Article

Study on Sulfide Ore Dust Dispersion and Dust Reduction Measures Based on Simulation

School of Resources and Safety Engineering, Central South University, Changsha 410083, China
*
Author to whom correspondence should be addressed.
Minerals 2024, 14(5), 523; https://doi.org/10.3390/min14050523
Submission received: 12 March 2024 / Revised: 6 May 2024 / Accepted: 13 May 2024 / Published: 18 May 2024

Abstract

:
Sulfide ore dust is at risk of explosion. To analyze the concentration distribution of sulfide ore dust in the ore loading, transporting, and unloading operations, the migration and dispersion processes of sulfide ore dust were simulated by using FLUENT software and taking the dust generation rate, roadway air velocity, and dust source position as variables. The concentration of sulfide ore dust was analyzed from the four-dimensional perspective of time and space. The results show that the maximum concentration of sulfide ore dust is determined by the dust generation rate. The roadway air velocity exhibits dual effects on the migration and deposition of sulfide ore dust. The ore loading position significantly impacts the distribution of sulfide ore dust, manifesting in varying degrees of superposition effects. Based on the results, this paper proposes a comprehensive dust reduction measure in the form of water curtain and dynamic ventilation, effectively minimizing the concentration of sulfide mine dust within the roadway.

1. Introduction

During excavation, mining, ore crushing, and transportation in sulfur-rich metal mines, sulfide ore dust accumulates at high concentrations. This dust poses a significant explosion risk when exposed to ignition sources such as hot surfaces, open flames, ore collisions, mechanical impacts, or short-circuit sparks [1,2]. The tendency of sulfide ore dust for spontaneous combustion heightens its potential for explosions. Accidents involving sulfide ore dust explosions threaten the lives of mine workers, damage electrical and mechanical equipment, and result in significant property losses [3,4]. The dispersion concentration is a prerequisite for sulfide ore dust explosions. Moreover, sulfide ore dust has adverse physiological effects on the human body [5]. Therefore, it is crucial to research the dispersion characteristics of sulfide ore dust and implement dust reduction measures.
Currently, dust dispersion is primarily investigated in the context of coal dust, monolithic sulfur powder, metallic dust, and organic dust, focusing on dust control [6,7,8]. Nguyen-Dinh et al. [9] explored a method to reduce the dispersion of harmful particles during the dressing of carbon–oxygen composites. Ercan et al. [10] measured the diffusion state of deposited dust against the background of a thermal power plant. Dust dispersion is characterized by a large quantity of dust particles and complex dust transportation, which makes it extremely difficult to track the dust through experiments. Consequently, numerical simulation is extensively employed to study dust dispersion. For instance, Portarapillo et al. [11] simulated the dust dispersion in a 1 m3 explosive container using the computational fluid dynamics (CFDs) simulation method. Madureira et al. [12] explored the utility of computational fluid dynamics (CFDs) in simulating particle behavior within the respiratory system. Bruce et al. [13] built a dust diffusion model to optimize the relative efficiency of passive dust samplers. Moreover, the method of gas–solid two-phase flow is often used in dust diffusion simulation [14].
In the spatial dimension, the dust diffusion spaces identified in the existing research mainly include fully mechanized coal mining faces, chutes, building communities, confined spaces, equipment interiors, etc. [15,16]. In the time dimension, dust simulation methods include steady-state and transient simulations. While steady-state simulation models the dust’s movement once it reaches a stable state, mine production environments involve the dynamic influence of airflow movement on dust behavior [17,18]. Consequently, transient simulation can better reflect the distribution and migration of sulfide ore dust in the production site [19].
This paper established a physical model based on the ore transportation level of a copper mine in China. The generation, migration, and dispersion of sulfide ore dust within the ore loading, transporting, and unloading operations were simulated using the FLUENT software. The study analyzed the impact of factors such as the dust generation rate, the air velocity in the roadway, and the dust source position on the distribution of sulfide ore dust. This analysis highlighted the location and time of the sulfide ore dust’s high-concentration distribution area. Based on these findings, dust-reduction measures such as water curtain and dynamic ventilation were adopted, which can significantly reduce the concentration of sulfide ore dust as verified by simulation.

2. Numerical Simulation Methods

2.1. Physical Model

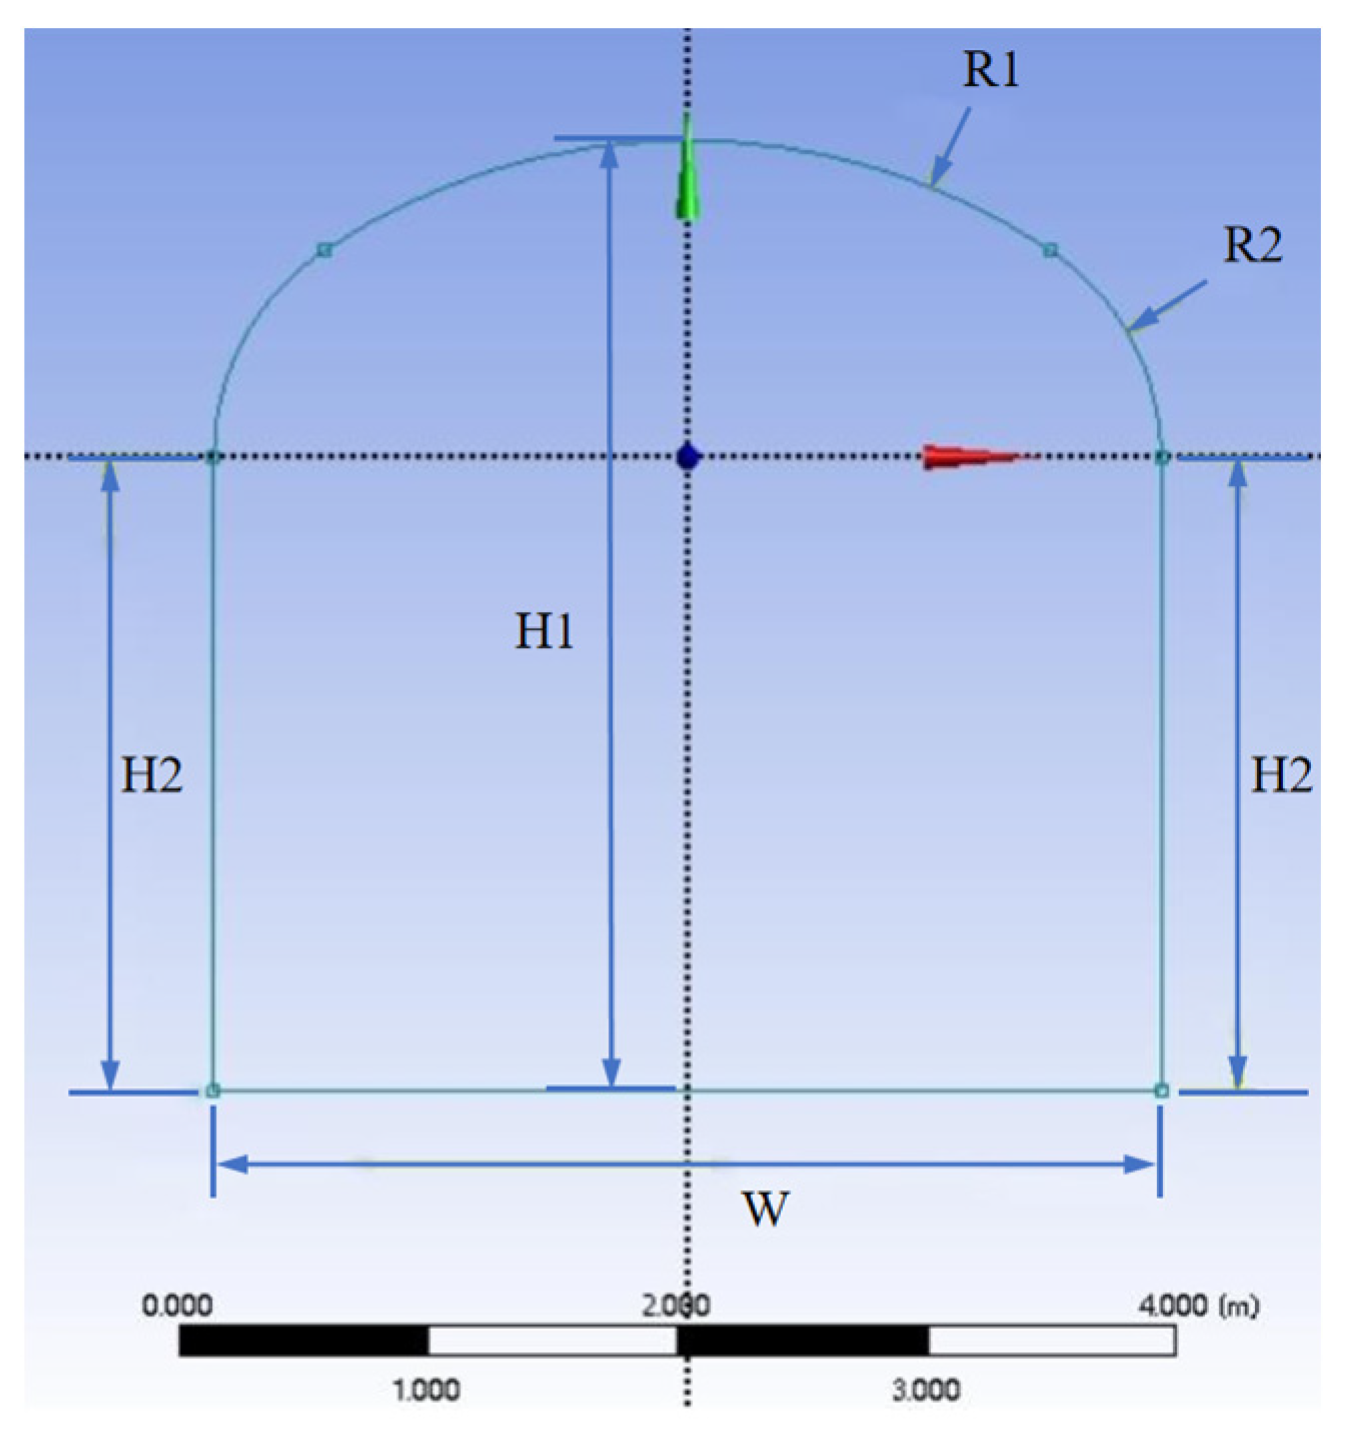
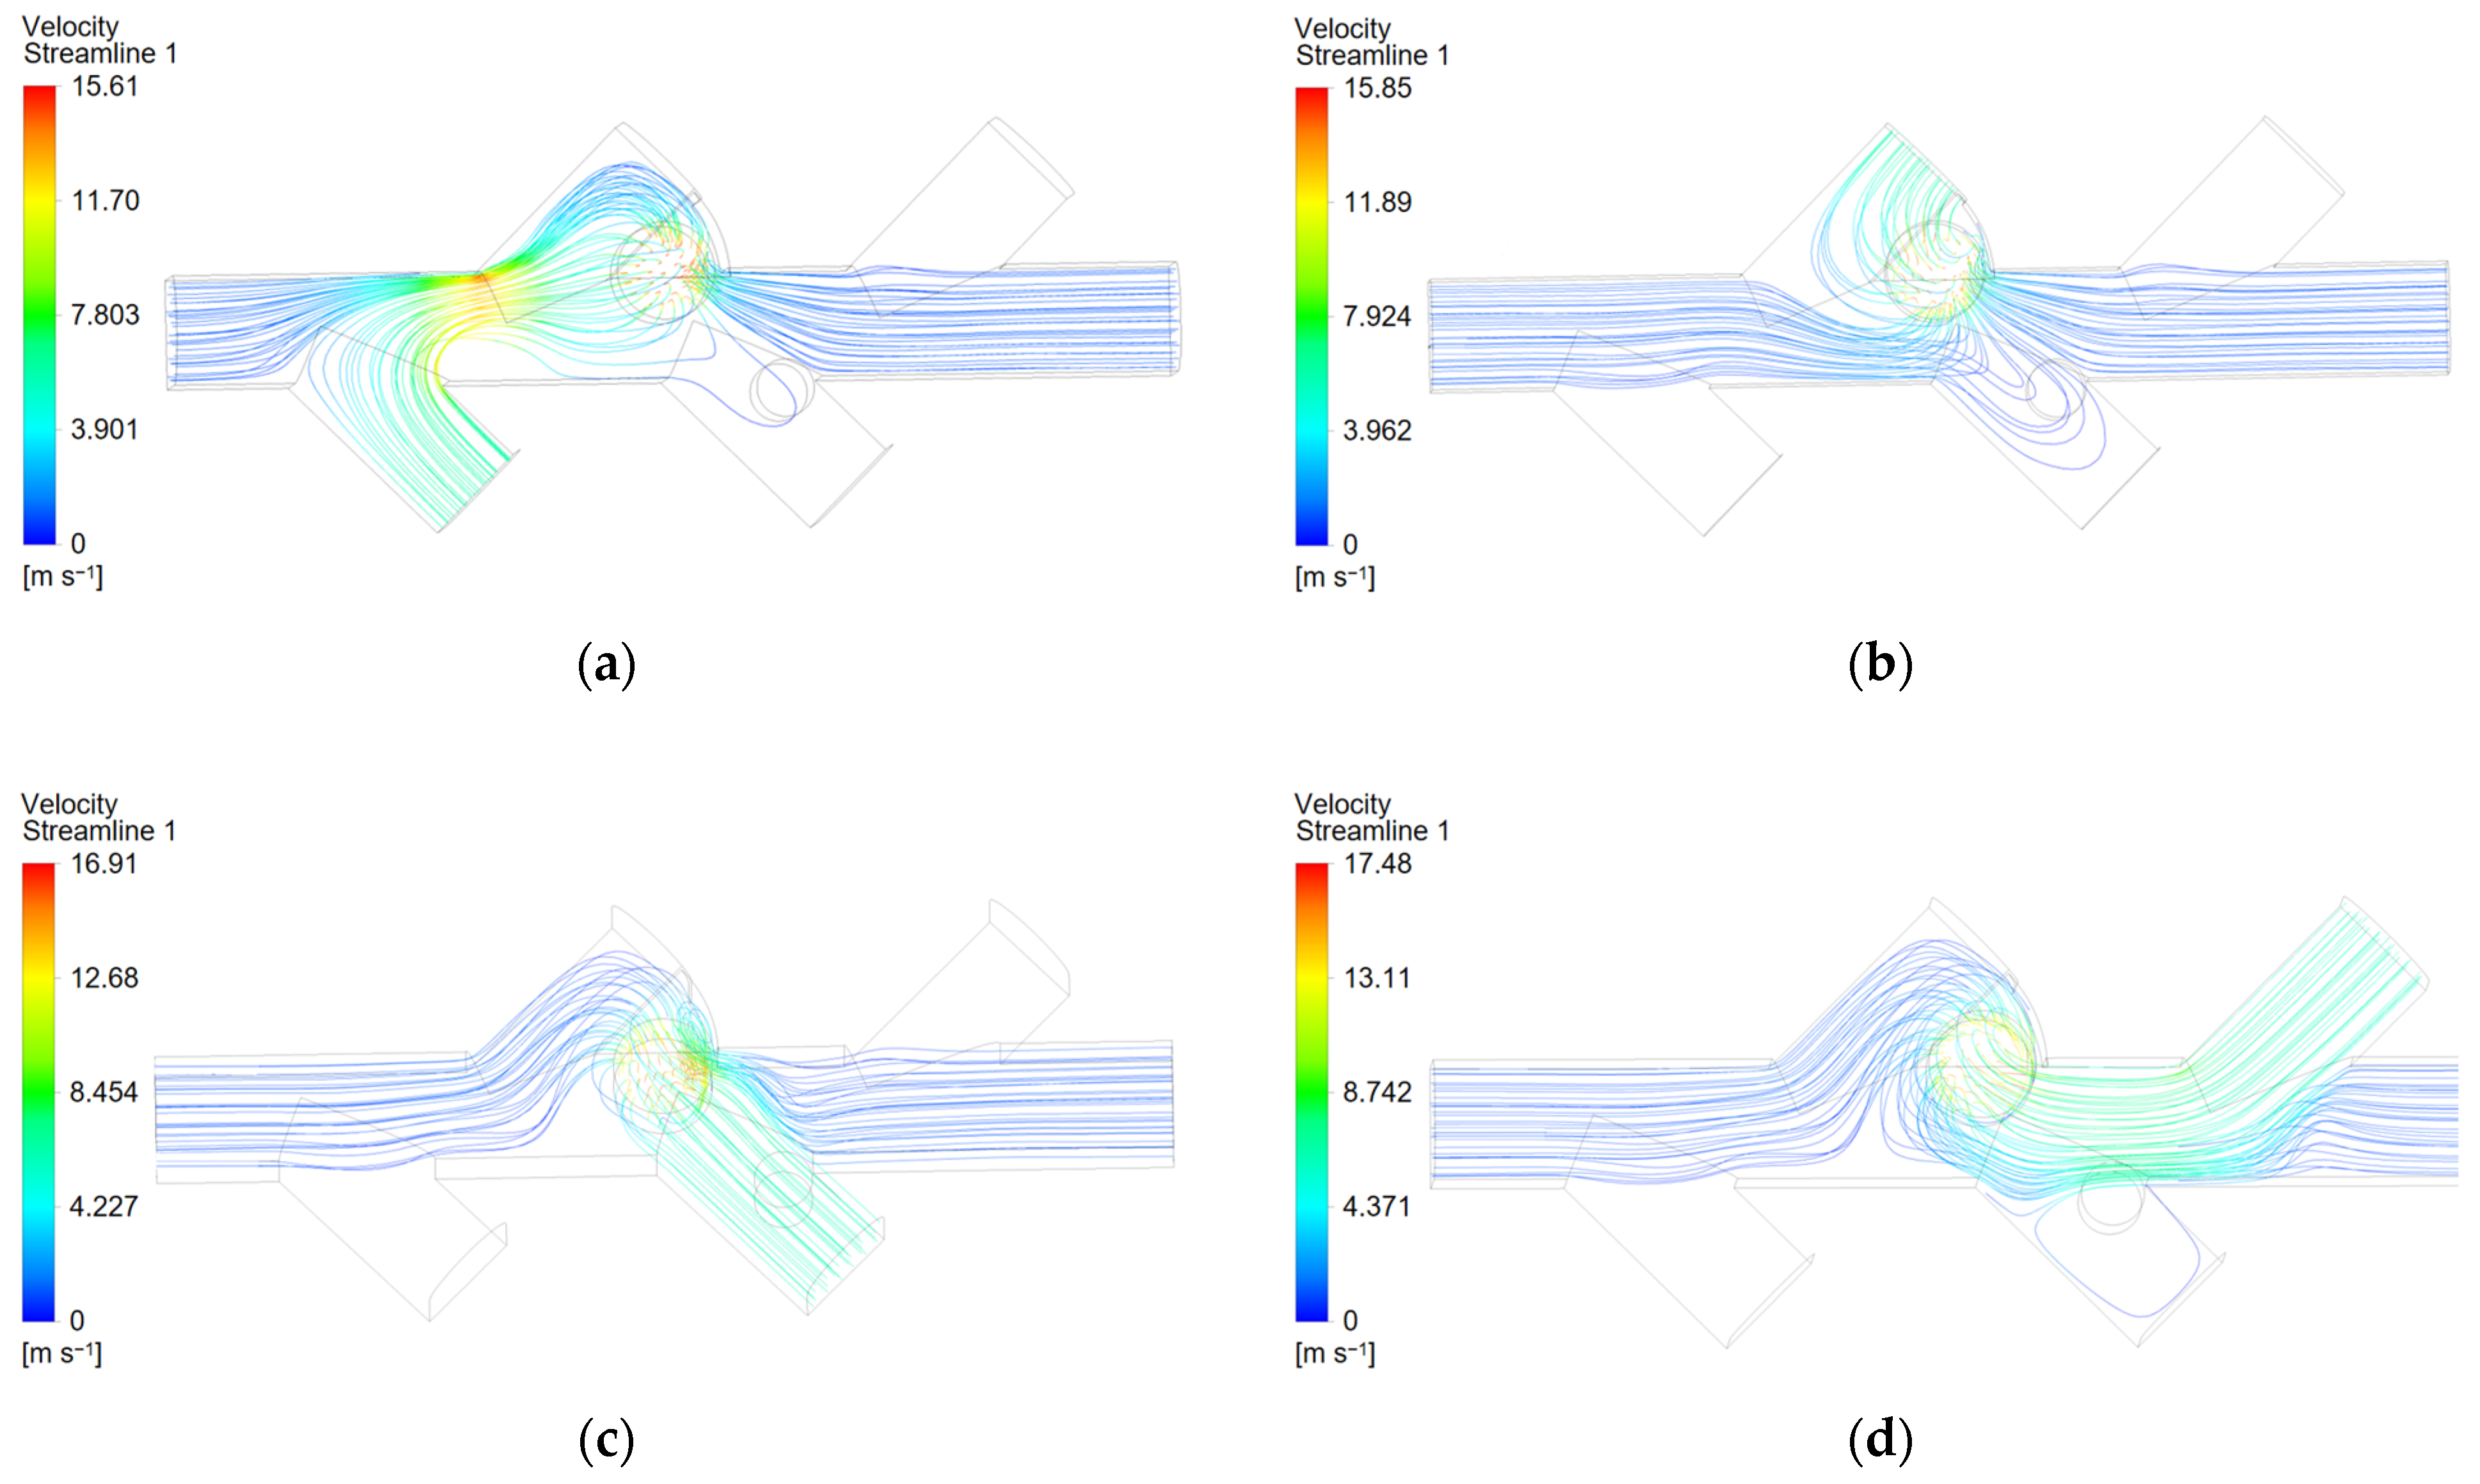
In this paper, a roadway model of sulfide ore at the loading, transporting, and unloading level is established based on the field measurement results, as shown in Figure 1. Figure 2 illustrates a cross-section of the roadway, while Table 1 shows the main overall dimensions of the roadway. Points “a”, “b”, “c”, and “d” represent ore loading points where the load–haul–dump (LHD) vehicle shovels up and loads the ore from the sulfide ore pile, and transports it to the ore pass, which is the ore unloading point. Figure 3 shows the routes involved in the ore-transporting process, while Figure 4 illustrates the velocity streamlines for each route within the roadway model. Operations that contribute to sulfide ore dust generation include the following: (1) dust is generated when the LHD vehicle shovels the sulfide ore; (2) ore dust is spilled in the haulage process, which also causes dust on the ground; (3) dust is generated during the process of unloading the sulfide ore into the ore pass; (4) dust deposited on the ore pass is swept up by the airflow currents generated during the fall of the sulfide ore.
This paper takes the ore loading point and ore unloading point as the main sources of dust generation. The generation, migration, and dispersion of sulfide ore dust in a 30 s period of the ore loading, transporting, and unloading operation were simulated with the transient simulation method. The release time and interval of the dust source are determined according to the ore drawing operation process: the ore loading time is 1–3 s (the first dust generation stage), the haulage time is 3–10 s (the first dust reduction stage), the ore unloading time to the ore pass is 10–12 s (the second dust generation stage), and 12–30 s is the second dust reduction stage.

2.2. Mesh Configuration

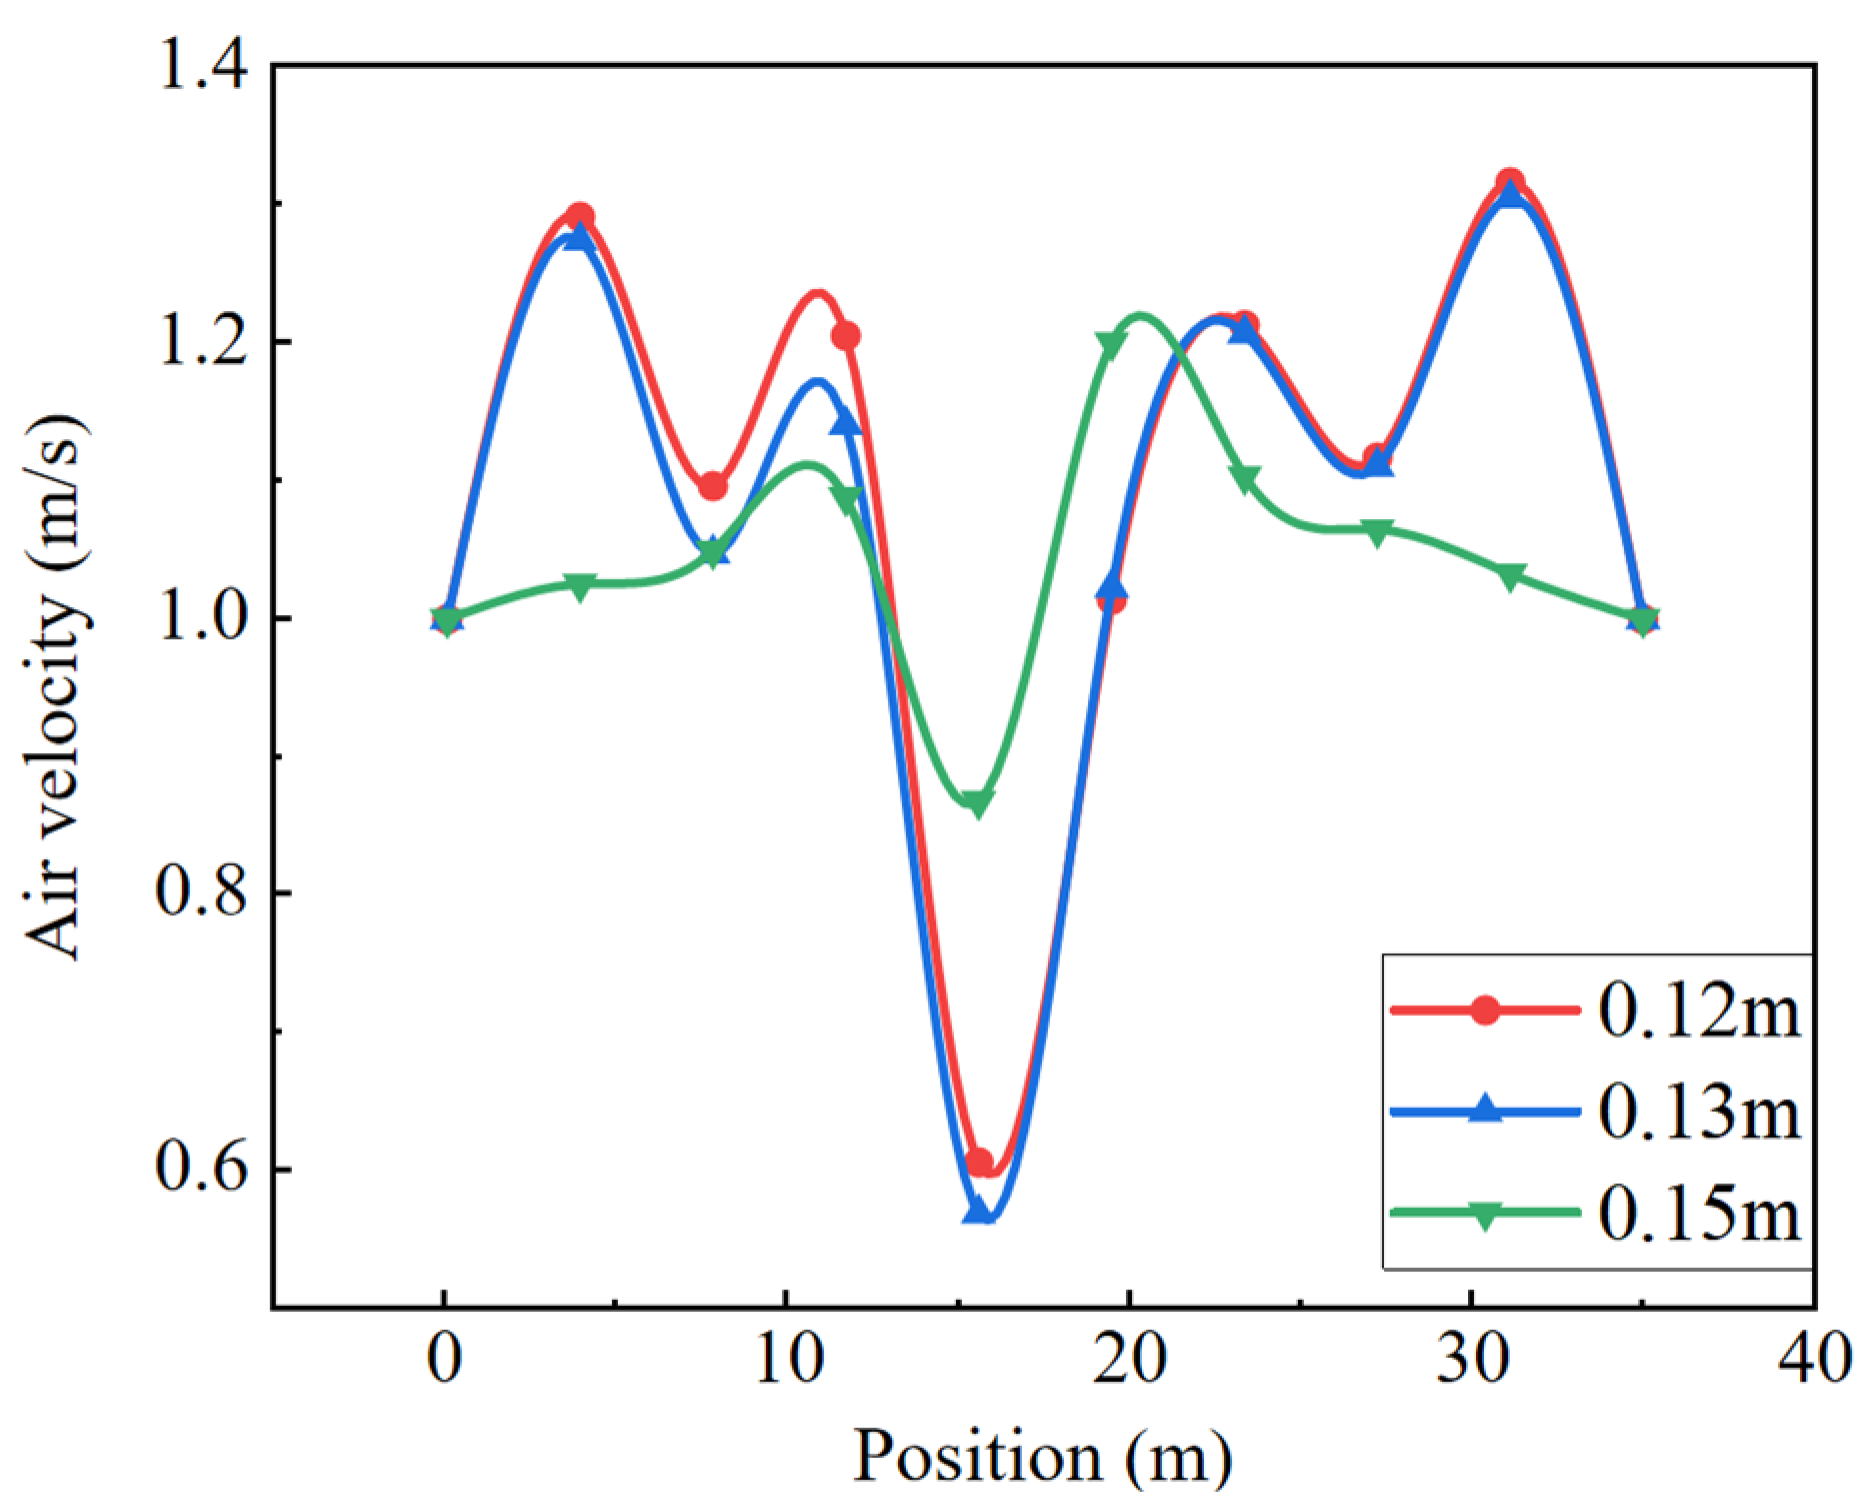
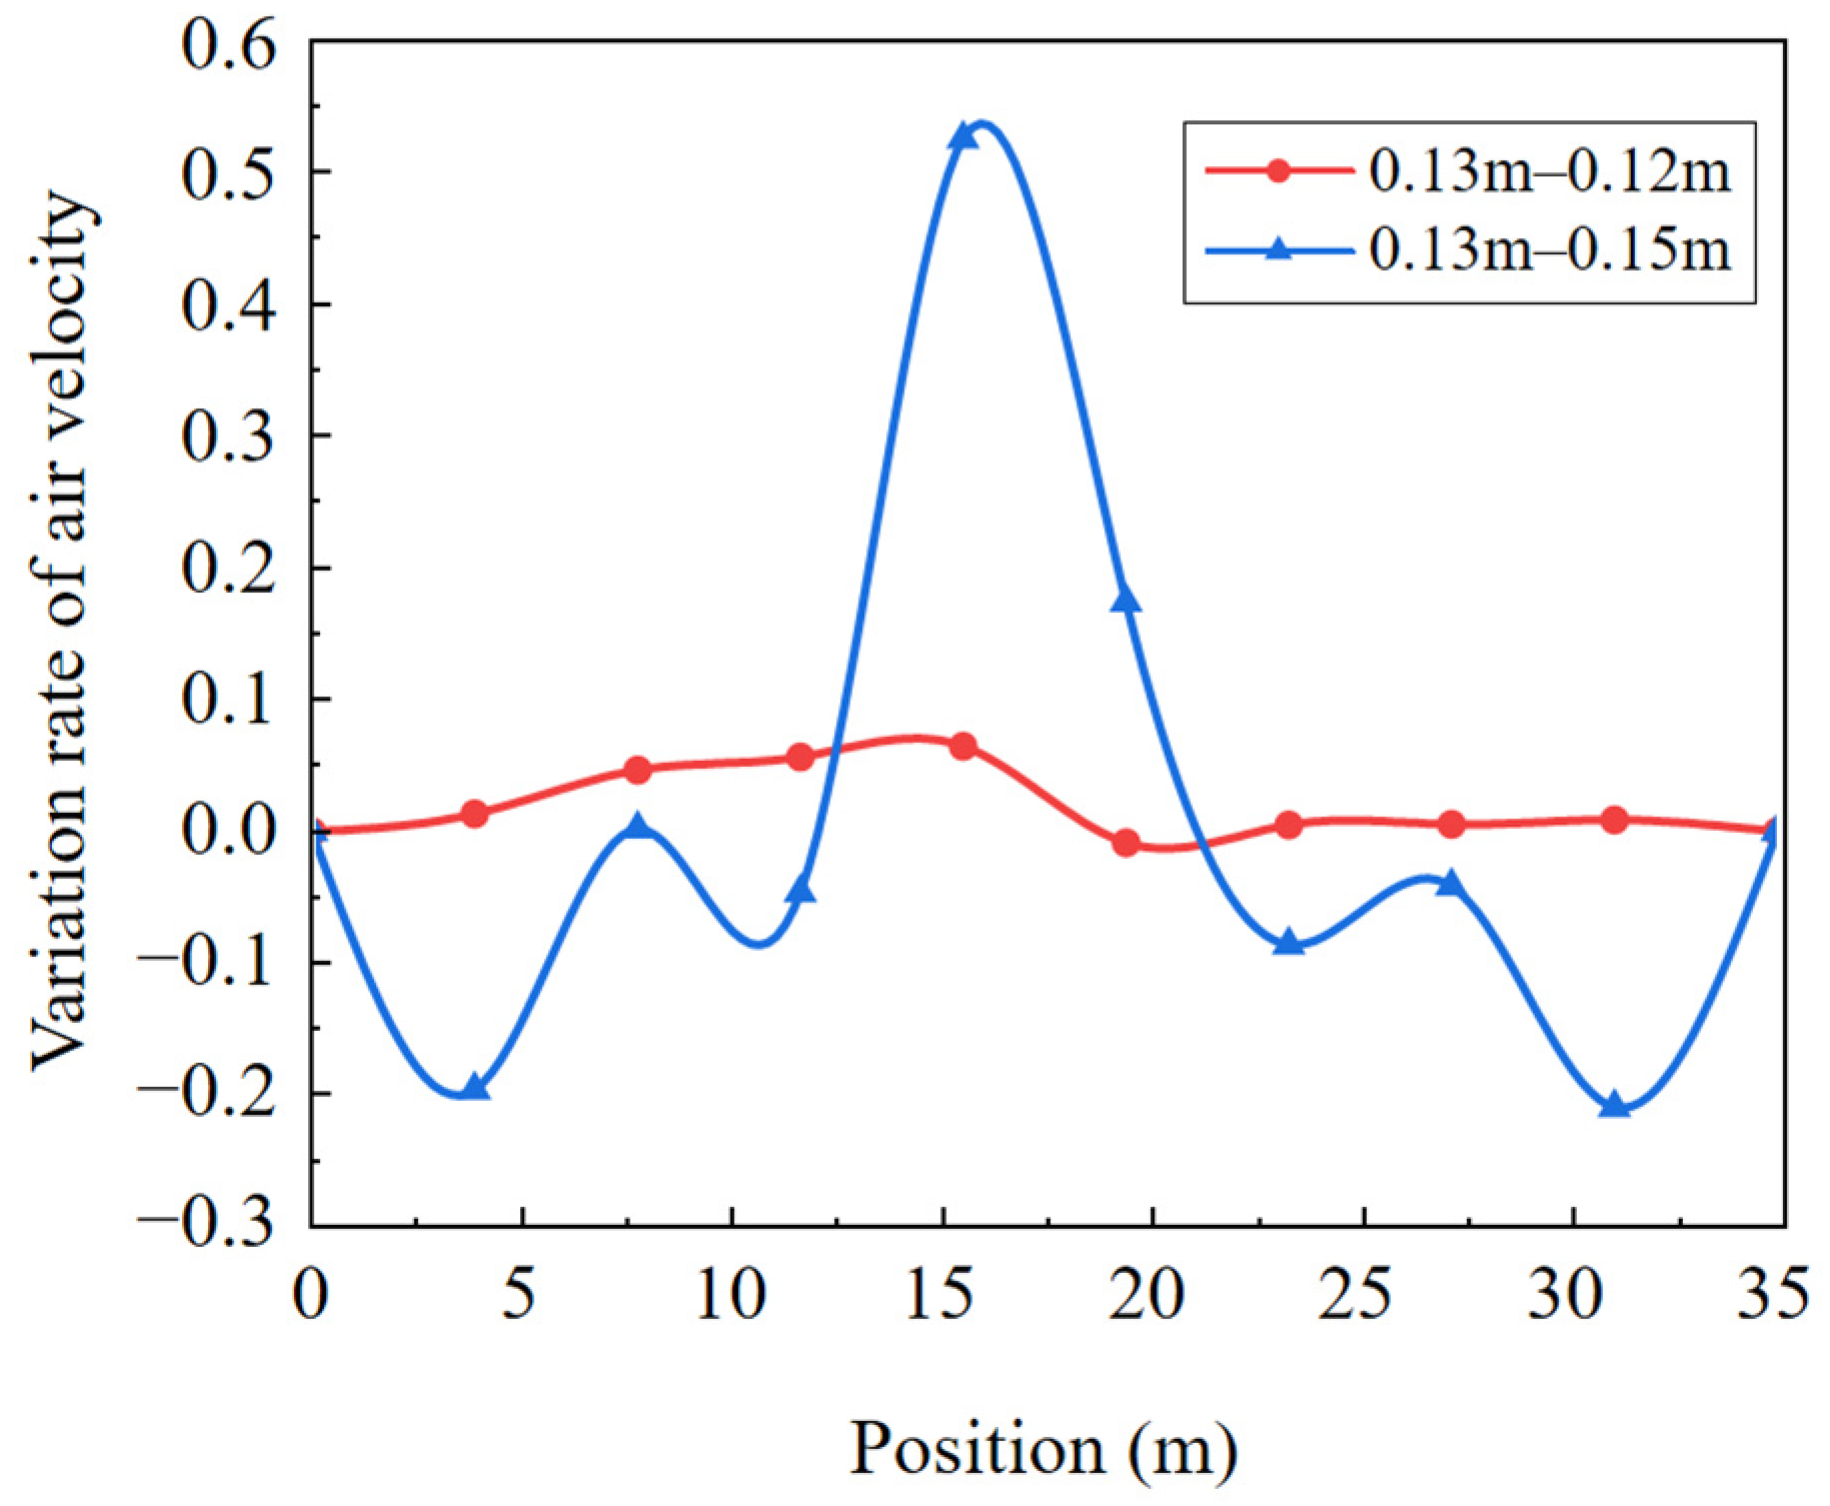
The model is meshed using the meshing schemes in Table 2. Figure 5 verifies the independence of these various meshing schemes. Notably, as the grid size decreases from 0.15 m to 0.13 m, there is a significant change in the roadway air velocity. The change in the air velocity is stabilized as the grid size is refined to 0.12 m. Figure 6 illustrates the rate of change in the roadway air velocity with different gridding schemes. Specifically, when the grid size is 0.12 m, the air velocity change rate in the roadway remains within 5%, indicating that the trend of air velocity change has stabilized. With a grid size of 0.12 m, the total grid count is 1,409,799, satisfying the requirements for calculation accuracy. As shown in Figure 7, the model is meshed using the tetrahedron method.
The mesh used for the simulation calculation is required to meet various quality requirements [20]. The mesh quality is mainly evaluated through the aspect ratio and deflection rate. The minimum aspect ratio must be greater than 0.05 and the average deflection rate must be less than 0.33. The quality indexes of the 0.12 m grid in this paper are shown in Table 3, which meet the calculation requirements.

2.3. Theoretical Model

2.3.1. Theory of Gas–Solid Two-Phase Flow

The Eulerian–Lagrangian method is used in the present study. The air is treated as a continuous phase and solved using the Navier–Stokes equations, while particles are treated as a discrete phase and solved using Newton’s second law. Eventually, the motion state of the dust particles and the distribution of sulfide ore dust concentration at different times were obtained [21].
(1)
Control Equations of Continuous Phase Turbulent Flow
The continuous phase primarily solves the equations of continuity, momentum, and energy about the fluid. These equations are commonly known as the Navier–Stokes equations (N-S equations) in computational fluid dynamics [22]. In this simulation, the flow process is treated as isothermal and the direct energy transfer and conversion of the fluid are ignored, so the energy equation is closed.
The continuity equation:
u i x i = 0
The momentum equation:
( ρ u i ) t + ( ρ u i u j ) x j = p x i + τ i j x j + ρ g i + F i
where ui is the mean velocity of the fluid, xi is the i-direction, ρ is the density of the fluid, p is the fluid pressure, gi is the gravitational acceleration of gravity, and Fi is the relevant source that contains the other models.
The realizable k-ε model has been widely used to resolve turbulence flow [23,24]. It has been shown in the literature that eddy viscosity-based models present a compromise between speed and reasonable accuracy for the pressure drop. The equations are given as follows:
t ( ρ k ) + x i ( ρ k u i ) = x i [ ( μ + μ t σ k ) k x j ] + G k + G b ρ ε Y M + S k G K = μ t S 2 ,     S = 2 S i j S i j ,     S i j = 1 2 ( u j x i + u i x j )
t ( ρ ε ) + x j ( ρ ε u j ) = x j [ ( μ + μ t σ ε ) ε x j ] + ρ C 1 S ε ρ C 2 ε 2 k + v ε + C 1 ε ε k C 3 ε G b + S ε C 1 = max ( 0.43 , η η + 5 ) ,     η = S k ε
where Gk is the turbulent kinetic energy due to the laminar velocity gradient, Gb is the turbulent kinetic energy generated by the buoyancy force, YM is the contribution to the dissipation rate of the expansion of turbulent pulsations in the compressible flow into the global process, Sk and Sε are the turbulent kinetic energy and turbulent dissipative source, σk and σε are the turbulent Prandtl numbers denoting the k and ε equations, and C1ε, C2ε, and C3ε are the empirical constants.
(2)
Control equations of discrete phase
The main forces on sulfide ore dust in the flow field include (1) gravity, (2) buoyancy, (3) drag force, (4) Snaffman lift force, pressure gradient force, virtual mass force, Basset force, Magnus force, thermophoresis force, and Brownian force. The pressure gradient force is disregarded due to the incompressible nature of air in the system. The virtual mass force and Basset force are omitted given that the air density is significantly lower than the density of sulfide ore dust. Moreover, the thermophoretic force is not considered as heat exchange is absent during the airborne transport of sulfide ore dust. In addition, given the small particle size in this study, the Magnus force exerts minimal influence on the sulfide ore dust, thus rendering it negligible. Accordingly, the forces acting on the dust particles are simplified as gravity, buoyancy, drag force, and Snaffman lift force.
The forces equations:
F g = 1 6 π d P 3 ρ p g
F b = 1 6 π d P 3 ρ g
F D = 1 2 C D ρ | u u p | ( u u p ) 1 4 π d P 2
F S = 1.61 d P 2 ρ u ( u u p ) d u d y
where Fg is the gravity, Fb is the buoyancy, FD is the drag force, FS is the Snaffman lift force, dp is the particle diameter, ρp is the density of the particle, ρ is the density of the fluid, CD is the drag coefficient between gas and particles, up is the particle velocity, and u is the velocity of the gas phase.
The trajectories of discrete phase particles are predicted by integrating the force balance on the particles. The governing equation is written as:
d u p d t = β D ( u u p ) + g ρ p ρ ρ + F o t h e r s
where g is the gravitational acceleration, Fother is an additional acceleration term, βD(uuP), is the drag force per unit particle mass, and is given as follows:
β D = 18 μ d p 2 ρ p C D Re p 24
where μ is the fluid viscosity, and Rep is the particle Reynolds number.
The particle Reynolds number Rep was defined as:
Re p = ρ P d P | u p u | μ

2.3.2. Impinging Airflow Accompanying Dust Generation

From a microscopic perspective, sulfide ore dust is produced during the extrusion and crushing of ore as it moves and collides rapidly. This rapid movement drives the air surrounding the crushed ore into a flow, resulting in an impact airflow that shares the same direction, cycle, and speed as the sulfide ore dust. On a macro level, the movement of lump ore propels the surrounding air, also generating an accompanying impact airflow. For instance, during the unloading of ore into the ore pass, a powerful impact airflow is created.
In the dust generation position, the sulfide ore dust can reach a position far away from the dust source due to the existence of impact airflow. This is further verified by the simulation which showed that, in the absence of impact airflow, the sulfide ore dust settled in a short distance after generation. However, the sulfide ore dust moved a long distance after we added the condition of an accompanying impact airflow, which is more consistent with the movement and distribution of sulfide ore dust in the generation process. Thus, the accompanying airflow condition is necessary to simulate the real motion state of sulfide ore dust particles.

2.4. Boundary Condition

The gas phase in this simulation is represented by air at 25 °C, possessing a density of 1.1691 kg/m3 and a dynamic viscosity of 1.84 × 10⁻⁵ kg/m·s. The inlet boundary condition for the roadway is set to an inlet velocity of 6 m/s, while a Pressure outlet is used at the outlet of the roadway.
Distinct boundary conditions are implemented at various wall locations. Reflective boundary contact models are used on the sides and top of the main haulage roadway, trap boundary models on the bottom, and escape boundary models on the ends of the roadway, the ore pass, and the bottom of the return air shaft. A no-slip wall boundary condition was set for the inner wall of the roadway. The default wall roughness is 0.6. The boundary conditions in the simulation of this paper are shown in Table 4. Additionally, the parameters of the discrete phase model and continuous phase model are detailed in Table 5 and Table 6, respectively.

2.5. Numerical Validation

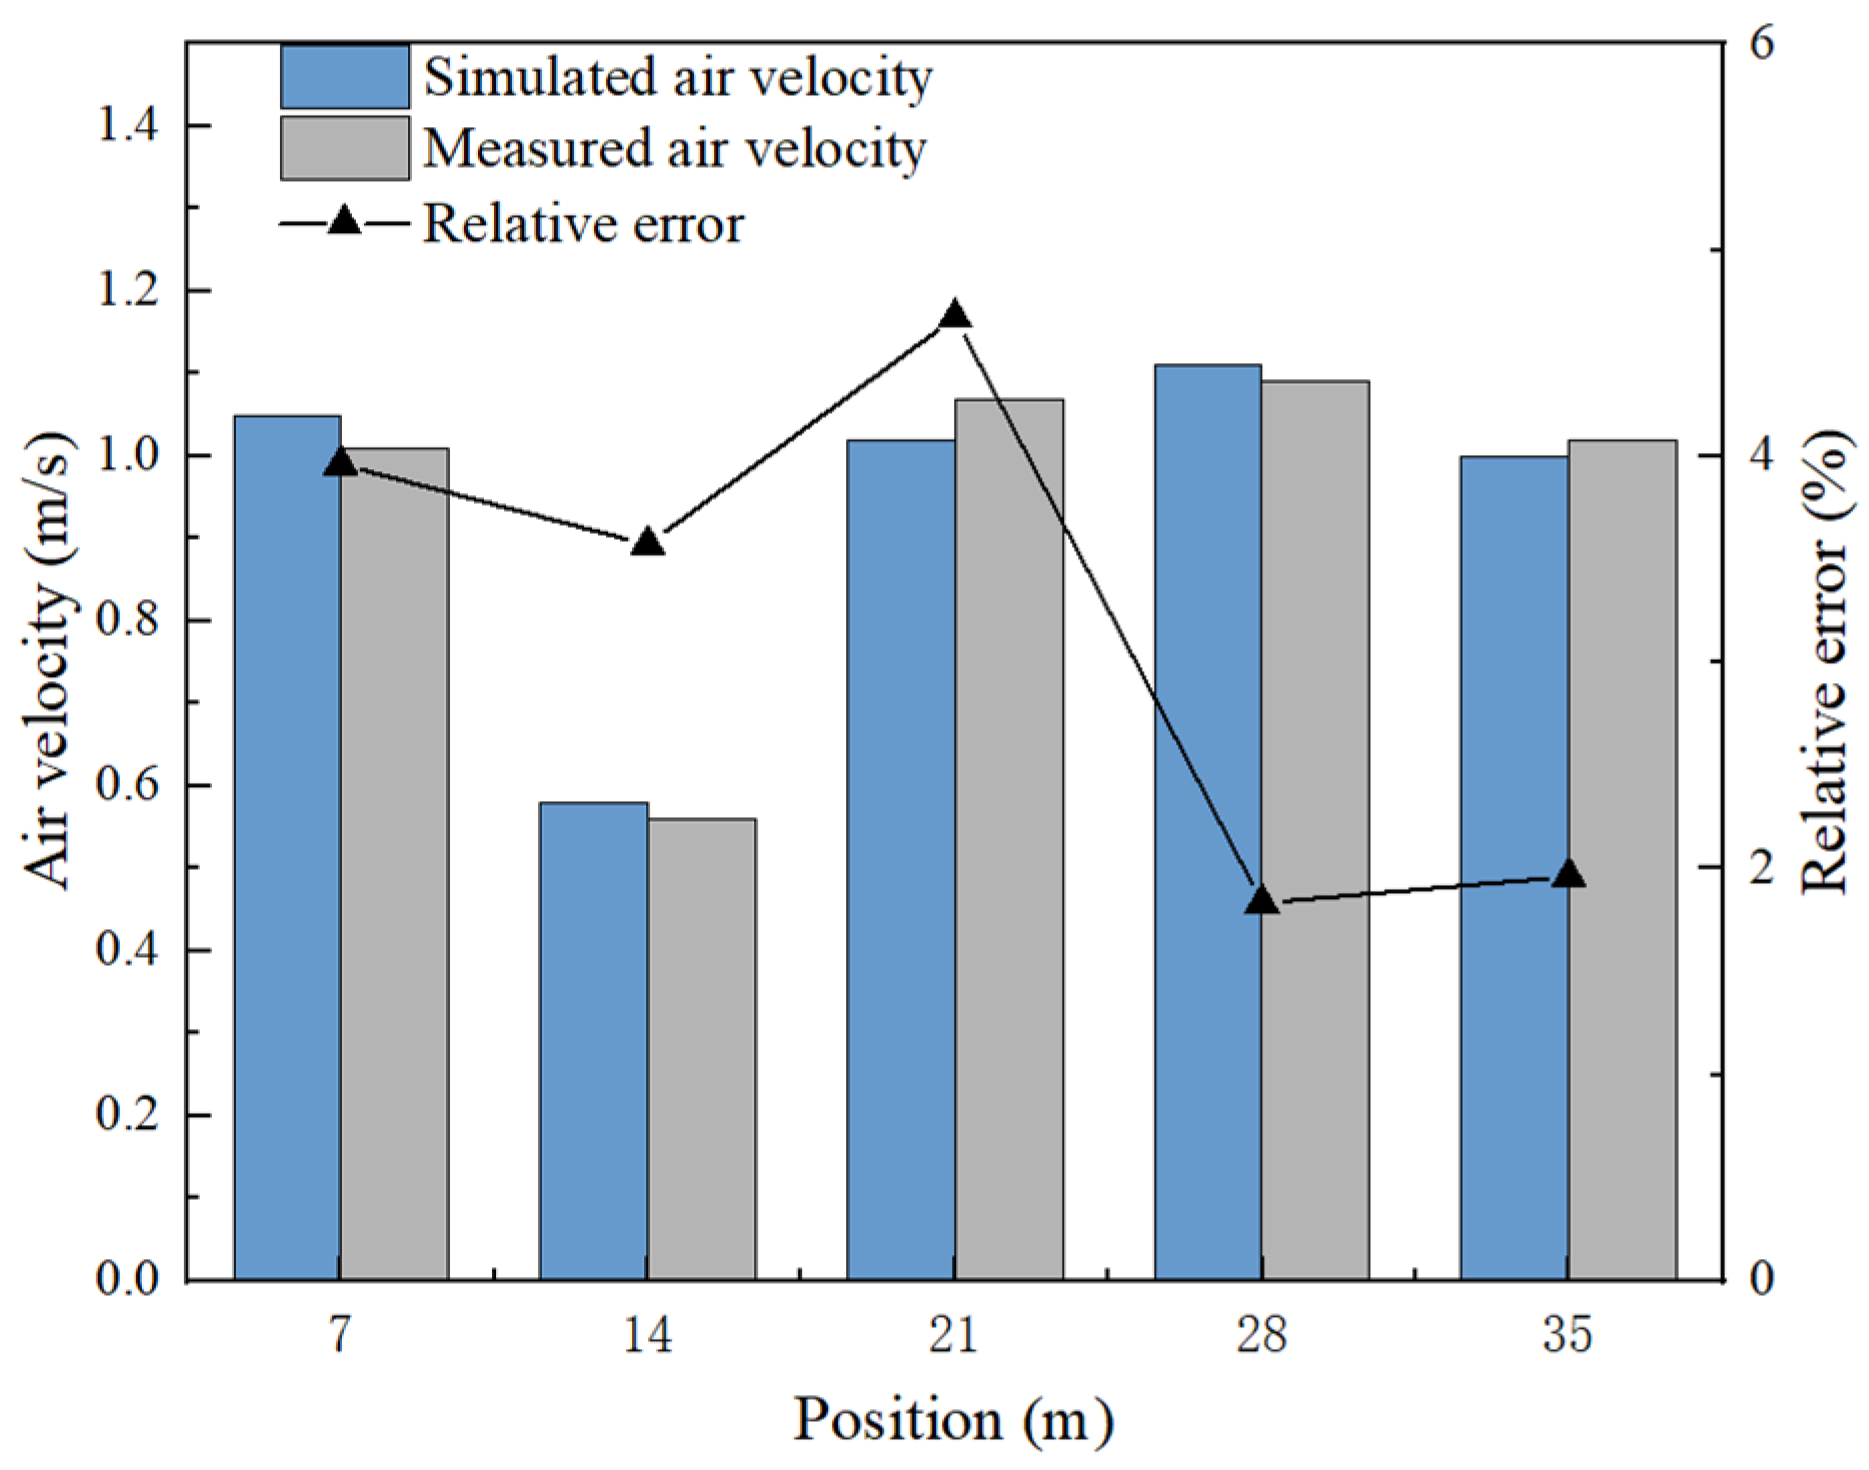
The air velocity was measured on-site to verify the accuracy and reliability of the simulation results. Measurement points were arranged at 7 m, 14 m, 21 m, 28 m, and 35 m along the main haulage roadway, and the air velocity was measured three times at each measurement point and the average of the measurement results was taken. A comparison of the simulation results with the actual measurement results is shown in Figure 8.
As shown in Figure 8, the discrepancy between the simulated air velocity and the measured air velocity is small, with an average error of 3.2% and a maximum deviation of less than 5%. The simulated air velocity and measured air velocity have similar distribution patterns, indicating the good accuracy of the numerical simulation.

2.6. Simulation Scheme

Based on the principle of control variables, eight simulation schemes were designed, as detailed in Table 7, considering dust source positions, dust generation rates, and air velocities as variables. The primary dust sources in these simulations were the ore loading and unloading points. Specifically, dust is generated at the ore loading point during the first dust generation stage, while dust generation occurs at the ore unloading point in the second dust generation stage. Schemes 1, 2, and 3 represent low, medium, and high dust generation rates, respectively, with dust generation rates of 1 kg/s, 2 kg/s, and 3 kg/s. The unloading points remain static, while the loading points, labeled as “a”, “b”, “c”, and “d”, correspond to the respective simulations conducted for schemes 2, 6, 7, and 8. As for air velocities, schemes 2, 4, and 5 correspond to normal, low, and high air velocities in the roadway, respectively, at 1 m/s, 0.5 m/s, and 2 m/s. According to the detonation test data for the sulfide ore dust and considering the safety coefficient for preventing sulfide ore dust explosions, 0.2 kg/m3 is determined as the lower limit of explosion concentration.

3. Results and Discussion

3.1. Dust Generation Rate

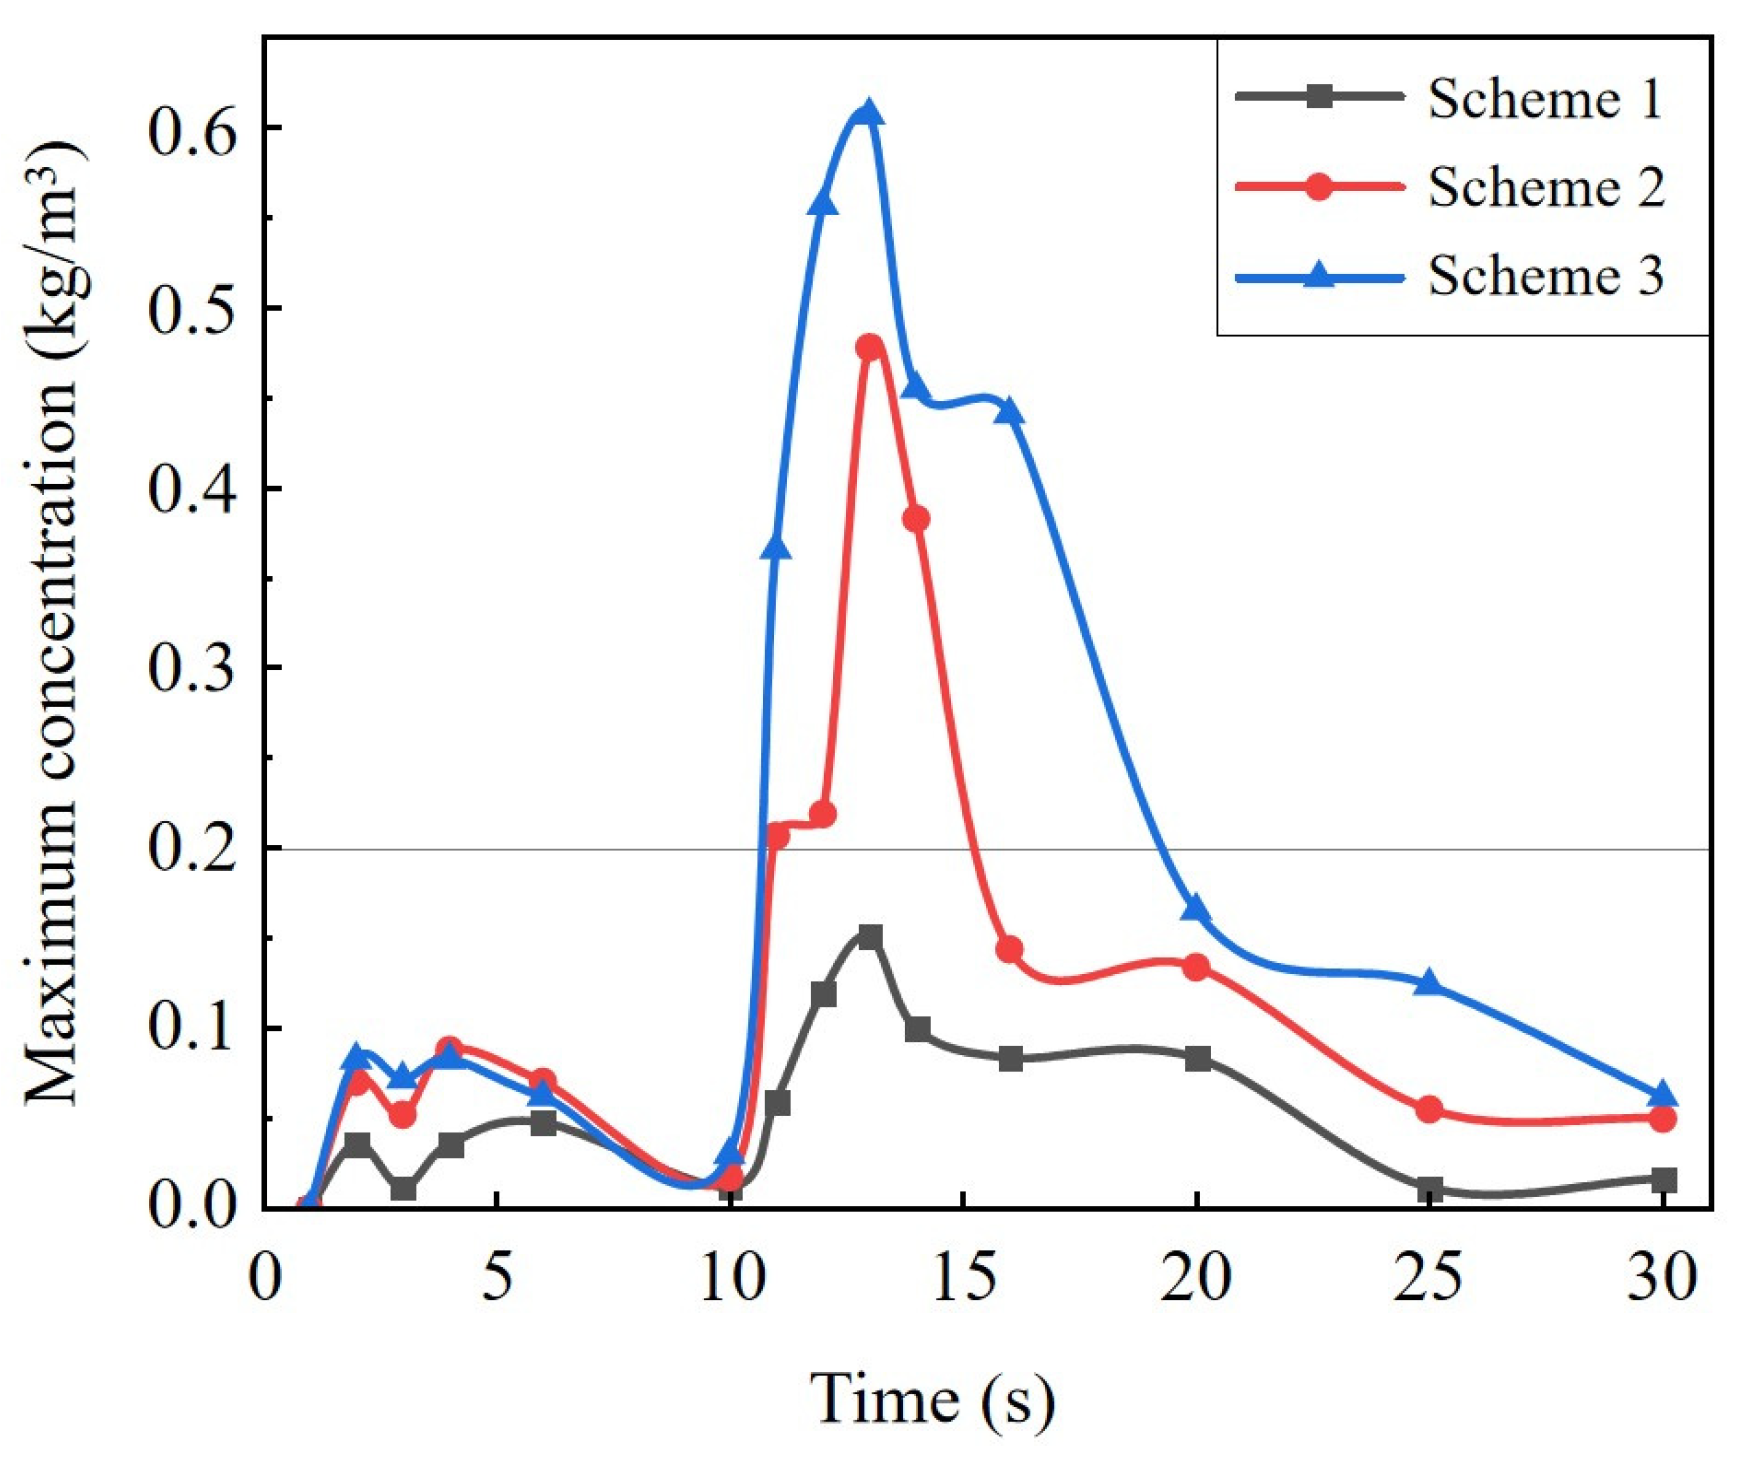
The dust generation rates in schemes 1, 2, and 3 increase sequentially; the loading point is “a”, and the air velocity of the roadway is 1 m/s. The maximum concentration of sulfide ore dust (Cmax) in the roadway at different times for schemes 1 to 3 is shown in Figure 9. In scheme 1, the Cmax remains below 0.2 kg/m3 throughout the operation, indicating a low explosion hazard of the sulfide mine dust in the roadway when the dust generation rate is comparatively low. For schemes 2 and 3, the Cmax in the roadway increases significantly due to the enhanced dust generation rate. The peak Cmax value also increases significantly, where that in scheme 2 peaks at 0.48 kg/m3 and in scheme 3 it peaks at 0.63 kg/m3, both exceeding the lower explosive limit concentration. In terms of the duration of time in which the maximum sulfide ore dust concentration is higher than the lower explosion limit, scheme 1 has a duration of 0 s, while scheme 2 has a duration of 5.5 s and scheme 3 has a duration of 9 s. This trend indicates that as the dust generation rate increases, the duration of the high-concentration state extends, thus augmenting the explosion hazard.
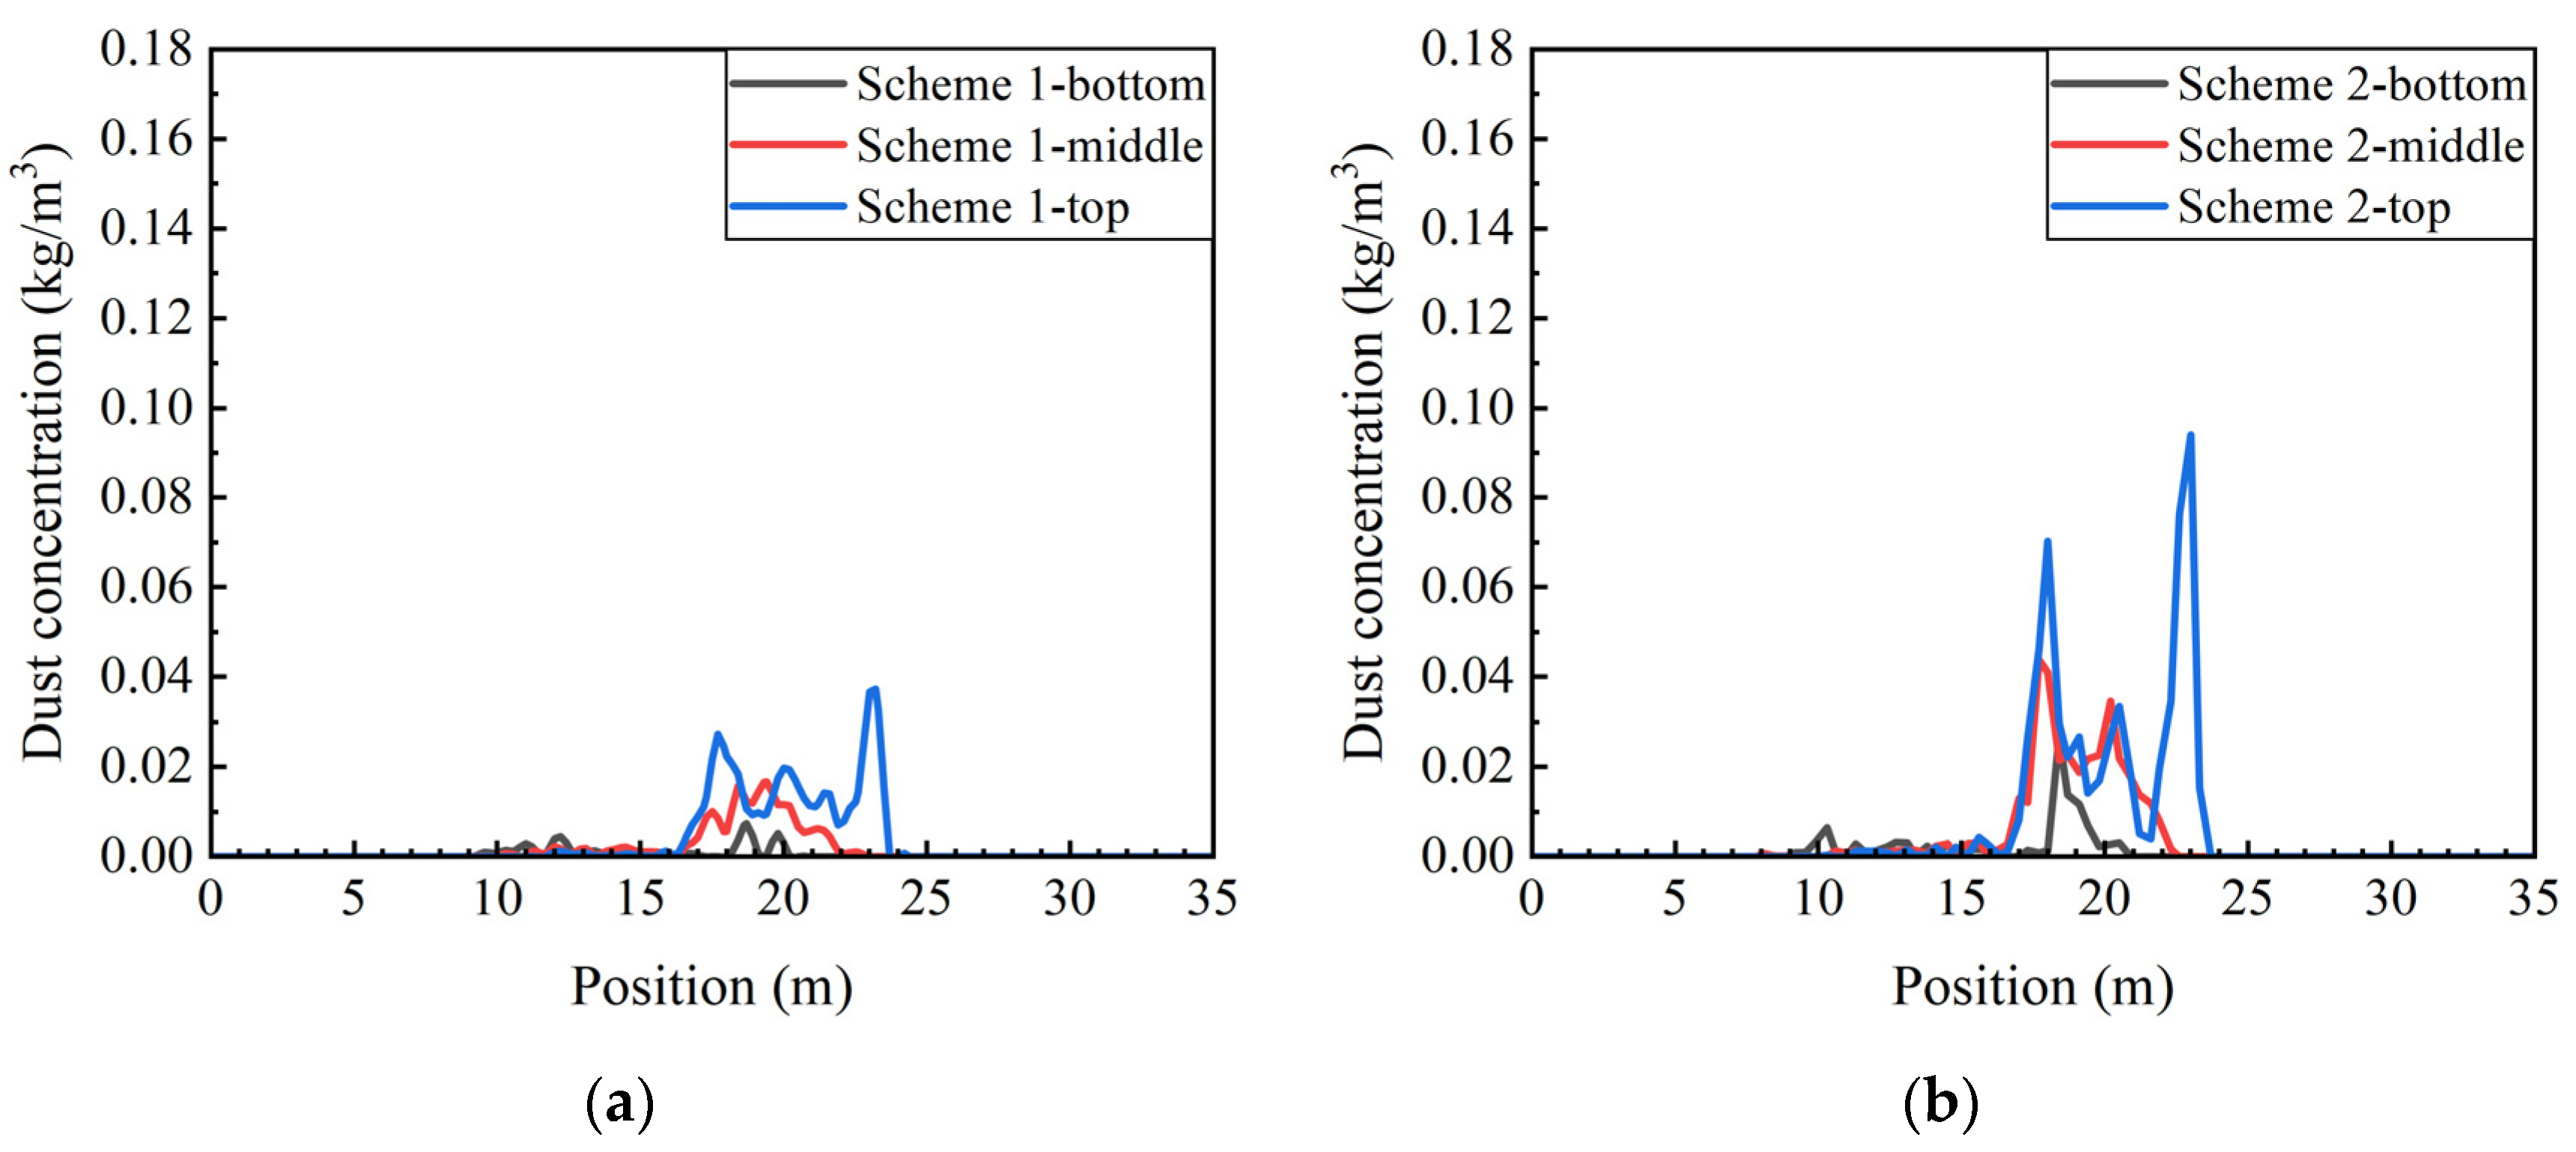
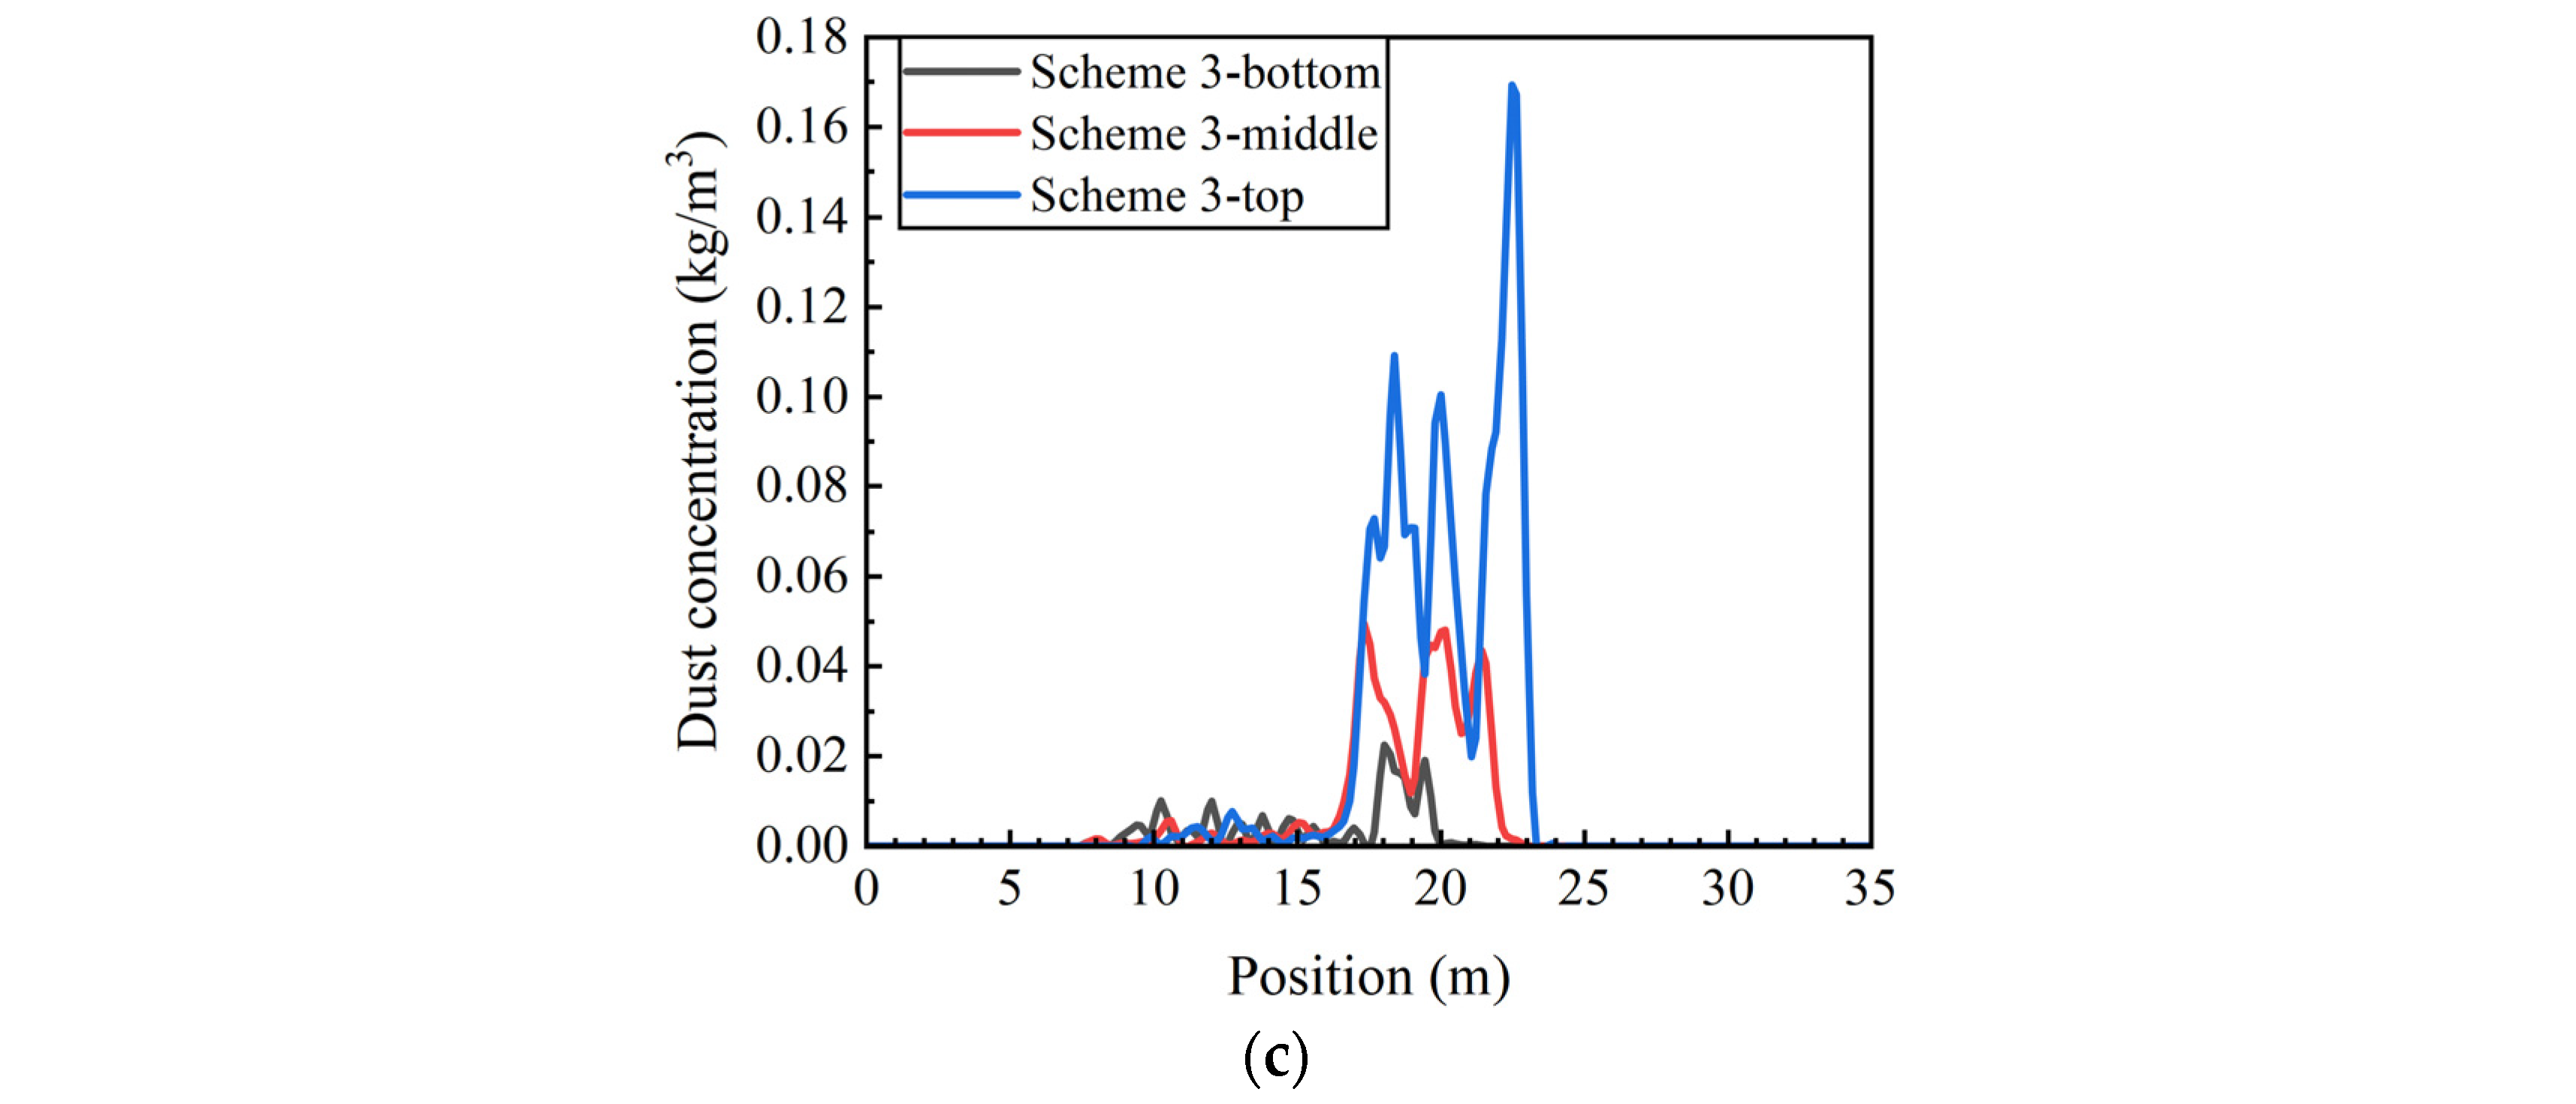
At 13 seconds, the Cmax for schemes 1, 2, and 3 reaches its peak. Figure 10 illustrates the concentration of sulfide ore dust at various heights along the roadway at this time: the bottom (0.4 m height), the middle (1.6 m height), and the top (2.9 m height). The dust concentration at different heights increased with the increase in the dust generation rate. The concentration of sulfide ore dust at the top is highest at positions of 17 m and 23 m. This is attributed to the return air shaft located at 17 m, where the sulfide ore dust is strongly disturbed by the airflow, while 23 m is the location of the ore pass, and the direction of the sulfide ore dust generated from the ore pass is upward. As a result, the dust gathers at the top of the roadway. In addition, a high concentration of sulfide ore dust also occurs at approximately 20 m, where the superposition effect of sulfide ore dust from two sources is the greatest.
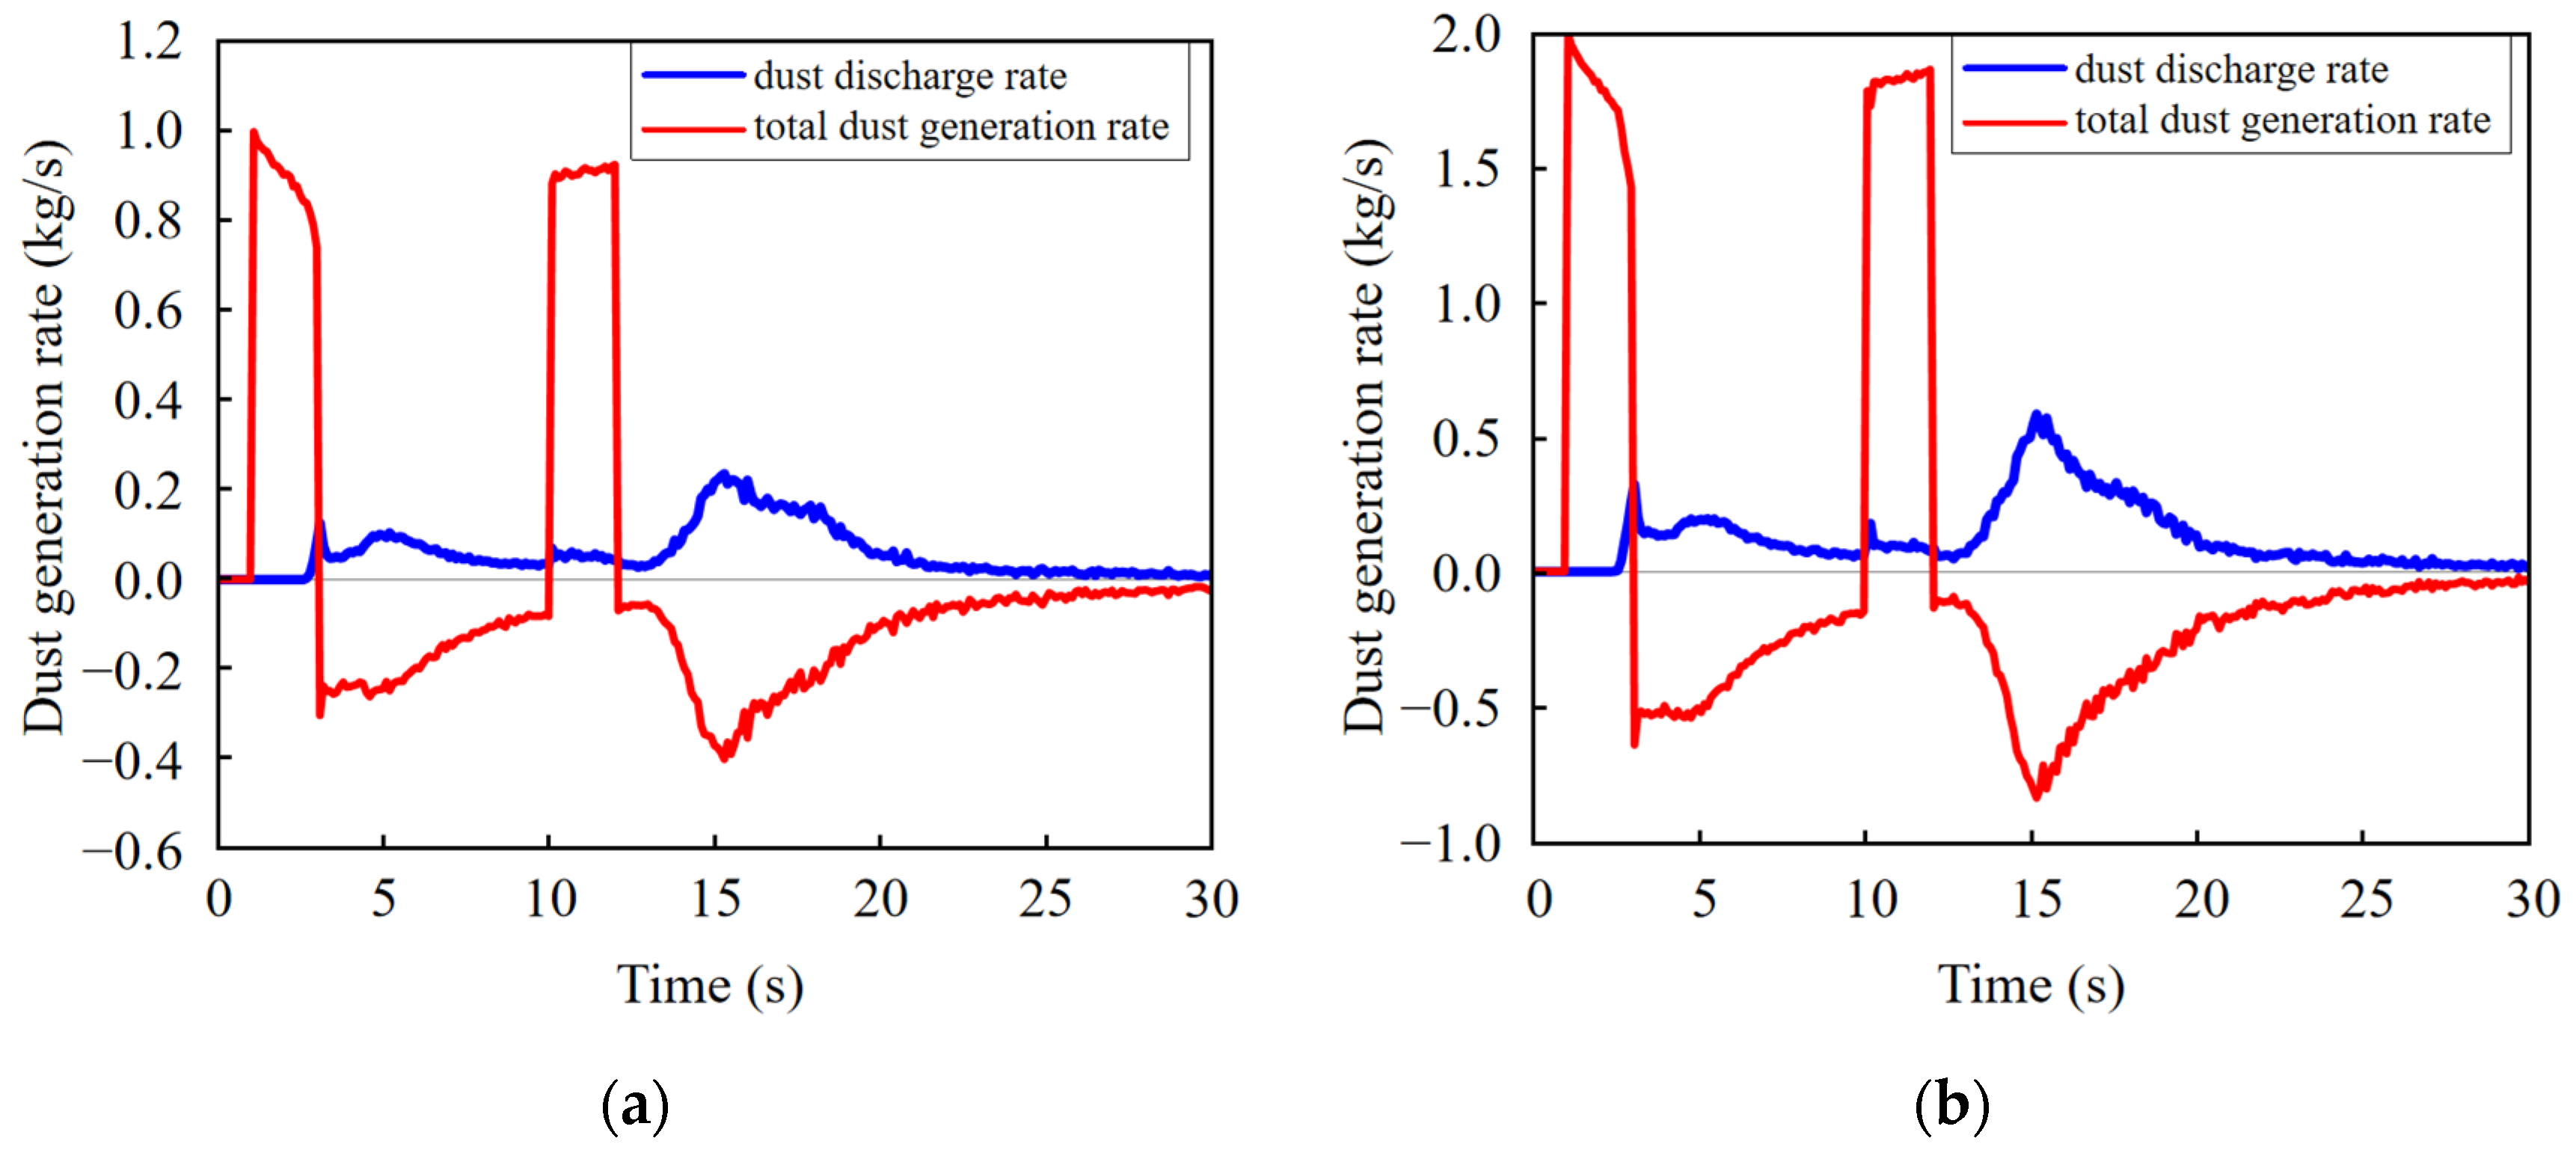
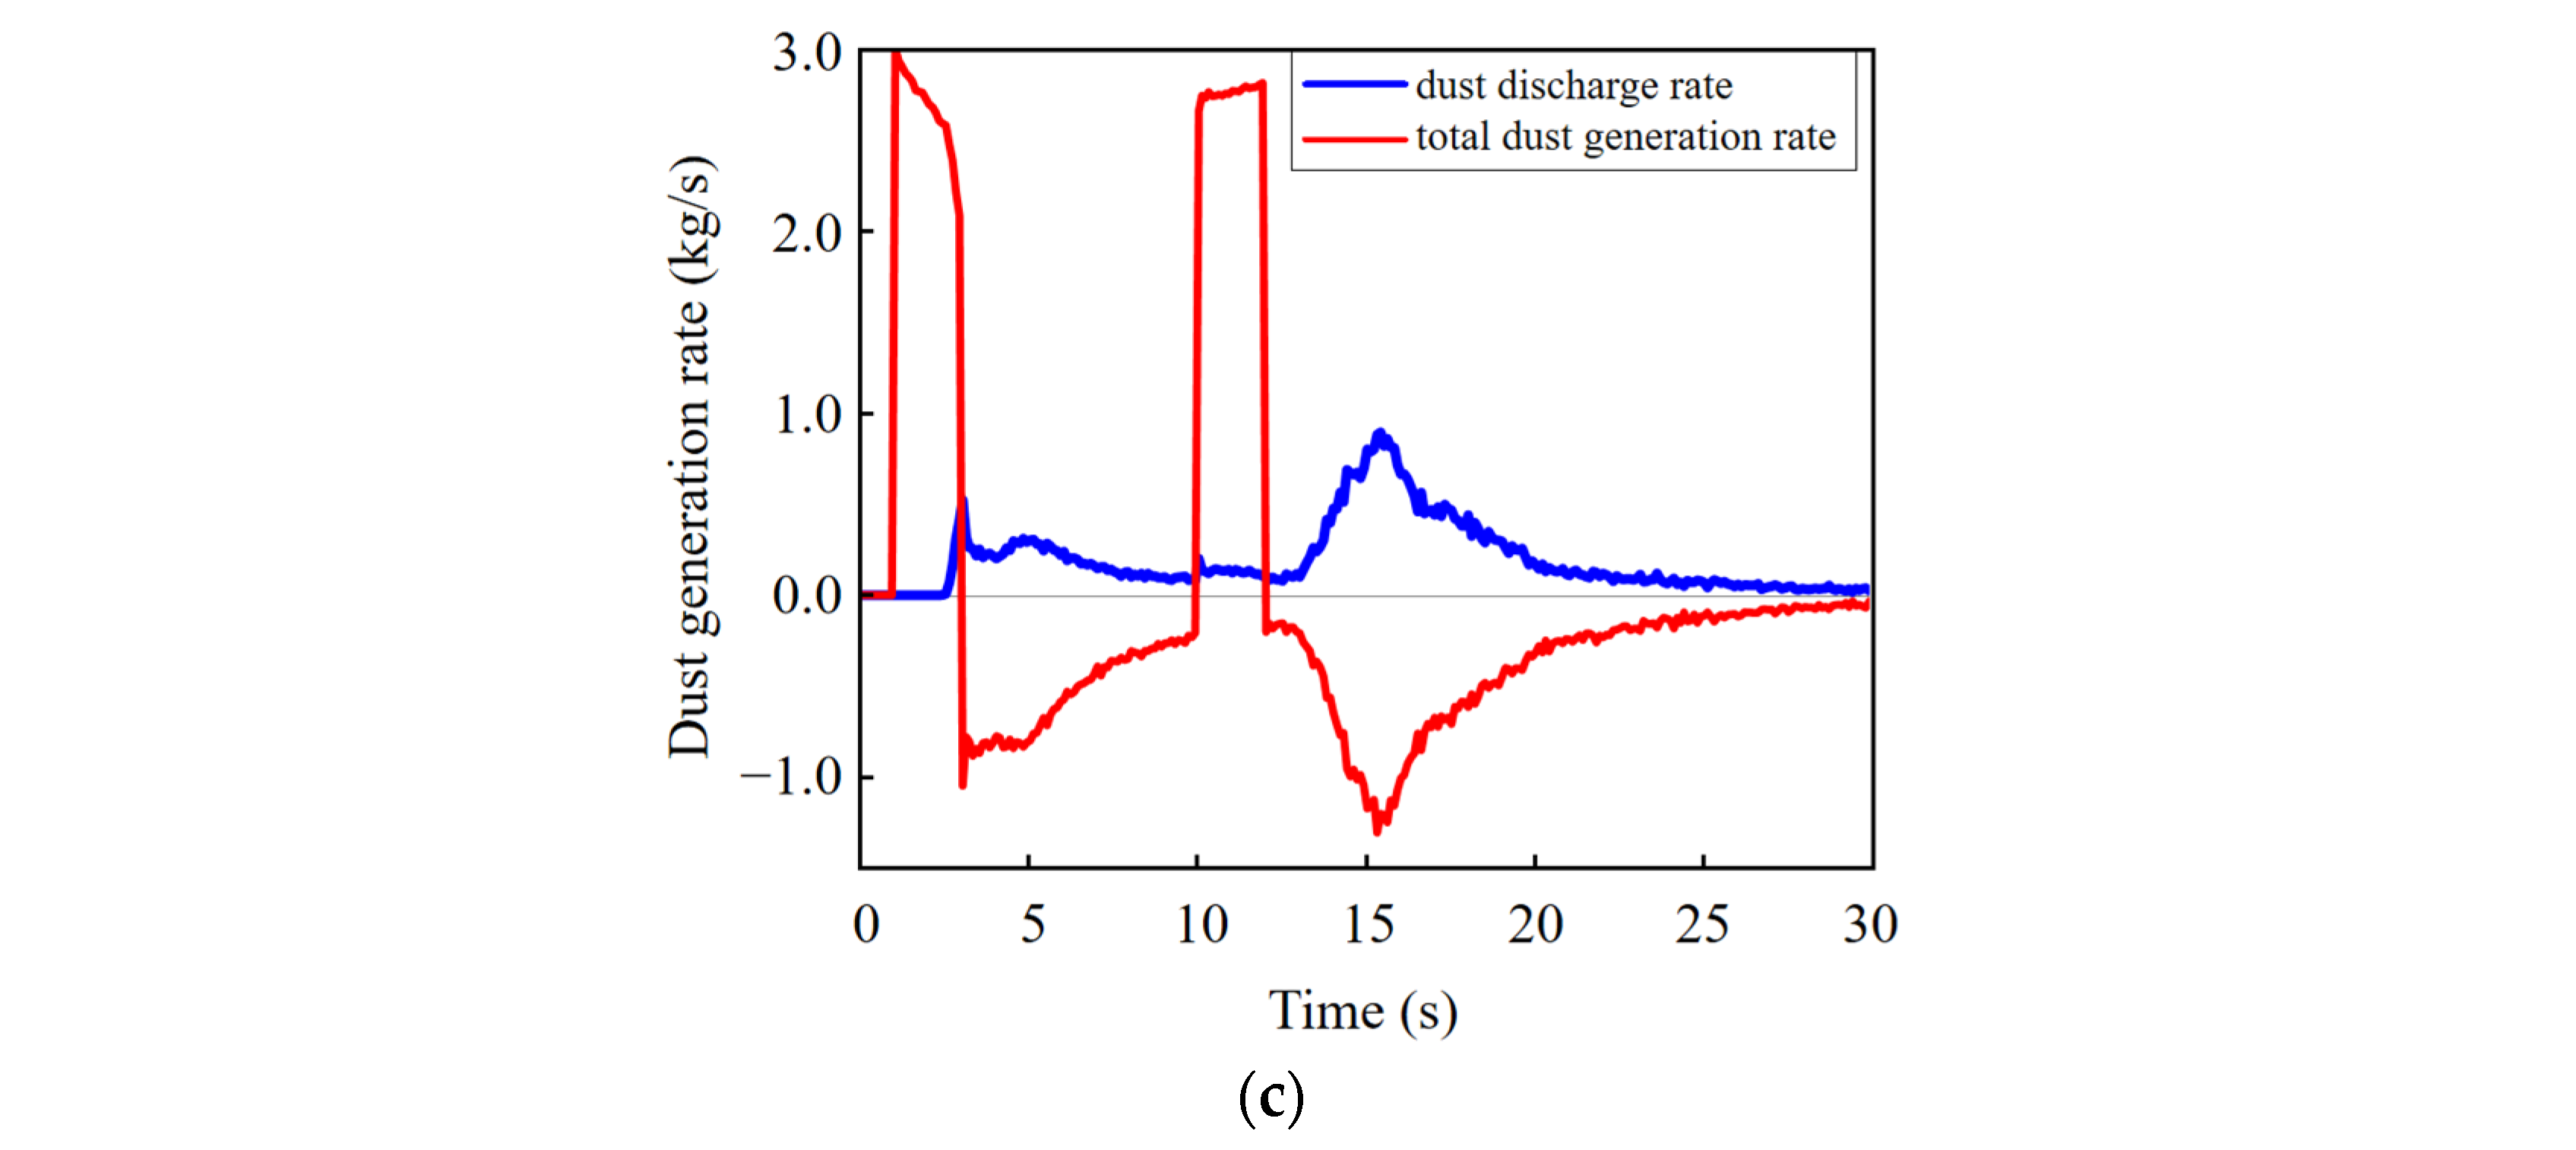
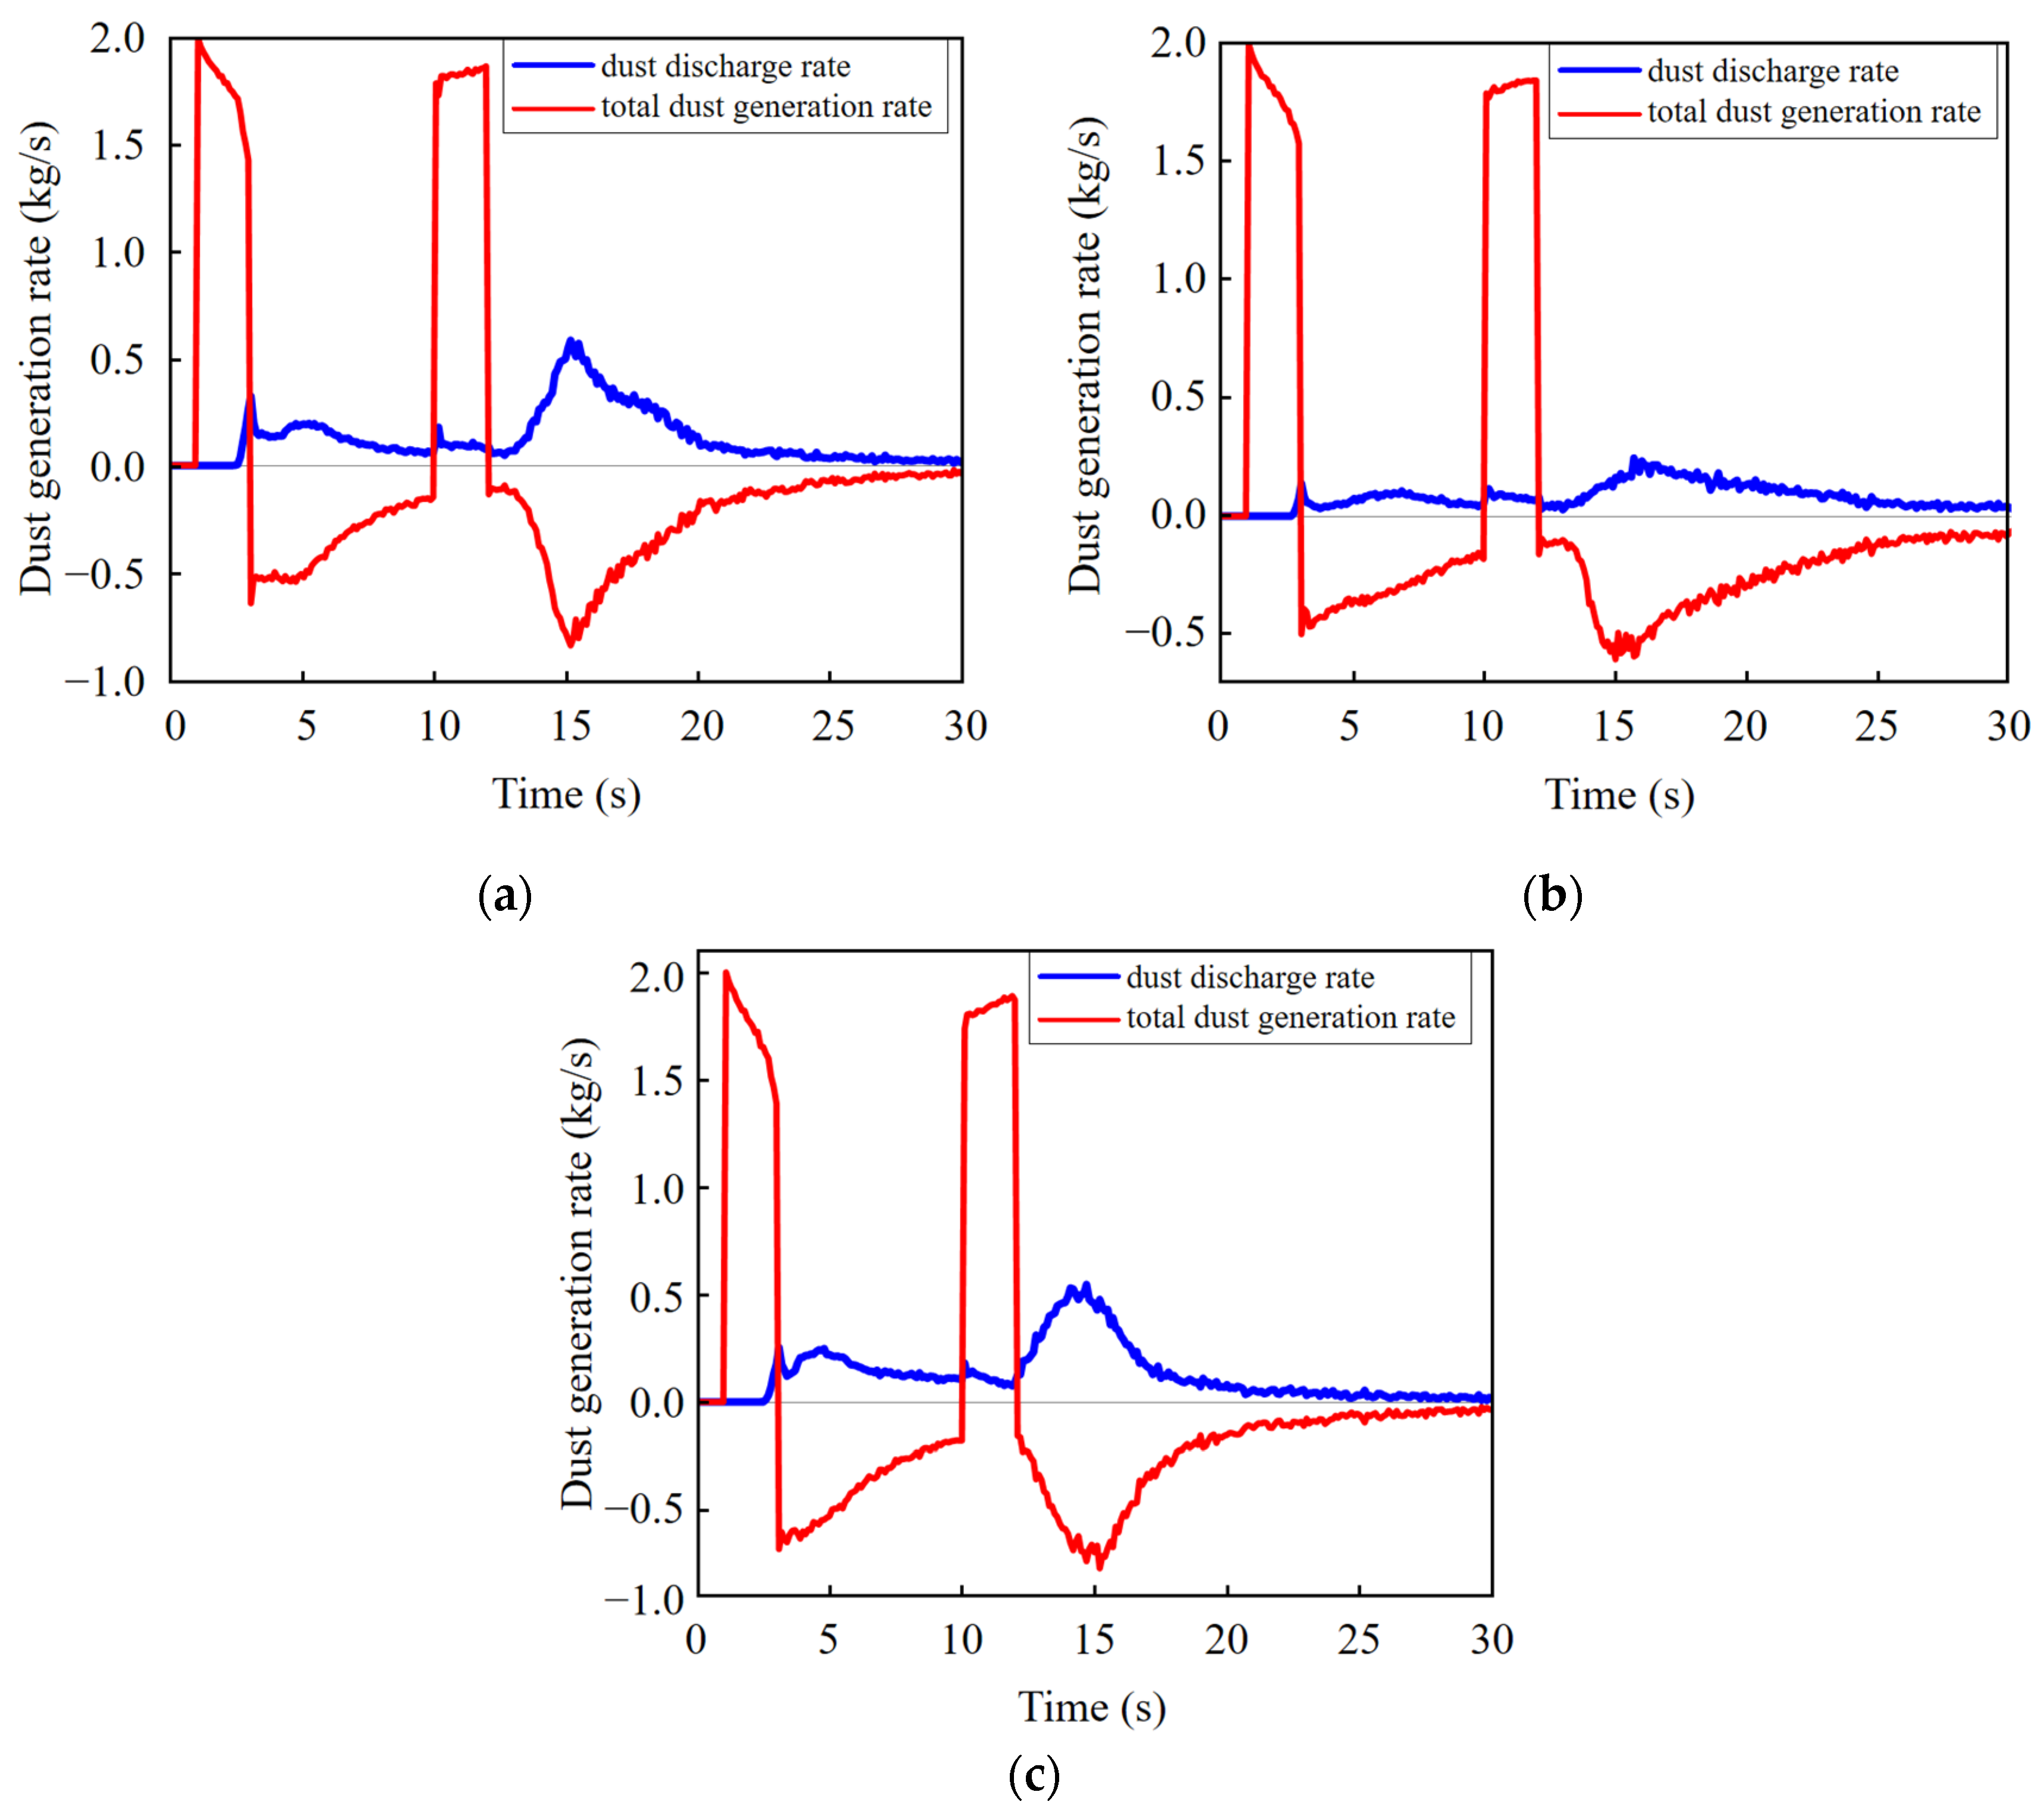
Figure 11 presents the total dust generation rate and the dust discharge rate at different times for schemes 1 to 3. The dust discharge rate refers to the quantity of dust discharged from the return air shaft per unit of time. The total dust generation rate signifies the difference between the quantity of dust generated in the roadway and that settled in the roadway and discharged from the return air shaft at that moment, which is the quantity of dust generated at that moment floating in the roadway. The integral of the total dust production rate over time is the total quantity of dust floating in the roadway.
In this model, the ore loading points generate dust at 1–3 s (the first dust generation stage) and the ore unloading point generates dust at 10–12 s (the second dust generation stage). During this time, the dust generation in the roadway exceeds that settled in the roadway and discharged from the return air shaft, resulting in a positive total dust generation rate. However, at the moments of 3–10 s (the first dust reduction stage) and 12–30 s (the second dust generation stage), the generation rate in the roadway is zero, consequently leading to a negative total dust production rate.
The overall trend in the changes in the dust generation rate in schemes 1, 2, and 3 is the same. The discharge rate begins to rise from 2.5 s, marking the onset of sulfide ore dust being discharged through the return air shaft. From 3 s onwards, the sulfide ore dust in the roadway experiences a rapid decrease. The loading operation concludes and transitions into the transporting operation, resulting in a considerable quantity of sulfide ore dust settling in the roadway. Simultaneously, a minor fraction of sulfide ore dust is discharged through the return air shaft. Between 10 and 12 s, the dust generation rate shows a stable trend. The quantity of sulfide ore dust discharged through the return air shaft increases significantly compared with the first dust reduction stage.

3.2. Roadway Air Velocity

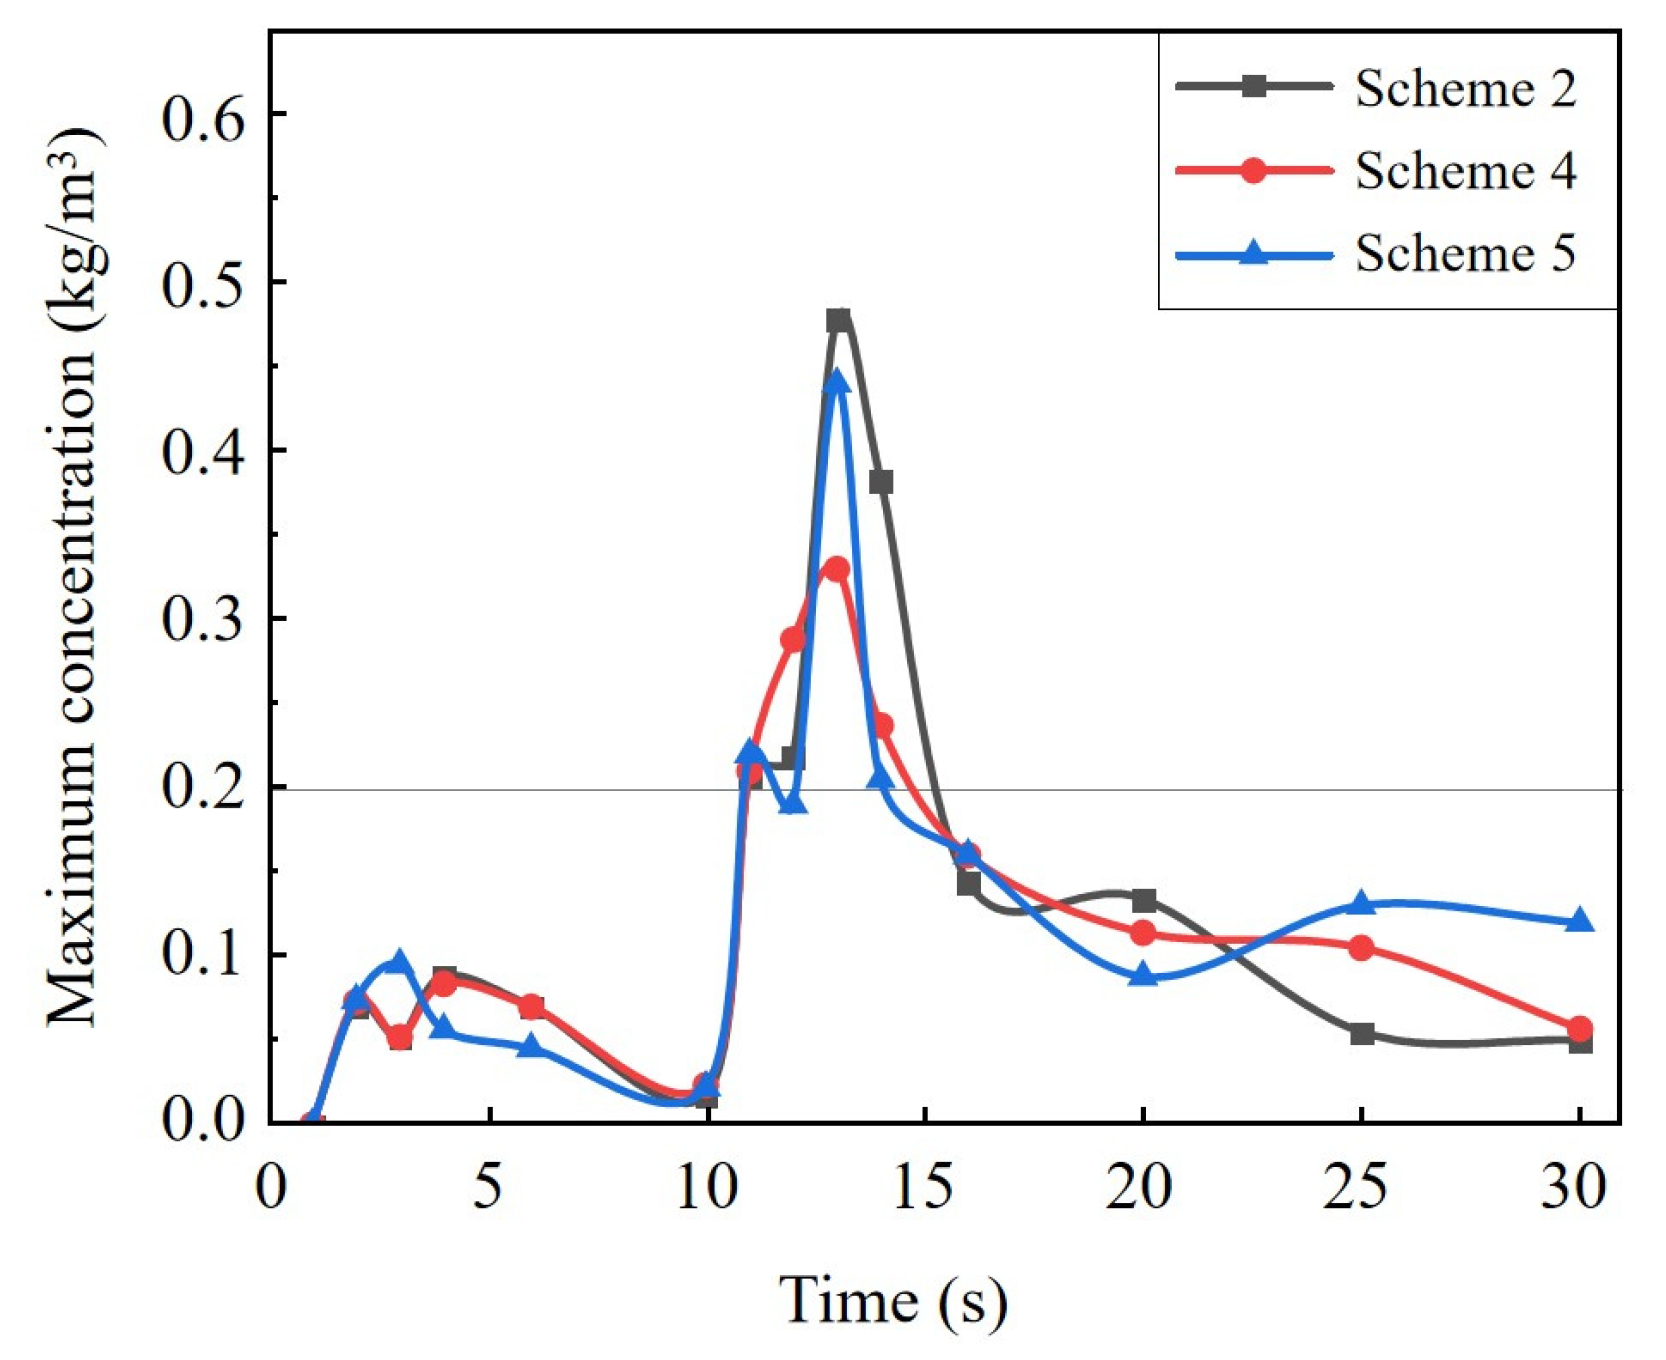
The roadway air velocities in schemes 2, 4, and 5 are 1 m/s, 0.5 m/s, and 2 m/s, respectively, with the loading point being “a” and the dust generation rate being 2 kg/s. Figure 12 presents the maximum concentration of sulfide ore dust in the roadway at different times for schemes 2, 4, and 5. Within the initial 0–10 s, the influence of air velocity remains relatively insignificant. Between 10 and 16 s, the air velocity becomes a significant factor. Specifically, the peak concentrations are ordered as Cmax, scheme2 > Cmax, scheme5 > Cmax, scheme4. The duration of the Cmax exceeding the lower limit for explosion concentration in each scheme is as follows: Tscheme2 (4.4 s) > Tscheme4 (4.0 s) > Tscheme5 (3.2 s). This indicates that a higher air velocity facilitates a more rapid discharge of sulfide dust, whereas a lower air velocity is more conducive to reducing the peak Cmax value.
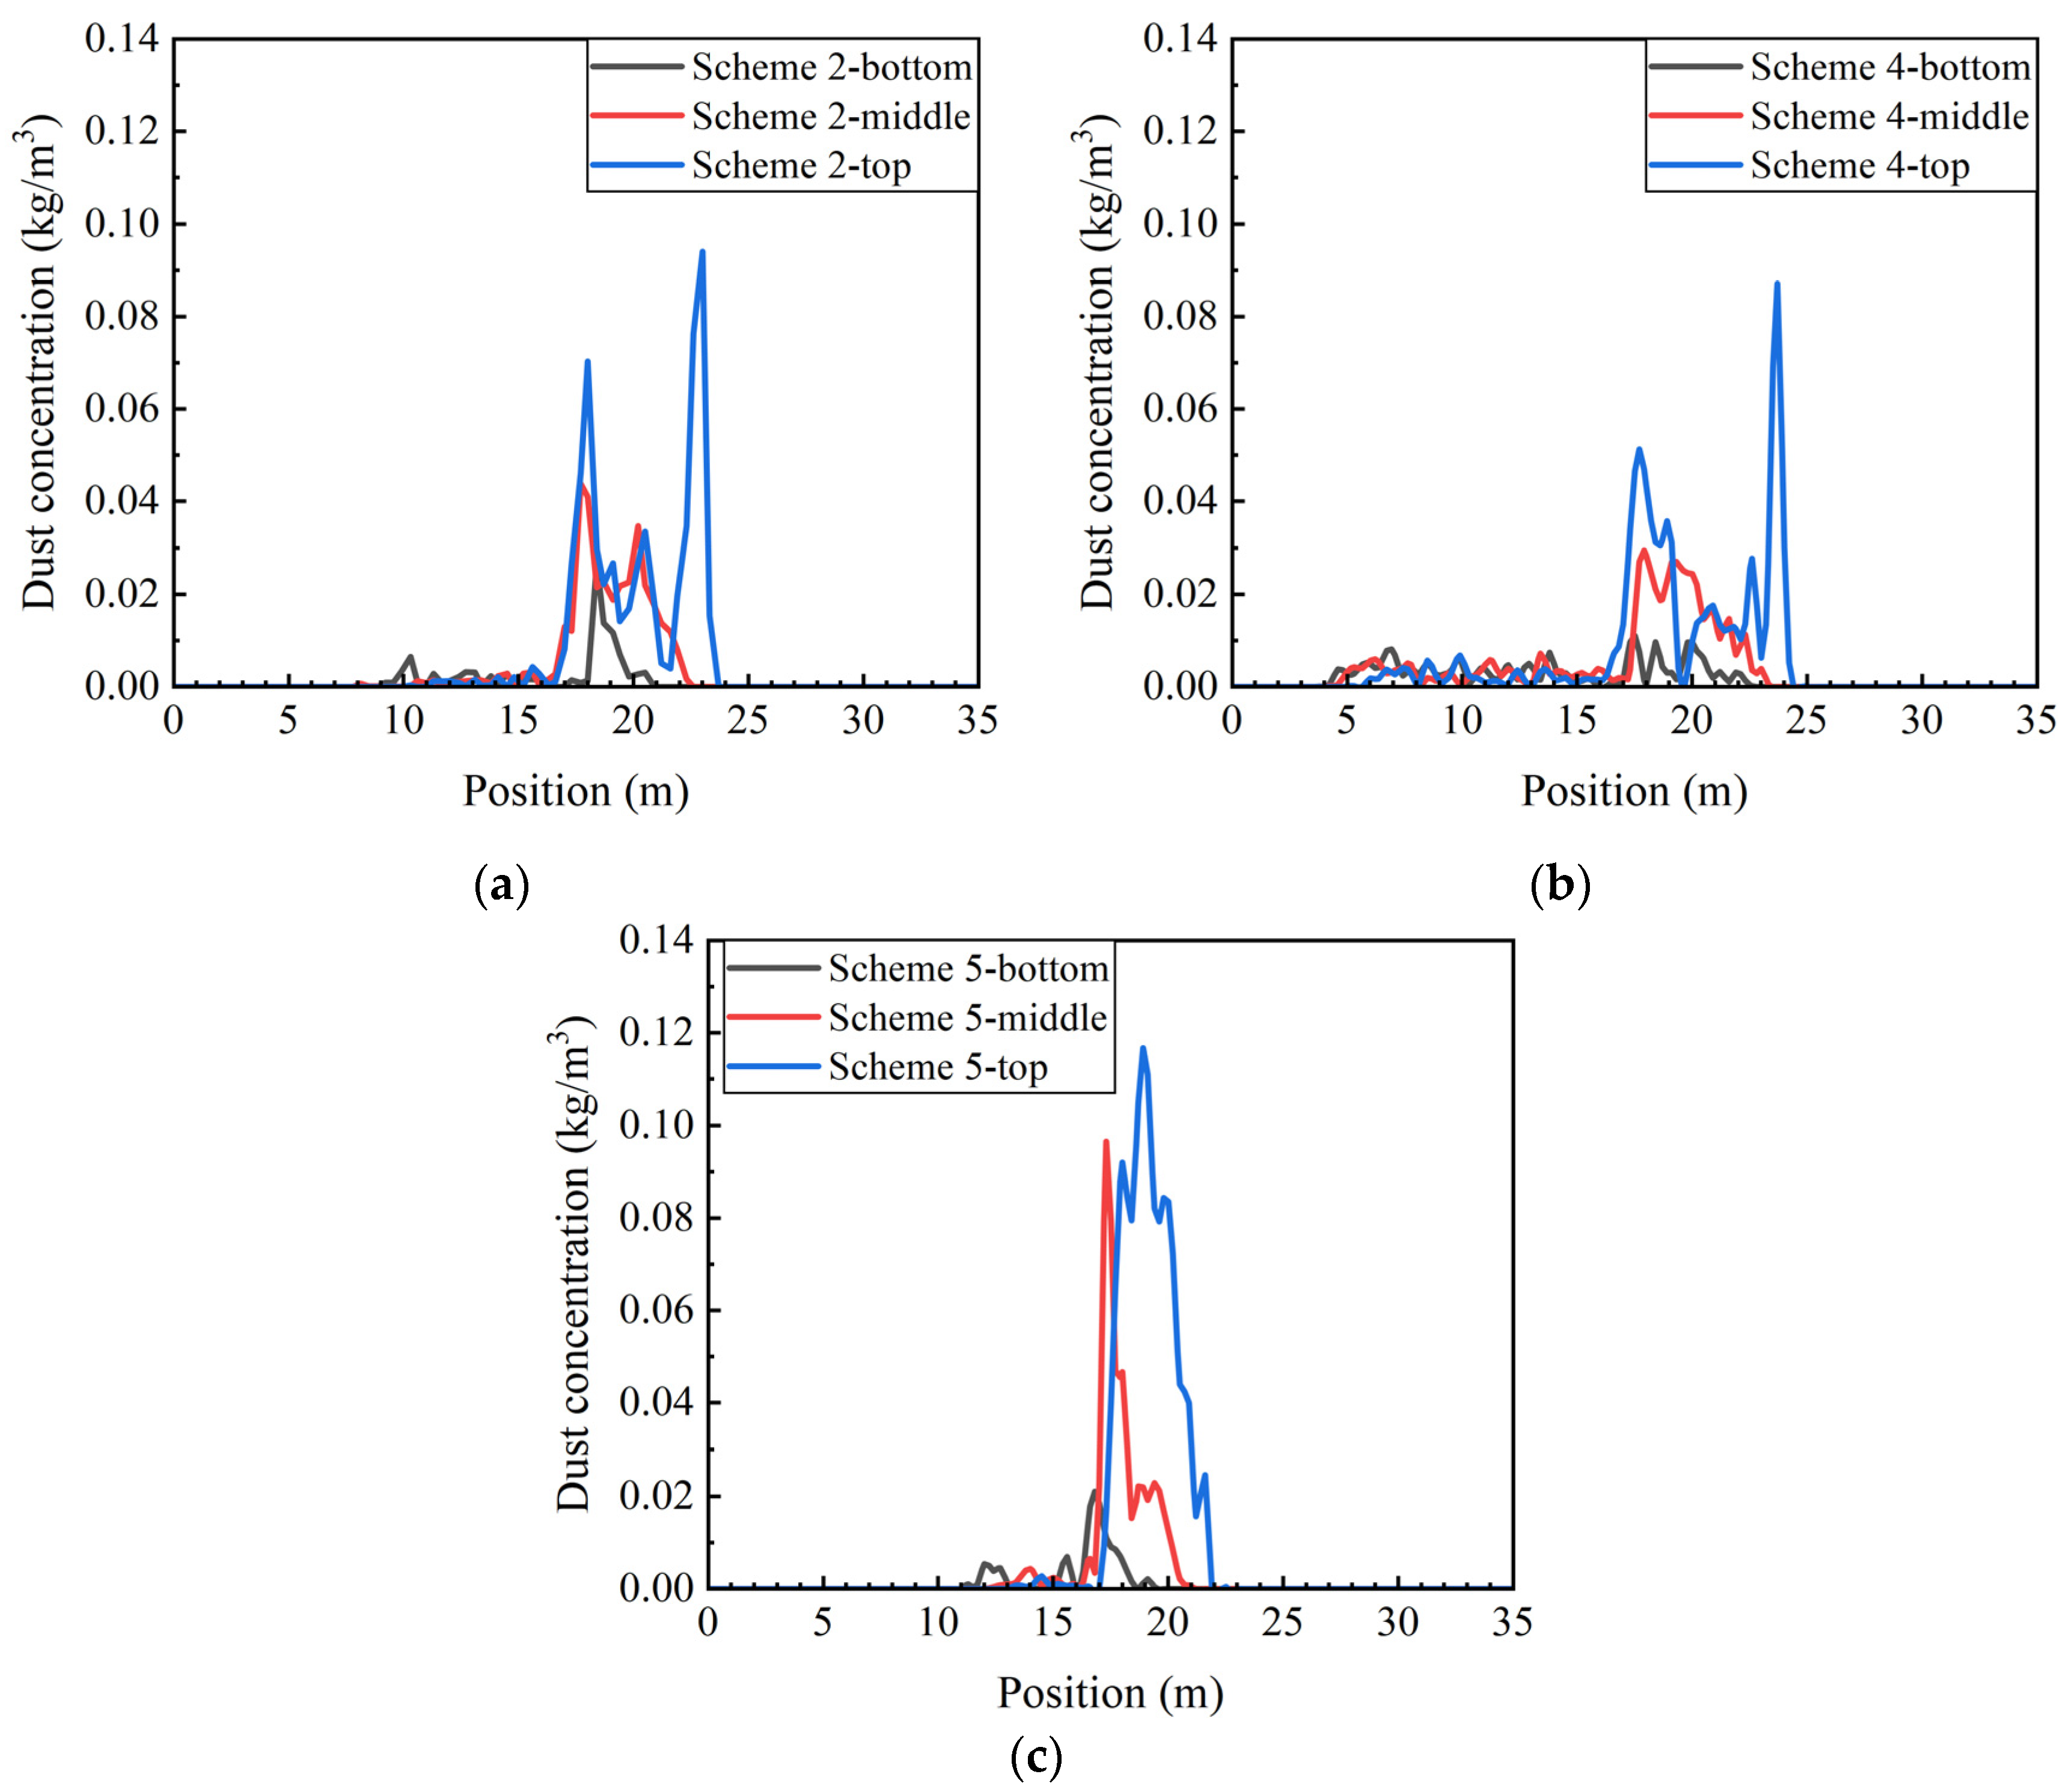
The maximum dust concentration in schemes 4 and 5 peaked at 13 s as well. Figure 13 presents the concentration of sulfide ore dust at different heights of the main haulage roadway at 13 s for scheme 2, 4, and 5. In scheme 4, the peak concentration of sulfide ore dust is observed at the return air shaft and ore pass, while in scheme 5, it is situated at 19 m. As the air velocity intensifies, the maximum dust concentration at the top and middle also rises. This signifies that an increased air velocity aggravates the superposition effect of sulfide ore dust, resulting in a more concentrated distribution. Within the first 15 m of the main haulage roadway, varying air velocities have a distinct impact on the distribution of the sulfide ore dust. Specifically, a slower air velocity prolongs the distribution distance of the sulfide ore dust and enlarges the settling space for the dust particles.
Figure 14 illustrates the dust discharge rate and the total dust generation rate at different times for schemes 2, 4, and 5. At an air velocity of 0.5 m/s (scheme 4), the dust discharge rate is minimal, indicating that sulfide ore dust settles more readily under lower wind speeds. As the air velocity increases, the impact of the airflow on the sulfide ore dust discharge becomes more significant, albeit coupled with an augmented dispersal of airborne sulfide ore dust. The above results indicate that the air velocity has a dual effect on the dispersion of sulfide ore dust. Therefore, adopting an optimal air velocity is crucial for effectively reducing dust concentrations.

3.3. Dust Source Position

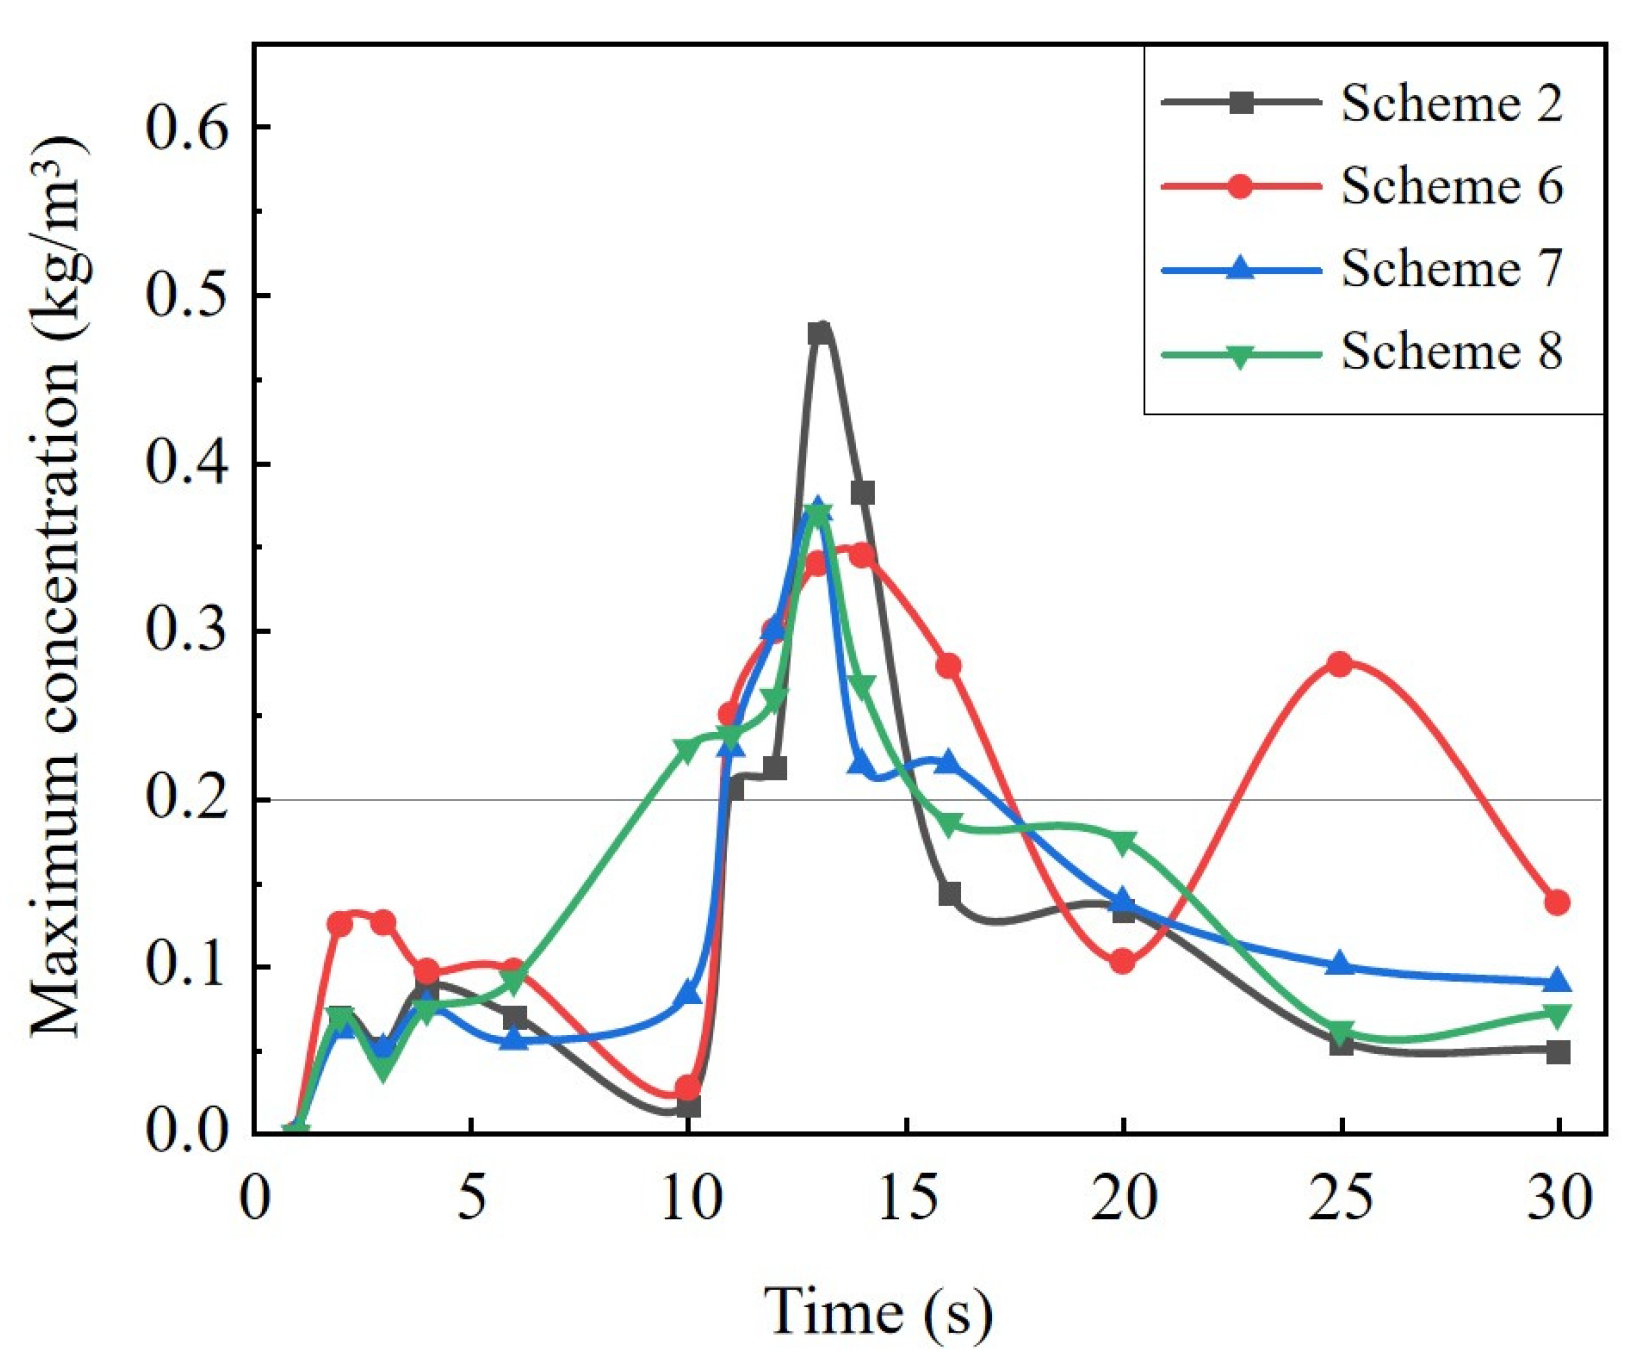
The ore loading positions in schemes 2, 6, 7, and 8 are “a”, “b”, “c”, and “d”, respectively, with the roadway air velocity being 1 m/s and the dust generation rate being 2 kg/s. The maximum concentration of sulfide ore dust in the roadway at different times for these schemes is shown in Figure 15. The peak Cmax reaches 0.47 kg/m3 in scheme 2, which is higher than that of others. The Cmax in scheme 6 fluctuates significantly at different times and has the longest duration above the lower explosive concentration limit. In scheme 6, the sulfide ore dust is discharged from the return air shaft through the shortest path. Moreover, due to the disturbance of airflow near the return air shaft, the diffusion movement of the sulfide ore dust is more intense and disperses in the roadway space for a longer time.
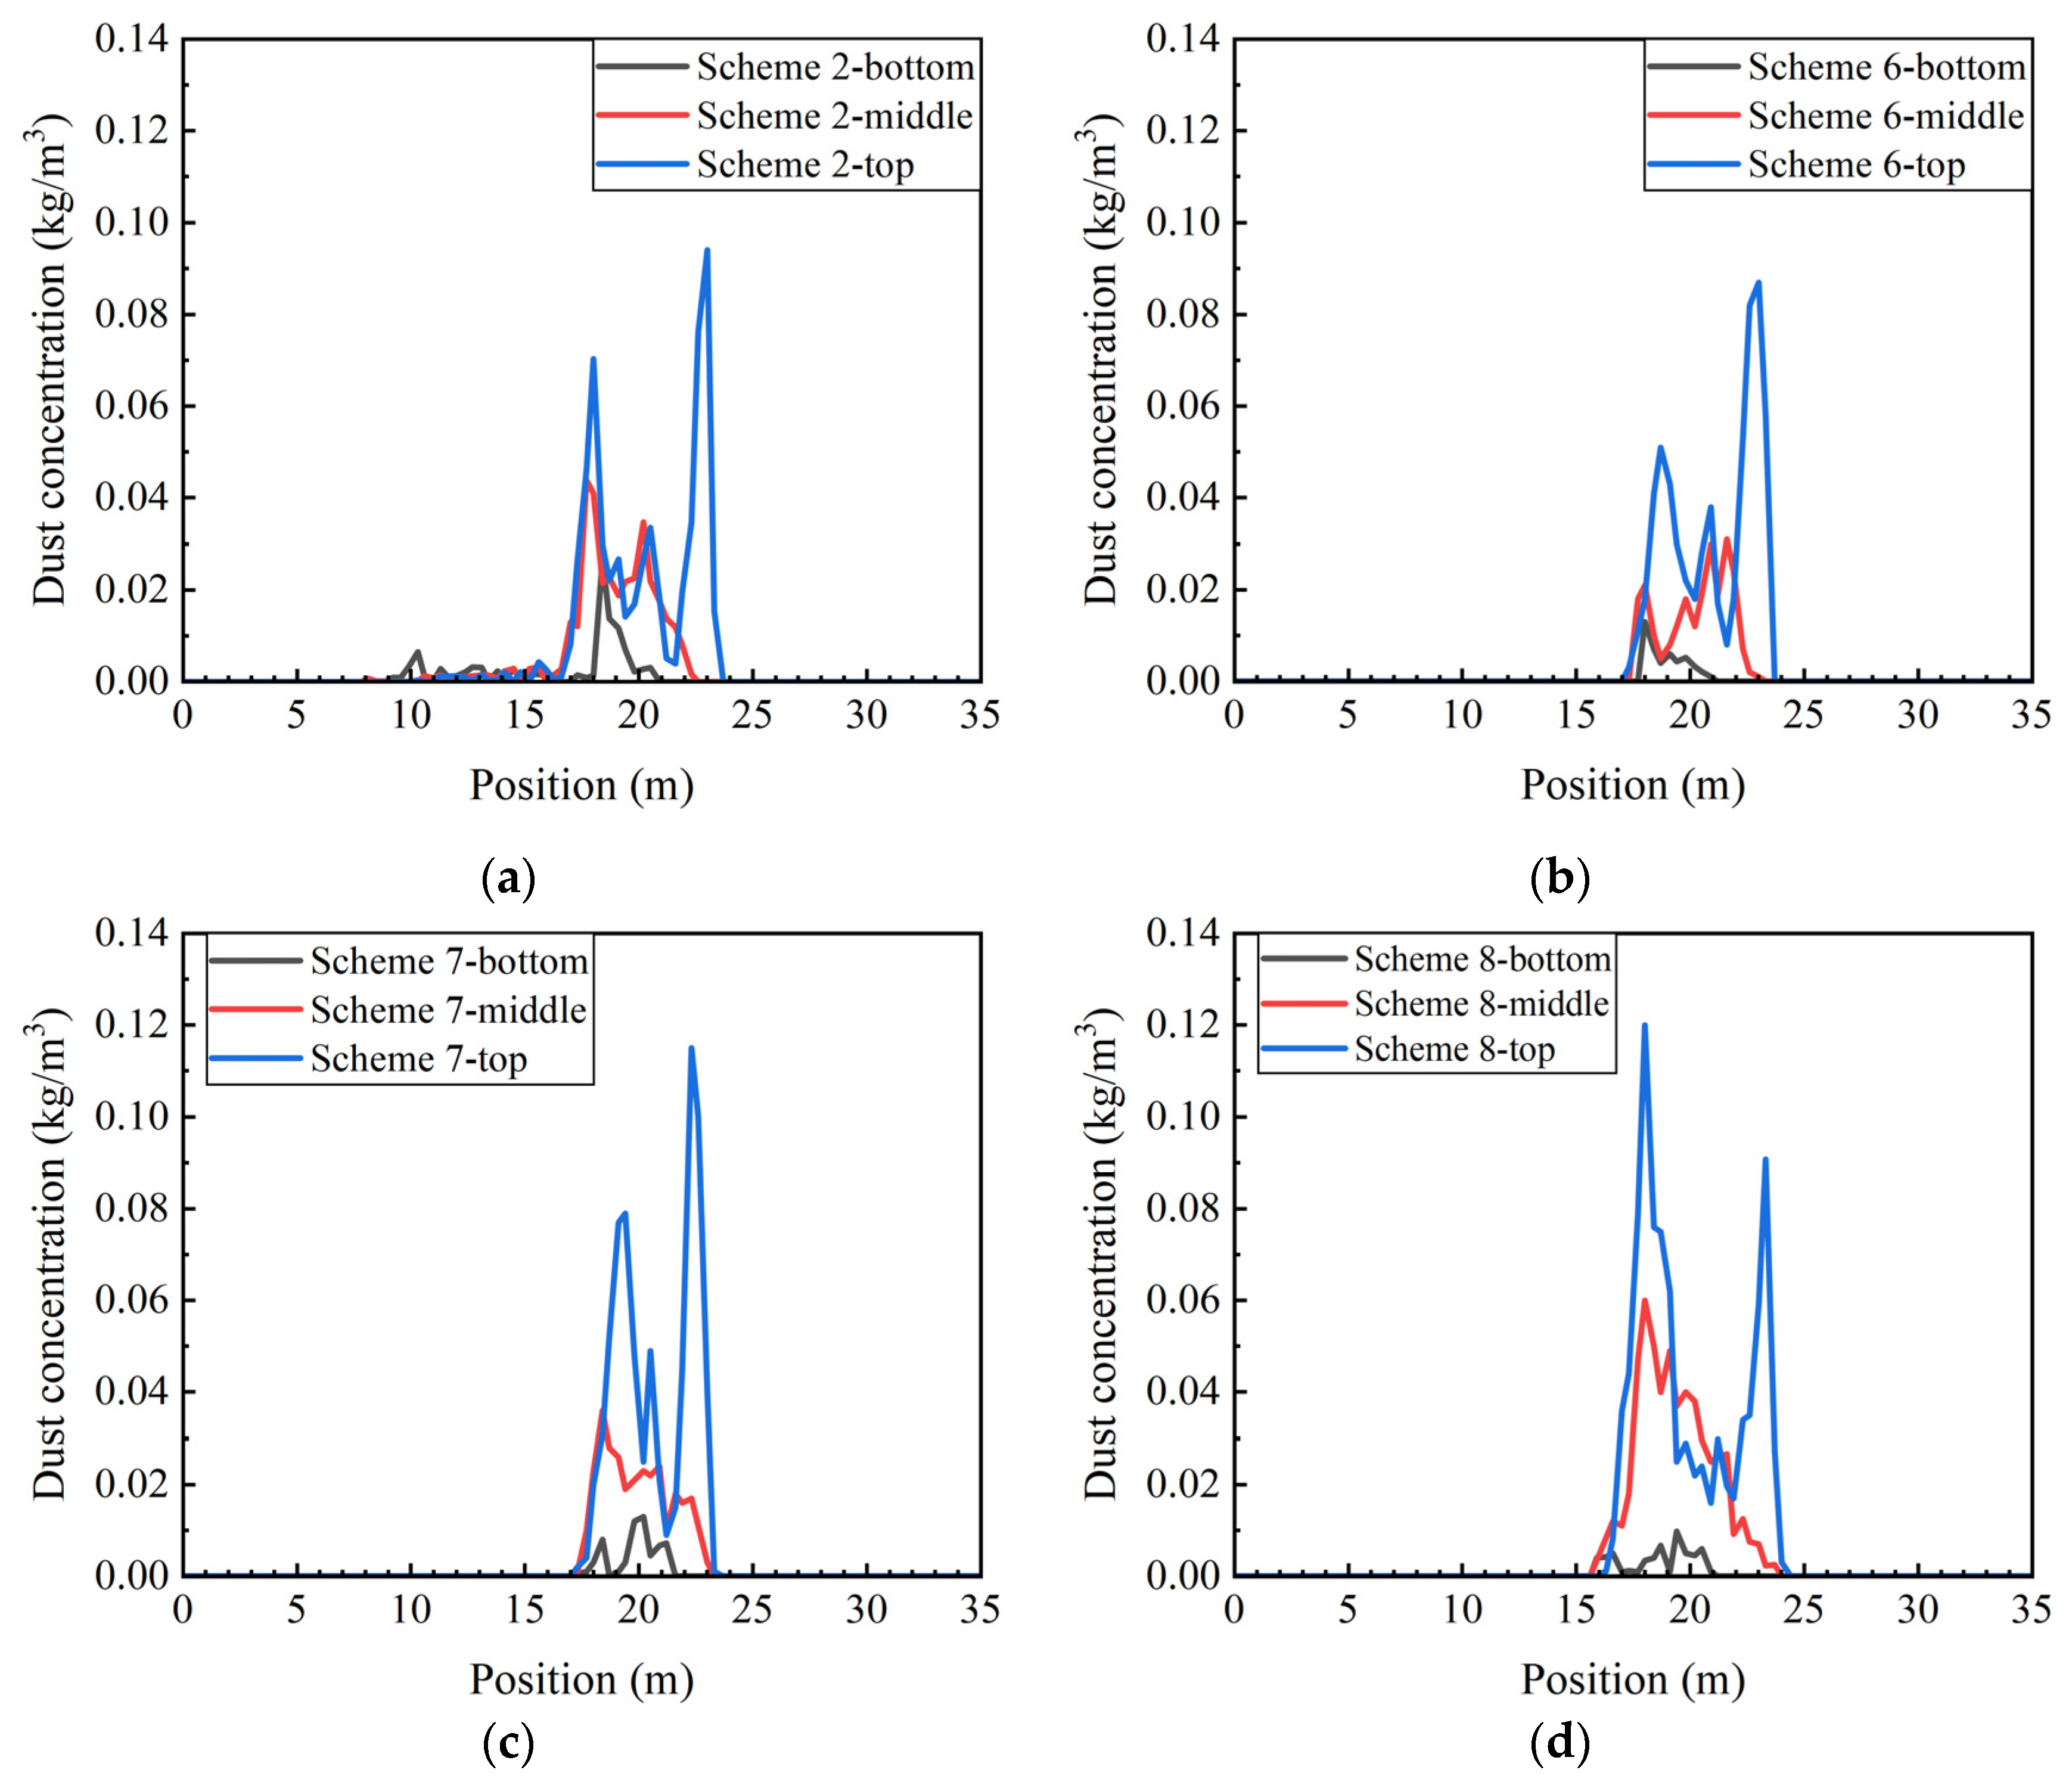
Figure 16 shows the concentration of sulfide ore dust at different heights in the main haulage roadway at 13 s for schemes 2, 6, 7, and 8. In scheme 7, the concentration of sulfide dust in the top position of the ore pass is significantly greater than that in the middle and bottom, and the difference in concentration between the top, middle, and bottom is significant. Furthermore, for scheme 8, the dust concentrations at the top and middle within the return air shaft are greater than those observed in the ore pass, distinguishing it from the other schemes.
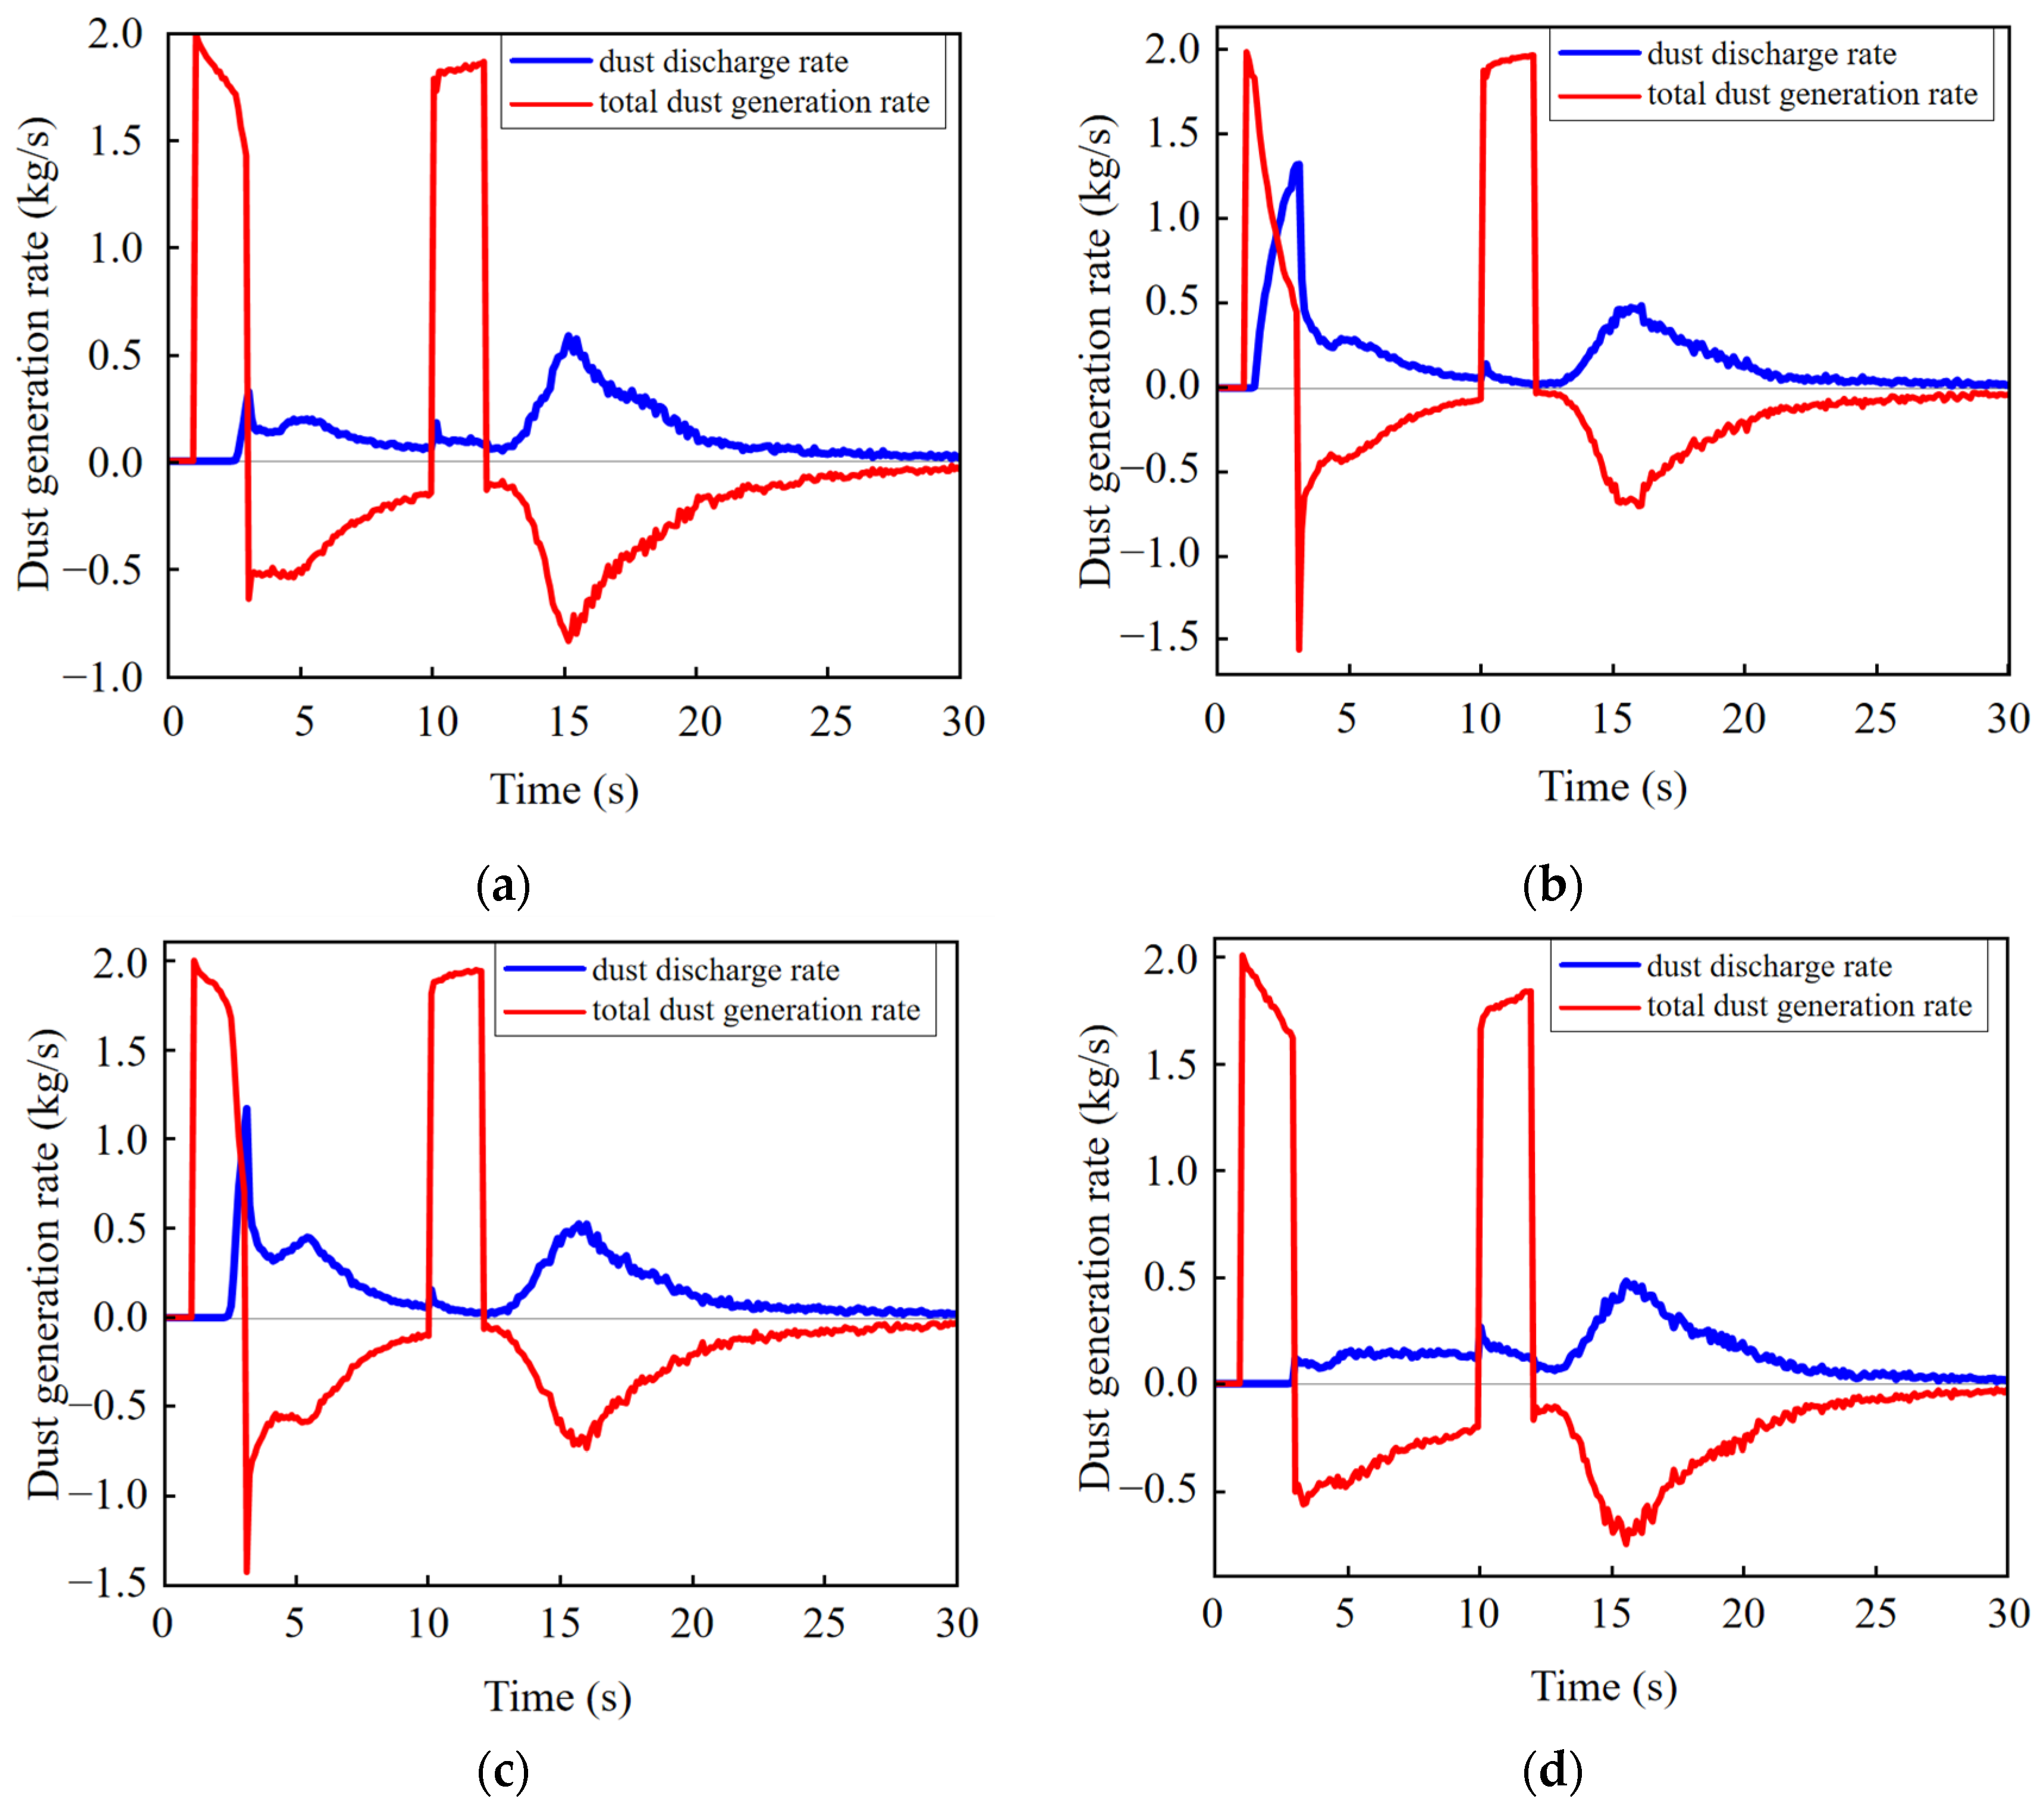
Figure 17 presents the dust discharge rate and the total dust generation rate at different times for schemes 2, 6, 7, and 8. When the dust source is closer to the return air shaft, the dust discharge is timely and the quantity of dust discharge is high for schemes 6 and 7. Particularly in scheme 6, most of the sulfide ore dust can reach the return air shaft and be discharged quickly through the return air shaft at the same time as dust generation. For scheme 8, the dust source in the first dust generation stage is far from the return air shaft. The sulfide ore dust settles more on the path between the dust source and the return air shaft, and only a small portion is discharged.
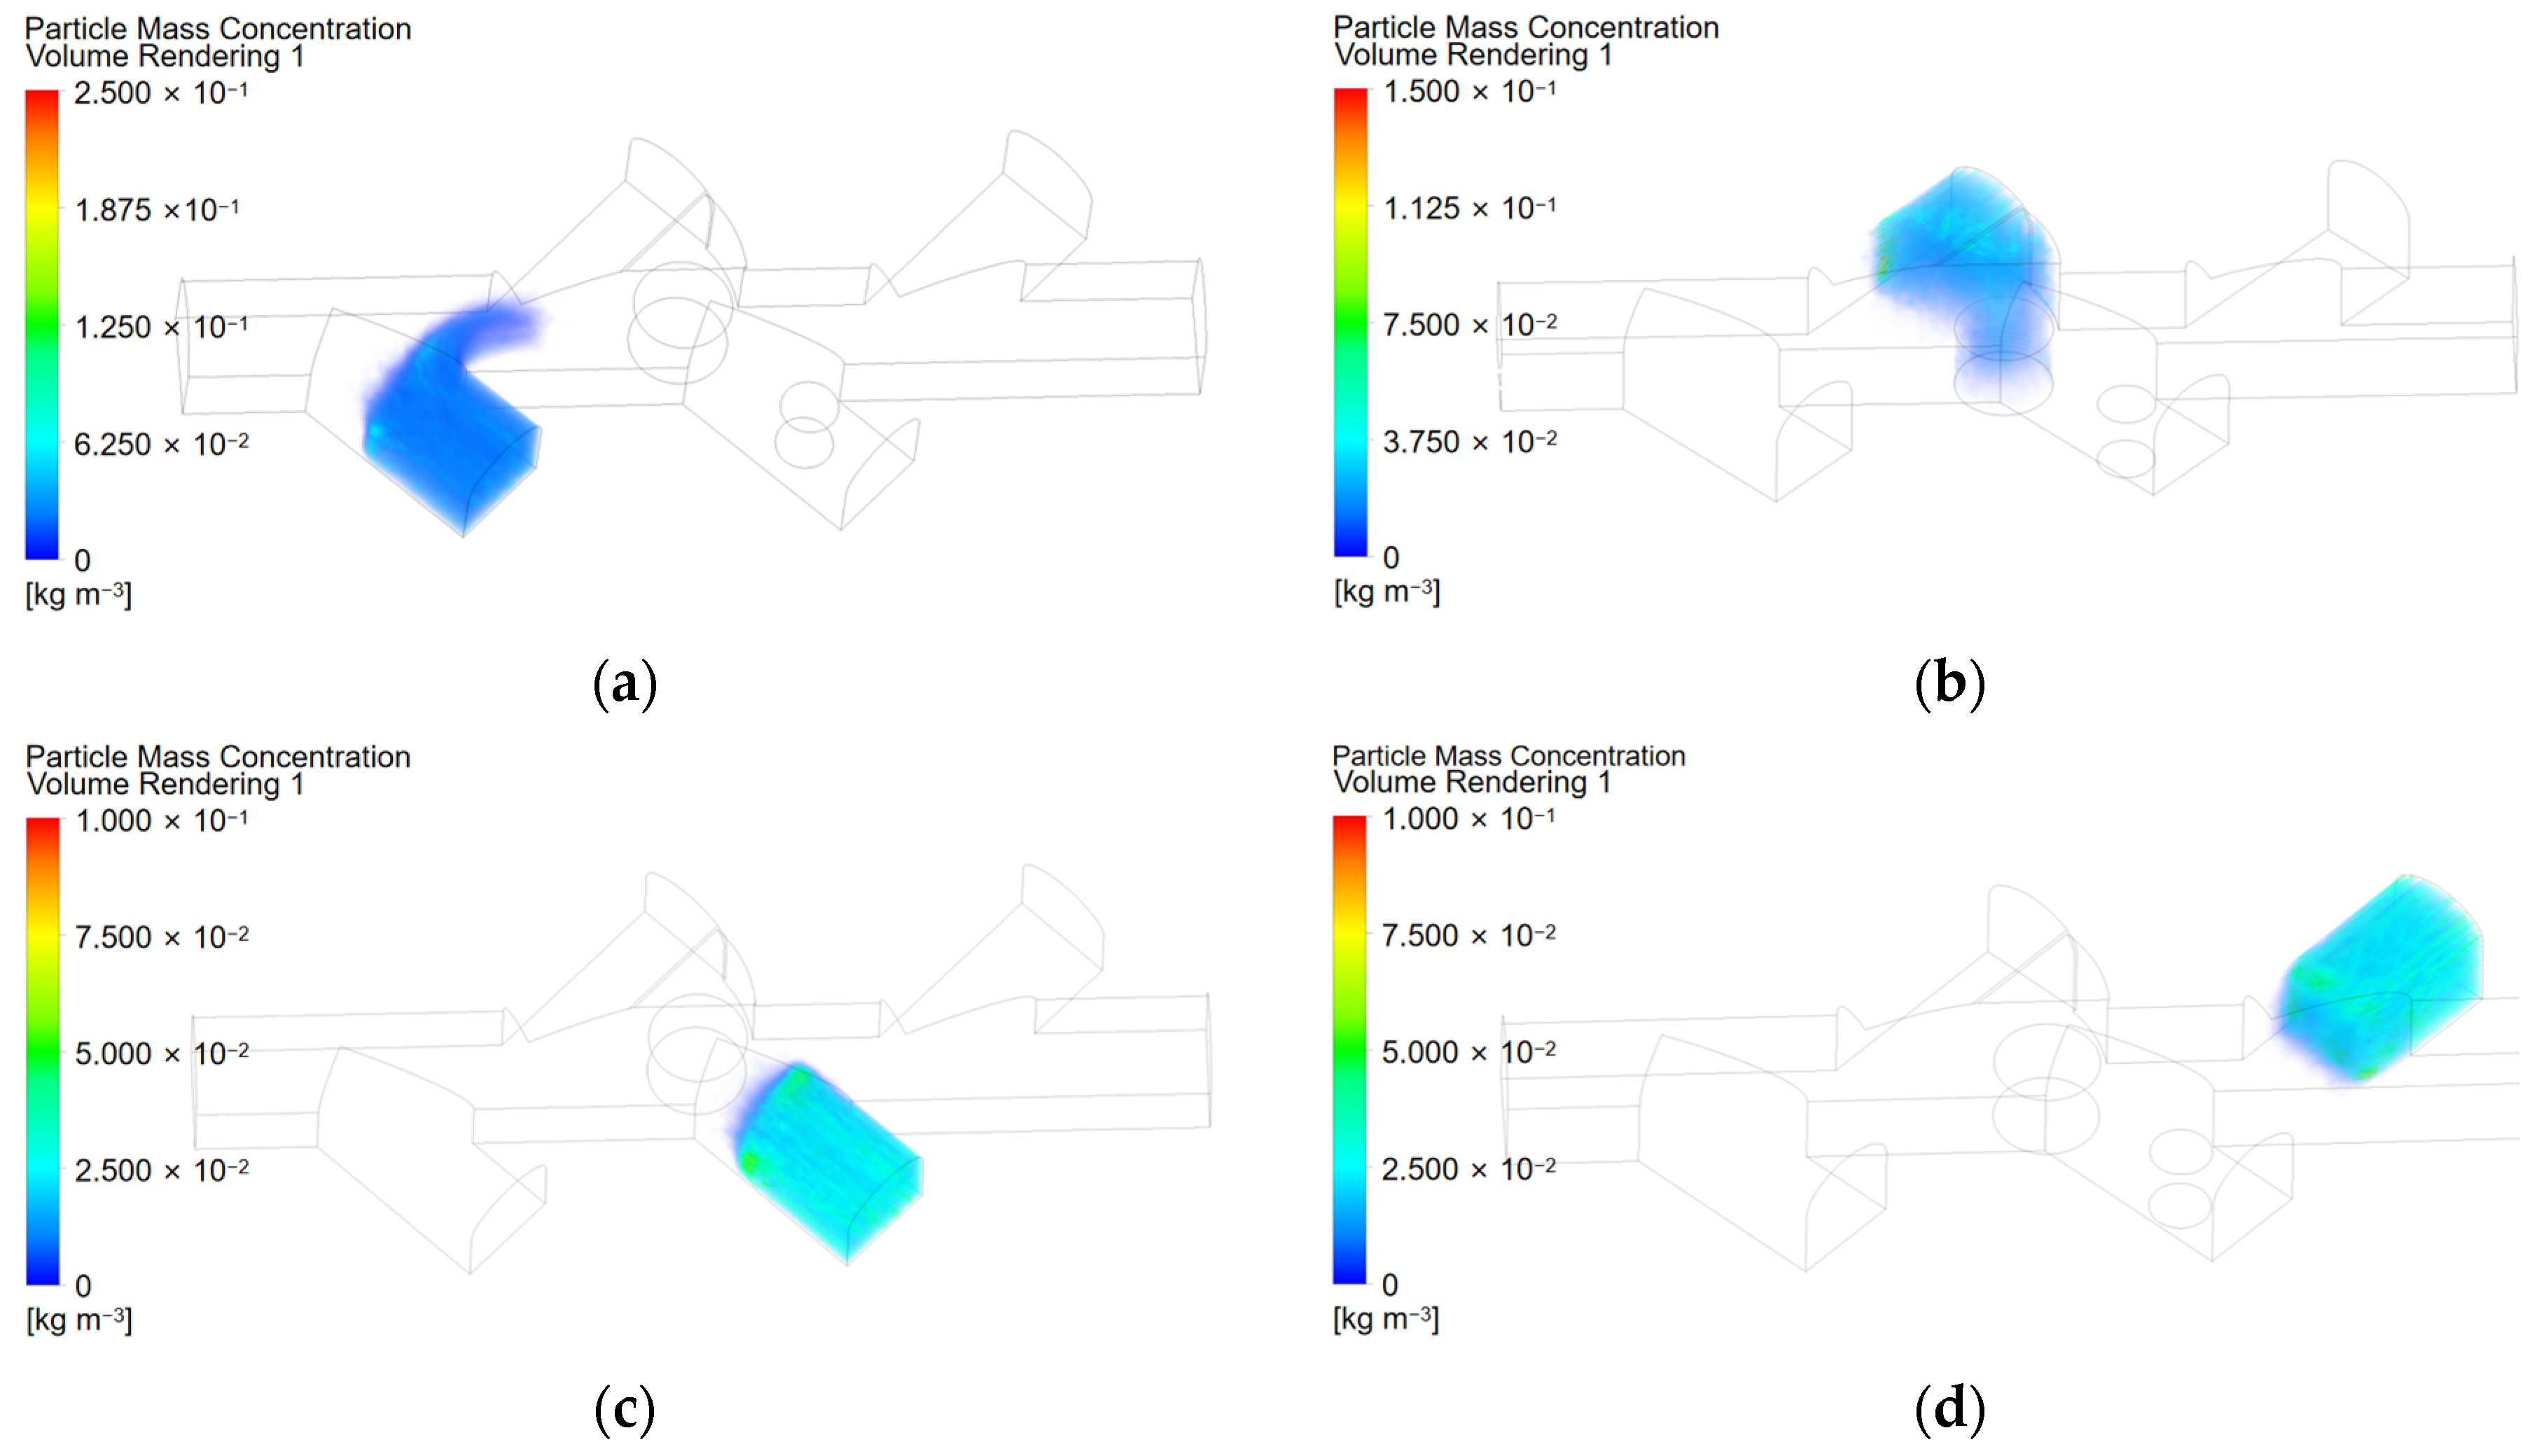
Based on the preceding analysis of sulfide ore dust movement patterns at various times, 3 s, 13 s, and 30 s are chosen to analyze the distribution of sulfide ore dust concentration in the roadway. These selected times correspond to the onset of dust transportation, the peak dispersed concentration, and the ultimate dispersed state, respectively. Figure 18 presents the distribution of sulfide ore dust in the model layout at 3 s. The loading point in scheme 6 is the closest to the return air shaft, and the sulfide ore dust generated is the first to be discharged through the return air shaft. The sulfide ore dust in scheme 8, which is farther away from the return air shaft, is only transported to the haulage roadway. The maximum dust concentration in all schemes is 0.1 kg/m3, which is below the lower limit of explosive concentration.
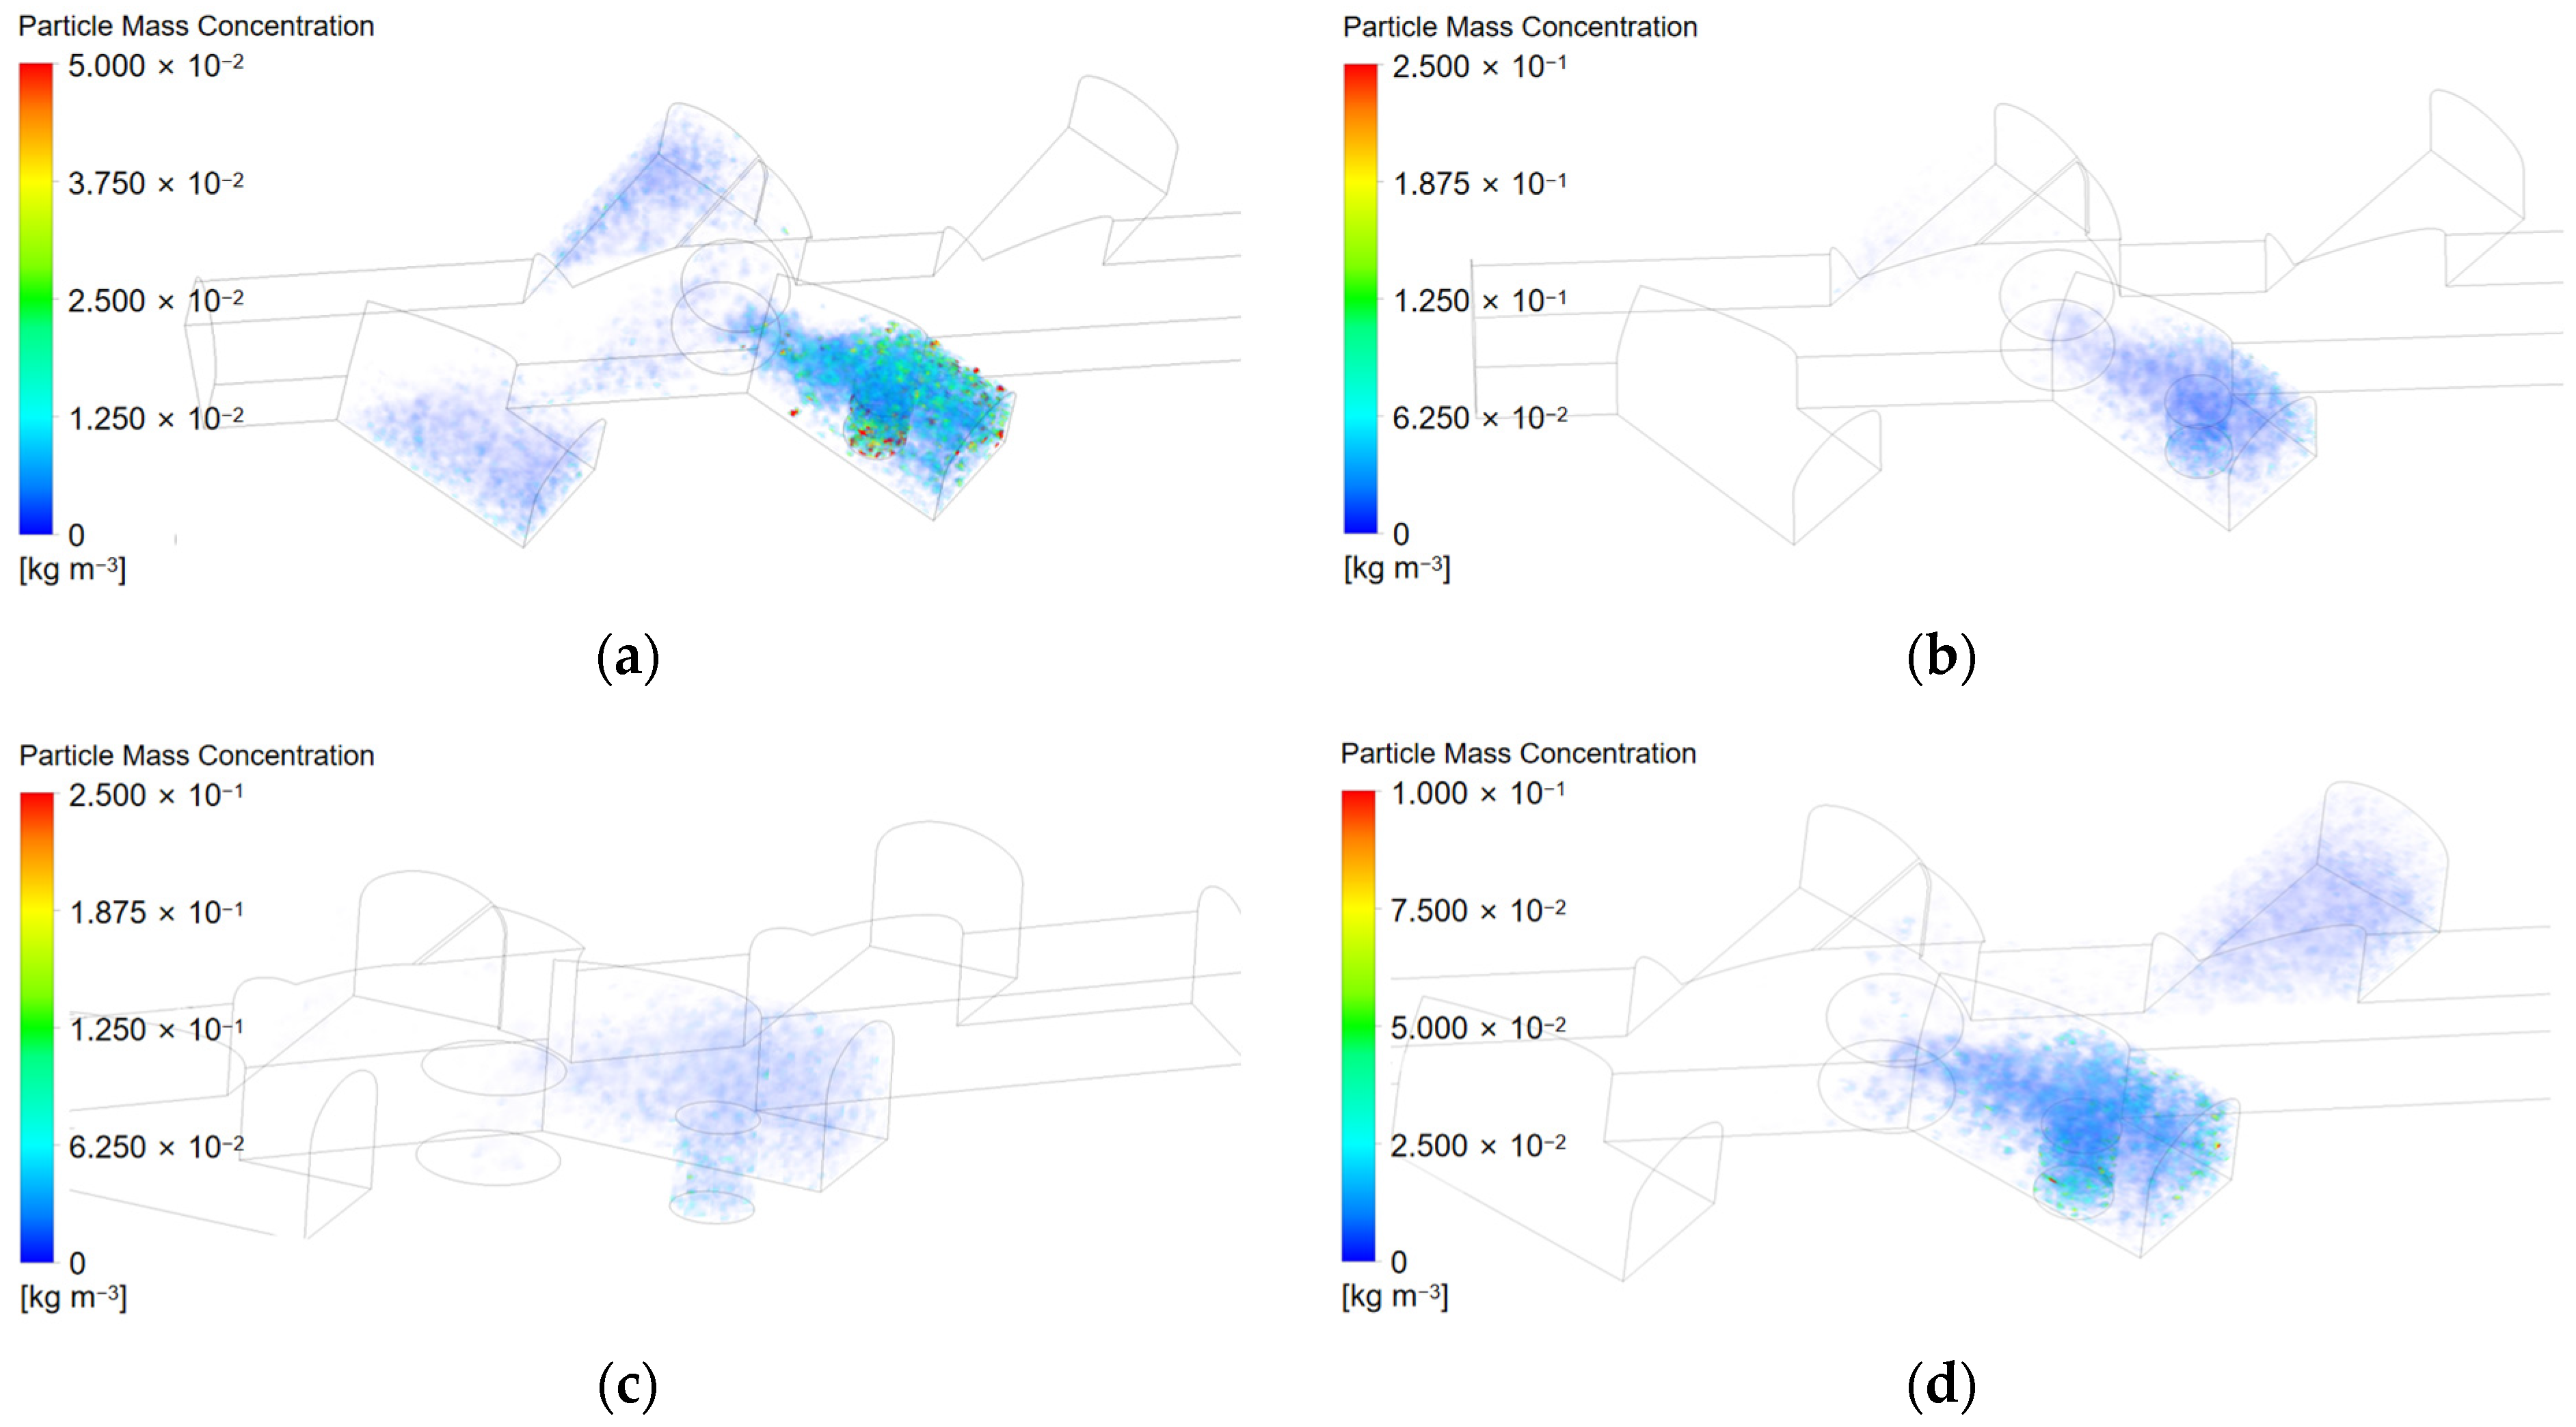
Figure 19 presents the distribution of sulfide ore dust in the model layout at 13 s. At 13 s, the sulfide ore dust is in a highly dispersed state. Most of the dust generated in the first dust generation stage has been settled and discharged. At this time, the high concentration of sulfide ore dust is mainly distributed in the ore pass and above the roadway wall.
Figure 20 shows the distribution of sulfide ore dust in the model layout at 30 s. The concentration of sulfide ore dust in the different schemes is reduced to below the lower limit of the explosive concentration, and the spatial location of the final distribution of sulfide ore dust varies significantly. The ore pass is the location with the major concentration of sulfide ore dust in the different schemes, which is the essential location for sulfide ore dust management.

4. Water Curtain Dust Reduction and Dynamic Ventilation

A comprehensive dust reduction scheme is proposed based on the above analysis of the movement law, aggregation position, and duration of sulfide ore dust settlement. The water curtain measures are adopted at the dust-generating positions to reduce the generation of sulfide ore dust from the source. During the migration, diffusion, and settlement of sulfide ore dust, the air velocity of the roadway should be controlled by controlling the operation of fans. Dynamic ventilation methods are used to reduce effects of the disturbance of airflow on the sulfide ore dust and discharge the sulfide ore dust promptly. According to existing research, the dust reduction efficiency of the water curtain can reach more than 55%. After adding an appropriate amount of dust suppressant, the dust reduction efficiency can reach 85.9% [25,26]. In this paper, recycled water is used as the medium to reduce the generation of sulfide ore dust at the ore loading point and ore pass. And the dust reduction efficiency is taken as 50%. Based on the above analysis, a high air velocity is conducive to the timely migration of sulfide ore dust to the return air shaft, while a low air velocity at the return air shaft can avoid dust accumulation caused by airflow disturbance. Considering the distance from the roadway entrance to the return air shaft, the change of airflow from the entrance to the return air shaft has a certain delay.
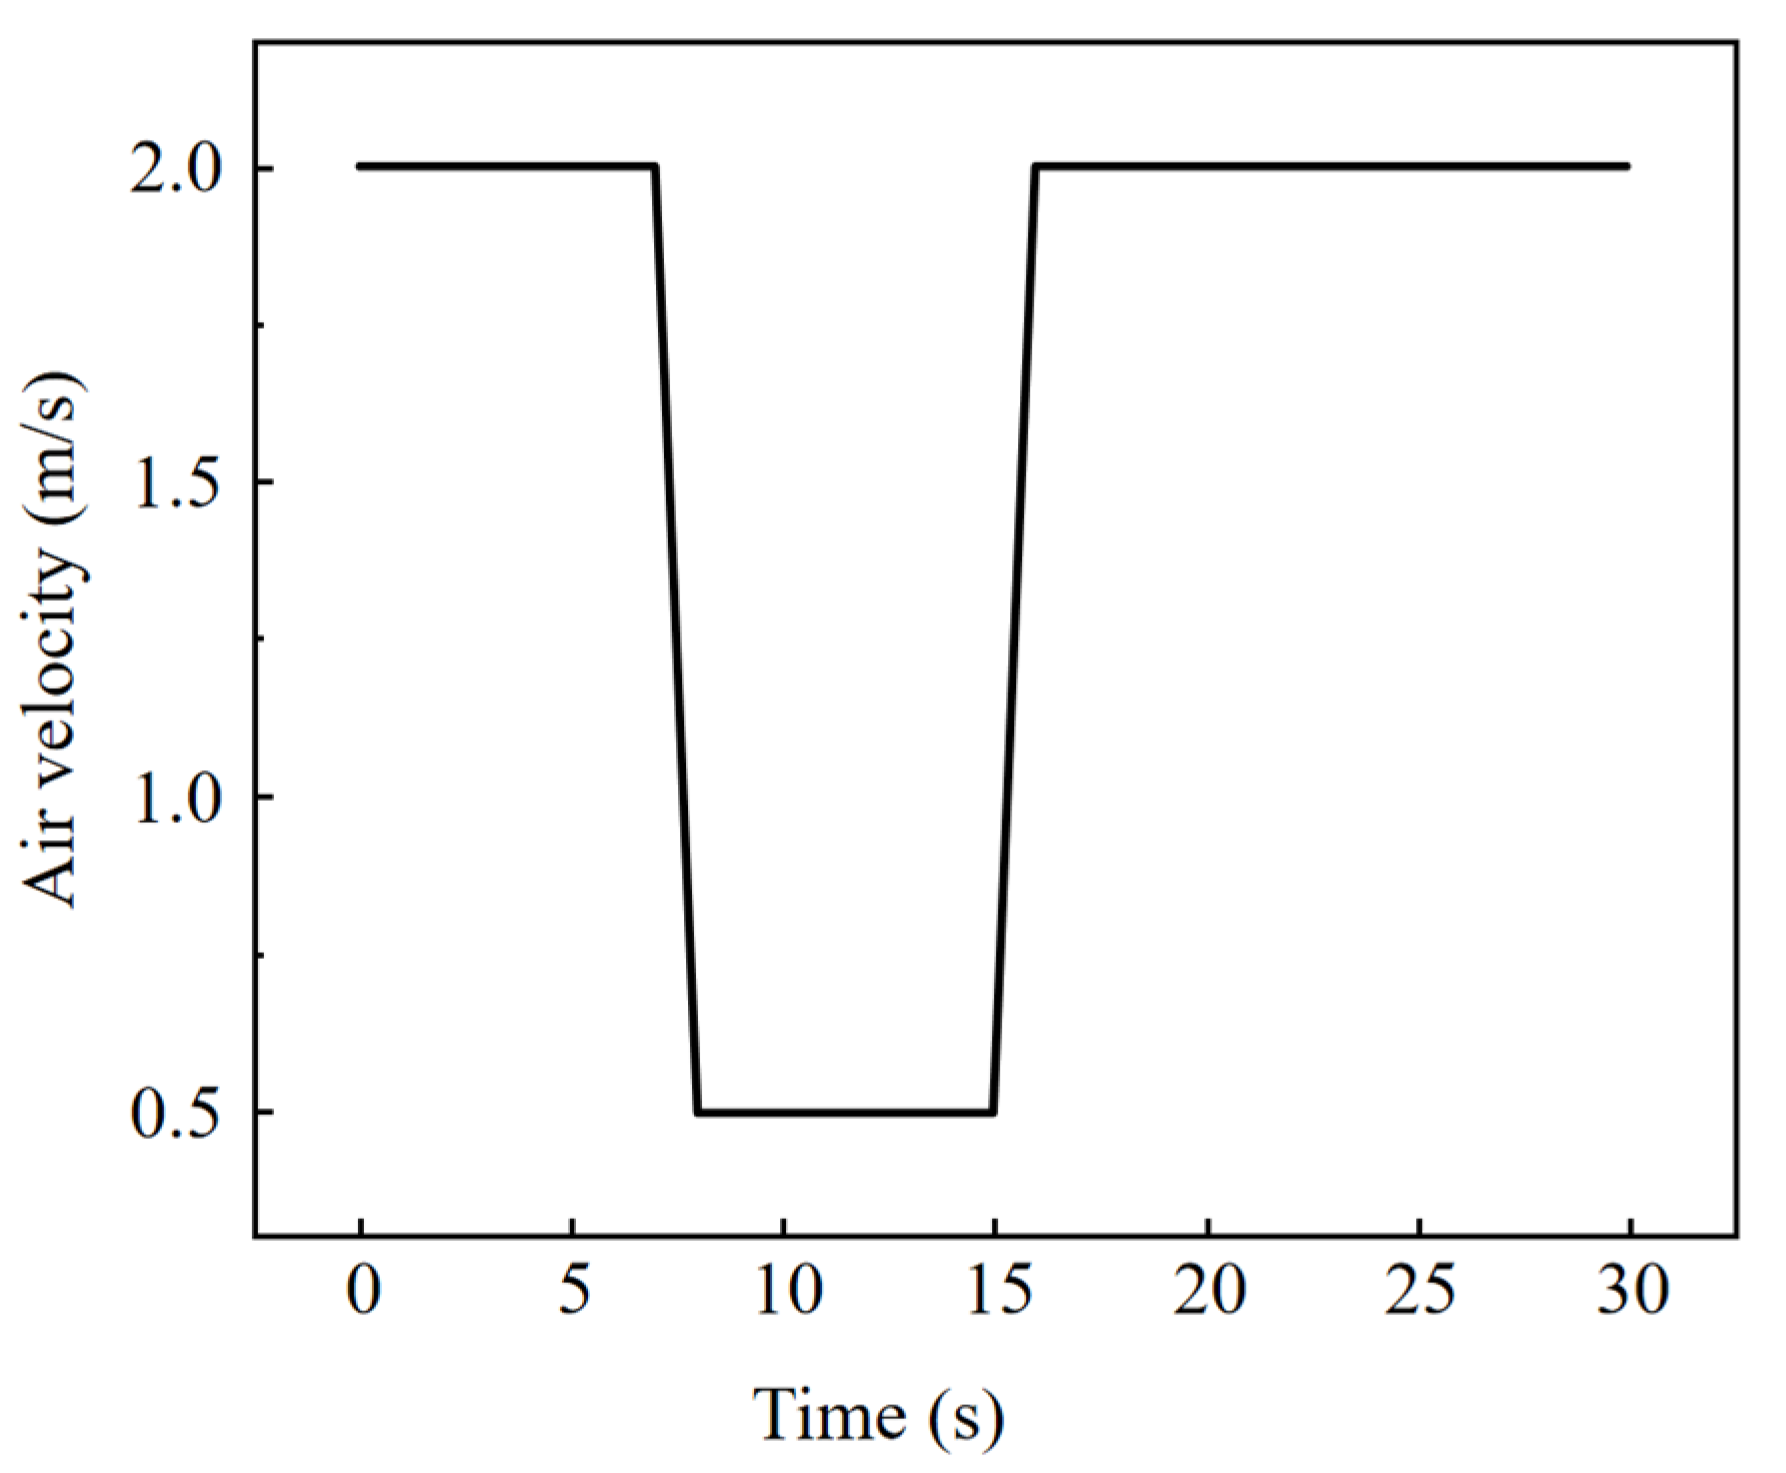
The optimized dynamic ventilation scheme is shown in Figure 21. The air velocity from 0 to 7 s is 2 m/s, which can accelerate the migration of sulfide ore dust to the return air shaft. The air velocity is 0.5 m/s for 8 to 15 s, which can reduce the disturbance of the airflow and ensure that the sulfide ore dust is steadily discharged. The air velocity between 16 and 30 s is 2 m/s. The concentration of sulfide ore dust is below the lower limit of explosion concentration at this time, so the high air velocity is conducive to the rapid discharge of residual dust.
Based on scheme 2, an optimized dust reduction scheme was simulated to verify the effect. The maximum dust concentration in the roadway is significantly reduced in the ore loading, transporting, and unloading process, as shown in Figure 22. The time that the maximum dust concentration is above the lower limit of explosion concentration is significantly shortened, which only lasted 0.5 s. The maximum dust concentration is 0.116 kg/m3, and the accumulation of sulfide ore dust in the roadway has been significantly prevented.
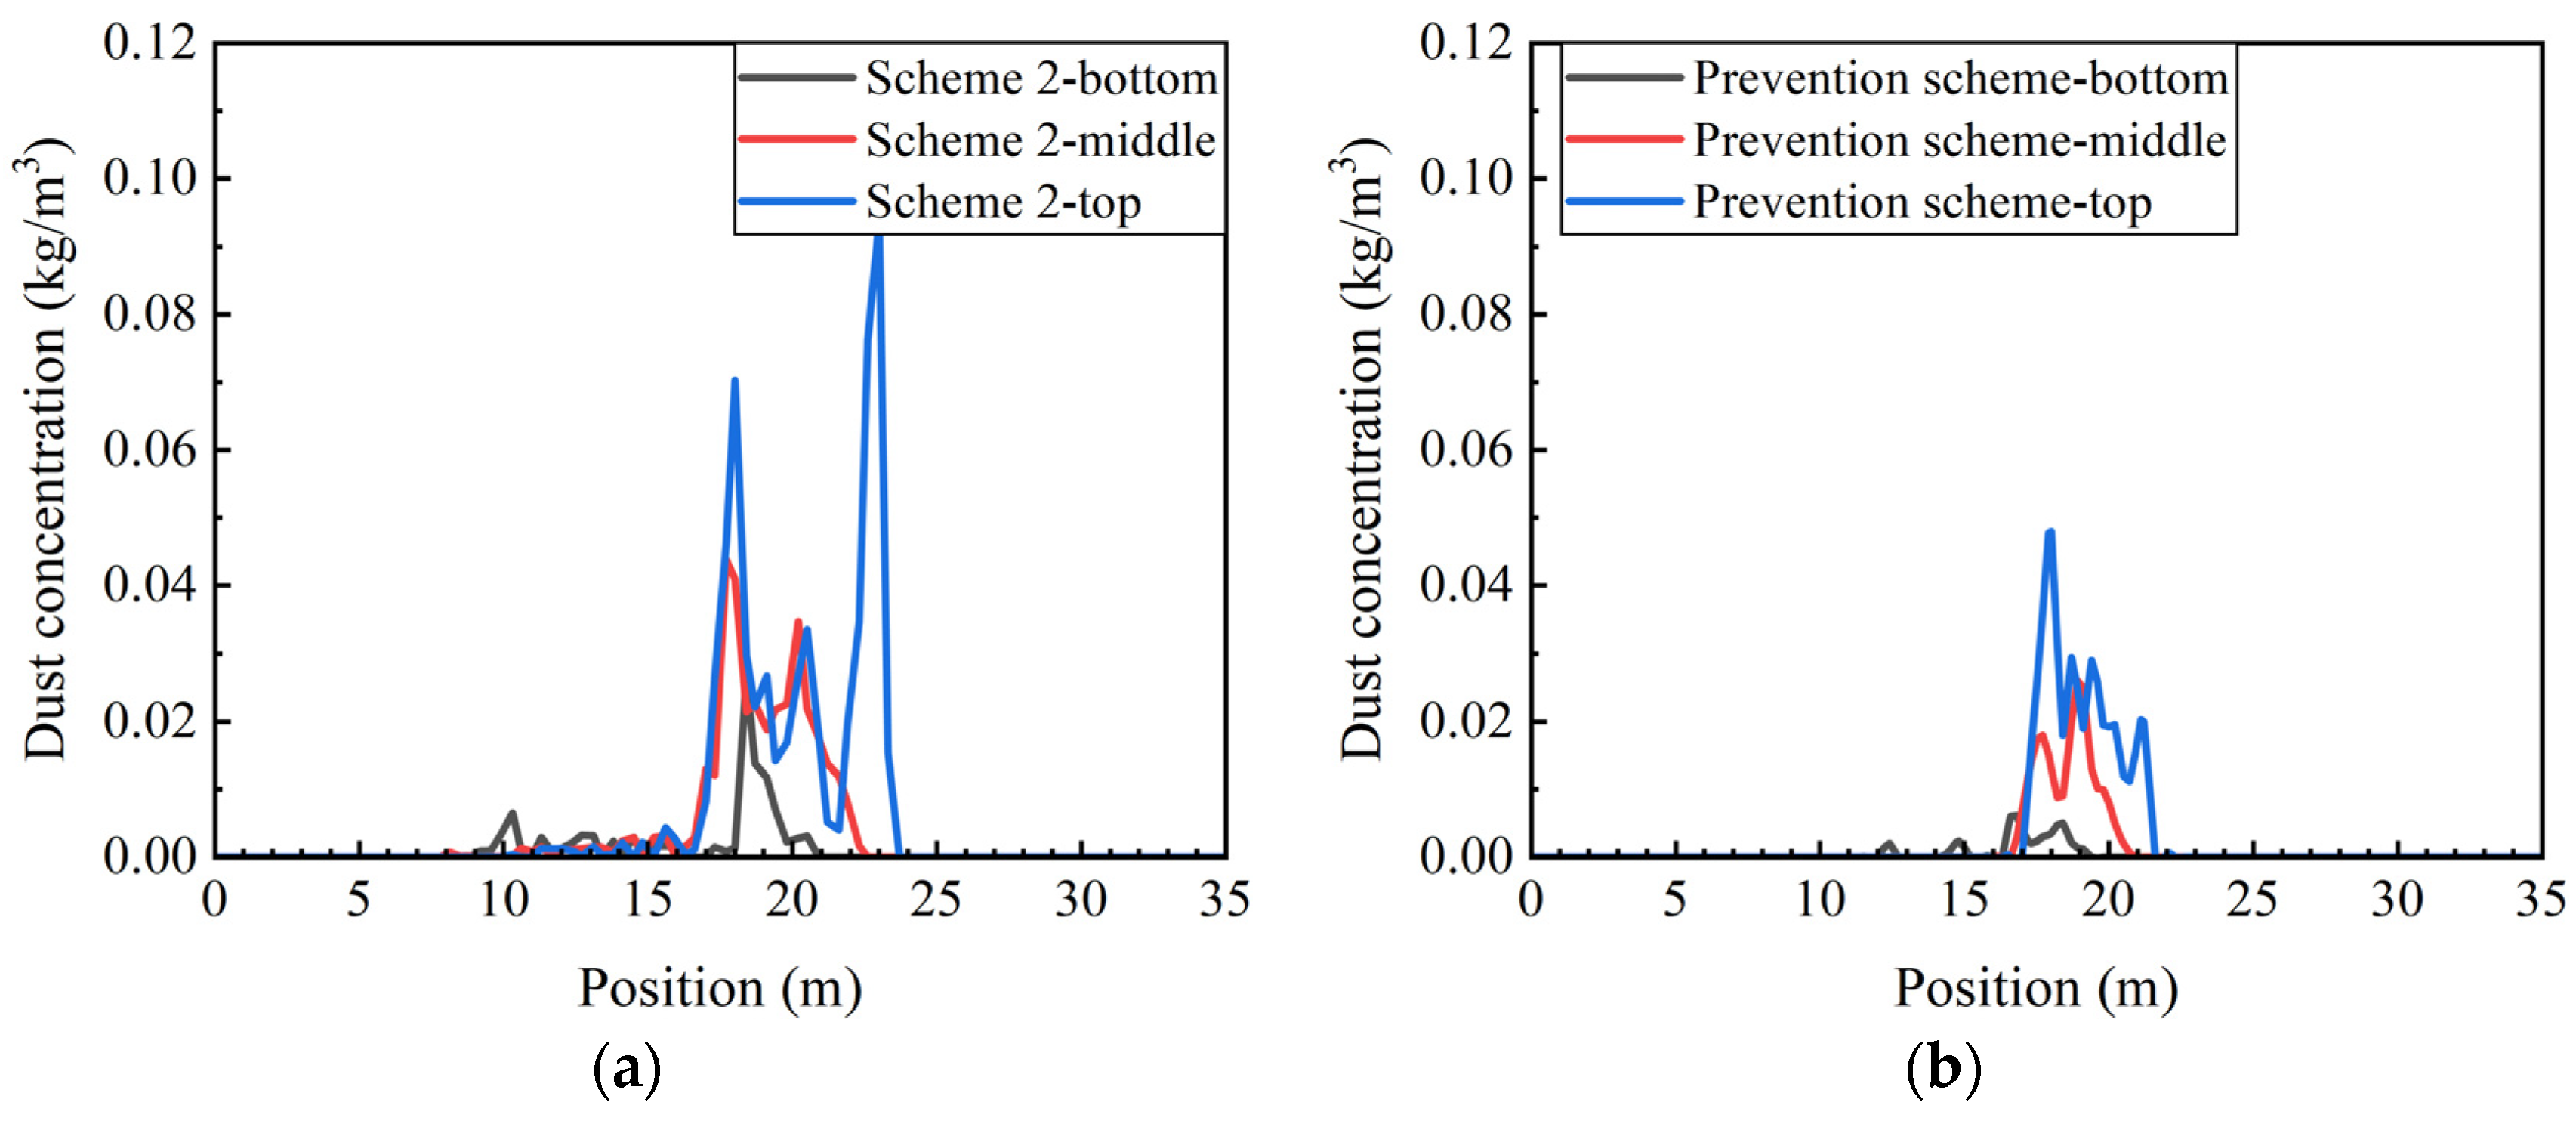
Figure 23 illustrates the concentration of sulfide ore dust at different heights of the main haulage roadway at 13 s. Notably, the concentration of sulfide ore dust has significantly decreased across all height positions. Specifically, the maximum concentration of sulfide ore dust has diminished from 0.10 kg/m3 to 0.048 kg/m3 and the spatial distribution of sulfide ore dust along the roadway has narrowed by 4 m. Consequently, the prevention scheme exhibits an impressive comprehensive dust-reduction effect.
Figure 24 presents the dust discharge rate and the total dust generation rate at different times for scheme 2 and the prevention scheme. In the prevention scheme, the dust generation rate is reduced in the first dust generation stage and the proportion of sulfide ore dust discharged through the return air shaft to the generation of dust increases. Therefore, the amount of dust accumulation in the roadway decreases. This result indicates that the prevention scheme using water curtain dust reduction and dynamic ventilation can still effectively reduce the generation and accumulation of sulfide ore dust in the roadway while reducing the effects of a disturbance in the air velocity on the sulfide ore dust.

5. Conclusions

This paper uses the Fluent software to simulate the migration and dispersion of sulfide ore dust during the ore loading, transporting, and unloading process. The concentration distribution of sulfide ore dust in different dust source positions, the dust generation rate, and the roadway air velocity are explored. Based on the results of the study, targeted dust control measures were proposed. The main conclusions are as follows:
(1)
The dust generation rate at the source determines the concentration of sulfide ore dust in the roadway. Spatially, the primary accumulation positions of high-concentration sulfide ore dust are the side walls near the ore loading point, the return air shaft, and the vicinity of the ore pass. Temporally, the highest sulfide ore dust concentration occurs during the ore unloading process in the ore pass. Additionally, with the increase in the dust generation rate, the duration of the concentration of sulfide ore dust above the explosion critical value is longer.
(2)
The air velocity in the roadway exerts a dual effect on the migration of sulfide ore dust. On the one hand, a high air velocity facilitates the accelerated discharge of sulfide ore dust. On the other hand, increased airflow disturbance intensifies the dispersion of sulfide ore dust. Conversely, when the air velocity is low, it leads to an increase in the deposition of sulfide ore dust. Therefore, the overall dust reduction’s effectiveness is optimized by maintaining an appropriate roadway air velocity.
(3)
There are notable variations in the migration, settlement, and distribution of sulfide ore dust at different ore loading points. When the ore loading points are situated far from the return air shaft, a large quantity of sulfide ore dust settles. The maximum concentration of sulfide ore dust decreases when the ore loading points are near the return air shaft. When operating near the ore pass, the maximum dust concentration increased because of the superposition of the dust generated at the ore loading point and the ore pass.
(4)
The comprehensive dust reduction measures of the water curtain and dynamic ventilation can reduce the concentration in time and space, resulting in a shorter duration of high-concentration dispersion. Ultimately, the risk of explosion is reduced from the perspective of sulfide ore dust dispersion.

Author Contributions

Conceptualization, Z.L.; methodology, Z.L. and P.H.; software, P.H. and Y.X.; validation, Z.L., P.H., and Y.X.; investigation, Y.X.; writing—original draft preparation, P.H. and Y.X.; writing—review and editing, Z.L. and P.H.; visualization, P.H.; supervision, Z.L.; funding acquisition, Z.L. and P.H. All authors have read and agreed to the published version of the manuscript.

Funding

This research was funded by the National Natural Science Foundation of China (grant number 52274247), and the Postgraduate Innovative Project of Central South University (grant number 2023ZZTS0519).

Data Availability Statement

The data presented in this study are available in the current article.

Conflicts of Interest

The authors declare no conflicts of interest. The funders had no role in the design of the study; in the collection, analyses, or interpretation of data; in the writing of the manuscript; or in the decision to publish the results.

References

  1. Altwal, J.M.; Véchot, L.N. Experimental study of the influence of particle size on Minimum Explosible Concentration of sulfur dust. J. Loss Prev. Process Ind. 2021, 71, 104507. [Google Scholar] [CrossRef]
  2. Jin, H.M.; Pan, W.; Shen, X.; Cheng, S.Y. Nonlinear Determination Method for Self-Heating Initiative Temperature of Sulfide Ores. Complexity 2020, 2020, 1709158. [Google Scholar] [CrossRef]
  3. Pan, W.; Wu, C.; Li, Z.J.; Wu, Z.W.; Yang, Y.P. Evaluation of spontaneous combustion tendency of sulfide ore heap based on nonlinear parameters. J. Cent. South Univ. 2017, 24, 2431–2437. [Google Scholar] [CrossRef]
  4. Pinaev, A.V.; Pinaev, P.A. On the explosiveness of suspensions of sulfide ore dust in air in shock waves. J. Phys. Conf. Ser. 2019, 1382, 012095. [Google Scholar] [CrossRef]
  5. Rao, Y.Z.; Tian, C.S.; Xu, W.; Xiao, C.Y.; Yuan, B.Y.; Yu, Y. Explosion pressure and minimum explosible concentration properties of metal sulfide ore dust Clouds. J. Chem. 2020, 2020, 7980403. [Google Scholar] [CrossRef]
  6. Zhao, B.; Li, S.; Lin, H.F.; Liu, X.X. Influence of air inlet distance on coal dust pollution characteristics in working environment during tunneling based on CFD method. Part. Sci. Technol. 2023, 42, 12–30. [Google Scholar] [CrossRef]
  7. Roberts, J.; Andrews, L.; Wypych, P. Analysis of dust dispersion in the loading of a bulk carrier ship using CFD and DEM. Part. Sci. Technol. 2022, 40, 346–354. [Google Scholar] [CrossRef]
  8. Taheri, M.; Zolfaghari, S.A.; Hassanzadeh, H.; Salmanzadeh, M. Numerical investigation of the effects of fan-coil airflow direction on distribution and deposition of indoor pollutant particles. J. Build. Eng. 2021, 33, 101547. [Google Scholar] [CrossRef]
  9. Nguyen-Dinh, N.; Hejjaji, A.; Zitoune, R.; Bouvet, C.; Salem, M. New tool for reduction of harmful particulate dispersion and to improve machining quality when trimming carbon/epoxy composites. Compos. Part A Appl. Sci. Manuf. 2020, 131, 105806. [Google Scholar] [CrossRef]
  10. Ercan, O.; Dincer, F.; Sari, D.; Ceylan, O.; Dincer, F.K. Determination of PM10 and deposited dust dispersion on the settlement areas from Aksa Goynuk coal (lignite) fueled thermal power plant. Atmos. Pollut. Res. 2020, 11, 2126–2132. [Google Scholar] [CrossRef]
  11. Portarapillo, M.; Trofa, M.; Sanchirico, R.; Benedetto, A.D. CFD simulations of dust dispersion in the 1 m3 explosion vessel. J. Loss Prev. Process Ind. 2020, 68, 104274. [Google Scholar] [CrossRef]
  12. Madureira, E.; Aboelezz, A.; Su, W.C.; Roghanchi, P. From Dust to Disease: A Review of Respirable Coal Mine Dust Lung Deposition and Advances in CFD Modeling. Minerals 2023, 13, 1311. [Google Scholar] [CrossRef]
  13. Bruce, J.; Smith, J.; Fowler, M. Relative efficiency of passive dust samplers: Progress towards coarse dust dispersion modelling. Atmos. Environ. 2021, 244, 117872. [Google Scholar] [CrossRef]
  14. Chang, P.; Xu, G.; Huang, J.X. Numerical study on DPM dispersion and distribution in an underground development face based on dynamic mesh. Int. J. Min. Sci. Technol. 2020, 30, 471–475. [Google Scholar] [CrossRef]
  15. Luo, K.; Yu, H.J.; Dai, Z.X.; Fang, M.M.; Fan, J.R. CFD simulations of flow and dust dispersion in a realistic urban area. Eng. Appl. Comput. Fluid Mech. 2016, 10, 228–242. [Google Scholar] [CrossRef]
  16. Azam, S.; Mishra, D.P. Effects of particle size, dust concentration and dust-dispersion-air pressure on rock dust inertant requirement for coal dust explosion suppression in underground coal mines. Process Saf. Environ. Prot. 2019, 126, 35–43. [Google Scholar] [CrossRef]
  17. Wang, D.; Jing, Q.; Qian, X.M.; Yuan, M.Q.; Liu, S.Q. Research on explosive dust space ventilation scheme based on CFD simulation. J. Phys. Conf. Ser. 2020, 1507, 082050. [Google Scholar] [CrossRef]
  18. Zhao, Y.M.; Ambrose, R.P.K. Modeling dust dispersion and suspension pattern under turbulence. J. Loss Prev. Process Ind. 2019, 62, 103934. [Google Scholar] [CrossRef]
  19. Zhang, Q.; Qian, X.M.; Yuan, M.Q.; Zhao, L.; Zhao, Y.; Fan, T.; Chen, Y.Y.; Fu, L.Y. CFD investigation on diffusing dynamics of respirable dust coupled with multiple sources on a longwall face: A case study from meso-scale. Powder Technol. 2019, 345, 43–53. [Google Scholar] [CrossRef]
  20. Li, Z.J.; Zhao, S.Q.; Li, R.R.; Huang, Y.L.; Xu, Y.; Song, P.F. Increasing Oxygen Mass Fraction in Blind Headings of a Plateau Metal Mine by Oxygen Supply Duct Design: A CFD Modelling Approach. Math. Probl. Eng. 2020, 2020, 8541909. [Google Scholar] [CrossRef]
  21. Vakilzadeh, A.; Sarvestani, A.B.; Osloob, R.; Kamali, R. Sensitivity analysis of kinetic theory of granular flow (KTGF) and mixture models in terms of involved elemental parameters for two-phase gas-solid flow. Part. Sci. Technol. 2023, 41, 1156–1169. [Google Scholar] [CrossRef]
  22. Joubert, A.; Laborde, J.C.; Bouilloux, L.; Chazelet, S.; Thomas, D. Modelling the pressure drop across HEPA filters during cake filtration in the presence of humidity. Chem. Eng. J. 2011, 166, 616–623. [Google Scholar] [CrossRef]
  23. Pereira, T.W.C.; Marques, F.B.; Pereira, F.D.R.; Ribeiro, D.D.; Rocha, S.M.S. The influence of the fabric filter layout of in a flow mass filtrate. J. Clean. Prod. 2016, 111, 117–124. [Google Scholar] [CrossRef]
  24. Zhang, Y.M.; Cai, P.; Jiang, F.H.; Dong, K.J.; Jiang, Y.C.; Wang, B. Understanding the separation of particles in a hydrocyclone by force analysis. Powder Technol. 2017, 322, 471–489. [Google Scholar] [CrossRef]
  25. Peng, H.T.; Nie, W.; Zhang, S.B.; Cheng, W.M.; Liu, Q.; Guo, C.; Ma, Q.X.; Zhou, Z.L.; Xu, C.W.; Hua, Y.; et al. Research on negative pressure jet dust-removal water curtain technology for coal mine cleaner production. Fuel 2022, 310, 122378. [Google Scholar] [CrossRef]
  26. Zhang, Q.; Fan, L.; Wang, H.T.; Han, H.; Zhu, Z.Q.; Zhao, X.; Wang, Y.X. A review of physical and chemical methods to improve the performance of water for dust reduction. Process Saf. Environ. Prot. 2022, 166, 86–98. [Google Scholar] [CrossRef]
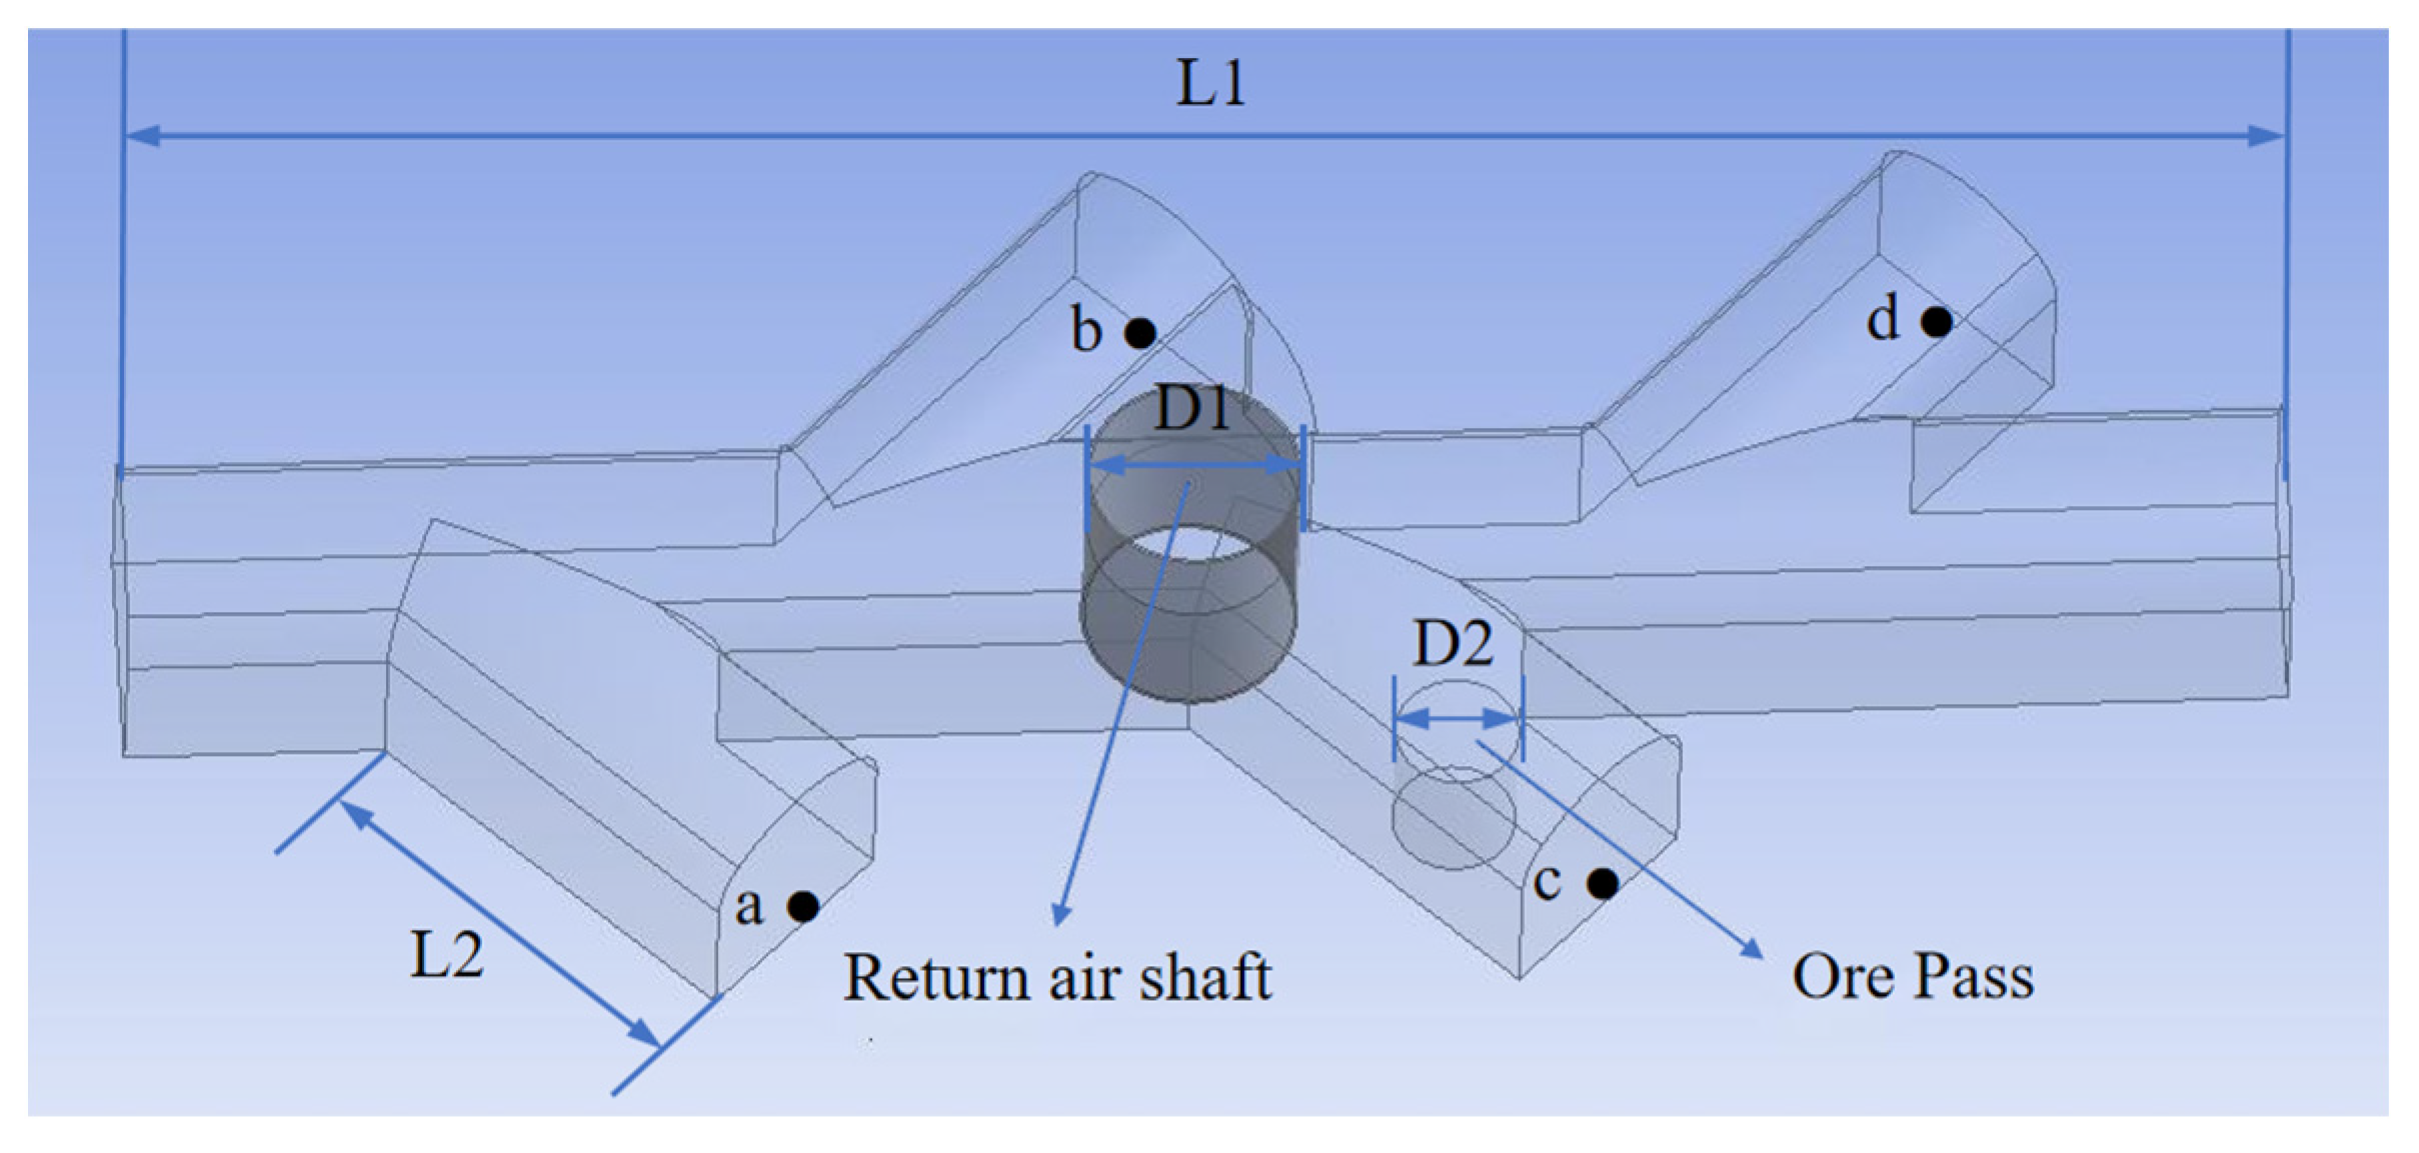
Figure 1. Illustration of the roadway model.
Minerals 14 00523 g001
Figure 2. Cross-section of roadway.
Minerals 14 00523 g002
Figure 3. The routes involved in the ore-transporting process: (a) route a; (b) route b; (c) route c; (d) route d.
Minerals 14 00523 g003
Figure 4. The velocity streamlines of different routes: (a) route a; (b) route b; (c) route c; (d) route d.
Minerals 14 00523 g004
Figure 5. Roadway air velocity for different meshing schemes.
Minerals 14 00523 g005
Figure 6. Rate of variation in roadway air velocity for different meshing schemes.
Minerals 14 00523 g006
Figure 7. Schematic diagram of tetrahedral mesh delineation for the roadway model.
Minerals 14 00523 g007
Figure 8. Comparison of air velocity.
Minerals 14 00523 g008
Figure 9. Maximum dust concentration in the roadway at different times for schemes 1 to 3.
Minerals 14 00523 g009
Figure 10. The concentration of sulfide ore dust at different heights of the main haulage roadway at 13 s for schemes 1 to 3: (a) scheme 1; (b) scheme 2; (c) scheme 3.
Minerals 14 00523 g010aMinerals 14 00523 g010b
Figure 11. Total dust generation rate and dust discharge rate at different times for schemes 1 to 3: (a) scheme 1; (b) scheme 2; (c) scheme 3.
Minerals 14 00523 g011aMinerals 14 00523 g011b
Figure 12. Maximum dust concentration in roadway at different times for schemes 2, 4, and 5.
Minerals 14 00523 g012
Figure 13. The concentration of sulfide ore dust at different heights of the main haulage roadway at 13 s for schemes 2, 4, and 5: (a) scheme 2; (b) scheme 4; (c) scheme 5.
Minerals 14 00523 g013
Figure 14. Total dust generation rate and dust discharge rate at different times for schemes 2, 4, and 5: (a) scheme 2; (b) scheme 4; (c) scheme 5.
Minerals 14 00523 g014
Figure 15. Maximum dust concentration at different times for schemes 2, 6, 7, and 8.
Minerals 14 00523 g015
Figure 16. The concentration of sulfide ore dust at different heights of the main haulage roadway for schemes 2, 6, 7, and 8: (a) scheme 2; (b) scheme 6; (c) scheme 7; (d) scheme 8.
Minerals 14 00523 g016
Figure 17. Total dust generation rate and dust discharge rate at different times for schemes 2, 6, 7, and 8: (a) scheme 2; (b) scheme 6; (c) scheme 7; (d) scheme 8.
Minerals 14 00523 g017
Figure 18. Distribution of sulfide ore dust in the model layout at 3 s: (a) scheme 2; (b) scheme 6; (c) scheme 7; (d) scheme 8.
Minerals 14 00523 g018
Figure 19. Distribution of sulfide ore dust in the model layout at 13 s: (a) scheme 2; (b) scheme 6; (c) scheme 7; (d) scheme 8.
Minerals 14 00523 g019
Figure 20. Distribution of sulfide ore dust in the model layout at 30 s: (a) scheme 2; (b) scheme 6; (c) scheme 7; (d) scheme 8.
Minerals 14 00523 g020
Figure 21. Air velocity of dynamic ventilation scheme.
Minerals 14 00523 g021
Figure 22. Maximum dust concentration in the roadway at different times.
Minerals 14 00523 g022
Figure 23. The concentration of sulfide ore dust at different heights in the main haulage roadway at 13 s: (a) scheme 2; (b) prevention scheme.
Minerals 14 00523 g023
Figure 24. Dust generation rate at different times for scheme 2 and prevention scheme: (a) scheme 2; (b) Prevention scheme.
Minerals 14 00523 g024
Table 1. Main overall dimensions of the roadway.
LetterLetter MeaningDimension
L1Length of main haulage roadway35 m
L2Length of secondary haulage roadway5 m
D1Diameter of return air shaft3.4 m
D2Diameter of ore pass0.7 m
WNet width of roadway cross-section3.8 m
H1Height of roadway cross-section3.8 m
H2Net height of roadway cross-section2.53 m
R1Radius of three-centered arch2.63 m
R2Radius of three-centered arch0.88 m
Table 2. Meshing schemes.
SchemeGrid Size (m)Number of GridsNumber of Nodes
10.121,689,7853,437,177
20.131,409,799260,782
30.151,010,232187,919
Table 3. Mesh quality index.
ParametersMinimumMaximumAverage
Grid quality0.2221610.8447
Aspect ratio1.15969.22241.8227
Skewness7.0832 × 10−60.799790.21601
Orthogonality0.258910.996810.86471
Maximum corner70.653°157.18°95.542°
Table 4. The parameters of boundary conditions.
Boundary ConditionParameter
Inlet boundary typeVelocity Inlet
Velocity magnitude6 m/s
Outlet boundary typePressure Outlet
Turbulence intensity2.72%
Wall roughness height0.05 m
Wall roughness constant0.6
Upper and side wallReflect
Bottom wallTrap
The ends of the roadway, the ore pass, and the bottom of the return air shaftEscape
Hydraulic diameter3.84
Reynolds number1,462,174
Turbulence intensity2.71%
Wall shear conditionNo-Slip
Table 5. The parameters of the discrete phase model.
Discrete Phase ModelParameter
Interaction with Continuous PhaseOn
Update DPM source each flow iterationOn
Unsteady particle trackingOn
Maximum steps2000
Length scale0.01 m
Discrete random walk modelOn
Injection typeSurface
MaterialCopper Ore
Density4200 kg/m3
Diameter distributionRoisin–Rammler
Min. Diameter1 × 10−6 m
Max. Diameter1 × 10−4 m
Spread parameter1.87
Table 6. The parameters of the continuous phase model.
Continuous Phase ModelParameter
SolverPressure Based
TimeSteady
Viscous ModelRealizable k-ε
Near-wall TreatmentStandard Wall Functions
EnergyOff
Temperature25 °C
MaterialAir
Density1.1691 kg/m3
Viscosity1.84 × 10−5 kg/m·s
Solution methodsParameter
Pressure–Velocity CouplingSimple
Momentum DiscretizationFirst order upwind
Convergence criterion10−4
Time step size0.1 s
Number of Time steps300
Maximum iteration steps40
Calculation steps12,000
Table 7. Simulation scheme.
Simulation SchemeDust Source Position (Ore Loading Point)Dust Generation Rate
in the First Dust
Generation Stage (kg/s)
Dust Generation Rate
in the Second Dust Generation Stage (kg/s)
Air Velocity in the Road with Dust Source
Position (m/s)
1a111
2a221
3a331
4a220.5
5a222
6b221
7c221
8d221
Disclaimer/Publisher’s Note: The statements, opinions and data contained in all publications are solely those of the individual author(s) and contributor(s) and not of MDPI and/or the editor(s). MDPI and/or the editor(s) disclaim responsibility for any injury to people or property resulting from any ideas, methods, instructions or products referred to in the content.