Article

Influence of Mineralogy and Mineralogy Approach to Optimize Processing: A Case Study of Tin–Copper Polymetallic Ore

1
School of Land Resource Engineering, Kunming University of Science and Technology, Kunming 650093, China
2
The BGRIMM Technology Group, Beijing 102628, China
*
Author to whom correspondence should be addressed.
Minerals 2024, 14(6), 554; https://doi.org/10.3390/min14060554
Submission received: 7 May 2024 / Revised: 19 May 2024 / Accepted: 22 May 2024 / Published: 27 May 2024
(This article belongs to the Section Mineral Processing and Extractive Metallurgy)

Abstract

:
Tin-Copper polymetallic ore is a type of typical ore that cassiterite is closely associated with sulfide minerals. In mineral processing of tin–copper polymetallic ore, flotation is generally used to recover valuable sulfide minerals, while gravity separation is used to recover cassiterite. A mine in Yunnan, China, uses the traditional “flotation–gravity separation” process to recover copper and tin but faces several problems during processing, such as an insufficient copper grade in Cu concentrate, a much higher grade of As in S concentrate, and a grade of S in Sn concentrate that exceeds the standard. A process mineralogy study was conducted, with a focus on Cu–S mixed concentrate, S concentrate, and Sn rough concentrate. It was determined that the main cause of these problems is not the liberation or size distribution of valuable minerals but the superstructure of pyrrhotite, which represents one of the most abundant minerals in the products. Based on EMPA, SEM-EDS, and XRD data, both monoclinic pyrrhotite and hexagonal pyrrhotite occurred in all samples. The abundance of different superstructures of pyrrhotite in one sample was determined by means of particle extraction and area calculation from microscopic images, and the distribution characteristics of monoclinic pyrrhotite and hexagonal pyrrhotite in the whole process were clarified. This process mineralogy study indicates that the strong magnetic hexagonal pyrrhotite mainly affects the copper recovery during flotation, and the hexagonal pyrrhotite mainly affects the recovery of cassiterite during gravity separation. Strong magnetic monoclinic pyrrhotite and weak magnetic hexagonal pyrrhotite should be fully considered in the optimization of mineral processing, and the magnetic separation of pyrrhotite should be adopted to optimize the overall environment of copper flotation and tin gravity separation.

1. Introduction

Process mineralogy, which can be used during the whole cycle of mineral processing, provides a basis for the research and optimization of technology used in mineral processing. Objects of process mineralogy research include ore and products for grinding and feed, concentrate, and tail from the flotation process [1]. Normally, research topics include element occurrence, mineral composition, particle size distribution, the liberation of valuable minerals and their association, etc. These studies are often performed on polished sections using instruments like QEMSCAN, MLA, microscopes, and SEM-EDS [2]. In fact, detailed research on process mineralogy, which is highly integrated with mineral processing, can effectively improve the research efficiency of metallurgy and help to quickly identify the cause of poor indices and the direction of process optimization [3,4,5]. Especially for the research and technology development of the comprehensive utilization of complex polymetallic ores, systematic process mineralogy studies, which should include some investigation of mineral properties and provide detailed mineral data, are particularly important and necessary to determine a reasonable process index and determine the breakthrough direction of process optimization [5,6].
Sulfide–cassiterite deposits are among the most common tin polymetallic deposits. An important feature of these types of ore is that, in addition to cassiterite, they generally contain sulfide minerals, including different types and large contents [7]. Hence, valuable minerals include not only cassiterite but also other sulfide minerals, such as chalcopyrite, galena, sphalerite, silver minerals, and others. However, the requirements for processing cassiterite using gravity separation and sulfide minerals using flotation are often opposite. Cassiterite is brittle and fragile, making it necessary to minimize grinding [8]. On the other hand, because of the close correlation among sulfide minerals, a high grinding fineness is often required for sulfide mineral flotation. Therefore, the recycling of valuable sulfide minerals and cassiterite in tin polymetallic ores is restricted by these opposing requirements, and the resource utilization rate of the conventional “flotation–gravity separation” process is often low; in particular, the concentrate grade of sulfide flotation is often limited. Therefore, research in this field often has strict requirements for the selection of the mineral processing flow structure and necessitates the in-depth study of mineral properties [9].
This study takes a typical tin–copper polymetallic deposit in Yunnan, China, as the research object. The mine uses the traditional “flotation–gravity separation” process to recover copper and tin. Long-standing problems during production include an insufficient copper grade in the Cu concentrate, a much higher grade of As in the S concentrate than the requirements for qualified sulfur concentrate, and a grade of S in the tin concentrate that exceeds the standard. Breakthroughs in new mineralogy research are urgently needed to provide clear answers about the causes of these problems and to provide directions for the development of new mineral-processing technologies.
Based on the above needs and issues, key products from the whole process were selected as the research objects. In addition to conventional process mineralogy research, such as chemical element analysis, mineral composition and model mineral analysis, particle size distribution, and the liberation characteristics of valuable minerals, this research focuses on the classification and quantification of pyrrhotite. We used mineral in situ analysis technology to investigate pyrrhotite, a typical non-stoichiometric mineral whose mineral properties can change under different conditions and which makes up the highest mineral content in most products. This study describes trends in the two superstructures of pyrrhotite during processing and their impacts on the separation process. Based on our results, a process improvement technique, using the characteristics of pyrrhotite with different magnetic strengths, is proposed to improve the copper flotation and tin gravity separation environment.

2. Samples and Methods

2.1. Process Flowsheet, Problems, and Sample Selection

The ore produced in the plant is a tin–copper polymetallic ore, using a combined flotation–gravity process (Figure 1). Sulfide is separated using mixed flotation, and Cu concentrate and S concentrate are formed through separate flotation. The tailings of the mixed flotation enter a gravity separation cycle, and they are then re-selected in two stages to form Sn concentrate.
In this process, three problems limit the qualified concentrate:
Insufficient copper grade in the copper concentrate: In the process of separating copper and sulfur to obtain Cu concentrate, there are too many products in the circuit, and it is difficult to separate the Cu and S. Normally, the Cu grade of Cu concentrate is only about 12%.
The As grade in S concentrate is too high: The As content of sulfur concentrate is much higher than the requirement for qualified sulfur concentrate, and it is difficult to separate arsenic sulfur using flotation.
The S grade in Sn concentrate is also high: pyrrhotite and pyrite are retained in the mixed flotation tailings and enter the gravity separation process, which has a great influence on tin gravity separation, resulting in a high sulfur content in tin concentrate.
Therefore, three samples (Cu-S mixed concentrate, S concentrate, and Sn rough concentrate) were selected for a detailed process mineralogy study, based on the following reasons:
  • Cu-S mixed concentrate was selected to understand the problem of an insufficient copper concentrate grade. During the copper–sulfur separation process, a process mineralogy study based on Cu-S mixed concentrate can provide mineralogical data, like the Cu mineral size and liberation degree, to help determine the reasons for a low Cu grade and a method to change it.
  • S concentrate was selected to solve the problem of As in S concentrate. Through process mineralogical research of S concentrate, types of As minerals and the relationship between sulfur minerals and arsenic minerals in products can be clarified. These data can answer whether there is a possibility of reducing arsenic content in sulfur concentrate.
  • Sn rough concentrate processed after the first gravity separation process was selected to understand why a large quantity of pyrrhotite and pyrite enters gravity separation, resulting in a high S grade in Sn concentrate. Through mineralogy research, the size distribution of pyrrhotite and pyrite and their relationship with cassiterite can be obtained.

2.2. Method

2.2.1. Chemical Analysis

The main element contents in the concentrates were quantified with ICP-OES after performing the acid digestion method.

2.2.2. SEM-Based Automated Mineralogy and SEM Analysis

The modal mineralogy of the concentrations was determined with MLA, a kind of automated mineral analysis system, coupled with an FEI QUANTA 650 SEM and an energy dispersive spectrometer (Bruker Nano analytics, Berlin, Germany). The SEM-EDS was also used for manual mineral observation and analysis.

2.2.3. EMPA Analysis of Mineral

The in situ chemical composition of pyrrhotite was characterized using a -1720H electron microprobe (EPMA-1720H) via wavelength-dispersive spectrometry (Shimadzu, Kyoto, Japan). The acceleration voltage, beam current, and beam size used for the analysis were 15 kV, 10 20 nA, and 10 μm, respectively.

2.2.4. XRD

Mineral phase identification was achieved with X-ray diffractometry using a Rigaku SmartLab 5 mm slit and a Bruker D8 advance powder XRD with a Cu anode. The X-ray diffractometer was operated at a voltage of 40 KV. The XRD data were collected over a 2θ range of 5–90° with a step size of 0.02 and counting time of 10°/min. Software (HighScore plus 3.0) was used to quantify the complete minerals based on the PDF-4 DATABASED.

2.2.5. Microscope Analysis

Microscopy of polished sections is the most common method used for process mineralogy research. The concentrates were consolidated with epoxy resin to produce polished sections, and a Zeiss optical microscope was used to carry out mineral analysis, obtaining data on their size distribution, mineral associations, and liberation characteristics.

3. Results

3.1. Cu-S Mixed Concentrate

3.1.1. Chemical Composition
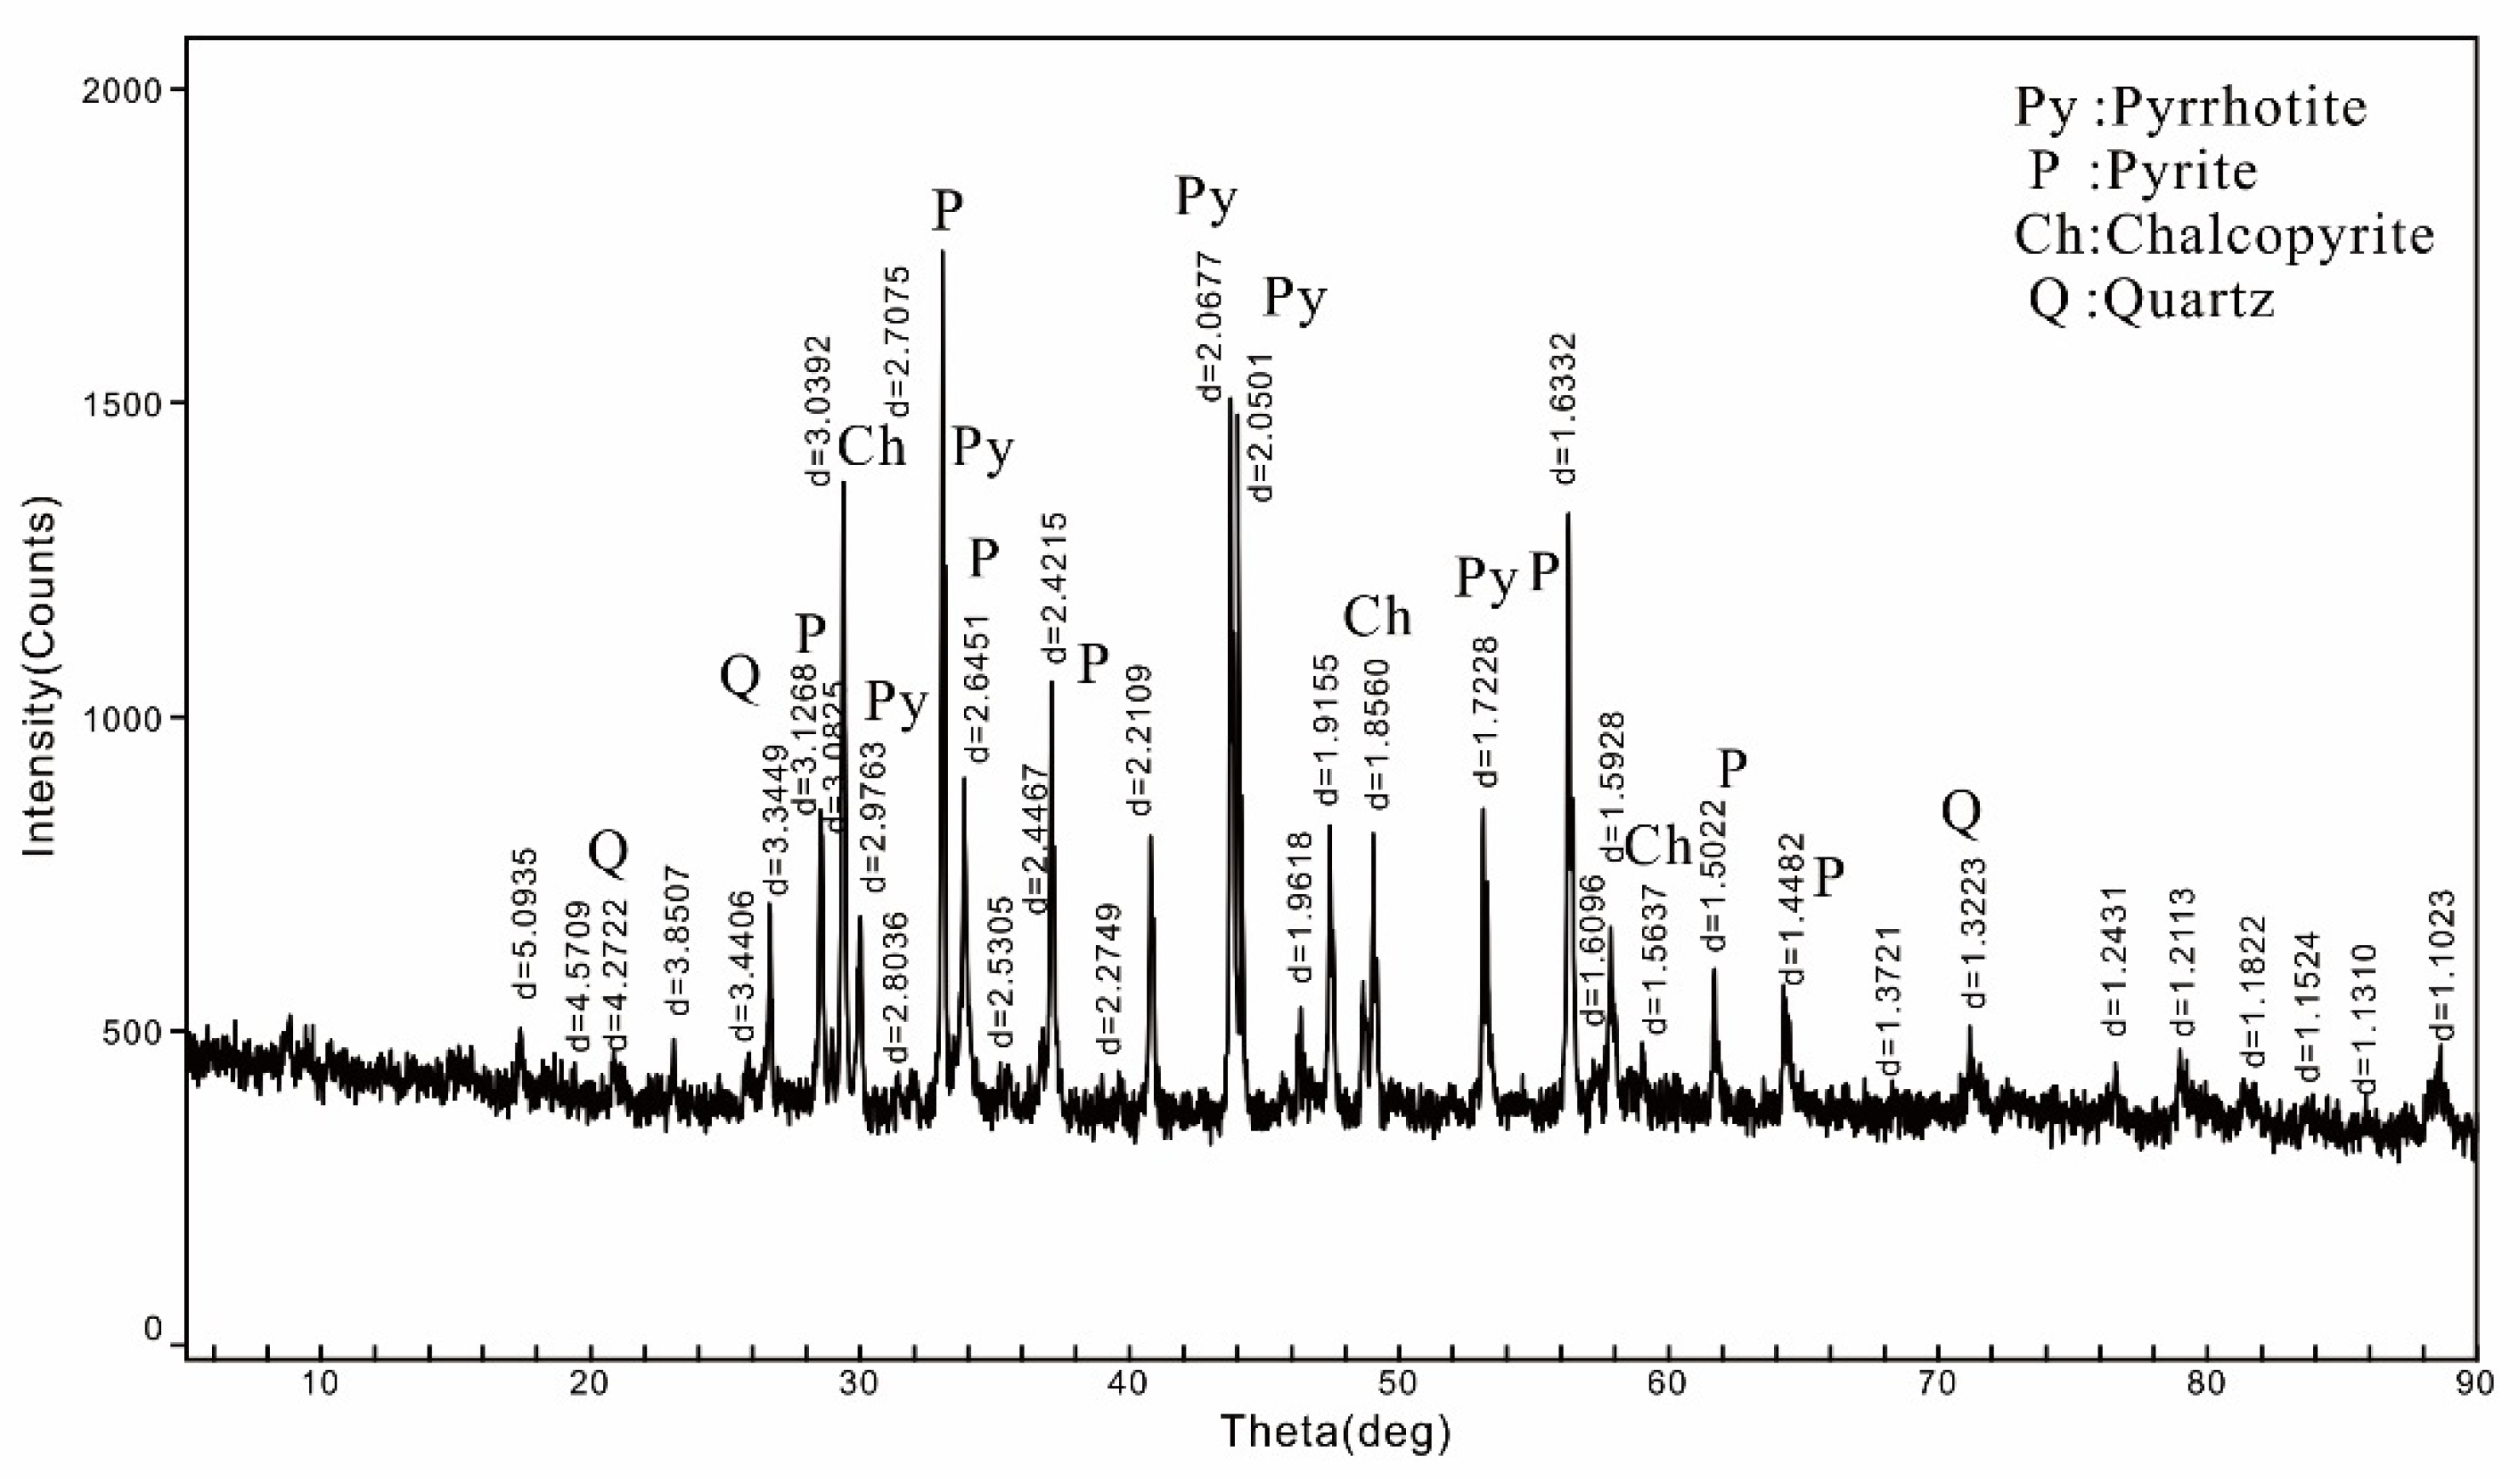
The chemical composition of the Cu-S mixed concentrate is shown in Table 1. In Table 1, it is clear that the grade of Cu in the Cu-S mixed concentrate was 3.62%.

3.1.2. XRD Result

The XRD technique was employed to identify the main minerals in the samples. By matching mineral powder diffraction files (PDF-4) listed in the International Center for Diffraction Data (ICDD) database, the main minerals in the Cu-S concentrate were determined to include pyrrhotite, pyrite, and chalcopyrite, as shown in Figure 2.

3.1.3. Mineral Composition

The mineral composition of Cu-S mixed concentrate was measured using MLA, and the results of the model minerals are shown in Table 2. The sulfide mineral was dominated by pyrrhotite, followed by pyrite and arsenopyrite. Most of the copper minerals were chalcopyrite, with trace amounts of tetrahedrite and covellite, etc. The sample also contained a small amount of gangue minerals, such albite, quartz, k-feldspar, diopside, calcite, hessonite, and others.

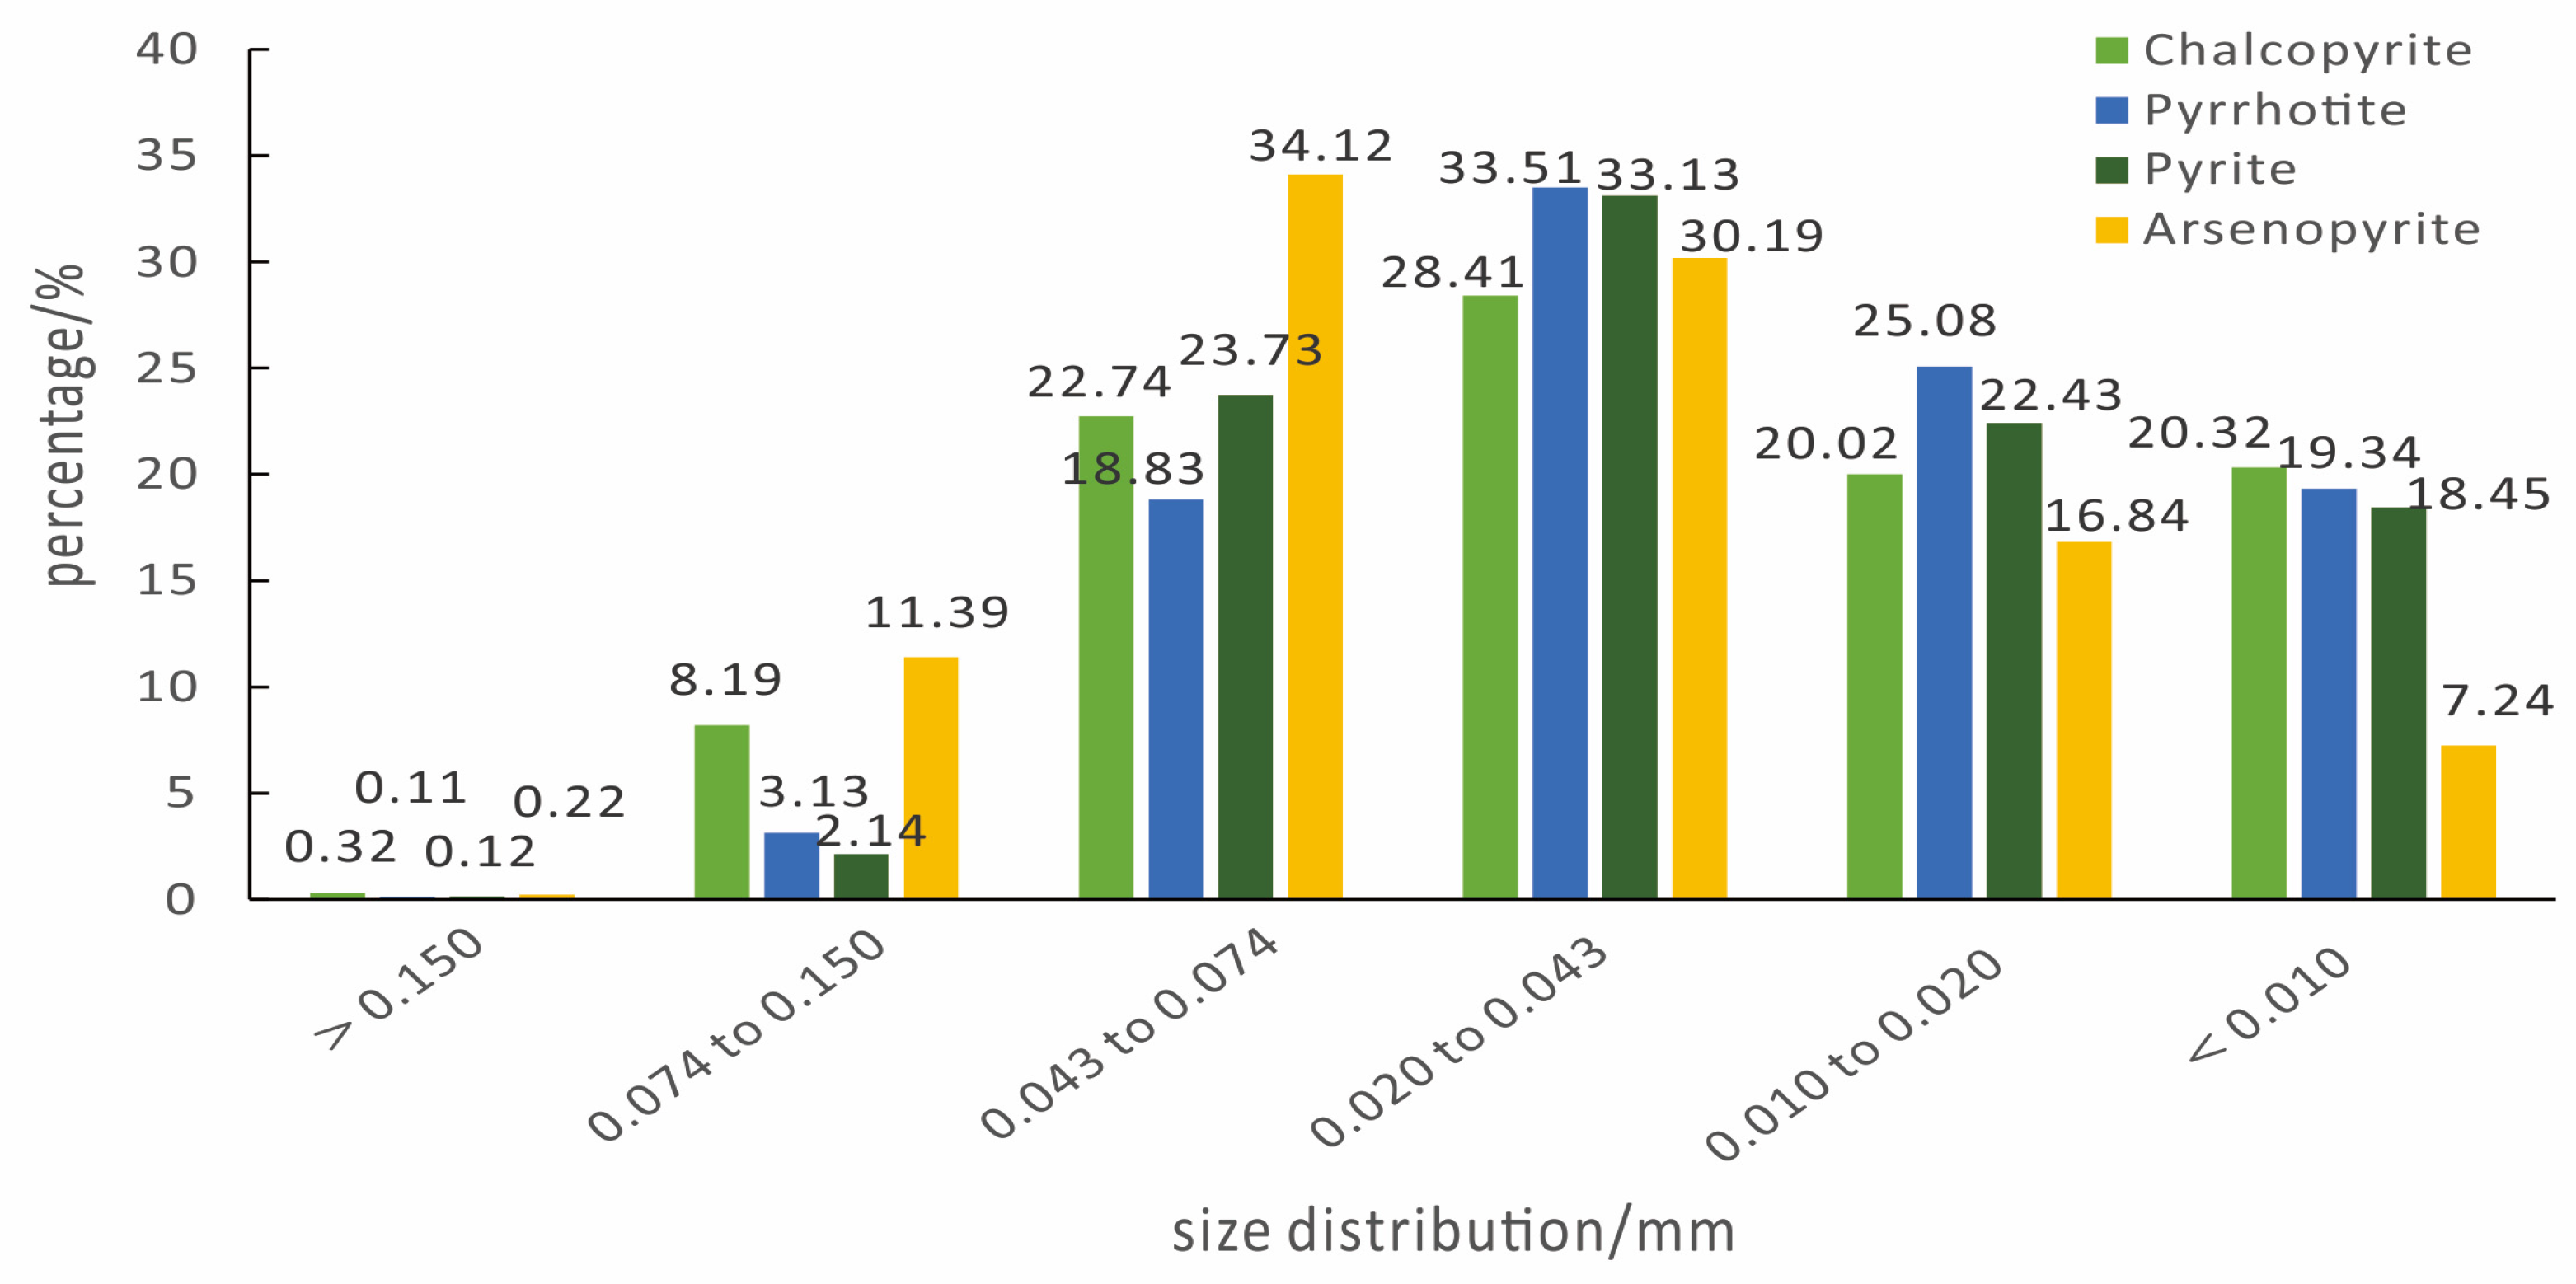
3.1.4. Mineral Size Distribution of Main Sulfide Minerals

The mineral size distribution characteristics of chalcopyrite, pyrrhotite, pyrite, and arsenopyrite, which affect the separation of copper and sulfur, were studied. The results are shown in Figure 3. From the figure and data, it is clear that the particle size distributions of these four minerals were all very concentrated.
The particle size of chalcopyrite was mainly finer than 0.074 mm, with a proportion of more than 90%. The proportion of particles with sizes between 0.043 and 0.074 was 22.75%, the proportion of particles with sizes between 0.010 and 0.0204 was 20.02%, and the proportion of those finer than 0.010 mm was 20.32%.
For the pyrrhotite, the particle size was mainly in the range from 0.020 to 0.043 mm, the proportion of which was 33.50%. Additionally, the proportion of particles with sizes between 0.043 and 0.074 mm was 18.84%, the proportion of those with sizes between 0.010 and 0.020 was 25.09%, and the proportion of those with sizes smaller than 0.010 mm was 19.34%.
The particle size of the pyrite was mainly between 0.020 and 0.043 mm, the proportion of which was 33.13%. In addition, the proportions of particles with sizes between 0.043 and 0.074 mm and 0.010 and 0.020 mm were 23.73% and 22.43%, respectively.
The particle size of the arsenopyrite was mainly from 0.020 to 0.074 mm. The proportion of particles with sizes between 0.043 and 0.074 mm was 34.12%, while the proportion of those with sizes between 0.020 and 0.043 mm was 30.19%.

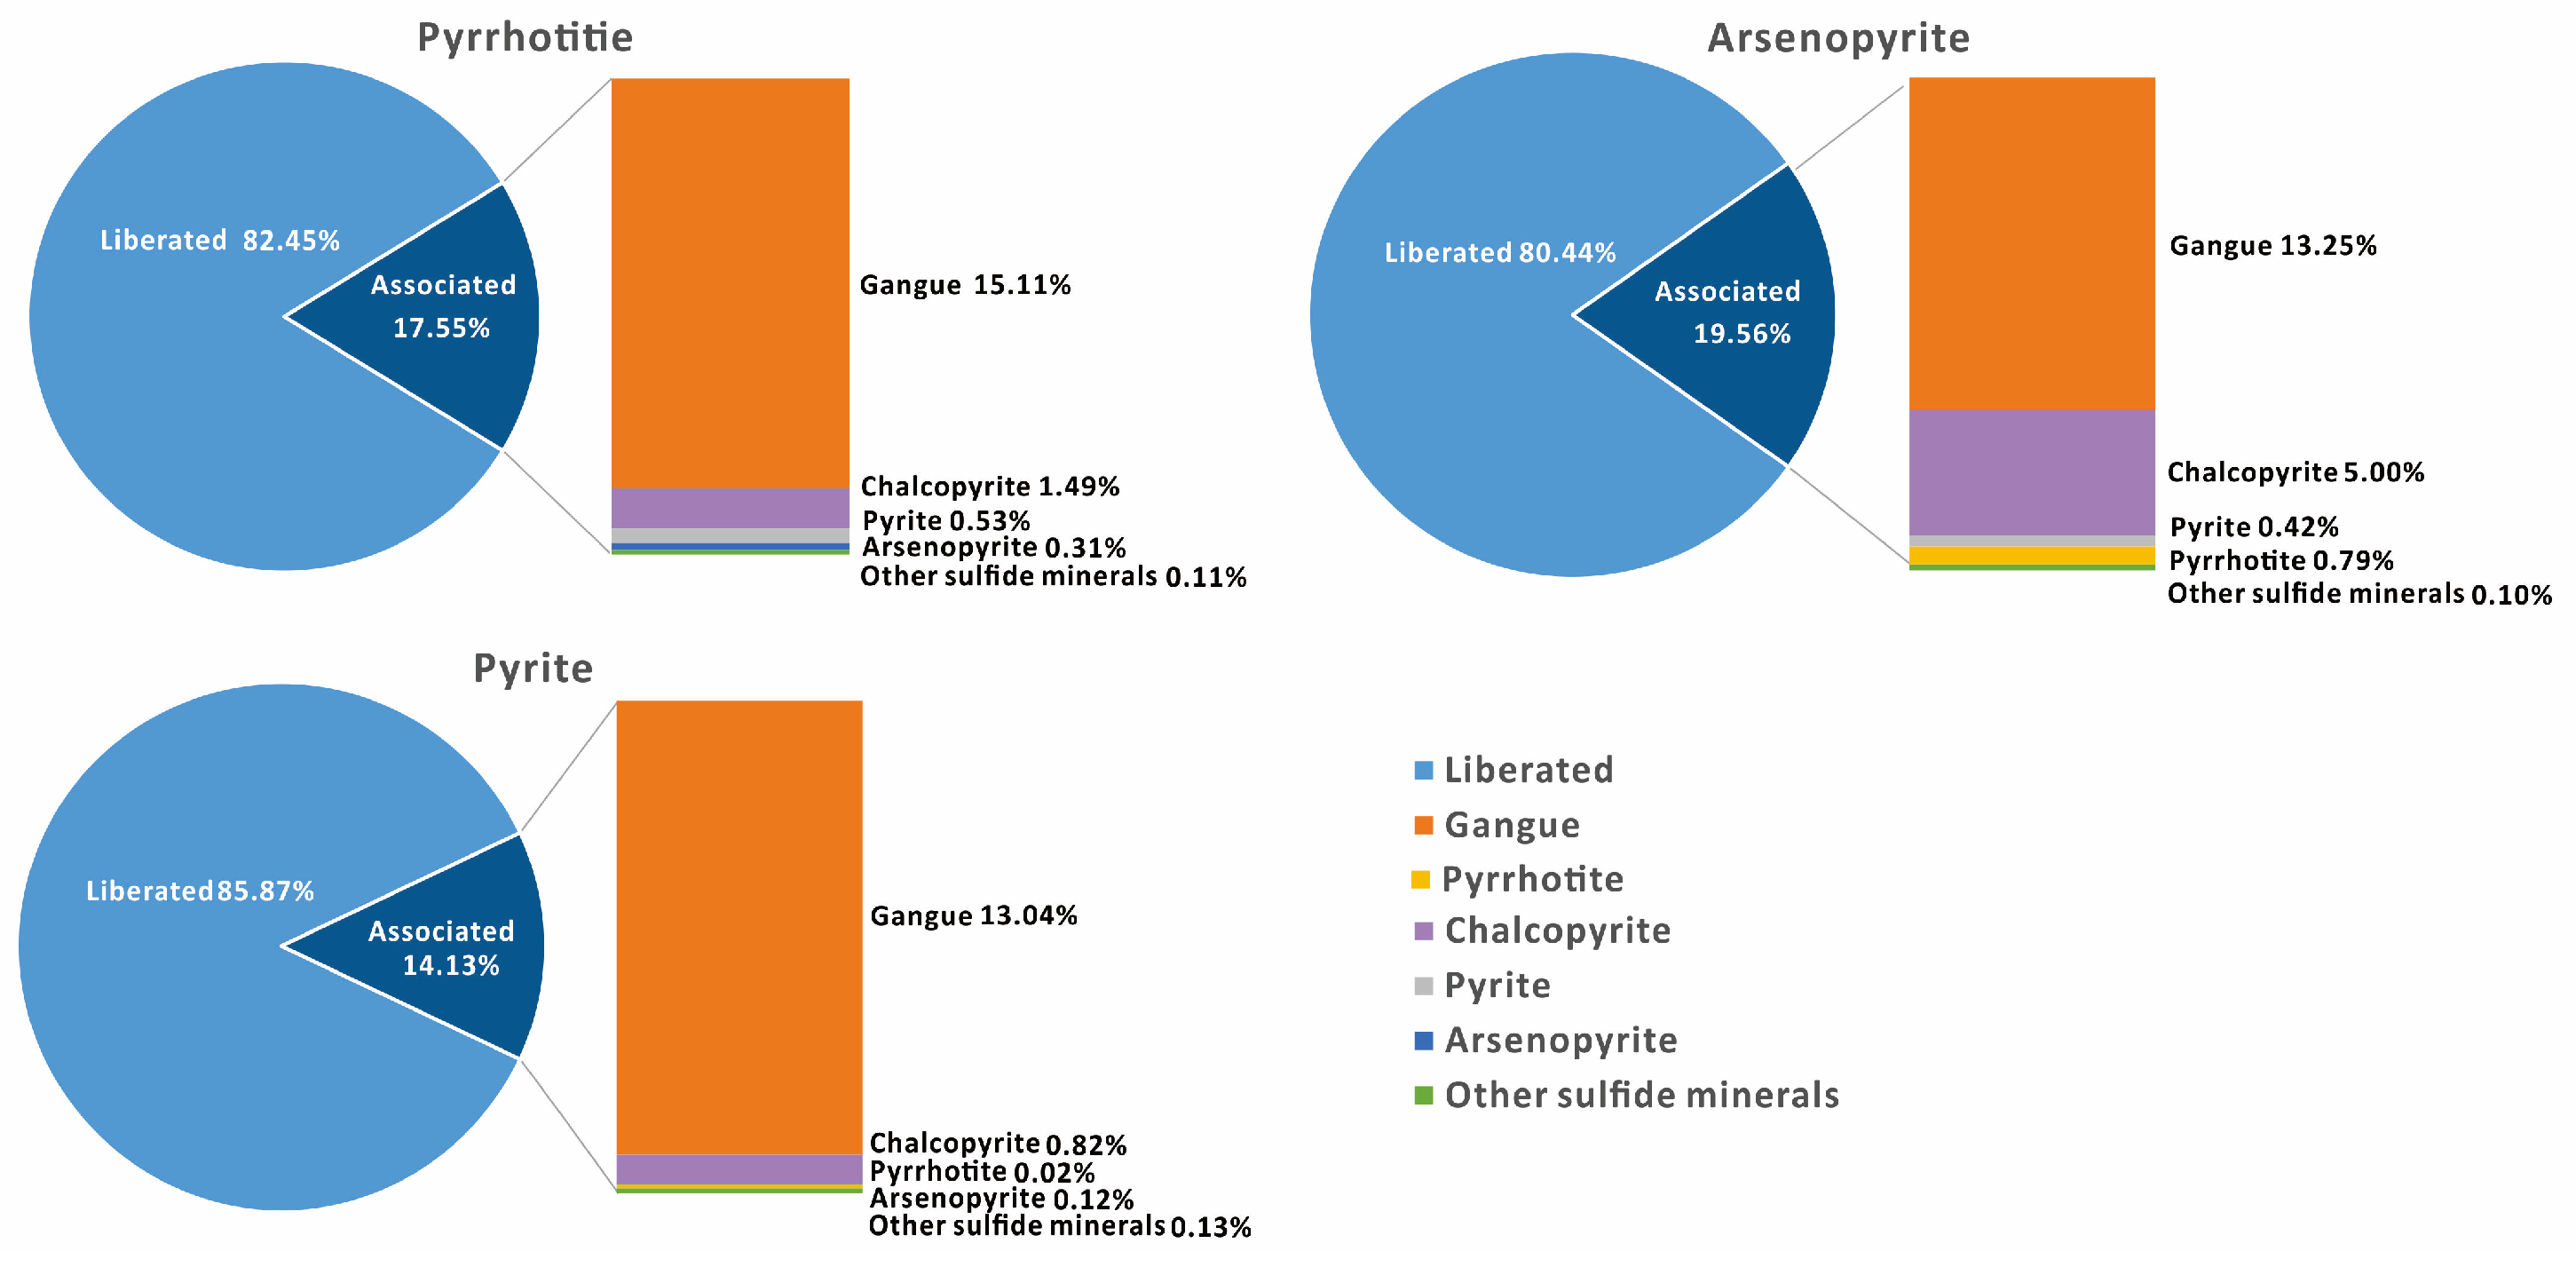
3.1.5. Liberation of Main Sulfide Minerals

The liberation degrees of chalcopyrite, pyrrhotite, pyrite, and arsenopyrite were measured, and the results are shown in Figure 4.
As shown in Figure 4, the liberation degrees of chalcopyrite, pyrrhotite, pyrite, and arsenopyrite were 87.54%, 94.05%, 95.02%, and 94.33%, respectively.
The proportion of chalcopyrite associated with gangue minerals was 9.13%. Another 2.19% of chalcopyrite was associated with pyrrhotite. Small amounts of chalcopyrite were associated with pyrite, arsenopyrite, and other sulfide minerals, accounting for 0.42%, 0.12%, and 0.60%, respectively.
The pyrrhotite was mainly associated with gangue minerals, followed by chalcopyrite (2.39%). Very small amounts were associated with pyrite, arsenopyrite, and other sulfides, accounting for 0.09%, 0.05%, and 0.11%, respectively.
The pyrite was mainly associated with gangue, accounting for 4.94%, and with small amounts of chalcopyrite, arsenopyrite, pyrite, and other sulfides, accounting for 0.94%, 0.11%, 1.74%, and 0.13%, respectively.
The proportion of arsenopyrite associated with gangue was 4.16%. Additionally, small amounts of arsenopyrite were associated with chalcopyrite, pyrite, pyrrhotite, and other sulfide minerals, accounting for 1.10%, 0.05%, 0.25%, and 0.10%, respectively.

3.1.6. In Situ Chemical Composition of Pyrrhotite

To accurately determine the iron and sulfur contents of pyrrhotite, the main components of pyrrhotite were analyzed using EMPA. The composition information of the particles is shown in Table 3.

3.2. S concentrate

3.2.1. Chemical Composition
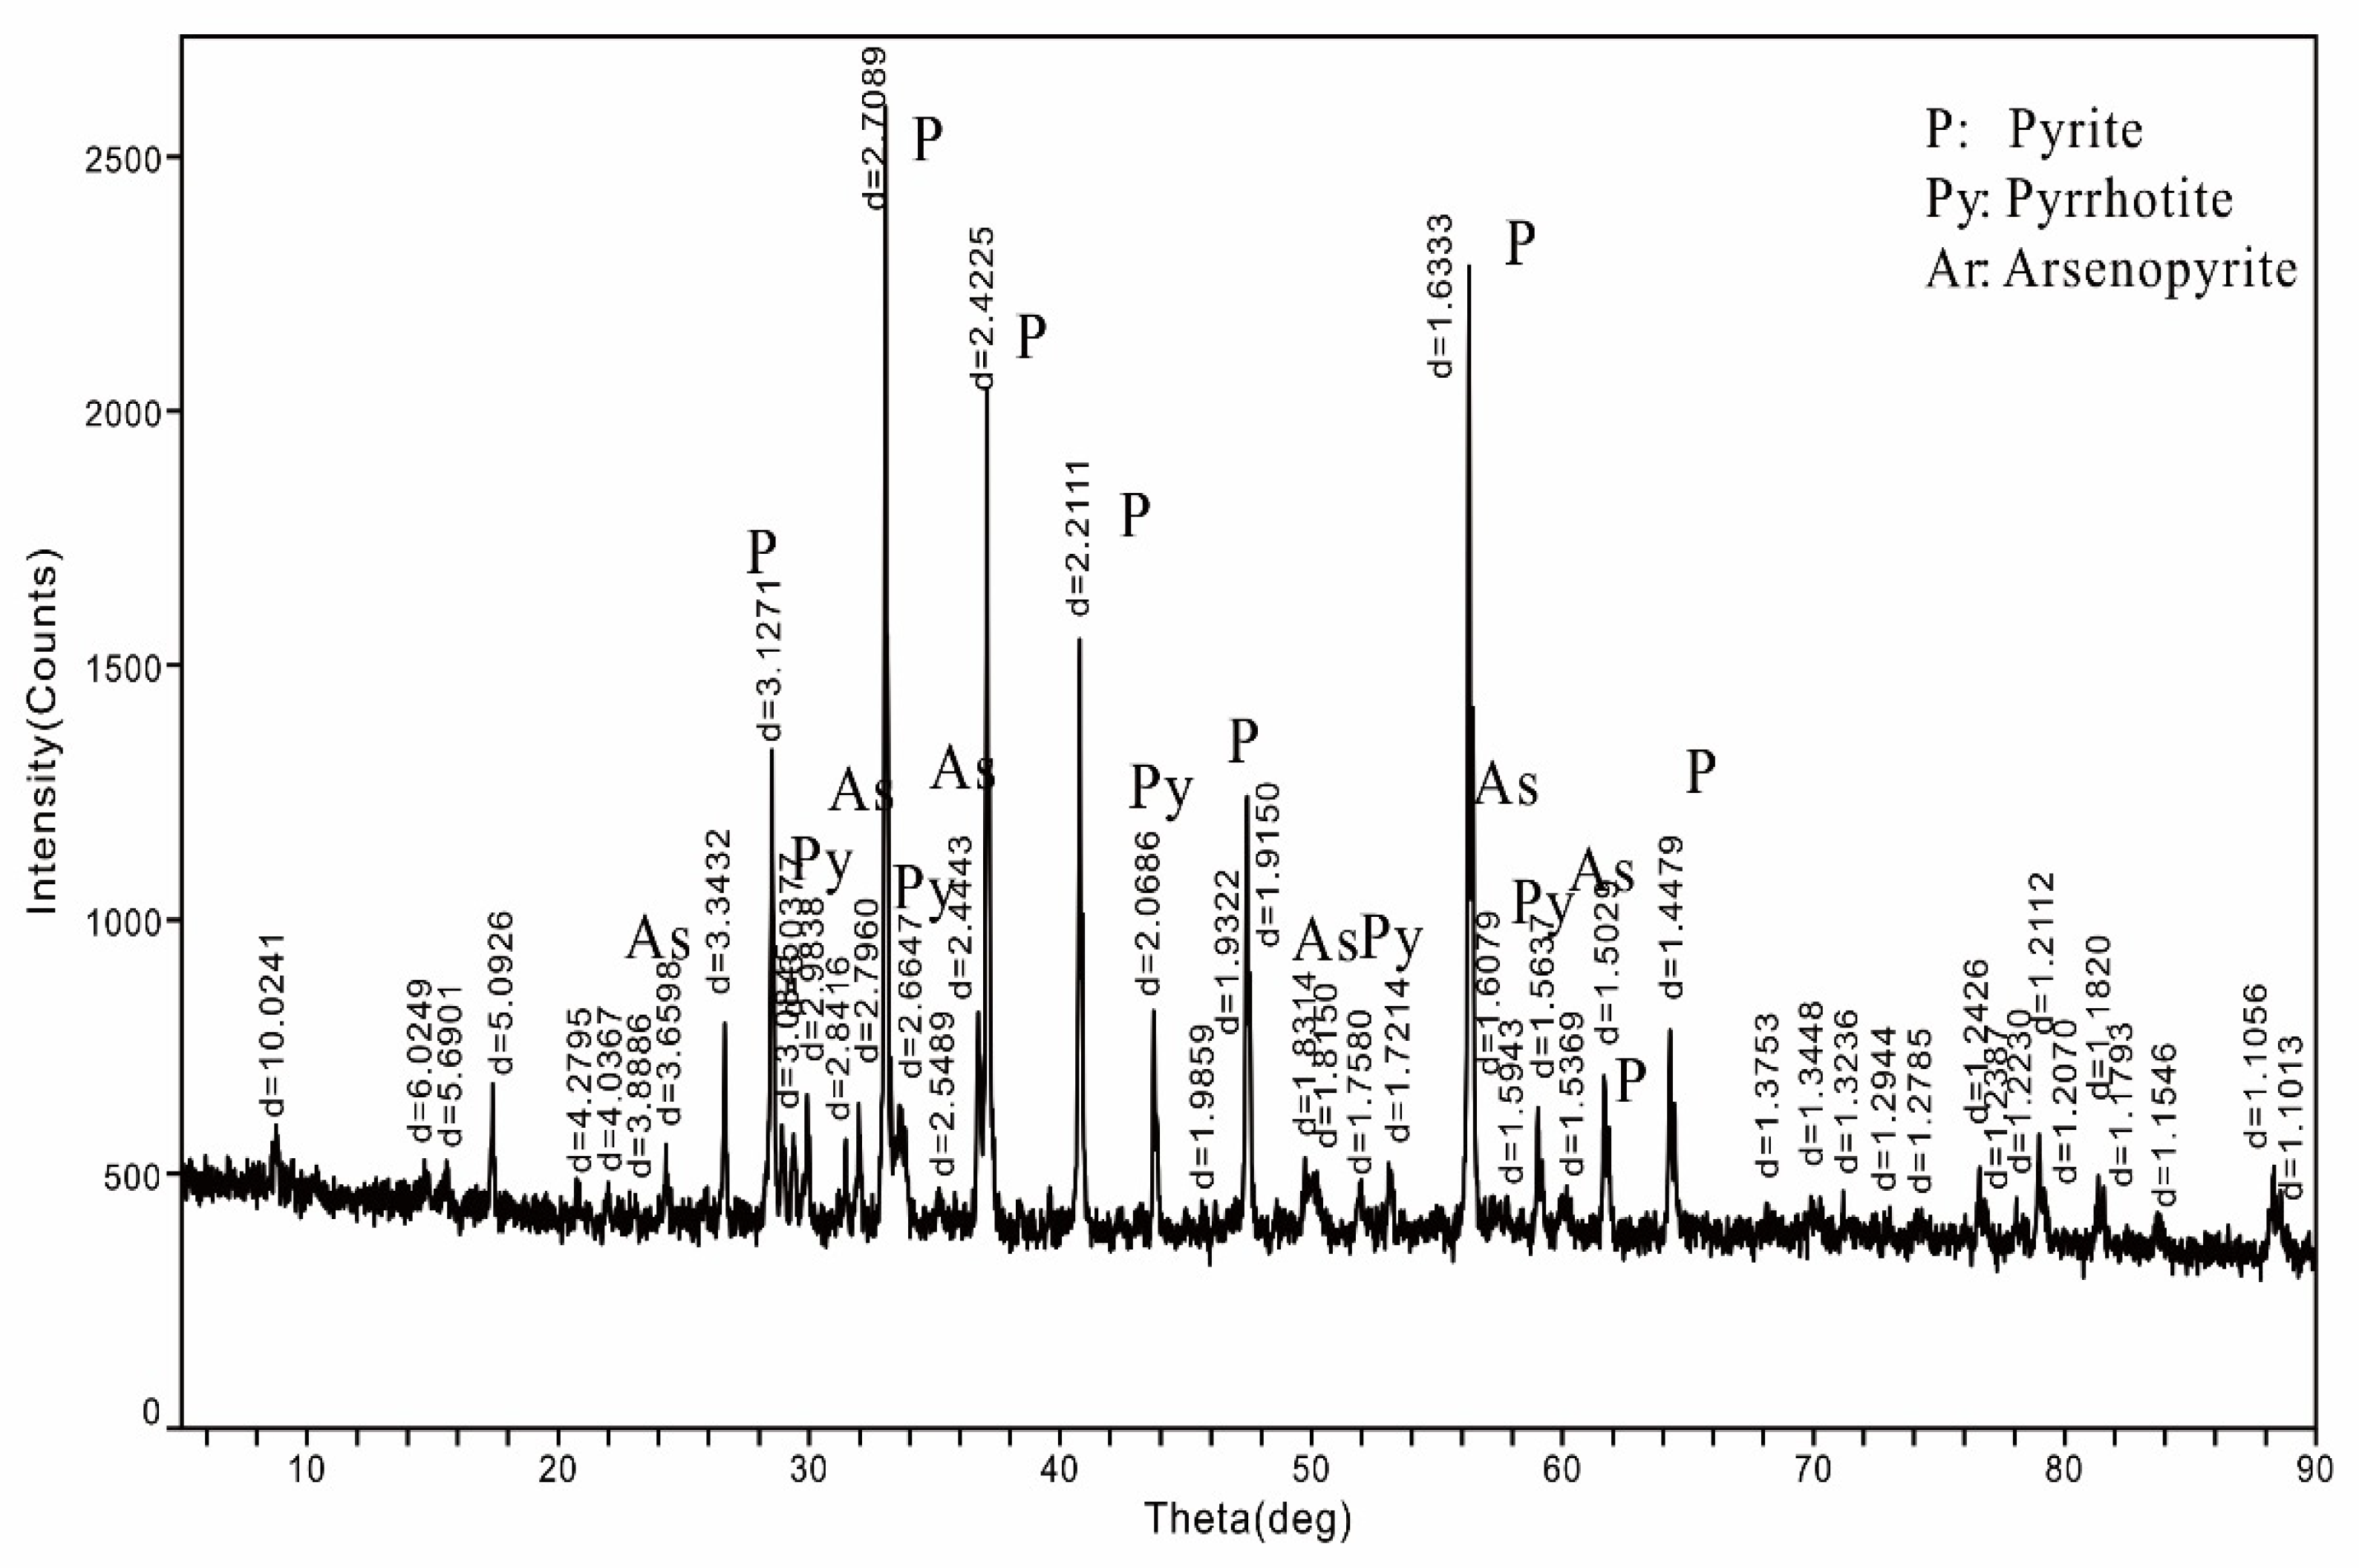
The chemical composition of the S concentrate is shown in Table 4. According to Table 4, the grade of As in the S concentrate was 6.84%, which is much higher than the requirement for qualified S concentrate.

3.2.2. XRD Result

The main minerals in the S concentrate included pyrite, pyrrhotite, and arsenopyrite (Figure 5), which is in line with the mineral powder diffraction files (PDF-4) listed in the ICDD database.

3.2.3. Mineral Composition

The mineral composition of the S concentrate was measured using MLA, and the results of the model mineral are shown in Table 5. Pyrite and pyrrhotite were the main sulfide minerals in the S concentrate, the proportions of which were 38.53% and 35.23%, respectively. Additionally, the proportion of arsenopyrite was also rich, at 14.86%. Gangue minerals in the S concentrate included quartz, siderite, muscovite, dolomite, calcite, K-feldspar, and others.

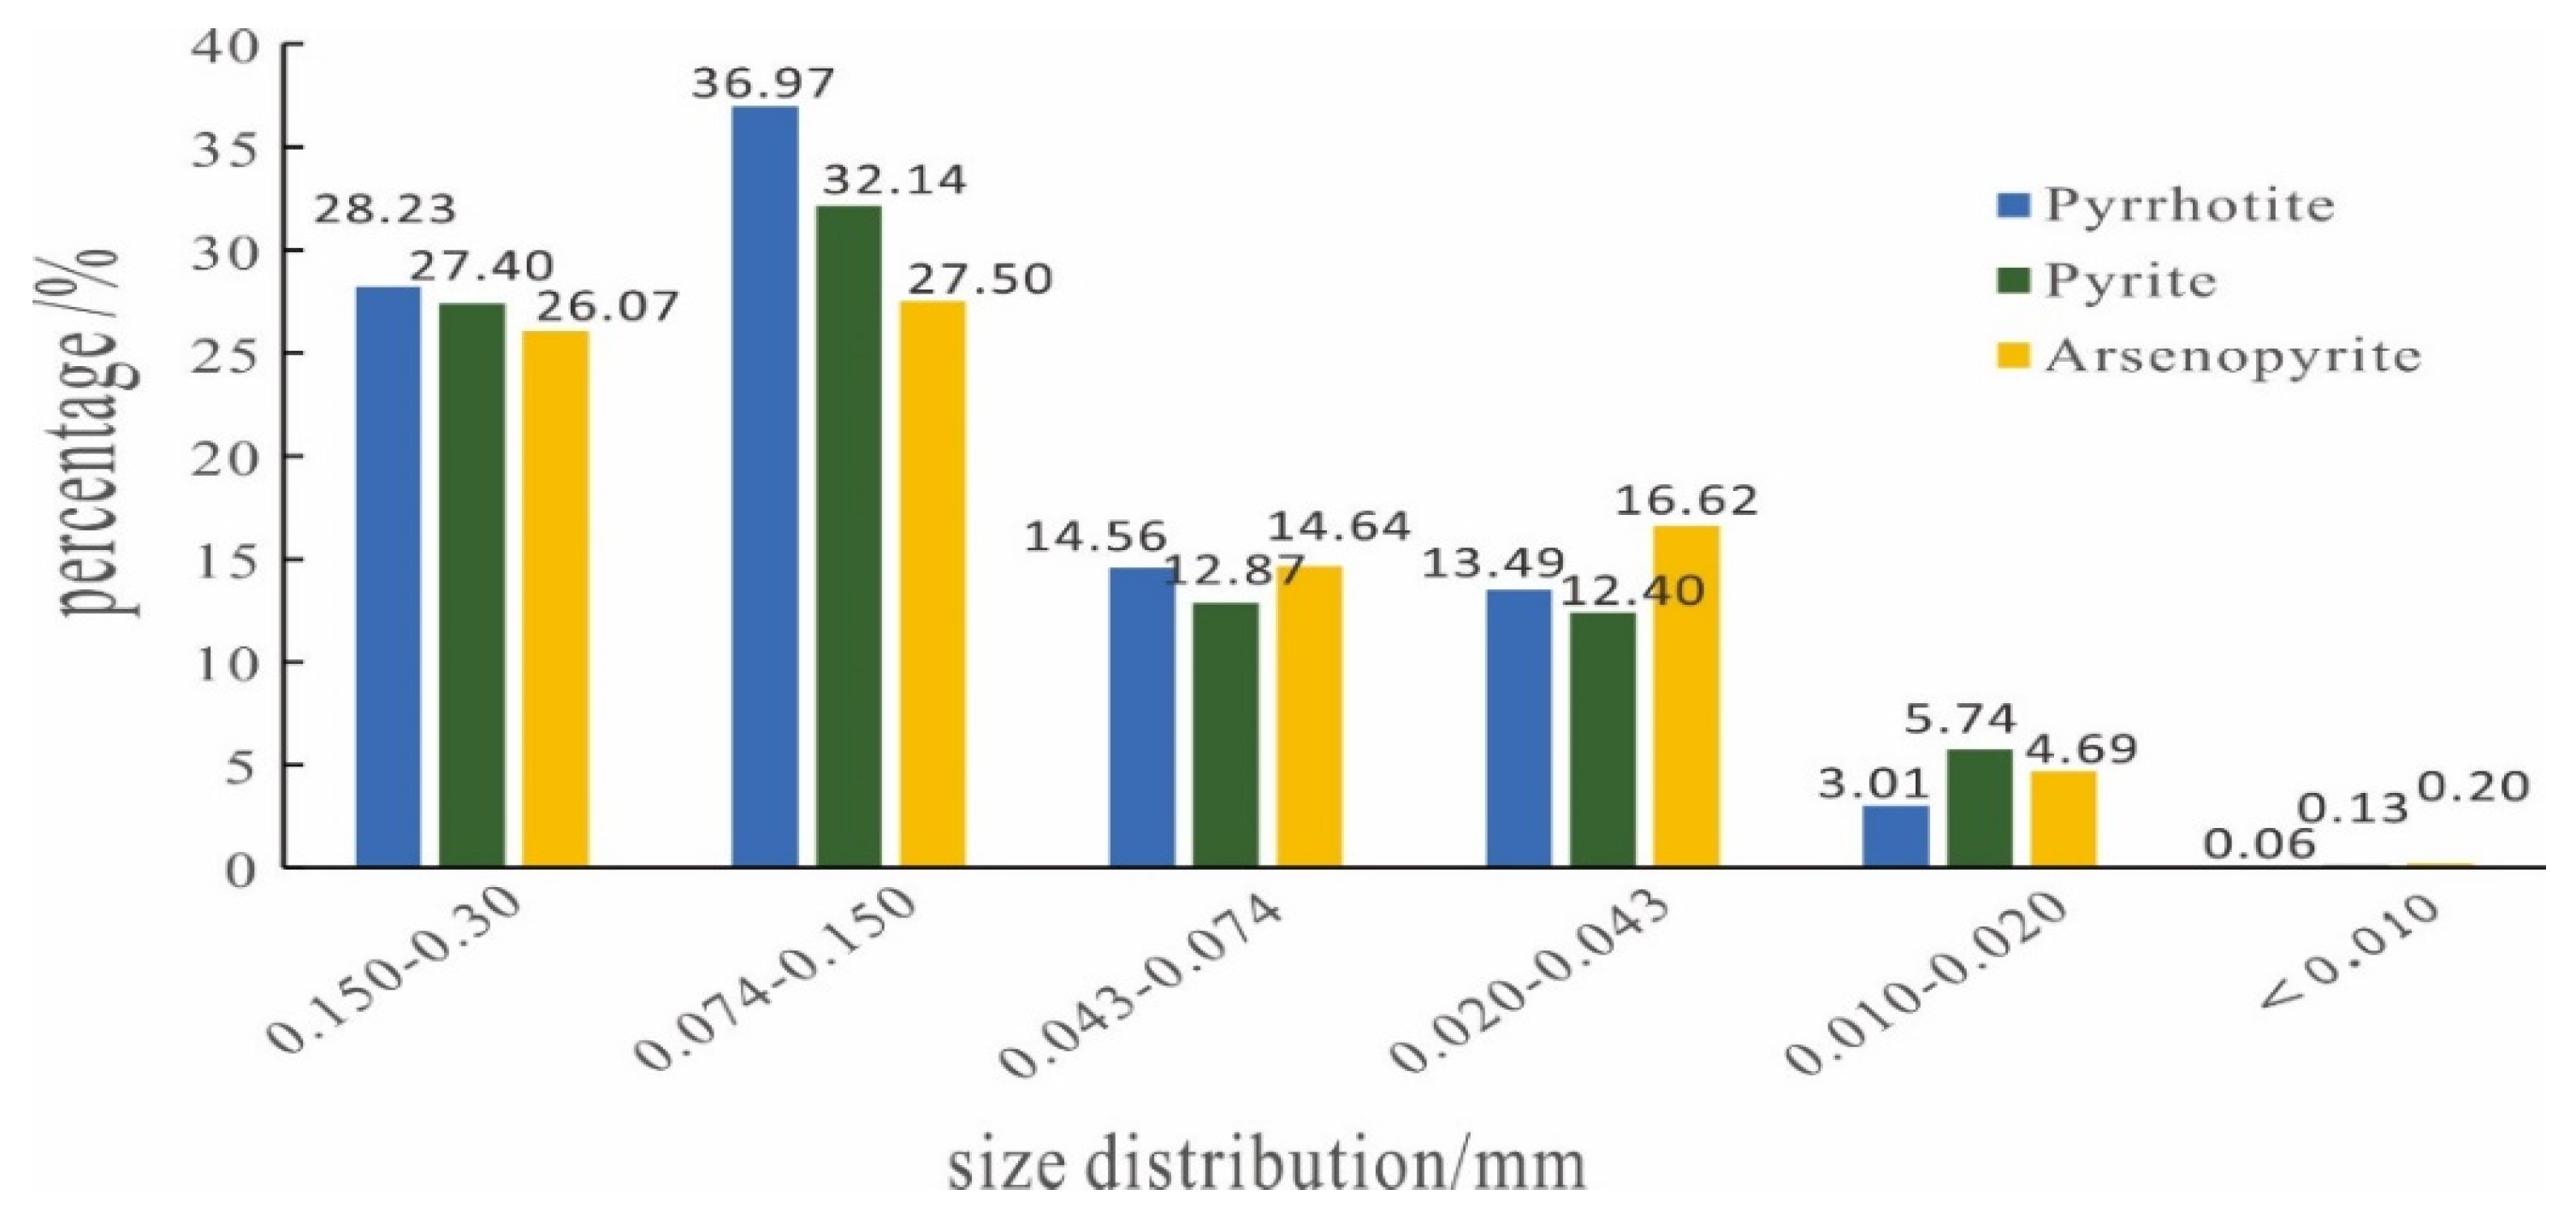
3.2.4. Mineral Size Distribution of Main Sulfide Minerals

The mineral size distribution characteristics of the main sulfide minerals (pyrrhotite, pyrite, and arsenopyrite) were studied. The results are shown in Figure 6.
The grain sizes of pyrrhotite, pyrite, and arsenopyrite were relatively coarse. Their particle sizes were mostly above 0.02 mm, of which 0.074–0.30 mm accounted for the highest proportion. The proportions of pyrrhotite, pyrite, and arsenopyrite above 0.074 mm reached 65.20%, 59.54%, and 53.57%, respectively, and those between 0.020 and 0.074 mm reached 13.49%, 12.40%, and 16.62%, respectively.

3.2.5. Liberation of Main Sulfide Minerals

The liberation degrees of pyrrhotite, pyrite, and arsenopyrite and their associated minerals in the S concentrate were studied and measured, and the results are shown in Figure 7.
As shown in Figure 7, the liberation degrees of pyrrhotite, pyrite, and arsenopyrite were 82.45%, 85.87%, and 80.43%, respectively.
The pyrrhotite was mainly associated with gangue minerals, the proportion of which was 15.11%. In addition, some pyrrhotite was associated with chalcopyrite (1.49%). Very small amounts were associated with pyrite, arsenopyrite, and other sulfides, accounting for 0.53%, 0.31%, and 0.11%, respectively.
The pyrite was mainly associated with gangue, accounting for 13.04%. Small amounts of pyrite were associated with chalcopyrite, arsenopyrite, and other sulfides, accounting for 0.82%, 0.12%, and 0.13%, respectively.
The proportion of arsenopyrite associated with gangue was 13.25%. In addition, some arsenopyrite was associated with chalcopyrite, accounting for 5.00%. Very small amounts were associated with pyrite, pyrrhotite, and other sulfides, accounting for 0.42%, 0.79%, and 0.11%, respectively.

3.2.6. In Situ Chemical Composition of Pyrrhotite

To accurately determine the iron and sulfur contents of the pyrrhotite, the main components of the pyrrhotite particles in the S concentrate were analyzed randomly using EMPA. The composition information of the particles is shown in Table 6.

3.3. Sn Rough Concentrate

3.3.1. Chemical Composition
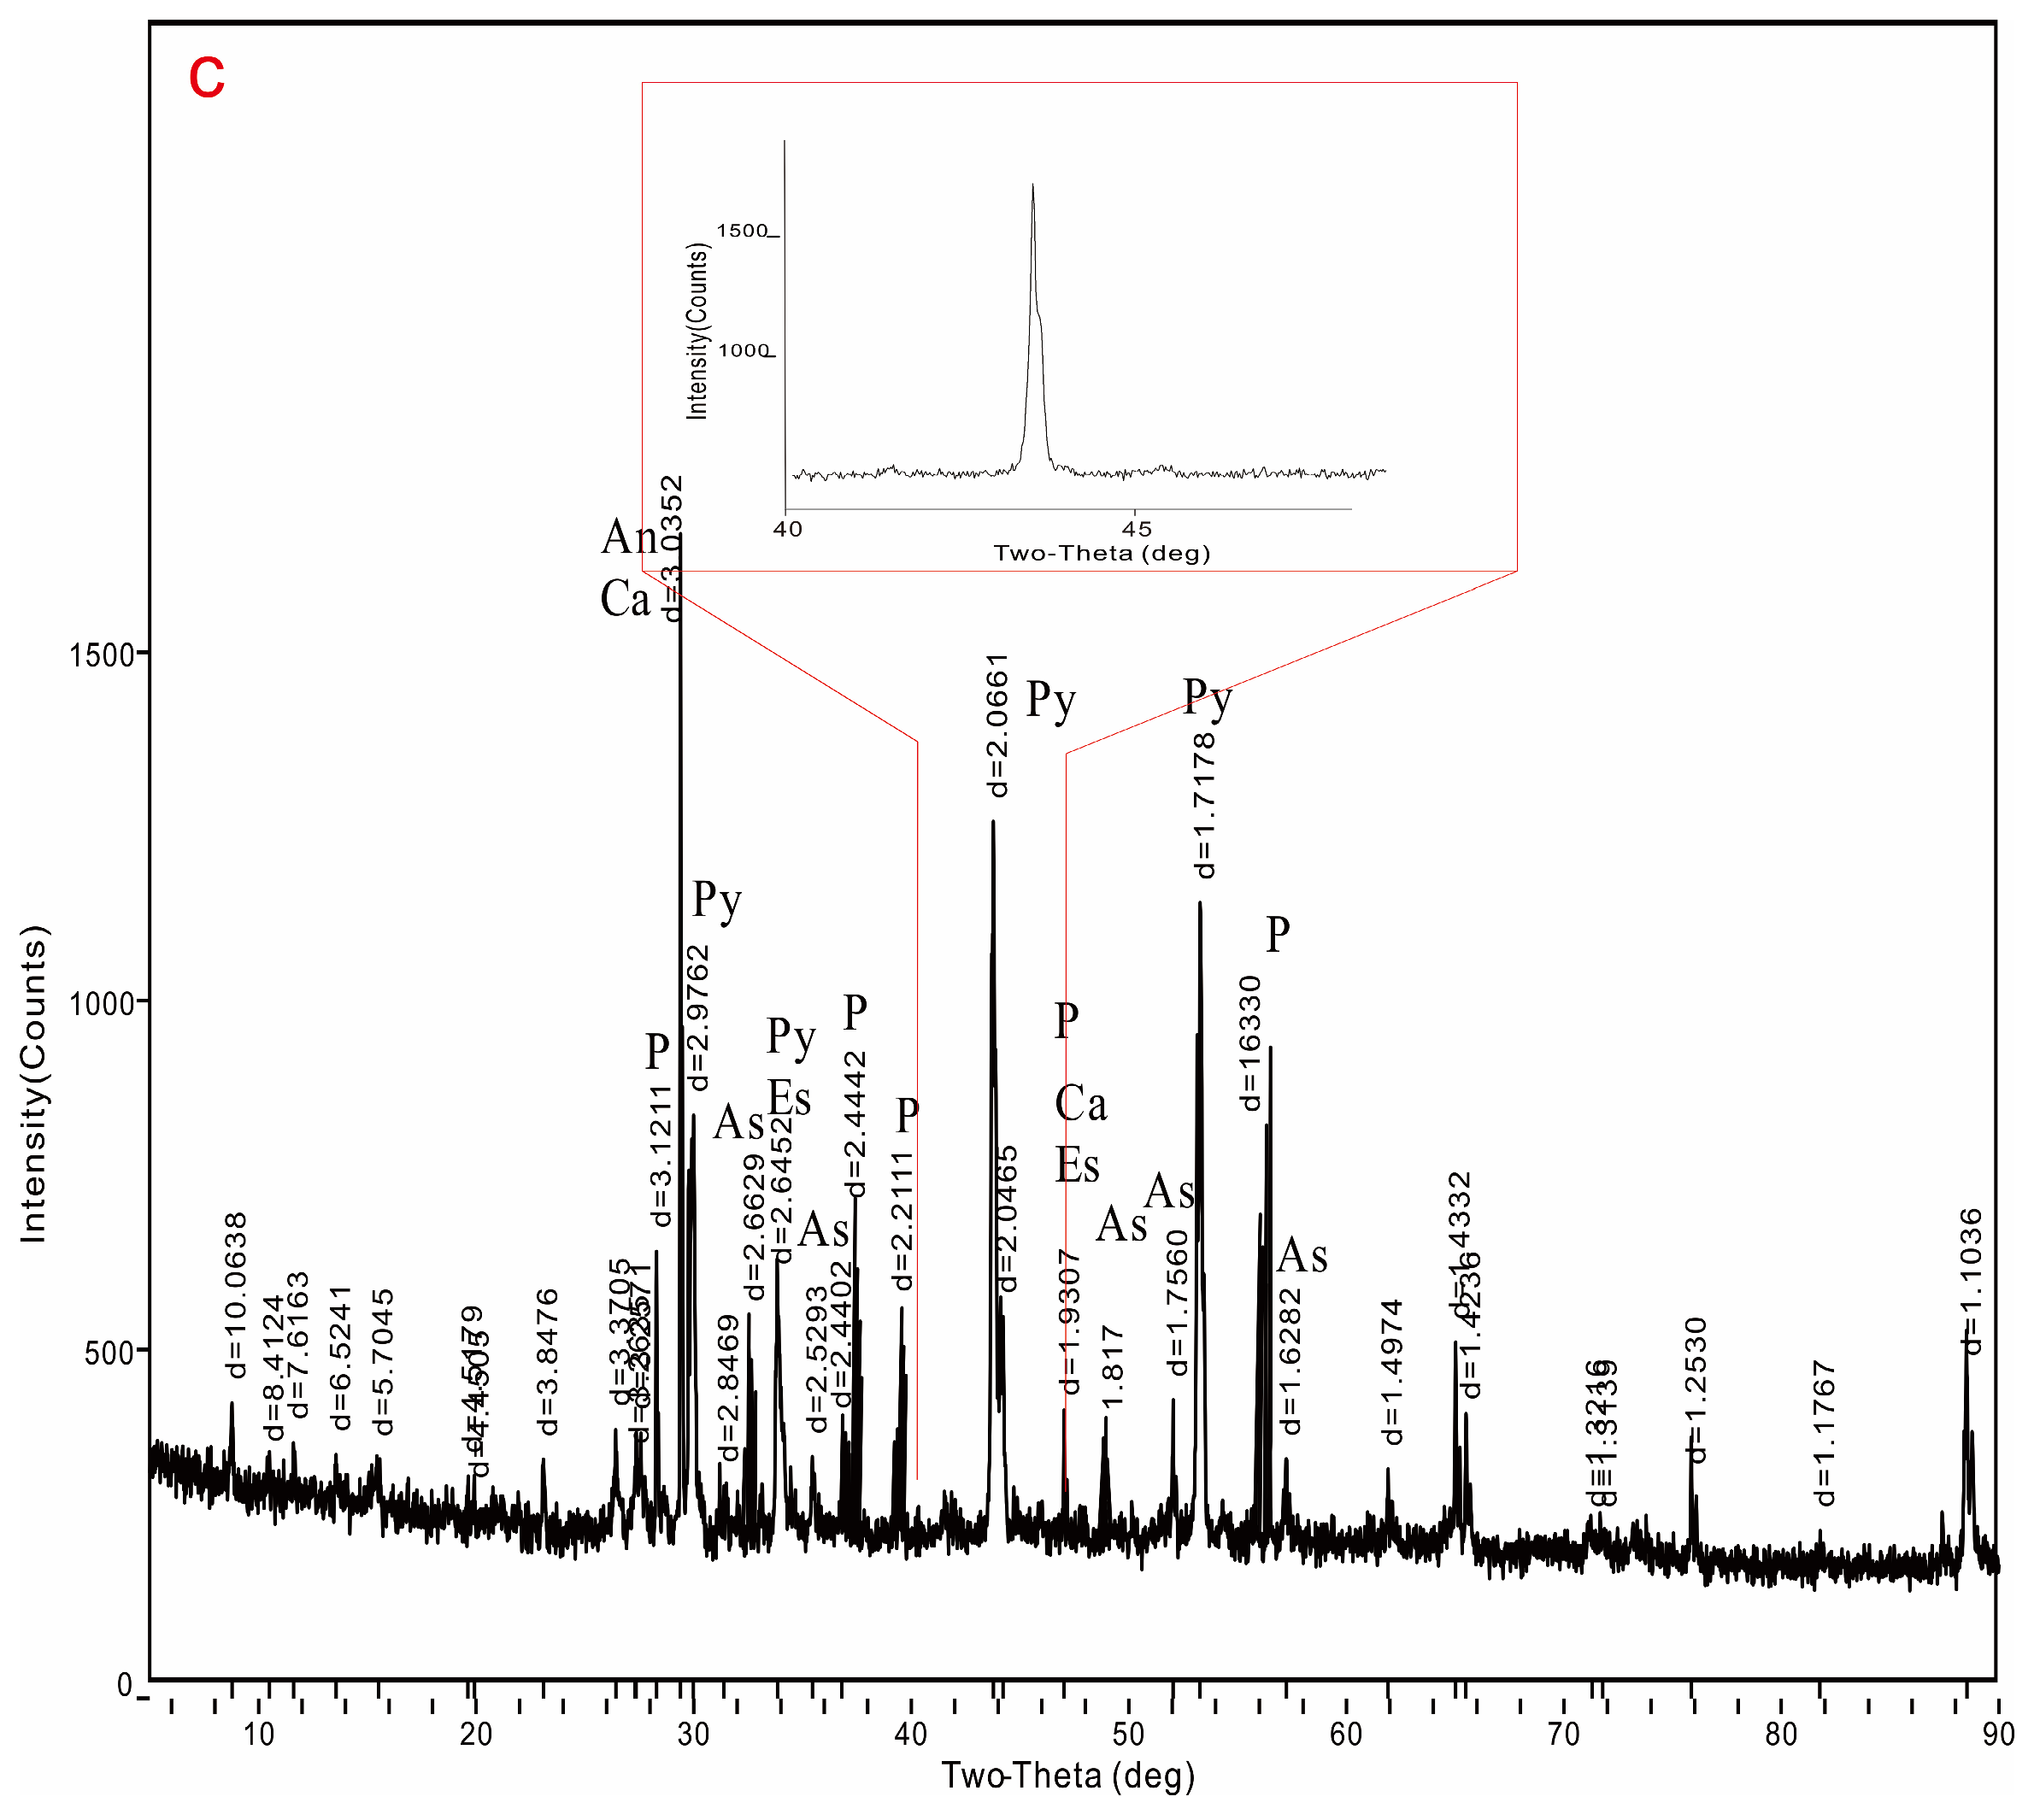
The chemical composition of the Sn rough concentrate is shown in Table 7. As shown in the table, the grade of Sn in the rough concentrate was 4.08%. At the same time, the grade of S was as high as 27.05%.

3.3.2. XRD Results

The results of the XRD for the Sn rough concentrate are shown in Figure 8. The minerals that were identified in the Sn rough concentrate based on their XRD patterns included pyrrhotite, pyrite, arsenopyrite, essonite, andradite, calcite, and quartz.

3.3.3. Mineral Composition

The mineral composition of the Sn rough concentrate is shown in Table 8. Pyrrhotite was the main sulfide mineral in the Sn rough concentrate, the proportion of which was as high as 60.56%. The other sulfide minerals included arsenopyrite, pyrite, chalcopyrite, and stannite. In addition, the gangue minerals included essonite, calcite, diopside, andradite, siderite, albite, quartz, muscovite, and others.

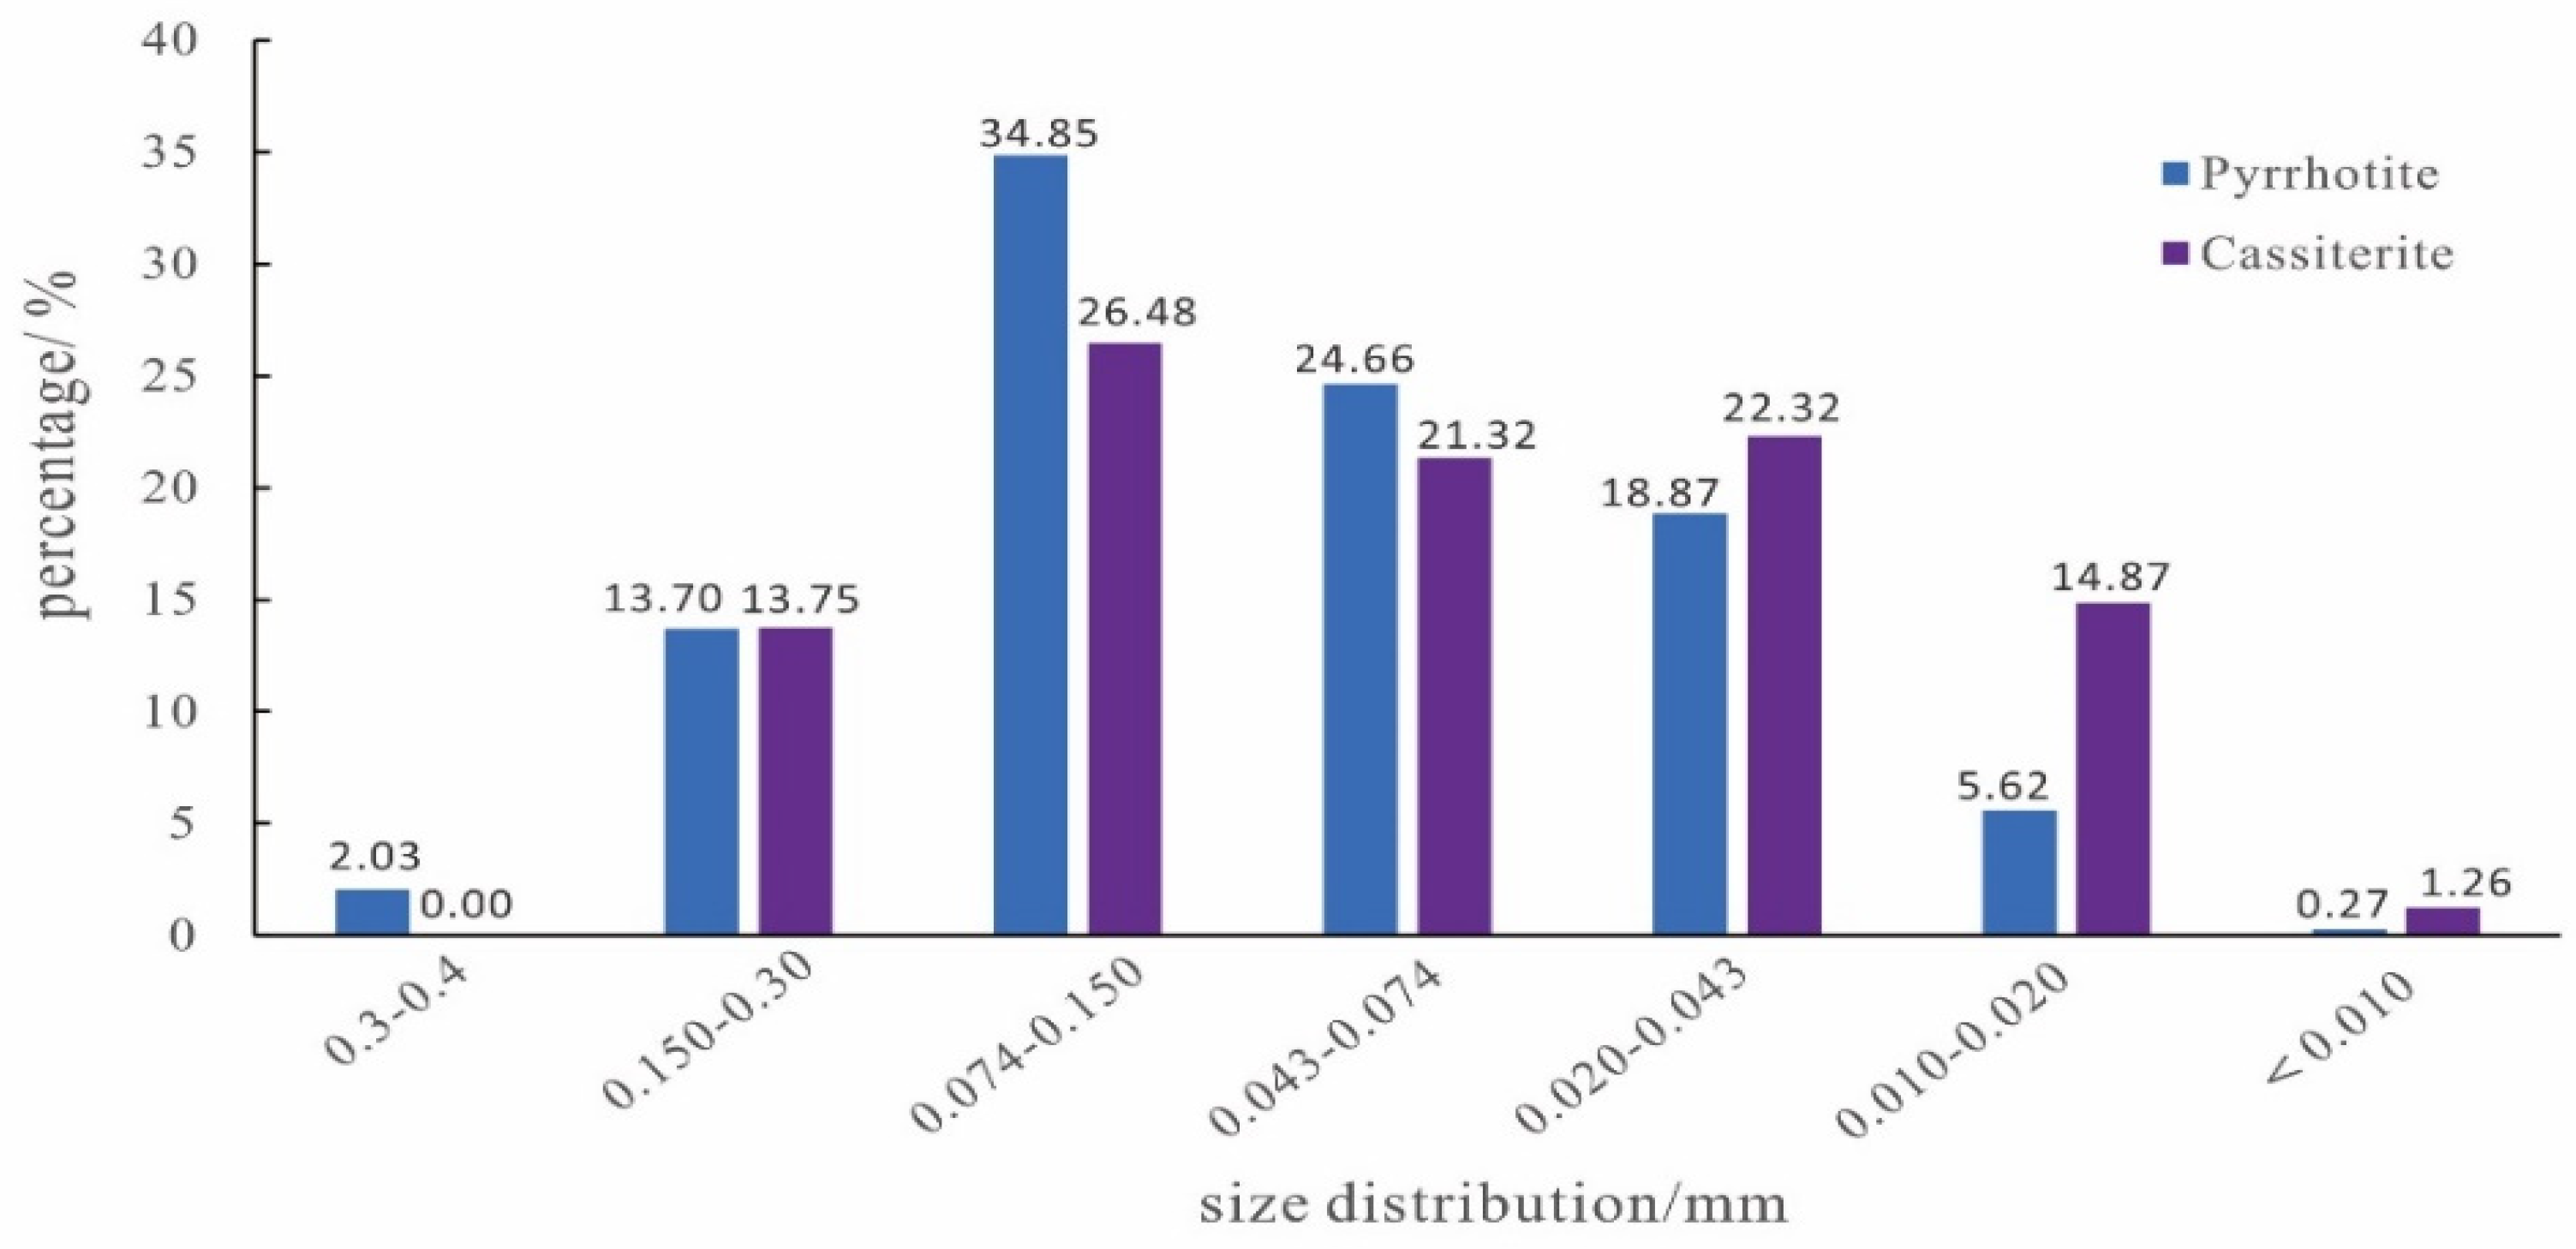
3.3.4. Mineral Size Distribution of Pyrrhotite and Cassiterite

As cassiterite is the target mineral for Sn processing, and pyrrhotite is the sulfide mineral with the highest content, the size distributions of these two minerals were studied and measured. The results are shown in Figure 9.
The particle size of the cassiterite in the Sn rough concentrate was between 0.020 mm and 0.15 mm, and its proportion reached 70.12%.
The particle size of the pyrrhotite in the Sn rough concentrate was mainly between 0.074 and 0.15 mm, accounting for 34.85%. In addition, the particles with sizes between 0.02 and 0.043 mm and those between 0.043 and 0.074 mm also occupied a certain proportion, accounting for 18.87% and 24.66%, respectively.

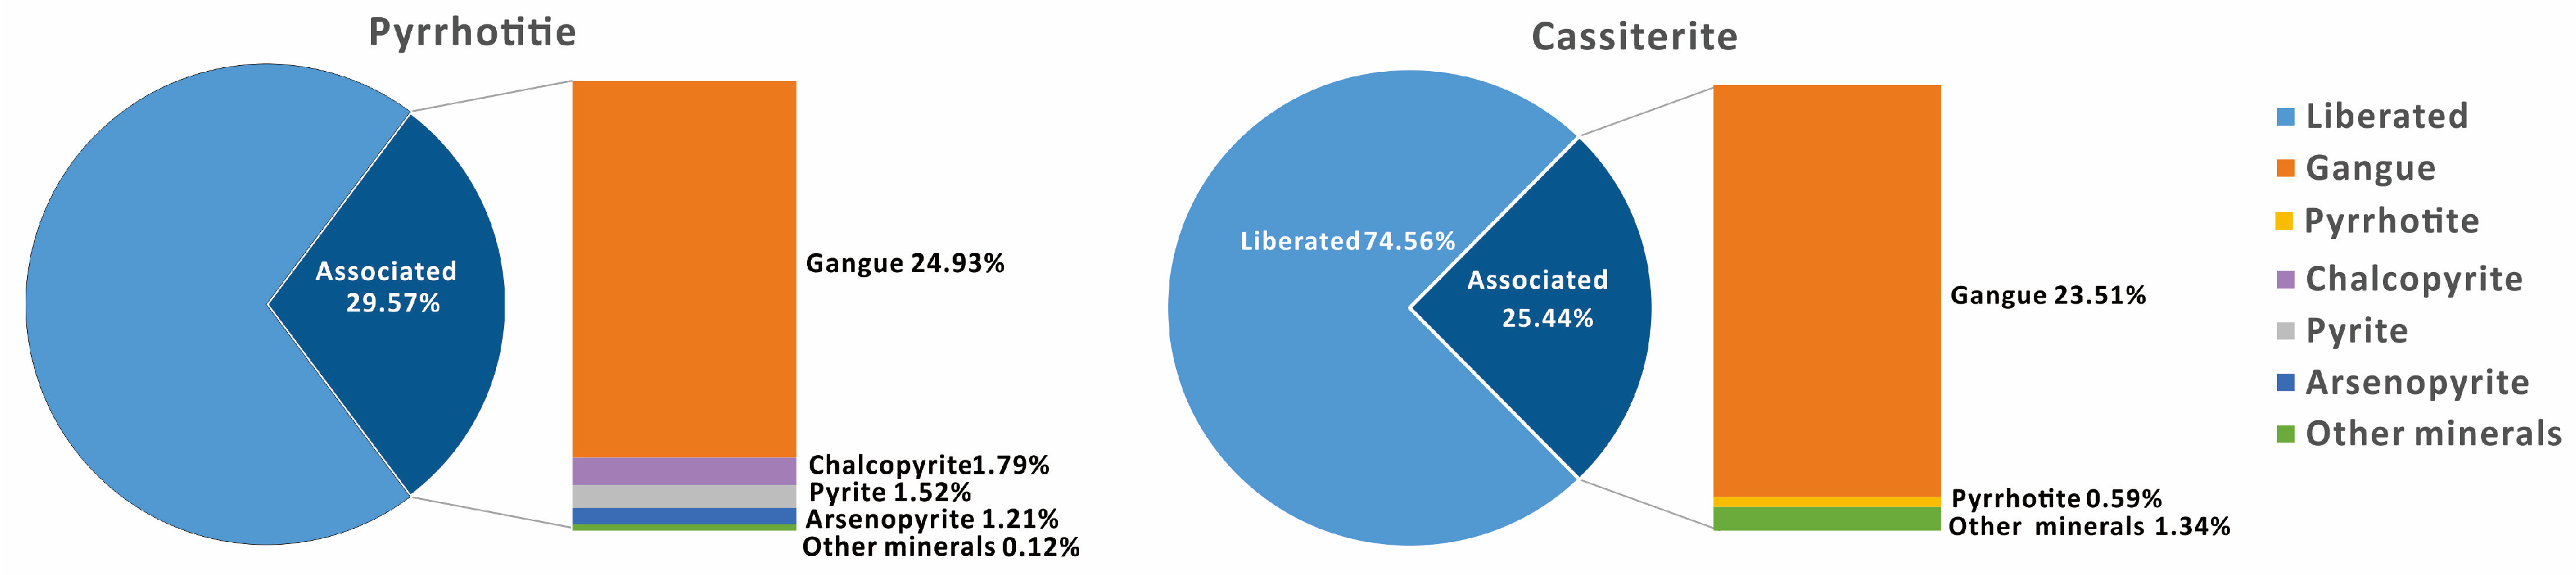
3.3.5. Liberation of Pyrrhotite and Cassiterite

The liberation degrees of the pyrrhotite and cassiterite and their associated minerals in the Sn rough concentrate were studied and measured, and the results are shown in Figure 10.
As shown in Figure 10, the liberation degrees of pyrrhotite and cassiterite were 70.43% and 74.56%, respectively.
The pyrrhotite was mainly associated with gangue minerals, the proportion of which reached 24.93%. In addition, some of the pyrrhotite was associated with chalcopyrite, pyrite, and arsenopyrite, accounting for 1.79%, 1.52%, and 1.21%, respectively.
The cassiterite was mainly associated with gangue, accounting for 23.51%. The proportion of cassiterite associated with pyrrhotite was only 0.59%. In addition, some of the cassiterite was associated with other minerals, like pyrite, stannite, and others, the total proportion of which was 1.34%.

3.3.6. In Situ Chemical Composition of Pyrrhotite

To accurately determine the iron and sulfur contents of the pyrrhotite, the main components of the pyrrhotite particles in the Sn rough concentrate were analyzed randomly using EMPA. The composition information of the particles is shown in Table 9.

4. Discussion

4.1. Process Mineralogy Factors Affecting the Process Indicators

4.1.1. Liberation Degree and Size Distribution of Target Minerals

The liberation degrees and main size distributions of the target minerals are two important factors during mineral processing [10,11]. In this study, the liberation degree of chalcopyrite in the Cu-S mixed concentrate was 87.54%; the liberation degrees of pyrrhotite, pyrite and arsenopyrite in the S concentrate were 82.45%, 85.87%, and 80.44%, respectively; the liberation degree of cassiterite in the Sn rough concentrate was 74.56%. Therefore, all of them reached the requirements of separation processing.
In terms of the particle size distribution characteristics, the particle size composition of chalcopyrite in the Cu-S mixed concentrate and the main particle size composition of minerals in the S concentrate were within the range of flotation capacity separation, while the particle size of cassiterite in the Sn rough concentrate was within the range of gravity separation.
Therefore, the liberation degrees and particle size distributions of the target minerals were not factors that caused problems in their separation. These factors under the current grinding conditions can meet the requirements of mineral processing.

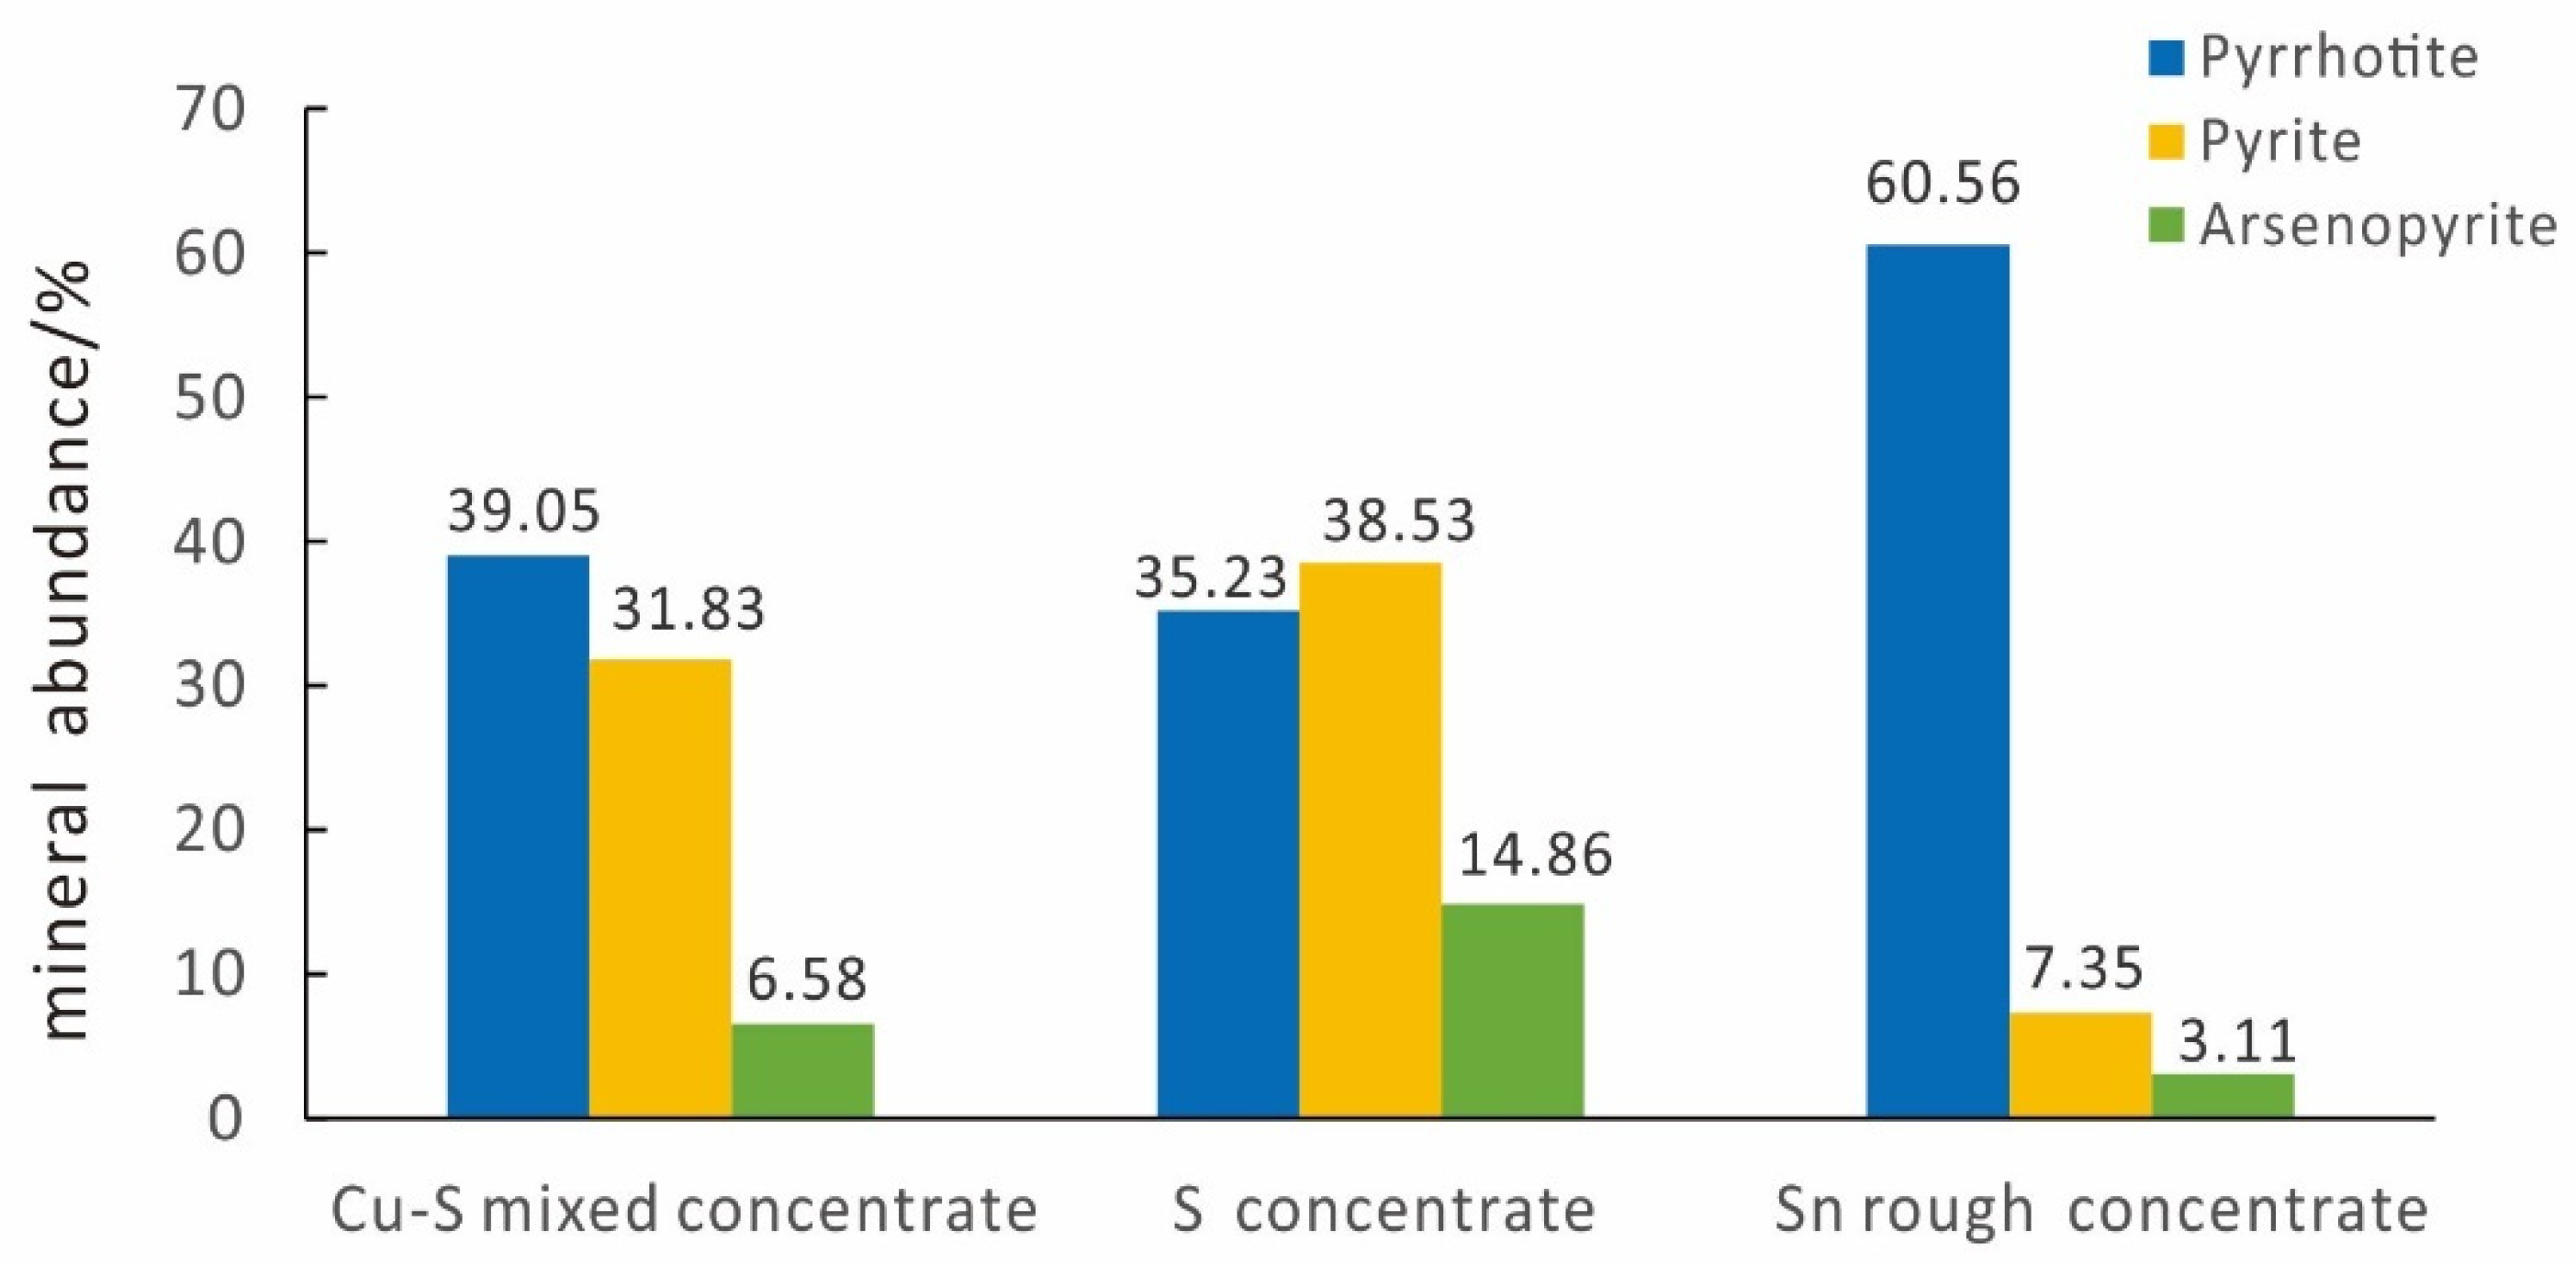
4.1.2. Main Minerals and Their Abundance

In these three samples, pyrite, pyrrhotite, and arsenopyrite were the minerals with the highest contents (Figure 11). Both in the Cu-S mixed concentrate and in the Sn rough concentrate, the contents of pyrrhotite were the largest, reaching 39.05% and 60.56%, respectively. In the S concentrate, the content of pyrrhotite also exceeded 30%, reaching 35.23%, only slightly less than the content of pyrite.
As a typical non-stoichiometric mineral, the chemical formula of pyrrhotite can be written as Fe1−XS, where x varies from 0 (FeS) to 0.125 (Fe7S8). The key point is that pyrrhotite has a different microstructure, and with changes in structure, the mineral properties will also change [12,13]. Therefore, when the content of pyrrhotite is high, it is likely to be an important factor affecting the results of processing and the key to improved processing [14,15,16].

4.2. Classification of Pyrrhotite

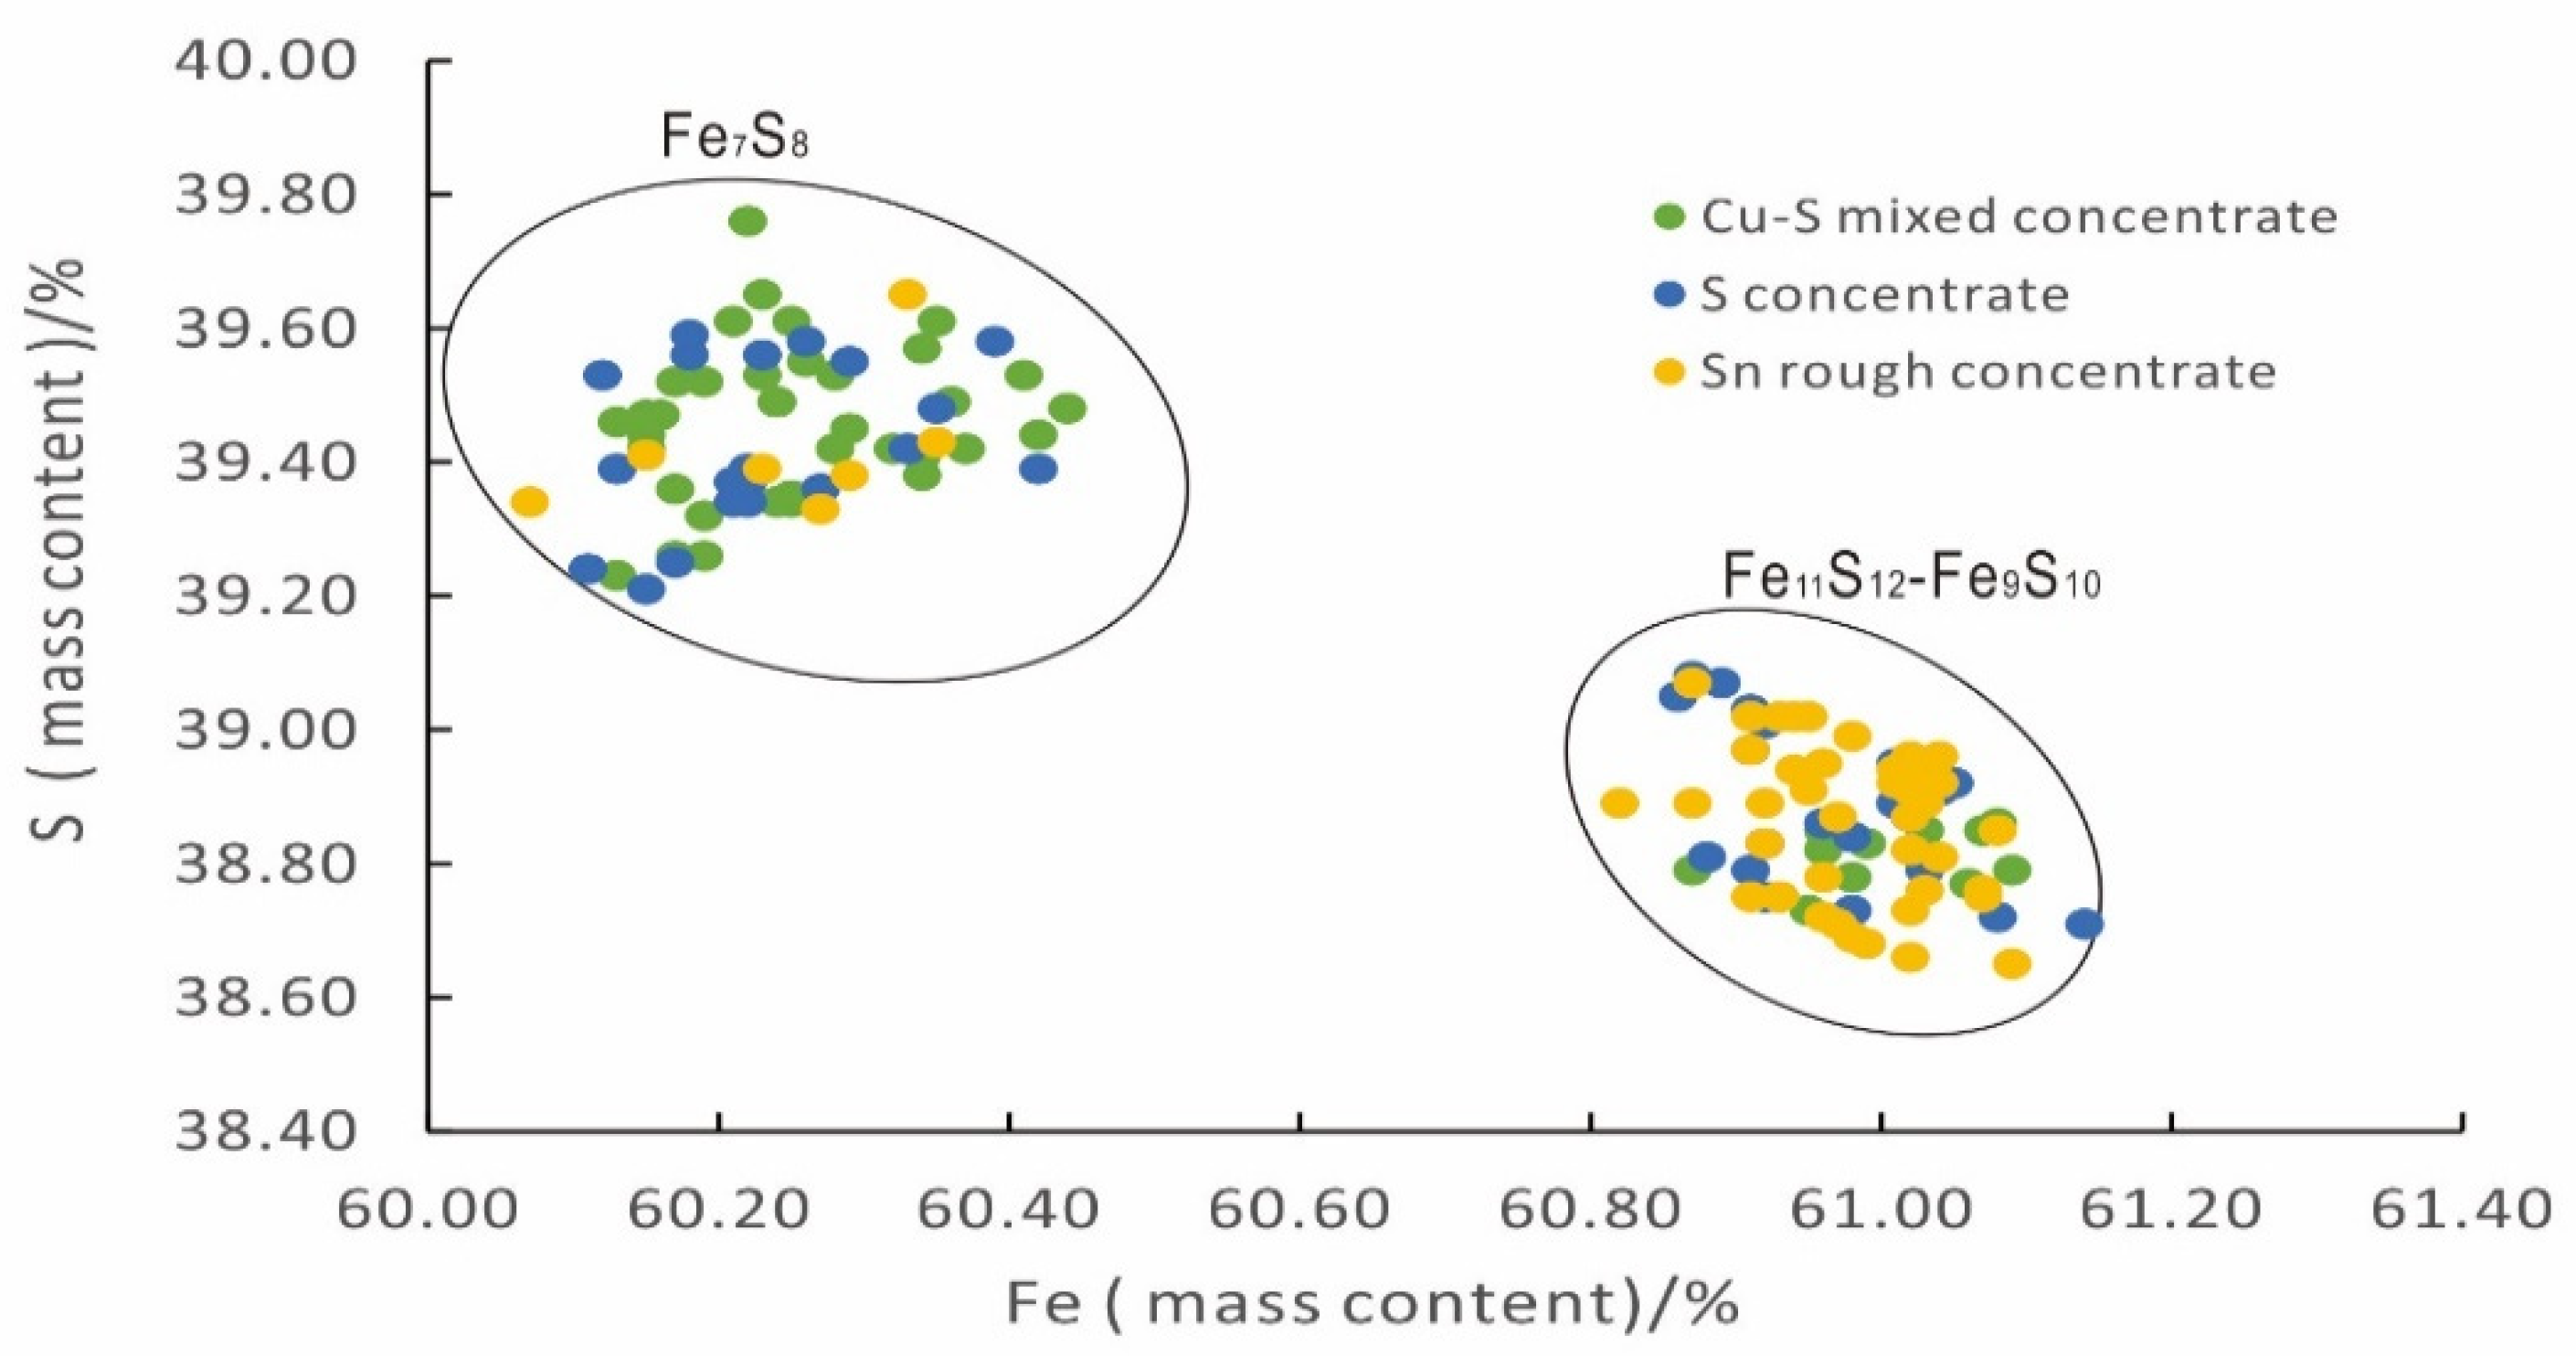
4.2.1. Fe and S Content of Pyrrhotite in Different Samples

Due to its iron deficiency, the crystal structure of pyrrhotite can be divided into a hexagonal crystal system and a monoclinic crystal system. Pyrrhotite with lesser iron deficiency forms a hexagonal crystal system, whereas that with greater iron deficiency forms a monoclinic crystal system [17]. Previous research has generally maintained that, normally, monoclinic pyrrhotite, which exhibits strong magnetism with the iron mass content, ranges between 46.5% and 46.8% on a mole basis, and hexagonal pyrrhotite ranges between 47.4% and 48.3% on a mole basis, exhibiting weak magnetism [18,19,20,21].
The selection of particles in this study was random, so the number of particles can reflect the probability of the occurrence of superstructures to a certain extent (Figure 12). In a Cu-S mixed concentrate, monoclinic pyrrhotite is the majority, and hexagonal pyrrhotite is a minority. The content of monoclinic pyrrhotite in the S concentrate was slightly less than that of hexagonal pyrrhotite. In the Sn rough concentrate, the weak magnetic hexagonal pyrrhotite was dominant, while strong magnetic monoclinic pyrrhotite only occasionally appeared.

4.2.2. XRD Peak Ratios of Pyrrhotite in Different Samples

As previously mentioned, pyrrhotite superstructures have approximately similar characteristic peaks from 2θ = 43° to 45° with a d-spacing to 2.066 for hexagonal pyrrhotite and double peaks for monoclinic pyrrhotite [22,23].
In the XRD results of the three samples, a characteristic double peak from 2θ = 43° to 45° is shown (Figure 13a), which implies that the pyrrhotite in the Cu-S concentrate was mainly monoclinic pyrrhotite.
For the S concentrate, the intensity of the characteristic double peak between 2θ = 43° and 45° is different (Figure 13b).
As seen in the results of the Sn rough concentrate, the single characteristic peaks and a d-spacing to 2.06 is between 2θ = 43° and 45° (Figure 13c). Therefore, the pyrrhotite in the Sn rough concentrate was mainly hexagonal pyrrhotite.

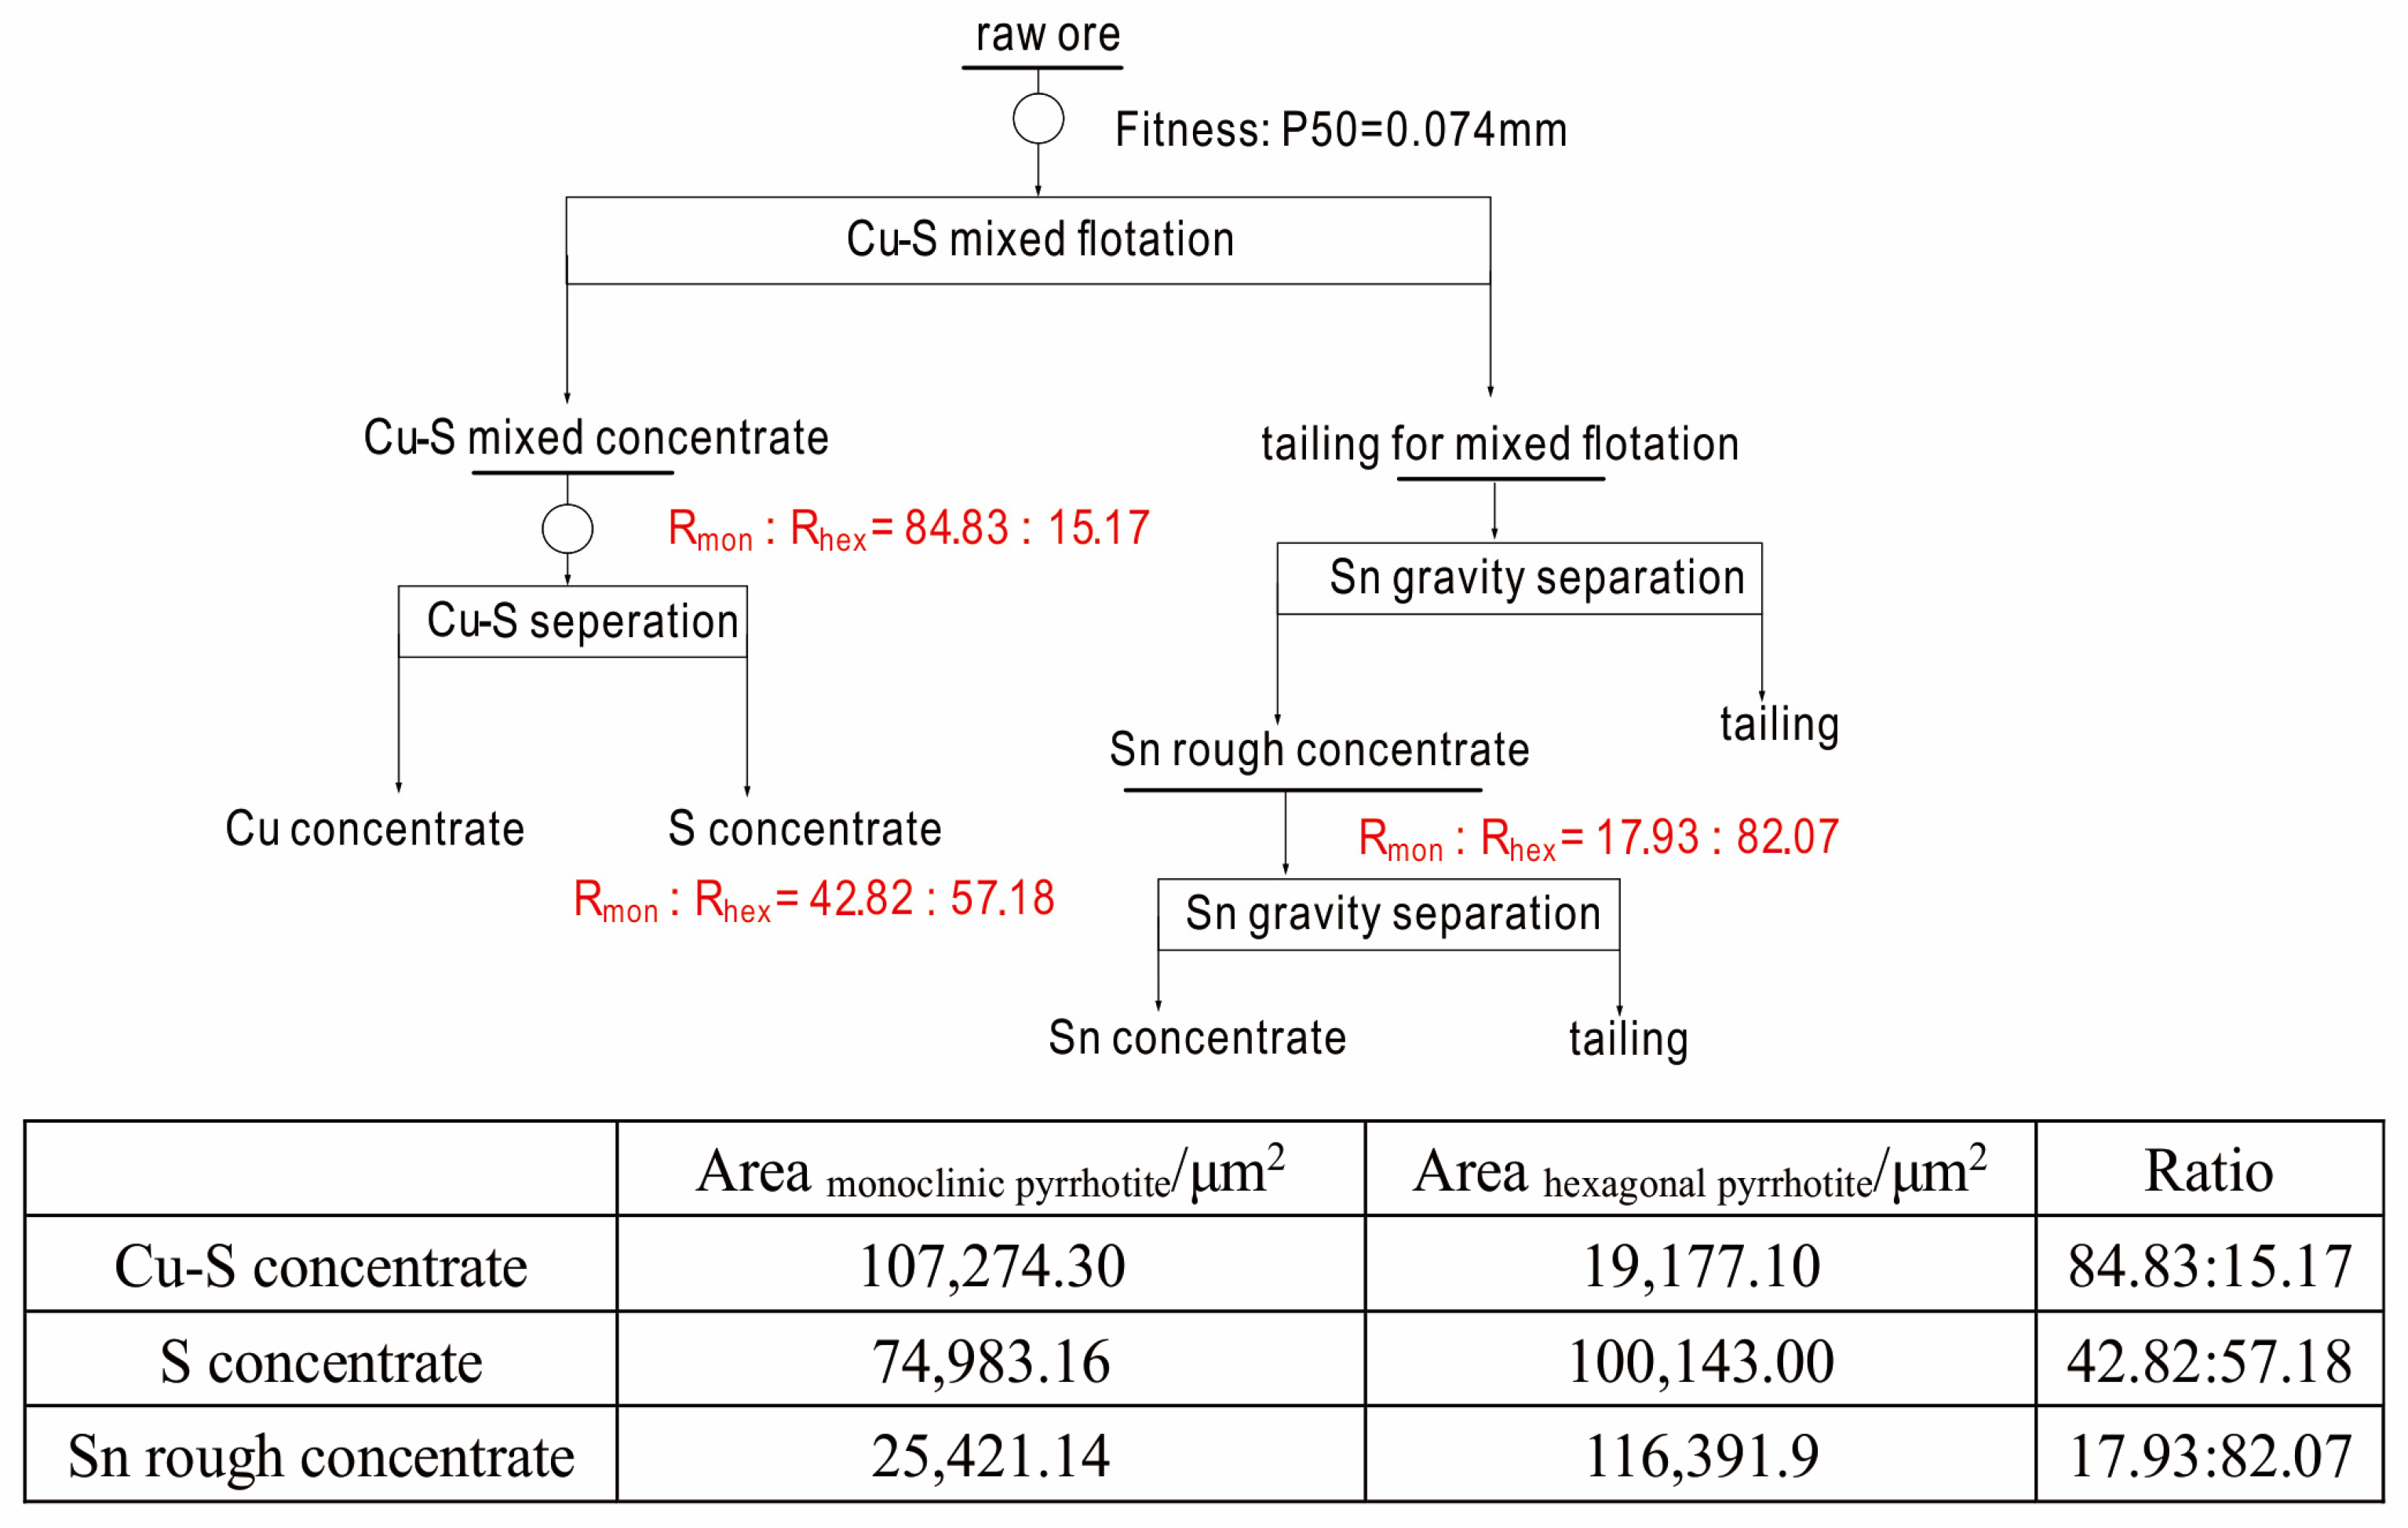
4.3. Ratio Calculation for Different Superstructures of Pyrrhotite in Different Samples

The superstructures of pyrrhotite can be qualitatively determined using in situ element content analyses or X-ray diffraction (XRD). However, neither of these methods can directly quantify the different superstructures of pyrrhotite in one sample.
The abundance of minerals is determined as their mass ratio. The ratios of two minerals can be calculated as follows:
a = M 1 M 2 = ρ 1 × V 1 ρ 2 × V 2
where a is the relative proportion of two minerals; M is the mass; ρ is the density of the mineral; V is the volume of the mineral.
For the same mineral, the density of different superstructures of pyrrhotite can be considered to be approximately equal; hence, ρ1ρ2.
On the other hand, through the grinding process, the particle morphology of granular minerals tends to be round granular, so V 1 V 2 S 1 S 2 . Here, S is a two-dimensional cross-sectional area of a particle, which can be observed and measured using microscopic images.
If the area of each superstructure of a pyrrhotite particle in one sample can be measured, the area ratio can be considered as the ratio between different superstructures. Based on the known total pyrrhotite abundance in the sample, after the ratio of different superstructures is determined, it is possible to calculate the abundance of each superstructure of pyrrhotite in one sample.
After determining the superstructures of particles by their in situ S and Fe contents, image segmentation and computation techniques make it possible to quickly extract certain superstructures of pyrrhotite particles from microscopic images of the samples and calculate the area of the particles. In this study, based on the microscopic images obtained during the analysis of EMPA, the monoclinic pyrrhotite and hexagonal pyrrhotite particles in the images were extracted through image segmentation and processing (Figure 14a,b). The particle area was calculated (Figure 14c,d), and the total particle area is presented (Figure 14e,f).
Using the methods of particle extraction and area calculation, the abundance of pyrrhotite with different superstructures in each product was determined in this study. Overall, for the whole process structure, it was found that monoclinic pyrrhotite and hexagonal pyrrhotite had completely different distribution characteristics throughout the whole process: the monoclinic pyrrhotite was enriched in the copper flotation stage at the start of the process, while the hexagonal pyrrhotite tended to enter the flotation tailings and to become the main sulfur mineral affecting the gravity separation of cassiterite (Figure 15). This is consistent with the previous conclusion that monoclinic pyrrhotite has good floatability, while hexagonal pyrrhotite has poor floatability.
After the monoclinic pyrrhotite with good floatability entered the copper–sulfur mixed concentrate, its floatability was close to that of chalcopyrite. It was activated by chemicals at the same time during the copper–sulfur mixed flotation stage. Therefore, it is difficult to separate chalcopyrite and pyrrhotite with flotation due to their different floatability levels. In this situation, the strong magnetic properties of monoclinic pyrrhotite should be considered, and magnetic separation can be used to optimize the overall environment of copper separation.
The relative densities of pyrrhotite and cassiterite do not show a large difference. At the same time, comparing the particle sizes of pyrrhotite and cassiterite in the Sn rough concentrate, it was found that their particle size distribution ranges were very close, although the pyrrhotite was coarser than the cassiterite. Therefore, after the hexagonal pyrrhotite entered the process of cassiterite gravity separation, the density difference was small, and the gravity separation was difficult. Therefore, high-gradient strong magnetic separation based on the weak magnetism of hexagonal pyrrhotite is a good way to improve the environment of cassiterite separation.

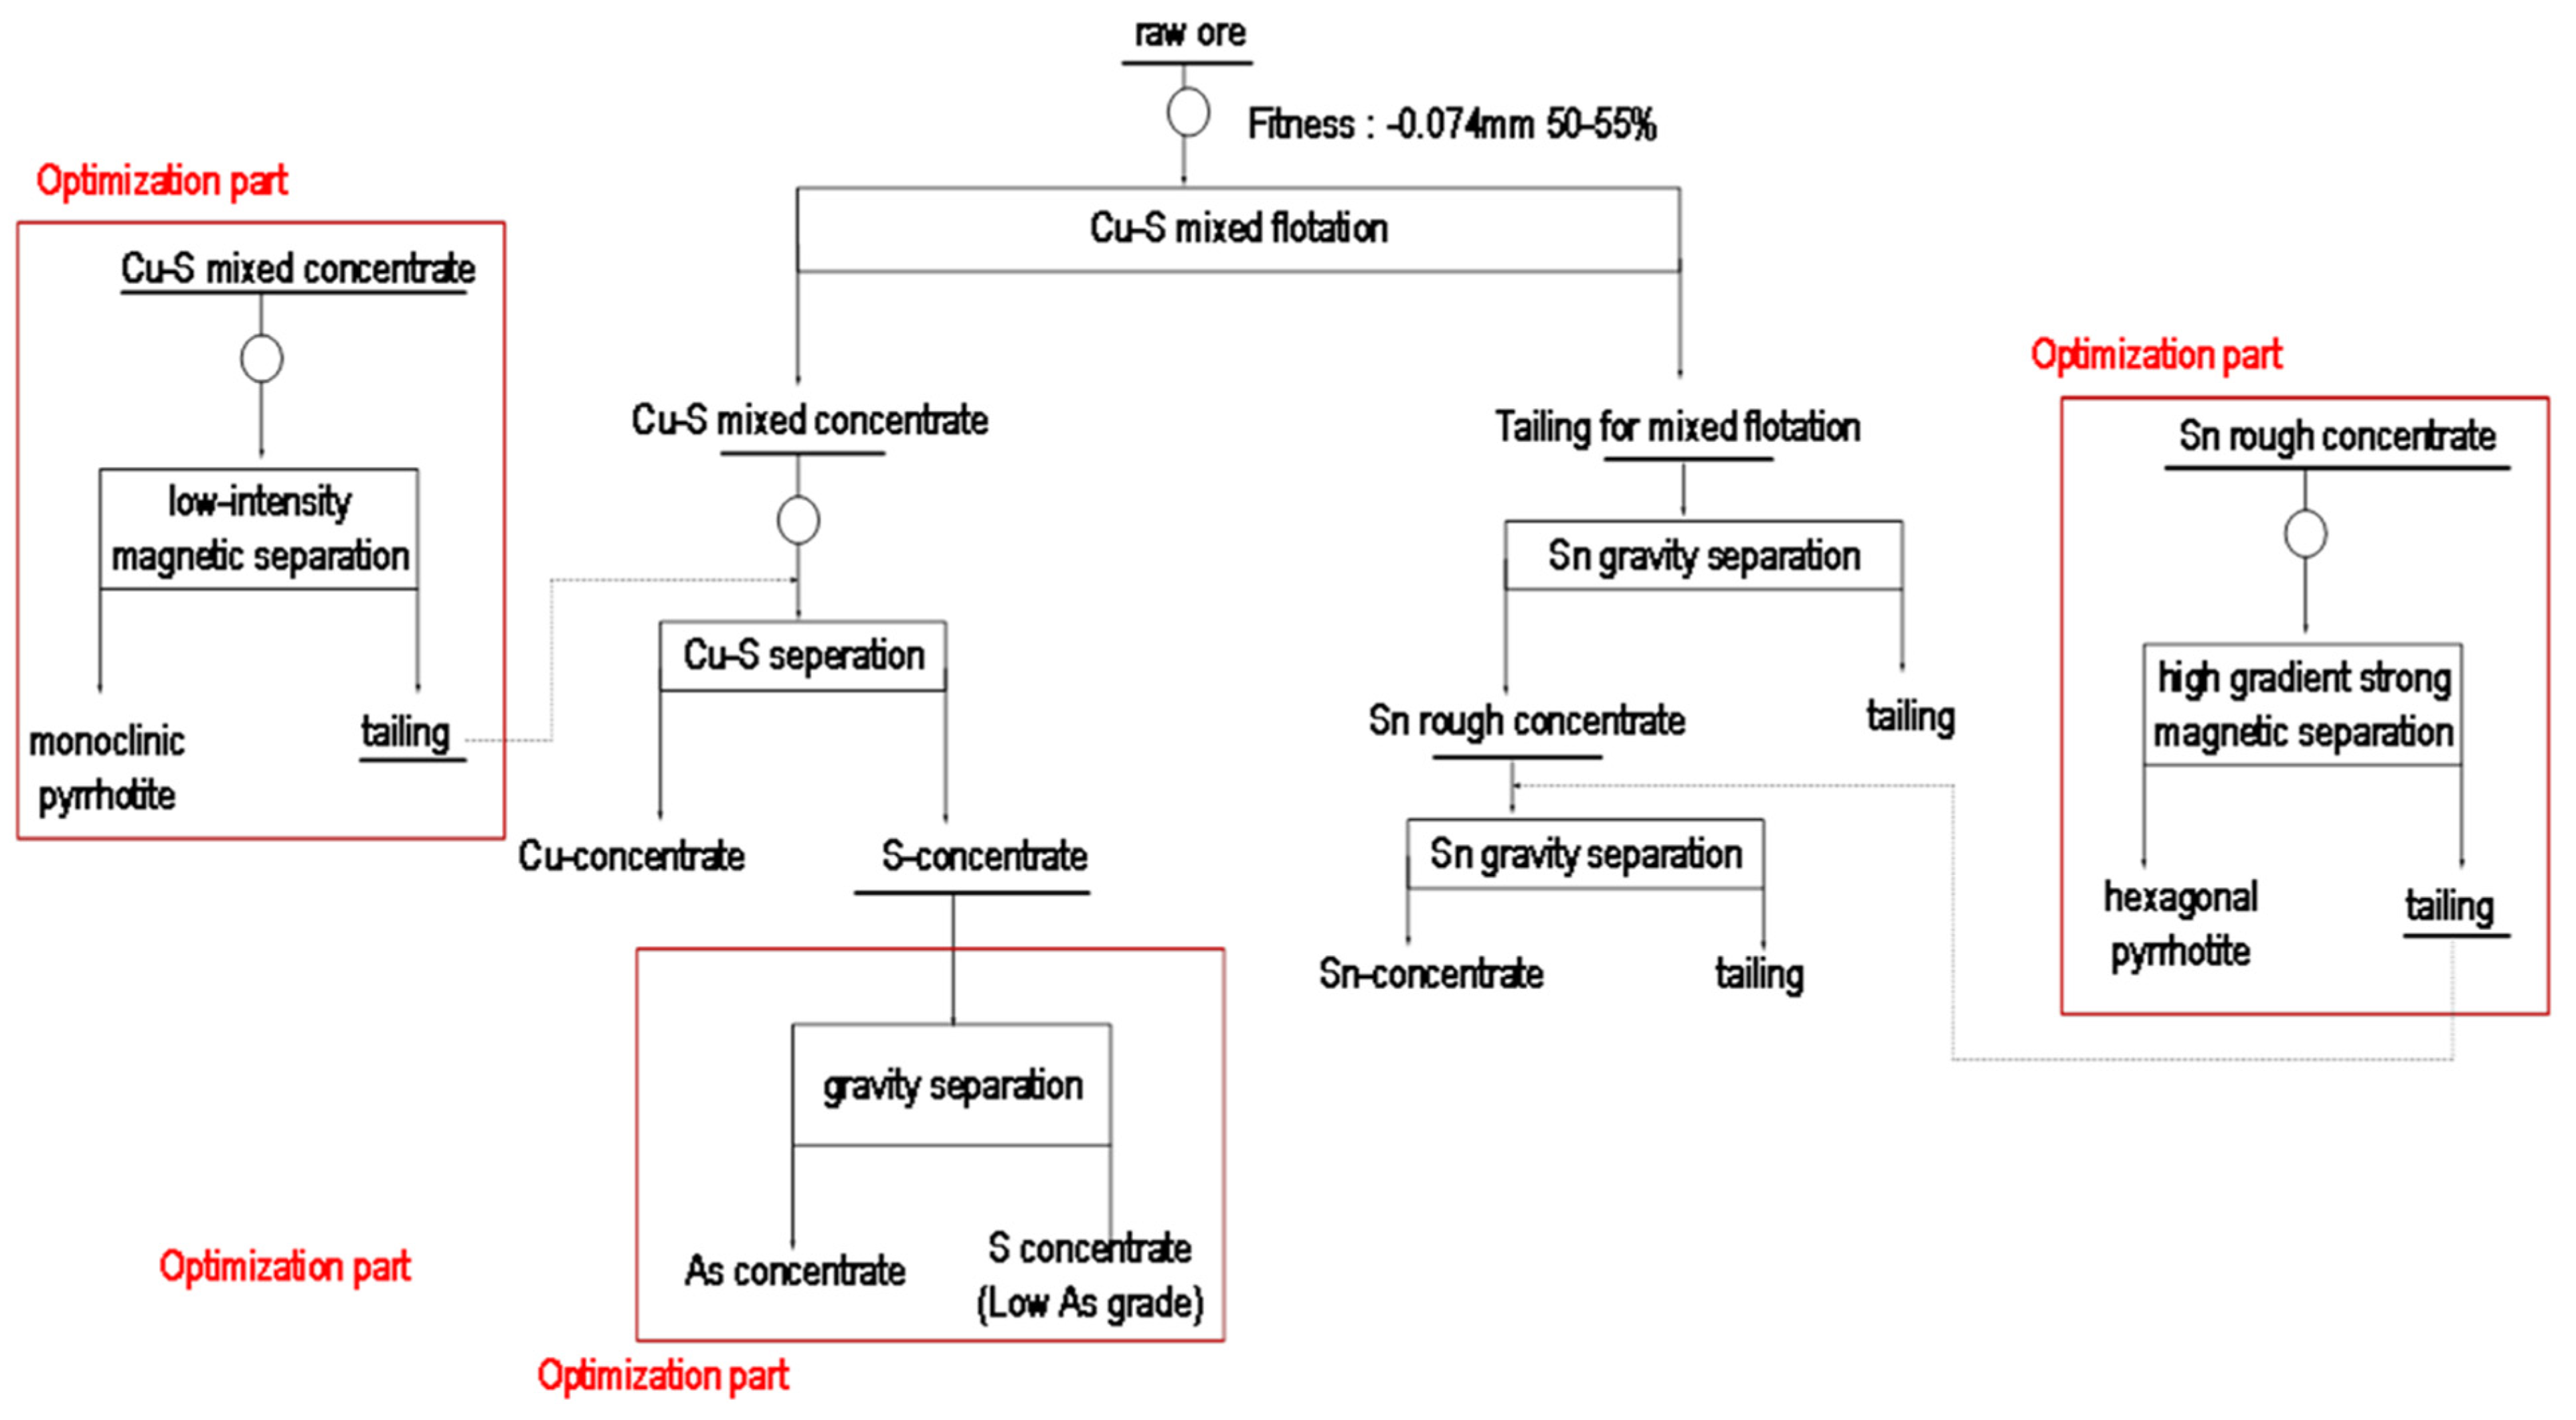
4.4. Optimization Test Results for Mineralogical Evidence Suggestion

Based on this mineralogy study, an optimization test was carried out (Figure 16). A low-intensity magnetic separation was added after the Cu-S mixed flotation to separate the monoclinic pyrrhotite from the Cu-S mixed concentrate. The addition of gravity separation to separate the arsenopyrite from the S concentrate became possible. In addition, a high-gradient strong magnetic separation was added after the first Sn gravity separation to separate the hexagonal pyrrhotite influencing Sn beneficiation.
The optimization test achieved much better results compared to the existing process. After the addition of low-intensity magnetic separation, the copper grade of the copper concentrate was increased from 14.23% to 20.50%, achieving the requirements of a qualified copper concentrate. The As content of the sulfur concentrate was reduced to 0.93%, and an arsenic concentrate with a grade of 46.21% was formed. After the separation of the hexagonal pyrrhotite using high-intensity magnetic separation, the Sn grade in the Sn rough concentrate was increased to 14.35%, and the sulfur content was reduced to 8.62%.

5. Conclusions

For complex polymetallic ores, such as Sn-Cu polymetallic ores, where sulfur and oxygen minerals are closely intergrown and need to be recovered at the same time, the separation technology should not consider a single separation method but should comprise a multi-method composite process mode according to the different properties of the key minerals.
To identify the mineralogical factors causing production problems, this study selected important mineral processing products from different cycles in the whole process of a Sn-Cu polymetallic mine as the research object. Based on the analysis of the liberation degrees and particle size characteristics of the processed minerals, the superstructures and proportions of the key mineral pyrrhotite in each product were studied in detail.
It was found that the trend of different superstructures of pyrrhotite in the process had different characteristics and influenced different elemental contents. The strong magnetic monoclinic pyrrhotite mainly affected the recovery of copper, while the weak magnetic hexagonal pyrrhotite affected the gravity separation of cassiterite. Due to the close floatability of monoclinic pyrrhotite, it was difficult to separate the Cu and S, which resulted in a low Cu grade of Cu concentrate. On the other hand, the small relative gravity difference between the hexagonal pyrrhotite and the tin pyrrhotite resulted in a high S content in the Sn concentrate. In this situation, the removal of monoclinic pyrrhotite by adding low-intensity magnetic separation during the Cu-S separation process and the removal of hexagonal pyrrhotite by adding strong magnetic separation before tin separation can be considered.

Author Contributions

Conceptualization, X.Y. and X.T.; data curation, X.Y.; investigation, X.Y.; writing—original draft, X.Y.; writing—review and editing, X.T. and X.X. All authors have read and agreed to the published version of the manuscript.

Funding

This research received no external funding.

Data Availability Statement

Data are contained within the article.

Conflicts of Interest

The authors declare no conflicts of interest.

References

  1. Abdollahia, M.; Bahramib, A.; Mirmohammadic, S.M.; Kazemid, F.; Daneshe, A.; Ghorbanif, Y. A process mineralogy approach to optimize molybdenite flotation in copper-molybdenum processing plants. Miner. Eng. 2020, 157, 106557. [Google Scholar] [CrossRef]
  2. Wightman, E.; Evans, C. Representing and interpreting the liberation spectrum in a processing context. Miner. Eng. 2014, 61, 121–125. [Google Scholar] [CrossRef]
  3. Can, N.M.; Celik, I.B.; Bicak, O.; Altun, O. Mass balance and quantitative mineralogy studies for circuit modification. Miner. Process. Extr. Metall. Rev. 2013, 34, 348–365. [Google Scholar] [CrossRef]
  4. Ghorbani, Y.; Fitzpatrick, R.; Kinchington, M.; Rollinson, G.; Hegarty, P. A process mineralogy approach to gravity concentration of Tantalum bearing minerals. Minerals 2017, 7, 194. [Google Scholar] [CrossRef]
  5. Rincon, J.; Gaydardzhiev, S.; Stamenov, L. Investigation on the flotation recovery of copper sulfosalts through an integrated mineralogical approach. Miner. Eng. 2019, 130, 36–47. [Google Scholar] [CrossRef]
  6. Tungpalan, K.; Wightman, E.; Manlapig, E. Relating mineralogical and textural characteristics to flotation behaviour. Miner. Eng. 2015, 82, 136–140. [Google Scholar] [CrossRef]
  7. Li, H.; Yang, C.; Tian, Z.; Wu, C.; Qin, W. Cassiterite beneficiation in China: A mini-review. J. Cent. South Univ. 2023, 30, 1–19. [Google Scholar] [CrossRef]
  8. Bulatovic, S.; De Silvio, E. Process development for impurity removal from a tin gravity concentrate. Miner. Eng. 2000, 13, 871–879. [Google Scholar] [CrossRef]
  9. Angadi, S.I.; Sreenivas, T.; Jeon, H.S.; Baek, S.H.; Mishra, B.K. A review of cassiterite beneficiation fundamentals and plant practices. Miner. Eng. 2015, 70, 178–200. [Google Scholar] [CrossRef]
  10. Tomance, R.; Blagojev, M. Quantifying mineral liberation—A conventional and new automatic sophisticated techniques approach. J. Pol. Miner. Eng. Soc. 2020, 2, 211–216. [Google Scholar] [CrossRef]
  11. Kelebek, S.; Tukel, C.J. Separation of nickeliferous hexagonal pyrrhotite from pentlandite in Ni-Cu sulphide ores: Recovery by size performance. Miner. Eng. 2018, 125, 223–230. [Google Scholar] [CrossRef]
  12. Belzile, N.; Chen, Y.W.; Cai, M.F.; Li, Y. A review on pyrrhotite oxidation. J. Geochem. Explor. 2004, 84, 65–76. [Google Scholar] [CrossRef]
  13. Gordon, S.C.; McDonald, A.M. A study of the composition, distribution, and genesis of pyrrhotite in the copper cliff offset, sudbury, Ontario, Canada. Can. Mineral. 2015, 53, 859–878. [Google Scholar] [CrossRef]
  14. Becker, M.; De Villiers, J.; Bradshaw, D. The mineralogy and crystallography of pyrrhotite from selected nickel and PGE ore deposits. Econ. Geol. 2010, 105, 1025–1037. [Google Scholar] [CrossRef]
  15. Becker, M.; Bradshaw, D.; De Villiers, J. The mineralogy of pyrrhotite from Sudbury CCN and Phoenix nickel ores and its effect on flotation performance. Can. Metall. Q. 2011, 50, 10–19. [Google Scholar] [CrossRef]
  16. Becker, M.; De Villiers, J.; Bradshaw, D.J.M.E. The flotation of magnetic and non-magnetic pyrrhotite from selected nickel ore deposits. Miner. Eng. 2010, 23, 1045–1052. [Google Scholar] [CrossRef]
  17. Schrader, D.L.; Davidson, J.; McCoy, T.J.; Zega, T.J.; Russell, S.S.; Domanik, K.J.; King, A.J. The Fe/S ratio of pyrrhotite group sulfides in chondrites: An indicator of oxidation and implications for return samples from asteroids Ryugu and Bennu. Geochim. Cosmochim. Acta. 2021, 303, 66–91. [Google Scholar] [CrossRef]
  18. Haines, G.L.; Carpenter, M. Magnetoelastic coupling associated with vacancy ordering and ferrimagnetism in natural pyrrhotite, Fe7S8. J. Phys. Condens. Matter. 2020, 32, 385401. [Google Scholar] [CrossRef]
  19. de Villiers, J.P.; Liles, D.C. The crystal-structure and vacancy distribution in 6 C pyrrhotite. Am. Mineral. 2010, 95, 148–152. [Google Scholar] [CrossRef]
  20. Multani, R.S.; Waters, K.E. A review of the physicochemical properties and flotation of pyrrhotite superstructures (4C–Fe7S8/5C–Fe9S10) in Ni-Cu sulphide mineral processing. Can. J. Che. Eng. 2018, 96, 1185–1206. [Google Scholar] [CrossRef]
  21. Wang, H.; Salveson, I. A review on the mineral chemistry of the non-stoichiometric iron sulphide, Fe1-x S (0 ≤ x ≤ 0.125): Polymorphs, phase relations and transitions, electronic and magnetic structures. Phase Transit. 2005, 78, 547–567. [Google Scholar] [CrossRef]
  22. Janzen, M.P.; Nicholson, R.V.; Scharer, J.M. Pyrrhotite reaction kinetics: Reaction rates for oxidation by oxygen, ferric iron, and for nonoxidative dissolution. Geochim. Cosmochim. Acta. 2000, 64, 1511–1522. [Google Scholar] [CrossRef]
  23. Multani, R.S.; Waters, K.E. Flotation recovery–by–size comparison of pyrrhotite superstructures with and without depressants. Miner. Eng. 2019, 130, 92–100. [Google Scholar] [CrossRef]
Figure 1. Flowchart of flotation–gravitation process used in the plant.
Minerals 14 00554 g001
Figure 2. XRD of Cu-S concentrate.
Minerals 14 00554 g002
Figure 3. Mineral size distributions of chalcopyrite, pyrrhotite, pyrite, and arsenopyrite in Cu-S mixed concentrate.
Minerals 14 00554 g003
Figure 4. Liberation and association of chalcopyrite, pyrrhotite, pyrite, and arsenopyrite in Cu-S mixed concentrate.
Minerals 14 00554 g004
Figure 5. XRD of S concentrate.
Minerals 14 00554 g005
Figure 6. Mineral size distributions of pyrrhotite, pyrite, and arsenopyrite in S concentrate.
Minerals 14 00554 g006
Figure 7. Liberations and associations of pyrrhotite, pyrite, and arsenopyrite in S concentrate.
Minerals 14 00554 g007
Figure 8. XRD results of Sn rough concentrate.
Minerals 14 00554 g008
Figure 9. Mineral size distribution of pyrrhotite and cassiterite in Sn rough concentrate.
Minerals 14 00554 g009
Figure 10. Liberation and association of pyrrhotite and cassiterite in Sn rough concentrate.
Minerals 14 00554 g010
Figure 11. Mineral abundance of the top three minerals in the different samples.
Minerals 14 00554 g011
Figure 12. Elemental contents and chemical formulates of pyrrhotite in different samples.
Minerals 14 00554 g012
Figure 13. XRD characteristic peaks of pyrrhotite with different superstructures. (a) Characteristic double peak of XRD results of Cu-S concentrate; (b) characteristic double peak of XRD results of S concentrate; (c) characteristic double peak of XRD results of Sn rough concentrate.
Minerals 14 00554 g013aMinerals 14 00554 g013b
Figure 14. Pyrrhotite classification and area calculation steps. (a,b) EPMA analysis for different particle to know Fe and S content; (c,d) separate pyrrhotite with monoclinic and hexagonal with different color by image segmentation and computation techniques; (e,f) calculate the particle area for two group by computation auto calculation techniques; (g,h) result show back to SEM image.4.4. Distribution Characteristics of Different Superstructures of Pyrrhotite in the Whole Process and Their Effects on Process Optimization.
Minerals 14 00554 g014
Figure 15. Distribution characteristics of different superstructures of pyrrhotite during the process.
Minerals 14 00554 g015
Figure 16. Flowchart of optimization test.
Minerals 14 00554 g016
Table 1. Chemical composition of Cu-S mixed concentrate (%).
ElementCuSnSFeBiAs
Content, %3.620.1337.1647.070.212.97
ElementSiO2CaOMgOAl2O3K2ONa2O
Content, %3.721.070.670.650.230.56
Table 2. Results of model mineral for Cu-S mixed concentrate (%).
MineralContent (%)MineralContent (%)
Pyrrhotite39.05Dolomite0.88
Pyrite31.83Hornblende0.72
Arsenopyrite6.58Calcite0.64
Chalcopyrite9.90Chlorite0.52
Tetrahedrite0.23Muscovite0.50
Covellite0.15Essonite0.42
Cassiterite0.17Limonite0.27
Siderite2.07Andradite0.27
Albite2.11Sphene0.17
Quartz1.11Hematite0.14
K-feldspar1.01Others0.35
Diopside0.90
Table 3. Elemental contents of pyrrhotite in Cu-S mixed concentrate (mass percent, %).
FeS FeS FeS FeS FeS
160.1539.421160.1739.522160.2539.343160.1639.474161.4638.22
260.2239.761260.1939.262260.2439.343260.3439.114261.2838.18
360.3639.491360.3539.172360.1339.463360.2339.234361.4338.35
460.1739.261460.4239.142460.3439.573460.4539.174461.7438.19
560.2339.021560.2839.532560.2339.163561.2338.424561.3338.23
660.3439.381660.3439.312660.4539.213661.3638.374661.6338.25
760.2639.551760.1339.232760.2339.223761.4238.154761.2938.23
860.3539.611860.2639.582860.5639.123861.2338.534861.1838.26
960.3439.111960.6439.292960.1539.443961.3238.454961.6738.27
1060.4339.152060.6639.153060.6739.124061.4538.435061.6538.27
Table 4. Chemical composition of S concentrate (%).
ElementFeSSnCuBiAs
Content (%)45.9539.490.460.920.0896.84
ElementSiO2CaOMgOAl2O3K2ONa2O
Content (%)3.950.620.460.380.11<0.005
Table 5. Results of model minerals of S concentrate (%).
MineralContent (%)MineralContent (%)
Pyrite38.53Chlorite0.54
Arsenopyrite14.86Hematite0.48
Pyrrhotite35.23Diopside0.37
Chalcopyrite1.43Andradite0.35
Cassiterite0.51Sphene0.34
Stannite0.22Essonite0.25
Quartz2.09Calcite0.18
Siderite1.58K-feldspar0.15
Albite0.98Muscovite0.12
Dolomite0.89Others0.16
Hornblende0.74
Table 6. Elemental contents of pyrrhotite in S concentrate (mass percent, %).
FeS FeS FeS FeS FeS
160.1839.591160.2139.372160.8739.083161.0238.924160.9238.83
260.1239.531260.2239.372260.8939.073261.0538.924261.0238.87
360.1839.561360.3339.422360.8639.053361.0538.924361.0238.87
460.2639.581460.2139.342460.9139.033460.8838.814460.9838.84
560.2339.561560.2239.342560.9239.013560.9638.864560.9138.79
660.2939.551660.2739.362660.9138.973661.0438.914660.9238.75
760.3939.581760.1139.242761.0138.953761.0438.914761.0338.79
860.1339.391860.1739.252861.0238.943861.0438.914860.9838.73
960.3539.481960.4239.392961.0238.943961.0138.894961.0838.72
1060.2239.392060.1539.213061.0238.934061.0138.895061.2438.71
Table 7. Chemical composition of Sn rough concentrate (%).
ElementFeSSnCuBiAs
Content (%)45.9539.490.460.920.0896.84
ElementSiO2CaOMgOAl2O3K2ONa2O
Content (%)3.950.620.460.380.11<0.005
Table 8. Results of model minerals of Sn rough concentrate (%).
MineralContent (%)MineralContent (%)
Pyrrhotite60.56Albite1.18
Pyrite7.35Quartz1.04
Arsenopyrite3.11Chlorite0.89
Chalcopyrite1.17Muscovite0.58
Cassiterite5.12K-feldspar0.54
Stannite0.22Dolomite0.32
Essonite6.98Hornblende0.31
Calcite3.48Sphene0.31
Diopside3.18Hematite0.21
Andradite1.83Others0.28
Siderite1.34
Table 9. Elemental contents of pyrrhotite in Sn rough concentrate (mass percent, %).
FeS FeS FeS FeS FeS
160.3339.651160.9439.022160.9238.893161.0338.894160.9738.71
260.1539.411260.9539.022261.0238.953261.0238.874261.0238.73
360.0739.341360.9138.972361.0438.963361.0238.824361.0738.76
460.2339.391460.8238.892461.0138.943461.0238.824461.0738.75
560.3539.431560.9838.992561.0138.923560.9138.754560.9838.69
660.2939.381660.9438.942661.0238.913660.9638.784660.9838.69
760.2739.331760.9638.952761.0438.923761.0838.854760.9938.68
860.8739.071860.8738.892861.0338.913860.9338.754861.0938.65
960.9139.021961.0238.962960.9738.873961.0438.814961.0238.46
1060.9339.022060.9538.913060.9238.834060.9638.725061.0338.46
Disclaimer/Publisher’s Note: The statements, opinions and data contained in all publications are solely those of the individual author(s) and contributor(s) and not of MDPI and/or the editor(s). MDPI and/or the editor(s) disclaim responsibility for any injury to people or property resulting from any ideas, methods, instructions or products referred to in the content.

