Article

Geochemical Signature and Risk Assessment of Potential Toxic Elements in Intensively Cultivated Soils of South-West Punjab, India

Department of Environmental Science and Technology, Central University of Punjab, V.P.O. Ghudda, Bathinda 151401, India
*
Author to whom correspondence should be addressed.
Minerals 2024, 14(6), 576; https://doi.org/10.3390/min14060576
Submission received: 1 April 2024 / Revised: 27 May 2024 / Accepted: 27 May 2024 / Published: 30 May 2024

Abstract

:
Soil contamination with potentially toxic elements (PTEs) in the Malwa region belt of Punjab, India, can be a serious concern as a result of intensive agricultural practices and overuse of agrochemicals. The main objectives of the present study were to evaluate the spatial distribution, geochemical signature, and contamination level/health risk of PTEs in 76 soil samples (0–10 cm) collected from the three districts viz. Muktar, Faridkot, and Moga of Punjab, India. The result shows that PTEs concentrations vary widely in the region, with Fe and Mn distribution patterns being mostly coherent with each other. When compared to the Indian natural soil background values, the average concentration of Pb and Zn were higher than the limit, only Pb exceeded the average values of the world background and upper continental crust (UCC). Spatial autocorrelation plotted with a local indicator of spatial association (LISA) in GeoDa software version 1.18 was used to identify hotspots. A positive spatial autocorrelation (>0.2) was indicated with Moran’s I values for Pb, V, Mn, Cu, and Cr, being highest for Pb. A principal component analysis (PCA) identified the major geo-chemical patterns of Fe-Al-V-Cr and TOC-Mn-Zn-HCO3, which were positively loaded on PC1. This indicates that Fe/Al-oxyhydroxides and organic matter play a dominant role in controlling metal mobility in soils. This can be further substantiated with the Spearman’s rank correlation values. The contamination factor (CF) indicates that only Pb and Zn (15.7% and 3.9% samples, respectively) were under high risk. This could be due to the excessive application of chemical fertilizers. The large range of degree of contamination (Cdeg) values suggests that there are variations in the degree of soil pollution due to PTEs. A little over 3.9% of samples had significant contamination, compared to 72.3% of samples with low contamination and 23.6% of samples with moderate contamination. Human non-carcinogenic and carcinogenic risk levels were investigated. The hazard index (HI) values for adult ranged from 0.00 to 0.2, and values for children ranged from 0.009 to 1.2. These findings suggest that both children and adults are not at potential risk, except in a few locations. Overall, the results of this study provide the current baseline status of toxic elements in agricultural soil. This would be helpful for developing strategies for sustainable management of the soil resources in the region, as well as for future monitoring programs of the soil quality in the Malwa region as a whole, to track any changes in the contamination levels over time.

Graphical Abstract

1. Introduction

Contamination of agricultural soil with potentially toxic elements (PTEs) has been reported from many parts of the world and poses a risk to both human and animal health [1,2,3,4,5]. Due to their ability to bind to a variety of substances, soil particles can be thought of as a significant sink for pollutants that may come from a variety of anthropogenic and natural sources [5,6,7,8]. In the last few decades, growing populations and our evolving way of life have led to increased food consumption, placing an immense strain on soil resources [9,10,11]. For instance, to ensure global food security by 2050, food production must rise by up to 70% [7,12]. To meet this demand, agricultural practices have become more intensive, leading to increased use of pesticides, fertilizers, and other chemicals [13,14,15,16]. Consequently, significant volumes of these fertilizers, including nitrogen (N), phosphorus (P), potassium (K), and compound/mixed variants, are regularly applied to agricultural soils to ensure adequate macronutrient supply [6,17]. It was estimated that in 2019, over 220 million tons (MT) of commercial fertilizers and liming materials were utilized worldwide, predominantly in agricultural landscapes [18,19]. In terms of overall fertilizer consumption, India is the leading country in the South Asian Association of Regional Cooperation (SAARC) and the world’s second-largest consumer of fertilizer [20]. In the fiscal year 2019–2020, the total consumption of nutrients (N + P2O5 + K2O) amounted to 28.97 MT, with nitrogen (N), phosphorus pentoxide (P2O5), and potassium oxide (K2O) individually consumed at 18.86 MT, 7.46 MT, and 2.64 MT, respectively [21]. A variety of fertilizer products are currently employed to cultivate crops and meet the growing demand for food. Urea, ammonium sulphate (AS)/ammonium chloride (ACl), diammonium phosphate (DAP), single superphosphate (SSP), and muriate of potash (MoP), as well as NP/NPK complex fertilizers, are predominant in the Indian market [21]. The prevalence of chemical fertilizers in India’s agricultural practices is indeed significant, aiding in meeting the nation’s food demands. However, this can also lead to soil contamination as a significant amount of PTEs has been reported in different fertilizers worldwide [21,22,23,24]. Concentrations of Cd, Pb, Cu, and Zn at 0.1 to 170 mg/kg, 1 to 300 mg/kg, 7 to 225 mg/kg, and 50 to 1450 mg/kg were reported in P fertilizers [22]. Whereas, Cd, Pb, Cu, and Zn ranged from 0.05 to 8.5 mg/kg, 1 to 15 mg/kg, 2 to 1450 mg/kg, and 1 to 42 mg/kg in N fertilizers, respectively [22]. However, this reliance results in the accumulation of PTEs such as arsenic (As), copper (Cu), lead (Pb), manganese (Mn), chromium (Cr), mercury (Hg), cobalt (Co), vanadium (V), nickel (Ni), fluoride (F), cadmium (Cd), selenium (Se), molybdenum (Mo), iron (Fe), and zinc (Zn) in the soil [24,25,26]. While these substances are necessary for many biological processes in moderation, high concentrations can be harmful to biological systems [27,28,29]. Their toxicity, persistence, and lack of natural degradation make them major threats to human health and the environment [30,31,32,33,34]. Furthermore, the accumulation of PTEs in soil is identified as detrimental to soil fertility, plant growth, and overall ecosystem functioning [29,35,36,37]. This accumulation poses a risk as these elements have the potential to accumulate in plants and subsequently move up the food chain [8,38,39,40].
The scale of soil degradation in India, estimated by the National Bureau of Soil Survey and Land Use Planning, is staggering, with approximately 30% of the country soil classified as degraded [41]. The majority of Indian states are severely impacted by soil degradation; the worst-affected states are Punjab, Haryana, Gujarat, Maharashtra, Andhra Pradesh, and Telangana [28,35,41,42,43]. It is believed that intensive farming methods, extensive use of chemicals and fertilizers, and inadequate irrigation management are some of the causes of soil degradation in these states. To maintain sustainable land use practices, preserve agricultural productivity, and protect the livelihoods of millions of people in India, this widespread soil degradation must be addressed [2,44].
Punjab is referred to as the “Granary of India” [45] because it supplies a majority of the food in the country [46]. Agriculture is the primary occupation for the state population. Approximately 35.45% of wheat and 25.53% of rice produced in 2018–2019 came from Punjab, India, according to the statistical abstract report for 2021 [46]. Even though Punjab makes up 1.53% total land area of India, the majority of the cropped area is made up of wheat and rice. The fertilizer consumption of Punjab state is significantly higher (247 kg/ha) as compared to the Indian (165.8 kg/ha) and world average (140.5 kg/ha) [47,48]. In Punjab soil, PTEs concentrations varied from 154 to 422.1 mg/kg, 0.4 to 118 mg/kg, 0.4 to 58.1 mg/kg, 0.1 to 19.2 mg/kg, 3.9 to 27.9 mg/kg, 0.1 to 30 mg/kg, BDL to 75.7 mg/kg, and 0.1 to 98.1 mg/kg for Mn, Pb, Cu, Co, Ni, Cd, Cr, and Zn, respectively [46]. The majority of the PTE concentrations were under the limit with the exception of Cd and Pb at some places in the agricultural soil of Punjab [45,46,49,50,51,52], particularly in districts like Faridkot, Moga, and Muktsar, where 92%, 89%, and 90% of the area is under agriculture. These districts, renowned for their agricultural productivity, face heightened risks due to intensive farming practices, industrial activities, and urbanization. In addition to promoting economic development and growth, the interaction of these variables has resulted in contamination of PTEs in the soil. Since the dawn of civilization, the study area is one of the areas that has seen extensive agriculture. There has not been much in-depth research conducted on the potentially toxic element contamination in the soil, and there is a lack of health risk evaluation in the area under study. However, other research emphasizes the negative impacts of PTEs on soil quality, agricultural productivity, and human health in soil samples taken from different parts of Punjab [45,50,51,52,53]. There may indeed be a lack of specific studies focusing on soil contamination with PTEs in the selected region of Punjab. In light of these challenges, understanding the distribution, concentration, and ecological effects of PTEs in the soil of the Faridkot, Moga, and Muktsar districts is of paramount importance. Thus, the current study was initially carried out to evaluate the elements (As, Cu, Pb, Cr, V, Ni, Fe, and Zn) that may be hazardous in agricultural soils of selected districts of Punjab. Afterwards, we determine the relationship between PTEs and other soil quality parameters by using principal component analysis (PCA) and correlation analysis. Finally, a variety of pollution indices are used to determine the level of pollution and assess health risk. Such understanding forms the foundation for devising effective mitigation strategies aimed at safeguarding environmental and human well-being. By unraveling the complexities of soil contamination and its ecological ramifications, stakeholders can work towards sustainable land management practices that ensure the continued prosperity of Punjab agricultural landscapes while preserving the health of its ecosystems and communities.

2. Materials and Methods

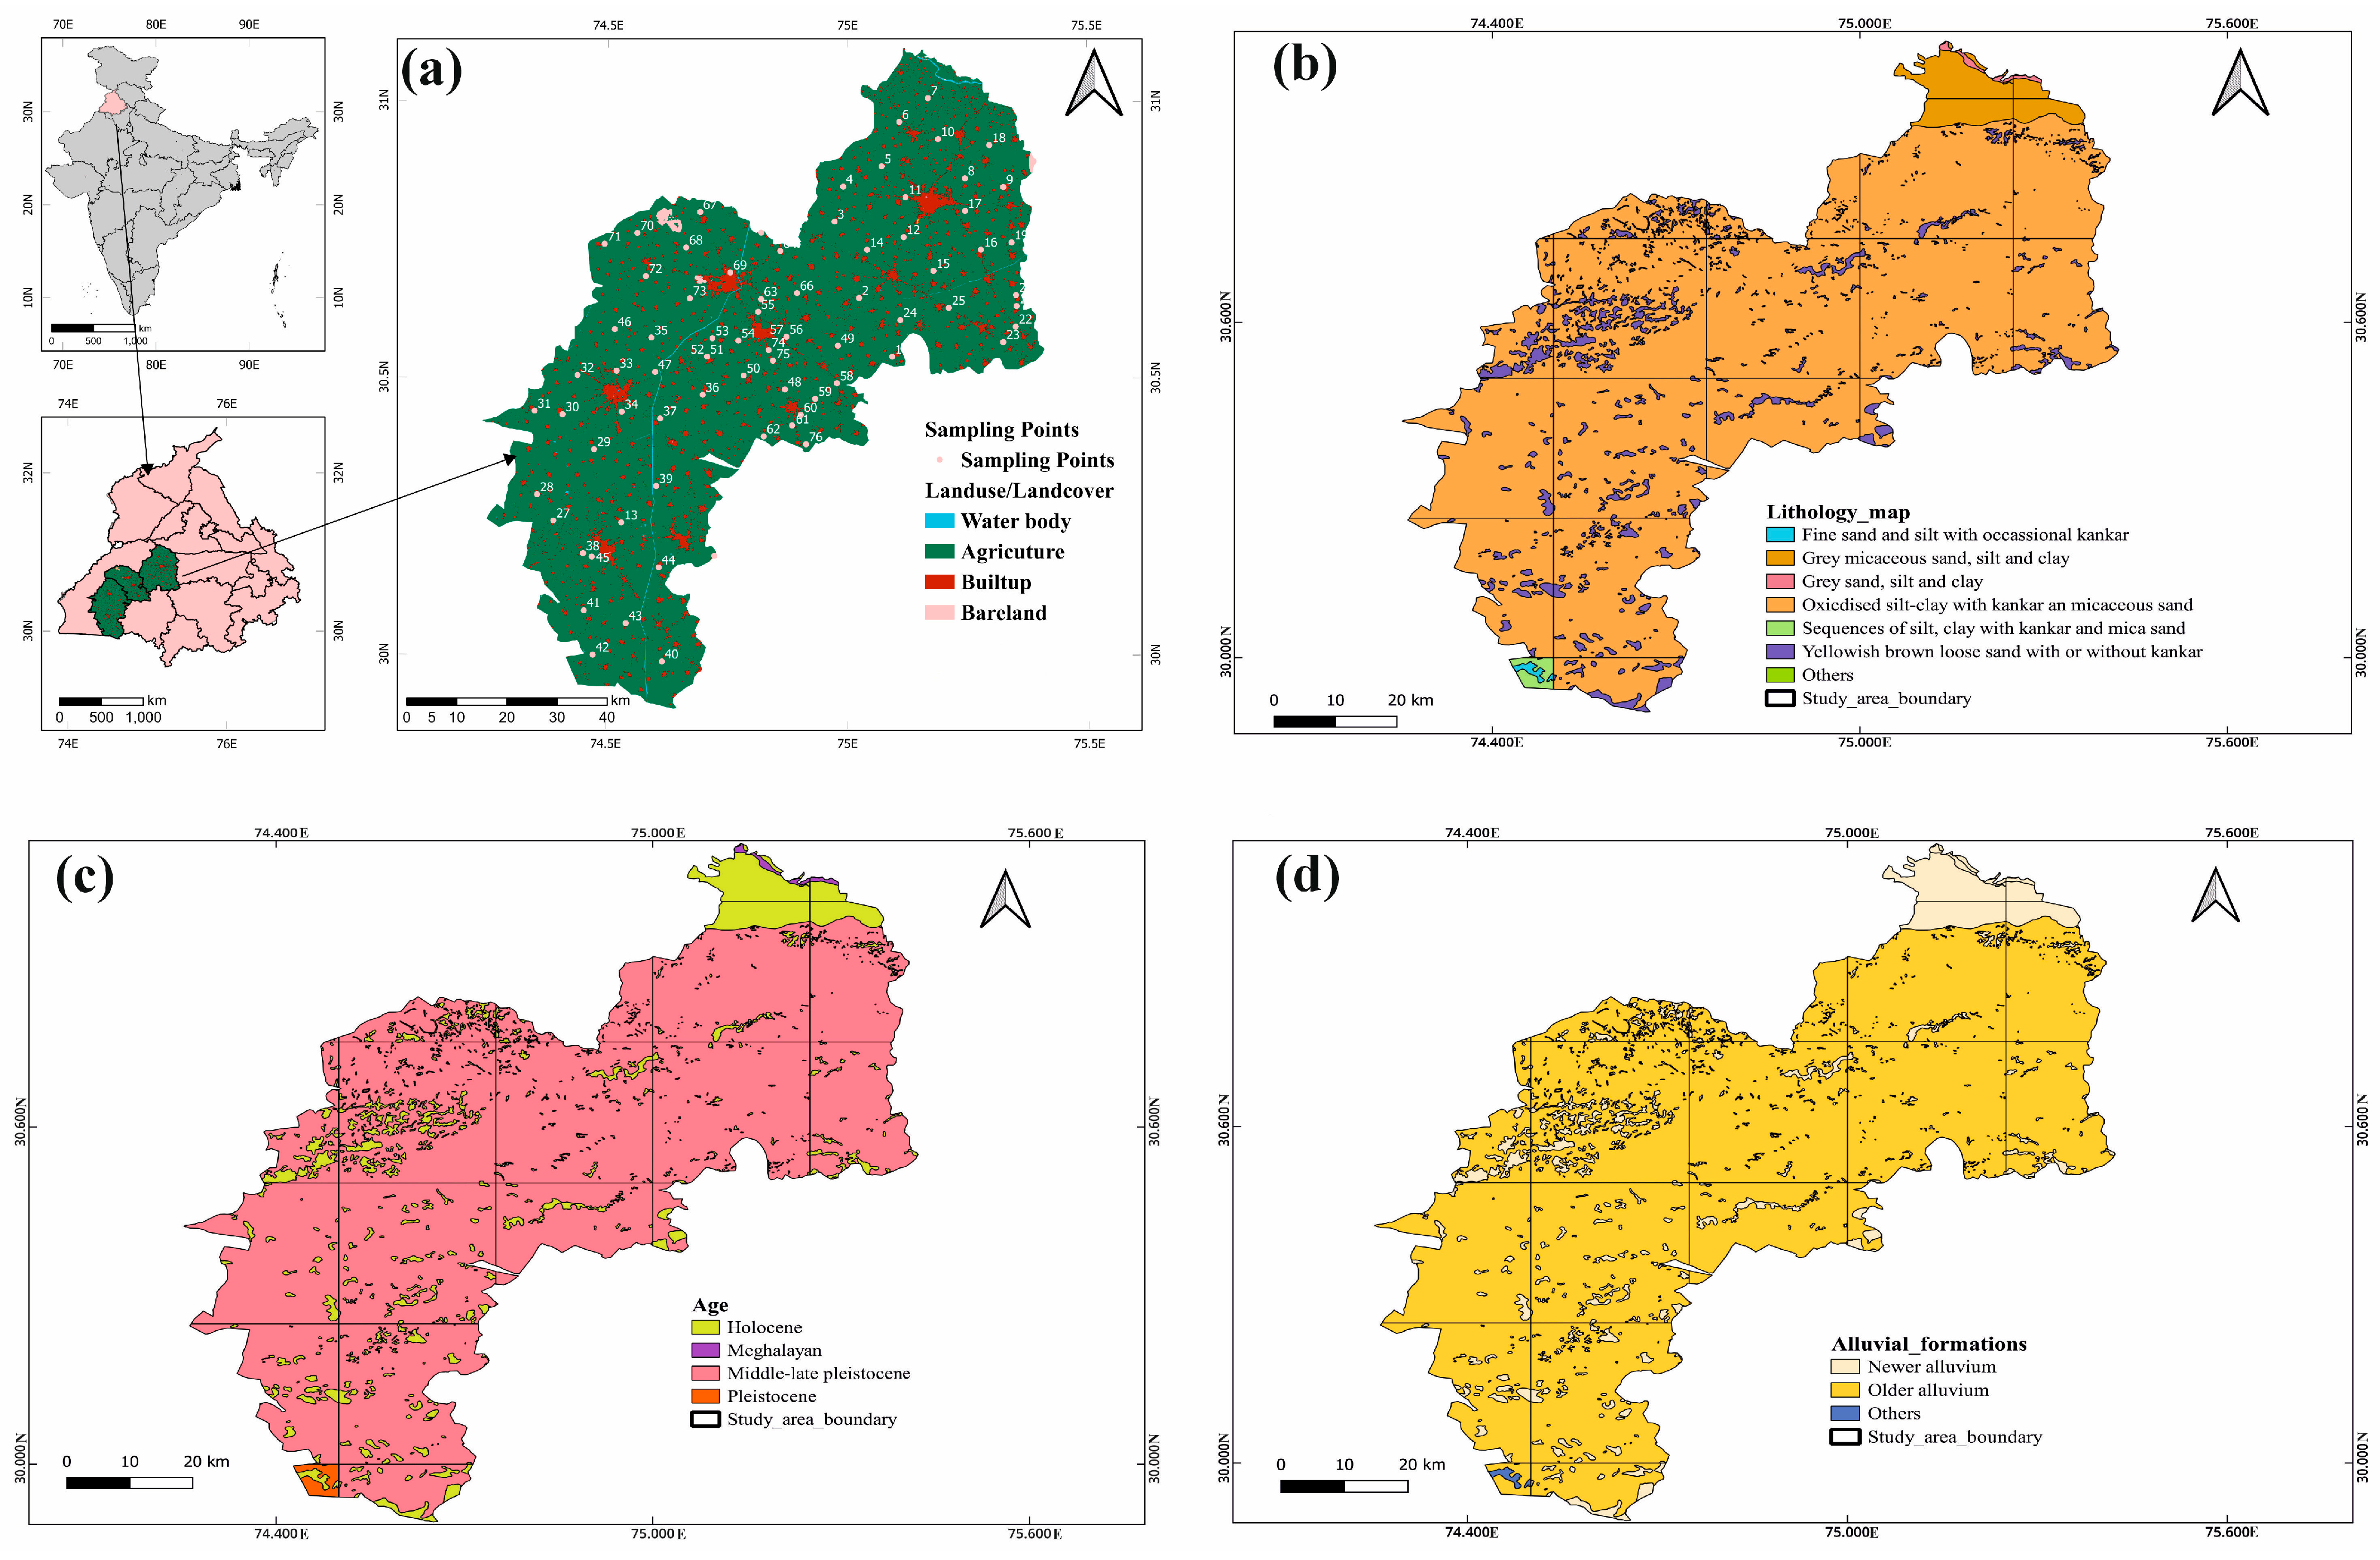
2.1. Study Area Description

The study area, located in southwestern Punjab, India, encompasses three districts, Muktsar, Faridkot, and Moga (Figure 1), situated on the Indo–Gangetic alluvial plain within the western part of the Sutlej basin; the region is primarily agricultural. The landuse/landcover (LULC) map depicts how most of the area was dominated with agriculture followed by built-up area and then bare land (Figure 1a). The climate of southwestern Punjab is hot, dry (average annual rainfall 420 mm), and arid with scorching summers and cold winters [54,55,56]. The elevation of the study area ranged between 191 and 204 msl. Geologically, the region’s lithology is primarily composed of grey micaceous sand, silt, clay, oxidized silt–clay with kankar, and micaceous sand, with patches of yellowish-brown loose sand with or without kankar (Figure 1b). Geological formations consist of thick sequences of Quaternary deposits ranging from the mid-Pleistocene to the Recent age (Figure 1c). Moga is notable for having the highest annual rainfall as compared to Faridkot and Muktsar. Alluvial plains and sand dunes make up its terrain, which is primarily made up of desert and sierogem soil in Muktsar and Moga, whereas Faridkot is distinguished by sandy loam soil and alluvium. The principal aquifer in the study area is the alluvium, with an older alluvium and newer alluvium serving as major aquifers (Figure 1d). Various minerals are found in the region, including feldspars, quartz, muscovite, amphibole, biotite, anhydrite (gypsum), fluorite, kaolinite, and chlorite, contributing to the geological diversity of the area [54,55,56].

2.2. Collection of Soil Samples

A total of 76 soil samples were collected from the districts of Muktsar, Faridkot, and Moga during the year 2022–2024 covering a total area of 6221 km2. Dry fly ash and bottom fly samples were also collected from the coal-based thermal power plant situated in Punjab, India. The sampling sites were mapped using QGIS 3.28 software (Figure 1a) with one sample per grid (8 × 8 km2). Using a stainless-steel auger, soil samples were taken from agricultural fields at a depth of 0 to 10 cm. From each sampling location, about 1 kg of soil was gathered and brought to the lab in double-zip plastic bags that had been previously cleaned with ethanol and double-distilled water. Moreover, soil samples were sieved through a mesh with pore sizes of 2 mm after being air-dried at ambient temperature. After that samples were kept in fresh polythene bags for further analysis.

2.3. Analysis of Soil Physicochemical Properties

Soil pH and electrical conductivity (EC) were assessed in 1:5 soil: water suspension through the IS method [58,59]. The mixture was shaken for 2 h, and the supernatant was filtered and used for measurement. Total organic carbon (TOC) content was determined using the Walkley–Black rapid titration method [60]. Available phosphorus levels were examined utilizing the Olsen method and measured using a spectrophotometer [61].

2.4. Analysis of PTEs in Soil

A total of 10 elements, comprising PTEs (Zn, Cu, Pb, Ni, Cr, Al, As, Fe, Mn, and V), were determined using MP-AES (Agilent 4210, Agilent Technologies, Mulgrave, Victoria, Australia). Prior to analysis, soil and ash samples were acid-digested using reversed aqua regia (1:3 v/v; HCl: HNO3 (USEPA 3052)) in a microwave digester (Milestone Ethos Easy) [50]. Following the process of digestion, samples were diluted and filtered using PTFE syringe filters with a pore size of 0.45 μm before being injected into the instrument. Quality control measures for MP-AES data included the analysis of duplicate samples and certified reference materials (CRMs: GBM303-4, MRGeo08). The obtained data showed a high degree of consistency with mentioned CRMs. The Relative Standard Deviation (% RSD) was used to ensure the precision, and it varied within ±10% for most of the elements.

2.5. Statistical and Geospatial Analysis of Data

Descriptive statistics such as minimum (min), maximum (max), average, and standard deviation (SD), and multivariate statistical analyses such as PCA and Spearman’s rank correlation, were performed using R software, version 4.2.3. Before performing the PCA, the raw data for each parameter were transformed using the centered log ratio (CLR) method in order to ensure data consistency and reliability and to minimize closure issues [4] using Equation (1) [62] provided below.
C L R x = ( log x 1 / g x , log ( x 1 / g x ) ) ,   log x N / g x
Using CLR-PCA, the original variables are changed into principal components (PCs), which are new, uncorrelated variables. Using QGIS (version 3.28) software Kriging interpolation tools, the spatial distribution of several parameters was plotted. The geographical correlation between those parameters is shown in the geospatial plots. The spatial autocorrelation and (Moran’s Index) and Local Indicator of Spatial Association (LISA), along with their z-score and p-value, were calculated using GeoDa 1.18 software [63].

2.6. Soil Pollution Indices Calculation

2.6.1. Contamination Factor

The contamination factor (CF) was utilized as a method to evaluate the pollution potential of specific elements present in soils [64]. It was determined using Equation (2) [65].
C F = C m e t a l C c o n t r o l
Here, ‘Cmetal’ represents the concentration of PTEs in the contaminated samples, while ‘Ccontrol represents the concentration of PTEs in background samples. A regional control value derived from Indian natural background soils [66,67] was used in this study. For As, the world background soil value [68] was used, as this element was absent in the Indian reference values. The degree of contamination is then categorized based on the ‘CF’ values provided in Supplementary Table S1 [69].

2.6.2. Degree of Contamination

The contamination degree (Cdeg) of a specific sampling location is determined by adding up the contamination factors for all elements present, as indicated in Equation (3) [69,70].
C d e g = i = 1 n C F
where ‘n’ represents the number of pollutants analyzed and ‘CF’ denotes the contamination factor. The categorization of Cdeg [69] is outlined in Supplementary Table S2.

2.6.3. Geo-Accumulation Index (Igeo)

Muller introduced the geo-accumulation index (Igeo) as a method to assess the contamination of trace elements in sediments [70], and it has since become a widely adopted approach for evaluating soil contamination [71]. The calculation of Igeo has been realized as per Equation (4) [65]:
I g e o = l o g 2   C m e t a l I .5 × C m e t a l   c o n t r o l
where ‘Cmetal’ represents the concentration of the metal in the sample under study, while ‘Cmetal (control)’ denotes the geochemical background value [68] derived from Indian natural soil data. The factor 1.5 serves as a correction factor, aimed at mitigating the influence of potential variations in background or control values that could be attributed to local terrain effects. The classification of Igeo index values into six distinct classes [69] is detailed in Supplementary Table S3.

2.6.4. Health Risk Assessment Index

Human health risk assessment is the process of determining the kind and likelihood of harmful health effects in people who might be exposed to substances in polluted environmental media. Oral ingestion, inhalation, and dermal contact are the three main ways that people are exposed to hazardous substances. Nevertheless, oral consumption and dermal absorption are thought to be the primary exposure channels for heavy metals in soil [72]. The average daily intake (ADI) of chemicals in soils for these three pathways is determined with Equations (5)–(7) [72].
A D I o r a l = C × I R i n g × E F × E D B W × A T × 10 6
A D I d e r m a l = C × S A × S A F × A B S × E F × E D B W × A T × 10 6
A D I i n h a l a t i o n = C × I R i n h × E F × E D B W × A T
where ‘C’ represents the concentration of heavy metals in the soil (mg kg−1); ‘ADIoral’, ‘ADIdermal’, and ‘ADIinh’ are average daily intake values from soil ingestion, dermal absorption, and inhalation, respectively (mg kg−1 day−1); ‘EF’ is the exposure frequency, 350 days per year−1; ‘ED’ is the exposure duration, 30 years for adults and 6 years for children [3,73]; and ‘IRing’ is the ingestion rate (mg day−1), 100 mg kg−1 for adults and 200 mg kg−1 for children. According to USEPA (2002), the exposed skin area (SA) is 5700 cm2 for adults and 2800 cm2 for children; the skin adherence factor (SAF) is 0.07 mg cm−2 for adults and 0.2 mg cm−2 for children; and ‘IRinh’ represents inhalation rate in (m3/day) [73].
The USEPA (2002) defines ‘ABS’ as the dermal absorption factor, which is 0.001 for both adults and children. ‘PEF’ on the other hand, is the particle emission factor, which is 1.36 × 10⁹ m3 kg−1 and relates the concentration of a pollutant in the soil to the concentration of a respirable particle in the air due to fugitive dust emissions from contaminated soils. ‘BW’ is the body weight, which is 20 kg for children and 70 kg for adults. Finally, ‘AT’ is the averaging time, which is 70 (lifetime) × 365 days for carcinogens (As, Cr, and Ni) and ‘ED’ × 365 days for non-carcinogens [73].

Non-Carcinogenic Risk Assessment

The hazard quotient (HQ), which is determined as the ratio of the average daily intake and a reference dose (RfD), can be expressed as Equation (8) [72]. It is commonly used to describe non-carcinogenic risks.
H Q = A D I R f D
where ‘RfD’ is the reference dosage (mg kg−1 day−1) of PTEs. This is the highest concentration of a PTE that is safe for human health. The reference dosage for non-dairy ingestion of PTEs (RfDing; mg kg−1 day−1) for adults and children in soil was taken into account in this study. The USEPA (2002) [73] offers a technique to evaluate dermal absorption exposure to chemicals when reference doses are lacking. This method involves multiplying the soil oral reference dosage by a gastrointestinal absorption factor in order to determine dermal risk [73].
In order to evaluate the combined non-carcinogenic effects of a number of contaminants, the hazard index (HI) is calculated by adding together the HQ values of each element. The formula for the HI can be expressed as Equation (9) [72].
H I = H Q i = A D I i R f D i
where H Q i represents the Hazard Quotient for the ith element, A D I i denotes average daily intake, and R f D i represents the reference dose for the same. It is unlikely that the exposed person will suffer negative health impacts if the HI value is less than 1. On the other hand, in the event that the HI value surpasses 1, there exists a possibility of a non-carcinogenic health consequence, with a probability that tends to rise with the HI value [3,74].

Carcinogenic Risk Assessment

The process of estimating carcinogenic risks involves computing the cumulative likelihood that an individual would experience cancer during their lifetime due to exposure to a probable carcinogen. According to USEPA (2010), the slope factor (SF) directly translates the average lifetime intake of a toxin into the incremental chance of a person developing cancer [75,76]. Cancer risk can be calculated using Equation (10) [72].
C R = A D I × S F
where ‘CR’ is cancer risk, ‘SF’, is the carcinogenicity slope factor (mg kg−1 day−1). The cumulative cancer risk from all chemicals and pathways is used when there are many carcinogenic pollutants present. Supplementary Table S9 also shows the RfD and SF from non-dietary consumption, skin contact, and inhalation of the eight heavy metals.

3. Results and Discussion

3.1. Physicochemical Properties of Soil

The results of the physicochemical analysis of the soil samples are summarized in Table 1. Soil pH ranged from 6.9 to 8.57, indicating that most of the samples were alkaline in nature. These results are in line with earlier studies on the agricultural soils of Bathinda, Talwandi Sabo, and Amritsar [77,78]. One essential measure of the health of the soil is electrical conductivity (EC). It offers insightful information on a number of functional and quality aspects of the soil including crop yields, plant nutrient accessibility, and soil microbial activity. It also contributes significantly to important soil processes, such as the release of methane, carbon dioxide, and nitrogen oxides which are greenhouse gases. As illustrated in Table 1, the EC of all soil samples ranged from 125 to 1703 μS cm−1, with an average value of less than 4500 μS cm−1, suggesting that the soils in the study area are not saline. In agricultural soil, EC may arise from the accumulation of soluble fertilizers, pesticides, and salts. Irrigation with elevated EC-containing groundwater also contributes the rise in soil EC in the area. Concentrations of dissolved HCO3 ranged between 150 and 1050 mg/kg with a mean value of 491.3 mg/kg, and TKN ranged between 0.06 and 0.2% with a mean value of 0.1% (Table 1), which represented the soil in the area was very low in nitrogen. The range of TOC in the soil was 0.07% to 2.2%, which signifies the variability and low content of organic matter content within the soil. TOC represents the accumulation of organic compounds derived from the decomposition of soil organisms, cells, and tissues of soil organisms and various forms of plant and animal remains. The sandy loam texture of the soils under study may be the cause of their low organic matter content due to their low retention capacity. Table 1 provides a statistical summary of PTE concentrations in soil samples. There is a wide variation of the metal concentrations in agricultural soil, with iron (Fe) and aluminum (Al) having the highest concentrations. The order of the average metal concentrations (mg/kg) in descending order is as follows: Al (11,541.8), Fe (10,382), V (1289.5), Mn (186.3), Zn (67.47), Pb (31.59), Cr (22.99), Cu (12.02), Ni (3.96), and As (1.7) (Table 1). To make comparisons easier, metal concentrations from the world background soil and the Indian natural background were used (Table 2). While the mean concentration of Pb (31.5 mg/kg) was found to be higher than the World background soil [68], the mean concentration of Zn (67.4 mg/kg) was found to be higher than the Indian natural background value [67].

3.2. Comparison of Soil PTE Concentrations with Other Studies of Punjab and Other Reference Values

The soil metal concentration data were compared with other studies conducted in Punjab and reference values from different parts of the world have been summarized in Table 2. The result showed that the soil in various parts of Punjab is contaminated with a wide range of PTEs. The following particular ranges were noted: Zn ranged from 2.9 to 120.1, Cu from 0.9 to 58.1, Pb from 3.8 to 90, Mn from 14.3 to 184.2, Ni from 0.5 to 56, Cr from 0.8 to 87.7, and As from 1.8 to 115.7 (mg/kg) [42,49,52,53,79,80,81,82,83,84,85]. When compared to the previous studies of Punjab (Table 2), the majority of the metals in the present study exhibit within the range, with elevated levels reported from Bathinda [9], Rupnagar and Ludhiana [85]. The average soil PTEs concentrations were compared with Indian natural soil [67], world background values [68], reference soil China [86], reference soil USA [87], reference soil Spain [88], Upper continental crust [89] as summarized in Table 2. For instance, the concentration of Zn in the study site soil is approximately three times higher than the Indian natural soil background value and almost the same as the world background soil value. Similarly, the soil at the study site has substantially lower Cu concentrations than both background values, indicating reduced potential for Cu contamination. The concentrations of Pb vary greatly among various locations of Punjab. For example, Rajewal reported the lowest average Pb concentration (3.83 mg/kg) in agricultural soil [80], which is significantly lower than the levels found in the current study. On the other hand, SAS Nagar in Punjab had the highest average Pb concentration (90.02 mg/kg) [81], which is roughly three times greater than what was found in the current study. Zn concentrations in the study samples were found to be higher than the Indian natural soil background values in various districts, including Harike, Barnala, Ludhiana, Rupnagar, SAS Nagar, Amritsar, and Batla [49,52,81,82,83,84,85]. The concentration of As exceeded the world background value in the Ludhiana and Bathinda districts of Punjab [9,52]. Chromium levels exceeded the concentration of the world background value in the Rajewal, Tibbi Taiba, and Bathinda districts of Punjab (Table 2) [9,80].
The Pb levels in the study site soil are notably elevated, surpassing the Indian natural soil background value [67] and approaching the world background soil value [68] (Table 2). All the PTEs were found under the levels of the reference soil China [86], except for Pb, while Pb and Zn levels were higher when compared with USA reference soil [87] and Upper continental crust [89]. While only Pb content was higher in the study soil than the Reference soil of Spain [88] (Table 2). Overall, the data suggest that the soil at the study site is contaminated with various PTEs, posing potential risks to the environment and human health. The disparities observed in the heavy metal concentrations between the study site soil and the background values can be attributed to various factors related to various anthropogenic activities.
Groundwater and canal water serve as primary irrigation sources in the study area, yet the specified PTEs are not significantly present except U and F- in these groundwater and canal sources [90,91]. Research by Krishan et al. (2021) supports this observation, indicating that the concentrations of metals such as Zn, Cu, and Pb in groundwater and canals met Indian standards [92]. This suggests that these water sources are unlikely to be major contributors to heavy metal contamination in the agricultural soil of Punjab. The study site, being an agricultural center, shows exacerbated PTE contamination due to related activities. Conversely, studies already highlighted the substantial impact of fertilizer usage on soil contamination in the region [3,81,93]. High levels of PTEs, including Zn, Cu, and Pb, have been detected in soils treated with chemical fertilizers, indicating their role as significant contributors to soil contamination. Additionally, a positive correlation between fertilizer application rates and PTE concentrations in soil samples has been reported earlier, further underscoring the association between fertilizer usage and soil contamination in the region [94,95]. Therefore, while groundwater and canal water may not be major sources of heavy metal contamination, fertilizer application emerges as a prominent factor contributing to soil pollution in Punjab.
Table 1. Descriptive statistics of soil physicochemical properties and PTEs.
UnitMin1st QuartileMedianMean3rd QuartileMaxSD
pH-6.97.57.77.788.50.3
ECμS/cm125284.2403.4476.9532.81703312.2
Salinitymg/kg107239.2351.2414.7475.61544280
HCO3mg/kg150277.5500491.36501050228.4
TKN%0.060.10.170.10.20.20.06
APmg/kg40.392.4103.5100.5113.7132.417.7
TOC%0.070.711.11.52.20.4
Znmg/kg117.548.267.474.3971.4120
Cumg/kg2.86.510.512.015.841.97.4
Pbmg/kg0.26.411.531.547.417940.4
Mnmg/kg0.1107.2164.2186.3223.3672.1117.7
Vmg/kg41.8672.41136.21289.51816.53142.1765.9
Nimg/kg0.81.73.853.95.8172.7
Almg/kg346.37002.1947911,541.815,077.533,462.46420.6
Crmg/kg6.315.422.522.929.449.210
Asmg/kg0.71.31.71.71.92.60.42
Femg/kg4226973996410,38212,74333,4375233.9
Min: Minimum, Max: Maximum, SD: Standard deviation, EC: Electrical Conductivity, TKN: Total Kjeldal Nitrogen, AP: Available Phosphorous, TOC: Total Organic Carbon.
Table 2. Comparison of average value of PTEs (mg/kg) in this study with other studies from Punjab, India and worldwide reference limits.
LocationsZnCuPbMnVNiAlCrAsFeReferences
This study67.41231.5186.31289.53.911,541.822.91.710,382
Jalandhar City, Punjab2.90.9 14.3 0.56 0.811.813.8[42]
SBS Nagar, Punjab80.115.4 184.2 19 749.6[79]
Jalalabaad, Punjab 9.06.6 29.5 [80]
Rajewal, Punjab 9.13.83 86.9 [80]
Yousufpur, Punjab 5.5 [80]
Tibbi Taiba, Punjab 3.07 87.7 [80]
Doomniwala, Punjab 13.35.8 67 [80]
Harike, Punjab5918.76.5374 22.3 17,700[83]
Barnala, Punjab55.717.119.33655.227.6 64.89.925,722[84]
Mansa, Punjab 15.6 47.710,70037.58.114,000[53]
Bathinda, Punjab114.728.86.6 56 941528,803[9]
Ludhiana, Punjab 71.540.331.5 21.9 115.7 [52]
Amritsar, Punjab96.558.124.8 24.7 [49]
Rupnagar and Ludhiana, Punjab70.130.547.5342 33.3 36.2 1498[85]
SAS Nagar, Punjab32.65.190 6.5 5.22.7 [81]
Batla, Punjab120.14.14.0152.4 12.7 488.2[82]
Indian natural soil background 22.156.513.1 27.7 114 [66]
World background soil67.828.228.4571 17.8 70.911.4 [68]
Reference soil China742327 27 6111.2 [86]
Reference soil USA552117380 15 415.5 [87]
Reference soil Spain192 30 43 73 [88]
Upper continental crust521417900 19 352 [89]
Reference soil Brazil59.935.117 13.2 40.3 [4]

3.3. Geospatial Distribution of PTEs in Soil

The geographic distribution of PTEs aids in hotspot differentiation and the identification of the likely PTE source in the soil regime. Within the study area, there were significant fluctuations in the spatial variance of total PTEs (Cr, Zn, Pb, Mn, Al, and Fe) (Figure 2a–f). The Zn concentration increased from Muktsar to Moga, according to the geographical variation of PTEs; a similar pattern was also seen for Mn and Fe (Figure 2) due to the binding adsorption of these PTEs on the surface of Fe/Al-oxyhydroxides. The distribution of Pb and Zn was almost opposite in the area, it has been also confirmed in a Spearman’s rank correlation plot where a negative association was found in between Zn and Pb. The concentration of Pb was higher in the Muktsar than in Faridkot and Moga regions. It showed that the Pb in soil was due to anthropogenic activities. Compared to Faridkot and Moga, the majority of Muktsar had a lower concentration of aluminum, and an almost similar pattern was seen in Cr (Figure 2d,e). The north-eastern region of Moga and the southwest region of Faridkot had higher levels.

3.4. Weight Matrix and Spatial Autocorrelation

The 76 samples were assigned a neighborhood structure using spatial weight matrices, and 10 PTEs’ spatial autocorrelation was evaluated. Supplementary Table S4 displays the global Moran’s I values with their p-value and z-score (Supplementary Table S4). The test results for Moran’s I significance ranged from p < 0.001 to 0.5 (Supplementary Table S4). While As, Zn, Fe, and Ni showed low Moran’s I values near zero, Pb, Cr, Cu, Al, Mn, and V displayed considerable and positive spatial autocorrelation on the weight matrix as well as first-order queen contiguity (Supplementary Table S4). The strength of a spatial autocorrelation is generally correlated with the absolute value of Moran’s I, and the significance of a geographical structure is correlated with the size of the standardized metric [96]. The ability to compare the significant spatial patterns of many variables or of the same variable with various calculation settings is one of the advantages of the standardized Moran’s I. A significant positive Moran’s I value of Pb, V, Mn, Cr, Cu, and Al with a significance level (p-value ≤ 0.01), showed the positive spatial autocorrelation of PTEs in the area.

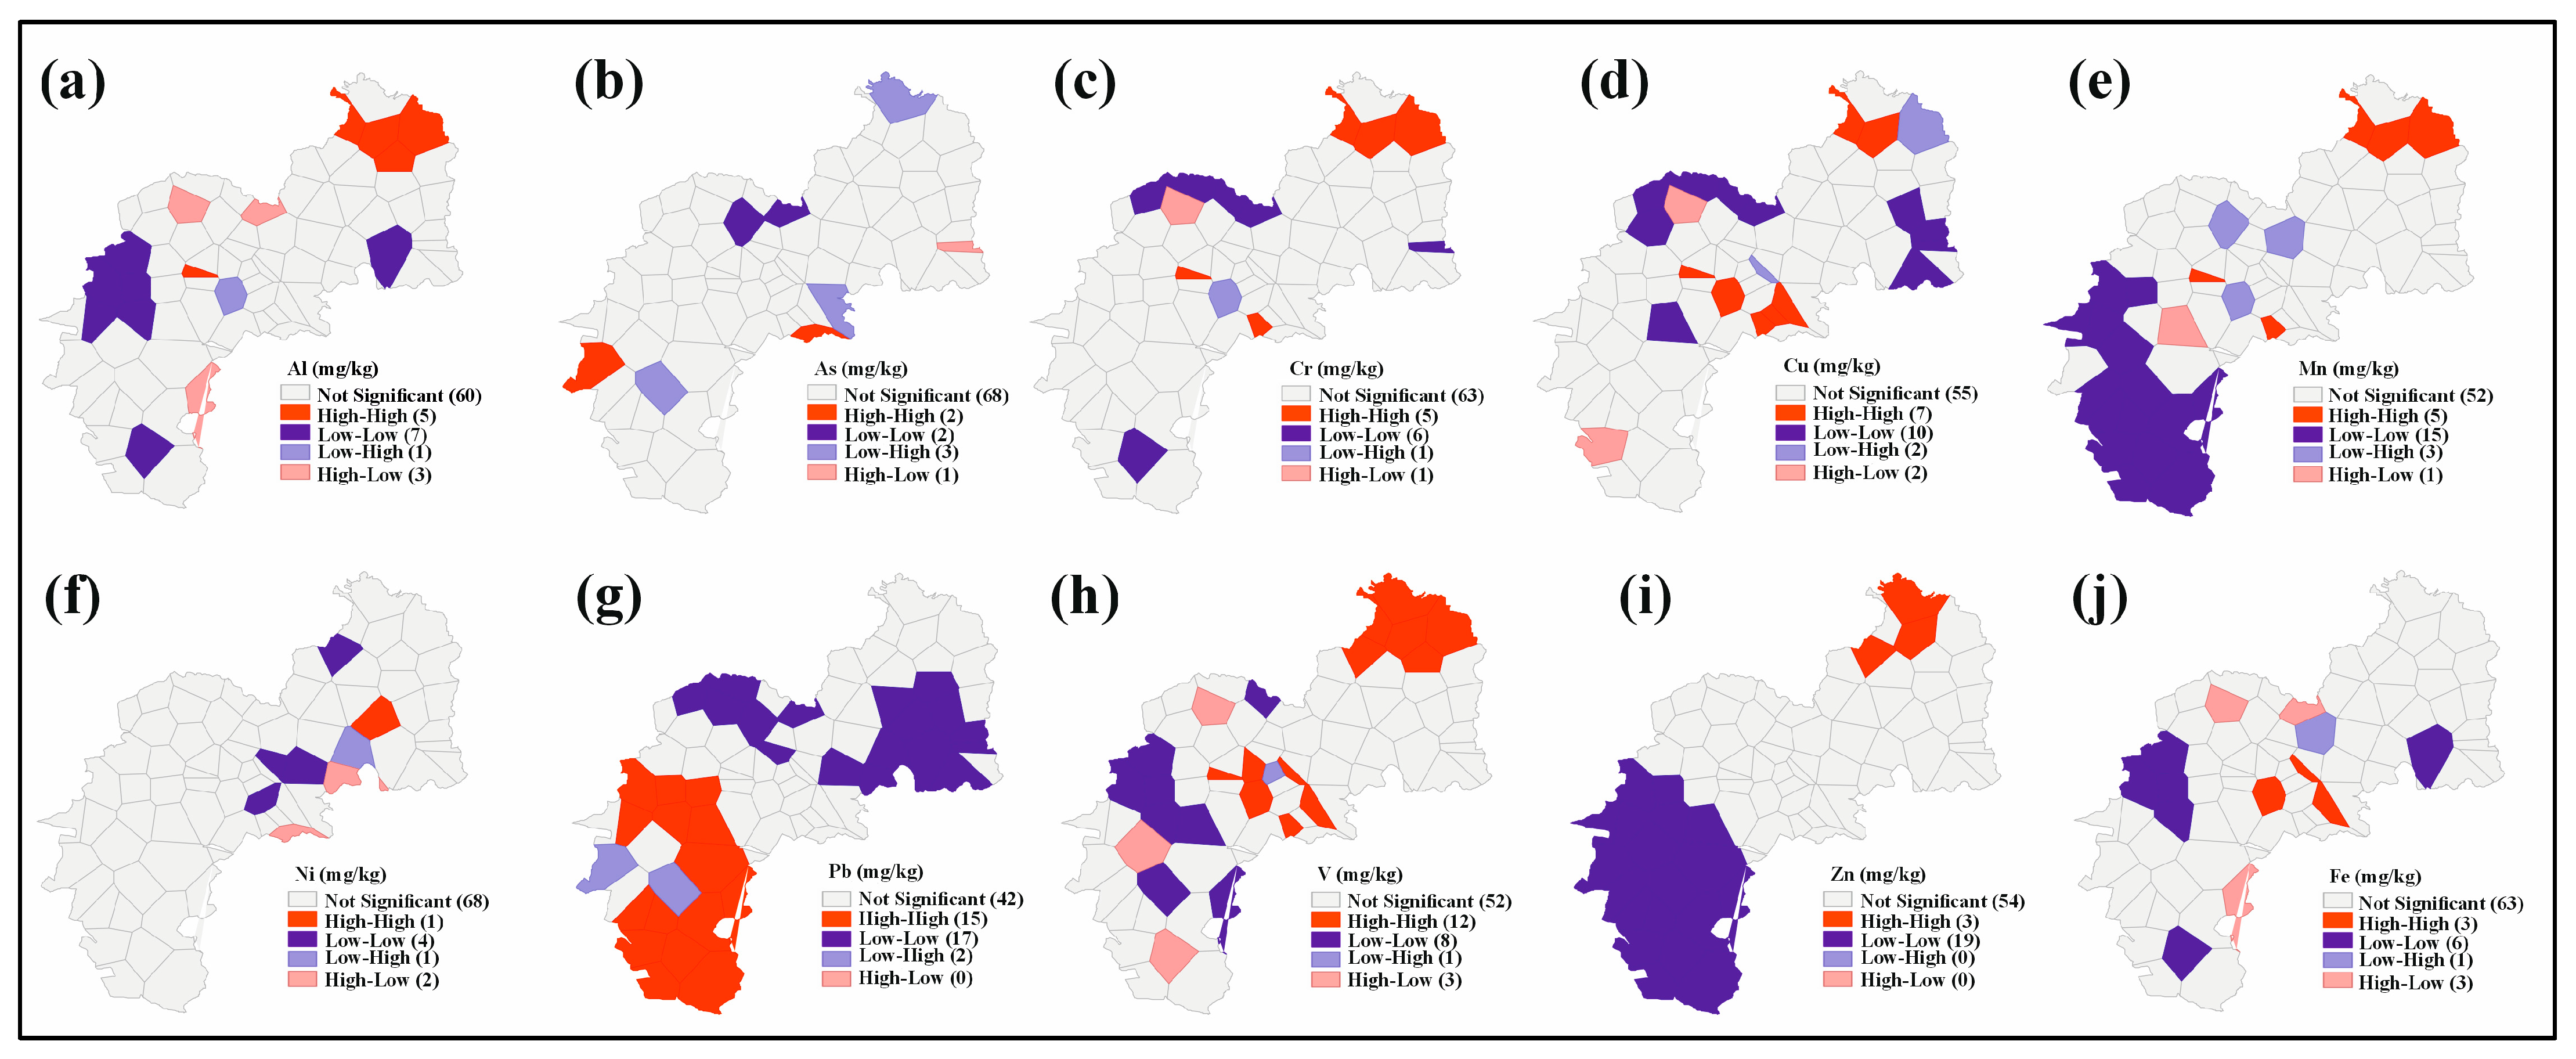
3.5. Spatial Autocorrelation of Selected Elements in Soil

The Local Indicator of Spatial Association (LISA) provides information on the details of spatial variability. The selected distance indicates the local spatial pattern (high-high, low-low, high-low, low-high, and no significance) where the spatial dependency of Al, Cr, Mn, Zn, Cu, Fe, Ni, Pb, and V was strongest [97]. Moreover, half of the samples of the 10 PTEs showed no meaningful geographical pattern, despite the fact that they all had a substantial global spatial positive correlation (Supplementary Table S4). The substantial spatial clusters accounted for 42.1% of Pb, 28.9% of Zn, 26.3% of Mn, and 26.3% of V, while around 20% of the other PTE samples were part of this greater spatial pattern (Figure 3a–j, Supplementary Figure S1), with the exception of V. The low-low pattern of the 10 PTEs dominated the overall geographic distribution as trace elements in soils (Figure 3). Certain noteworthy spatial patterns may point to robust, continuing enrichment processes of certain PTEs in the soils of southwest Punjab. The notable geographical patterns of these PTEs, in contrast to the spatial randomness, showed that the underlying enrichment processes were more stable, which would make cleanup more challenging. Furthermore, the outliers in the evaluation of soil PTEs, including Ni and As in this study, may reflect possible polluted sites. In the event that more spatial interpolation is generated, the outliers should use a more sophisticated geo-statistics approach rather than being randomly eliminated [96].

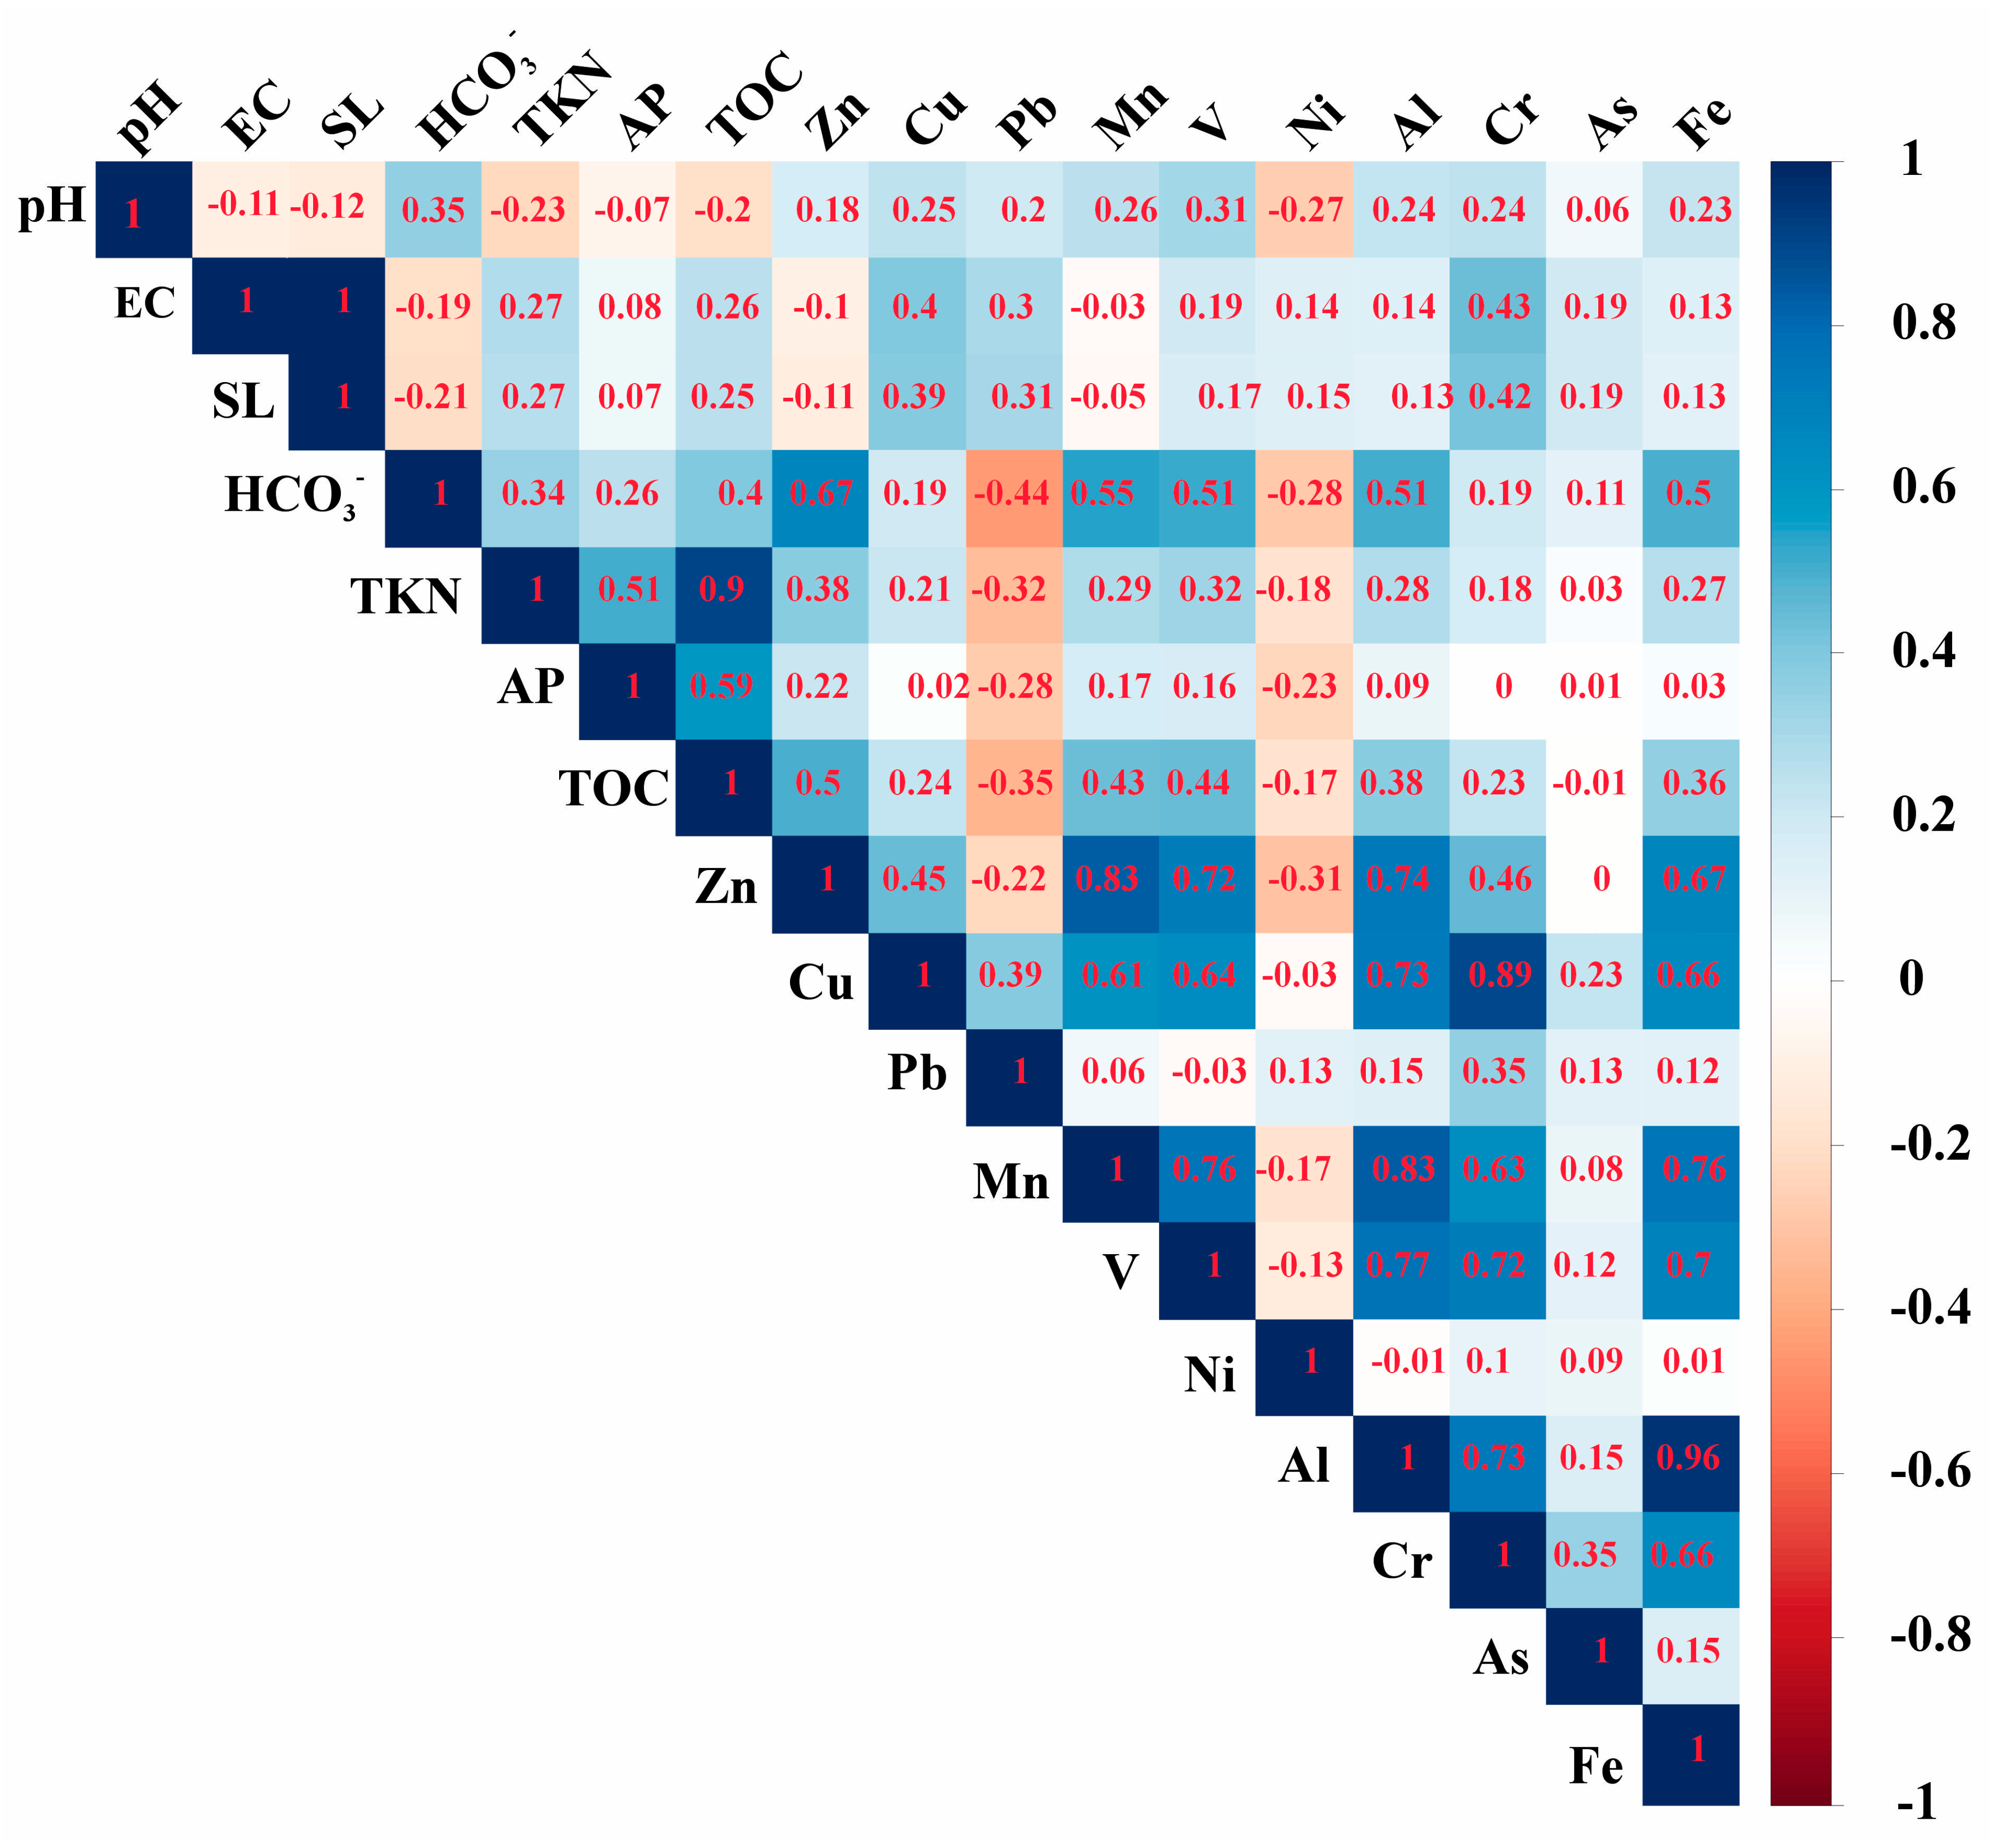
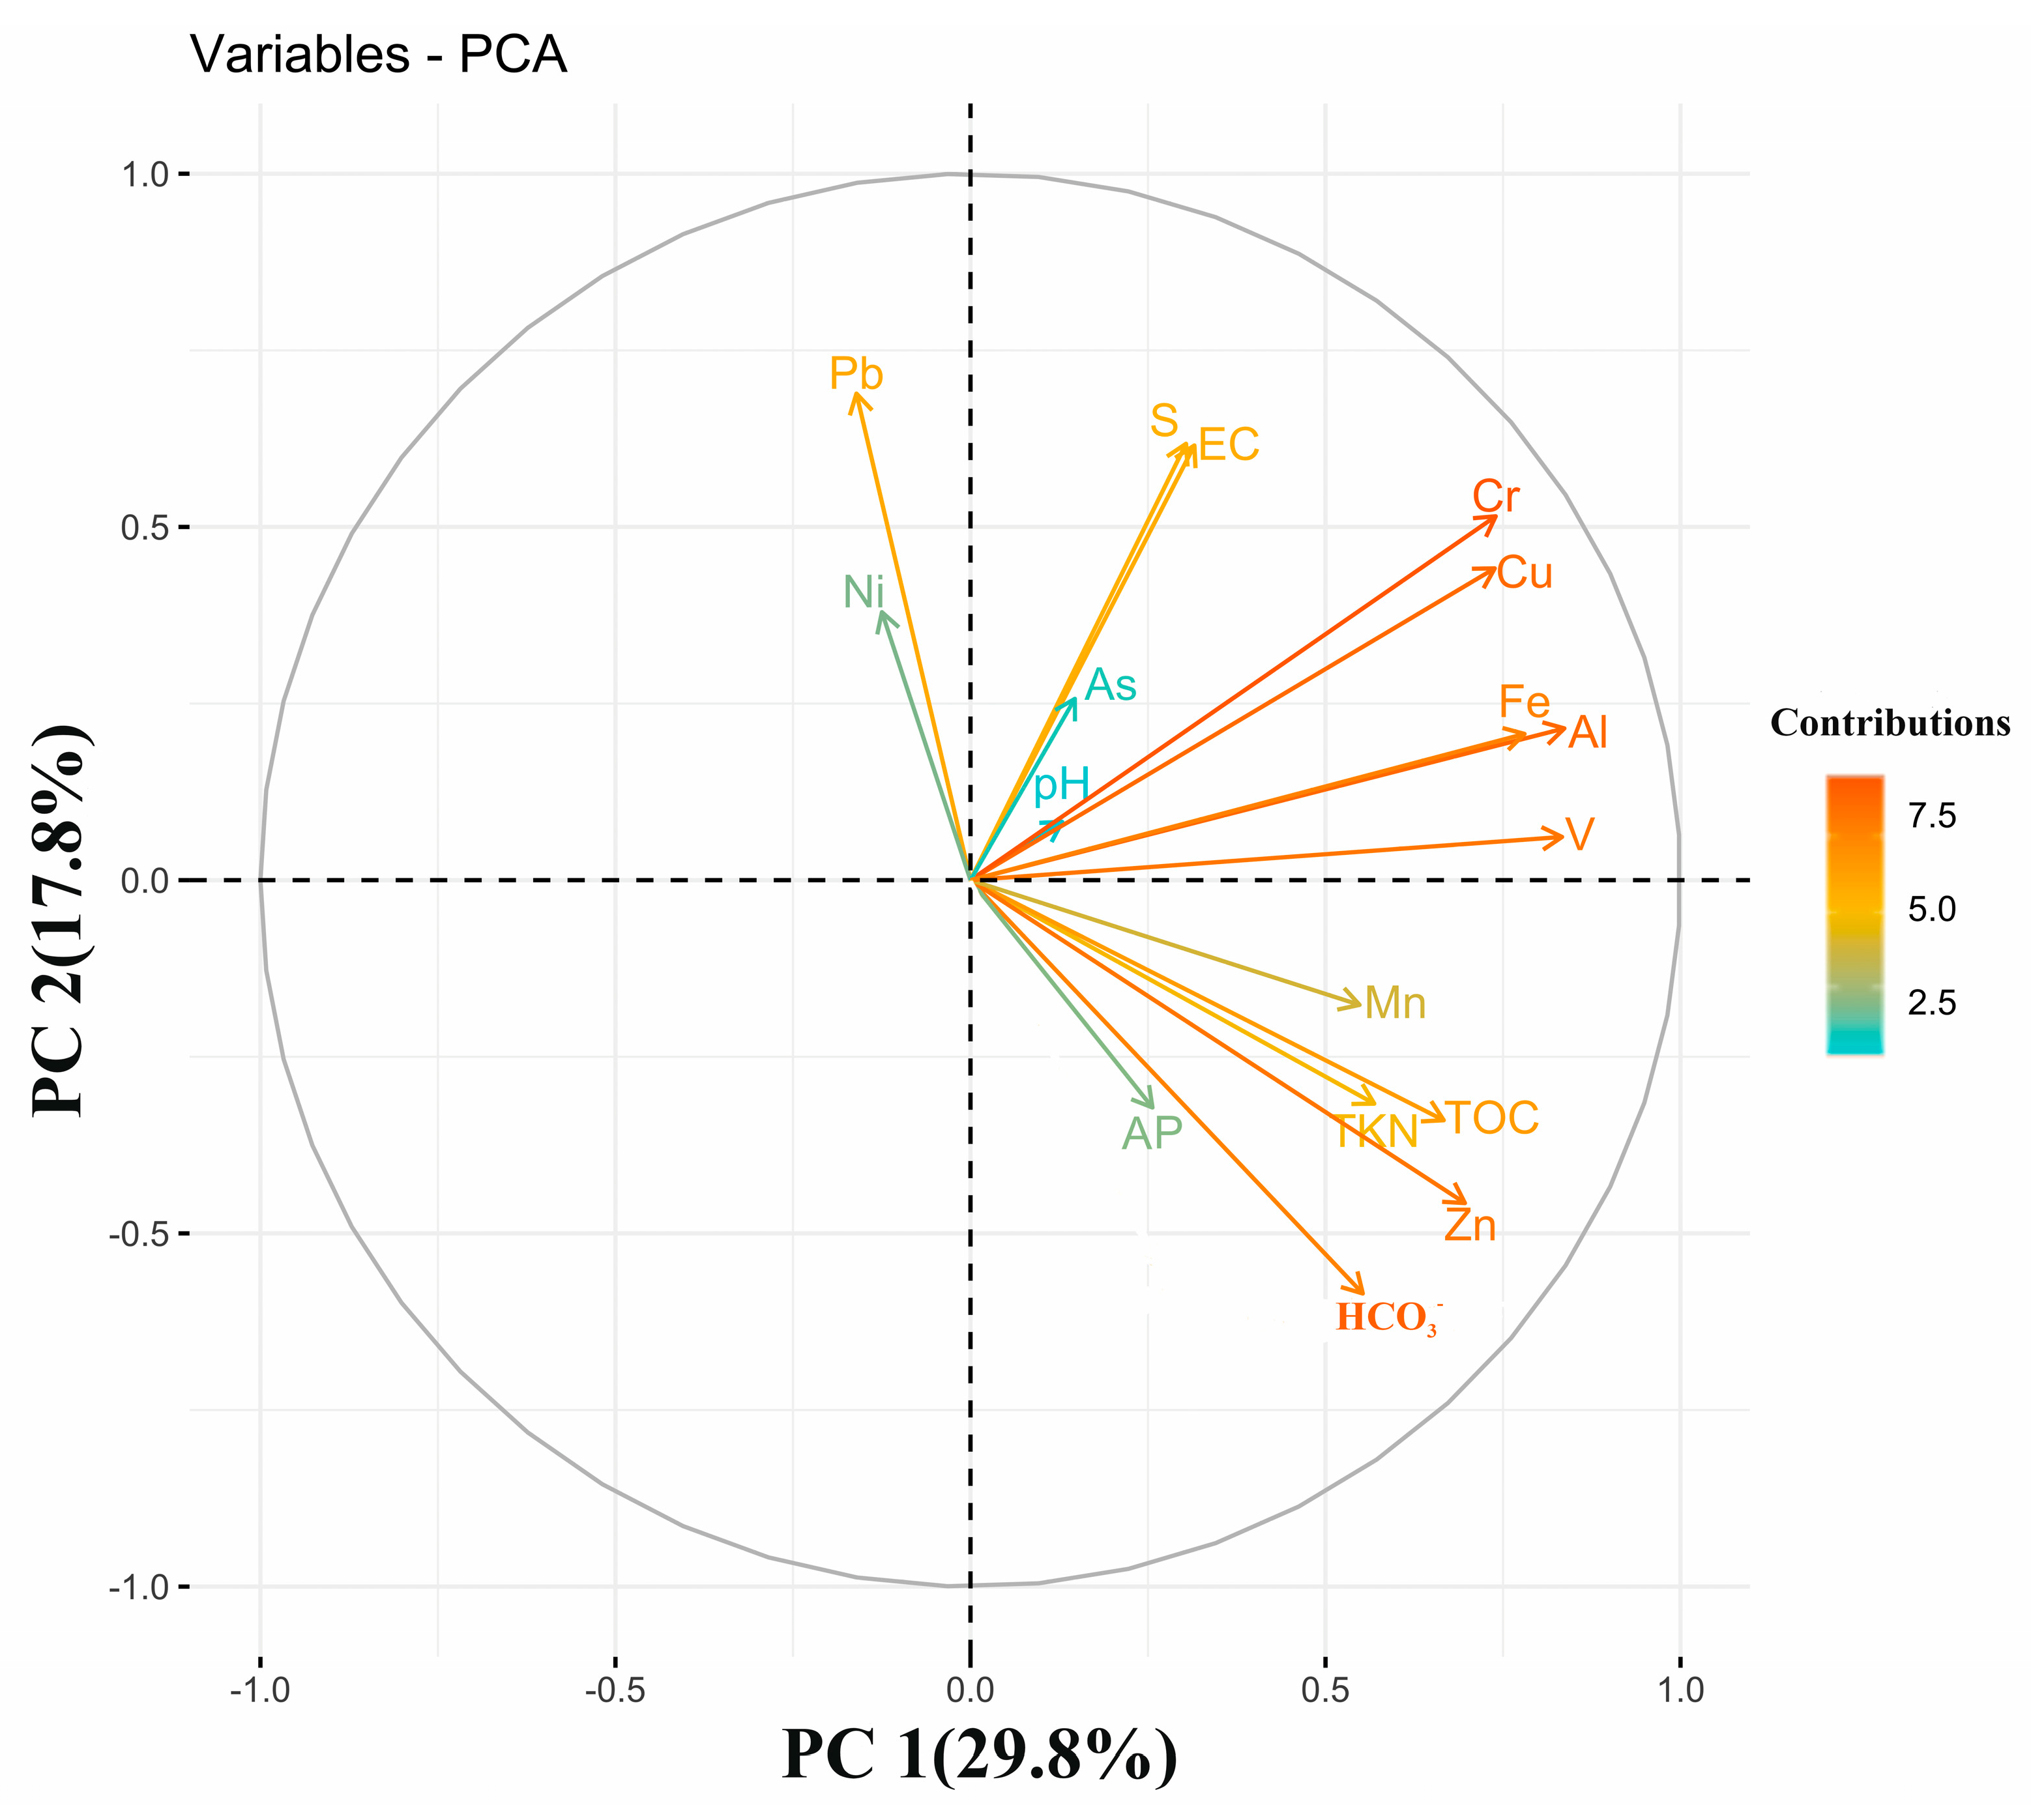
3.6. Multivariate Statistical Analysis

Spearman’s rank correlation matrix is frequently used to evaluate the degree of similarity and relationships between elements. Spearman’s rank correlation coefficients (ρ < 0.05) were calculated for all parameters using clr data (Figure 4). Correlation strengths were classified as follows: strong (ρ = ±0.7 to ±0.9), moderate (ρ = ±0.4 to ±0.69), weak (ρ = ±0.1 to ±0.39), and none or very weak (ρ = 0 to ±0.1) [87]. Zinc exhibited moderate to strong positive associations with Cu (ρ = 0.45), Mn (ρ = 0.83), V (ρ = 0.72), Al (ρ = 0.74), Cr (ρ = 0.46), and Fe (ρ = 0.67). Manganese showed strong positive associations with V (ρ = 0.76), Al (ρ = 0.83), Cr (ρ = 0.63), and Fe (ρ = 0.76). Aluminum also had strong positive associations with Cr (ρ = 0.73) and Fe (ρ = 0.96). Parameters such as AP and TOC played a significant role in the accumulation and release of PTEs in the soil [98,99,100]. In this study, TOC exhibited moderate-to-strong positive associations with PTEs such as Cu, V, Mn, Al, Cr, and Fe, while showing negative associations with Pb and Ni (Figure 4). Due to the various processes involved in the adsorption of metals and metalloids by soil TOC, TOC can influence the distribution of these elements in the soil [101]. The relationship between TOC and PTEs, including heavy metals and metalloids, is dependent on specific soil conditions, despite TOC’s crucial role in regulating these substances [102]. No significant correlation was observed between TKN and PTEs in the soil (Figure 5). Iron displayed moderate-to-strong positive associations with Zn, Mn, Ni, and Al, while it was weakly associated with Cu, V, and Cr. This indicates that PTEs are adsorbed onto the surface of Fe/Al-hydroxides which prevents their mobilization from the soil [100]. Understanding the origin of heavy metals requires more than a single correlation analysis. Consequently, PCA is widely used to determine the properties and sources of heavy metals in both anthropogenic and natural soils [6,97].
In clr-transformed PCA, five principal components (PCs) with eigenvalues > 1 were extracted, describing 75.1% of the total variance. The first two PCA axes together accounted for 47.6% (PC1 29.8% and PC2 17.8%) of the total variance (Figure 5). Parameters such as Zn, Al, Mn, Fe, and V were positively loaded in with PC1, and their positive association was also found in the Spearman’s correlation plot (Figure 4). All the elements loaded in the PC1 were found below the world background value and Indian natural soil after comparison except Zn. The significant association of Fe with PTEs represents that that Fe/Al-oxyhydroxides are the major scavengers of these metals in the soils. PC2 was positively loaded with Pb and Cu, and the same was observed in the correlation plot (Figure 4 and Figure 5), whereas Pb and Ni were negatively loaded in PC1 and positively loaded in PC2 (Figure 5). The concentrations of Zn and Pb exceeding the Indian natural background values could be attributed to several factors, including the atmospheric deposition of fly ash, extensive use of agrochemicals, wastewater discharge, and the presence of coal-based thermal power plants, which significantly contribute to PTE contamination in the soil in this region. Elevated concentrations of PTEs have been observed in dry fly ash and bottom ash collected from various nearby industrial sources. Specifically, dry fly ash contains Mn, Cu, Pb, Zn, As, Ni, and Cr at concentrations of 638 mg/kg, 116 mg/kg, 187.5 mg/kg, 38.3 mg/kg, 99 mg/kg, and 306.5 mg/kg, respectively. Similarly, bottom ash exhibits Mn, Zn, Pb, As, Ni, and Cr concentrations of 596 mg/kg, 98.4 mg/kg, 128.9 mg/kg, 96.6 mg/kg, 30.6 mg/kg, 76.6 mg/kg, and 281.9 mg/kg, respectively (Table 3). Solid-waste dumping can also contribute to PTE concentrations as it leaches down and is accumulated in the soil. In a study by Moturi et al. (2004), the Pb, Zn, and Cu concentrations ranged from 23 to 530 mg/kg, 116 to 23,321 mg/kg, and Cu 147 to 10,144 mg/kg, respectively in the solid waste [103]. Fertilizers are another critical source of Zn and Pb in agricultural soils. For instance, nitrogen (N) fertilizers, phosphorus (P) fertilizers, lime fertilizers, and manure contain substantial amounts of Pb, measured at 15 mg/kg, 300 mg/kg, 125 mg/kg, and 60 mg/kg, respectively [22,104,105]. Zn concentrations in these fertilizers are also considerable, with values of 42 mg/kg in N fertilizers, 1450 mg/kg in P fertilizers, 450 mg/kg in lime fertilizers, and 250 mg/kg in manure (Table 3) [22,104,105]. This extensive use of contaminated fertilizers substantially contributes to the elevated Zn and Pb levels observed in the agricultural soils of this region [106]. Weintraub and Schimel (2003) found a substantial correlation between nitrogen and carbon mineralization based on the considerable connection (ρ = 0.59) between TKN and TOC in PC4 [107]. Moderate-to-strong positive associations between TOC and the majority of inorganic elements suggests that TOC does significantly influence inorganic elements in the irrigated soil [108]. Arsenic was positioned differently in the soil PCA than phosphorus, which demonstrated their competing behaviour and may have had an impact on the ability to retain As [78,109].

3.7. Environmental Pollution Level Assessment

The contamination factor and Cdeg values were computed using the background values (Indian natural soil [66,67] and world background value [68] for As) for a subset of PTEs (As, Cr, Cu, Fe, Mn, Ni, Pb, and Zn). The CF values between elements differed significantly. The maximum CF in surface soils fell in the following order: Zn > Pb > Mn > Fe > Cu > Ni > Cr > As (Supplementary Table S5). The contamination factor of Zn had a median of 2.18 and ranged from 0.04 to 43.95 (Figure 6a). Pb ranged from 0.01 to 13.66 with a median value of 0.88, Cu ranged from 0.05 to 0.07 with a median of 0.1 (Figure 6a). The median value of Mn was found to be 0.78 (Figure 6a). The contamination factor of Ni ranged from 0.02 to 0.61 with a median value of 0.13, and Cr varied from 0.05 to 0.43, with a median of 0.19 (Figure 6a). The contamination factor of Zn, Pb, and Mn were significant, only 15.7% and 3.9% samples of Pb and Zn were under the high-risk category (Supplementary Table S5). About 40.7% and 18.4% samples of Zn and Pb were moderately polluted, whereas 30% of Mn samples fall under this category. The highest CFs of Zn, Pb, and Mn were found in the Dharmkot, Dabra, and Mandwala villages of Moga, Muktsar, and Faridkot, respectively, whereas the lowest CFs of Zn, Pb, and Mn were found in Midda village of Muktsar. The average Cdeg value was 7.23, with values ranging from 1.13 to 48.20. The Dargah Saidan village in Moga has the highest Cdeg values. The Sangat Pura village in Moga recorded the lowest Cdeg values. The large range of Cdeg values suggests that there are variations in the degree of metal pollution in the study area soil. A little over 3.9% of samples had significant contamination, compared to 72.3% of samples with low contamination and 23.6% of samples with moderate contamination (Supplementary Figure S2).

3.8. Geo-Accumulation Index

To assess trace element contamination in sediments, the geo-accumulation index (Igeo) has become a popular tool for assessing soil contamination [71]. For PTEs, the majority of samples have an Igeo value falling into class 0 (Igeo < 0), uncontaminated (Figure 6b, Supplementary Table S6). For PTEs like Zn, Pb, and Mn, 34.21%, 72.37%, and 88.16% of the samples fall under class (0), while Igeo values for PTEs such as Cu, Ni, Cr, and Fe fall under the class (0) in approximately all the samples (Figure 6b). Class 1 had around 34.21% of Zn samples, 2.63% of Pb samples, and 10.53% of Mn samples (Figure 6b). Class 2 had approximately 10.53% of the Pb samples, 27.63% of the Zn samples, and 1.32% of the Mn samples (Figure 6b). Very few samples were found in the class representing significant contamination, while the majority of samples fell into the uncontaminated category. The highest Igeo value for Zn was observed in the village of Dharmkot in Moga and the lowest value was found in the Midda village of Muktsar. The highest Igeo value of Pb was found in the Dabra village in Muktsar and the lowest value was found in the village of Midda in Muktsar. The soil in the area was contaminated with Zn, Pb, and Mn which may be due to anthropogenic activities in the area.

3.9. Human Health Risk Assessment

In order to aid in the assessment of potential health concerns that toxic compounds may pose to people, the USEPA developed the health risk assessment (HRA) method. Children as well as adult were evaluated for the possible health risk posed by soil PTE contamination; HQ took into consideration the “soil-to-human” exposure pathway. A genuine number of HQ is the end result of a series of calculations. No negative consequences should be anticipated if HQ is less than unity [73,110]. This explains why comparable literature has utilized HRA so frequently. However, it has several drawbacks. Firstly, it cannot possibly be unique for every exposed human because it is based on rigid assumptions about things like exposure duration, body weight, air volume inhaled, etc. [111]. Secondly, it is unable to account for significant health-related issues like pre-existing health problems, genetic problems, etc. Thirdly, it does not indicate certainty but rather a possible risk. Despite the widespread knowledge of these drawbacks, the most crucial method for determining potential health hazards associated with PTE exposure is the health-related risk assessment (HRA). In summary, health risk assessment is a powerful strategy due to its simplicity, but the results should only be viewed as a preliminary risk assessment of the possible harm associated with chemical use. Due to reports that the majority of exposures that have an impact on human health occur through the mouth, this pathway was investigated in this case. The non-carcinogenic health risk has also been investigated since it considers all PTEs that have been evaluated and is regarded as an essential first step in evaluating health risks in the study areas.

3.9.1. Non-Carcinogenic Risks Assessment

The non-carcinogenic health risk indices (hazard quotient (HQ) and hazard index (HI)) were estimated for selected toxic elements through three potential exposure pathways (ingestion, inhalation, and dermal contact) for adults and children; results are listed in Supplementary Table S7. This indicates a similar pattern of non-carcinogenic risk for adults and children, with higher risk noticeable for Pb. The Pb (HQ) contribution to the total obtained value of HI was determined to be 90.76% for adults and 90.77% for children. On the other hand, for adults and children alike, the total HQ values for Zn, Cu, and Ni were less than 6.8% of the HI value. The latter is a tool used to assess the cumulative non-carcinogenic health risk over exposure to multiple contaminants [73]. If the hazard index (HI) is <1, it suggests that the exposed individual is unlikely to experience obvious adverse health effects. However, there is a possibility that non-carcinogenic consequences might appear if the HI > 1. According to Man et al. (2010), there is a tendency for the probability of these effects to rise with the hazards index [112]. In this instance, the percentage of soils with a hazard index between 0.2 and 1 was roughly 27.63%, and 71.05% of soils had a HI lower than 0.2 for children. A hazard index of less than 0.2 is present in all proportions of soils for adults. Thus, it can be said that because of their physiological differences, children are more susceptible to the non-carcinogenic effects of PTE exposure than adults. One common way that soil contaminants enter children is through their habit of sucking their fingers [113]. As a result, children can unintentionally ingest high amounts of soil.

3.9.2. Carcinogenic Risks Assessment

Carcinogenic risks were assessed for Cr, Ni, and As, due to the availability of carcinogenic slope factors (SF) for these PTEs. The carcinogenic risks from PTE exposure from soils were presented for non-dietary ingestion, dermal contact, and inhalation pathways [3]. The average carcinogenic risk values for As, Ni, and Cr were calculated for both children and adults. The findings demonstrated that these risks fell within acceptable levels Supplementary Table S8 [3], with values above 1.00 × 10⁻⁶, which is considered to have significant health effects. Risks surpassing 1.00 × 10⁻⁴ are viewed as unacceptable. Specifically, the average carcinogenic risk values for children were as follows: 2.47972 × 10⁻⁵ for arsenic, 8.72964 × 10⁻⁸ for nickel, and 7.0652 × 10⁻⁶ for chromium. For adults, the average carcinogenic risk values were 3.55578 × 10⁻⁶ for As, 5.25091 × 10⁻⁸ for Ni, and 1.52223 × 10⁻⁷ for Cr. Overall, the values indicate that while there is some risk associated with exposure to these PTEs, it is considered manageable and not likely to result in significant health effects. The average carcinogenic risk values varied between children and adults, with slightly higher values observed for children compared to adults for all three elements. This is because children are particularly vulnerable to heavy-metal exposure due to various factors such as additional routes of exposure (e.g., breastfeeding and placental exposure), high-risk behaviours (e.g., hand-to-mouth activities and higher risk-taking activity in adolescence), and physiological differences (e.g., higher comparative uptakes and lower toxin elimination rates) [112].

4. Conclusions

In the present study, contamination factor (CF), degree of contamination (Cdeg), geo-accumulation index (Igeo), Moran’s index (MIs), spatial autocorrelation, principal component analysis (PCA), and health risk from different pathways were used to identify the geochemical signature, spatial distribution pattern, and environmental/human health risk of PTEs in the agricultural soils of the Malwa region. Among the analyzed PTEs, the average concentration of Pb exceeded the reference values of the world background, Indian natural soil, and upper continental crust. The average concentration of Zn exceeded the Indian natural soil, but was below the world background value. Elevated levels of Zn and Pb in the soil may be due to excessive use of chemical fertilizers and additives such as fly ash and manures. Arsenic, Zn, Fe, and Ni showed low Moran’s I values near zero while Pb, Cr, Cu, Al, Mn, and V displayed considerable and positive spatial autocorrelation on the weight matrix and first-order queen contiguity. The highest Moran’s I value was recorded for Pb with a p-value = 0.001, representing its positive spatial autocorrelation. More than half of the samples of the PTEs had no significant spatial pattern. The significant spatial clusters accounted for 42.1% of Pb, 28.9% of Zn, 26.3% of Mn, and 26.3% of V. Multivariate results show moderate-to-strong positive associations of Fe with PTEs such as Zn, Al, Mn, and Ni, indicating that Fe/Al-oxyhydroxides are the primary scavengers of these metals. Contamination factor results showed that, on the basis of degree of contamination, a little over 3.9% of samples had significant contamination, compared to 72.3% of samples with low contamination and 23.6% of samples with moderate contamination. Hazard quotient values for adults were much lower than 1 but children HQ values were close to 1. The value of the HI indicates that there is no potential risk for adults and children both, except in Dabra Village in Muktsar, where the HI value for children exceeded 1. The HI further supports our earlier conclusions that there is not a potential risk for adults from PTE concentrations in the soil. However, continuous soil quality monitoring is essential for sustainable management of soil resources and ecological restoration of the region.

Supplementary Materials

The following supporting information can be downloaded at: https://www.mdpi.com/article/10.3390/min14060576/s1, Figure S1: Distribution of different cluster groups of different PTEs. Indicates that most of the samples for all PTEs were in the no significant category; Figure S2: The % of samples that belong to different levels of Cdeg. Indicates that most of the samples exhibited a low degree of contamination or a moderate degree of contamination, whereas a very-low percentage of samples were in the considerable and very-high degree of contamination categories. Table S1: Classification according to contamination factor [69]; Table S2: Classification according to degree of contamination [70]. Table S3: Classification according to Igeo values [71]; Table S4: Moran’s index, p-value, and z-score of different PTEs in soil, showed Pb has a MI value maximum of 0.53 with a p-value <0.001 that depicts the +ve spatial autocorrelation of Pb; Table S5: CF of selected PTEs in soil of semiarid region of Punjab; Table S6: The % of samples that belong to different classes on the basis of Igeo values of different PTEs in the soil. Indicates that most of the samples were in the uncontaminated category and very few samples of Pb, Zn, and V were in the uncontaminated/moderately-contaminated-to-moderately-contaminated category; Table S7: Hazard quotient and hazard index of PTEs in children and adults; Table S8: Cancer risk from As, Ni, and Cr in children and adults. Indicates all the samples belong to no-risk category; Table S9: Summary of reference dose (RfD) and cancer slope factor (SF) of heavy metals through oral, dermal, and inhalation pathways; Table S10: Outcome of PCA. Indicated PC1 was positively loaded with Zn, Mn, V, and Al. PC2 was positively loaded with Pb, Mn, and Cu. PC3 was loaded with HCO3 and Mn.

Author Contributions

Conceptualization, U.C. and P.K.S.; methodology, U.C.; software, U.C.; validation, U.C., P.K.S. and S.M.; formal analysis, U.C., P.K.S., D.K. and T.T., investigation, U.C., P.K.S. and S.M., resources, S.M., data curation, U.C., writing—original draft preparation, U.C., D.K. and T.T.; writing—review and editing, P.K.S. and S.M.; visualization, U.C.; supervision, P.K.S. and S.M. All authors have read and agreed to the published version of the manuscript.

Data Availability Statement

Data will be available upon personal request.

Acknowledgments

A research fellowship was provided by the University Grant Commission (UGC), Government of India, for which the first, second, and third authors are grateful. PKS and SM express sincere gratitude and appreciation to DST SERB New Delhi (Government of India) for providing all support to this work through core research grant (CRG/2021/002567). For chemical analysis, the authors additionally thank the DST-FIST lab at the Department of Environmental Science and Technology, Central University of Punjab.

Conflicts of Interest

The authors declare that they have no known competing financial interests or personal relationships that could have appeared to influence the work reported in this paper.

References

  1. Adimalla, N.; Qian, H.; Wang, H. Assessment of heavy metal (HM) contamination in agricultural soil lands in northern Telangana, India: An approach of spatial distribution and multivariate statistical analysis. Environ. Monit. Assess. 2019, 191, 246. [Google Scholar] [CrossRef] [PubMed]
  2. Arora, S.; Bhatt, R.; Sharma, V.; Hadda, M.S. Indigenous Practices of Soil and Water Conservation for Sustainable Hill Agriculture and Improving Livelihood Security. Environ. Manag. 2023, 72, 321–332. [Google Scholar] [CrossRef] [PubMed]
  3. Chen, H.; Teng, Y.; Lu, S.; Wang, Y.; Wang, J. Contamination features and health risk of soil heavy metals in China. Sci. Total Environ. 2015, 512, 143–153. [Google Scholar] [CrossRef] [PubMed]
  4. Sahoo, P.K.; Dall’Agnol, R.; Salomao, G.N.; Junior, J.d.S.F.; Silva, M.S.; Filho, P.W.M.e.S.; da Costa, M.L.; Angelica, R.S.; Filho, C.A.M.; da Costa, M.F.; et al. Regional-scale mapping for determining geochemical background values in soils of the Itacaiunas River Basin, Brazil: The use of compositional data analysis (CoDA). Geoderma 2020, 376, 114504. [Google Scholar] [CrossRef]
  5. Zhang, M.; Zhang, T.; Zhou, L.; Lou, W.; Zeng, W.; Liu, T.; Yin, H.; Liu, H.; Liu, X.; Mathivanan, K.; et al. Soil microbial community assembly model in response to heavy metal pollution. Environ. Res. 2022, 213, 113576. [Google Scholar] [CrossRef] [PubMed]
  6. Al-Wabel, M.I.; Sallam, A.E.-A.S.; Usman, A.R.; Ahmad, M.; El-Naggar, A.H.; El-Saeid, M.H.; Al-Faraj, A.; El-Enazi, K.; Al-Romian, F.A. Trace metal levels, sources, and ecological risk assessment in a densely agricultural area from Saudi Arabia. Environ. Monit. Assess. 2017, 189, 252. [Google Scholar] [CrossRef] [PubMed]
  7. Shaheen, M.E.; Tawfik, W.; Mankoula, A.F.; Gagnon, J.E.; Fryer, B.J.; El-Mekawy, F. Determination of heavy metal content and pollution indices in the agricultural soils using laser ablation inductively coupled plasma mass spectrometry. Environ. Sci. Pollut. Res. 2021, 28, 36039–36052. [Google Scholar] [CrossRef] [PubMed]
  8. Terzano, R.; Rascio, I.; Allegretta, I.; Porfido, C.; Spagnuolo, M.; Khanghahi, M.Y.; Crecchio, C.; Sakellariadou, F.; Gattullo, C.E. Fire effects on the distribution and bioavailability of potentially toxic elements (PTEs) in agricultural soils. Chemosphere 2021, 281, 130752. [Google Scholar] [CrossRef] [PubMed]
  9. Ahmad, F.; Saeed, Q.; Shah, S.M.U.; Gondal, M.A.; Mumtaz, S. Environmental sustainability: Challenges and approaches. In Natural Resources Conservation and Advances for Sustainability; Elsevier: Amsterdam, The Netherlands, 2022; pp. 243–270. [Google Scholar] [CrossRef]
  10. Hemathilake, D.M.K.S.; Gunathilake, D.M.C.C. Agricultural productivity and food supply to meet increased demands. In Future Foods; Elsevier: Amsterdam, The Netherlands, 2022; pp. 539–553. [Google Scholar] [CrossRef]
  11. Khan, N.; Ray, R.L.; Sargani, G.R.; Ihtisham, M.; Khayyam, M.; Ismail, S. Current Progress and Future Prospects of Agriculture Technology: Gateway to Sustainable Agriculture. Sustainability 2021, 13, 4883. [Google Scholar] [CrossRef]
  12. Ammar, K.A.; Kheir, A.M.S.; Ali, B.M.; Sundarakani, B.; Manikas, I. Developing an analytical framework for estimating food security indicators in the United Arab Emirates: A review. Environ. Dev. Sustain. 2024, 26, 5689–5708. [Google Scholar] [CrossRef] [PubMed]
  13. Ghosh, A.; Manna, M.C.; Jha, S.; Singh, A.K.; Misra, S.; Srivastava, R.C.; Srivastava, P.P.; Laik, R.; Bhattacharyya, R.; Prasad, S.S.; et al. Impact of soil-water contaminants on tropical agriculture, animal and societal environment. In Advances in Agronomy; Elsevier: Amsterdam, The Netherlands, 2022; Volume 176, pp. 209–274. [Google Scholar] [CrossRef]
  14. Kopittke, P.M.; Menzies, N.W.; Wang, P.; McKenna, B.A.; Lombi, E. Soil and the intensification of agriculture for global food security. Environ. Int. 2019, 132, 105078. [Google Scholar] [CrossRef] [PubMed]
  15. Shah, F.; Wu, W. Soil and Crop Management Strategies to Ensure Higher Crop Productivity within Sustainable Environments. Sustainability 2019, 11, 1485. [Google Scholar] [CrossRef]
  16. Stoate, C.; Báldi, A.; Beja, P.; Boatman, N.; Herzon, I.; van Doorn, A.; de Snoo, G.; Rakosy, L.; Ramwell, C. Ecological impacts of early 21st century agricultural change in Europe—A review. J. Environ. Manag. 2009, 91, 22–46. [Google Scholar] [CrossRef] [PubMed]
  17. Cyrys, J.; Stölzel, M.; Heinrich, J.; Kreyling, W.; Menzel, N.; Wittmaack, K.; Tuch, T.; Wichmann, H.-E. Elemental composition and sources of fine and ultrafine ambient particles in Erfurt, Germany. Sci. Total Environ. 2003, 305, 143–156. [Google Scholar] [CrossRef] [PubMed]
  18. Rashid, A.; Schutte, B.J.; Ulery, A.; Deyholos, M.K.; Sanogo, S.; Lehnhoff, E.A.; Beck, L. Heavy Metal Contamination in Agricultural Soil: Environmental Pollutants Affecting Crop Health. Agronomy 2023, 13, 1521. [Google Scholar] [CrossRef]
  19. Yadav, A.; Yadav, K.; Abd-Elsalam, K.A. Nanofertilizers: Types, Delivery and Advantages in Agricultural Sustainability. Agrochemicals 2023, 2, 296–336. [Google Scholar] [CrossRef]
  20. Ravisankar, N.; Ansari, M.A.; Panwar, A.S.; Aulakh, C.S.; Sharma, S.K.; Suganthy, M.; Jaganathan, D. Organic farming research in India: Potential technologies and way forward. Indian J. Agron. 2021, 66, S142–S162. [Google Scholar]
  21. Shukla, A.K.; Behera, S.K.; Chaudhari, S.K.; Singh, G. Fertilizer use in Indian agriculture and its impact on human health and environment. Indian J. Fertil. 2022, 18, 218–237. [Google Scholar]
  22. Alengebawy, A.; Abdelkhalek, S.T.; Qureshi, S.R.; Wang, M.-Q. Heavy Metals and Pesticides Toxicity in Agricultural Soil and Plants: Ecological Risks and Human Health Implications. Toxics 2021, 9, 42. [Google Scholar] [CrossRef] [PubMed]
  23. Pahalvi, H.N.; Rafiya, L.; Rashid, S.; Nisar, B.; Kamili, A.N. Chemical fertilizers and their impact on soil health. In Microbiota and Biofertilizers, Volume 2; Ecofriendly tools for reclamation of degraded soil environs; Springer: Cham, Switzerland, 2021; pp. 1–20. [Google Scholar]
  24. Gambuś, F.; Wieczorek, J. Pollution of fertilizers with heavy metals. Ecol. Chem. Eng. A 2012, 19, 353–360. [Google Scholar] [CrossRef] [PubMed]
  25. Gall, J.E.; Boyd, R.S.; Rajakaruna, N. Transfer of heavy metals through terrestrial food webs: A review. Environ. Monit. Assess. 2015, 187, 1–21. [Google Scholar] [CrossRef]
  26. Palansooriya, K.N.; Shaheen, S.M.; Chen, S.S.; Tsang, D.C.W.; Hashimoto, Y.; Hou, D.; Bolan, N.S.; Rinklebe, J.; Ok, Y.S. Soil amendments for immobilization of potentially toxic elements in contaminated soils: A critical review. Environ. Int. 2020, 134, 105046. [Google Scholar] [CrossRef] [PubMed]
  27. Hu, W.; Huang, B.; Shi, X.; Chen, W.; Zhao, Y.; Jiao, W. Accumulation and health risk of heavy metals in a plot-scale vegetable production system in a peri-urban vegetable farm near Nanjing, China. Ecotoxicol. Environ. Saf. 2013, 98, 303–309. [Google Scholar] [CrossRef] [PubMed]
  28. Sharma, R.K.; Agrawal, M. Biological effects of heavy metals: An overview. J. Environ. Biol. 2005, 26, 301–313. [Google Scholar] [PubMed]
  29. Yang, G.-H.; Zhu, G.-Y.; Li, H.-L.; Han, X.-M.; Li, J.-M.; Ma, Y.-B. Accumulation and bioavailability of heavy metals in a soil-wheat/maize system with long-term sewage sludge amendments. J. Integr. Agric. 2018, 17, 1861–1870. [Google Scholar] [CrossRef]
  30. Adamo, P.; Iavazzo, P.; Albanese, S.; Agrelli, D.; De Vivo, B.; Lima, A. Bioavailability and soil-to-plant transfer factors as indicators of potentially toxic element contamination in agricultural soils. Sci. Total Environ. 2014, 500–501, 11–22. [Google Scholar] [CrossRef] [PubMed]
  31. Alavanja, M.; Baron, J.A.; Brownson, R.C.; Buffler, P.A.; DeMarini, D.M.; Djordjevic, M.V.; Doll, R.; Fontham, E.T.H.; Gao, Y.T.; Gray, N.; et al. Tobacco smoke and involuntary smoking. In IARC Monographs on the Evaluation of Carcinogenic Risks to Humans; World Health Organization International Agency for Research on Cancer: Lyon, France, 2004; Volume 83, pp. 1–1413. [Google Scholar]
  32. Duan, B.; Feng, Q. Comparison of the Potential Ecological and Human Health Risks of Heavy Metals from Sewage Sludge and Livestock Manure for Agricultural Use. Toxics 2021, 9, 145. [Google Scholar] [CrossRef] [PubMed]
  33. Lin, M.; Gui, H.; Wang, Y.; Peng, W. Pollution characteristics, source apportionment, and health risk of heavy metals in street dust of Suzhou, China. Environ. Sci. Pollut. Res. 2017, 24, 1987–1998. [Google Scholar] [CrossRef] [PubMed]
  34. Meng, W.; Wang, Z.; Hu, B.; Wang, Z.; Li, H.; Goodman, R.C. Heavy metals in soil and plants after long-term sewage irrigation at Tianjin China: A case study assessment. Agric. Water Manag. 2016, 171, 153–161. [Google Scholar] [CrossRef]
  35. Jayakumar, M.; Surendran, U.; Raja, P.; Kumar, A.; Senapathi, V. A review of heavy metals accumulation pathways, sources and management in soils. Arab. J. Geosci. 2021, 14, 1–19. [Google Scholar] [CrossRef]
  36. Yu, Z.; Dong, J.; Fu, W.; Ye, Z.; Li, W.; Zhao, K. The Transfer Characteristics of Potentially Toxic Trace Elements in Different Soil-Rice Systems and Their Quantitative Models in Southeastern China. Int. J. Environ. Res. Public Health 2019, 16, 2503. [Google Scholar] [CrossRef]
  37. Zhang, Y.; Hou, D.; O’Connor, D.; Shen, Z.; Shi, P.; Ok, Y.S.; Tsang, D.C.W.; Wen, Y.; Luo, M. Lead contamination in Chinese surface soils: Source identification, spatial-temporal distribution and associated health risks. Crit. Rev. Environ. Sci. Technol. 2019, 49, 1386–1423. [Google Scholar] [CrossRef]
  38. Nematollahi, M.J.; Keshavarzi, B.; Zaremoaiedi, F.; Rajabzadeh, M.A.; Moore, F. Ecological-health risk assessment and bioavailability of potentially toxic elements (PTEs) in soil and plant around a copper smelter. Environ. Monit. Assess. 2020, 192, 1–19. [Google Scholar] [CrossRef] [PubMed]
  39. Nieder, R.; Benbi, D.K. Potentially toxic elements in the environment—A review of sources, sinks, pathways and mitigation measures. Rev. Environ. Health 2023. [Google Scholar] [CrossRef] [PubMed]
  40. Qu, C.; Sun, K.; Wang, S.; Huang, L.; Bi, J. Monte Carlo Simulation-Based Health Risk Assessment of Heavy Metal Soil Pollution: A Case Study in the Qixia Mining Area, China. Hum. Ecol. Risk Assess. Int. J. 2012, 18, 733–750. [Google Scholar] [CrossRef]
  41. Bhattacharyya, R.; Bhatia, A.; Ghosh, B.N.; Santra, P.; Mandal, D.; Kumar, G.; Singh, R.J.; Madhu, M.; Ghosh, A.; Mandal, A.K.; et al. Soil degradation and mitigation in agricultural lands in the Indian Anthropocene. Eur. J. Soil Sci. 2023, 74, e13388. [Google Scholar] [CrossRef]
  42. Brar, M.S.; Malhi, S.S.; Singh, A.P.; Arora, C.L.; Gill, K.S. Sewage water irrigation effects on some potentially toxic trace elements in soil and potato plants in northwestern India. Can. J. Soil Sci. 2000, 80, 465–471. [Google Scholar] [CrossRef]
  43. Gomiero, T. Soil Degradation, Land Scarcity and Food Security: Reviewing a Complex Challenge. Sustainability 2016, 8, 281. [Google Scholar] [CrossRef]
  44. Manna, M.C.; Rahman, M.M.; Naidu, R.; Bari, A.S.M.F.; Singh, A.B.; Thakur, J.K.; Ghosh, A.; Patra, A.K.; Chaudhari, S.K.; Subbarao, A. Organic farming: A prospect for food, environment and livelihood security in Indian agriculture. In Advances in Agronomy; Elsevier: Amsterdam, The Netherlands, 2021; Volume 170, pp. 101–153. [Google Scholar] [CrossRef]
  45. Sharma, N.; Singhvi, R. Effects of Chemical Fertilizers and Pesticides on Human Health and Environment: A Review. Int. J. Agric. Environ. Biotechnol. 2017, 10, 675–680. [Google Scholar] [CrossRef]
  46. Daulta, R.; Prakash, M.; Goyal, S. Metal content in soils of Northern India and crop response: A review. Int. J. Environ. Sci. Technol. 2023, 20, 4521–4548. [Google Scholar] [CrossRef]
  47. ENVIS Centre Punjab. Fertilizer Consumption in Punjab (1960–2017). 2018. Available online: http://punenvis.nic.in/index3.aspx?sslid=5862&subsublinkid=4973&langid=1&mid=1 (accessed on 10 May 2024).
  48. World Bank Collection. Fertilizer Consumption (Kilograms per Hectare of Arable Land. 2016. Available online: https://data.worldbank.org/indicator/AG.CON.FERT.ZS?end=2016&start=2002&view=chart (accessed on 10 May 2024).
  49. Kaur, R.; Pakade, Y.B.; Katnoria, J.K. A study on physicochemical analysis of road and railway track side soil samples of Amritsar (Punjab) and their genotoxic effects. Int. J. Environ. Ecol. Eng. 2014, 8, 510–513. [Google Scholar]
  50. Kumar, R.; Mittal, S.; Peechat, S.; Sahoo, P.K.; Sahoo, S.K. Quantification of groundwater–agricultural soil quality and associated health risks in the agri-intensive Sutlej River Basin of Punjab, India. Environ. Geochem. Health 2020, 42, 4245–4268. [Google Scholar] [CrossRef] [PubMed]
  51. Kaur, J.; Bhat, S.A.; Singh, N.; Bhatti, S.S.; Kaur, V.; Katnoria, J.K. Assessment of the Heavy Metal Contamination of Roadside Soils Alongside Buddha Nullah, Ludhiana, (Punjab) India. Int. J. Environ. Res. Public Health 2022, 19, 1596. [Google Scholar] [CrossRef] [PubMed]
  52. Sharma, P.; Kaur, J.; Katnoria, J.K. Assessment of spatial variations in pollution load of agricultural soil samples of Ludhiana district, Punjab. Environ. Monit. Assess. 2023, 195, 1–18. [Google Scholar] [CrossRef] [PubMed]
  53. Kaur, G.; Kaur, R.; Boparai, J.K.; Sharma, V.K.; Sharma, P.K. Investigating the heavy metals and pesticides concentration in agricultural soil and groundwater of mansa district of Punjab, India: Insights into its impact on human health. Int. J. Innovat. Res. Sci. Eng. 2017, 3, 179–187. [Google Scholar]
  54. CGWB. Groundwater Information Booklet, Muktsar District Punjab. 2013. Available online: http://cgwb.gov.in/districtprofile/Punjab/muktsar.pdf (accessed on 10 May 2024).
  55. CGWB. Groundwater Information Booklet, Faridkot District Punjab. 2013. Available online: https://www.cgwb.gov.in/old_website/District_Profile/Punjab/Faridkot.pdf (accessed on 10 May 2024).
  56. CGWB. Groundwater Information Booklet, Moga District Punjab. 2013. Available online: https://www.cgwb.gov.in/old_website/District_Profile/Punjab/Moga.pdf (accessed on 10 May 2024).
  57. NRSC. Thematic Data set—Geomorphology (50k) through Bhuvan. 2006. Available online: https://bhuvan-app1.nrsc.gov.in/thematic/thematic/index.php (accessed on 10 May 2024).
  58. IS: 2720 (Part 26)-1987; Methods of Test for Soils (Second revision). Determination of pH Value. Bureau of Indian Standards: New Delhi, India, 1987.
  59. IS: 14767-2000; Determination of the Specific Electrical Conductivity of Soils Method of Test. Bureau of Indian Standards: New Delhi, India, 2000.
  60. Walkley, A. A critical examination of a rapid method for determining organic carbon in soils—Effect of variations in digestion conditions and of inorganic soil constituents. Soil Sci. 1947, 63, 251–264. [Google Scholar] [CrossRef]
  61. Olsen, S.R. Estimation of Available Phosphorus in Soils by Extraction with Sodium Bicarbonate USDA Circular; Gov. Printing Office: Washington, DC, USA, 1954; Volume 939, pp. 1–19. [Google Scholar]
  62. Filzmoser, P.; Hron, K.; Reimann, C. Principal component analysis for compositional data with outliers. Environ. Off. J. Int. Environ. Soc. 2009, 20, 621–632. [Google Scholar] [CrossRef]
  63. Zhang, C.; Luo, L.; Xu, W.; Ledwith, V. Use of local Moran’s I and GIS to identify pollution hotspots of Pb in urban soils of Galway, Ireland. Sci. Total Environ. 2008, 398, 212–221. [Google Scholar] [CrossRef]
  64. Abrahim, G.M.S.; Parker, R.J. Assessment of heavy metal enrichment factors and the degree of contamination in marine sediments from Tamaki Estuary, Auckland, New Zealand. Environ. Monit. Assess. 2007, 136, 227–238. [Google Scholar] [CrossRef] [PubMed]
  65. Sahoo, P.K.; Equeenuddin, S.M.; Powell, M.A. Trace elements in soils around coal mines: Current scenario, impact and available techniques for management. Curr. Pollut. Rep. 2016, 2, 1–14. [Google Scholar] [CrossRef]
  66. Reimann, C.; Garrett, R.G. Geochemical background—Concept and reality. Sci. Total Environ. 2005, 350, 12–27. [Google Scholar] [CrossRef] [PubMed]
  67. Gowd, S.S.; Reddy, M.R.; Govil, P. Assessment of heavy metal contamination in soils at Jajmau (Kanpur) and Unnao industrial areas of the Ganga Plain, Uttar Pradesh, India. J. Hazard. Mater. 2010, 174, 113–121. [Google Scholar] [CrossRef] [PubMed]
  68. Kabata-Pendias, A.; Pendias, H. Trace Elements in Soils and Plants; CRC Press: Boca Raton, FL, USA, 1998. [Google Scholar]
  69. Håkanson, L. An ecological risk index for aquatic pollution control. A sedimentological approach. Water Res. 1980, 14, 975–1001. [Google Scholar] [CrossRef]
  70. Halim, M.A.; Majumder, R.K.; Zaman, M.N. Paddy soil heavy metal contamination and uptake in rice plants from the adjacent area of Barapukuria coal mine, northwest Bangladesh. Arab. J. Geosci. 2015, 8, 3391–3401. [Google Scholar] [CrossRef]
  71. Muller, G. Index of Geoaccumulation in sediments of the Rhine River. GEO J. 1969, 2, 108–118. [Google Scholar]
  72. USEPA. Risk Assessment Guidance for Superfund, Vol. I, Human Health Evaluation Manual (Part A); Office of Emergency and Remedial Response: Washington, DC, USA, 1989. [Google Scholar]
  73. US Environmental Protection Agency. Exposure Factors Handbook; EPA/540/1-88/001; Office of Remedial Response: Washington, DC, USA, 2002. [Google Scholar]
  74. Cocârţă, D.M.; Neamţu, S.; Deac, A.M.R. Carcinogenic risk evaluation for human health risk assessment from soils contaminated with heavy metals. Int. J. Environ. Sci. Technol. 2016, 13, 2025–2036. [Google Scholar] [CrossRef]
  75. Aendo, P.; Netvichian, R.; Thiendedsakul, P.; Khaodhiar, S.; Tulayakul, P. Carcinogenic Risk of Pb, Cd, Ni, and Cr and Critical Ecological Risk of Cd and Cu in Soil and Groundwater around the Municipal Solid Waste Open Dump in Central Thailand. J. Environ. Public Health 2022, 2022, 3062215. [Google Scholar] [CrossRef]
  76. US Environmental Protection Agency (USEPA). Riskbased Concentration Table. 2010. Available online: http://www.epa.gov/reg3hwmd/risk/human/index.htm (accessed on 10 May 2024).
  77. Kaur, I.; Gupta, A.; Singh, B.P.; Sharma, S.; Kumar, A. Assessment of radon and potentially toxic metals in agricultural soils of Punjab, India. Microchem. J. 2019, 146, 444–454. [Google Scholar] [CrossRef]
  78. Kumar, R.; Kumar, R.; Mittal, S.; Arora, M.; Babu, J.N. Role of soil physicochemical characteristics on the present state of arsenic and its adsorption in alluvial soils of two agri-intensive region of Bathinda, Punjab, India. J. Soils Sediments 2016, 16, 605–620. [Google Scholar] [CrossRef]
  79. Parihar, J.K.; Parihar, P.K.; Pakade, Y.B.; Katnoria, J.K. Bioaccumulation potential of indigenous plants for heavy metal phytoremediation in rural areas of Shaheed Bhagat Singh Nagar, Punjab (India). Environ. Sci. Pollut. Res. 2021, 28, 2426–2442. [Google Scholar] [CrossRef] [PubMed]
  80. Bhatti, S.S.; Kumar, V.; Singh, N.; Sambyal, V.; Singh, J.; Katnoria, J.K.; Nagpal, A.K. Physico-chemical Properties and Heavy Metal Contents of Soils and Kharif Crops of Punjab, India. Procedia Environ. Sci. 2016, 35, 801–808. [Google Scholar] [CrossRef]
  81. Sonkar, V.; Jaswal, V.; Chenlak, S.; Nandabalan, Y.K. Pollution status and health risk assessment of heavy metals in the soil of Sahibzada Ajit Singh (SAS) Nagar district of Punjab, India and its source apportionment. J. Geochem. Explor. 2024, 261, 107453. [Google Scholar] [CrossRef]
  82. Bala, N.; Pakade, Y.B.; Mahurkar, M.; Kadaverugu, R.; Minakshi; Katnoria, J.K. Spatial distribution and source identification of metal contaminants in soil and rice grain samples: A study on exploration of soil quality and risk assessment. Environ. Monit. Assess. 2024, 196, 260. [Google Scholar] [CrossRef]
  83. Bhatti, S.S.; Kumar, V.; Sambyal, V.; Singh, J.; Nagpal, A.K. Comparative analysis of tissue compartmentalized heavy metal uptake by common forage crop: A field experiment. CATENA 2018, 160, 185–193. [Google Scholar] [CrossRef]
  84. Karanveer, K.; Bala, R.; Das, D. Appraisal and spatial distribution of Potential toxic elements in agricultural and non-agricultural land from alluvial plains of Punjab, India. In Proceedings of the 2022 Goldschmidt Conference, Honolulu, HI, USA, 15 July 2022; Goldschmidt: Wilmington, DE, USA, 2022. [Google Scholar]
  85. Setia, R.; Dhaliwal, S.S.; Singh, R.; Kumar, V.; Taneja, S.; Kukal, S.S.; Pateriya, B. Phytoavailability and human risk assessment of heavy metals in soils and food crops around Sutlej river, India. Chemosphere 2021, 263, 128321. [Google Scholar] [CrossRef]
  86. Chen, J.; Wei, F.; Zheng, C.; Wu, Y.; Adriano, D.C. Background concentrations of elements in soils of China. Water Air Soil Pollut. 1991, 57, 699–712. [Google Scholar] [CrossRef]
  87. Shacklette, H.T.; Boerngen, J.G. Element Concentrations in Soils and Other Surficial Materials of the Conterminous United States; US Government Printing Office: Washington, DC, USA, 1984; Volume 1270. [Google Scholar]
  88. Pérez, C.; Martínez, M.J.; Vidal, J.; Navarro, C. Proposed reference values for heavy metals in calcaric fluvisols of the Huerta de Murcia (SE Spain). In Proceedings of the International Symposium on Sustainable Use and Management of Soils in Arid and Semiarid Regions, Cartagena, Colombia, 22–26 September 2002; Quaderna Editorial: Cartagena, Colombia, 2002; pp. 22–26. [Google Scholar]
  89. Wedepohl, K.H. The composition of the continental crust. Geochim. Cosmochim. Acta 1995, 59, 1217–1232. [Google Scholar] [CrossRef]
  90. Chaudhari, U.; Mehta, M.; Sahoo, P.K.; Mittal, S.; Tiwari, R.P. Co-occurrence of geogenic uranium and fluoride in a semiarid belt of the Punjab plains, India. Groundw. Sustain. Dev. 2023, 23, 101019. [Google Scholar] [CrossRef]
  91. Sahoo, P.K.; Virk, H.S.; Powell, M.A.; Kumar, R.; Pattanaik, J.K.; Salomao, G.N.; Mittal, S.; Chouhan, L.; Nandabalan, Y.K.; Tiwari, R.P. Meta-analysis of uranium contamination in groundwater of the alluvial plains of Punjab, northwest India: Status, health risk, and hydrogeochemical processes. Sci. Total Environ. 2022, 807, 151753. [Google Scholar] [CrossRef] [PubMed]
  92. Krishan, G.; Taloor, A.K.; Sudarsan, N.; Bhattacharya, P.; Kumar, S.; Ghosh, N.C.; Singh, S.; Sharma, A.; Rao, M.S.; Mittal, S.; et al. Occurrences of potentially toxic trace metals in groundwater of the state of Punjab in northern India. Groundw. Sustain. Dev. 2021, 15, 100655. [Google Scholar] [CrossRef]
  93. Balakrishna, M.; Krishna, T.G.; Nagamadhuri, K.V.; Sudhakar, P.; Reddy, B.R.; Yuvaraj, K.M. Soil fertility and leaf nutrient status of mango orchards in the YSR district of Andhra Pradesh. Pharma Innov. J. 2021, 10, 87–91. [Google Scholar]
  94. Gong, Q.; Chen, P.; Shi, R.; Gao, Y.; Zheng, S.-A.; Xu, Y.; Shao, C.; Zheng, X. Health Assessment of Trace Metal Concentrations in Organic Fertilizer in Northern China. Int. J. Environ. Res. Public Health 2019, 16, 1031. [Google Scholar] [CrossRef] [PubMed]
  95. Sharma, S.; Nagpal, A.K.; Kaur, I. Heavy metal contamination in soil, food crops and associated health risks for residents of Ropar wetland, Punjab, India and its environs. Food Chem. 2018, 255, 15–22. [Google Scholar] [CrossRef] [PubMed]
  96. Huo, X.-N.; Li, H.; Sun, D.-F.; Zhou, L.-D.; Li, B.-G. Combining Geostatistics with Moran’s I Analysis for Mapping Soil Heavy Metals in Beijing, China. Int. J. Environ. Res. Public Health 2012, 9, 995–1017. [Google Scholar] [CrossRef]
  97. Li, W.; Xu, B.; Song, Q.; Liu, X.; Xu, J.; Brookes, P.C. The identification of ‘hotspots’ of heavy metal pollution in soil–rice systems at a regional scale in eastern China. Sci. Total Environ. 2014, 472, 407–420. [Google Scholar] [CrossRef] [PubMed]
  98. Fei, X.; Xiao, R.; Christakos, G.; Langousis, A.; Ren, Z.; Tian, Y.; Lv, X. Comprehensive assessment and source apportionment of heavy metals in Shanghai agricultural soils with different fertility levels. Ecol. Indic. 2019, 106, 105508. [Google Scholar] [CrossRef]
  99. Martin, H.W.; Kaplan, D.I. Temporal Changes in Cadmium, Thallium, and Vanadium Mobility in Soil and Phytoavailability under Field Conditions. Water Air Soil Pollut. 1998, 101, 399–410. [Google Scholar] [CrossRef]
  100. Shen, Q.; Demisie, W.; Zhang, S.; Zhang, M. The Association of Heavy Metals with Iron Oxides in the Aggregates of Naturally Enriched Soil. Bull. Environ. Contam. Toxicol. 2020, 104, 144–148. [Google Scholar] [CrossRef] [PubMed]
  101. Zeng, F.; Ali, S.; Zhang, H.; Ouyang, Y.; Qiu, B.; Wu, F.; Zhang, G. The influence of pH and organic matter content in paddy soil on heavy metal availability and their uptake by rice plants. Environ. Pollut. 2011, 159, 84–91. [Google Scholar] [CrossRef] [PubMed]
  102. Zhong, X.; Chen, Z.; Li, Y.; Ding, K.; Liu, W.; Liu, Y.; Yuan, Y.; Zhang, M.; Baker, A.J.M.; Yang, W.; et al. Factors influencing heavy metal availability and risk assessment of soils at typical metal mines in Eastern China. J. Hazard. Mater. 2020, 400, 123289. [Google Scholar] [CrossRef]
  103. Moturi, M.C.Z.; Rawat, M.; Subramanian, V. Distribution and fractionation of heavy metals in solid waste from selected sites in the industrial belt of Delhi, India. Environ. Monit. Assess. 2004, 95, 183–199. [Google Scholar] [CrossRef] [PubMed]
  104. Liu, Z.; Bai, Y.; Gao, J.; Li, J. Driving factors on accumulation of cadmium, lead, copper, zinc in agricultural soil and products of the North China Plain. Sci. Rep. 2023, 13, 7429. [Google Scholar] [CrossRef] [PubMed]
  105. Maji, P.; Mistri, B. Chemical fertilization as potential pathways of heavy metal contents in agricultural soil in Memari II block, west Bengal, India. Pollut. Resear. J. 2022, 41, 1008–10115. [Google Scholar] [CrossRef]
  106. Singh, S.; Raju, N.J.; Nazneen, S. Environmental risk of heavy metal pollution and contamination sources using multivariate analysis in the soils of Varanasi environs, India. Environ. Monit. Assess. 2015, 187, 345. [Google Scholar] [CrossRef] [PubMed]
  107. Weintraub, M.N.; Schimel, J.P. Interactions between Carbon and Nitrogen Mineralization and Soil Organic Matter Chemistry in Arctic Tundra Soils. Ecosystems 2003, 6, 129–143. [Google Scholar] [CrossRef]
  108. Bouaroudj, S.; Menad, A.; Bounamous, A.; Ali-Khodja, H.; Gherib, A.; Weigel, D.E.; Chenchouni, H. Assessment of water quality at the largest dam in Algeria (Beni Haroun Dam) and effects of irrigation on soil characteristics of agricultural lands. Chemosphere 2019, 219, 76–88. [Google Scholar] [CrossRef] [PubMed]
  109. Cui, J.-L.; Shi, J.; Jiang, G.; Jing, C. Arsenic Levels and Speciation from Ingestion Exposures to Biomarkers in Shanxi, China: Implications for Human Health. Environ. Sci. Technol. 2013, 47, 5419–5424. [Google Scholar] [CrossRef] [PubMed]
  110. Rinklebe, J.; Antoniadis, V.; Shaheen, S.M.; Rosche, O.; Altermann, M. Health risk assessment of potentially toxic elements in soils along the Central Elbe River, Germany. Environ. Int. 2019, 126, 76–88. [Google Scholar] [CrossRef] [PubMed]
  111. Taylor, A.A.; Tsuji, J.S.; Garry, M.R.; McArdle, M.E.; Goodfellow, W.L.; Adams, W.J.; Menzie, C.A. Critical Review of Exposure and Effects: Implications for Setting Regulatory Health Criteria for Ingested Copper. Environ. Manag. 2020, 65, 131–159. [Google Scholar] [CrossRef] [PubMed]
  112. Man, S.; Gao, W.; Zhang, Y.; Huang, L.; Liu, C. Chemical study and medical application of saponins as anti-cancer agents. Fitoterapia 2010, 81, 703–714. [Google Scholar] [CrossRef] [PubMed]
  113. Zhao, L.; Xu, Y.; Hou, H.; Shangguan, Y.; Li, F. Source identification and health risk assessment of metals in urban soils around the Tanggu chemical industrial district, Tianjin, China. Sci. Total Environ. 2014, 468, 654–662. [Google Scholar] [CrossRef]
Figure 1. Study area map; (a) landuse/landcover (LULC) map with distribution of sampling points (1 to 76), (b) lithology map showing the distribution of soil in the study area, (c) soil age showing most of the soil were middle-late Pleistocene, and (d) type of soil formation showing the area dominated with older alluvium. (The shapefile of these maps were acquired from Bhuvan portal [57]).
Minerals 14 00576 g001
Figure 2. Geospatial distribution of PTEs in soils. (a) Higher concentration of Zn found in Moga and lower concentration in Muktsar. (b) Concentration of Pb dominated Muktsar and was lower in Faridkot and Moga. (c) Mn concentrations were higher in Moga and Faridkot than in Muktsar. (d) Aluminum concentrations were higher in Faridkot and Moga than in Muktsar. (e) Distribution of Cr was lower in whole area except some area of all three districts. (f) Concentration of Fe was higher in most of Moga and Faridkot and lower in Muktsar except some parts.
Minerals 14 00576 g002
Figure 3. Local Indicator of Spatial Autocorrelation map depicting (a) Al, (b) As, (c) Cr, (d) Cu, (e) Mn, (f) Ni, (g) Pb, (h) V, (i) Zn, and (j) Fe; depicting the Moran’s I of Pb, Zn, and Mn, which were high and positive, showing their spatial distribution in soil, and also depicting that a high-high association of Pb is dominating Muktsar, and a low-low association of Zn and Mn is in Muktsar, different than in Faridkot and Moga.
Minerals 14 00576 g003
Figure 4. Spearman rank correlation between PTEs and physicochemical properties of the soil. Depicting the strong positive association of Fe with Al, Ni, Mn, Pb, Zn, and TOC with a p-value < 0.05 because Fe hydroxide-oxyhydroxides have the ability to hold the metals on their surface. Strong positive association of TOC with Mn, V, Al, and Fe which shows the high TOC in the soil holds the metals, so the concentration of metals is also high (EC—electrical conductivity, SL—salinity, AP—available phosphorus, TOC—total organic carbon, TKN—total Kjeldahl nitrogen).
Minerals 14 00576 g004
Figure 5. Principal component analysis showed associations of PTEs with other soil physicochemical properties using log transformed data. Depicting the 47.6% variance of total variance covered in only two PCs (EC—electrical conductivity, S—salinity, AP—available phosphorus, TOC—total organic carbon, and TKN—total kjeldahl nitrogen).
Minerals 14 00576 g005
Figure 6. Box plot for (a) the contamination factor and (b) the geo-accumulation index of PTEs in soils. The box indicates approximately the 25th, 50th, (median = black line) and 75th percentile.
Minerals 14 00576 g006
Table 3. Concentration (mg/kg) of PTEs in different soil additives (such as fly ash, bottom ash, and chemical and organic fertilizers).
SourcesAsCdCrNiPbZnMnReferences
Fly Ash38.3-306.599.0187.5116638This study
Bottom Ash30.6-281.976.6128.996.6596This study
P fertilizers-0.1–170--1–30050–1450-[22]
N fertilizers-0.05–8.5--1–151–42-[22]
Lime fertilizers-0.04–0.1--2–12510–450-[22]
Manure fertilizers-0.3–0.8--2–6015–250-[22]
Solid waste-0.8–224-154–153423–530116–23,321494–19,964[103]
Organic fertilizer-5.87--49.62664.27-[104]
Urea-0.8-----[105]
DAP- 236.00-108.14174.54-[105]
SSP-12.3583.00 128.47216.14 [105]
DAP: Diammonium Phosphate, SSP: Single Super Phosphate.
Disclaimer/Publisher’s Note: The statements, opinions and data contained in all publications are solely those of the individual author(s) and contributor(s) and not of MDPI and/or the editor(s). MDPI and/or the editor(s) disclaim responsibility for any injury to people or property resulting from any ideas, methods, instructions or products referred to in the content.

