Article

Distribution and Enrichment of Au, Hg, and Tl in the Lanmuchang Deposit, Guizhou, China

1
School of Geography and Resources, Guizhou Education University, Guiyang 550018, China
2
Engineering Technology Innovation Center of Mineral Resources Explorations in Bedrock Zones, Ministry of Natural Resources of China, Guiyang 550081, China
3
Guizhou Bureau of Geology and Mineral Exploration and Development, Guiyang 550004, China
4
College of Resource and Environmental Engineering, Guizhou University, Guiyang 550025, China
5
State Key Laboratory of Ore Deposit Geochemistry, Institute of Geochemistry, Chinese Academy of Sciences, Guiyang 550081, China
6
105 Geological Team, Guizhou Bureau of Geology and Mineral Exploration and Development, Guiyang 550018, China
*
Author to whom correspondence should be addressed.
Minerals 2024, 14(6), 615; https://doi.org/10.3390/min14060615
Submission received: 30 April 2024 / Revised: 4 June 2024 / Accepted: 14 June 2024 / Published: 17 June 2024
(This article belongs to the Special Issue Selenium, Tellurium and Precious Metal Mineralogy)

Abstract

:
Mineralization characterized by Au, Hg, and Tl enrichment is rare, and research on Au, Hg, and Tl mineralization is limited. The Lanmuchang Au–Hg–Tl deposit is located in the “Golden Triangle” of Yunnan, Guizhou, and Guangxi Provinces in China. In this study, we used scanning electron microscopy (SEM), electron microprobe analysis (EPMA), and a Tescan integrated mineral analyzer (TIMA) to analyze the mineral composition and distribution of the different types of ores and identify the occurrence state and enrichment mechanism of ore-forming elements in the Lanmuchang deposit. The results show that the primary ore minerals in the Lanmuchang deposit are pyrite, cinnabar, and lorandite. Cinnabar is the primary carrier of Hg (>90%), and pyrite is the primary carrier of Tl (>60%). Gold, Hg, and Tl primarily occur as solid solutions in hydrothermal pyrite, whereas they primarily occur as nano-scale particles in diagenetic pyrite. The substitution of As for S in hydrothermal pyrite promotes Au enrichment. The coupled substitution of 2Fe2+ ⇔ Tl+ + As3+ may be a significant Tl incorporation mechanism and promotes the occurrence of Hg in pyrite. The As and Se contents and Cu/Au and Co/Ni ratios of the hydrothermal pyrite demonstrate that the ore-forming fluid was mostly in a low-temperature, low-salinity, almost-neutral pH, and nearly reducing environment. The results show that the mineralization of the Lanmuchang deposit is associated with the cooling, oxidation, water–rock interaction, and boiling processes of the ore-forming fluid(s).

1. Introduction

Carlin-type Au deposits are concentrated in the Nanpanjiang–Youjiang mineralization area in China, which forms the famous Yunnan–Guizhou–Guangxi Au metallogenic region (known as the Dian–Qian–Gui Golden Triangle). The Dian–Qian–Gui Golden Triangle contains the second largest concentration of Carlin-type Au deposits after Nevada in the United States [1,2]. Currently, 136 Au deposits with more than 920 tons of proven gold resources have been identified [3]. Furthermore, this area also contains a series of low-temperature hydrothermal deposits of As, Sb, Hg, and Tl [2,3].
Researchers have conducted extensive research on Au and Sb mineralization, which is widely developed in the Dian–Qian–Gui Golden Triangle, and many notable results have been reported: (1) Ore-forming elements generally include Au, As, Sb, Hg, Tl, and Cu, with or without small amounts of Ag and base metals and a high Au/Ag ratio (mostly >5) [2,3,4,5]. (2) Gold primarily forms a solid solution within pyrite along with As, Sb, Hg, and Tl; pyrite is, therefore, considered to be an effective indicator for revealing the properties of ore-forming fluids and the mineralization process of Carlin-type Au deposits [2,5,6]. (3) Gold mineralization is primarily related to the dissolution of iron-bearing carbonate minerals and the sulfidation of dissolved iron [2,7]. Antimony mineralization results from the precipitation of S and Sb from the ore-forming fluid through sulfidation to form a large amount of stibnite [8]. (4) Ore-forming fluid has a low temperature (180–300 °C), low salinity (<5 wt.% NaCl equivalent), medium density (0.73–1.03 g/cm3), and effectively neutral pH (5–7) and is rich in CO2 (6–75 mol%) [7,9,10,11]. (5) Dominant Au and As species in ore-forming fluid are Au(HS ) 2 , Au(HS)0, and H3 AsO 3 0 [2,12]. However, because of the small number of independent Hg and Tl deposits in this area, research on Hg and Tl mineralization is limited.
The Lanmuchang Au–Hg–Tl deposit is located in the Dian–Qian–Gui Triangle [13]. It is the first independent Tl deposit in the world [14], and the only Tl deposit of industrial value in the Carlin-type gold deposit region [15]. Mercury, Tl, and Au resources in the Lanmuchang deposit reach large-, large-, and small-scale deposits, respectively [13]. Gold, Hg, and Tl enrichment is uncommon in Carlin-type Au deposits, as well as other types of deposits worldwide. Research on the Lanmuchang deposit has been primarily conducted with respect to three aspects: (1) some rare natural minerals have been discovered (e.g., christite, lanmuchangite, and lorandite) through mineralogy and mineral chemistry [13,16,17]; (2) based on tectono-geochemical analysis, tectonic mineralization, and the prospecting method for extracting deep mineralization information, mineralization has been explored [18,19]; and (3) combining the characteristics of biogenic mineralization and hydrothermal alteration, a sedimentary hydrothermal mineralization model has been proposed [20,21,22].
In this study, we aimed to identify the mineral composition and distribution of various types of ores, analyze the occurrence and distribution of ore-forming elements, and trace and evaluate the enrichment mechanisms of Au, Hg, and Tl during mineralization. To this end, we used scanning electron microscopy (SEM), electron microprobe analysis (EPMA), and a Tescan integrated mineral analyzer (TIMA).

2. Geological Background

2.1. Regional Geology

The Lanmuchang deposit is located in the Nanpanjiang–Youjiang metallogenic area in a predominantly sedimentary basin (Figure 1). A rift began to form in the basin during the Early Devonian, and passive margin sedimentation occurred from the Devonian to the Triassic [2,5]. The subduction of the Indosinian block in the Middle–Late Triassic and the subduction of the Paleo-Pacific plate in the Middle–Late Jurassic led to magmatic activity and deformation in the basin [23]. Phanerozoic marine strata with a thickness of >10,000 m cover the Precambrian basement of the basin [3]. Permian and Triassic sedimentary rocks, including limestone, dolomite, siltstone, sandstone, and mudstone, are mainly exposed. Recent dating results suggest that the Carlin-type gold deposits in the area may have formed during the Middle–Late Triassic (215–200 Ma) and Jurassic–Early Cretaceous (155–140 Ma), corresponding to the Indosinian intracontinental orogeny and Yanshanian lithospheric extension, respectively [24,25,26].
The mineralization of Au, As, Sb, Hg, and Tl in the region is lithologically and structurally controlled [2,3,5,11]. Ore-bearing strata and rocks are diverse [3]. Based on the characteristics of orebodies and ore-controlling structures, mineralization can be classified into two types: stratum- and fault-controlled [2,3,11]. Stratum-controlled mineralization is characterized by the development of multilayer orebodies that are commonly located in structural alteration bodies (SBT) between rocks with different physical and chemical properties [3,11]. The rock types that host the mineralization primarily include limestone, siltstone, and basaltic pyroclastic rock. These orebodies are generally controlled by anticlines. Fault-controlled mineralization is typically governed by high-angle faults, forming lenses or vein-like orebodies [3,11]. The alterations closely related to Au mineralization primarily include pyritization, silicification, and decarbonation.

2.2. Deposit Geology

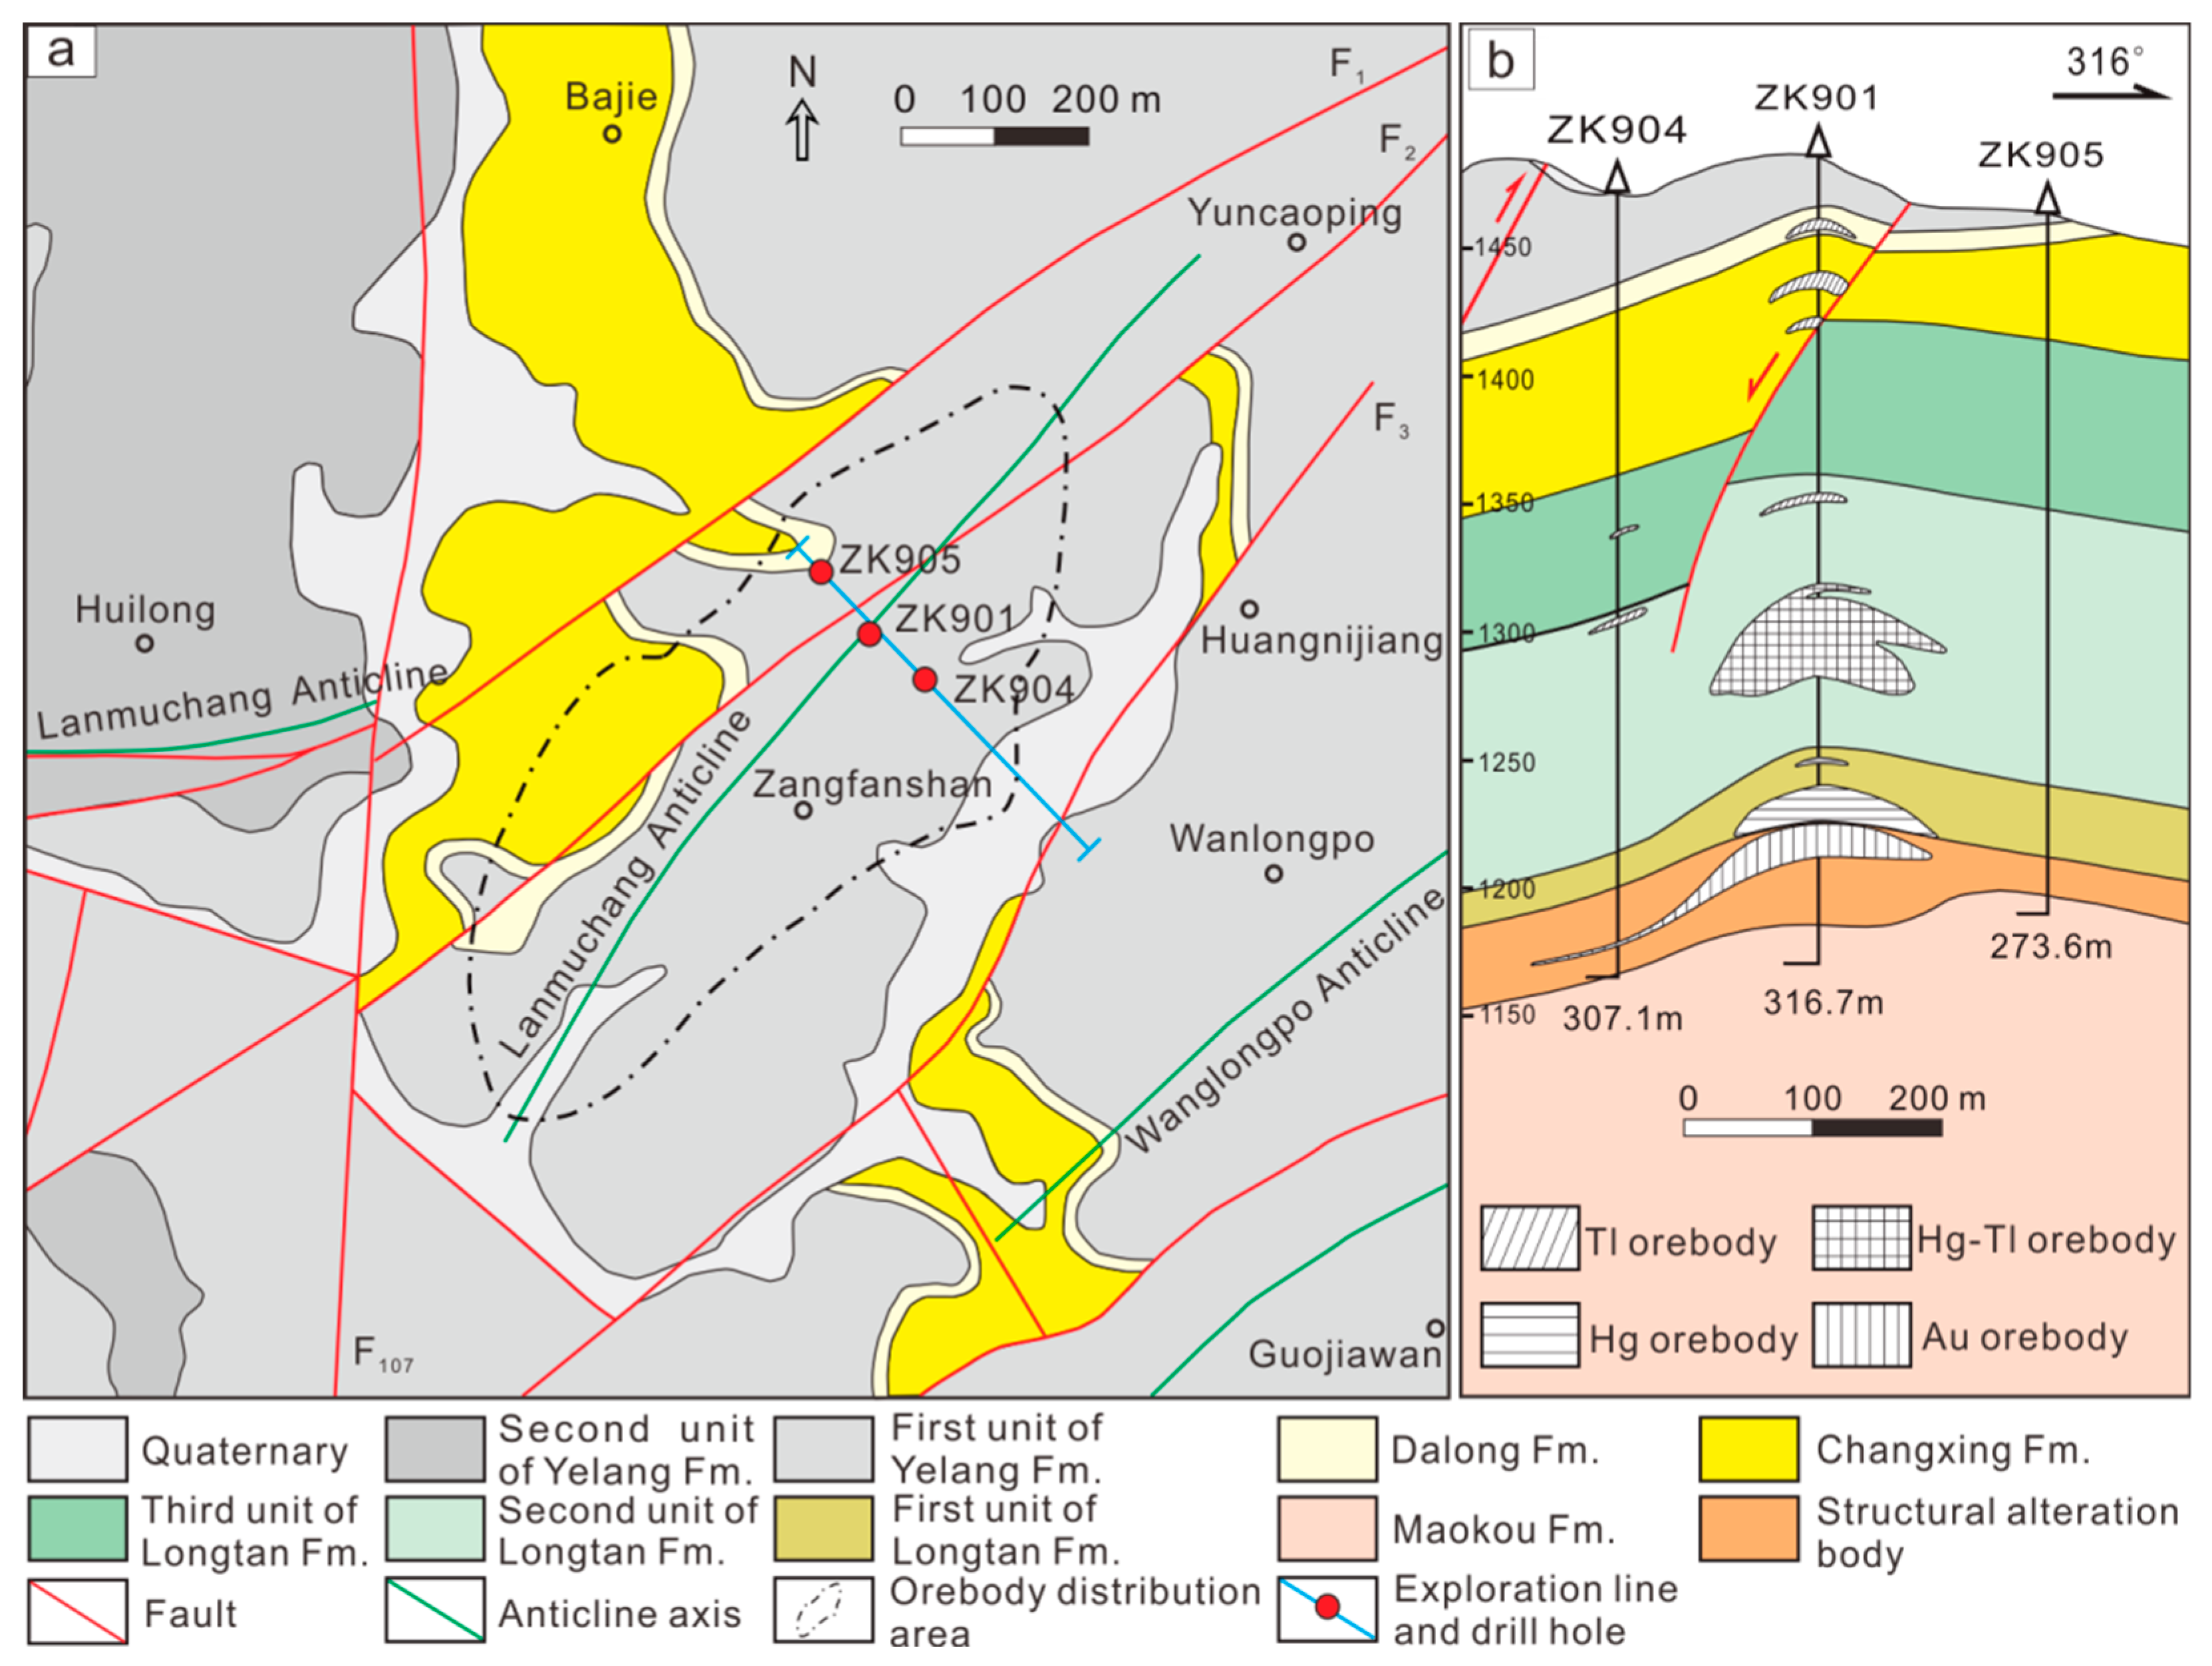
The Lanmuchang deposit is located in the central section of the southern limb of the Huijiabao Anticline and is controlled by the secondary Lanmuchang Anticline (Figure 2a). The Lanmuchang Anticline extends northeastward (40–60°) and is ~700 m long and ~250 m wide. Fault structures primarily developed in two groups: northeast- and approximately north–south-trending structures. The north–south-trending Huilong Fault cuts through the Lanmuchang Anticline at a breaking distance of ~200 m. Exposed strata primarily include the Lower Permian Maokou Formation; Upper Permian Longtan, Changxing, and Dalong Formation; and Lower Triassic Yelang Formation. Ore-bearing rocks are diverse and primarily include limestone, silty claystone, carbonaceous siltstone, and shale, which are typically mixed to form banded and laminated structures. Due to the diversity of the ore-bearing strata, more than 20 mineralized horizons have been identified [21]. Orebodies are primarily layered and stratiform, similar to the surrounding rock, and a small portion is produced in fault fracture zones in the form of veins and lenses. Thallium-rich orebodies are primarily located in the Changxing Formation (P3c), Dalong Formation (P3d), and the second unit of the Longtan Formation (P3l2). Mercury orebodies are primarily distributed in the first segment (P3l1) and second unit of the Longtan Formation (P3l2). Mercury and Tl mineralization partially overlap in space, forming Hg–Tl mixed orebodies. Au orebodies were primarily produced in the structural alteration body (SBT) between the Longtan and Maokou Formations. In general, various types of orebodies in the vertical direction show the typical mineralization distribution characteristics of “upper Tl (P3c+P3d), middle Hg–Tl (P3l2), lower Hg (P3l1), and bottom Au (SBT)” (Figure 2b).
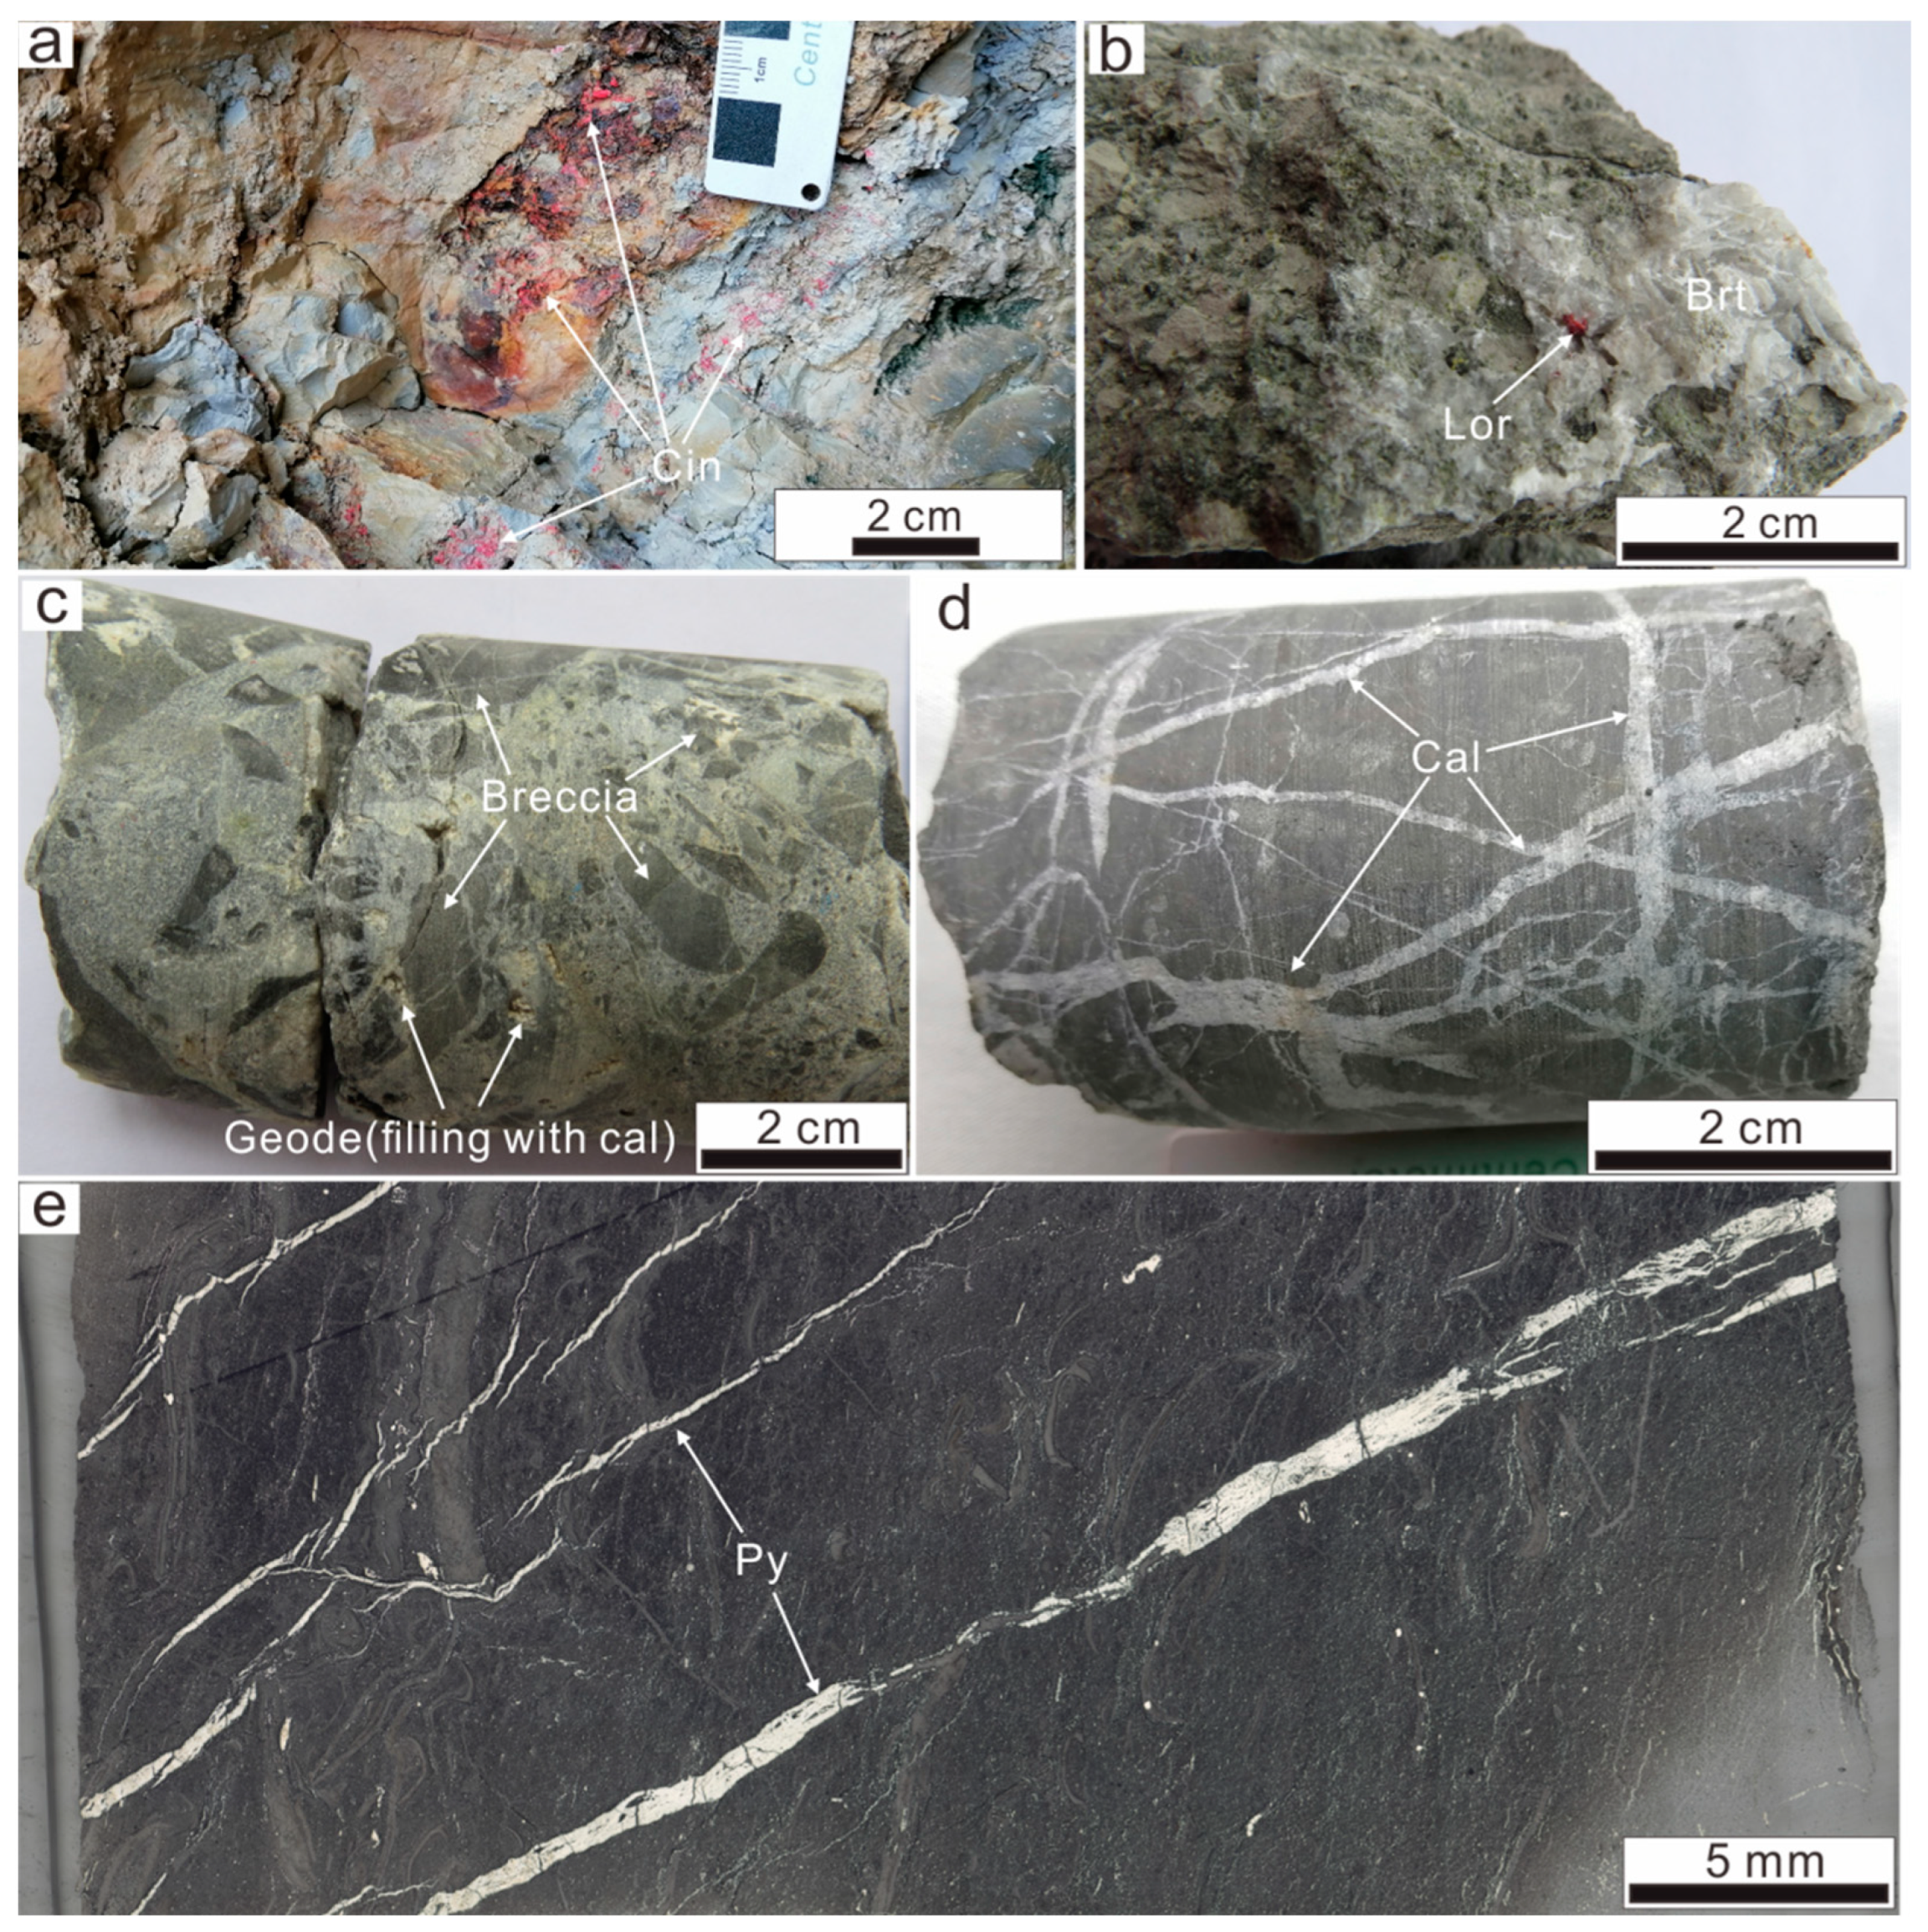
The ore textures of the Lanmuchang deposit primarily include laminar or banded (Figure 3a), disseminated (Figure 3b), brecciated (Figure 3c), miarolitic (Figure 3c), and vein or net-vein textures (Figure 3d,e). Hydrothermal alteration is dominated by low-temperature alteration, including sulfidation, silicification, decarbonation, carbonation, and kaolinitization. Kaolinitization is responsible for the formation of not only kaolinite but also subordinate amounts of illite. The primary assemblages of Au, Hg, and Tl mineralization are pyrite–stibnite–quartz–calcite–fluorite, cinnabar–pyrite–quartz–barite, and lorandite–pyrite–orpiment/orpiment–quartz, respectively. The mineral types of Hg and Tl mineralization are present in Hg–Tl mineralization. Pyrite, a highly developed interconnected ore mineral in Au, Hg, and Tl mineralization, is enriched in Au, Hg, Tl, and other elements at the microscopic level. Therefore, pyrite is considered to be a “bridge” mineral that runs through various spatial locations of the deposit and connects all mineralization types, thus providing an opportunity to assess the enrichment of different minerals throughout the orebody.

3. Sampling and Analytical Methods

As shown in Table S1, 16 samples of Au and Hg–Tl ores and surrounding rock were collected from four drill holes (ZK001, ZK005, ZK901, and ZK905) in the Lanmuchang deposit. Sample lithologies included clayey siltstone, claystone, and brecciated limestone. Polished thin sections (4.8 × 2.5 cm, 70–100 µm thick) were prepared for mineral type, abundance, and chemical composition analyses. Mineralogical observations were conducted by using an optical microscope and SEM to preliminarily determine the mineral morphology, assemblages, texture, and cutting relationship. Two representative samples were selected to further determine the mineral types, abundance, and paragenetic relationships by using a TIMA. Finally, the elemental composition and distribution of the different types of altered minerals were analyzed by using EPMA. Optical microscopy and SEM observations were performed at the Institute of Geochemistry, Chinese Academy of Sciences. TIMA and EPMA analyses were conducted at Nanjing Hongchuang Exploration Technology Service Co. Ltd. and the Hubei Geological Research Laboratory, respectively.

3.1. SEM

SEM analysis was performed by using a dual-beam focused ion beam (FIB)–SEM from Lunar and Planetary Sciences, Institute of Geochemistry, Chinese Academy of Sciences, equipped with secondary and backscattered electron detectors and an energy spectrometer. Prior to testing, the thin sections were carbon-coated to increase the conductivity. The sections were subsequently placed on a vacuum stage for semi-quantitative analysis and observation of the mineral microstructure and morphological characteristics. High-definition backscattered electron images and secondary electron images were acquired to provide precise positions for EPMA. The operating conditions were as follows: accelerating voltage of 20 kV, electron beam current of 1.6 nA, vertical spot diameter of ~1 μm, working distance of 25 mm, vacuum degree ranging from 20 to 60 Pa, EBSD scanning at 1000 points/s, and orientation measurement accuracy exceeding 0.1.

3.2. TIMA

TIMA analysis was performed by using a Mira-3 SEM device equipped with an EDAX Element 30 energy-dispersive X-ray spectroscope (EDS). First, the carbon-coated sample was placed in a field-emission SEM device and tested in high-vacuum mode, using TIMA software for calibration and focusing. Under an accelerating voltage of 25 kV and a probe current of 9.18 nA, the beam spot size, working distance, pixel spacing, and dot spacing were 75.42 nm, 15 mm, 3 μm, and 9 μm, respectively. Subsequently, the current and BSE signal intensities were calibrated with a platinum Faraday cup by using an automated procedure, and the EDS performance was checked with the manganese standard. The samples were scanned by using the TIMA liberation analysis module. The mass percentage of the sample was obtained by combining the analysis results with the density parameters of various minerals.

3.3. EPMA

First, the polished thin-sections were sputtered by carbon, and the desired spots for analyses were marked under the polarizing microscope and finally brought to the electron microprobe laboratory. A Shimadzu EPMA-1720H electron microprobe equipped with a five-channel spectrometer and an AZtec X-Max 50 Oxford X-ray spectrometer was used. Elements and X-ray lines used for the analysis were Fe (Kα), S (Kα), As (La), Tl (Mα), Hg (Mα), Sb (Lα), Au (Mα), Ag (Lα), Ni (Ka), Cr (Ka), Cu (Kα), Zn (Kα), Te (Lα), W (Mα), and Sn (Lα). Operating conditions included an accelerating voltage of 15 kV and a beam current of 20 nA with wavelength-dispersive X-ray spectrometers. The counting time was ≥10 s. The electron beam was <5 in diameter. Natural and synthetic standard specimens used for calibration were FeS2 (for Fe and S), FeAsS (for As), TlBr (for Tl), HgS (for Hg), Sb2S3 (for Sb), Au0 (for Au), Ag0 (for Ag), Ni0 (for Ni), Cr0 (for Cr), CuFeS2 (for Cu), ZnS (for Zn), PbTe (for Te), CaWO4 (for W), and SnS (for Sn). The element detection limit was 0.01%. The test data were calibrated by using ZAF, where Z is the atomic number calibration factor, A is the X-ray absorption calibration factor, and F is the X-ray fluorescence calibration factor. Sample testing and data calibration were performed following the requirements of the Chinese General Rules for Electron Microprobe Quantitative Analysis Methods (GB/T 15074-2008). The analysis error was <2%. In addition, various types of pyrite and cinnabar were selected for EPMA map scanning analysis.

4. Analytical Results

4.1. Ore Paragenesis and Their Textures

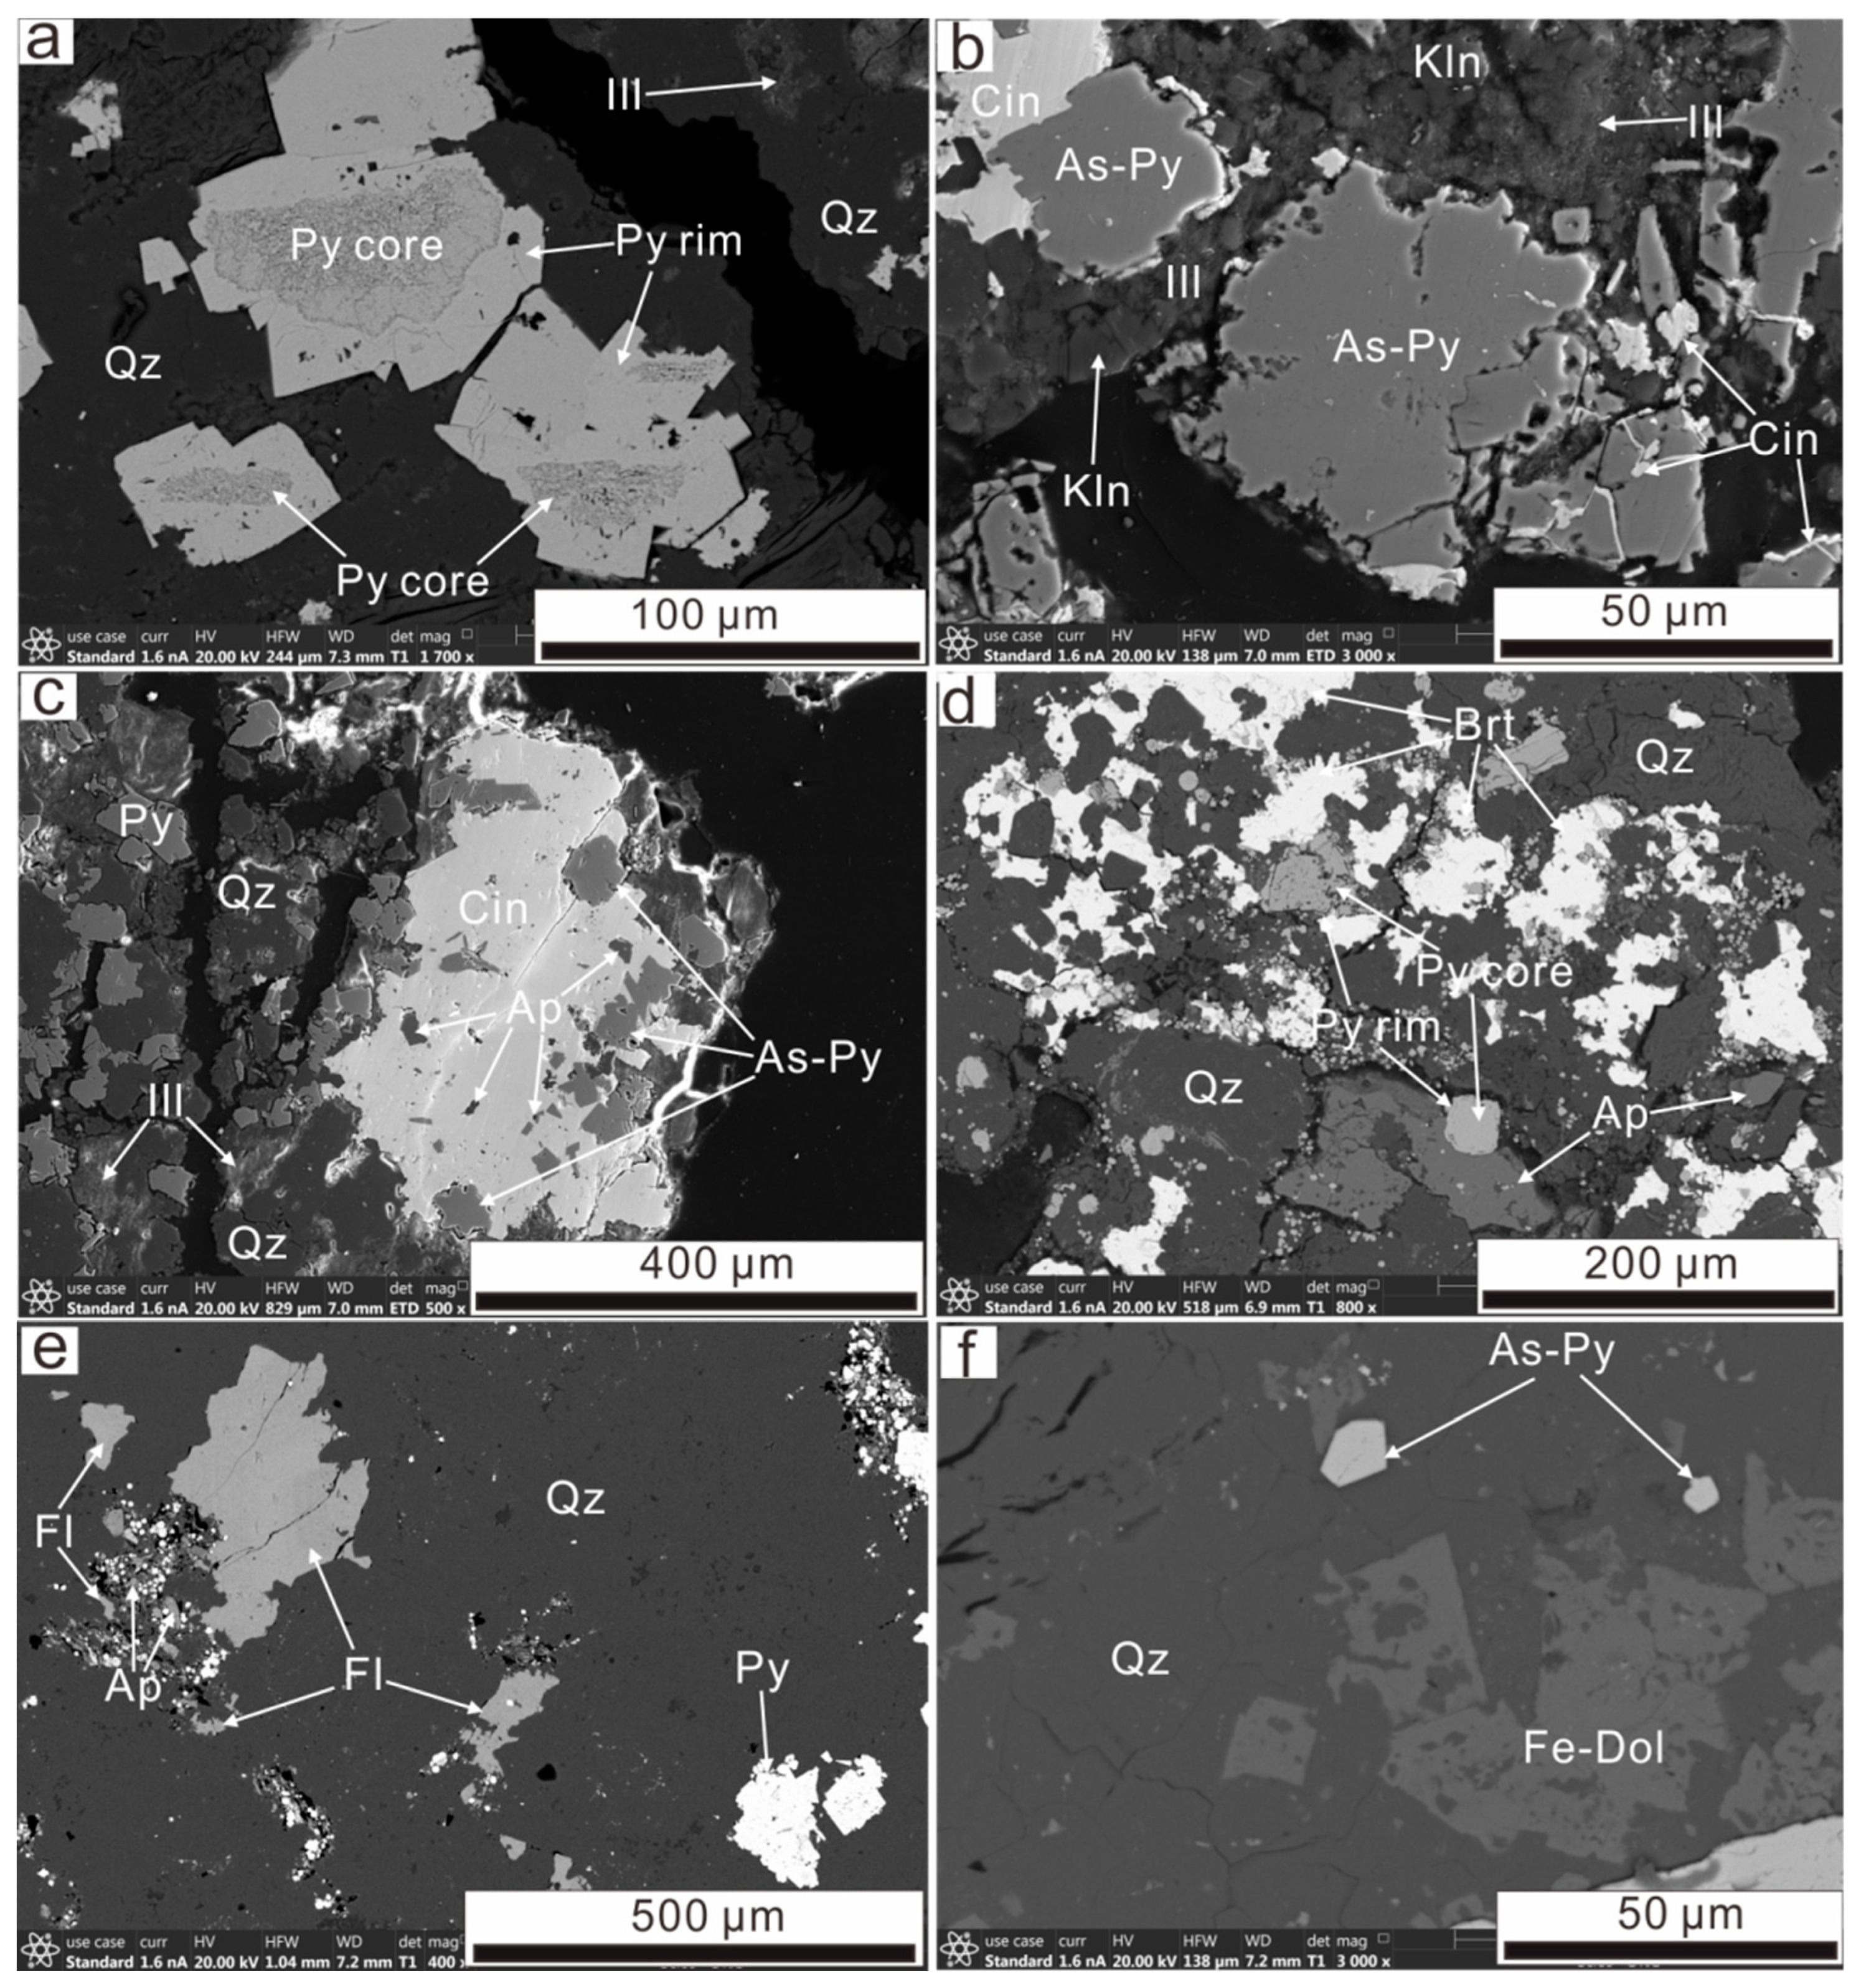
Petrographic (Figure 3), SEM (Figure 4), and TIMA (Figure S1) results reveal that the primary minerals in the deposit were pyrite, cinnabar, lorandite, quartz, kaolinite, illite, barite, dolomite, calcite, and fluorite. Pyrite can be classified into diagenetic and hydrothermal types. Diagenetic pyrite was present in banded or nodular form along layers and primarily occurred in the form of isolated euhedral–subhedral cubes and pentagonal dodecahedrons with coarse grains (Figure 4a,d); some of which comprised equi-dimensional pyrite microcrystals of ~1 μm in size, forming a strawberry-shaped structure. Pyrite framboids or single euhedral–subhedral pyrite crystals often formed cores of banded pyrite (Figure 4a,d). Hydrothermal pyrite was commonly disseminated in ores, veins, and dendrites along joints and fissures and occurred primarily in the form of tiny subhedral to heteromorphic grains (Figure 3e and Figure 4a–f). This type of pyrite was surrounded by quartz, illite, and a small amount of kaolinite (Figure 4a–f). In the banded pyrite, hydrothermal pyrite was distributed at the edge in the form of an accretionary rim and enveloped diagenetic pyrite (Figure 4a,d). Cinnabar was often distributed as subhedral to heteromorphic crystals with sizes ranging from several micrometers to tens of millimeters; some of which formed thin films or fine veins on the layered and fractured surface (Figure 4b,c). Cinnabar was replaced along the edges or cracks of pyrite to form a harbor-like erosion structure (Figure 4b,c). Lorandite was mostly present as a granular aggregate that filled rock/mineral voids (Figure 3b) and was locally produced along the layers, joints, and fissures, which were often closely associated with cinnabar and pyrite. Quartz was often distributed in irregular granular and agglomerated forms, and some crystals occurred in veins and net veins. Microscopic analysis showed that quartz cavities were filled with pyrite and cinnabar. Quartz-cemented limestone breccias are common in tectonic alteration bodies. Limestone had well-developed dissolution pores that were often filled with pyrite and calcite (Figure 3c). Calcite and dolomite primarily occurred in irregular grains and were often dissolved in the quartz (Figure 4f). These dissolution features indicate that carbonate minerals partially dissolved during the mineralization process and provide clear evidence of decarbonation of the carbonate host rocks. In addition, calcite was produced in veins with widths varying from 1 to 3 cm (Figure 3d). Barite was primarily generated in the matrix (Figure 3d) and was often replaced by quartz or pyrite (Figure 4d). Fluorite was often distributed in silicified limestone in the form of matrix and was replaced by quartz (Figure 4e). Kaolinite and illite were often associated with quartz, whereas pyrite and cinnabar were allocated to their voids (Figure 4a–c).
According to the characteristics of ore paragenesis, texture, and alteration, the mineralization can be preliminarily divided into three stages: pyrite–quartz–illite (I), cinnabar–kaolinite–calcite–fluorite (II), and lorandite–pyrite–quartz (III). Stage I is the primary mineralization stage of Au and the initial enrichment stage of Hg and Tl, and these mineralizing elements are primarily enriched in pyrite. Stage II is the primary Hg mineralization stage, characterized by cinnabar enrichment. Stage III is the primary Tl mineralization stage, characterized by lorandite enrichment.

4.2. Mineral Abundance

ZK901-10 comprised siltstone, representing Hg–Tl mineralization, with a Hg content of 0.6149%, a Tl content of 0.0139%, and a Au content of <0.02 g/t. The TIMA analysis showed that ZK901-10 primarily contained quartz (36.42%), pyrite (11.01%), kaolinite (20.55%), illite (18.43%), rutile (1.7%), barite (1.01%), and cinnabar (0.68%) (Table 1, Figure S1). ZK901-13 comprised silty claystone, representing Au mineralization, with a Au content of 1.35 g/t, and Hg and Tl contents <0.006%. TIMA analysis showed that sample ZK901-13 primarily contained quartz (56.45%), pyrite (15.8%), kaolinite (7.11%), illite (17.29%), and rutile (0.52%) (Table 1, Figure S1). Consequently, although the Au mineralization sample (ZK901-13) comprised claystone and the ZK901-10 sample comprised siltstone, the quartz content of ZK901-13 was ~20% higher than that of ZK901-10, demonstrating that the silicification of Au mineralization was more intense than that of Hg–Tl mineralization. In addition, the pyrite and kaolinite contents of the Au mineralization sample were ~6 and ~13% higher and lower than those of the Hg–Tl mineralization sample, respectively.

4.3. Mineral Chemistry

4.3.1. Pyrite

The chemical composition of pyrite is shown in Table S2. The sulfur content in diagenetic pyrite (coarse-grained euhedral or zoned pyrite core) ranged from 51.59 to 53.51 wt% (average of 52.99 wt%), which is lower than the theoretical value of standard pyrite (53.45 wt%). The Fe content varied within 44.47–46.03 wt% (average 45.32 wt%), which is lower than the theoretical value of standard pyrite (46.55 wt%). The S/Fe ratio (atomic ratio) ranged within 2–2.09 (average = 2.05), which was due to a slight depletion in S and Fe. Thallium was detected at all 21 points of diagenetic pyrite, with content ranging within 0.11–0.32 wt% and averaging 0.22 wt%. Gold, As, Hg, Sb, Ag, and Ni were detected at certain locations, with contents of 0.01–0.07 wt% (average = 0.03 wt%, n = 12), 0.02–0.19 wt% (median = 0.04 wt%, average = 0.06 wt%, n = 5), 0.02–0.14 wt% (average = 0.05 wt%, n = 9), 0.01–0.04 wt% (average = 0.02 wt%, n = 4), 0.01–0.04 wt% (average = 0.02 wt%, n = 8), and 0.01–0.20 wt% (average = 0.05 wt%, n = 16), respectively. The Au/Ag ratio ranged from 1.42 to 18, with an average of 5.80. The concentrations of other elements, such as Cr, Cu, Zn, Te, and W, were above the detection limit at a few points only. The Sn content was below the detection limit.
The Fe content of hydrothermal pyrite (fine-grained heteromorphic pyrite or rim of zoned pyrite) ranged within 42.92–45.50 wt%, with an average of 44.40 wt%. The S content ranged within 49.40–52.16 wt%, with an average of 50.17 wt%. The Fe and S contents of this type of pyrite were lower than the theoretical standard values for Fe and S in pyrite, reflecting Fe and S depletion. Arsenic and Tl were detected at all 32 sample measurement points of hydrothermal pyrite, with contents of 1.28–4.36 wt% (average = 3.28 wt%) and 0.17–0.42 wt% (average = 0.27 wt%), respectively. The Hg content ranged within 0.01–0.11 wt%, with an average of 0.05 wt% (n = 25). The Au content ranged within 0.01–0.14 wt%, with an average of 0.04 wt% (n = 17). The Sb content ranged within 0.01–0.12 wt%, with an average of 0.05 wt% (n = 21). The Ag content ranged within 0.01–0.03 wt%, with an average of 0.02 wt% (n = 10). The Ni content ranged within 0.01–0.09 wt%, with an average of 0.03 wt% (n = 23). The Cr content ranged within 0.01–0.06 wt%, with an average of 0.03 wt% (n = 24). The Zn content ranged within 0.01–0.09 wt%, with an average of 0.04 wt% (n = 18). The Te content ranged within 0.01–0.03 wt%, with an average of 0.02 wt% (n = 13). The W content ranged within 0.01–0.08 wt%, with an average of 0.05 wt% (n = 11). The Au/Ag ratio ranged within 1.1–39, with an average of 9.93. The Sn content was below the detection limit.
In summary, the two types of pyrite in the Lanmuchang deposit were characterized by Fe and S depletion and contained Tl as well as small amounts of trace elements such as Au, Hg, and Sb. Diagenetic pyrite contains little or no As; however, hydrothermal pyrite is generally rich in As and has high Au, Hg, and Tl contents.

4.3.2. Cinnabar

The chemical composition of cinnabar is shown in Table S3. The Hg content in cinnabar ranged between 83.46 and 87.41 wt%, with an average of 85.53 wt%, which is generally slightly lower than the theoretical value of Hg content in cinnabar (86.2 wt%). The Hg/S atomic ratio varied between 1.01 and 1.09, with an average of 1.04, which is slightly higher than the Hg/S atomic ratio of standard cinnabar (1:1). Cinnabar generally contained Tl, Fe, and Ag. Thallium and Fe were detected at all 29 sample measurement points of cinnabar, with contents of 0.52–0.71 wt% (average = 0.61 wt%) and 0.01–0.29 wt% (average = 0.1 wt%), respectively. Except for one detection point, Ag was detected at all other points, with a content of 0.01–0.09 wt% (average = 0.04 wt%). Small amounts of Zn, Ni, Cr, Te, W, and Sn were detected at some test points, and their contents were generally <0.05 wt%.

4.3.3. Quartz

The chemical composition of quartz is shown in Table S4. In addition to SiO2, quartz contained small amounts of Al2O3, K2O, TiO2, and FeO. The content of SiO2 ranged within 96.14–99.98 wt% (average = 98.54 wt%). The Al2O3 and FeO contents were above the detection limit, ranging within 0.27–3.7 wt% (average = 1.28 wt%) and 0.06–0.44 wt% (average = 0.18 wt%), respectively. The TiO2 content ranged within 0.02–1.19 wt% (average = 0.26, n = 6). Furthermore, As, Au, Sb, Hg, and Tl were detected at certain locations. The Au2O content at the three detection points was 0.04 wt%; the As2O3 contents recorded at two detection points were 0.02 and 0.03 wt%, respectively; Sb2O3 ranged within 0.01–0.02 wt% (average = 0.02 wt%, n = 4); HgO ranged within 0.03–0.05 wt% (average = 0.04 wt%, n = 3); and Tl2O3 ranged within 0.01–0.04 wt% (average = 0.02 wt%, n = 5).

4.3.4. Barite

The chemical composition of barite is shown in Table S5. The BaO content in barite ranged within 62.39–65.69 wt% (average 63.65 wt%), and the SO3 content ranged within 34.13–36.04 wt% (average 35.43 wt%). Arsenic, Au, and Sb were detected at certain points, with As2O3 content ranging within 0.02–0.04 wt% (average = 0.03 wt%, n = 4), the Au2O content ranging within 0.01–0.09 wt% (average = 0.05 wt%, n = 5), and the Sb2O5 ranging within 0.01–0.05 wt% (average = 0.03 wt%, n = 6). The Ag, Ni, Cu, Zn, Te, W, and Sn contents in barite were low, and most of the measurement points were below the detection limit. The Hg, Tl, and Cr contents were below the detection limits.

4.3.5. Kaolinite

The chemical composition of kaolinite is shown in Table S6. The SiO2 content of kaolinite ranged within 45.23–48.12 wt%, with an average of 46.75 wt%. The Al2O3 content ranged within 40.98–45 wt%, with an average of 43.08 wt%, and the Si/Al ratio ranged within 1.05–1.21, with an average of 1.09. The FeO and SO3 contents were negligible, ranging within 0.33–1.55 wt% (average = 0.77 wt%) and 0.13–2.54 wt% (average = 0.86 wt%), respectively. Gold (Au2O) was detected at seven points, two of which had values (0.09 wt%, 0.2 wt%) much higher than the others, and the remaining five points had an average value of 0.02 wt%. In addition, As, Sb, Hg, and Tl were detected at certain points, with the As2O3 content ranging within 0.01–0.08 wt% (average = 0.04 wt%, n = 6), and the Sb2O5 content ranging within 0.01–0.03 wt% (average = 0.02 wt%, n = 7); the HgO content was 0.01–0.11 wt% (average = 0.06 wt%, n = 6), and the Tl2O3 content was 0.01–0.08 wt% (average = 0.04 wt%, n = 5). The Ba, Mg, Ti, K, Ag, and Cu contents were higher than the detection limits at several locations.

4.3.6. Illite

The chemical composition of illite is shown in Table S7. The contents of the primary elements in illite, Si, and Al, varied greatly, whereas those of K, Fe, and Mg were relatively stable. The SiO2, Al2O3, K2O, FeO, and MgO contents were 49.87–54.18 wt% (average = 52.67 wt%), 30.33–36.04 wt% (average = 33.78 wt%), 7.71–8.60 wt% (average = 8.16 wt%), 1.74–4.72 wt% (average = 3.02 wt%), and 0.93–1.99 wt% (average = 1.51 wt%), respectively. In addition, Ba, Ti, and Sb were common in illite, with BaO, TiO2, and Sb2O5 contents ranging within 0.07–0.13 wt% (average = 0.09 wt%), 0.04–1.54 wt% (average = 0.44 wt%), and 0.13–0.20 wt% (average = 0.16 wt%), respectively. Small amounts of Hg, Tl, and Au were detected at certain points, with HgO, Tl2O3, and Au2O contents ranging within 0.05–0.10 wt% (average = 0.07 wt%, n = 3), 0.02–0.04 wt% (average = 0.03 wt%, n = 4), and 0.01–0.05 wt% (average = 0.03 wt%, n = 5), respectively. The Ag and Cu contents were higher than the detection limit at some points, whereas all Te contents were below the detection limit.

5. Discussion

5.1. Occurrence of Ore-Forming Elements

Previous studies have shown that Au in Carlin-type Au deposits primarily occurs in pyrite [27]. In addition to occurring in pyrite, mercury and Tl can form independent minerals (e.g., sulfates and sulfides of Tl–As–Sb ± Hg ± Pb ± Ag) [28,29]. Based on detailed observations of the drilling samples, a large amount of pyrite was detected in various ores. Lorandite (reacting with a Na(OH) solution to form black As oxide film) and cinnabar (forming a black aluminum amalgam after rubbing with aluminum rods) were identified in Hg–Tl ore. During microscopic examination and SEM, EPMA, and TIMA analyses, independent minerals of Hg (e.g., cinnabar) were identified; however, natural partials of Au were not recognized. In addition, no independent Tl minerals were observed under the microscope. This could be due to the lack of independent Tl minerals in the analyzed samples or because the prepared section did not include such minerals. The above-mentioned analysis demonstrates that the principal ore minerals in the Lanmuchang deposit are pyrite, cinnabar, and lorandite.
Table 2 shows that the total distribution of Hg in various minerals was 0.606829%. Approximately 96% of Hg was enriched in cinnabar. The total Hg content of all minerals was very close to the ore grade of the corresponding exploration sample (0.6149%). The total amount of Tl in each mineral was 0.048955%, which is somewhat different from the Tl content of the ore (0.0139%). This difference may be because the mineral content based on TIMA only represents a certain thin-section area, which differs slightly from the overall distribution of each mineral in the ore. Notably, this implies that pyrite is the primary carrier of Tl in Tl-bearing ores (accounting for ~61%) in the absence of independent Tl minerals. After analyzing lorandite-rich Tl ores, Li [16] concluded that the thallium distribution in pyrite accounts for 15.069% of the total thallium content of the ore, whereas the thallium content in the rock fragments dominated by pyrite accounted for 64.88%. In summary, the distribution of Tl in pyrite was similar in ores rich in and without independent Tl minerals. Therefore, pyrite may be the main Tl-bearing mineral that significantly controls the distribution of Tl resources in the Lanmuchang deposit.
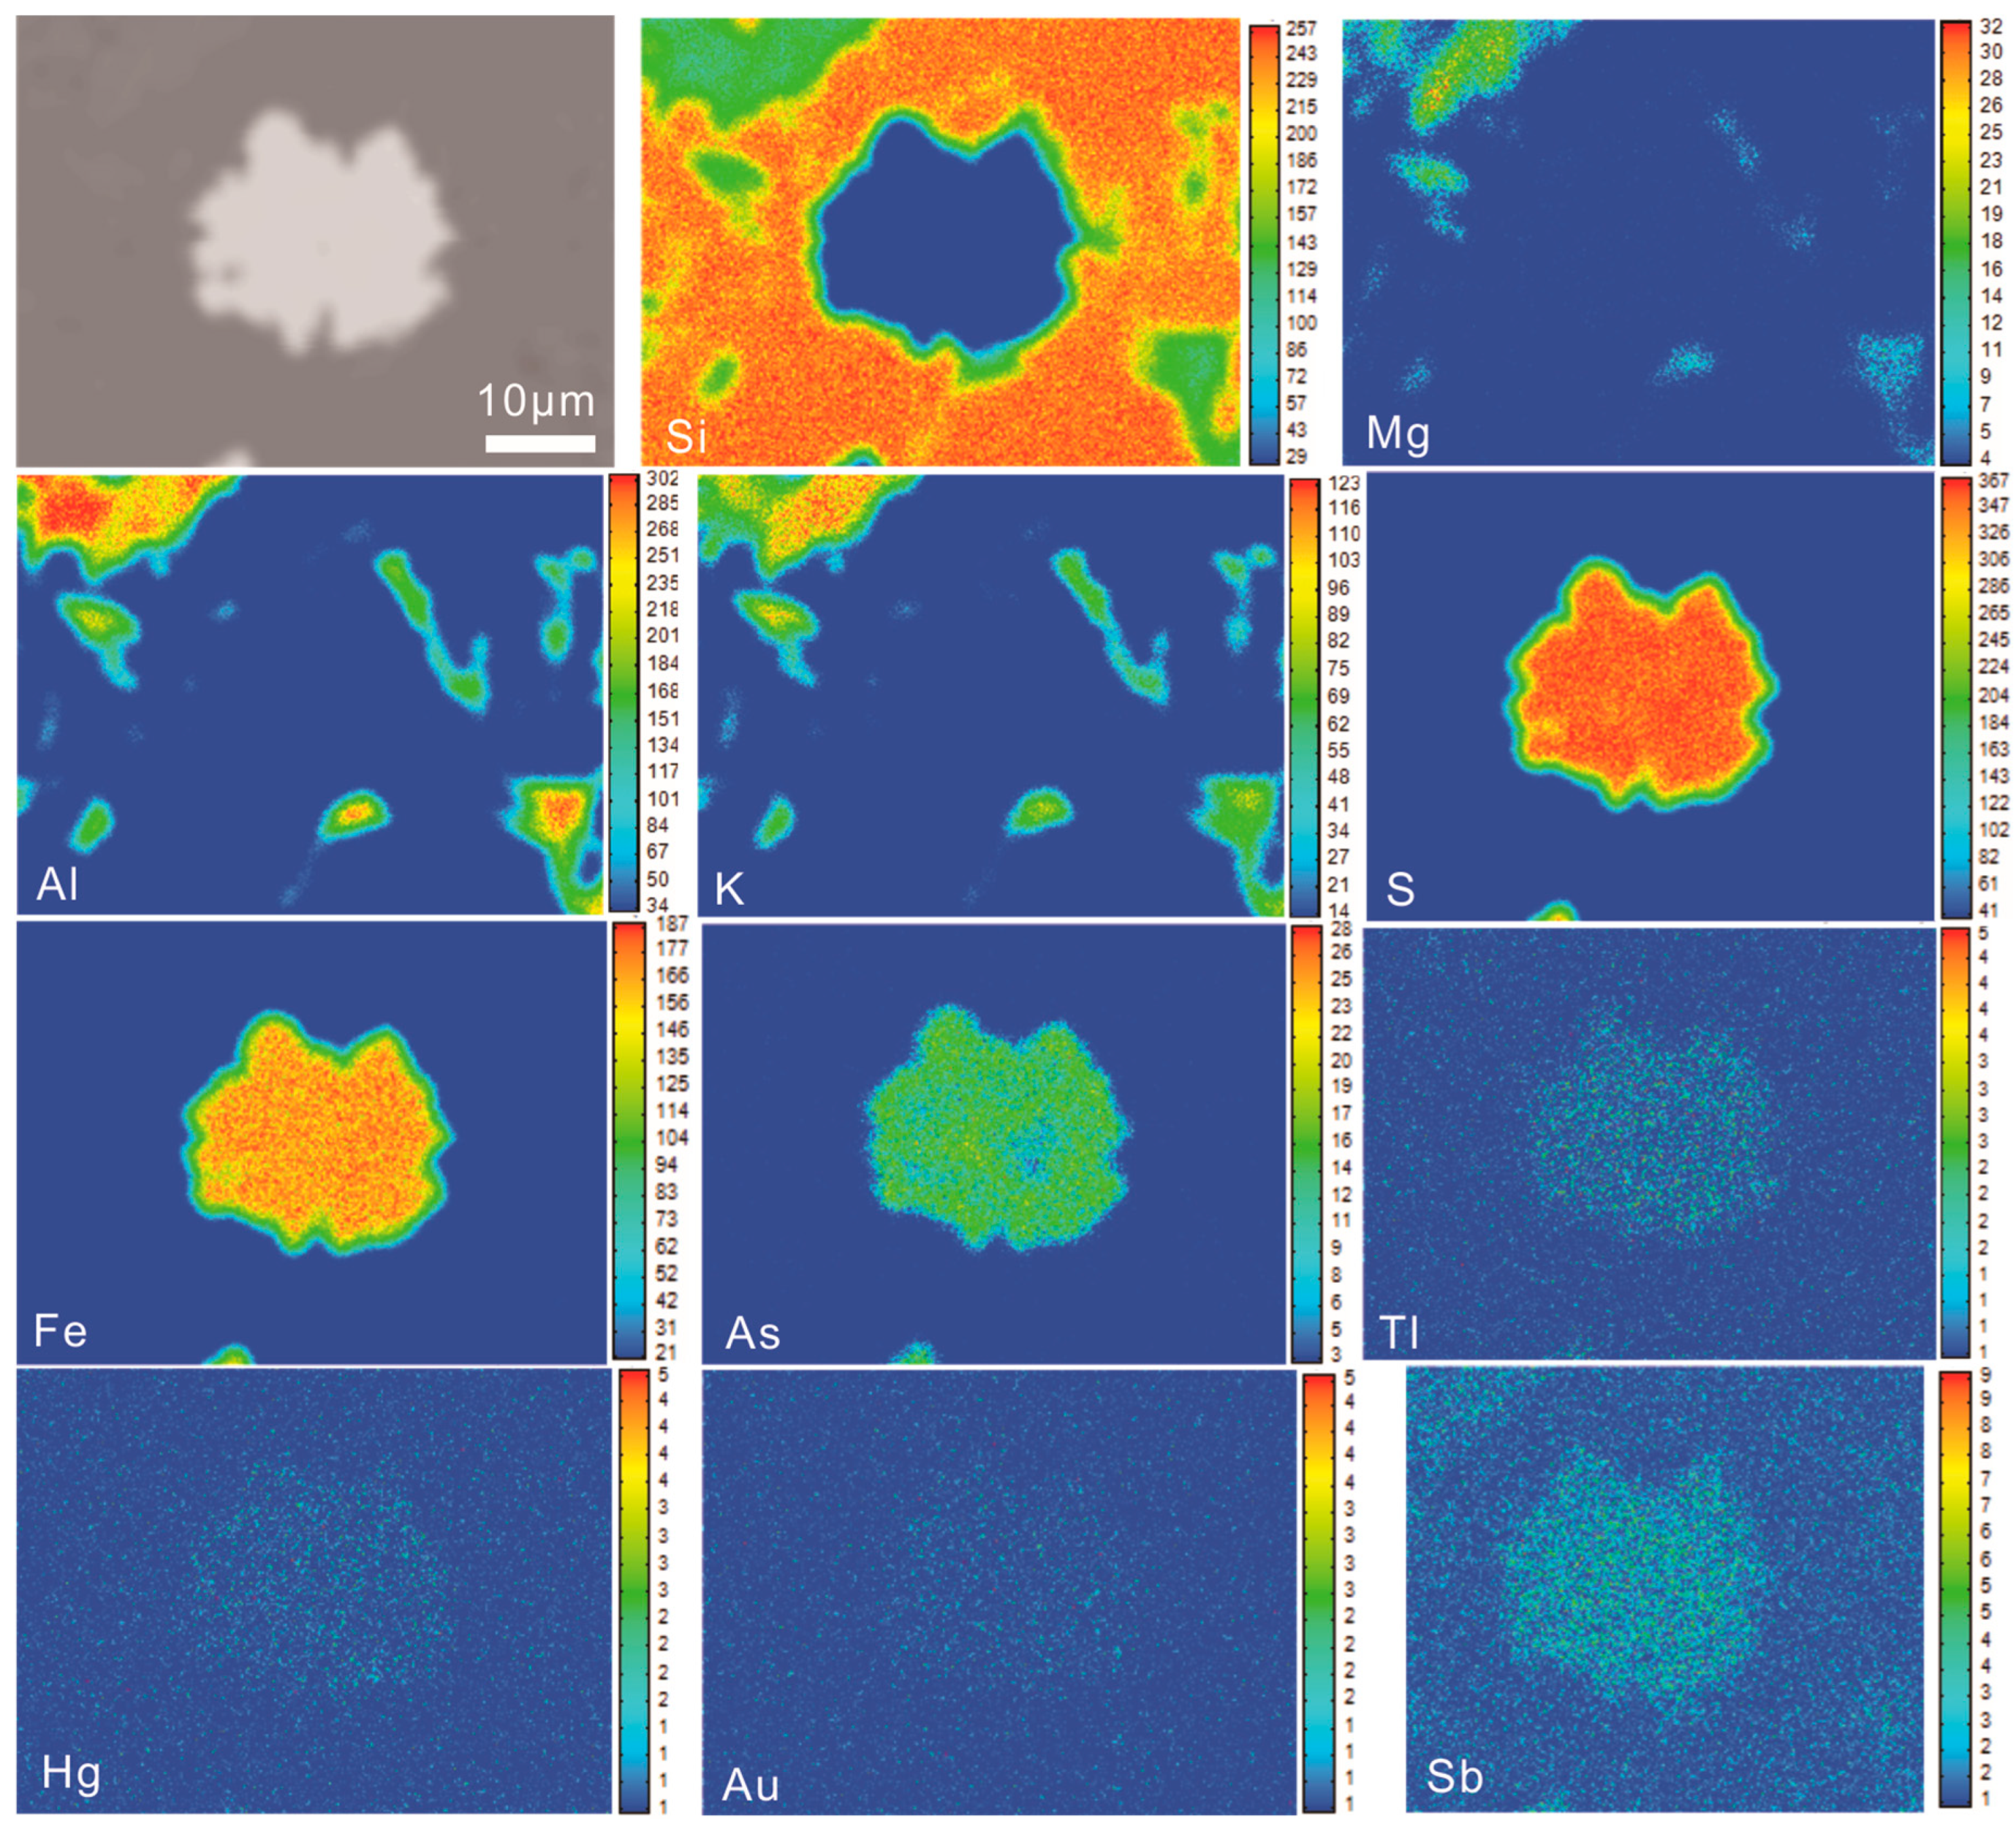
Gold primarily occurs in three forms in pyrite: invisible solid solution (Au+), nano-scale particles (Au0), and visible micrometer-scale inclusion [27,28,30]. Mercury and Tl are primarily incorporated in pyrite in the form of isomorphous solid solutions [28,29] or natural elemental minerals in micro-/nanophase mineral inclusions [31,32]. The EPMA scanning analysis of representative pyrites showed that Au, Hg, and Tl were relatively equidistributed (Figure 5). In addition, extremely high values were not observed for these elements in EPMA data (Table S2). These results indicate that Au, Hg, and Tl may primarily occur in pyrite in an “invisible” form (<0.1 μm).
Based on the Au and As contents in As-bearing pyrite and transmission electron microscope observation results, Reich [28] proposed a solubility limit for Au in As pyrite (CAu = 0.02CAs + 4 × 10⁻⁵), which can be used to determine the occurrence of Au in pyrite. The data above the solubility limit (Au/As >0.02) indicate that Au occurs primarily in the form of nano-Au (Au0), whereas Au occurs predominantly in the form of chemically bound lattice Au (Au+) if the data are below the curve (Au/As <0.02) [28]. The points of hydrothermal pyrite in this study were distributed below the solubility limit curve, whereas those of As-bearing diagenetic pyrite were located above the solubility limit (Figure 5a). This indicates that Au was primarily present in the form of lattice Au in hydrothermal pyrite, whereas it primarily occurs in the form of nano-scale particles in As-bearing diagenetic pyrite. The results of previous studies suggested that pyrite can adsorb AuS2 or Au complexes in low-As systems and reduce them to Au0, thereby forming natural Au inclusions [33,34,35]. Therefore, Au may also occur in the form of nano-scale particles in the As-free diagenetic pyrite, although no visible Au was observed in our samples.
The solubility limit of Hg in As pyrite (CHg = 0.02CAs + 4 × 10⁻⁵) is similar to that of Au, whereas the saturation limit of Tl is close to the Tl = As line, that is, n(Tl)/n(As) = 1 [36]. As shown in the Tl vs. As and Hg vs. As diagrams, the data for hydrothermal and As-bearing diagenetic pyrite, respectively, are primarily distributed above and below the solubility limit curves (Figure 6b,c), indicating that Hg and Tl primarily occur in the form of a solid solution in As-bearing hydrothermal pyrite, whereas they primarily occur in the form of nano-scale particles in As-bearing diagenetic pyrite.

5.2. Occurrence Mechanism of Ore-Forming Elements

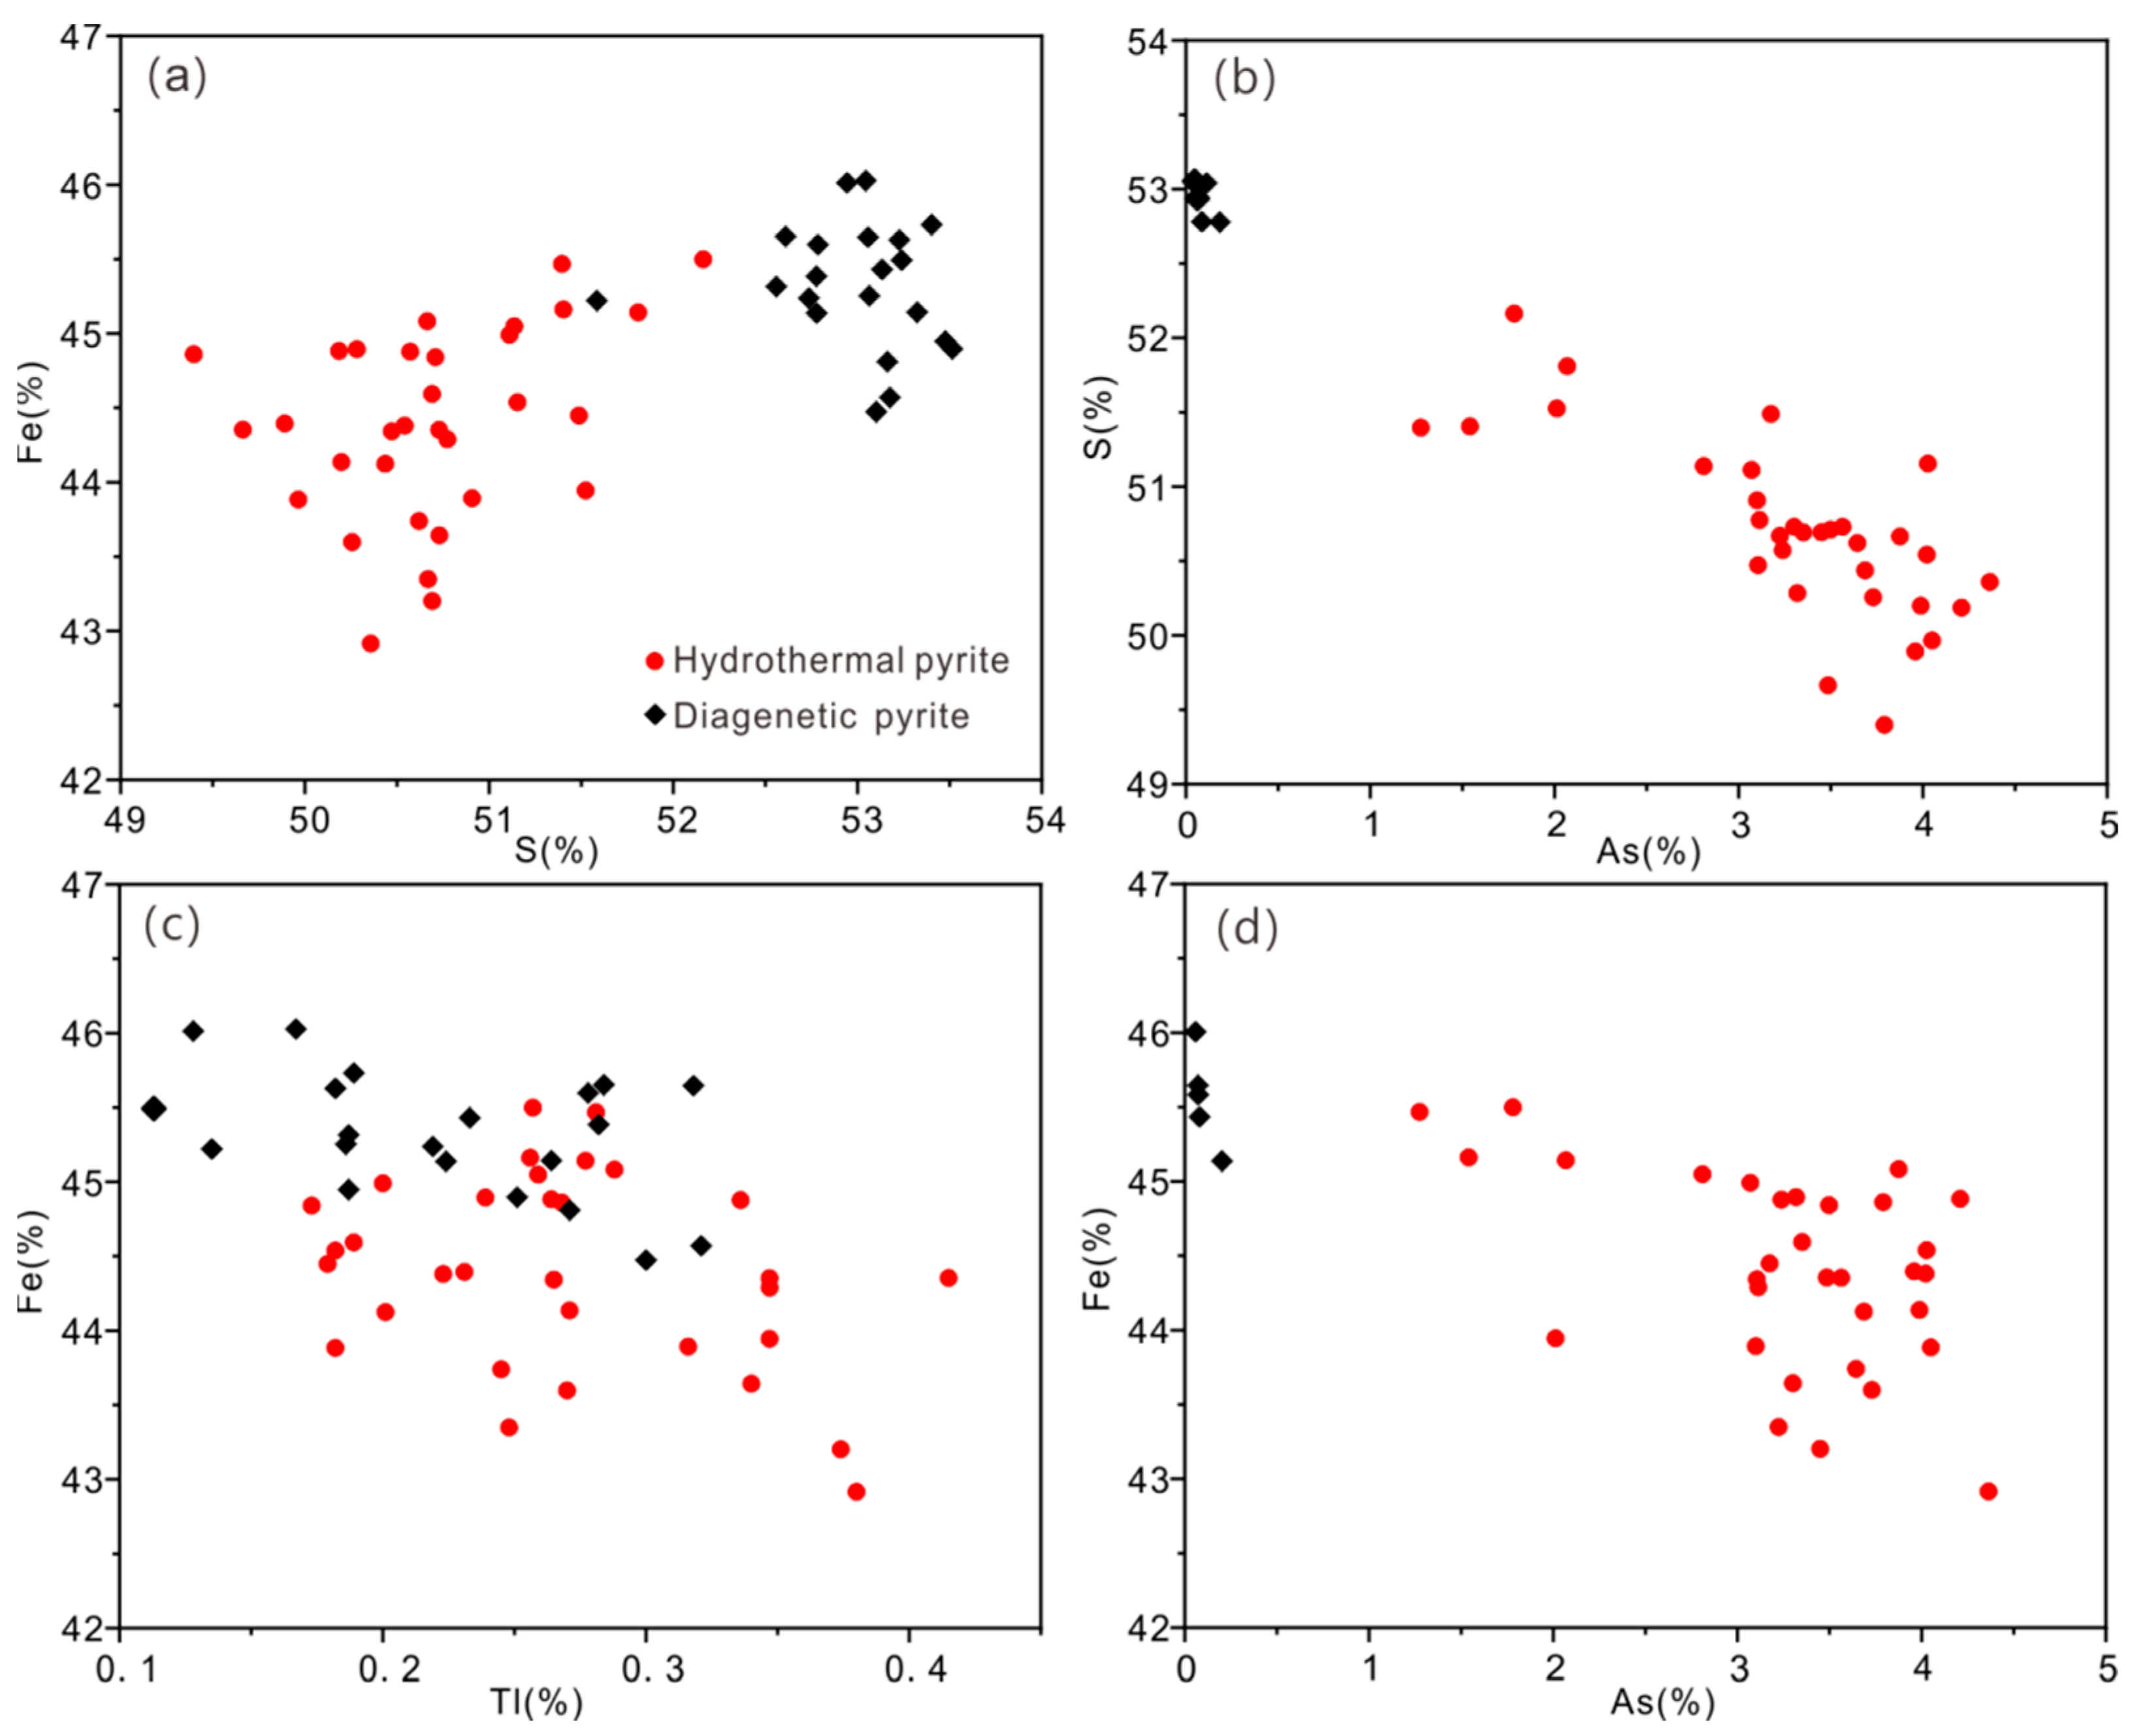
As shown in the Fe–S diagram (Figure 7a), hydrothermal and diagenetic pyrite are primarily distributed in the lower-left and upper-right sections of the plot, respectively. Iron and S are positively correlated, indicating that the degree of Fe and S loss in pyrite gradually increased from the diagenetic to hydrothermal periods, which may reflect the gradual increase in the degree of Fe and S replacement by other trace elements. In addition, a significantly negative correlation was observed between the S and As contents (Figure 7b); that is, from diagenetic to hydrothermal pyrite, the S concentration sharply decreased, and the As concentration increased. This indicates that As in hydrothermal pyrite may replace S in the mineral lattice. The results of previous studies demonstrated that As replaces S in pyrite and generally forms covalent As–S bonds [37,38]. However, because the radius of As is greater than that of S, substitution causes pyrite lattice distortion and produces defects [37,38]. The destruction of the crystal structure is conducive to the incorporation of other trace elements (e.g., Au, Hg, and Tl) [37,38,39,40]. In addition, As, as a variable-valence element, can replace Fe in pyrite in the form of As2+/3+ and thus increase the solubility of other trace elements [39,41,42]. In this study, negative correlations were observed among Fe, As, and Tl in pyrite (Figure 7c, d), which further indicates that Fe in pyrite may be partially replaced by As or Tl. In conclusion, the Au content in hydrothermal pyrite primarily depends on the As concentration. However, the Au–As relationship diagram indicates that there is no correlation between Au and As in hydrothermal pyrite (Figure 7a). Deditius’s [40] research showed that pyrite data primarily obtained from secondary ion mass spectroscopy analysis form a wedge-shaped area in the Au–As diagram, indicating that the Au content increases with the increase in As content, whereas data obtained from EPMA analysis exhibit no notable relationship between Au and As. Therefore, the lack of correlation between As and Au may be due to detection limits, which would reveal more detail if measured in ppm or ppb instead of wt.%.
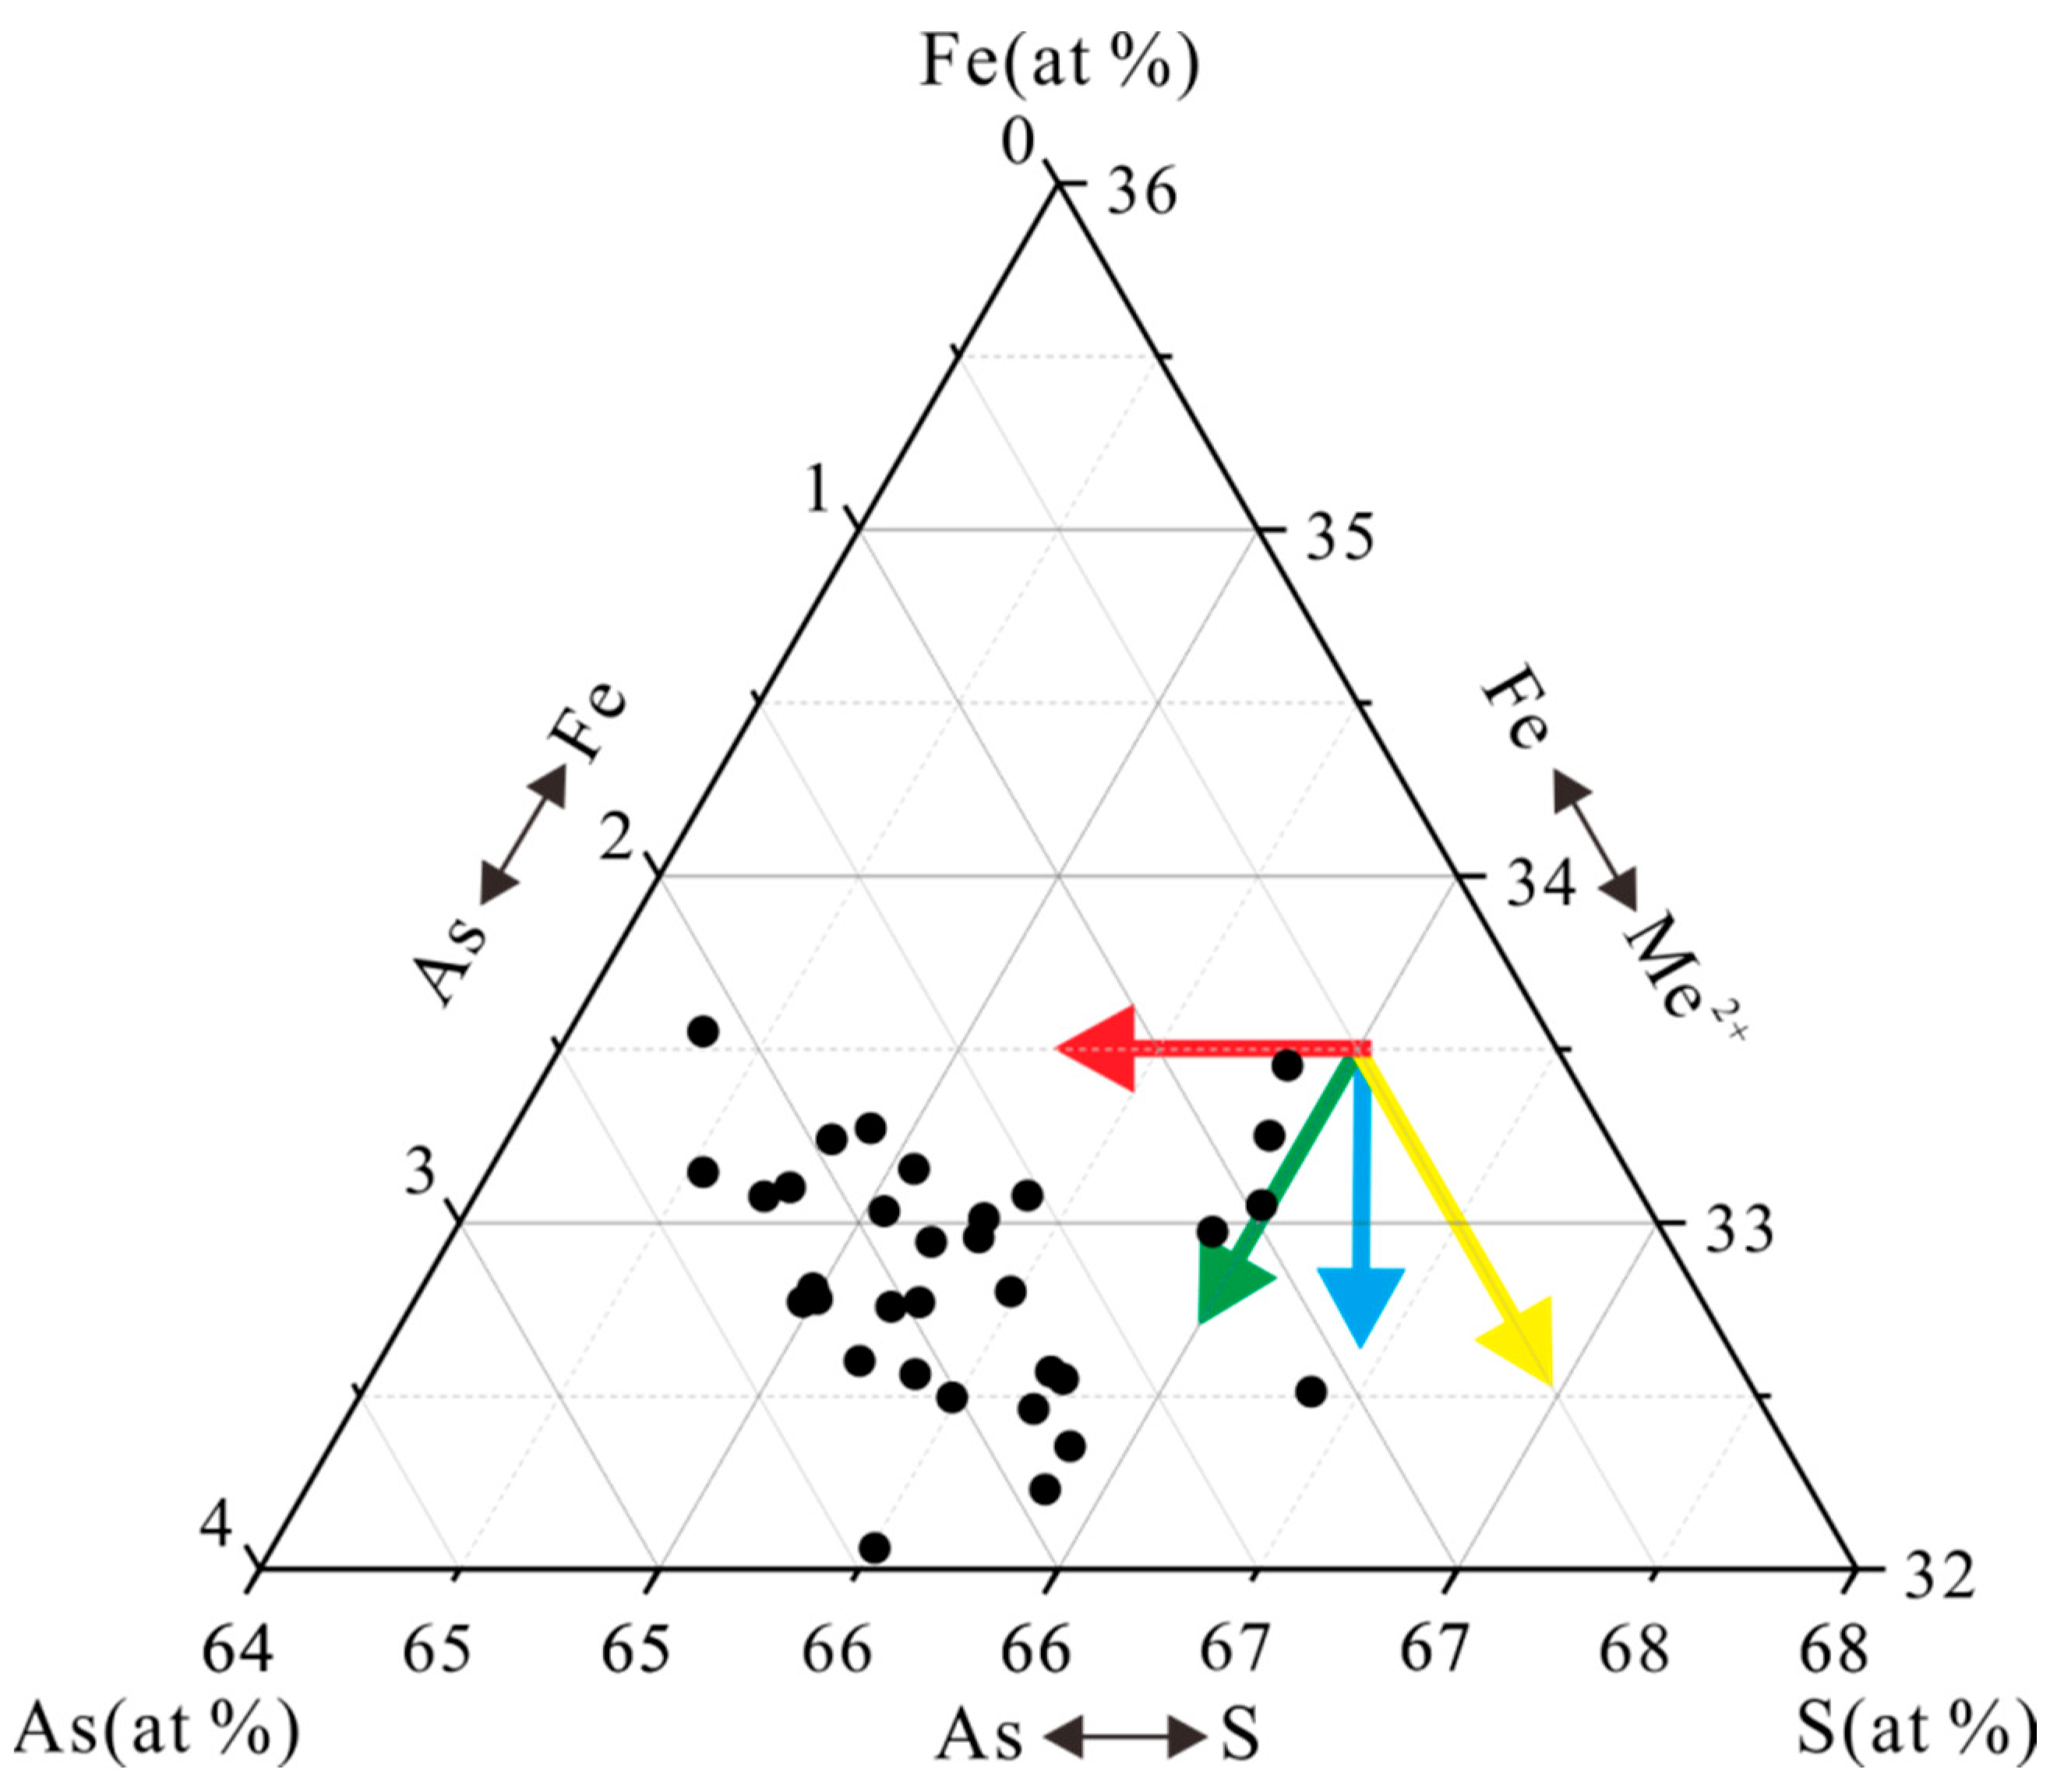
The As–S–Fe triangle diagram of pyrite reveals four mechanisms of element incorporation in the mineral structure: As1− replaces S, As2+ replaces Fe, As3+ replaces Fe, and Me2+ replaces Fe [40]. Me2+ includes divalent metal ions (e.g., Ni2+, Co2+, Mn2+, Cu2+, and Zn2+) with an ionic radius similar to that of Fe2+, which undergo isovalent substitution with Fe2+; it can also be represented by heterovalent metal ions (e.g., As3+, Sb3+, Ag3+, Sn4+, W6+, Tl+, Au3+, Cu+, and Bi3+) with different ionic radii, which undergo substitution with Fe2+ through coupled substitution [40]. Numerous studies of coupled substitution mechanisms have been conducted. For example, Chouinard et al. [37] proposed that the alivalent coupled substitution mechanism of 2Fe2+ ⇔ Au3+ + Cu+ is the primary role of Au incorporation into pyrite in the Pascua Lama gold deposit in Chile; D’Orazio et al. [43] and George et al. [44] confirmed that alivalent substitution (2Fe2+ ⇔ Tl+ + Sb3+) is the most important mechanism for Tl incorporation in pyrite in the southern Apuan Alps deposits. Pyrite data of the Lanmuchang deposit (Figure 8) primarily indicated that Fe replaces Me2+ and As1− replaces S. These trends indicate that the Fe in pyrite is primarily replaced by other metal elements, and S is potentially replaced by As. This is consistent with the negative correlation between S and As (Figure 7b). Combined with the negative correlation between Fe and As (Figure 7c) and Tl (Figure 7d), it can be speculated that the coupled substitution of 2Fe2+ ⇔ Tl+ + As3+ may be an important Tl incorporation mechanism for hydrothermal As pyrite. In addition, Manceau et al. [45] used high-energy-resolution X-ray absorption near edge structures to analyze As pyrite from the Goldstrike Au deposit in Nevada, USA, and reported that Hg occupies the Fe site in the mineral lattice. Therefore, lattice defects formed by the coupled substitution of As and Tl for Fe may contain Hg, which may explain why As- and Tl-bearing pyrite are enriched in ionic Hg.

5.3. Mineralization Conditions and Mechanisms

Various trace elements in pyrite indicate the physicochemical conditions of ore-forming fluids. A pyrite Cu/Au ratio close to 1 reflects a highly oxidizing fluid environment, whereas a ratio >1 reflects a more reducing fluid environment [46]. The 14 datapoints analyzed for hydrothermal pyrite in the Lanmuchang deposit show that the Cu/Au ratio was 0.2–11.5 (2.2 on average) and generally >1, indicating that the ore-forming fluid was in a reducing environment entirely. The solubility of As in fluid generally increases with the increase in the pH of the ore-forming fluid [47]. Therefore, the As content of hydrothermal pyrite is an indicator of the pH of the ore-forming fluid [48,49]. The As content of hydrothermal pyrite in the Lanmuchang deposit was moderate (1.28%–4.36%, with an average of 3.28%), indicating that the pH of the fluid in which it was formed was generally close to neutral. The Co/Ni ratio of pyrite is affected by salinity, with a high Co/Ni ratio corresponding to a high-salinity environment [50]. The Co/Ni ratio of the hydrothermal pyrite in the Lanmuchang deposit was ~1 and primarily >1 [51], indicating the low-salinity of the ore-forming fluid. The Se content in pyrite was negatively correlated with the temperature, roughly corresponding to the following equation: Sepyrite = 5×10¹³ × T−4.82 [42]. The Se content in pyrite in the Lanmuchang deposit ranged within 6.2–11.8 μg/g, with an average of 8.4 μg/g [51]. Based on this equation, the temperature of the ore-forming fluid in the deposit was calculated to be ~300 °C. Cao et al. [52] used this equation to analyze the mineralization temperature of orogenic Au deposits and showed that the temperature data were close to or slightly higher than the upper limit of the mineralization temperature. Therefore, the mineralization temperature of the Lanmuchang deposit should be <300 °C, which is representative of a low-temperature hydrothermal deposit.
Changes in the physicochemical conditions of ore-forming fluids (e.g., temperature, pH, and oxygen fugacity) are the primary causes of elemental precipitation. The As content of pyrite indicated that the ore-forming fluid of the deposit was generally in an almost-neutral pH environment. The Carlin-type Au deposit in Guizhou is rich in CO2 [7,9,10,11], which can act as a buffer to stabilize the pH of the fluid. Therefore, pH change alone may not be the primary precipitation mechanism for ore-forming elements. The stability of both the chlorine and sulfur complexes of Au, Hg, and Tl are controlled by the temperature [7,53,54,55]. The Se content of pyrite indicated that the mineralization environment was generally low; therefore, fluid cooling may have promoted the precipitation of ore-forming elements to some extent. In addition, change in the oxygen fugacity can also change the stability of the complex [55]. The Cu/Au ratio of pyrite indicated that the ore-forming fluid was in a reducing environment, which led to an increase in oxygen fugacity during subsequent evolution and thus to the precipitation of ore-forming elements.
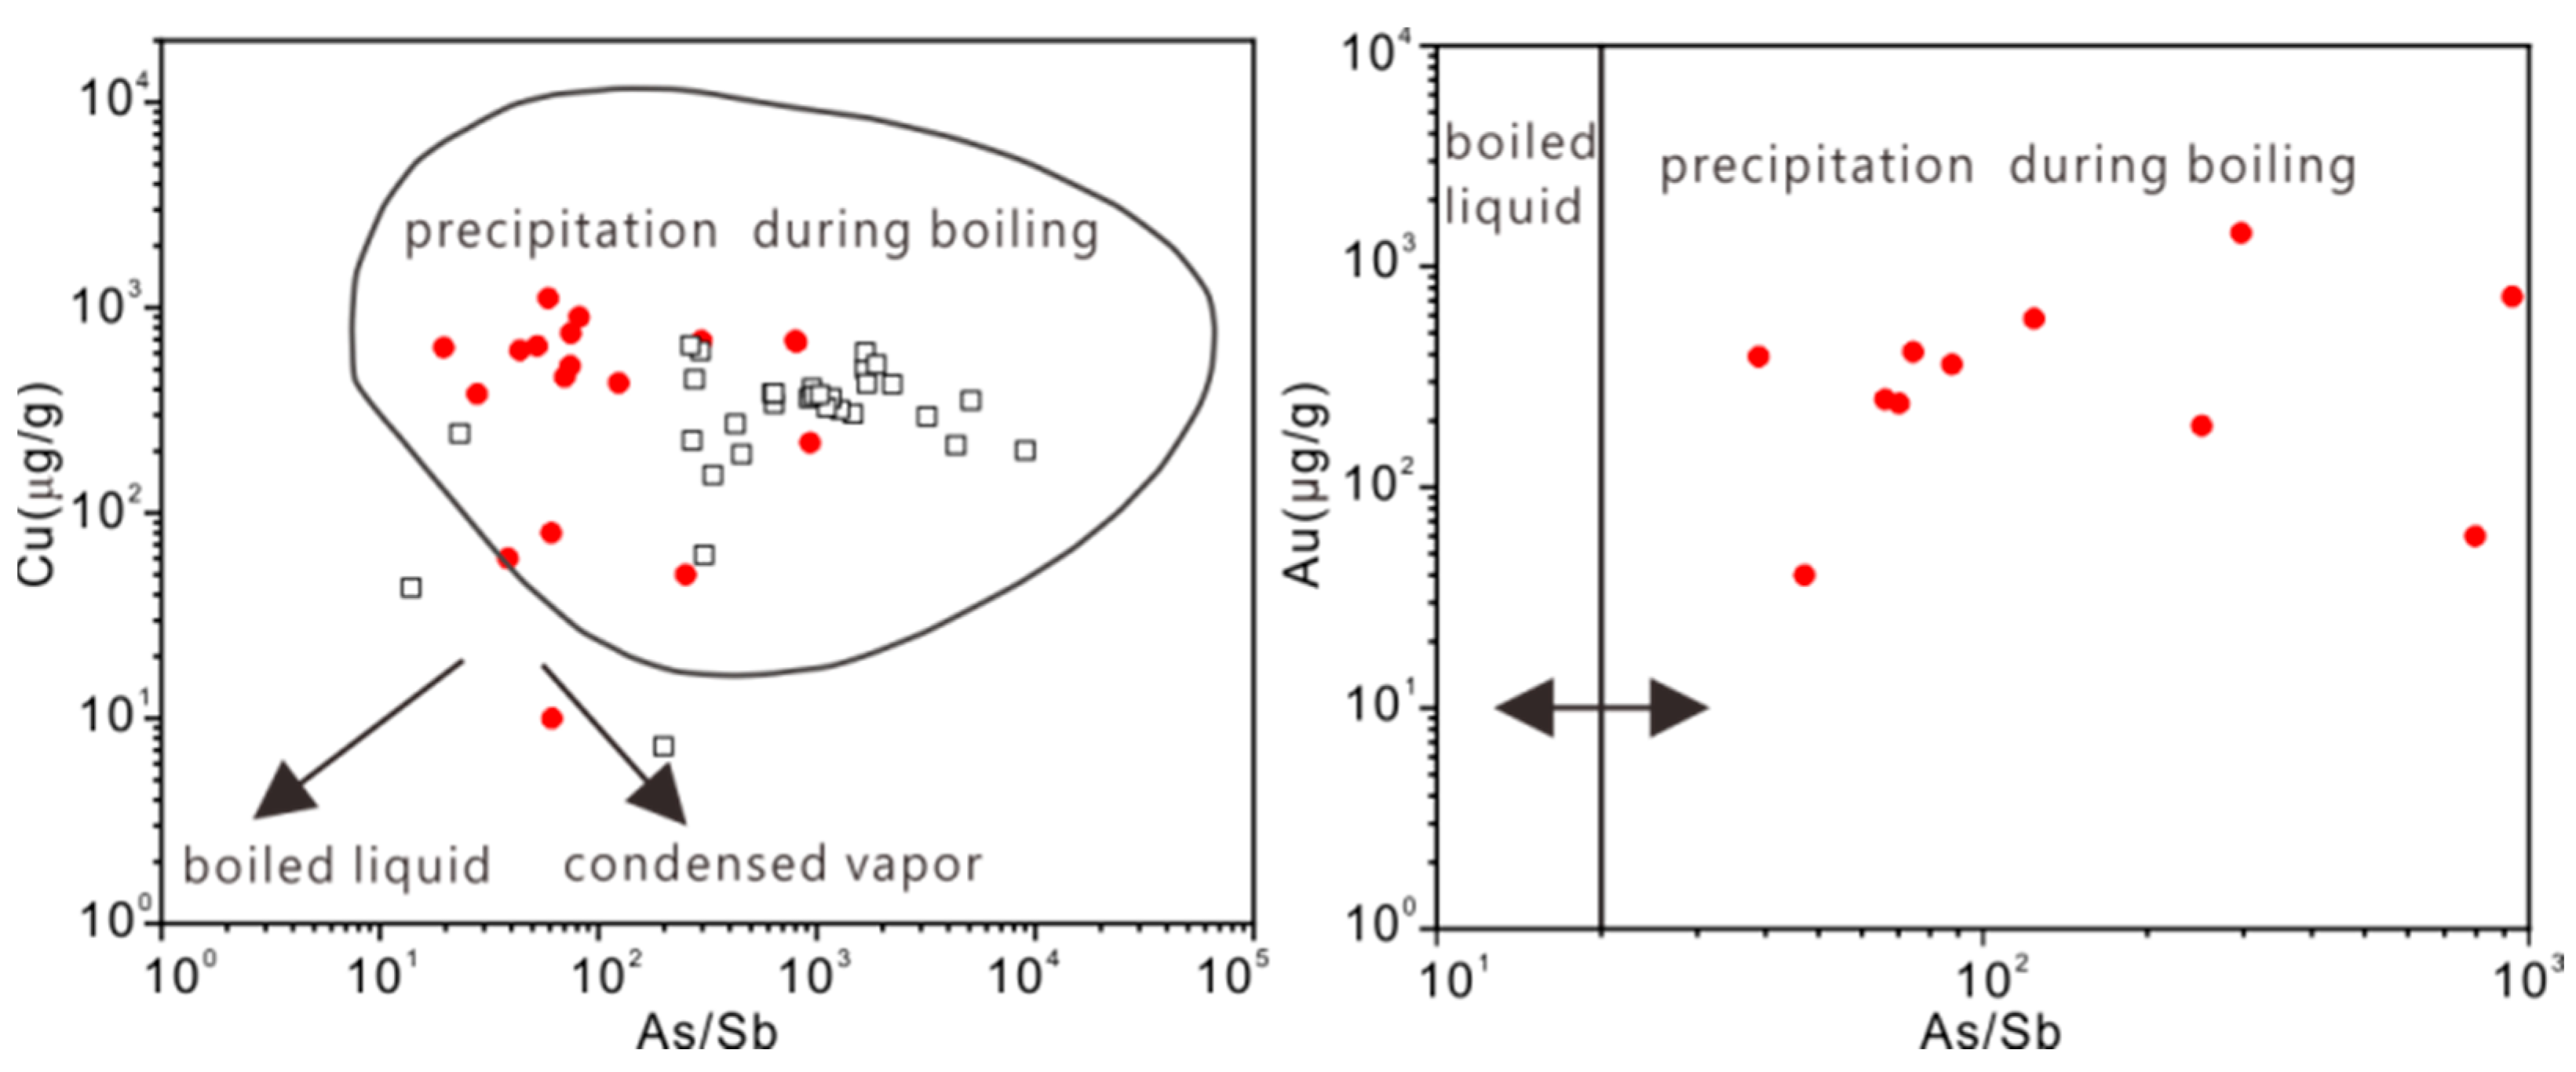
Changes in the physicochemical conditions of ore-forming fluids generally depend on geological processes such as water–rock interactions and fluid boiling. Román et al. [56] and Schaarschmidt et al. [57] proposed that the Cu, Au, and As/Sb ratios of pyrite could indicate whether fluid boiling had occurred. Pyrite precipitates in a boiling fluid environment when the As/Sb ratio is > 20 [57]. This study showed that the As/Sb ratio of hydrothermal pyrite (n = 23) was 20–933, with an average value of 180. In addition, data in the Cu–As/Sb and Au–As/Sb diagrams fall in the boiling fluid area (Figure 9), indicating that the hydrothermal pyrite experienced fluid boiling during its formation. In Carlin-type Au deposits, Au and Hg exist in liquid form and migrate as sulfur complexes [53,57]; thallium exists in gaseous form and migrates as chloride complexes [54]. Fluid boiling may cause the mineralizer to separate and also change the fluid salinity, temperature, and pressure conditions, thereby reducing the stability of the complex in the hydrothermal fluid, ultimately leading to mineral precipitation [58]. The Co/Ni ratio of pyrite may be related to water–rock interactions, that is, a lower Co/Ni ratio may reflect strong water–rock interactions between the ore-forming fluid and surrounding rock [50]. The Co/Ni ratio of pyrite in the Lanmuchang deposit was generally <1, indicating water–rock interactions during mineralization, which is consistent with the widespread development of sulfidation, silicification, and decarbonation. Previous studies have demonstrated that sulfidation is the most important formation mechanism of As pyrite and Au precipitation in Carlin-type Au deposits [7,50,59], which further confirms our understanding.

6. Conclusions

(1) Primary ore minerals in the Lanmuchang deposit include pyrite, lorandite, and cinnabar. Cinnabar is the primary carrier of Hg (>90%), and pyrite is the primary carrier of Tl (>60%), in addition to Au.
(2) Gold, Hg, and Tl primarily occur in the form of solid solutions in hydrothermal pyrite in the Lanmuchang deposit, whereas they primarily occur in the form of nano-scale particles in diagenetic pyrite. The substitution of As for S in hydrothermal pyrite promotes Au enrichment, and the coupled substitution of 2Fe2+ ⇔ Tl+ + As3+ may be an important Tl incorporation mechanism, which also leads to the occurrence of Hg in hydrothermal pyrite.
(3) The As content (1.28%–4.36%), Se content (6.2–11.8 μg/g), Cu/Au ratio (mostly >1), and Co/Ni ratio (mostly <1) of hydrothermal pyrite in the Lanmuchang deposit indicate that the ore-forming fluid was in a low-temperature, low-salinity, nearly neutral pH, and reduced state. The cooling, oxidation, water–rock interaction, and fluid boiling processes of the ore-forming fluid promoted mineral precipitation.

Supplementary Materials

The following supporting information can be downloaded at: https://www.mdpi.com/article/10.3390/min14060615/s1, Table S1: Location, characteristics, and analytical methods of samples, Table S2: Chemical composition of pyrite, wt%, Table S3: Chemical composition of cinnabar, wt%, Table S4: Chemical composition of quartz, wt%, Table S5: Chemical composition of barite, wt%, Table S6: Chemical composition of kaolinite, wt%, Table S7: Chemical composition of illite, wt%, Figure S1. Mineral types and distribution of Hg-Tl ore (ZK901-10) and Au ore (ZK901-13).

Author Contributions

Conceptualization, Data curation and Writing—original draft, S.L.; Writing—review and editing, S.L., J.L., Y.X., Z.X. and Q.T.; Experimental data consolidation, S.L., J.L. and Z.X.; Funding acquisition, S.L., J.L. and Z.W.; Investigation and Methodology, C.Y., B.Z. and Z.W.; Project administration, S.L., J.L. and Z.W.; Supervision, S.L., J.L. and Y.X. All authors have read and agreed to the published version of the manuscript.

Funding

This study was jointly funded by “Chunhui Plan” Cooperative Scientific Research Project of the Ministry of Education of China (HZKY20220235); Guizhou Provincial Basic Research Program (Natural Science) (Qian Ke He Ji Chu-ZK[2021]Yi Ban 203); Guizhou Provincial Science and Technology Innovation Talent Team (Qian Ke He Ping Tai Ren Cai CXTD [2021]007); Reward and Subsidy Fund Project of Guizhou Education University, Ministry of Science and Technology of the People’s Republic of China and National Natural Science Foundation of China (2023GZJB003); National Natural Science Foundation of China (U1812402); Innovation Team of Carlin-type gold deposit mineralization and prospecting in Guizhou Province (2023TD52400); Scientific Research Fund Project of Guizhou Education University (2024BS002); and Growth Project of Young Scientifc and Technological Talents in Colleges and Universities of Guizhou Province (Qian Jiao He KY Zi [2022] 294).

Data Availability Statement

All data are contained within the article and Supplementary Materials.

Acknowledgments

We would like to acknowledge Xiaoming Xie, Yingqiang Qian, and Xiaoyong Wang from 105 Geological Team, Guizhou Bureau of Geology and Mineral Exploration and Development, for their help during the fieldwork. We thank Weihao Yan and Jun Du from Nanjing Hongchuang Exploration Technology Service Co. Ltd. for TIMA analysis and Fang Wang (Hubei Geological Research Laboratory) for assistance with EPMA.

Conflicts of Interest

The authors declare no conflicts of interest.

References

  1. Muntean, J.L.; Cline, J.S. Diversity of Carlin-style gold deposits. Rev. Econ. Geol. 2018, 20, 1–6. [Google Scholar]
  2. Su, W.C.; Dong, W.D.; Zhang, X.C.; Shen, N.P.; Hu, R.Z.; Hofstra, A.H.; Cheng, L.Z.; Xia, Y.; Yang, K.Y. Carlin-type gold deposits in the Dian-Qian-Gui “golden triangle” of Southwest China. Rev. Econ. Geol. 2018, 20, 157–185. [Google Scholar]
  3. Li, S.T.; Xu, L.Y.; Wang, Z.P.; Yang, C.F.; Tan, L.J.; Nie, R.; Meng, M.H.; Li, J.H.; Zhang, B.Q.; Liu, J.Z. Application of tectono-geochemistry method for weak information extraction of Carlin-type gold deposits in Yunnan–Guizhou–Guangxi, SW China. Ore Geol. Rev. 2023, 163, 105813. [Google Scholar] [CrossRef]
  4. Hu, R.Z.; Fu, S.L.; Huang, Y.; Zhou, M.F.; Fu, S.H.; Zhao, C.H.; Wang, Y.J.; Bi, X.W.; Xiao, J.F. The giant South China Mesozoic low-temperature metallogenic domain: Reviews and a new geodynamic model. J. Asian Earth Sci. 2017, 137, 9–34. [Google Scholar] [CrossRef]
  5. Xie, Z.J.; Xia, Y.; Cline, J.S.; Pribil, M.J.; Koenig, A.; Tan, Q.P.; Wei, D.T.; Wang, Z.P.; Yan, J. Magmatic origin for sediment-hosted Au deposits, Guizhou Province, China: In situ chemistry and sulfur isotope composition of pyrites, Shuiyindong and Jinfeng deposits. Econ. Geol. 2018, 113, 1627–1652. [Google Scholar] [CrossRef]
  6. Yan, J.; Hu, R.Z.; Liu, S.; Lin, Y.T.; Zhang, J.C.; Fu, S.L. NanoSIMS element mapping and sulfur isotope analysis of Au-bearing pyrite from Lannigou Carlin-type Au deposit in SW China: New insights into the origin and evolution of Au-bearing fluids. Ore Geol. Rev. 2018, 92, 29–41. [Google Scholar] [CrossRef]
  7. Su, W.C.; Heinrich, C.A.; Pettke, T.; Zhang, X.C.; Hu, R.Z.; Xia, B. Sediment-Hosted gold deposits in Guizhou, China: Products of wall-rock sulfidation by deep crustal fluids. Econ. Geol. 2009, 104, 73–93. [Google Scholar] [CrossRef]
  8. Chen, J.; Huang, Z.L.; Yang, R.D.; Du, L.J.; Liao, M.Y. Gold and antimony metallogenic relations and ore-forming process of Qinglong Sb (Au) deposit in Youjiang basin.; SW China: Sulfide trace elements and sulfur isotopes. Geosci. Front. 2021, 12, 605–623. [Google Scholar] [CrossRef]
  9. Gu, X.X.; Zhang, Y.M.; Li, B.H.; Dong, S.Y.; Xue, C.J.; Fu, S.H. Hydrocarbon- and ore-bearing basinal fluids: A possible link between gold mineralization and hydrocarbon accumulation in the Youjiang basin, South China. Miner. Deposita 2012, 47, 663–682. [Google Scholar] [CrossRef]
  10. Peng, Y.W.; Gu, X.X.; Zhang, Y.M.; Liu, L.; Wu, C.Y.; Chen, S.Y. Ore-forming process of the Huijiabao gold district, southwestern Guizhou Province, China: Evidence from fluid inclusions and stable isotopes. J. Asian Earth Sci. 2014, 93, 89–101. [Google Scholar] [CrossRef]
  11. Li, S.T.; Xia, Y.; Liu, J.Z.; Xie, Z.J.; Tan, Q.P.; Zhao, Y.M.; Meng, M.H.; Tan, L.J.; Nie, R.; Wang, Z.P.; et al. Geological and geochemical characteristics of the Baogudi Carlin-type gold district (Southwest Guizhou, China) and their geological implications. Acta Geochim. 2019, 38, 587–609. [Google Scholar] [CrossRef]
  12. Su, W.C.; Zhang, H.T.; Hu, R.Z.; Ge, X.; Xia, B.; Chen, Y.Y.; Zhu, C. Mineralogy and geochemistry of goldbearing arsenian pyrite from the Shuiyindong Carlin-type gold deposit, Guizhou, China: Implications for gold depositional processes. Miner. Deposita 2012, 47, 653–662. [Google Scholar] [CrossRef]
  13. Li, S.T.; Zhou, G.H.; Liu, J.Z.; Yuan, S.F.; Wang, Z.P.; Yang, C.F.; Wang, X.Y.; Long, C.X.; Zhang, B.Q.; Li, J.H.; et al. Geological and geochemical characteristics of the Lanmuchang gold–mercury–thallium deposit in Southwestern Guizhou Province and their geological implications. Geol. Explor. 2022, 58, 475–488, (In Chinese with English abstract). [Google Scholar]
  14. An, S.R.; An, X.G.; Li, X.L. Discovery and study of rare natural christite in Guizhou. Guizhou Geol. 1988, 4, 377–379+383, (In Chinese with English abstract). [Google Scholar]
  15. Duan, H.Y.; Wang, C.M. Geochemistry and mineralization of a critical element: Thallium. Acta Petrol. Sin. 2022, 6, 1771–1794. [Google Scholar]
  16. Li, G.Z. A study of ore compositions and thallium occurrence in mercury-thallium deposit at Lanmuchang of Xingren County in southwestern Guizhou. Guizhou Geol. 1996, 1, 24–37, (In Chinese with English abstract). [Google Scholar]
  17. Chen, D.Y.; Wang, G.X.; Zou, Z.X.; Chen, Y.M. The discovery and study of Lanmuchangite, the First New Thallium Mineral, in China. J. Guizhou Univ. Technol. 2001, 5, 5–7+12, (In Chinese with English abstract). [Google Scholar]
  18. Ren, D.Y.; Chen, D.Y. The features of tectonics-controlling metallogenesis and its experimental study on Lanmuchang thallium deposit. Guizhou province. Geol. Geochemi. 2001, 3, 201–205, (In Chinese with English abstract). [Google Scholar]
  19. Yuan, S.F.; Liu, J.Z.; Song, W.F.; Su, C.P.; Yang, C.F.; Xu, L.Y.; Zhang, M.; Long, C.X.; Wang, X.Y.; He, J.P. Geologic and Tectono-geochemical Characteristics of Lanmuchang Au-Hg-Tl Deposit in Xingren, Guizhou. Guizhou Geol. 2018, 1, 7–13, (In Chinese with English abstract). [Google Scholar]
  20. Chen, D.Y.; Zou, Z.X. Studying Situation about Lanmuchang Type Thallium (Mercury) Ore Deposits in Southwestern Guizhou. Guizhou Geol. 2000, 4, 236–241, (In Chinese with English abstract). [Google Scholar]
  21. Zhang, Z.; Zhang, B.G.; Hu, J.; Yao, L.B.; Tian, Y.F. A Preliminary discussion on the bio-metallogenesis of Tl deposits in the Low-temperature minerogenetic province of southwestern China. Sci. China Ser. D Earth Sci. 2007, 50, 359–370. [Google Scholar] [CrossRef]
  22. Deng, F. The Geological Characteristics and Elemental Geochemistry Research about Xingren Lanmuchang Thallium (Mercury) Ore Deposits. Master’s Thesis, Kunming University of Science and Technology, Kunming, China, 2010. [Google Scholar]
  23. Hu, R.Z.; Gao, W.; Fu, S.L.; Su, W.C.; Peng, J.T.; Bi, X.W. Mesozoic intraplate metallogenesis in South China. Earth Sci. Front. 2024, 31, 226–238. [Google Scholar]
  24. Pi, Q.H.; Hu, R.Z.; Xiong, B.; Li, Q.L.; Zhong, R.C. In situ SIMS U-Pb dating of hydrothermal rutile, reliable age for the Zhesang Carlin-type gold deposit in the golden triangle region, SW China. Miner. Deposita 2017, 52, 1179–1190. [Google Scholar] [CrossRef]
  25. Chen, M.H.; Bagas, L.; Liao, X.; Zhang, Z.Q.; Li, Q.L. Hydrothermal apatite SIMS Th-Pb dating: Constraints on the timing of low-temperature hydrothermal Au deposits in Nibao, SW China. Lithos 2019, 324, 418–428. [Google Scholar] [CrossRef]
  26. Jin, X.Y.; Zhao, J.X.; Feng, Y.X.; Hofstra, A.H.; Deng, X.D.; Zhao, X.F.; Li, X.W. Calcite U-Pb dating unravels the age and hydrothermal history of the giant Shuiyindong Carlin-type gold deposit in the golden triangle, South China. Econ. Geol. 2021, 116, 1253–1265. [Google Scholar] [CrossRef]
  27. Fleet, M.E.; Mumin, A.H. Gold-bearing arsenian pyrite and marcasite and arsenopyrite from Carlin Trend gold deposits and laboratory synthesis. Am. Mineral. 1997, 82, 182–193. [Google Scholar] [CrossRef]
  28. Reich, M.; Kesler, S.E.; Utsunomiya, S.; Palenik, C.S.; Chryssoulis, S.L.; Ewing, R.C. Solubility of gold in arsenian pyrite. Geochim. Cosmochim. Acta 2005, 69, 2781–2796. [Google Scholar] [CrossRef]
  29. Palinkaš, S.S.; Hofstra, A.H.; Percival, T.J.; Šoštari´c, S.B.; Palinkaš, L.; Bermanec, V.; Pecskay, Z.; Boev, B. Comparison of the Allchar Au-As-Sb-Tl Deposit, Republic of Macedonia, with Carlin-Type Gold Deposits. Rev. Econ. Geol. 2018, 20, 335–363. [Google Scholar]
  30. Gopon, P.; Douglas, J.O.; Auger, M.A.; Hansen, L.; Wade, J.; Cline, J.S.; Robb, L.J.; Moody, M.P. A nanoscale investigation of Carlin-type gold deposits: An atom-scale elemental and isotopic perspective. Econ. Geol. 2019, 114, 1123–1133. [Google Scholar] [CrossRef]
  31. Palenik, C.S.; Ustunomiya, S.; Reich, M.; Kesler, S.E.; Wang, L.; Ewing, R.C. “Invisible” gold revealed: Direct imagining of gold nanoparticles in a Carlin-type deposit. Am. Miner. 2004, 89, 1359–1366. [Google Scholar] [CrossRef]
  32. Deditius, A.P.; Utsunomiya, S.; Kesler, S.E.; Reich, M.; Ewing, R.C. Trace elements nanoparticles in pyrite. Ore Geol. Rev. 2011, 42, 32–46. [Google Scholar] [CrossRef]
  33. Pokrovski, G.S.; Kokh, M.A.; Proux, O.; Hazemann, J.L.; Bazarkina, E.F.; Testemale, D.; Escoda, C.; Boiron, M.C.; Blanchard, M.; Aigouy, T.; et al. The nature and partitioning of invisible gold in the pyrite-fluid system. Ore Geol. Rev. 2019, 109, 545–563. [Google Scholar] [CrossRef]
  34. Pokrovski, G.S.; Escoda, C.; Blanchard, M.; Testemale, D.; Hazemann, J.L.F.; Gouy, S.; Kokh, M.A.; Boiron, M.C.; de Parseval, F.; Aigouy, T.; et al. An arsenic-driven pump for invisible gold in hydrothermal systems. Geochem. Persp. Let. 2021, 17, 39–44. [Google Scholar] [CrossRef]
  35. Zhang, H.; Cai, Y.; Sha, G.; Brugger, J.; Pring, A.; Ni, P.; Qian, G.; Luo, Z.; Zhang, Y.; Tan, W. Effects of arsenic on the distribution and mode of occurrence of gold during fluid-pyrite interaction: A case study of pyrite from the Qiucun gold deposit, China. Am. Miner. 2022, 107, 914–929. [Google Scholar] [CrossRef]
  36. Deditius, A.P.; Reich, M. Constraints on the solid solubility of Hg, Tl, and Cd in arsenian pyrite. Am. Miner. 2016, 101, 1451–1459. [Google Scholar] [CrossRef]
  37. Chouinard, A.; Paquette, J.; Williams-Jones, A.E. Crystallographic controls on trace-element incorporation in auriferous pyrite from the Pascua epithermal highsulfidation deposit, Chile-Argentina. Can. Miner. 2005, 43, 951–963. [Google Scholar] [CrossRef]
  38. Liu, Y.H.; Xue, C.J.; Zhao, Y.; Zhao, X.B.; Chu, H.X.; Liu, C.X.; Yu, L.; Wang, L.; Wu, D.H. Research on Auriferous Pyrite in Hydrothermal Gold Deposits, China. Geoscience 2020, 34, 1–12, (In Chinese with English abstract). [Google Scholar]
  39. Deditius, A.P.; Utsunomiya, S.; Renock, D.; Ewing, R.C.; Ramana, C.V.; Becker, U.; Kesler, S.E. A proposed new type of arsenian pyrite: Composition, nanostructure and geological significance. Geochim. Cosmochim. Acta 2008, 72, 2919–2933. [Google Scholar] [CrossRef]
  40. Deditius, A.P.; Reich, M.; Kesler, S.E.; Utsunomiya, S.; Chryssoulis, S.L.; Walshe, J.; Ewing, R.C. The coupled geochemistry of Au and As in pyrite from hydrothermal ore deposits. Geochim. Cosmochim. Acta 2014, 140, 644–670. [Google Scholar] [CrossRef]
  41. Qian, G.; Brugger, J.; Testamale, D.; Skiner, W.; Pring, A. Formation of As(II)-pyrite during experimental replacement of magnetite under hydrothermal conditions. Geochim. Cosmochim. Acta 2012, 100, 1–10. [Google Scholar] [CrossRef]
  42. Keith, M.; Smith, D.J.; Jenkin, G.R.; Holwell, D.A.; Dye, M.D. A review of Te and Se systematics in hydrothermal pyrite from precious metal deposits: Insights into ore-forming processes. Ore Geol. Rev. 2018, 96, 269–282. [Google Scholar] [CrossRef]
  43. D’Orazio, M.; Biagioni, C.; Dini, A.; Vezzoni, S. Thallium-rich pyrite ores from the Apuan Alps, Tuscany, Italy: Constraints for their origin and environmental concerns. Miner. Deposita 2017, 52, 687–707. [Google Scholar] [CrossRef]
  44. George, L.L.; Biagioni, C.; D’Orazio, M.; Cook, N.J. Textural and trace element evolution of pyrite during greenschist facies metamorphic recrystallization in the southern Apuan Alps (Tuscany, Italy): Influence on the formation of Tl-rich sulfosalt melt. Ore Geol. Rev. 2018, 102, 59–105. [Google Scholar] [CrossRef]
  45. Manceau, A.; Merkulova, M.; Murdzek, M.; Batanova, V.; Baran, R.; Glatzel, P.; Saikia, B.K.; Paktunc, D.; Lefticariu, L. Chemical forms of mercury in pyrite: Implications for predicting mercury releases in acid mine drainage settings. Environ. Sci. Technol. 2018, 52, 10286–10296. [Google Scholar] [CrossRef] [PubMed]
  46. Voute, F.; Hagemann, S.G.; Evans, N.J.; Villanes, C. Sulfur isotopes, trace element, and textural analyses of pyrite, arsenopyrite and base metal sulfides associated with gold mineralization in the Pataz-Parcoy district, Peru: Implication for paragenesis, fluid source, and gold deposition mechanisms. Miner. Deposita 2019, 54, 1077–1100. [Google Scholar] [CrossRef]
  47. Keith, M.; Smith, D.J.; Doyle, K.; Holwell, D.A.; Jenkin, G.R.; Barry, T.L.; Becker, J.; Rampe, J. Pyrite chemistry: A new window into Au-Te ore-forming processes in alkaline epithermal districts, Cripple Creek, Colorado. Geochim. Cosmochim. Acta 2020, 274, 172–191. [Google Scholar] [CrossRef]
  48. Gregory, D.D.; Cracknell, M.J.; Large, R.R.; McGoldrick, P.; Kuhn, S.; Maslennikov, V.V.; Baker, M.J.; Fox, N.; Belousov, I.; Figueroa, M.C.; et al. Distinguishing ore deposit type and barren sedimentary pyrite using laser ablation-inductively coupled plasma-mass spectrometry trace element data and statistical analysis of large data sets. Econ. Geol. 2019, 114, 771–786. [Google Scholar] [CrossRef]
  49. Babedi, L.; Heyden, B.P.; Tadie, M.; Mayne, M. Trace elements in pyrite from five different gold ore deposit classes: A review and meta-analysis. In Magmatism in the Ocean Basins; Special Publications; Saunders, A.D., Norry, M.J., Eds.; Geological Society: London, UK, 2022; Volume 516, pp. 47–83. [Google Scholar]
  50. Keith, M.; Haase, K.M.; Chivas, A.R.; Klemd, R. Phase separation and fluid mixing revealed by trace element signatures in pyrite from porphyry systems. Geochim. Cosmochim. Acta 2022, 329, 185–205. [Google Scholar] [CrossRef]
  51. Zhao, F.Q.; Gu, S.Y.; Mao, Q.; Deng, Z.X.; Guo, Z.D. LA-ICP-MS trace element characteristics of pyrites from the Lanmuchang Hg-Tl deposit in Xingren County, Guizhou Province and the Tl mineralization of the deposit. Acta Mineral. Sin. 2022, 42, 692–704, (In Chinese with English abstract). [Google Scholar]
  52. Cao, G.S.; Zhang, Y.; Chen, H.Y. Trace elements in pyrite from orogenic gold deposits: Implications for metallogenic mechanism. Acta Petrol. Sin. 2023, 39, 2330–2346, (In Chinese with English abstract). [Google Scholar] [CrossRef]
  53. Chen, L.A. A discussion on geochemical mechanism of mineralization of Hg, Sb, As and Au in carbonate formation in Guizhou. Guizhou Geol. 1990, 24, 196–203, (In Chinese with English abstract). [Google Scholar]
  54. Xiong, Y.L. The aqueous geochemistry of thallium: Speciation and solubility of thallium in low temperature systems. Environ. Chem. 2009, 6, 441. [Google Scholar] [CrossRef]
  55. Williams-Jones, A.E.; Bowell, R.J.; Migdisov, A.A. Gold in solution. Elements 2009, 5, 281–287. [Google Scholar] [CrossRef]
  56. Román, N.; Reich, M.; Leisen, M.; Morata, D.; Barra, F.; Deditius, A.P. Geochemical and micro-textural fingerprints of boiling in pyrite. Geochim. Cosmochim. Acta 2019, 246, 60–85. [Google Scholar] [CrossRef]
  57. Schaarschmidt, A.; Haase, K.M.; Klemd, R.; Keith, M.; Voudouris, P.C.; Alfieris, D.; Strauss, H.; Wiedenbeck, M. Boiling effects on trace element and sulfur isotope compositions of sulfides in shallow-marine hydrothermal systems: Evidence from Milos Island, Greece. Chem. Geol. 2021, 583, 120457. [Google Scholar] [CrossRef]
  58. Ma, Y.; Jiang, S.Y.; Frimmel, H.E.; Zhu, L.Y. In situ chemical and isotopic analyses and element mapping of multiple-generation pyrite: Evidence of episodic gold mobilization and deposition for the Qiucun epithermal gold deposit in Southeast China. Am. Miner. 2022, 107, 1133–1148. [Google Scholar] [CrossRef]
  59. Kesler, S.E.; Fortuna, J.; Ye, Z.; Alt, J.C.; Core, D.P.; Zohar, P.; Borhauer, J.; Chryssoulis, S.L. Evaluation of the role of sulfidation in deposition of gold, Screamer section of the Betze-Post Carlin-type deposit, Nevada. Econ. Geol. 2003, 98, 137–1157. [Google Scholar] [CrossRef]
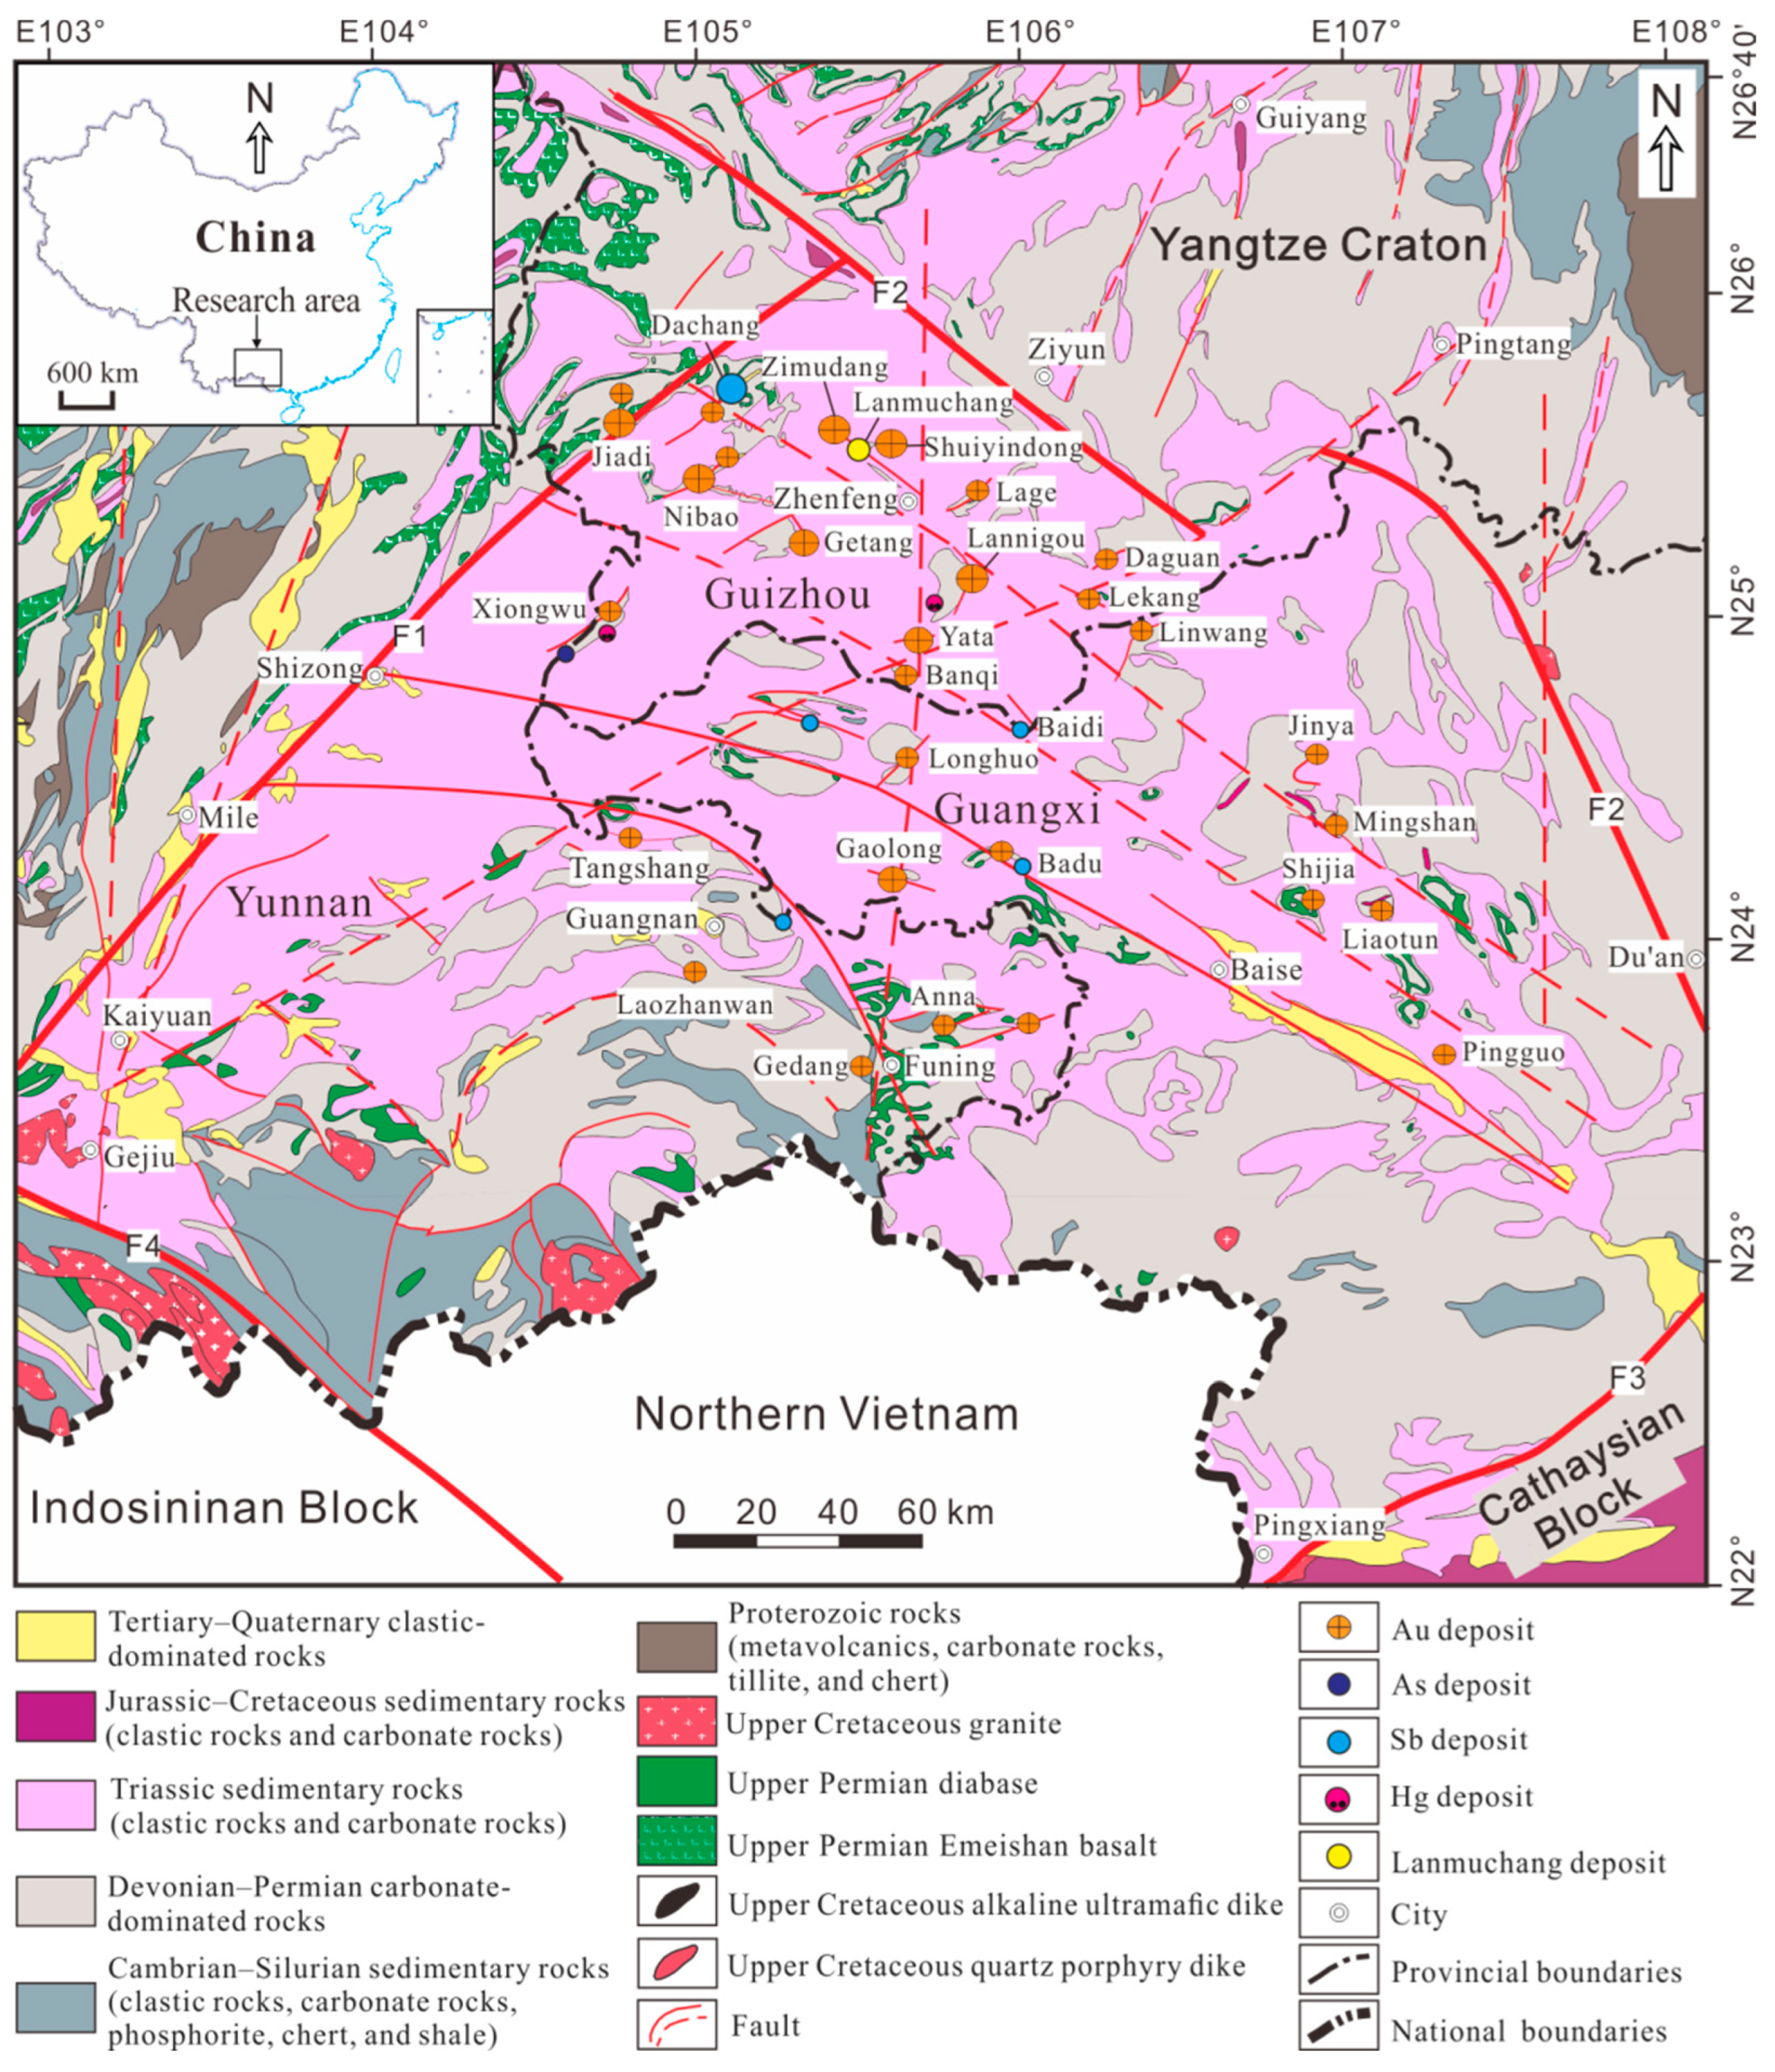
Figure 1. Regional geological map showing the distribution of Carlin-type Au and associated deposits in the Nanpanjiang–Youjiang metallogenetic area, SW China (modified from [2,3]). The thick red lines are basement-penetrating faults. F1 = Mile–Shizong Fault; F2 = Ziyun–Nandan Fault; F3 = Pingxiang–Nanning Fault; F4 = Red River Fault.
Minerals 14 00615 g001
Figure 2. Geological map of the Lanmuchang deposit (a) and geological profile of exploration line No. 9 (b) (modified from [13,21]).
Minerals 14 00615 g002
Figure 3. Structural characteristics of various ores in the Lanmuchang deposit. (a) Distribution of cinnabar in Hg ore rock layers, (b) disseminated distribution of lorandite in Tl ore, (c) crystal holes present in brecciated Au ore, (d) calcite stockworks and Au ore cuttings, and (e) polished slab showing fracture filling by pyrite in Tl mineralized rocks. Abbreviation: Brt = barite, Cal = calcite, Cin = cinnabar, Lor = lorandite, and Py = pyrite.
Minerals 14 00615 g003
Figure 4. Backscattered electron images of various ores in the Lanmuchang deposit. (a) Banded pyrite coexisting with quartz and kaolinite; (b) coexistence of pyrite, cinnabar, illite, and kaolinite (cinnabar dissolved by pyrite); (c) coexistence of pyrite, cinnabar, illite, quartz, and apatite (cinnabar dissolved by pyrite); (d) coexistence of pyrite, barite, quartz, and apatite (apatite dissolved by quartz); (e) coexistence of fluorite, quartz, and apatite (fluorite dissolved by quartz); and (f) coexistence of dolomite, quartz, and pyrite (dolomite dissolved by quartz). Abbreviations: Ap = apatite, As-py = As-pyrite, Brt = barite, Cal = calcite, Cin = cinnabar, Dol = dolomite, Fe-Dol = Fe-dolomite, Fl = fluorite, Ill = Illite, Kln = kaolinite, Lor = lorandite, Py = pyrite, and Qz = quartz.
Minerals 14 00615 g004
Figure 5. EPMA element surface scanning image of pyrite in the Lanmuchang deposit.
Minerals 14 00615 g005
Figure 6. Correlation diagrams between As and Au (a), Tl (b), and Hg (c) of pyrite in the Lanmuchang deposit (base map from [28,36]).
Minerals 14 00615 g006
Figure 7. Correlation diagrams between S and Fe (a), S and As (b), Fe and Tl (c), and Fe and As (d) of pyrite in the Lanmuchang deposit.
Minerals 14 00615 g007
Figure 8. As–S–Fe triangle diagram of hydrothermal pyrite in the Lanmuchang deposit (base map from [40]). Four different trends show substitution of (i) As for S (As1−–pyrite, red arrow), (ii) As2+ for Fe (As2+–pyrite, green arrow), (iii) As3+ for Fe (As3+–pyrite, blue arrow), and (iv) Me2+ for Fe (yellow arrow).
Minerals 14 00615 g008
Figure 9. Copper, Au, and As/Sb of hydrothermal pyrite from the Lanmuchang deposits indicate fluid boiling (base map from [57]). The data of the black hollow squares are from [51], and the data of the red solid circles are from this study.
Minerals 14 00615 g009
Table 1. Quantitative TIMA mineralogical analysis of Hg–Tl and Au ores from the Lanmuchang deposit.
Sample/MineralZK901-10ZK901-13
Mass % of PhaseVolume % of PhaseMass % of PhaseVolume % of Phase
Quartz36.4231.9256.4561.20
Pyrite11.0118.4515.808.96
Kaolinite20.5517.887.117.77
Illite18.4316.0317.2918.88
Si, Al, S, O, Fe, Ti, K4.053.661.181.24
Rutile1.702.410.520.35
Cinnabar0.681.85
Baryte1.011.52
Florencite-(La)0.800.940.080.07
Chromite0.540.810.020.01
Si, Ti, Al, K, O0.500.450.470.50
Apatite0.280.290.250.22
Muscovite0.310.290.340.35
Schorl0.200.21
Pyrrhotite0.110.160.050.03
Hematite/magnetite0.050.080.02
Biotite0.070.070.130.12
Unidentified minerals3.272.950.260.27
Total99.9899.9899.9799.97
Note: – = not detected.
Table 2. Hg and Tl distribution in various minerals in the Hg–Tl ore (ZK901-10) in the Lanmuchang deposit.
Mineral TypeMineral Content (%)Hg Content in
Minerals (%)
Hg Distribution in
Minerals (%)
Tl Content in
Minerals (%)
Tl Distribution in
Minerals (%)
Quartz36.420.020.0072840.020.007284
Pyrite11.010.040.0044040.270.029727
Cinnabar0.6885.530.5816040.610.004148
Illite18.430.040.0073720.020.003686
Kaolinite20.550.030.0061650.020.00411
Barite1.010000
Total88.1 0.606829 0.048955
The Au content of the ore is less than 0.2%, that of Hg is 0.6149%, and that of Tl is 0.0139%.
Note: Mineral content data from TIMA analysis results, element content data in minerals from EPMA analysis results, and element content of ore from exploration analysis results.
Disclaimer/Publisher’s Note: The statements, opinions and data contained in all publications are solely those of the individual author(s) and contributor(s) and not of MDPI and/or the editor(s). MDPI and/or the editor(s) disclaim responsibility for any injury to people or property resulting from any ideas, methods, instructions or products referred to in the content.