Article

Unraveling Dry Jigging: Insights into Pulsation, Energy Consumption, and Stratification Dynamics

by
Fortunato Lucas Quembo Raposo
1,2,
Carlos Otávio Petter
2 and
Weslei Monteiro Ambrós
2,*
1
Department of Natural Sciences, Púnguè University, Heróis Moçambicanos, Chimoio 323, Mozambique
2
Mineral Processing Laboratory, School of Engineering, Federal University of Rio Grande do Sul, 9500 Bento Gonçalves Avenue, Porto Alegre 91501-970, Brazil
*
Author to whom correspondence should be addressed.
Minerals 2024, 14(7), 678; https://doi.org/10.3390/min14070678
Submission received: 1 May 2024 / Revised: 24 June 2024 / Accepted: 27 June 2024 / Published: 28 June 2024
(This article belongs to the Section Mineral Processing and Extractive Metallurgy)

Abstract

:
The increasing concerns regarding water usage in mineral processing have led to a growing interest in dry jigging in recent years. However, there is still a need for a more comprehensive examination of the operational aspects of the technique. In this sense, this study focused on three main elements: (a) examining the air pulse pattern during dry jig operation; (b) assessing the evolution of the stratification profile over time using partition analysis; and (c) evaluating the specific energy consumption of batch dry jigging during operation. Also, an innovative operational strategy known as “transient pulsing” was proposed and analyzed, involving varying the intensity and frequency of the air pulse throughout the stratification process. All tests were conducted using density tracers spread across 11 density ranges (0.4–2.4 g/cm3) and a base bed (gravel) to analyze their separation in a batch, pilot-scale dry jig. Pressure drop and active power data were collected to measure the pulse characteristics and energy consumption. The airflow curves, obtained through pressure drop data, indicated that the pulsation process is more unstable as the airflow increases, possibly due to the pressure fluctuations experienced by air during valve closure. For the pulsation conditions used in the tests, the specific energy consumption was 10.66 Wh/kg of jigged material, with most of it related to the blower drive system. Analysis of the stratification evolution over time showed an oscillatory behavior, alternating between states of better (Ep < 0.1) and worse (Ep > 0.1) separation, especially for the near-gravity material (NGM). Results of the transient pulsation tests suggested that progressively increasing the vertical displacement of the bed during stratification resulted in slightly better segregation levels and more stable jigging evolution over time in comparison to stationary pulse conditions.

1. Introduction

Gravity separation, based on the separation of particles due to their differential motion in fluids, encompasses techniques with diverse characteristics and operational principles. Throughout history, gravity separation has traditionally been conducted using wet systems, except in areas where extreme weather conditions make it difficult to use processed water, either due to water scarcity or freezing of the wet products. However, rising environmental concerns regarding water usage and management in mineral processing plants, along with the growing emphasis on social and environmental responsibility by stakeholders, have spurred a demand for more sustainable beneficiation methods, notably dry beneficiation [1].
Dry gravity beneficiation methods were initially developed for coal processing and were particularly popular at the beginning of the 20th century. In 1916, the first commercial dry jig was introduced [2], while the Frazer–Yankey separator, based on an aero suspension of sand, was in use in the USA in the 1930s [3]. According to Weinstein and Snoby [2], by 1938, dry gravity separators already accounted for 16% of the beneficiated coal produced in the US.
Currently, dry gravity separation techniques can be categorized into three main types: air fluidized bed (dry dense medium) separation, air tabling, and dry jigging. In the first method, an upward air stream passes through a particle bed composed of specific medium particles (such as sand or magnetite powder) to create a pseudo-fluid bed [1]. This causes lighter materials to float or move upward, while heavier materials sink or move downward. Although it is not a new technique, there has been a renewed interest in this method, as evidenced by recent studies [4,5,6].
Air tabling can be seen as the combination of air fluidization and traditional wet shaking tabling. In this process, the feed is placed on a perforated deck surface that undergoes an eccentric oscillation [7]. Controlled upward airflow passes through the deck pores and the particle bed. This combination of fluidization and slipping action separates fractions of different densities (light, heavy, and middling) into different zones of the equipment, allowing for separate collection [1]. Some commercial equipment in this category includes the FGX separator [8,9] and the KAT air table [10].

1.1. Dry Jigging: Overview and State of the Art

Dry jigging (also known as air jigging or pneumatic jigging) is a particle separation method that relies on the density stratification of particle beds subjected to vertical pulsations generated by an upward pulsed airflow. This technique has similarities with the well-established hydraulic jigging process (wet jigging), which has been extensively utilized for concentrating coarse ores and coals and, more recently, in the recycling of solid waste [11,12]. Traditional hydraulic jigs typically feature a tank or chamber that is divided horizontally into two sections. One section holds the screen (perforated plate that supports the material bed) while the other section incorporates the water pulsation mechanism, which may consist of a piston, diaphragm, or air chamber [13].
Dry jigs consist of a container with a screen in its base through which an upward pulse of air is injected into the equipment (Figure 1). This air pulse is produced by an air stream from a blower passing through a butterfly or rotary piston valve, and the rotation frequency of the valve is directly linked to the air pulse frequency. Prior to entering the valve, a portion of the air stream is diverted to create a continuous flow. This continuous flow increases the porosity of the bed, thereby minimizing the occurrence of short circuits during the passage of the air pulse [11]. This results in the temporary fluidization of the bed (dispersion of the particles), enabling the particles to move relative to one another based on their specific gravities. Through repetitive cycles and after a specific number of bed pulsations, the bed experiences density-based segregation, with an increasing average particle density observed from the top to the bottom of the bed. In industrial jigs, the stratified bed is separated into two fractions: an upper product enriched in light (lower-density) materials, and a bottom product concentrated in heavy (higher-density) particles.
Dry jigs exhibit unique operational features that influence the stratification process, often leading to lower separation efficiencies compared to hydraulic jigs. The most apparent difference lies in the use of air rather than water as the pulsating fluid, directly affecting the density-based separation. The concentration criterion (CC), a well-known index originally proposed by Taggart [14], provides insights into the influence of changing the fluid type (particularly its density) on predicting the ease of the density-based separation of two different materials, and is given by the following:
C C = ρ d ρ f ρ l ρ f q ,
where ρ d , ρ l , and ρ f are the densities of the dense material, light material, and fluid, respectively. The quotient q is related to the flow regime, where q = ½ for the Stoke’s regime, q = 1 for the Newtons’ regime, and ½ < q < 1 for the intermediary regime [13]. For example, considering the separation of coarse coal (ρs = 1.3 g/cm3) and quartz (ρs = 2.6 g/cm3), the values of CC in water and air would be 5.33 and 2, respectively (Newtonian regime), indicating a significantly greater separation difficulty in the latter case.
Another way to compare the performance of hydraulic and dry jigging is by observing the difference in the minimum fluidization velocity required to move the bed [11]:
U f , m í n = ε ( 1 ε ) ρ s p f g d p 2 180 μ ,
where U f , m í n , ε , and μ are the superficial velocity, the bed porosity, and the viscosity of the fluid, respectively; d p is the average diameter of the bed particles, for the case of spherical particles.
The fact that the air density is hundreds of times lower than that of water results in the need for high velocities to move the bed. As depicted in Figure 2a, dry fluidization of coal beds demands velocities up to 240 times greater than hydraulic fluidization (Figure 2b). It can also be observed that air fluidization requires separations in narrower size ranges for similar performance to water separation.
It is important to note that the fluidization velocity curves shown in Figure 2 and calculated according to Equation (2) assume laminar flow conditions and uniform particle size, which is not the case in dry jigging. In practice, the jigging bed consists of irregularly shaped materials, resulting in packing distortions that can create preferential airflow paths and short circuits. All these factors contribute to more turbulent pulsation dynamics, making maintaining uniform bed pulsation significantly more challenging than in conventional hydraulic jigging.
Another distinguishing factor is the absence of an apparent suction phase in dry jigging, as the air pulse, unlike water, does not have a return flow after passing through the jig. In the context of classical hydrodynamic theory, this implies that the interstitial percolation mechanism has less influence, and segregation in dry jigs tends to be more direct, meaning that fine particles tend to concentrate with the light ones, as pointed out by Sampaio and Tavares [13] and experimentally observed by Ambrós et al. [15].
Dry jigging has been the focus of numerous case studies aimed at assessing its potential for processing materials from different sources. While coal beneficiation remains its primary application, research into this technique has been ongoing for years [16,17,18,19]. Also, there is a growing interest in applying dry jigging to recycling and solid waste processing, particularly in the recycling of construction and demolition waste [20,21,22,23,24,25]. However, there is a limited amount of literature addressing the fundamental aspects related to the influence of bed properties (density, size, and shape) on stratification, as well as the role of mechanical factors (such as pulse characteristics, bed thickness, and operation time) that are integral to the process of dry jigging. In the first group, one can cite the study by Cazacliu et al. [21], which evidenced that the bulk density difference between the particle species is the driving force behind segregation in dry jigs, and the works by Ambrós et al. [26] and Ambrós et al. [15], which addressed the occurrence of wall effects and the influence of particle size distribution on density stratification, respectively.
Among the studies delving into the operational aspects of dry jigging, the work by Boylu et al. [27] focused on the fluidization characteristics of coal particles during stratification in a pilot-scale dry jig, using pressure drop data acquired through a manometer to determine the minimum fluidization air velocities. The authors found that separation efficiency was unimodally (i.e., followed a U-shaped pattern) related to the air velocity, and the optimum separation was achieved at air velocities where the cohesive forces between particles were expected to cease. The study by Sahoo et al. [28], on the other hand, compared conventional fluidization with angular fluidization in an air-pulsated stratifier, which is comparable to a batch dry jig. The authors found that a 30° angle of fluidization was optimal for the air distributor system.
The study by Aziz et al. [29] is perhaps the most comprehensive so far in analyzing the combined effect of the main operational parameters of jigging—airflow, pulse rate, and pulsation time—on separation efficiency. Using binary mixtures of density tracers of two densities (1.4 and 2.7 g/cm3) and close-sized distribution (1.70–2.36 mm), the authors found that separation efficiency improved with increased pulse rate and time, whereas the influence of airflow was seemingly unimodal. Statistical analysis revealed that pulse rate and time significantly influenced separation, while the role of airflow was found to be statistically insignificant within the range of experimental values used.
As can be seen from the literature, most previous studies have focused on specific aspects of dry jig operation (fluidization, wall effects, etc.) or have limited the analysis to discrete systems of binary or ternary mixtures composing the jig bed. However, it remains necessary to address the practical aspects of dry jigging more comprehensively. This includes utilizing partition analysis for assessing separation efficiency, which involves using multi-density systems, as well as estimating the pulse profile and the energy consumption throughout the process.

1.2. Core Issues and Goals

Due to the absence of studies on the evaluation of the jigging cycle and the operating characteristics of the blowers that provide the airflow, the correspondence between segregation mechanisms in hydraulic and dry jigs remains an open question. Based on this, in this study, we examine the evolution of the stratification profile over time in dry jigging. We start from the hypothesis that, unlike in hydraulic jigs, the stratification evolution over time in dry jigging may not always result in a stable equilibrium segregation profile but could instead display cyclic or even stochastic behavior.
Also, according to the original evidence presented in the study by Coelho and de Brito [30] about the high energy demand of dry jigging in recycling plants (even greater than the crushing sector), we examine the energy consumption during dry jigging operation. The lack of data on the energy consumption profile of dry jigs makes the approach to this subject relevant.
Finally, we propose and analyze a new operational strategy called “transient pulsing”. This strategy involves progressively varying the intensity and frequency of the air pulse while a mixture is being jigged. We hypothesize that, if appropriately conducted, this strategy may improve stratification efficiency in dry jigging. The basis of this hypothesis lies in the relationship between stratification and dispersive forces, as defined in King’s model of stratification [31], which considers the pulsating fluid to be both the ’liberator’ of latent potential energy and the one responsible for remixing the stratified bed. Thus, it is assumed here that regulating the bed pulsation conditions as it stratifies could theoretically maximize the liberating action and minimize the remixing action caused by pulsation. As a result, stratification could be more pronounced under specific transient conditions than under fixed pulsation conditions.

2. Materials and Methods
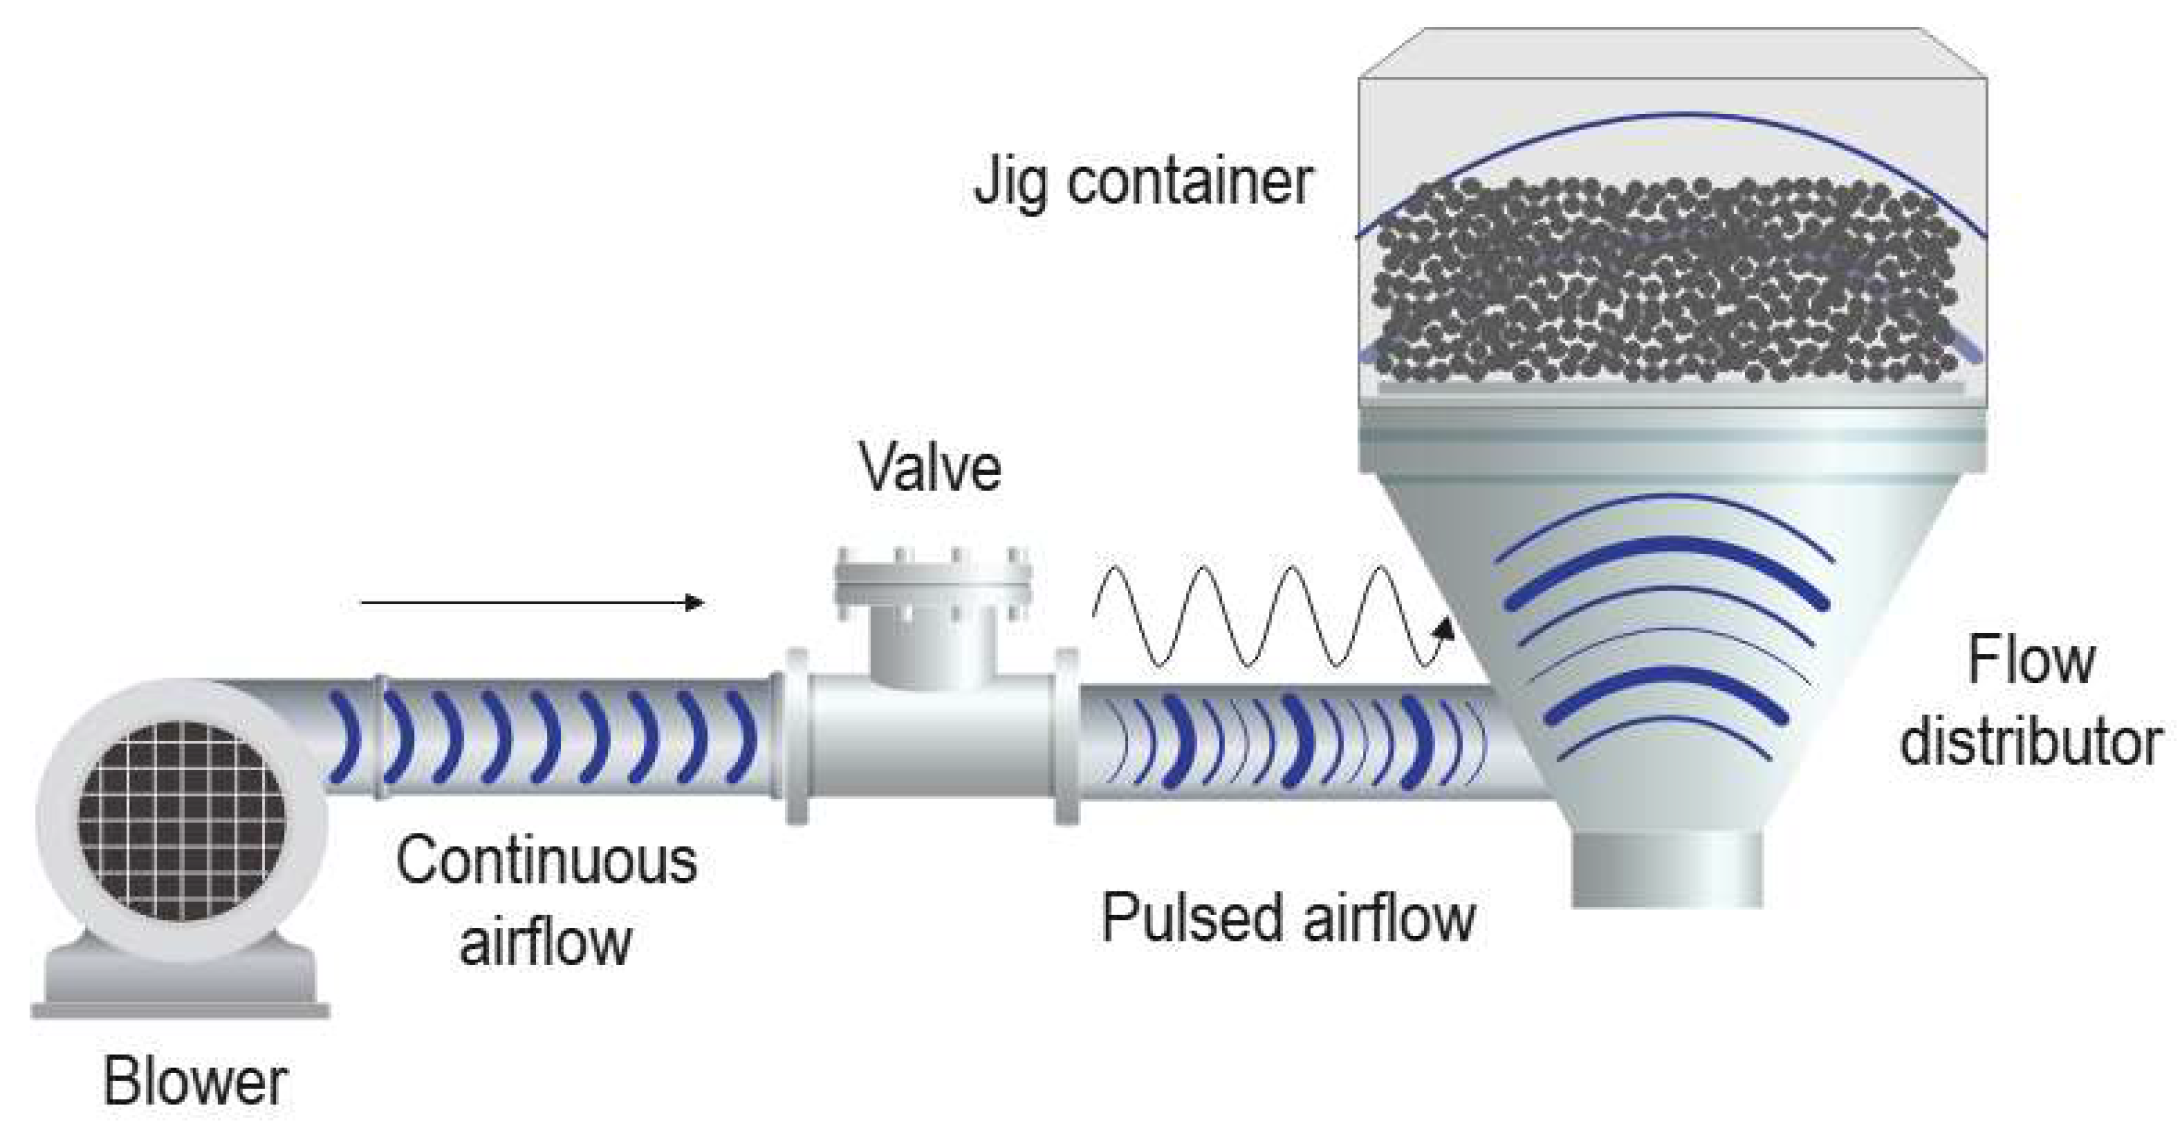
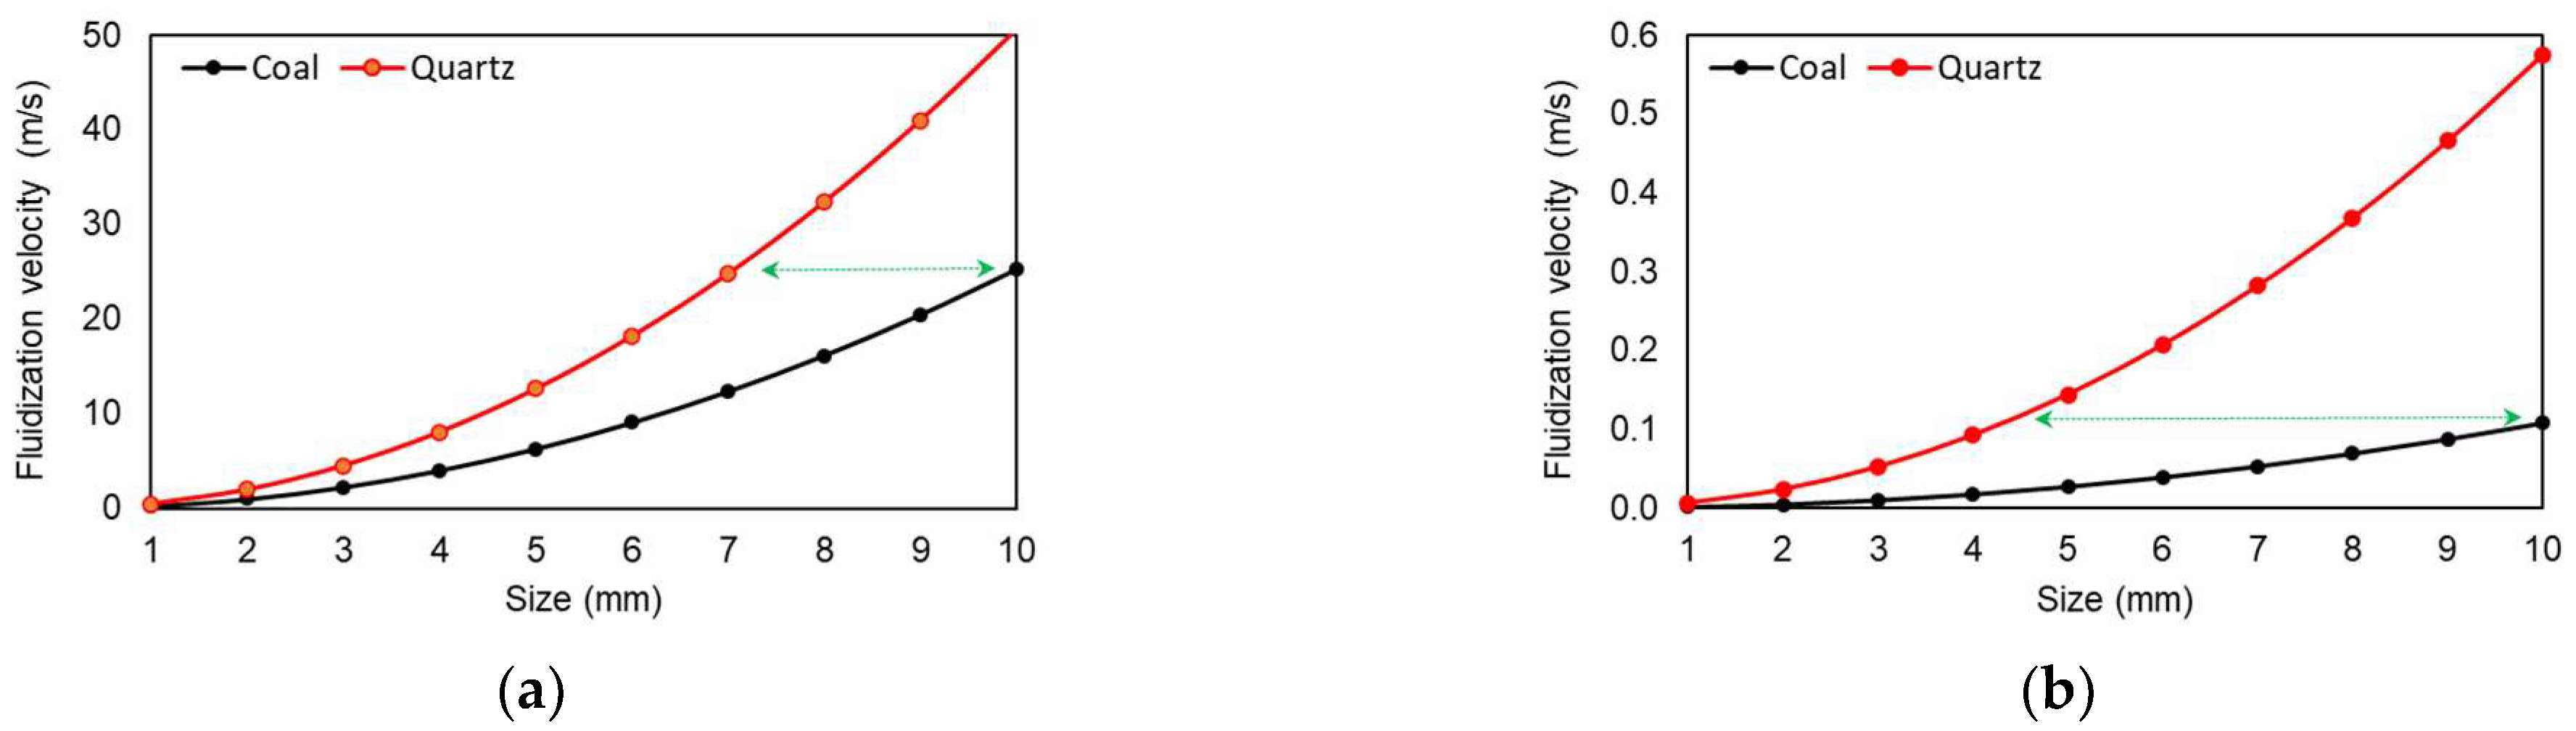
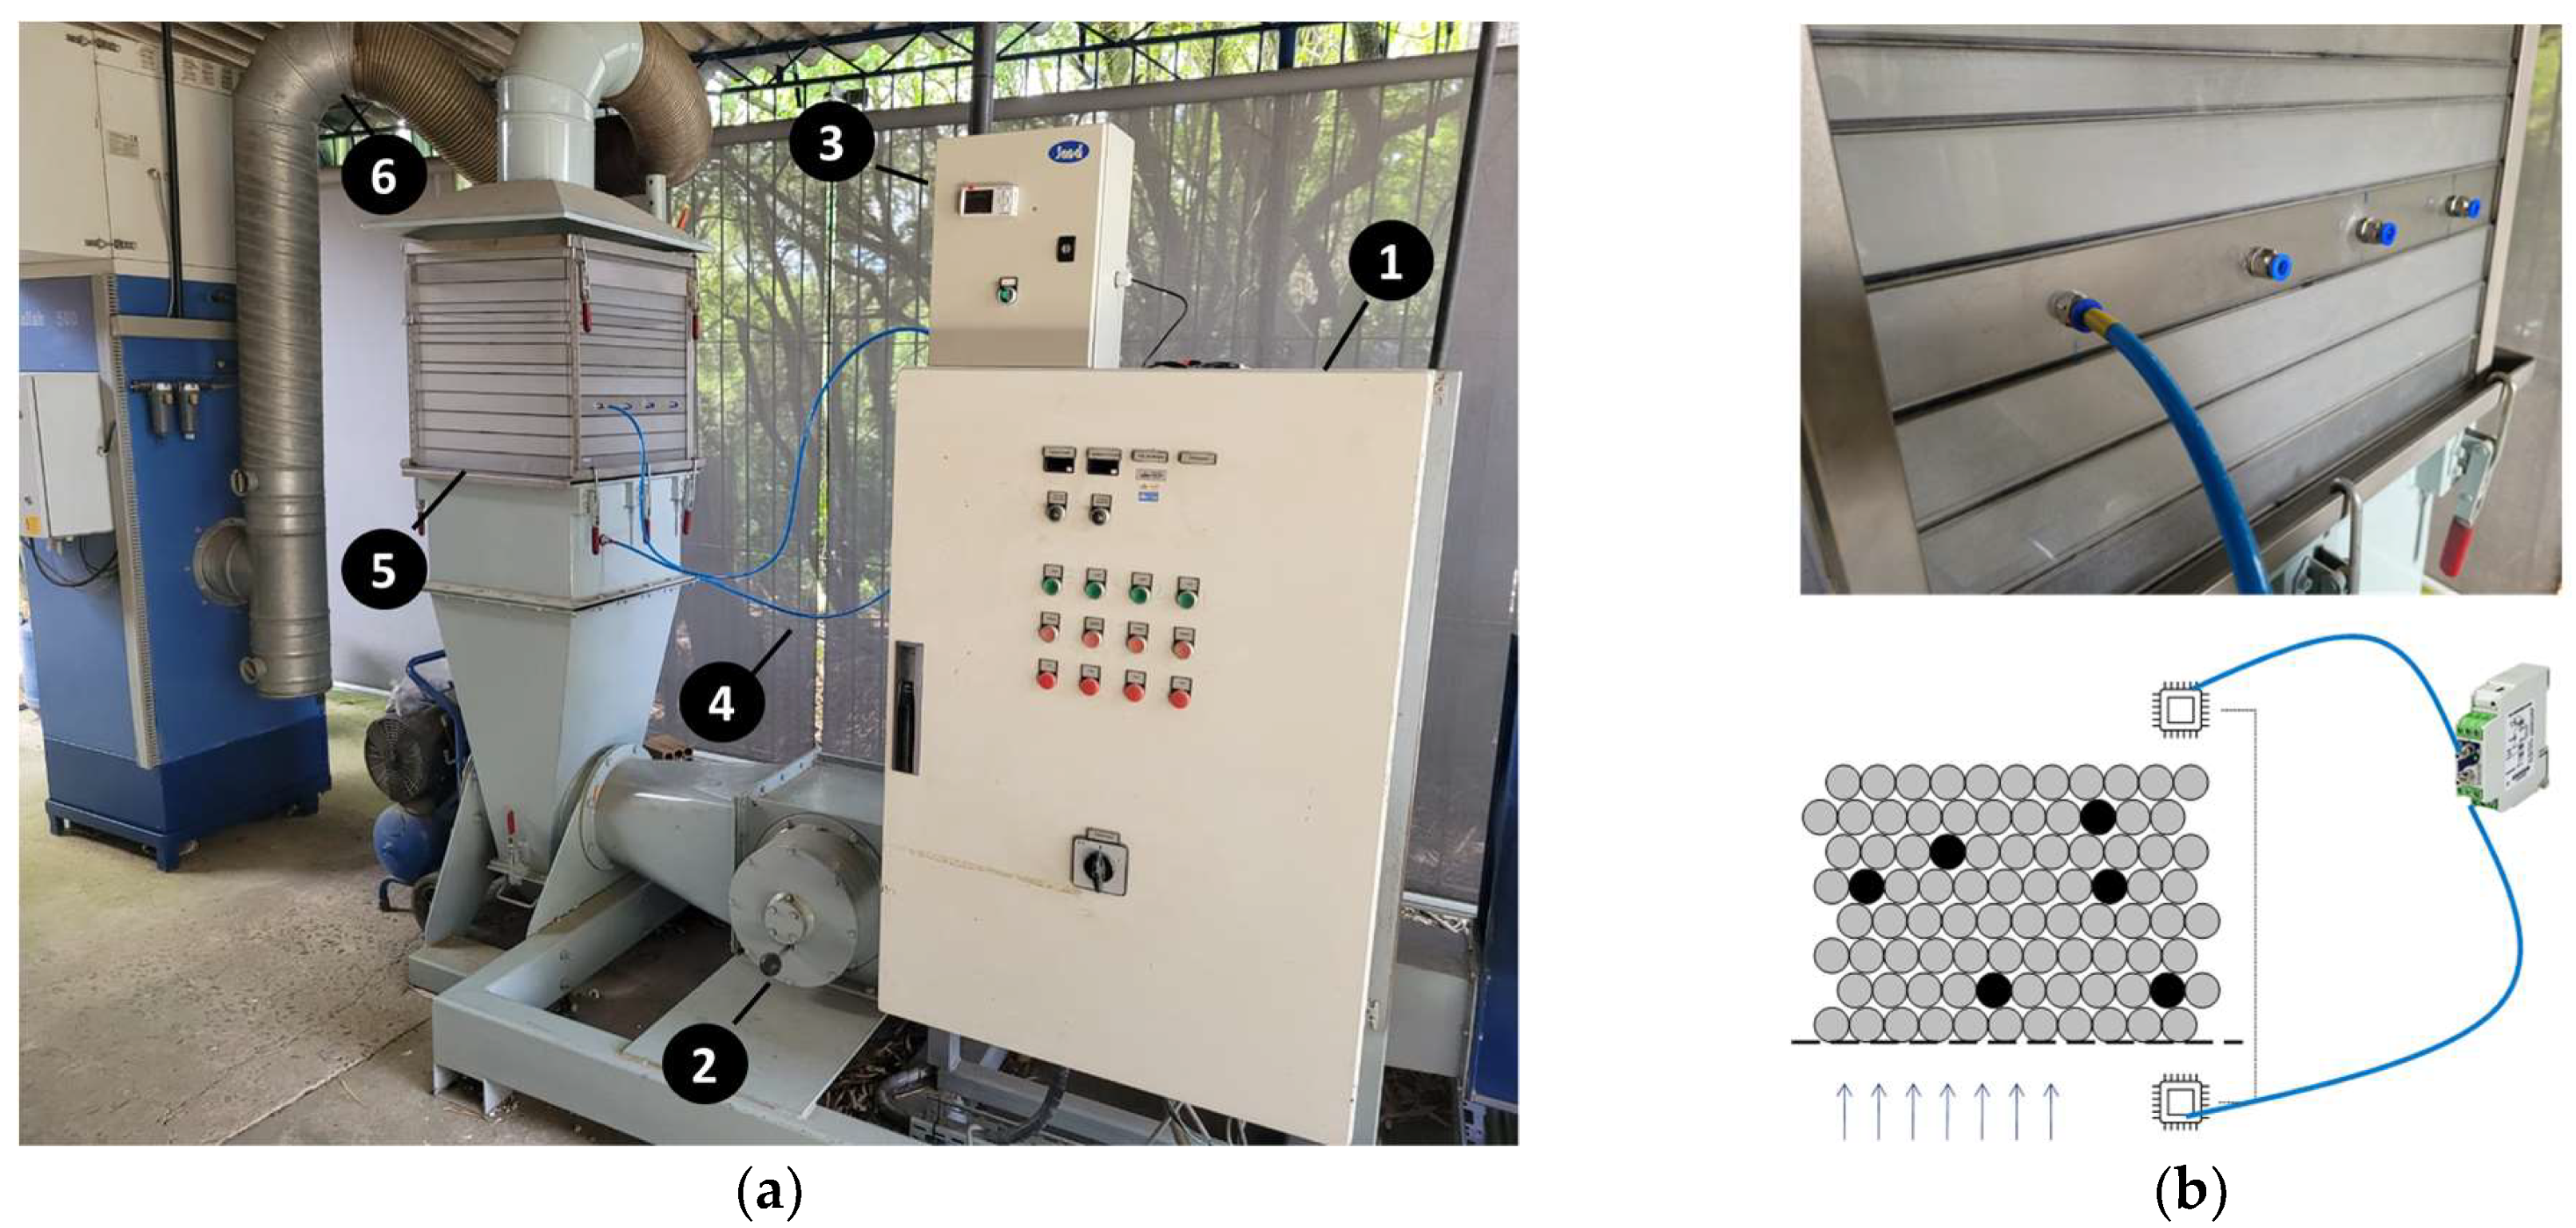
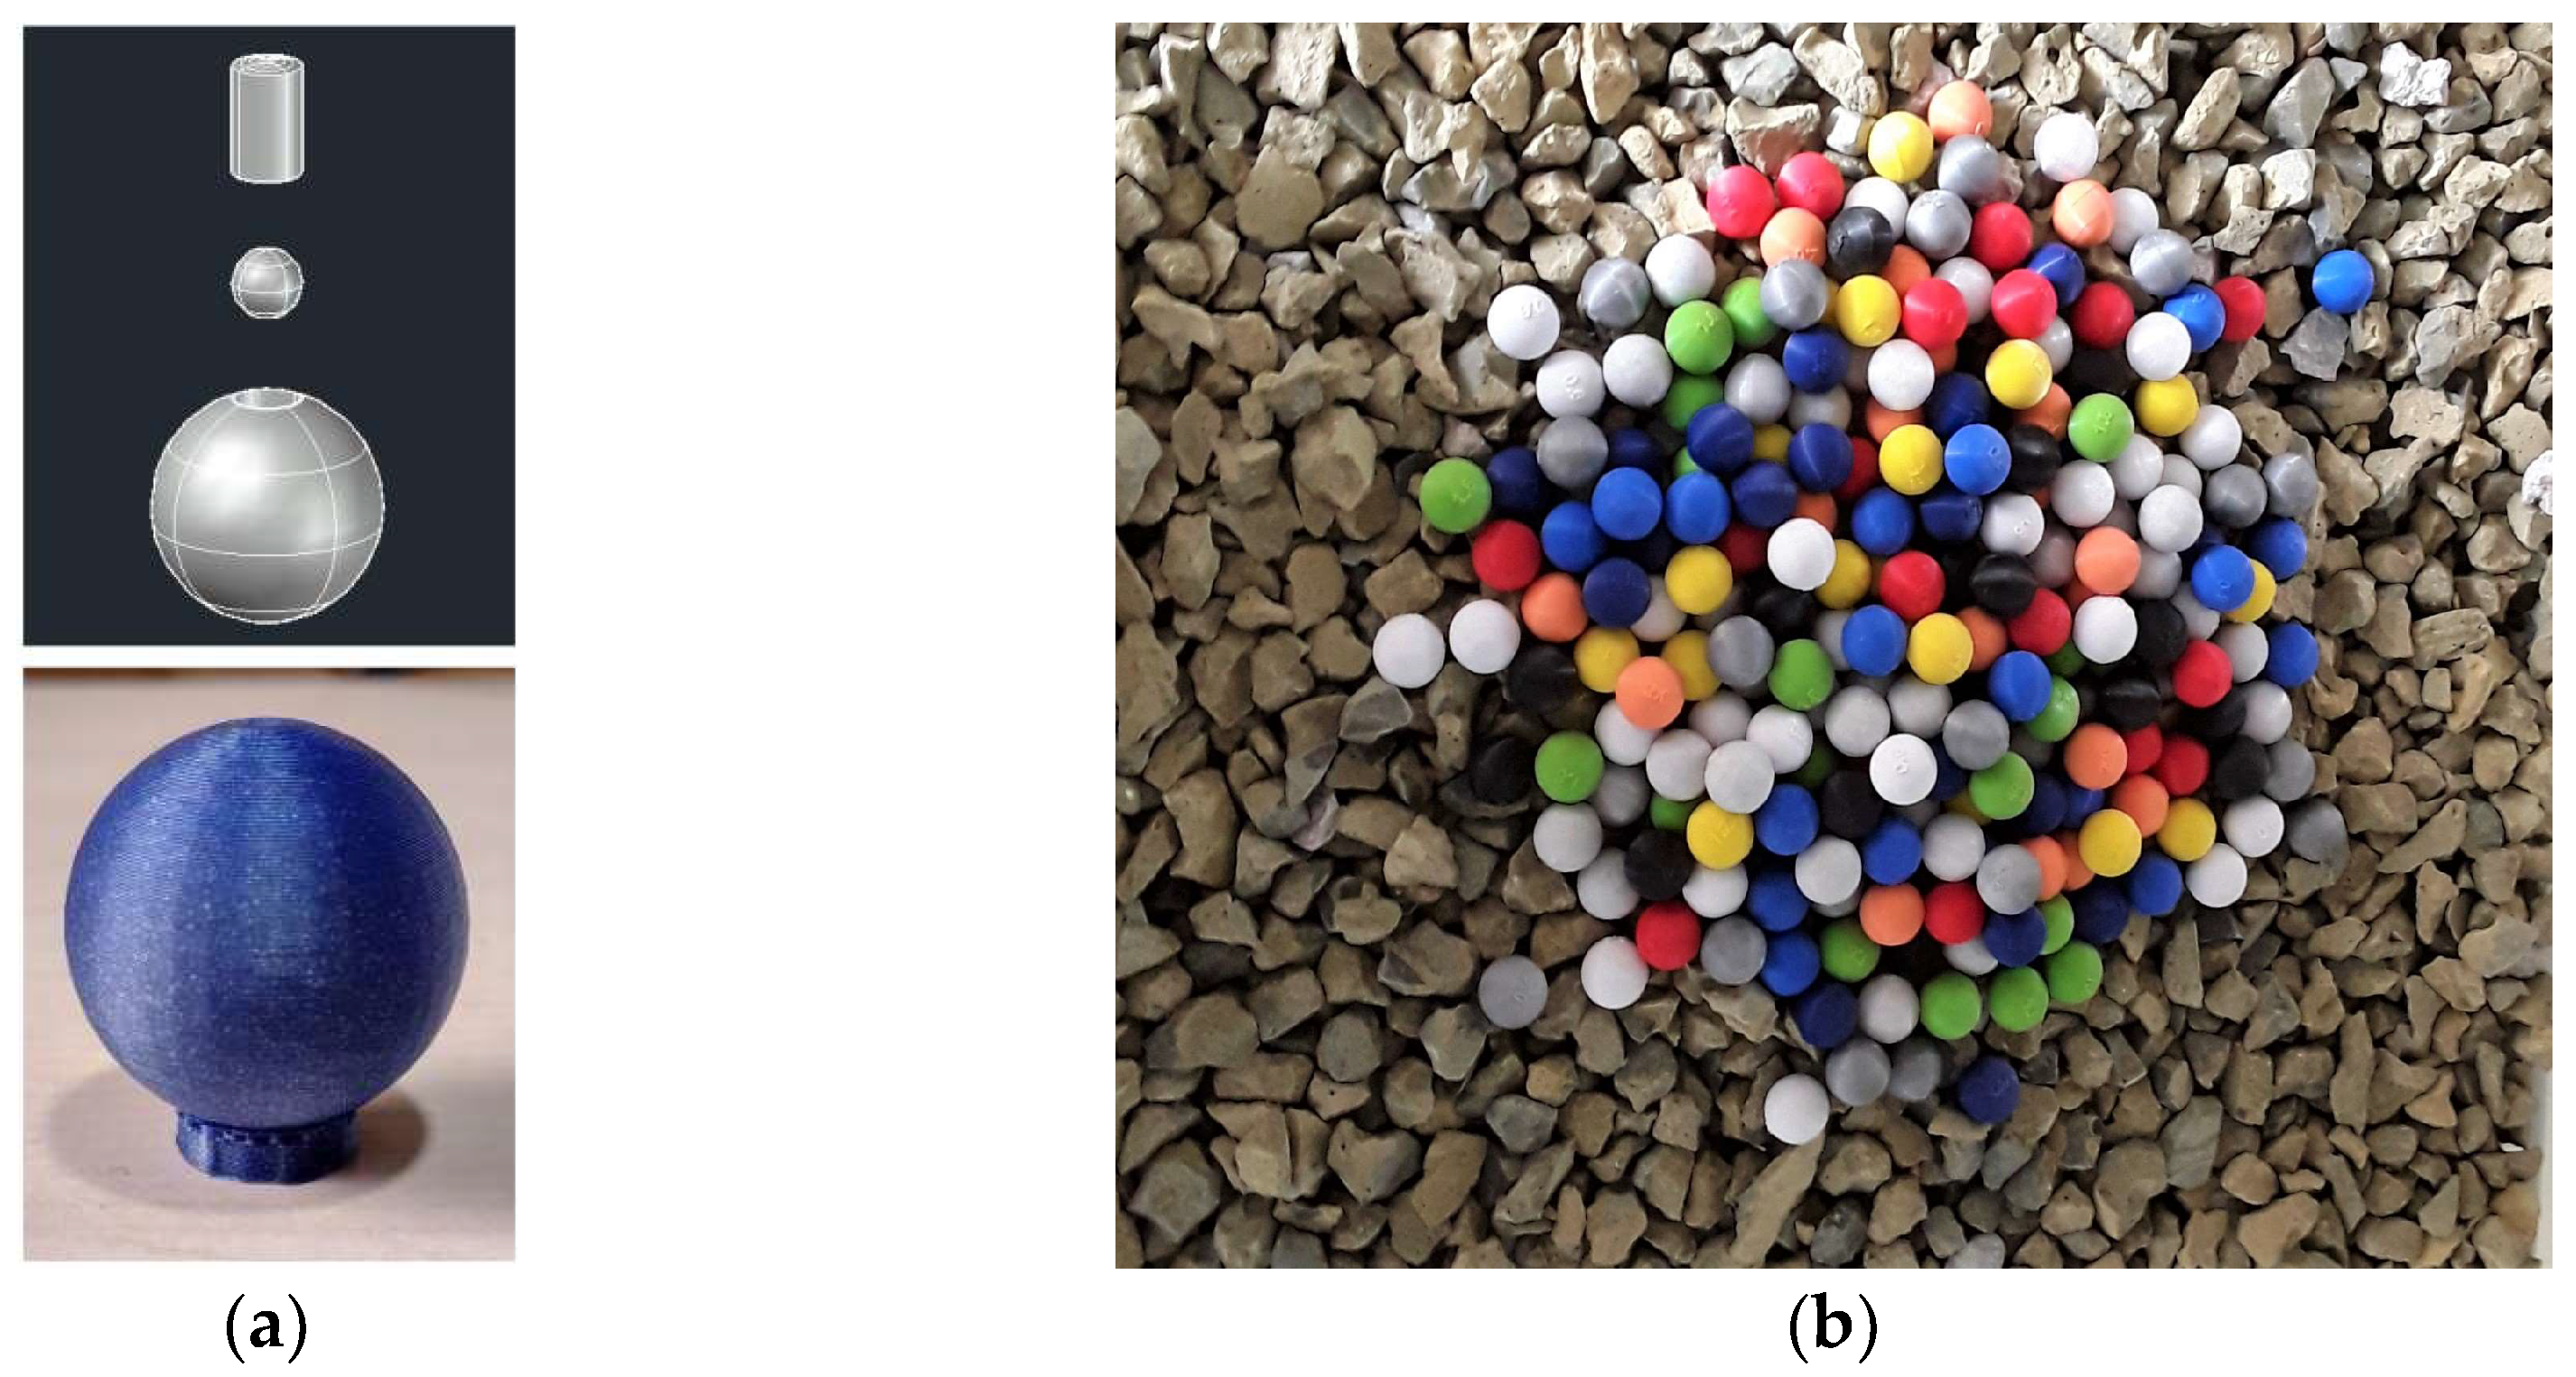
2.1. Equipment

The tests were carried out using a pilot-scale batch-operated dry jig, specifically the AllAir S-500 model manufactured by allmineral® (Düsseldorf, Germany, see Figure 3a). The jig has a capacity of about 60 kg per batch and consists of a container formed by overlapping square plexiglass frames (530 × 530 × 50 mm3) mounted on a 1 mm opening sieve. An upward-pulsed airflow passes through the separation container. During the testing process, samples of particulate materials are placed inside the container and exposed to the pulsating airflow for a specific period. The intensity and frequency of the pulse are controlled in a control panel.
Air injection into the jig container is achieved through a 15 kW centrifugal blower, with an output pressure of up to 6 kPa. The airflow is adjusted on the control panel in terms of the percentage of the maximum blower power, ranging from 0 to 100%, and is not directly known a priori. Before passing through the chamber containing the particulate bed, the air travels through a circular metal duct with a dual “Y”-shaped connection that divides the flow into two streams, one continuous and the other discontinuous. The continuous air stream aims to promote preliminary bed expansion to minimize the formation of short circuits and ensure as uniform a bed expansion as possible during pulsations. The discontinuous air stream, on the other hand, is controlled by a butterfly valve, where cycles of opening and closing enable the generation of air pulses with frequencies of up to 400 CPM (cycles per minute). Each opening and closing cycle of the valve results in an air pulse, inducing a vertical expansion and contraction motion of the bed.
After testing, the airflow stops, the bed pulsation ceases, and each compartment can be removed individually for collecting and analyzing vertical slices (strata) of the stratified bed. It is worth noting that cutting the bed in disjointed sections could disrupt particle positions near the interface between two strata, potentially causing composition errors of up to 9.1% in the stratified products [15].
The airflow entering the jig is calculated based on pressure drop data obtained using a Novus® NP785-68 differential pressure sensor (Novus Automation, Miami, FL, USA), with a range of −68 to +68 mbar, ±2% error, and 11.6-bit reading resolution. Measurements were taken every 0.1 seconds at inlet and outlet points using pneumatic hoses (Figure 3b). Data were recorded in mbar using a Novus® FieldLogger 512K recorder (Novus Automation, Miami, FL, USA), with a 512,000-record memory and 1000 records/second per channel.
The recorded ΔP values were used to calculate the air pulse velocity in the jig using the following equation:
v = 2   Δ P ρ a i r
where v and ρ a i r are the velocity (m/s) and density of air (1.225 kg/m3 at 25 °C and 101.325 kPa). The airflow rate (m3/s) was calculated by multiplying v by the cross-sectional area of the jig chamber, which is equal to 0.25 m2. In assigning test conditions, the flow rate considered corresponds to the peak (maximum flow rate) detected in a certain operational configuration.

2.2. Experimental Setup

In selecting the jigging bed for the tests, three factors were crucial. Firstly, a system comprising particles of diverse densities was necessary for enabling individual collection and counting for constructing partition curves. Secondly, an expedited method for assessing bed stratification was sought, given the substantial mass of particulate material (typically below 20 mm) required for each jig test, making manual grain-by-grain counting a time-consuming and tedious process. Lastly, a strategy was devised to minimize the slicing error mentioned earlier (Section 2.1), assumed to be proportional to the mass of material dragged during strata removal.
Therefore, it was decided to conduct jigging tests using density tracers mixed with a base bed of material with uniform characteristics (i.e., no significant variations in density, size, or shape). Subsequently, the analysis focused on determining the distribution of tracers with different densities over the stratified bed. Because there were fewer tracers than bed grains, this sped up the collection and evaluation of the stratification and reduced the error when removing the strata.
The density tracers used were made of polylactic acid (PLA) and produced using the fused deposition modeling (FDM) 3D printing method, as described by Warke and Puranik [32]. The tracers were spherical, with a diameter of 20 mm, and had the following specific masses: 0.4, 0.6, 0.8, 1.0, 1.2, 1.4, 1.6, 1.8, 2.0, 2.2, and 2.4 g/cm3. During manufacturing, the density of the tracers was adjusted by the thickness of the internal cavity for densities below 1.2 g/cm3 whereas, for densities above 1.2 g/cm3, it was also necessary to set the diameter of steel microspheres introduced into the internal cavity (Figure 4a) to ensure the desired density range and facilitate the magnetic recovery of the tracers (Table 1). This adjustment requirement limited the minimum diameter of the tracers to the adopted value of 20 mm. Each of the 11 specific masses comprised 20 spheres of different colors and embossed marking indicating the nominal density, totaling 220 density tracers (Figure 4b).
At first, polyethylene terephthalate (PET) particles with a diameter of 3 mm and a density of 1.4 g/cm3 were considered for the base bed. Indeed, the tracers were purposely manufactured for use with a PET bed base, justifying the chosen range of specific masses (0.4–2.4 g/cm3). However, exploratory tests revealed several issues with using PET as the base material. The main concern was the significant size disparity between the tracers and PET particles, causing most tracers to accumulate at the bottom of the bed, even those with very light densities (down to ρ = 0.8 g/cm3), thereby exacerbating the size influence on separation. Reducing the size influence on segregation in a PET bed proved challenging: constructing smaller tracers was not possible and acquiring or manufacturing tens of kilograms of PET with particle size closer to the tracers (20 mm) was unfeasible.
Further exploratory tests revealed that a gravel bed ( ρ = 2.89 g/cm3, measured using a helium pycnometer) in the range of −19 + 12.7 mm proved more suitable for the experiments. Firstly, segregation by size is minimized due to the coarser size of the gravel. Secondly, as gravel is denser than PET, there is a reduction in excessive concentration at the bottom layer observed in the latter case. The concentration of tracers at the bottom layer indicates inefficiencies in jigging, as gravel is denser than the tracers, with their concentration at the top of the bed being the expected trend in an ideal density-based stratification. Thus, all tests were conducted using approximately 60 kg of gravel in the range of −19 to +12.7 mm as the base bed, into which tracers were pre-mixed. The same mass of gravel was maintained in all trials to prevent variations in its particle size distribution and grain shapes.

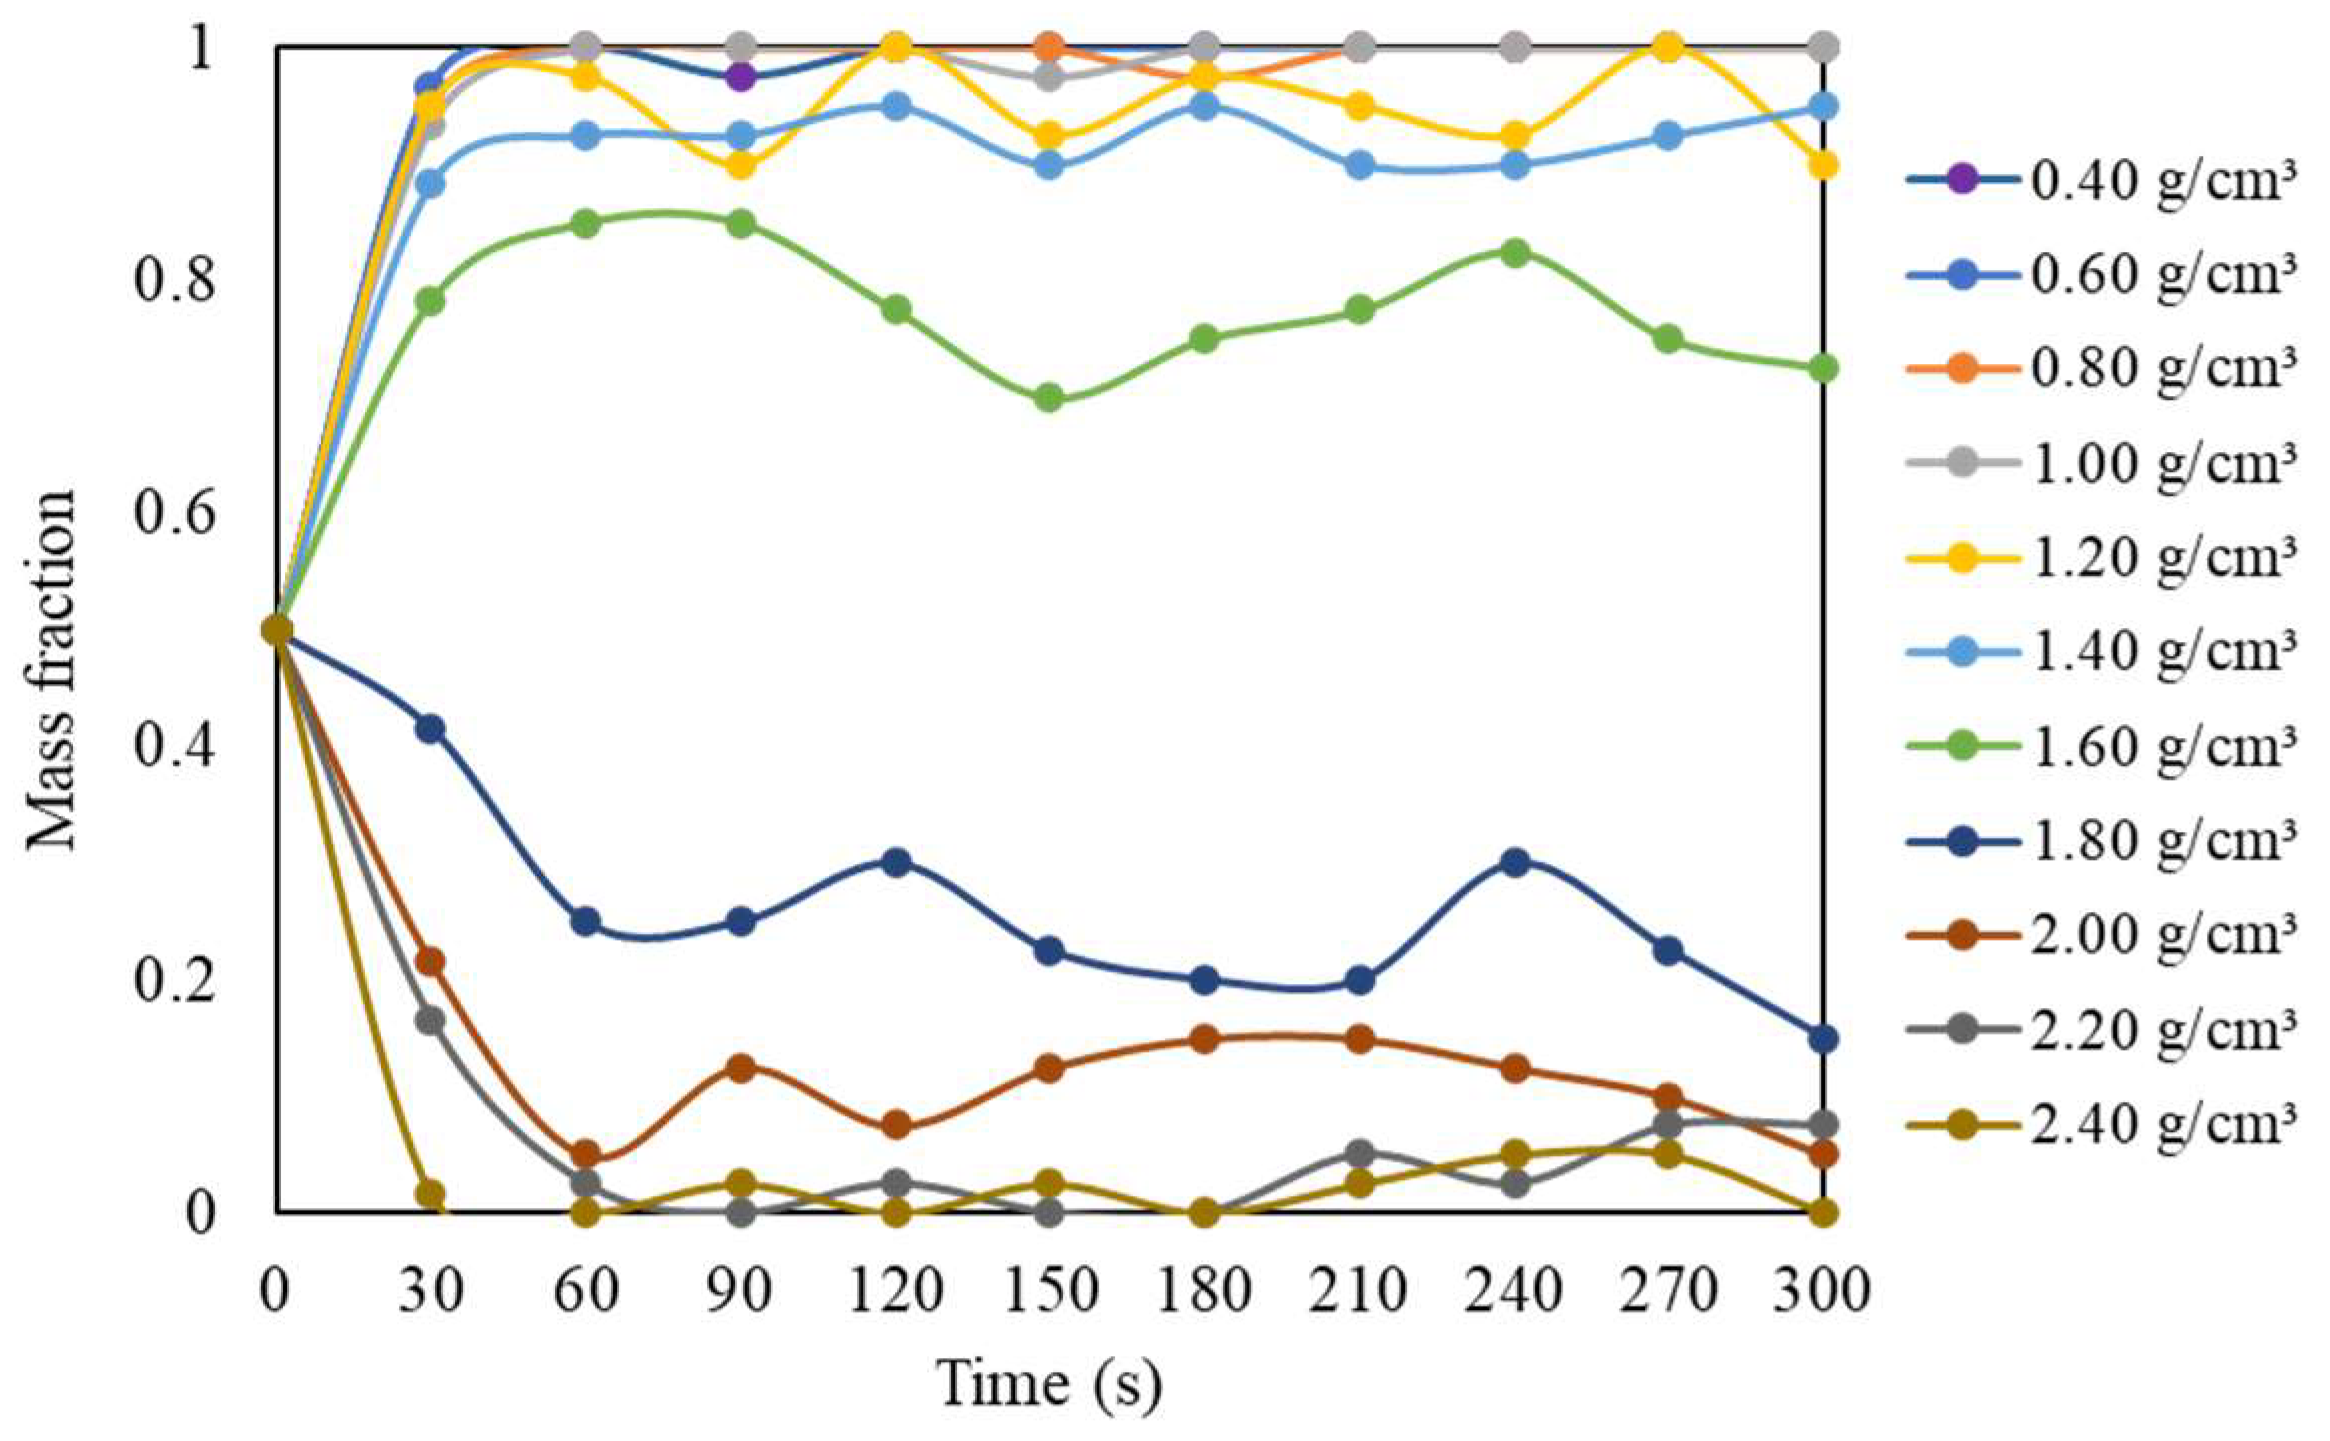
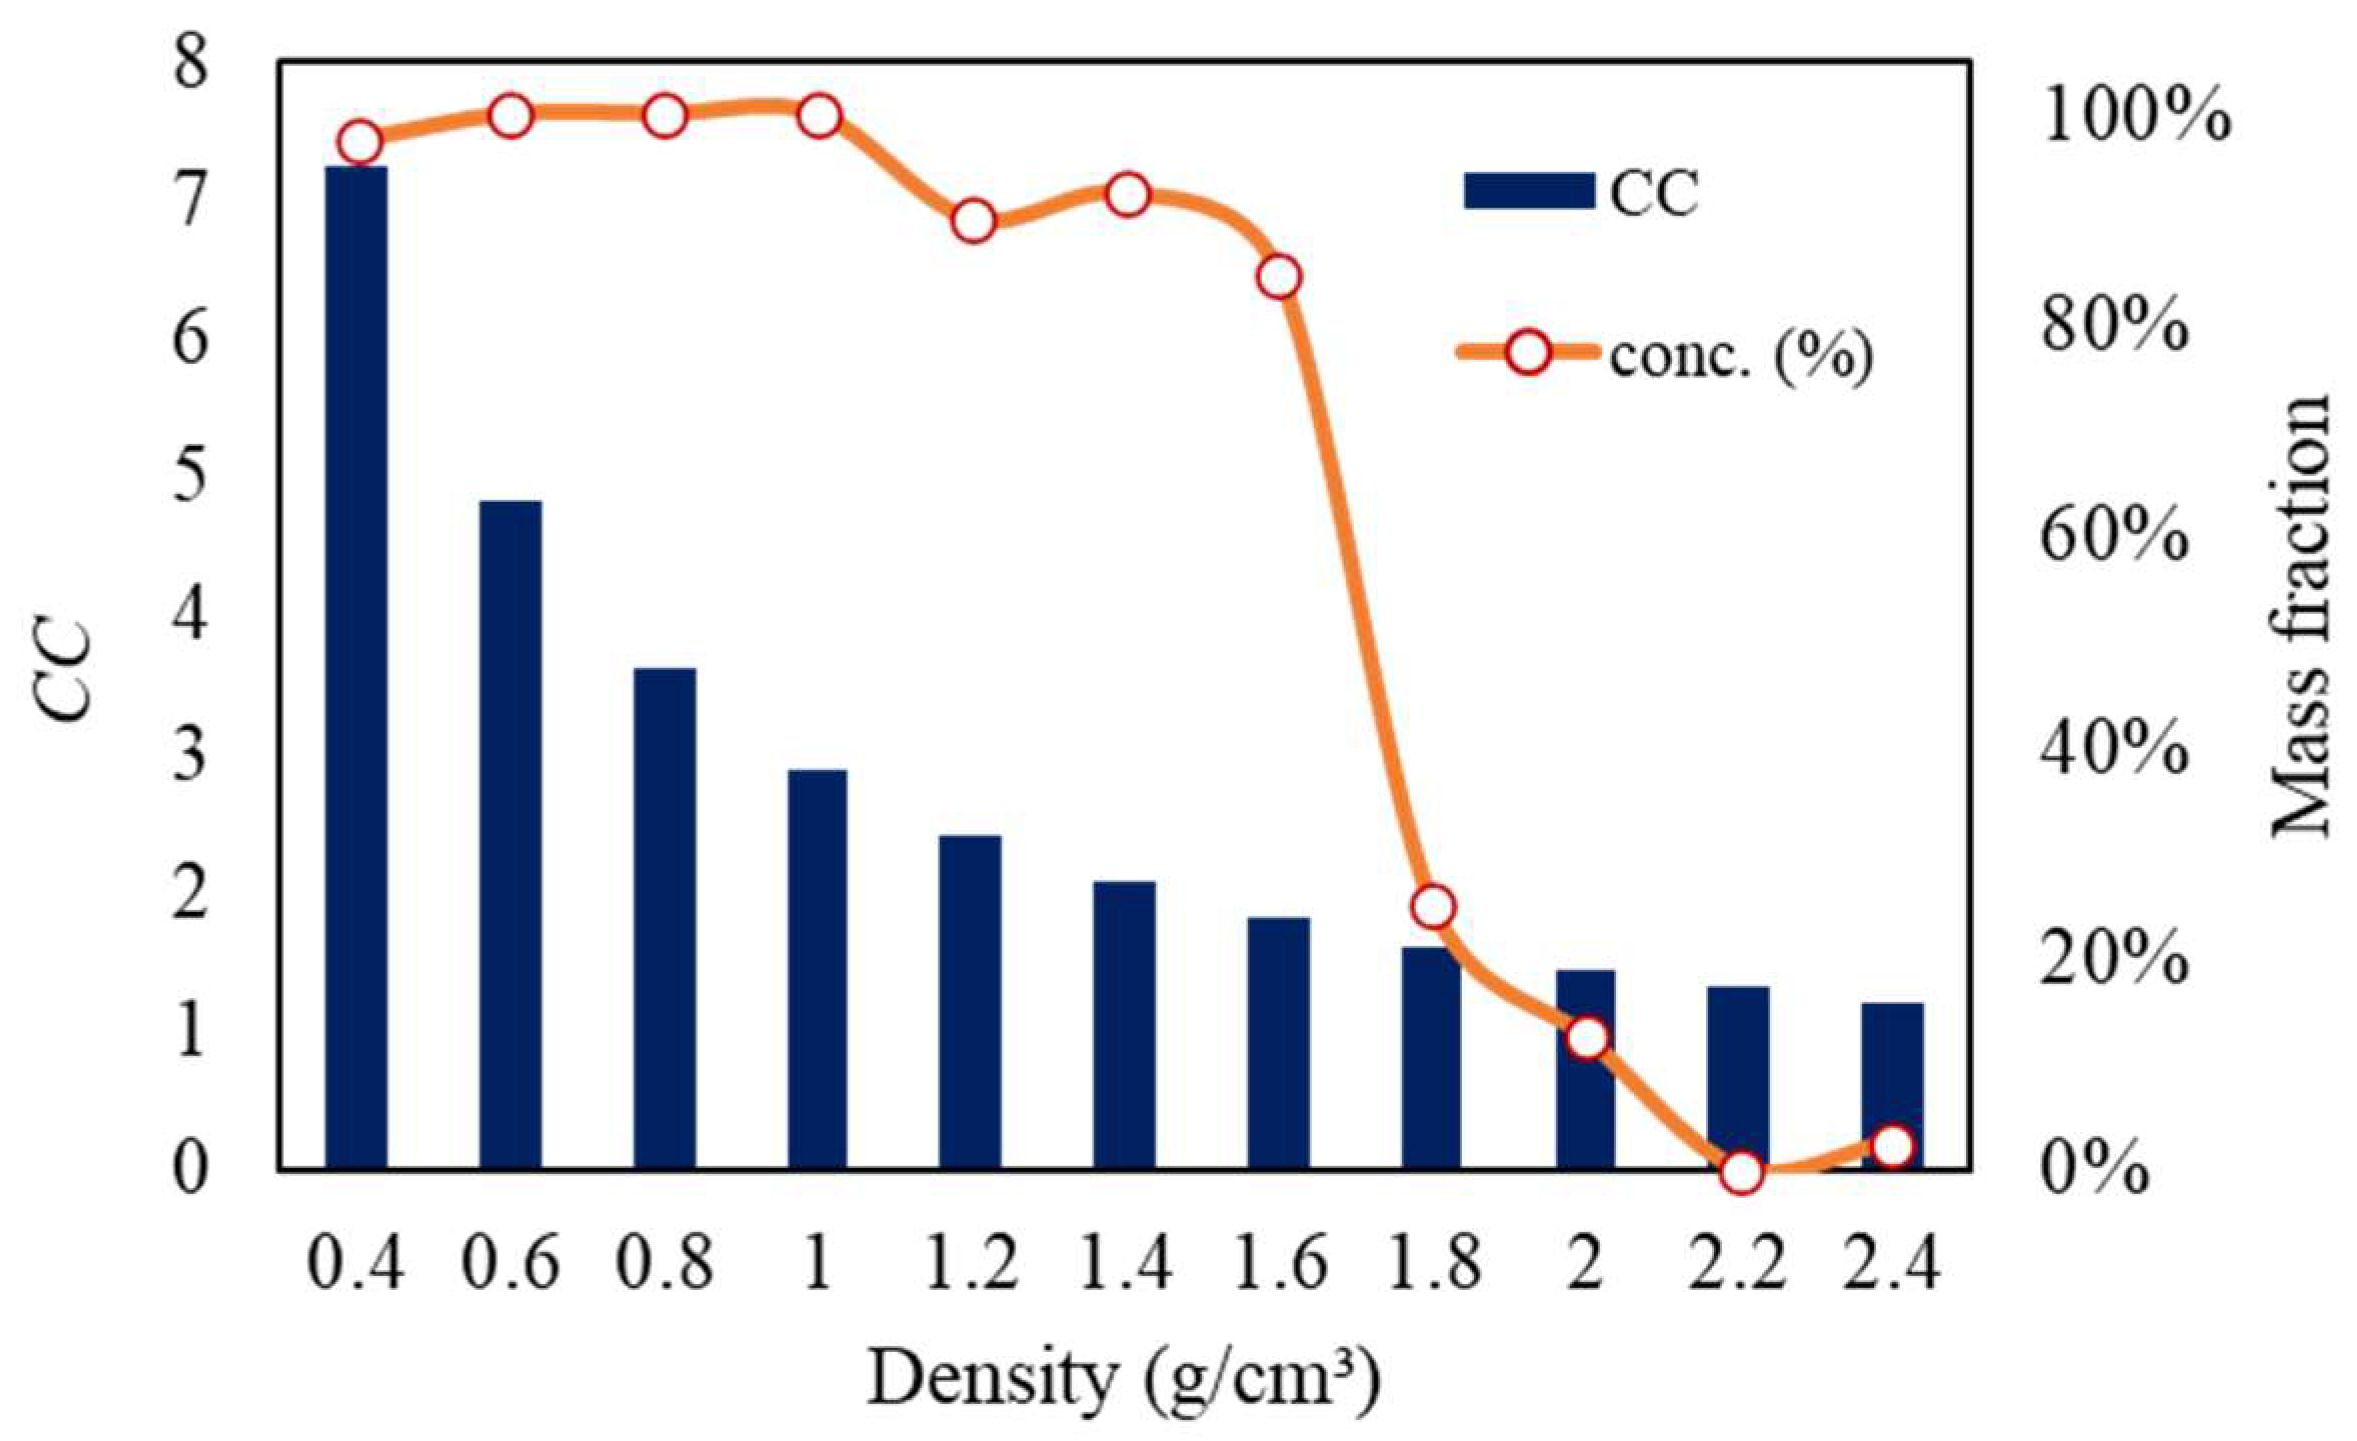
2.3. Stratification Analysis

All jigging tests were performed with a fixed bed thickness of 150 mm, corresponding to three container layers (50 mm each) filled. This thickness was chosen based on preliminary tests indicating that thicker beds result in low bed movement even under intense pulsation conditions (100% blower power). On the other hand, thinner thicknesses (e.g., 100 mm) would result in a thickness/top size ratio of only 5, which may not be sufficient to analyze the nuances of segregation differences under different operational conditions.
The product configuration was as follows: the upper layer was designated as the ’light product’ while the two lower layers were designated as the ’dense product’. This configuration is based on the fact that all tracers are less dense than the gravel base bed and should ideally be concentrated in the top layer after stratification. This naming convention is used throughout the text. After the jigging process, the light and dense products were collected separately, and the tracers present in each were collected and counted. The level of stratification was measured by analyzing how the tracers were distributed between the products, calculated according to the following:
P i = n p i , d e n s e N p i × 100 %
where P i is the partition coefficient, n p i , d e n s e is the number of tracers with specific mass ρ i collected in the dense product, and N p i is the total number of tracers with specific mass ρ i present in the bed. Plotting P i × ρ i illustrates the partition curve of the process, from which a parameter can be obtained as an indicator of jigging separation efficiency. This parameter is the mean probable error of separation [7,13]:
E p = ρ 75 ρ 25 2  
where ρ 75 and ρ 25 represent the densities corresponding to the 25% and 75% partitions, respectively. In addition to partition analysis, other indices were used for specific cases. For instance, in the analysis of stratification evolution over time, the variation in the distribution of tracers with different densities in different strata over the jigging time was also assessed.
All tests were conducted in duplicate, and the experimental error ( µ t ) between them was measured as the percentage difference:
µ t = Δ i t 20 = X i Y i t 20 × 100 %
where µ i is the percentage error for a test conducted at jigging time t and X i Y i is the absolute difference between the values measured in the first and second duplicate for a tracer of density i. The denominator value corresponds to the total number of tracers in each density.
The mean percentage error was utilized to assess the overall error for each tracer density at all the tested jigging times:
M P E i = 1 n t = t 1 n μ t  
where M P E i corresponds to the mean percentage error for each tracer of density i.

2.4. Stratification Evolution Analysis

Tests were carried out to analyze variations in the segregation profile of the bed over time under fixed pulsation conditions. To this end, jigging tests were conducted using a pulse frequency of 70 CPM (1.16 cycles per second) and a relative airflow rate of 95% (2.9 m3/s). These conditions were carefully selected after exploratory tests and proved to be suitable as they allowed for sufficient expansion of the bed during the pulse without causing excessive apparent turbulence. The tests were performed within a jigging time range of 30 to 300 s, with ∆t = 30 s (resulting in 10 jigging times). The minimum jigging time of 30 s was chosen based on specific considerations outlined in Section 3.1. The results were analyzed to assess the distribution of tracers in the light and dense products and to calculate partition indices for different jigging times.

2.5. Transient Pulsation Tests

The transient pulsation tests aimed to investigate if changing the pulsation conditions while the bed is rearranging itself could lead to better bed stratification (in this case, as the tracers distribute themselves to their equilibrium or near-equilibrium points along the gravel bed). The tests involved a series of experiments where the bed pulsation conditions, such as frequency or airflow rate, were systematically changed in either increasing or decreasing order. The experiments considered five jigging times: 60, 120, 180, 240, and 300 seconds. At each jigging time, four different transient pulsation conditions were assessed:
  • Increasing frequency pulses: the relative airflow rate was maintained at 95% (2.9 m3/s), while the bed pulsation frequency was varied in the range of 55 to 85 CPM at each quarter of the jigging time, at a rate of (85 – 55)/3 = +10 CPM.
  • Decreasing frequency pulses: the relative airflow rate was maintained at 95% (2.9 m3/s), while the bed pulsation frequency was varied in the range of 85 to 55 CPM at each quarter of the jigging time, at a rate of (55 – 85)/3 = −10 CPM.
  • Increasing amplitude pulses: the pulsation frequency was maintained at 70 CPM, while the relative airflow rate was varied in the range of 90% to 100% at each quarter of the jigging time, at a rate of (100 – 90)/3 = +3.3%.
  • Decreasing amplitude pulses: the pulsation frequency was maintained at 70 CPM, while the relative airflow rate was varied in the range of 100% to 90% at each quarter of the jigging time, at a rate of (90 − 100)/3 = −3.3%.
Table 2 exemplifies the adjustment in pulsation conditions for the test case with a jigging time of 60 s. The stratification profile under transient conditions was compared with those obtained under fixed pulsation conditions (i.e., no variation during jigging), where the frequency remained at 70 CPM and airflow rate at 95%.

3. Results

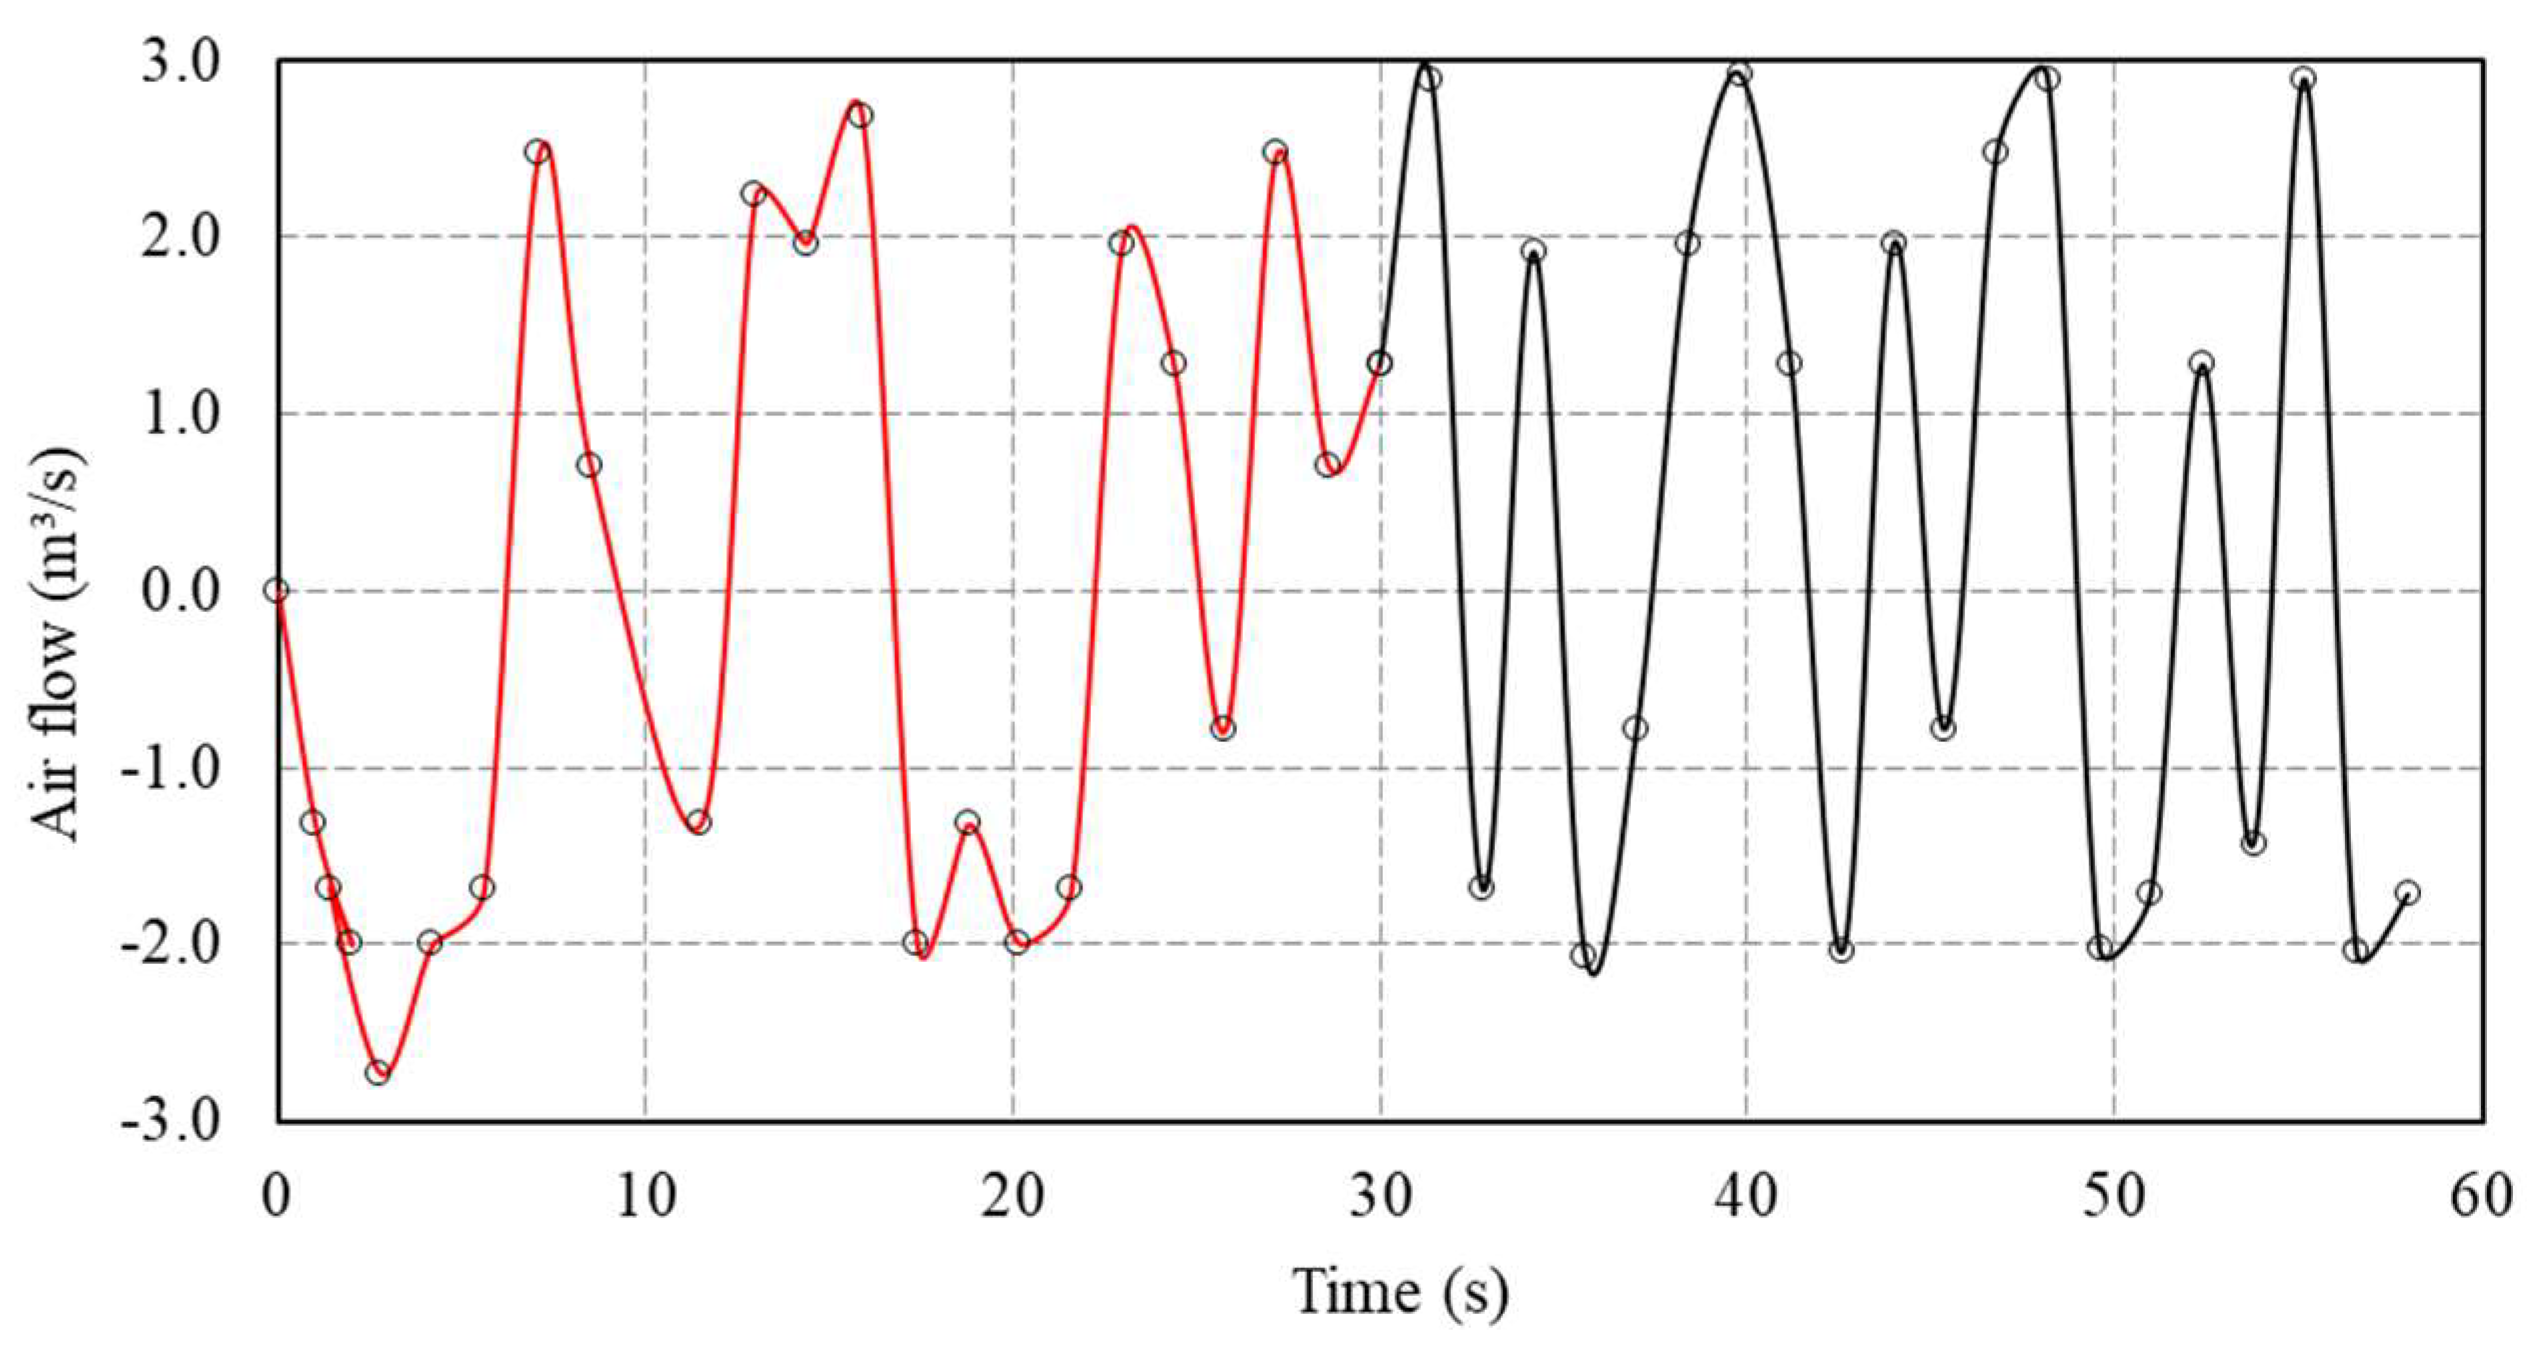
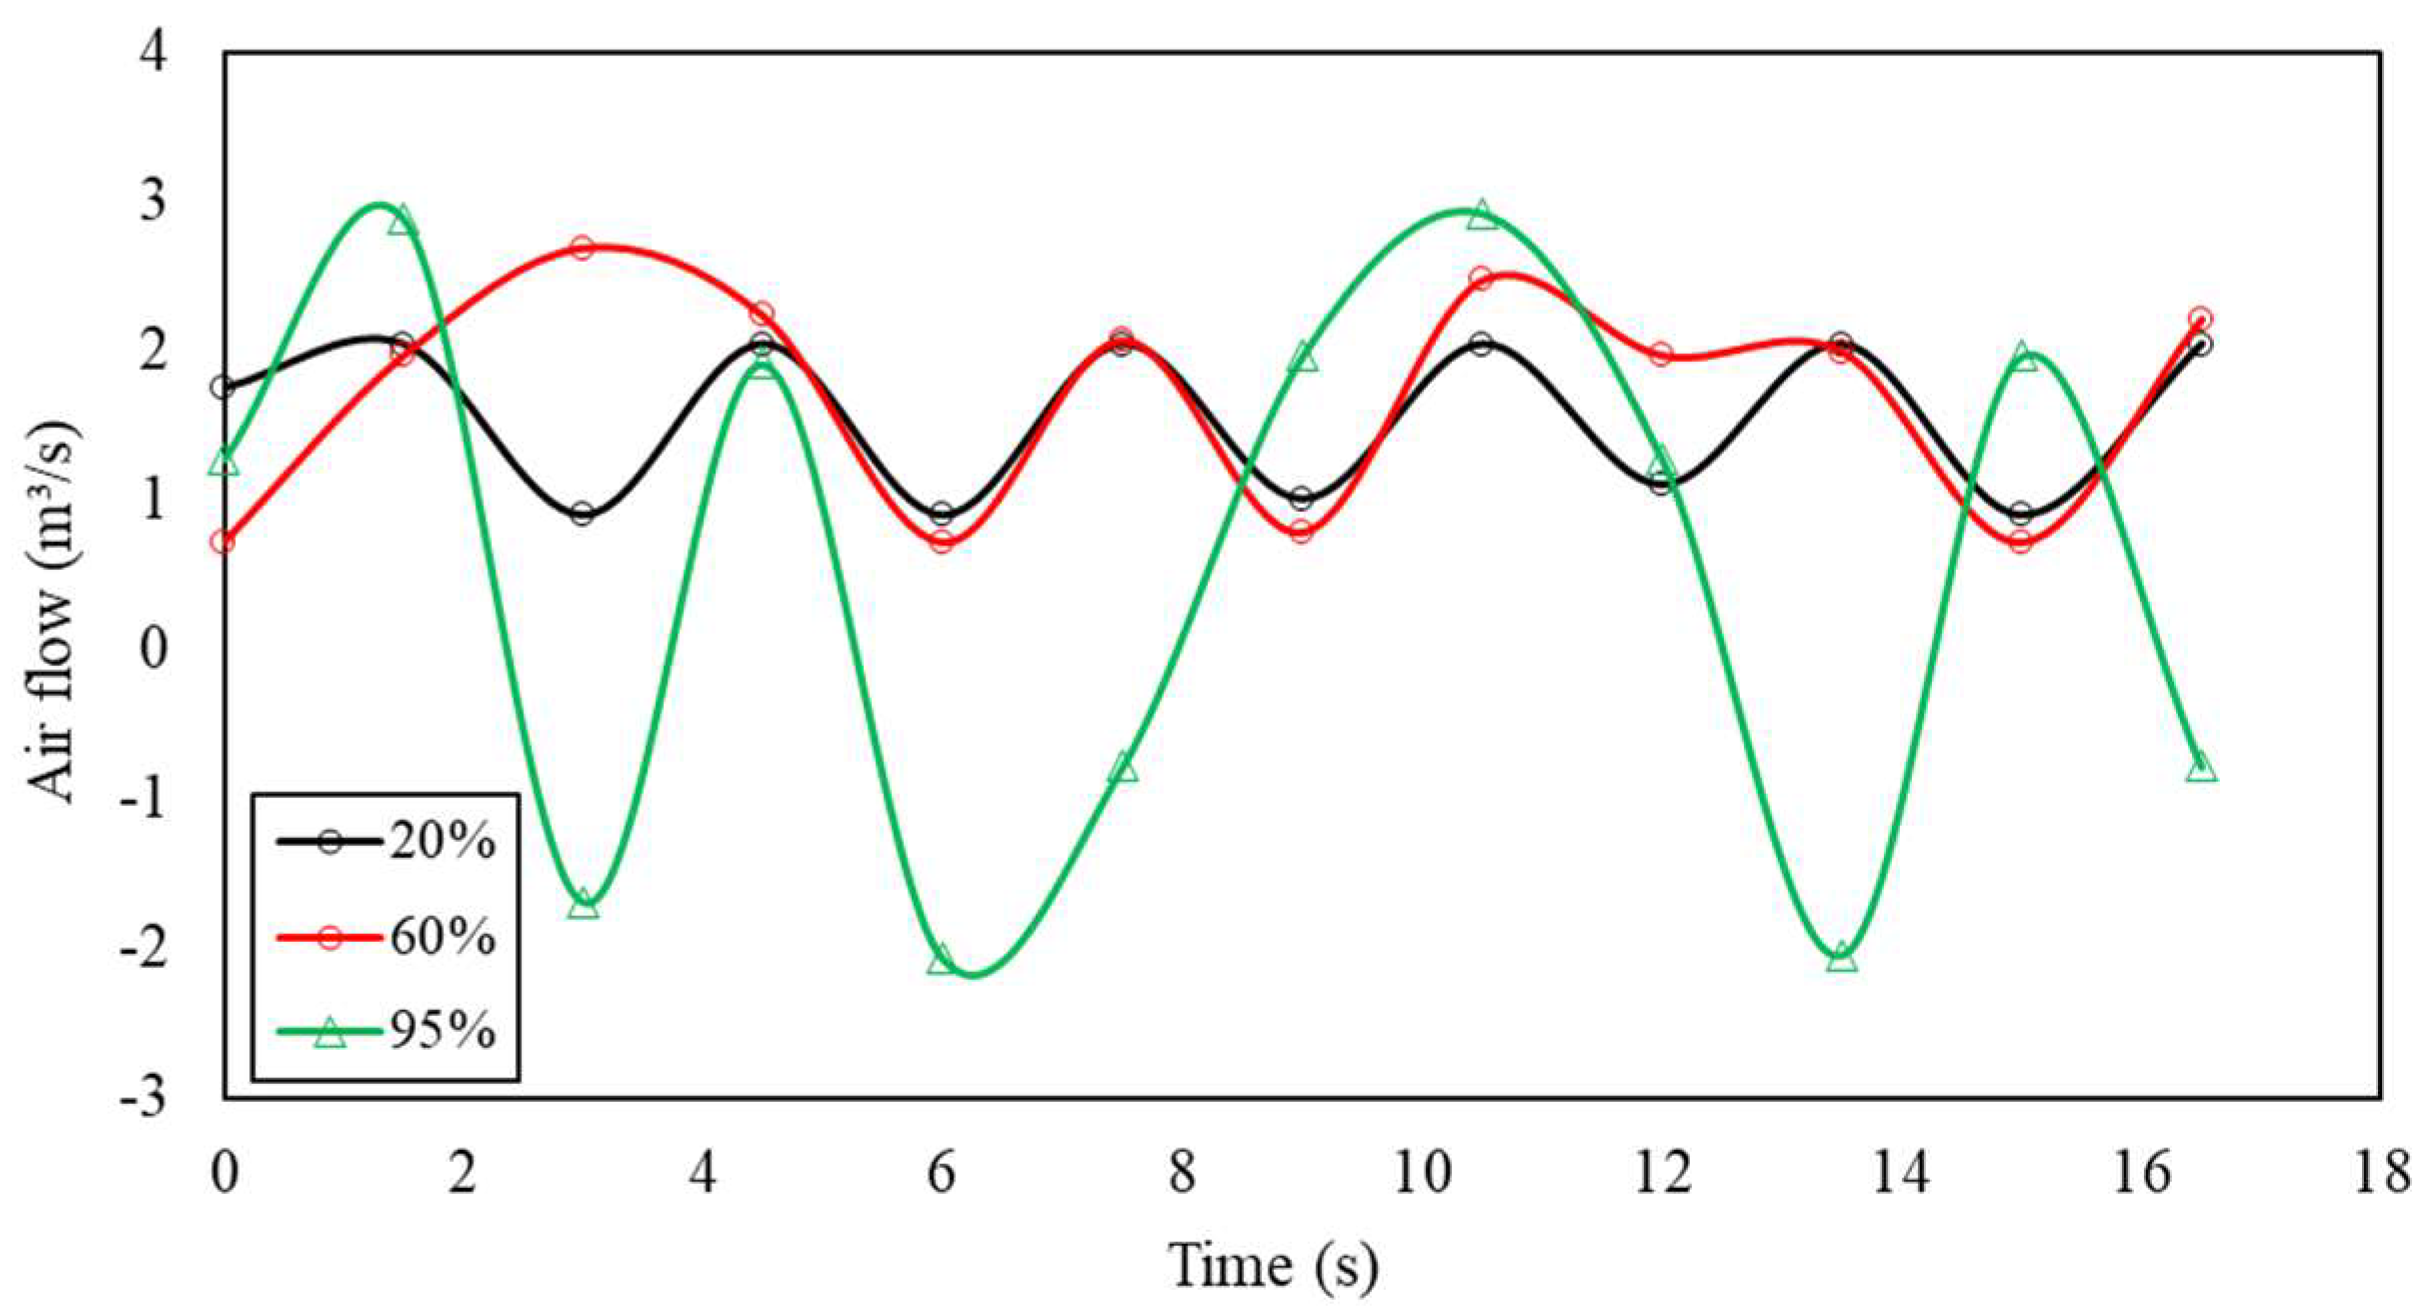
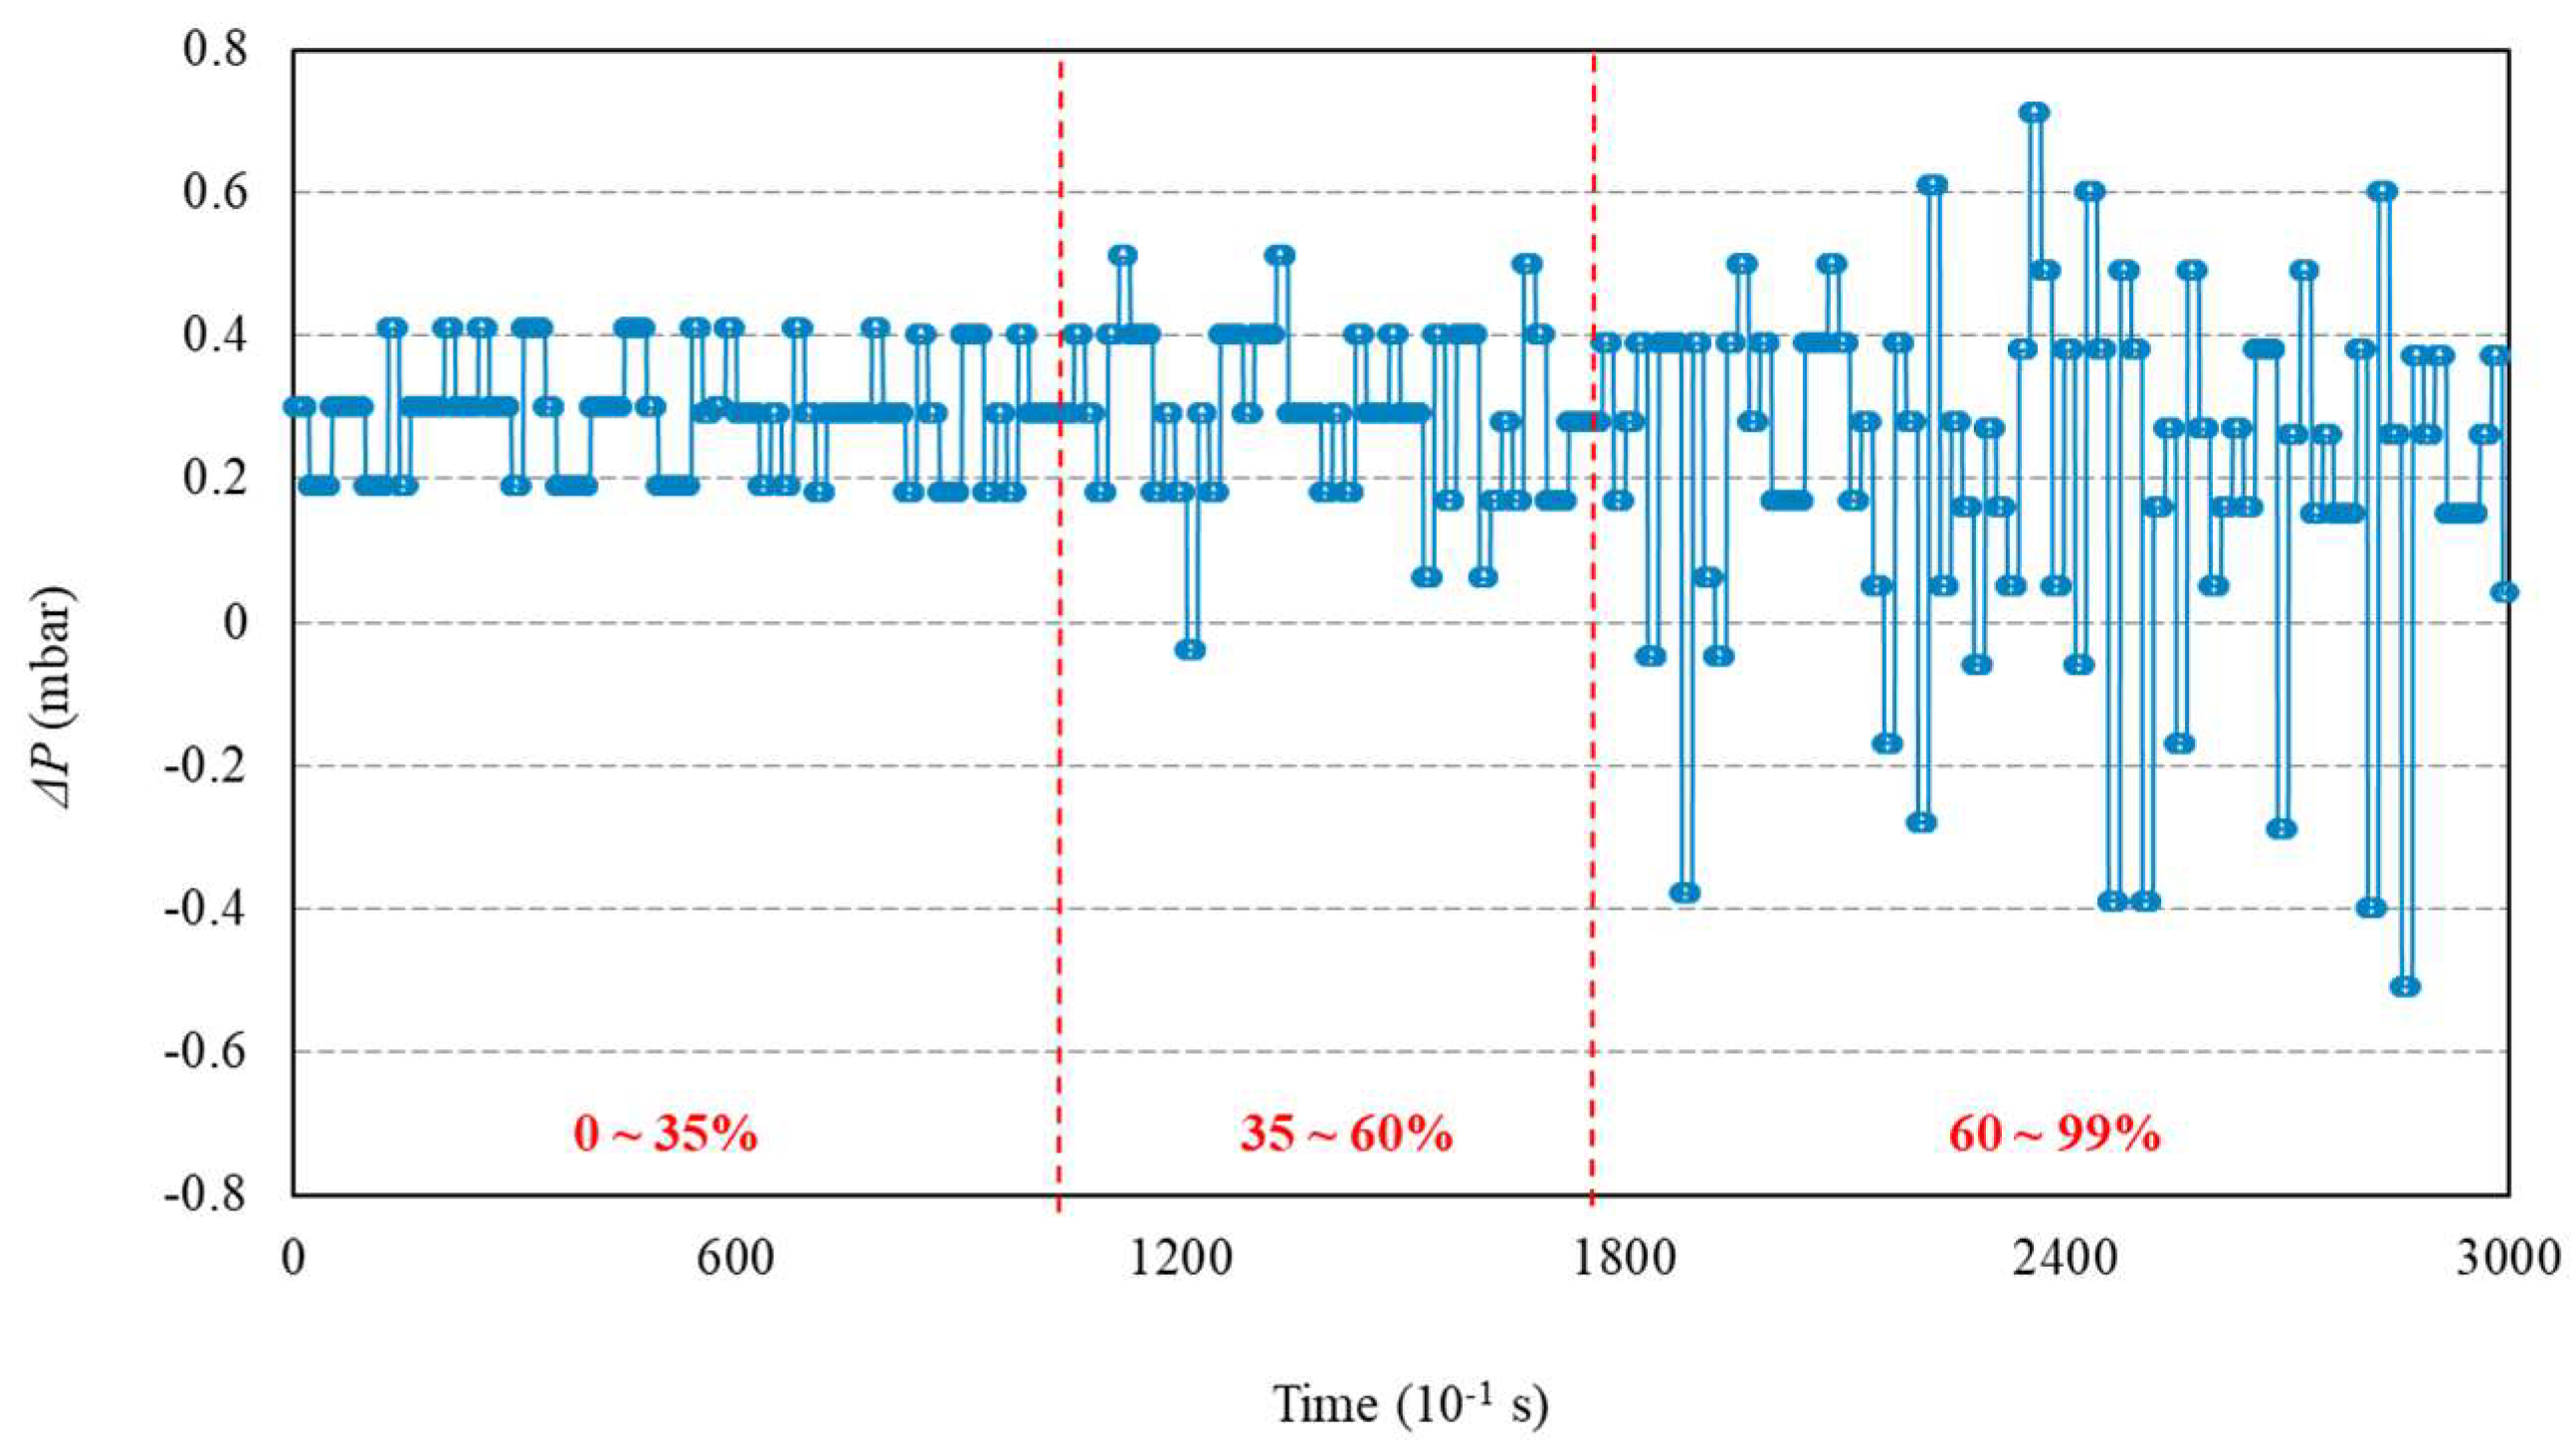
3.1. Air Pulse Characteristics

As mentioned in Section 2, the frequency of air pulses in dry jigs is regulated by the rotational frequency of a valve controlling the air intake into the jig container. However, it is important to note that the rotational frequency of the valve may not necessarily match the frequency of the bed pulsation. Unlike hydraulic jigs, where changes in water level can be directly linked with pulse amplitude, establishing this relationship is more challenging in dry jigging due to the lack of a distinct ’return’ phase for the air (which is present as a suction phase in hydraulic jigs). Additionally, the batch operation of the tested jig differs from industrial jigs, which operate continuously. Each test began with the jig turned off, so it took some time for the pulsation conditions to stabilize. However, stratification began early on, with minimal bed movement. Therefore, it was useful to define the time interval from which the pulsation could be considered to be stable or stationary.
Figure 5 depicts the variation in airflow (calculated as described in Section 2.1) over time for a fixed pulsation of 85 CPM (1.4 cycles per second) and a peak flow of 2.9 m3/s. It is evident that it takes approximately 30 s for the ∆P signal to stabilize. A ‘stable signal’ is defined to mean the repetition of peaks and valleys and the shape (signature) of the airflow profile over time. It can be observed that the pulse, represented by the red line, takes about 30 s to reach a steady flow rate and pulse frequency, as indicated by the black line. This implies that tests conducted in periods shorter than 30 s would not accurately represent the jigging conditions defined in the equipment control panel.
For this reason, all segregation tests on the jig were conducted with a minimum time of 30 s. Figure 5 also illustrates negative airflow values, which are possibly related to the pressure wave generated by the sudden change in air velocity during the moments of closure of the butterfly valve regulating the pulse. This evidence suggests the existence of a phenomenon equivalent to suction on the bed during certain moments of the jigging cycle. While the peak airflow of the pulse was 2.9 m3/s, negative airflows (opposite to the pulse direction) reached peaks of up to 2 m3/s (about 70% of the magnitude of the pulse peaks). After stabilization (t > 30 s), two alternating peaks in pulse flow emerge: one of higher intensity (≈3 m3/s) and another of lower intensity (≈2 m3/s or lower). This behavior is unexpected beforehand given the butterfly-type valve controlling the jig pulse, ideally resulting in repeated peaks of similar intensity.
To examine whether the observed pattern persisted across various pulsation conditions, we compared airflow curves for different blower power used, as depicted in Figure 6. Notably, at lower airflow rates (20% blower power), the curve displayed a well-defined and harmonious pattern over time, characterized by distinct yet similar peaks and valleys. Additionally, it exhibited a consistent wave period and frequency of 3 s and 0.33 Hz (≈20 CPM, closely aligned with the value specified in the control panel), respectively. However, at significantly higher airflow rates (60% and 95% blower power), the airflow profile becomes erratic, displaying peaks and valleys of varying magnitudes, including notably negative ones. The wave period and frequency also fluctuate and do not align with the rotation of the butterfly valve displayed by the jig panel.
At least two factors may be related to the described discrepancy: (1) the valve rotation does not correspond to that indicated on the panel; (2) as the airflow increases, the momentary trapping of air during the fraction of seconds that the valve remains closed generates an increasing “pressure blow”, causing a sudden increase in impulsion (and suction) that leads to a mismatch between the pulse frequency and the valve rotation frequency. Since the frequencies of ∆P and the valve were in sync at low airflow rates, it is reasonable to assume that the first hypothesis does not apply.
Evaluating the variations in ∆P across the entire spectrum of jig airflow rates, as shown in Figure 7, can be a way to assess the significance of the second hypothesis. It is noted that the ∆P signal showed three distinct phases:
  • Initially, there was a period of apparent stability, ranging from 0 to 35% of blower power.
  • This was followed by an onset of instabilities in the range of 35 to 60%, characterized by discordant peaks of ∆P.
  • Finally, there were curves showing variable ∆P peaks, indicating a high level of pulse instability as it approached maximum fan power.
In summary, the findings suggest that establishing the jigging cycle, particularly in dry jigging, entails factors as intricate as or possibly more intricate than those in traditional hydraulic jigging. Given that air is a compressible medium (unlike water), it experiences notable pressure fluctuations during the process, notably due to compression and suction during valve closure, which marks the cycle reversal. With air compression dependent on valve closure duration, it suggests that airflow and pulsation frequency are inter-related, as shown by the data in Figure 6.

3.2. Energy Consumption

Dry jigs comprise two key energy-consuming components: the rotary valve and the air blower. Additionally, the jigging system may feature a fan for dust channeling, where the dust is to be collected in bag filters or deposited in electrostatic precipitators. The batch jig used in the tests is equipped with a suction system and dust collection via bag filters.
Given their capacity for high tonnages and their application at the beginning of the mineral processing chain, particularly in typical coarse mineral pre-concentration operations, dry jigs may require a significant amount of energy. As highlighted in the study by Coelho and de Brito [30], dry jigs can incur the highest energy costs in simple processing plants, such as those handling construction and demolition waste. Thus, a more comprehensive investigation into the energy consumption profile of this operation is warranted.
Figure 8 shows the relationship between the blower airflow and the power used. There is a nearly linear increase in energy consumption as the blower flow rate increases, with peak consumption reaching around 400 Wh. It is important to note that this curve only considers the power associated with the air blower. For the operation of the rotary valve of the jig, the average useful power demanded across the entire operational range (10 to 400 CPM) is 54.74 ± 5.41 Wh. The slight variation in consumption with rotation is because most of the power is used to drive the valve. The dust collection system, particularly the fan generating suction in the duct, showed a fixed consumption of 40 Wh.
For the pulsation conditions used in the tests, the overall energy consumption measured in the jig was 496.82 Wh. With the total weight of the gravel bed plus tracers totaling 46.6 kg of material, the specific energy consumption was 10.66 Wh/kg of jigged material. Thus, if 30 tons/h of construction and demolition waste was processed in a dry jig, as described by Coelho and de Brito [30], the required energy would be 319.8 kW, approximately 12% higher than that indicated by the authors (282.5 kWh/jig). The higher consumption detected in this study may result from the characteristics of the local electrical installations. In this regard, it is important to note that the reactive power of the electrical grid is not being accounted for.

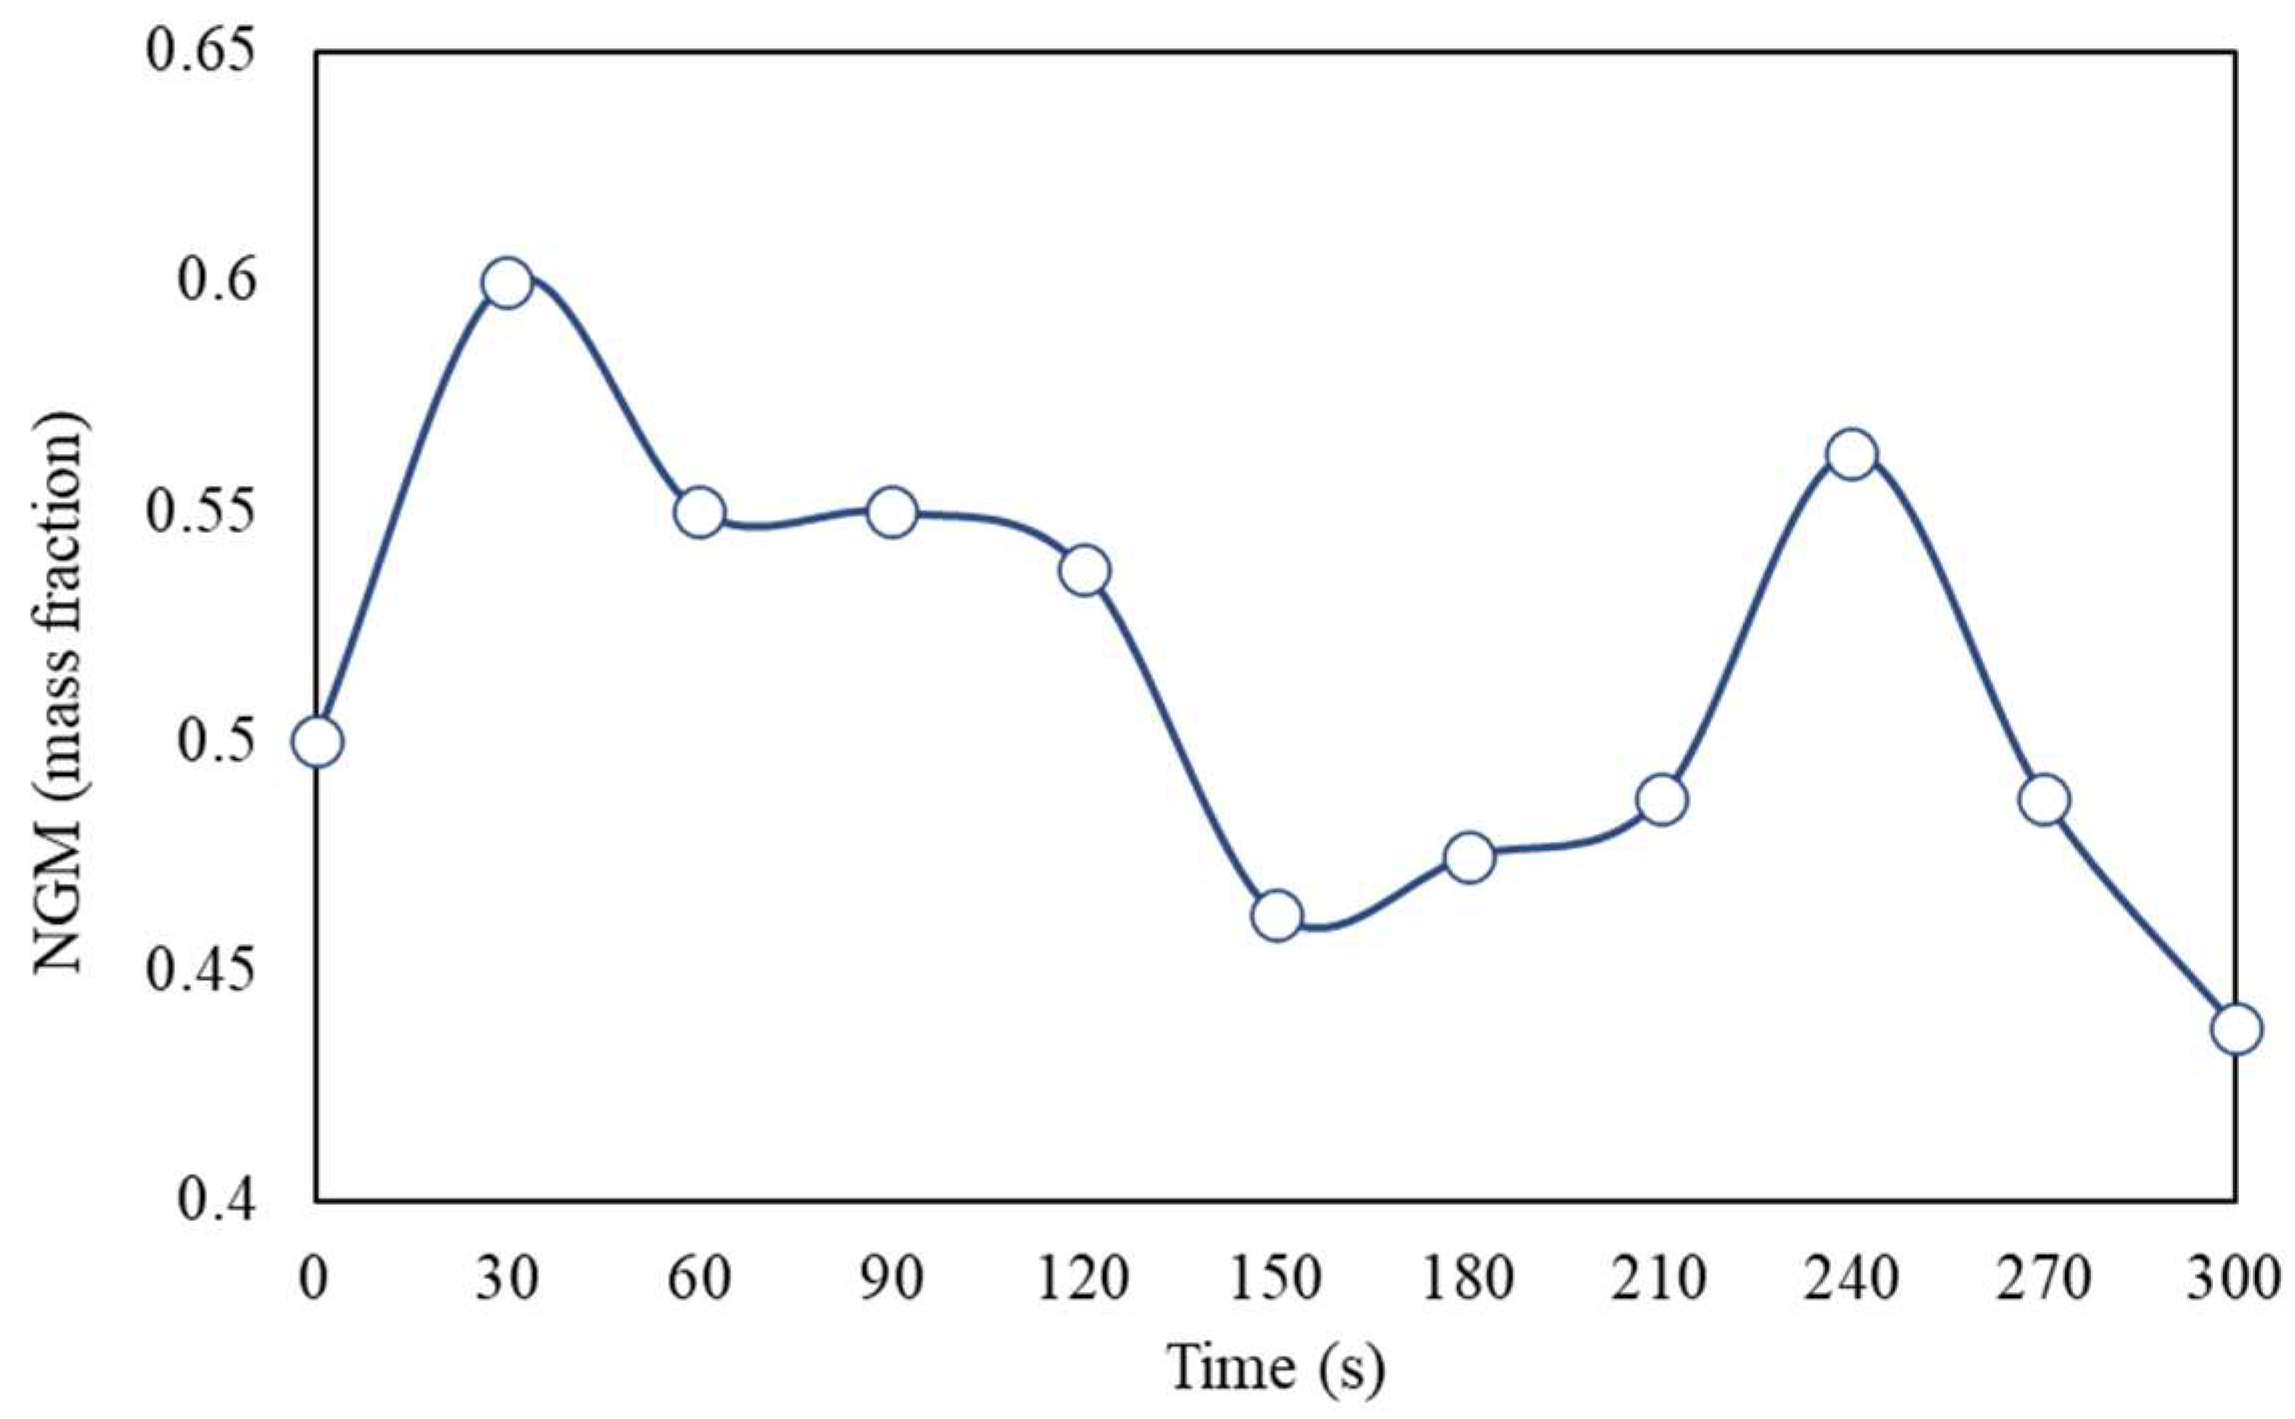
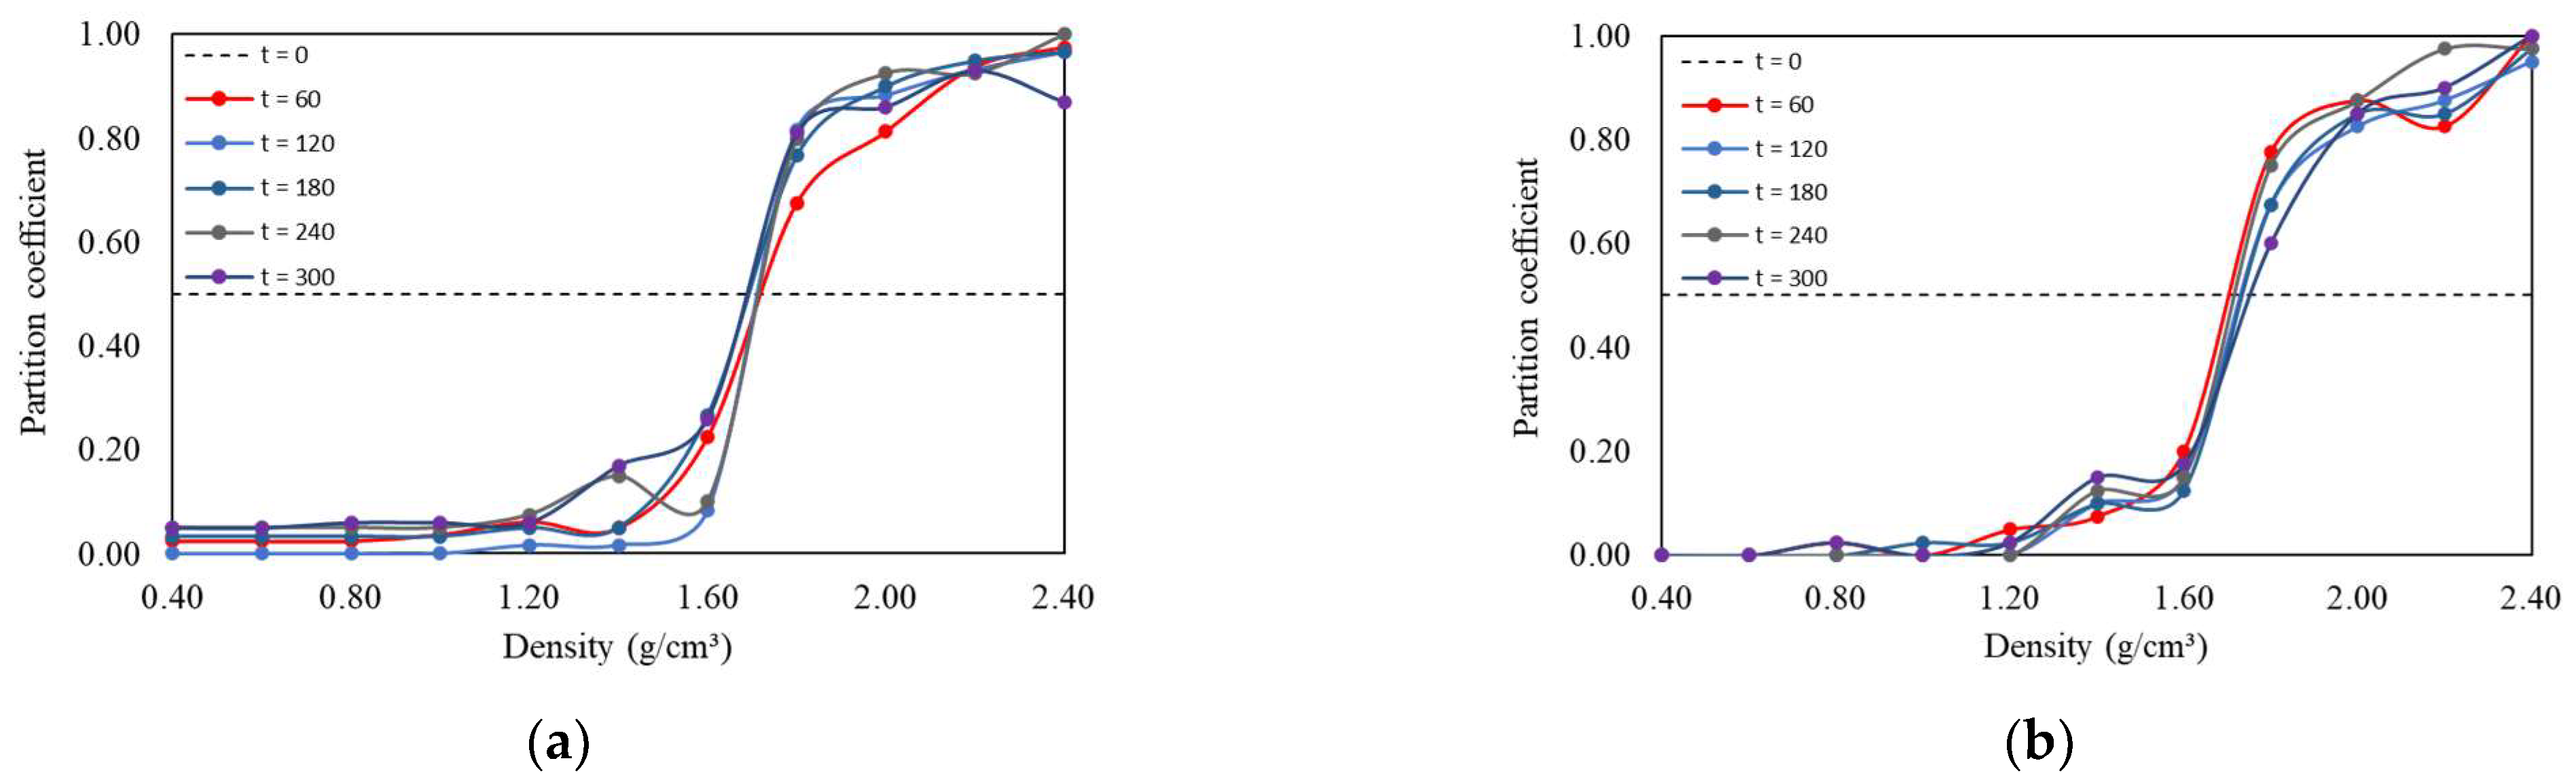
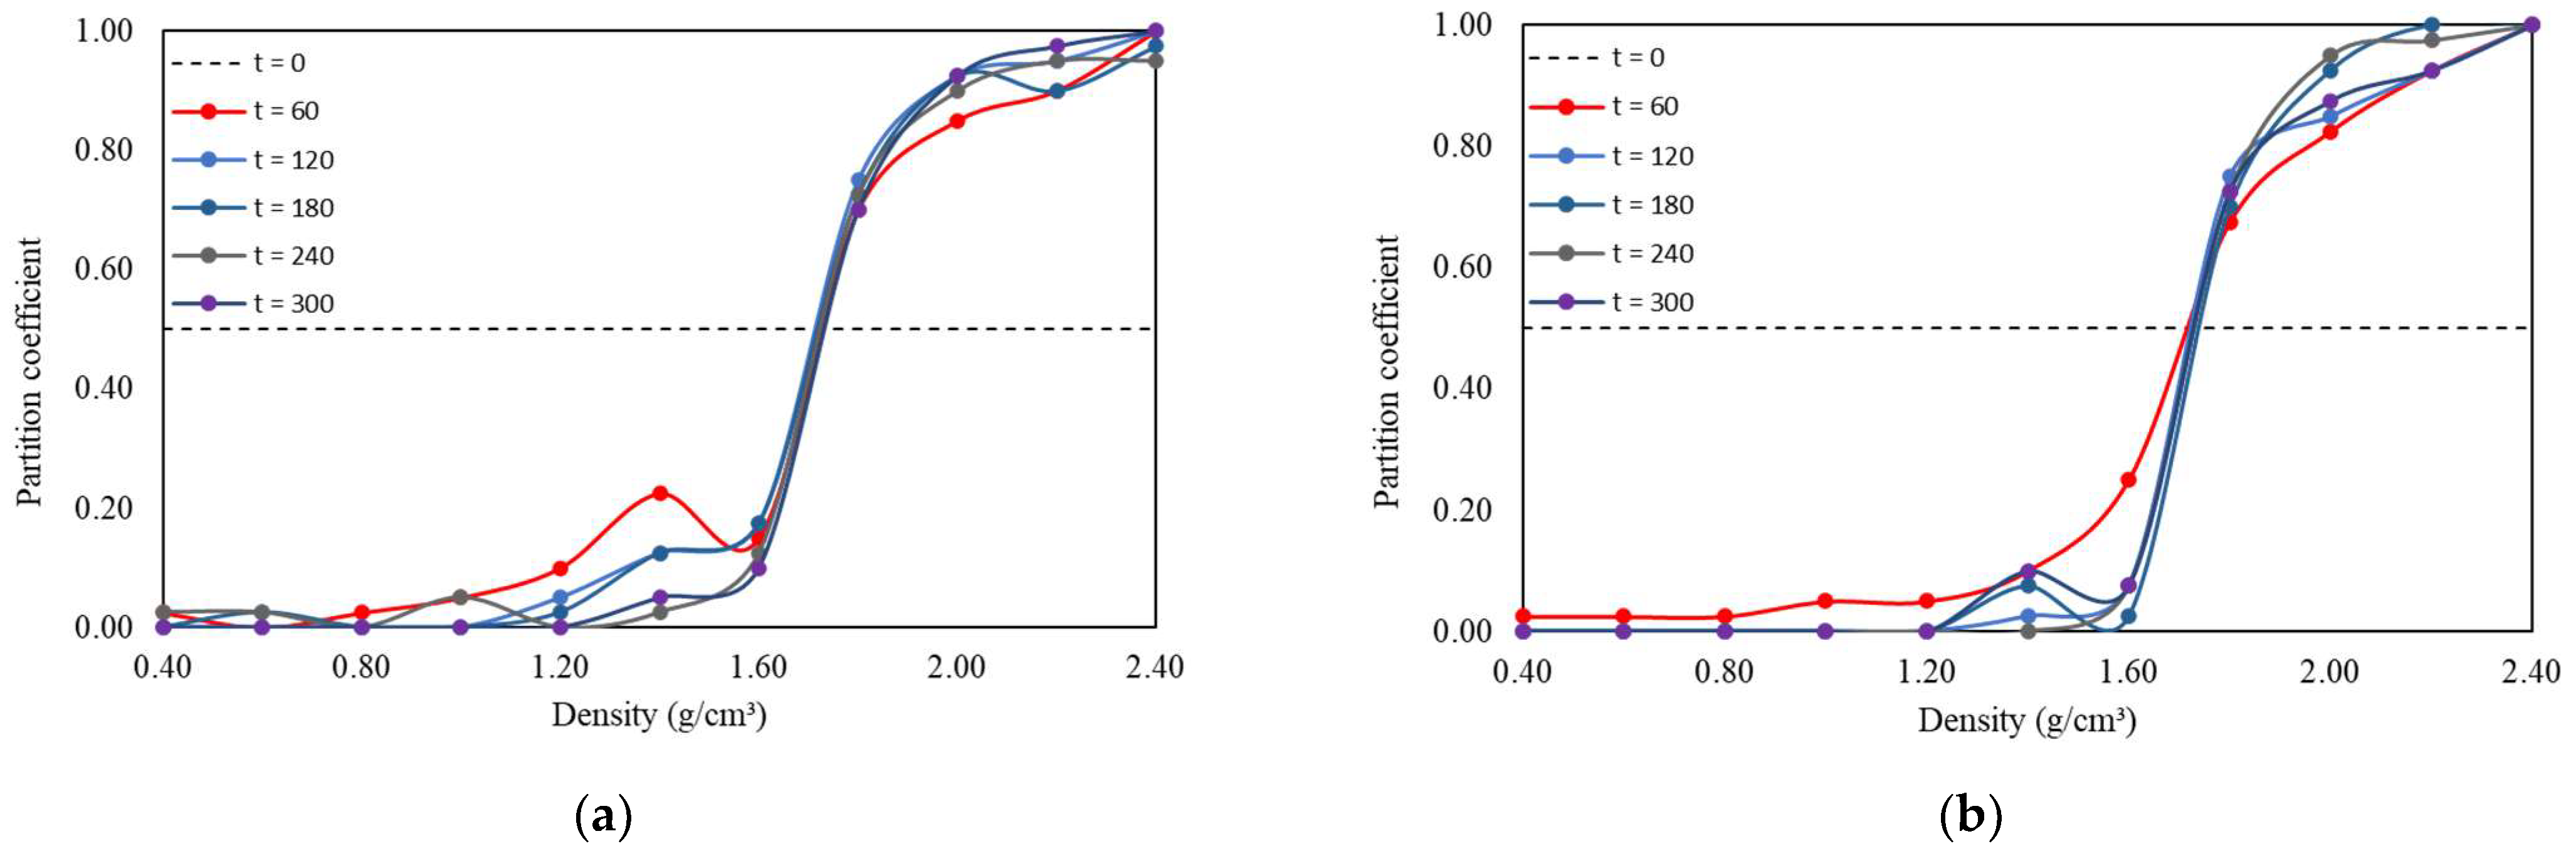
3.3. Stratification Evolution over Time

Jigging tests were conducted under the conditions described in Section 2.4 for jigging times of 30, 60, 90, 120, 150, 180, 210, 240, 270, and 300 s. The pulsation conditions were kept constant at 70 CPM, with an airflow peak of 2.9 m3/s (corresponding to 95% of the maximum fan flow rate). Figure 9 and Table 3 show the joint partition curves and the resulting separation efficiency indices, respectively.
The results generally indicated a non-asymptotic behavior of stratification in pneumatic jigs; that is, the stratification does not appear to evolve toward a defined equilibrium, with a stable distribution of tracers along the stratified bed, but rather to continuously vary with time due to the possible remixing of previously segregated tracers.
Except for t = 30 s, the partition curves appear overlapped within the range of calculation of the mean probable error (between ρ 25 and ρ 75 ). On the other hand, there is a significant variation in the partition profiles for the higher density ranges (> ρ 75 ), an issue that will be discussed further.
From 60 s onwards, an oscillatory behavior in the values of Ep can be observed, sometimes decreasing and sometimes increasing at each interval of +60 s. For the times of 60 and 90 s, Ep = 0.08, rising in the next two time steps, returning to a level of Ep < 0.1 after that, and finally increasing again for t = 270 and 300 s.
The results emphasize that remixing is a common occurrence in dry jigging, leading to its typically low stratification efficiency. This is likely due to the need for high air pulse velocities, as air has a significantly lower density compared to water. Because of the specific characteristics of air, the remixing effect is more prominent in dry jigging, making it challenging to reach a stable final state of equilibrium even with extended jigging times. Additionally, there are noticeable changes in partitioning every 60 s, reinforcing that this might be an inherent aspect of the dry jigging process.
The value of Ep = 0.1 is emblematic because, according to Sampaio and Tavares [13], it distinguishes high-performance gravity concentration equipment (dense media cyclones, centrifugal separators, etc., where Ep < 0.1) from lower-performance ones (autogenous separators, some jigs, etc., where Ep > 0.1). Thus, the oscillatory behavior demonstrated by the partition over time can be roughly approximated as an alternation between states of high and low separation performance in the jig.
The results, to some extent, differ from those observed for conventional hydraulic jigs. Woollacott et al. [33,34], for example, noted an independence of stratification from jigging time or, more specifically, that an equilibrium stratification profile would be established as soon as the jigging time was sufficient. In the present case, the stratification profile indicated by the partition data varies even with long dry jigging times.
The pattern observed in the partition analysis can be better visualized by considering the distribution of tracers in the stratified bed (Figure 10). A general trend of rapid concentration of lighter tracers in the light product can be noticed, while denser tracers show a decrease in their concentration, indicating their transfer to the dense product zone. Three distinct behaviors can be observed: lighter tracers (<1.4 g/cm3), which are rapidly concentrated in the light product of the jig; denser tracers (>2 g/cm3), which are concentrated in the dense product; and tracers with intermediate densities (=1.6 and 1.8 g/cm3), which exhibit a more pronounced oscillatory behavior regarding concentration over time.
As previously described in Table 3, the values of ρ 50 (separation density) remained very close, averaging 1.71 g/cm3 (±1.34% standard deviation). The tracers that showed a more oscillating concentration over time were precisely those found in the near-gravity material (NGM) range, that is, at densities distant by ±0.1 g/cm3 from the separation density [7].
In Figure 11, an interesting behavior of the NGM can be observed. At certain intervals, peaks of variation in the NGM concentration of up to 10% are noticeable every 60 s (between 30–90 s, 90–150 s, and 180–240 s). This behavior suggests that tracers in this density range do not find stable positions as the bed stratifies but remain in constant motion as the bed pulses, sometimes rising and concentrating in upper portions (light product) or descending and penetrating the lower portion of the bed (dense product, which includes two out of three layers of the bed).
Another way to interpret the distribution of tracers in the stratified bed is presented in Figure 12. Here, it is noticeable that the trend of concentration in the light product is proportional to the concentration criterion, calculated for separation in the air in the Newton regime, according to Equation (1), and for the case of ρ d e n s e = 2.89 g/cm3 (density of the gravel). It can be observed that, for CC values greater than or equal to 3, when the density is in the range of −1 g/cm3, the separation is almost complete. However, when CC is less than 1, and the density is in the range of +2 g/cm3, the separation is almost negligible. Within these limits, the density range of 1.2–1.8 g/cm3 shows a progressive decrease in concentration in the light fraction as the CC value decreases. The analysis of CC values confirms that even small differences in size and shape between tracers and the bed can significantly influence segregation, especially when the tracers’ density approaches the density of the bed (particularly for CC < 1).
As indicated in Section 2.3, all tests were performed in duplicate in order to estimate the experimental deviation of the data as well as to verify how this varied for each tracer and each jigging time. In Figure 13, the average percentage error (calculated using Equation (7) for each tracer across all jigging times is displayed. It is evident that the error stayed below 5% for tracers with the lowest (1.40 g/cm3 or less) and highest (2.20 g/cm3 or more) densities. However, there is a peak of around 14% between densities of 1.60 and 1.80 g/cm3, which matches the ρ 50 and NGM range measured in the tests. Since this density range is expected to be more challenging to separate, it is reasonable to infer that the higher difference between the duplicate measurements for tracers in the NGM range is linked to a greater occurrence of short circuits (cross-contamination between light and dense zones).

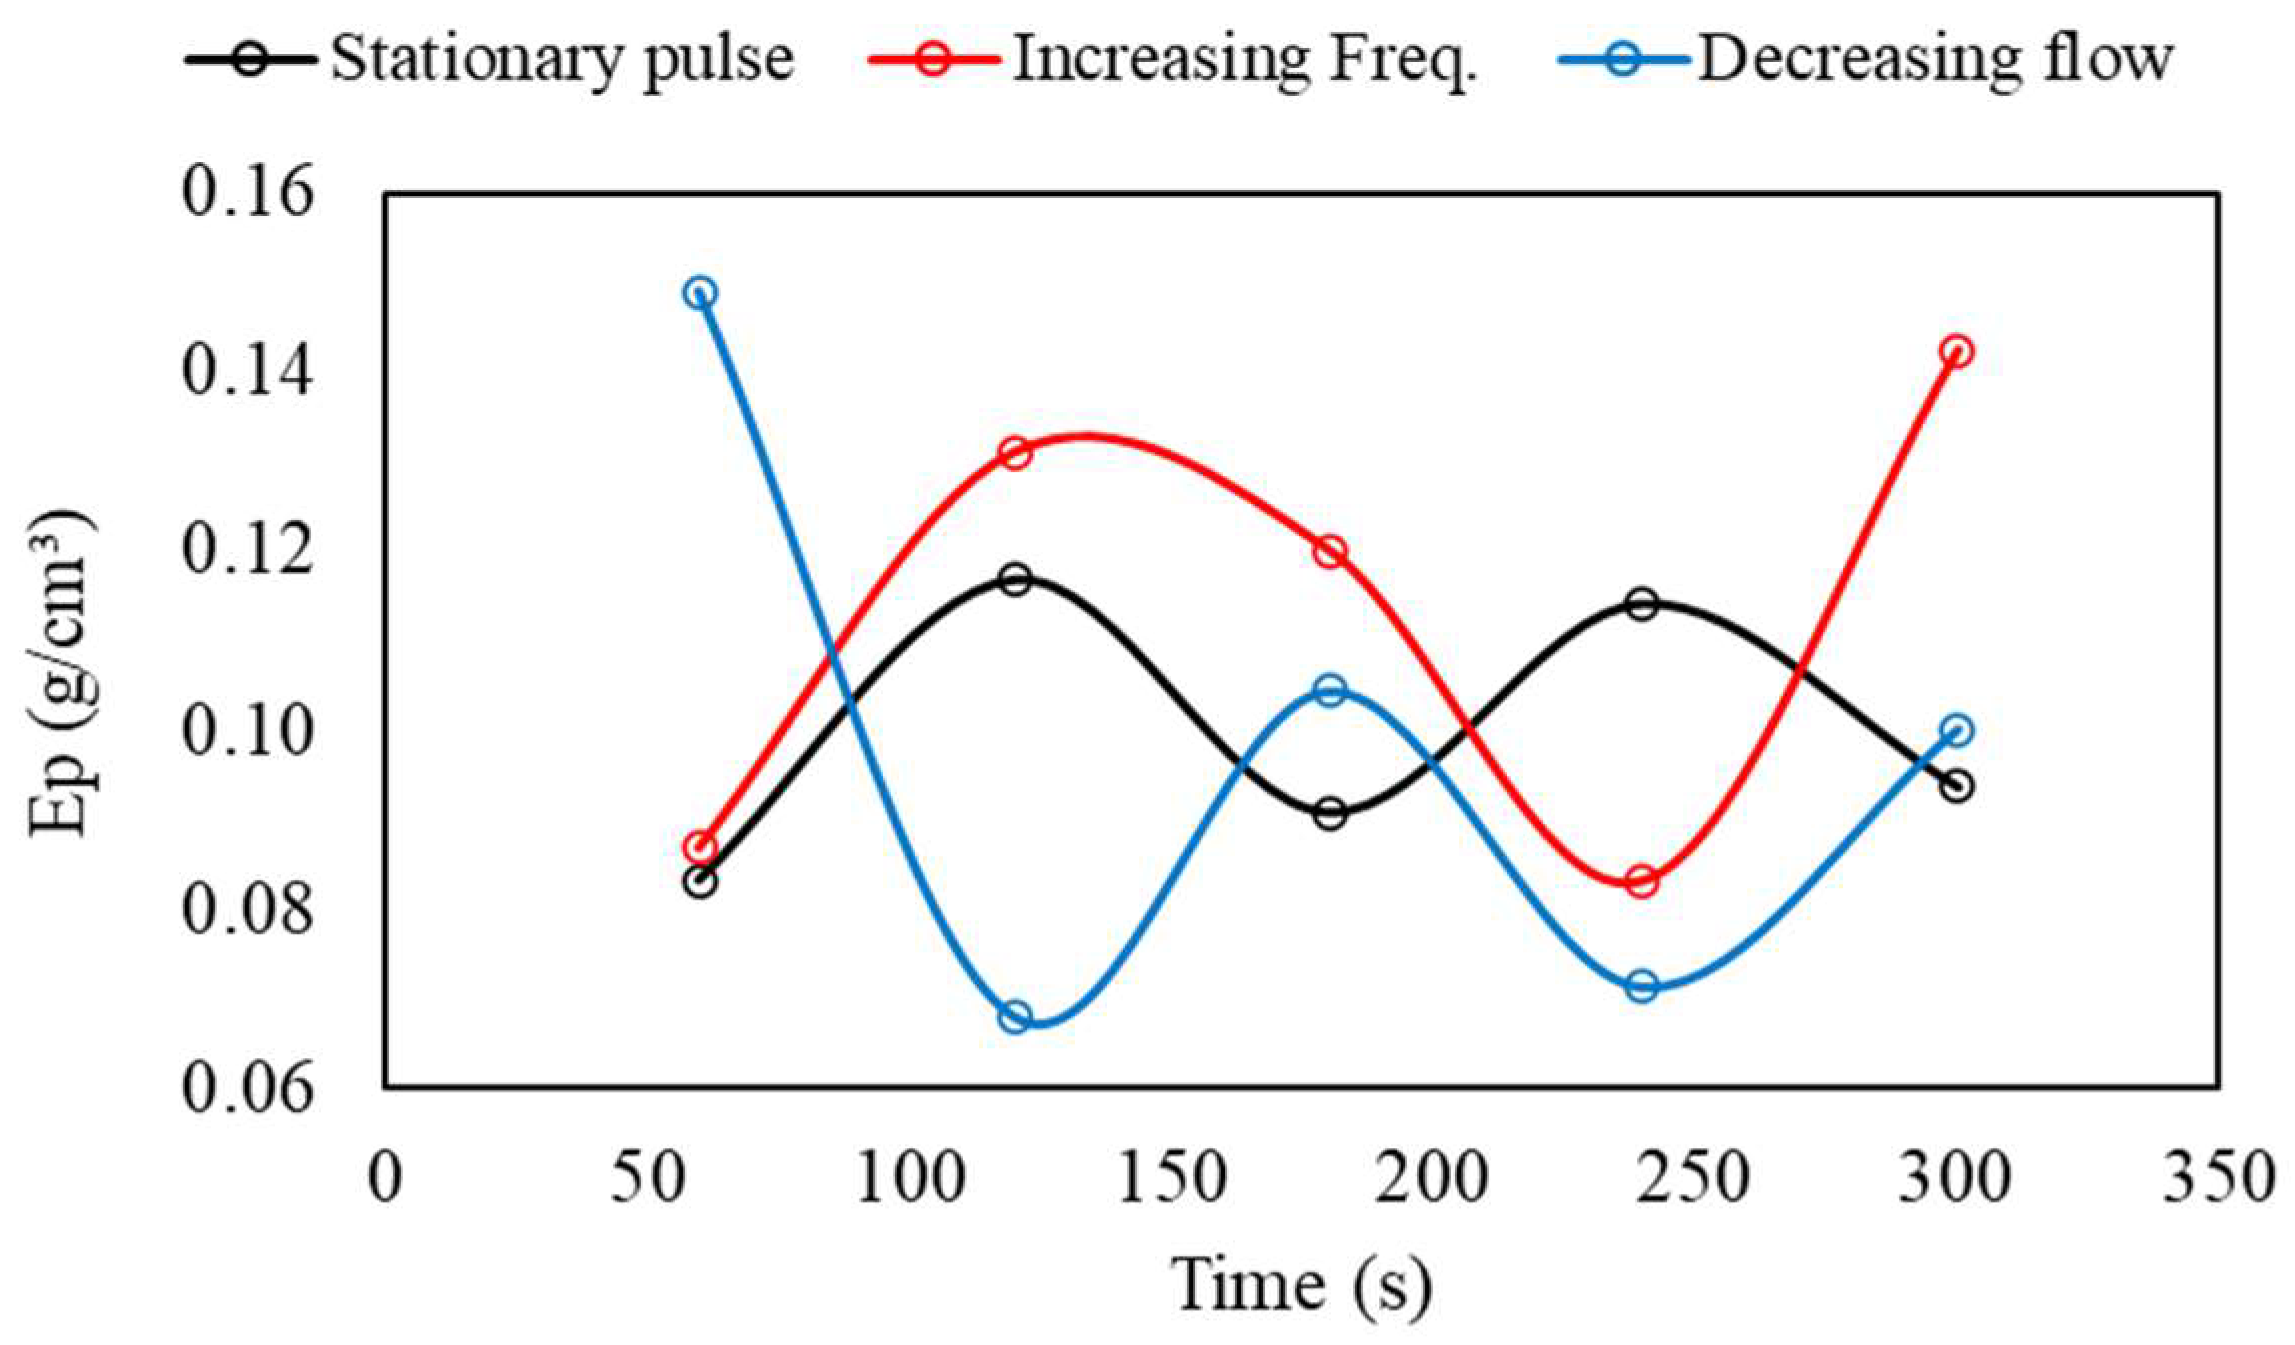
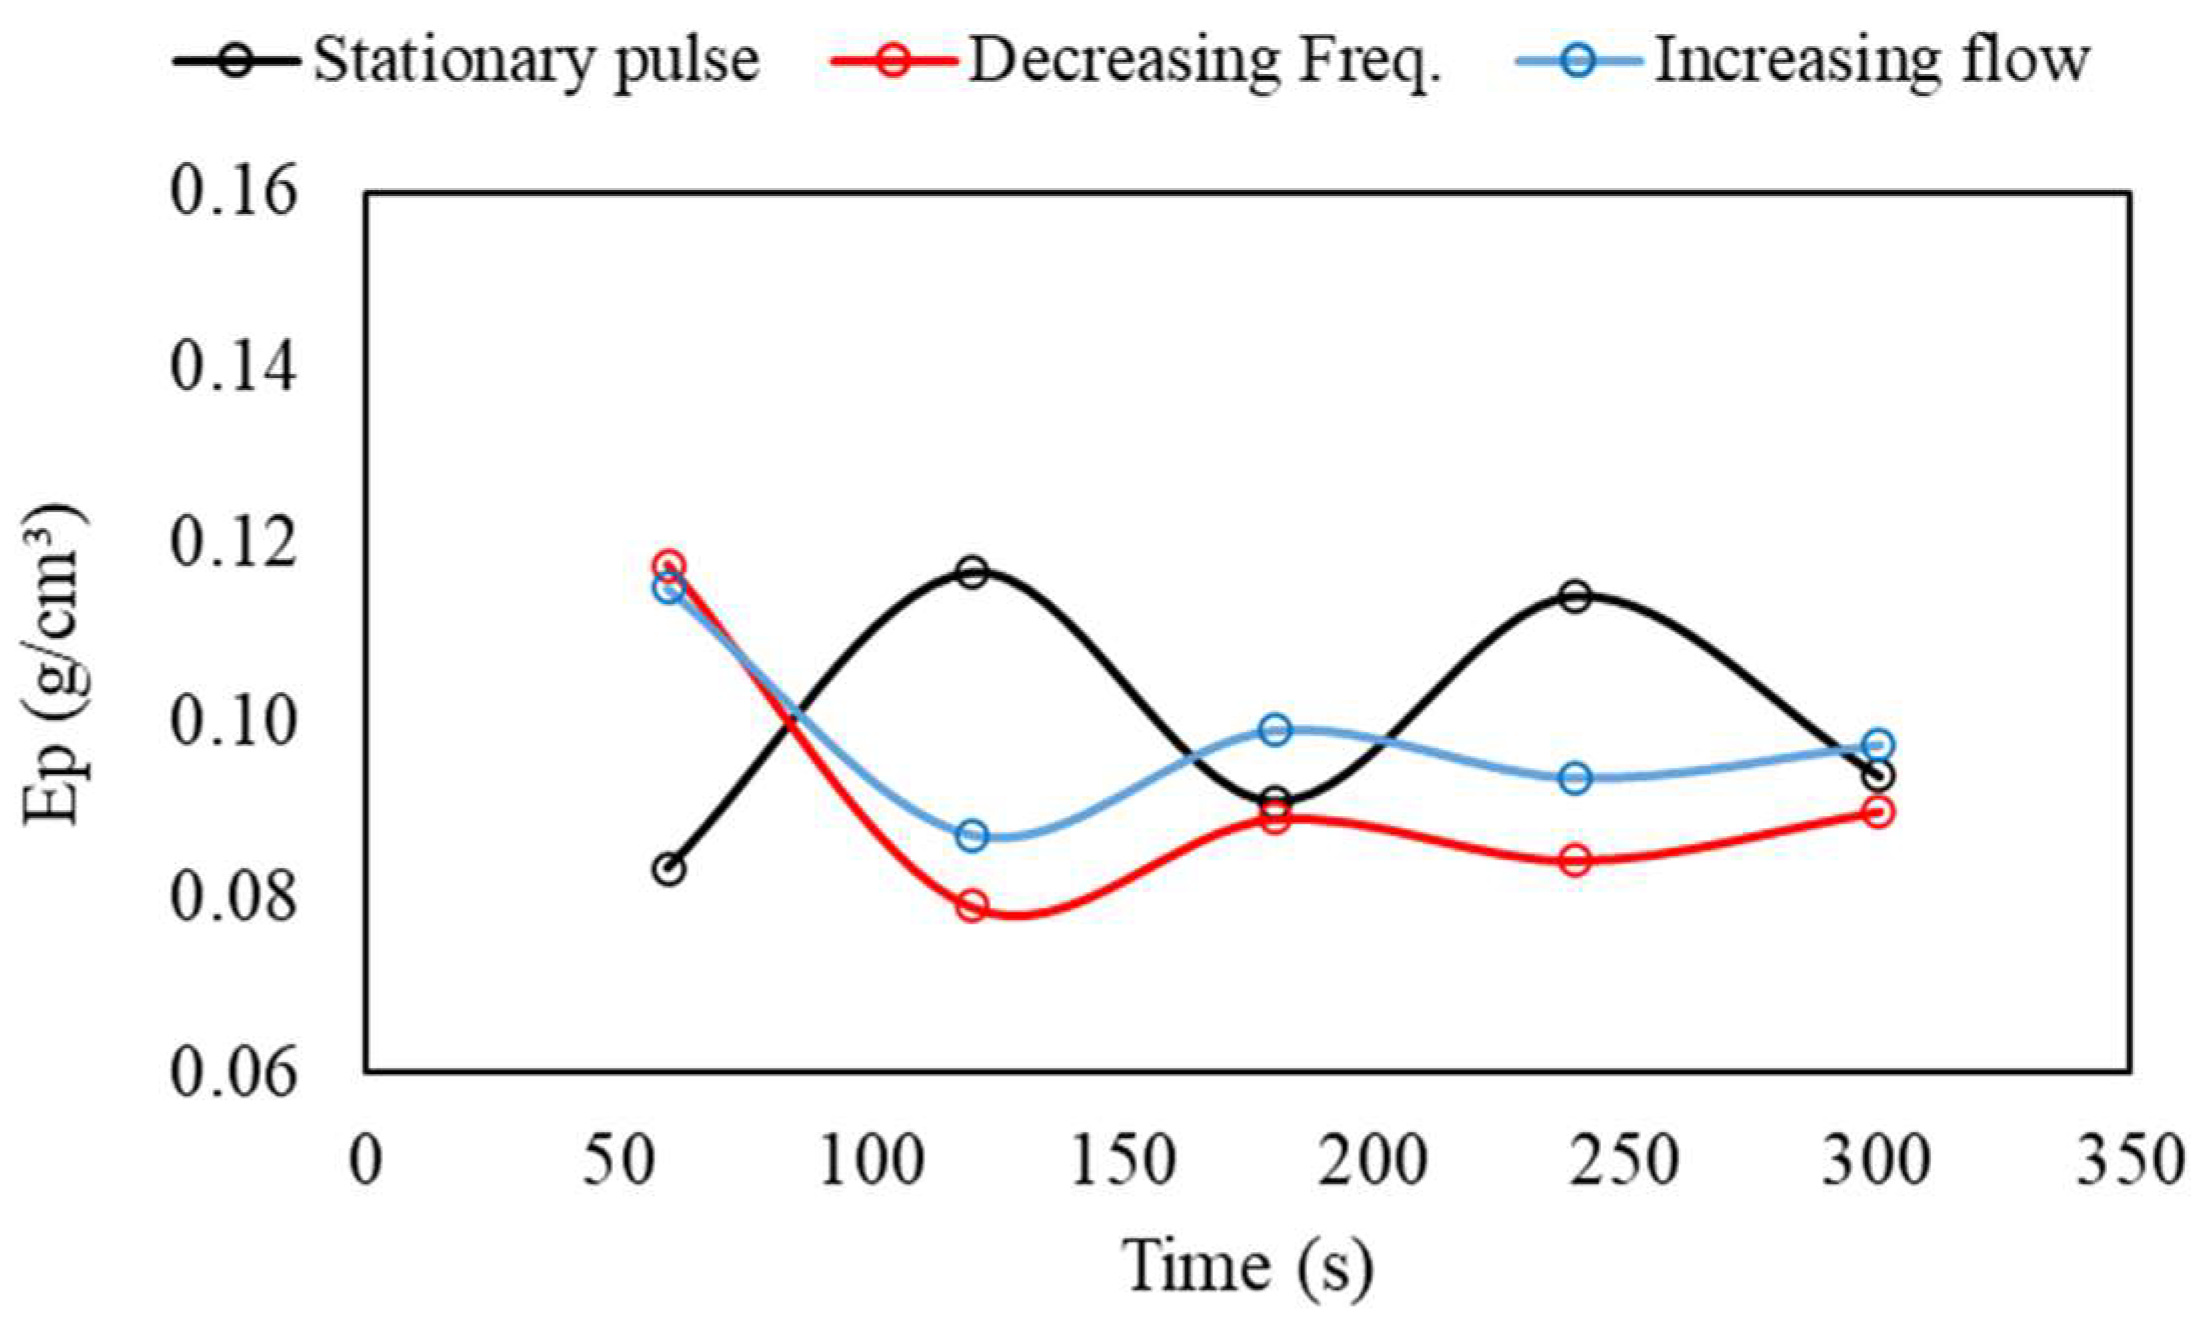
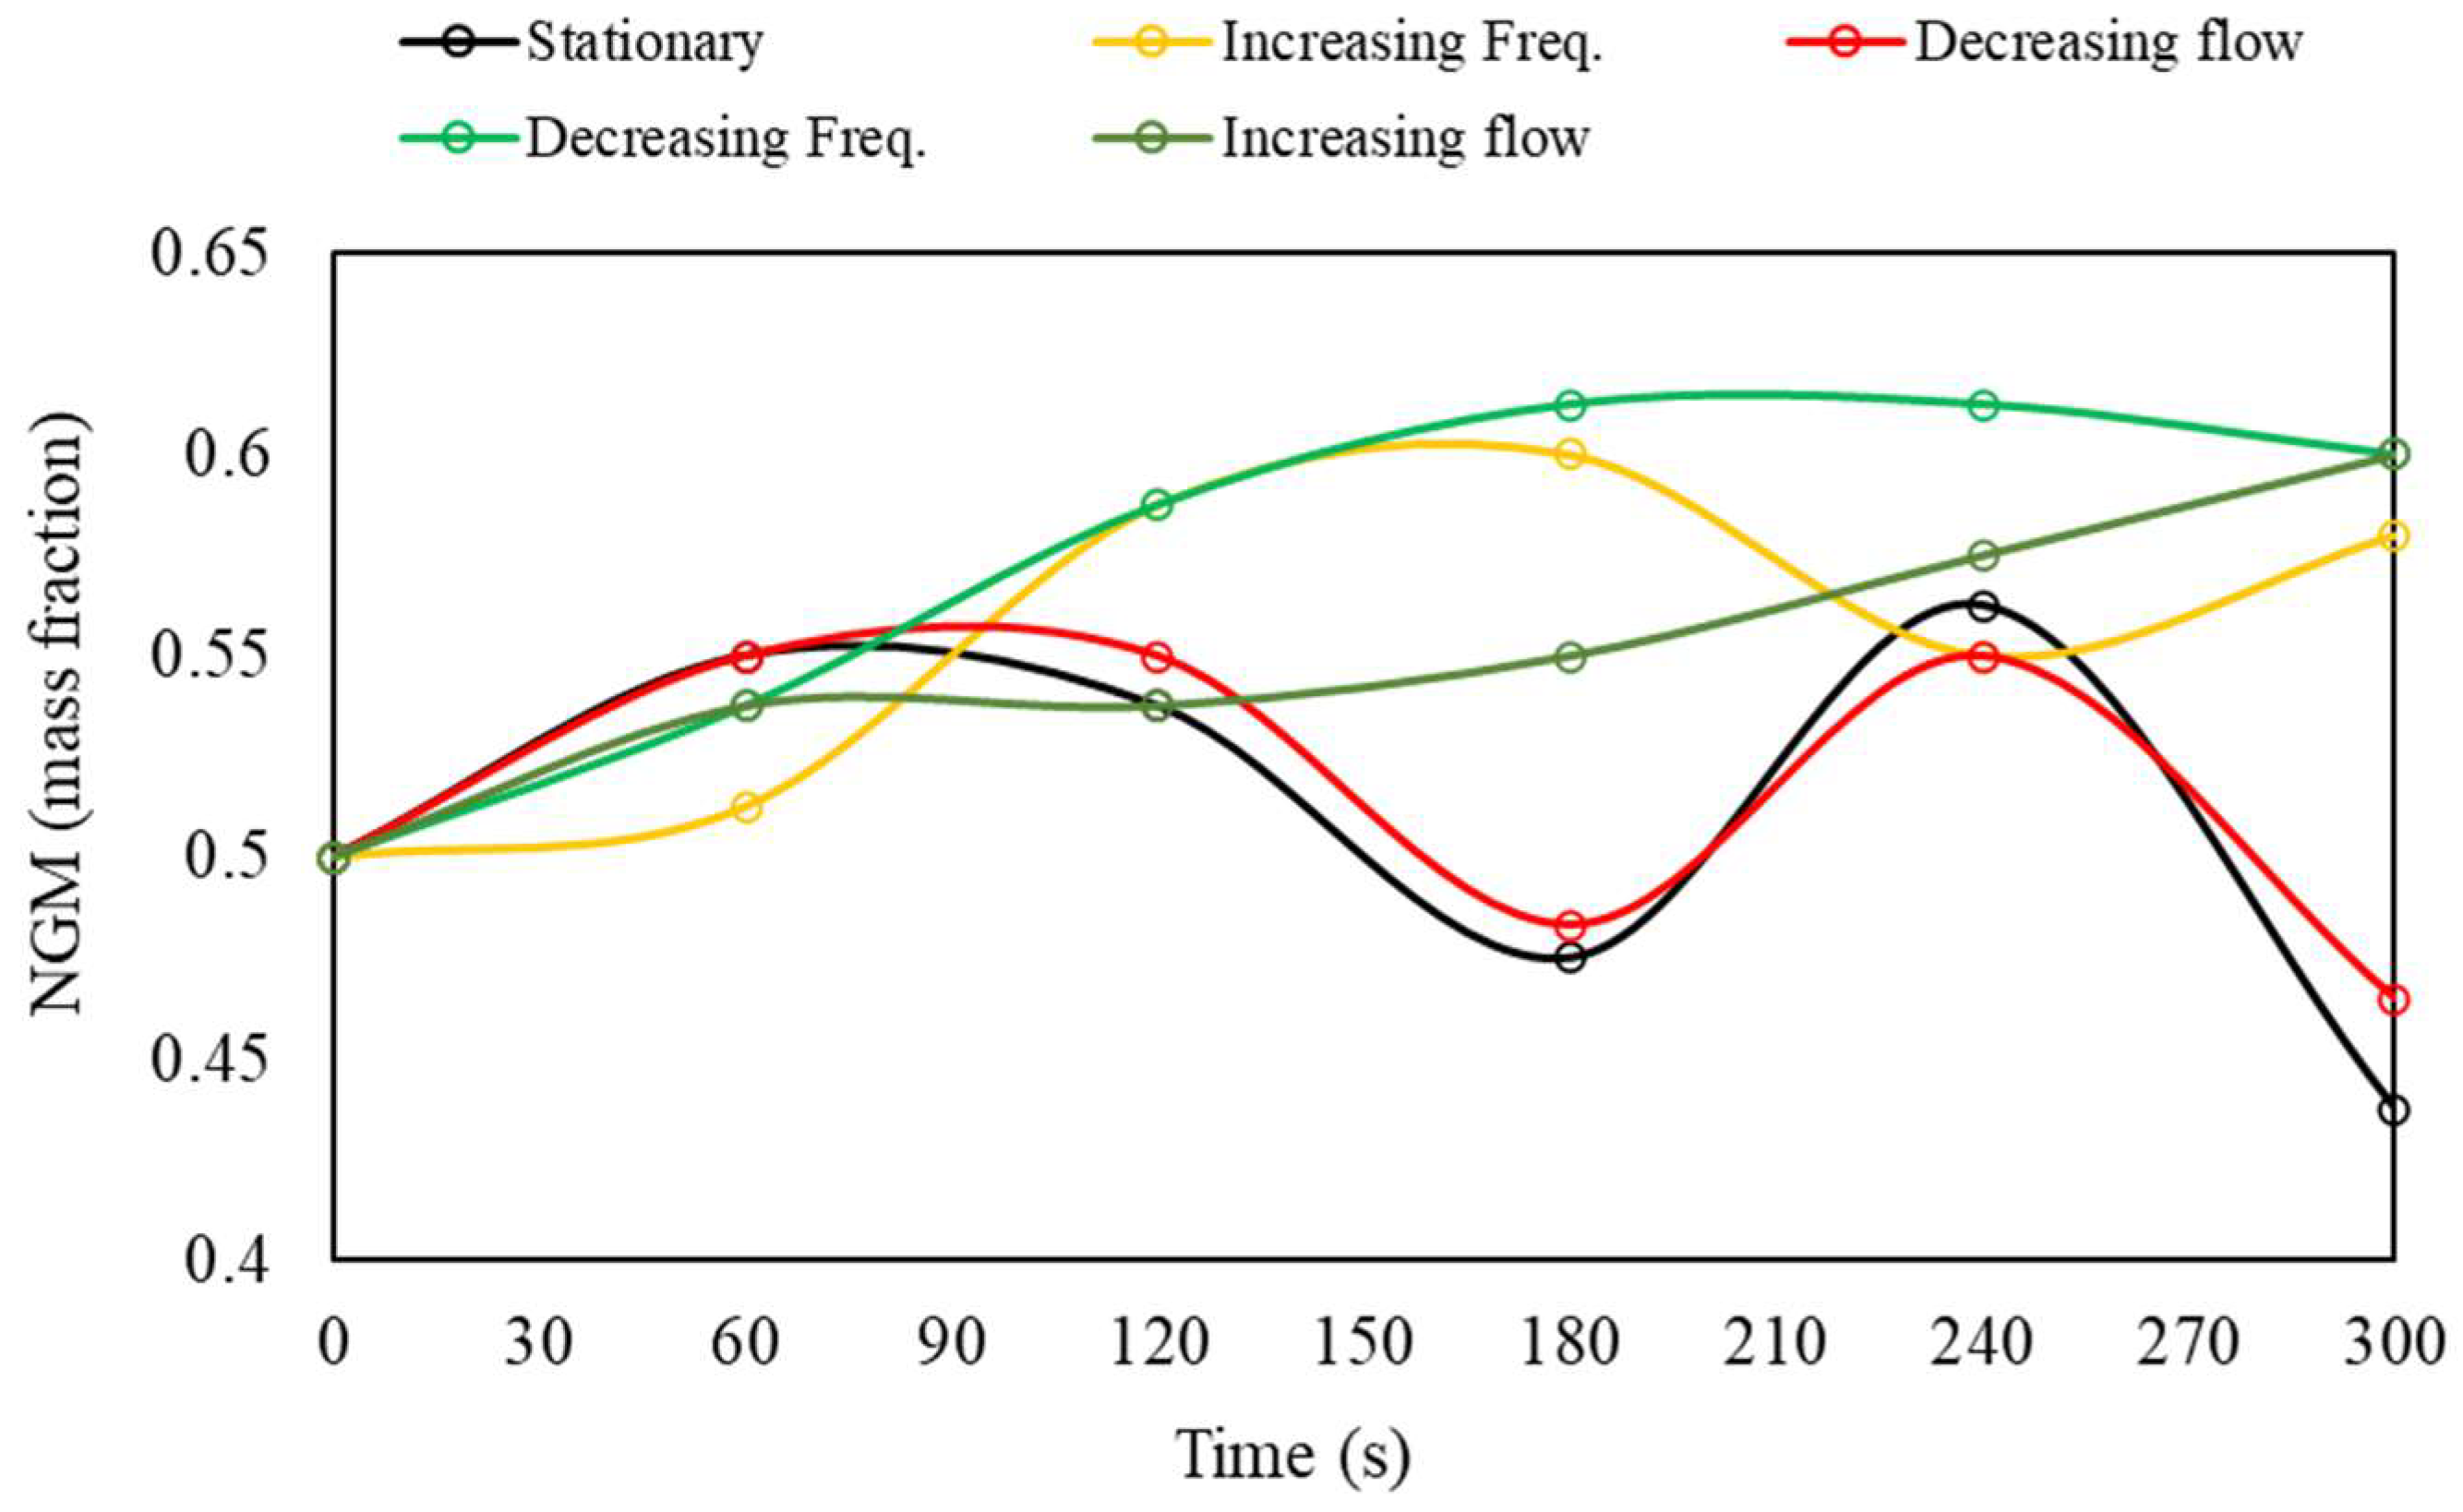
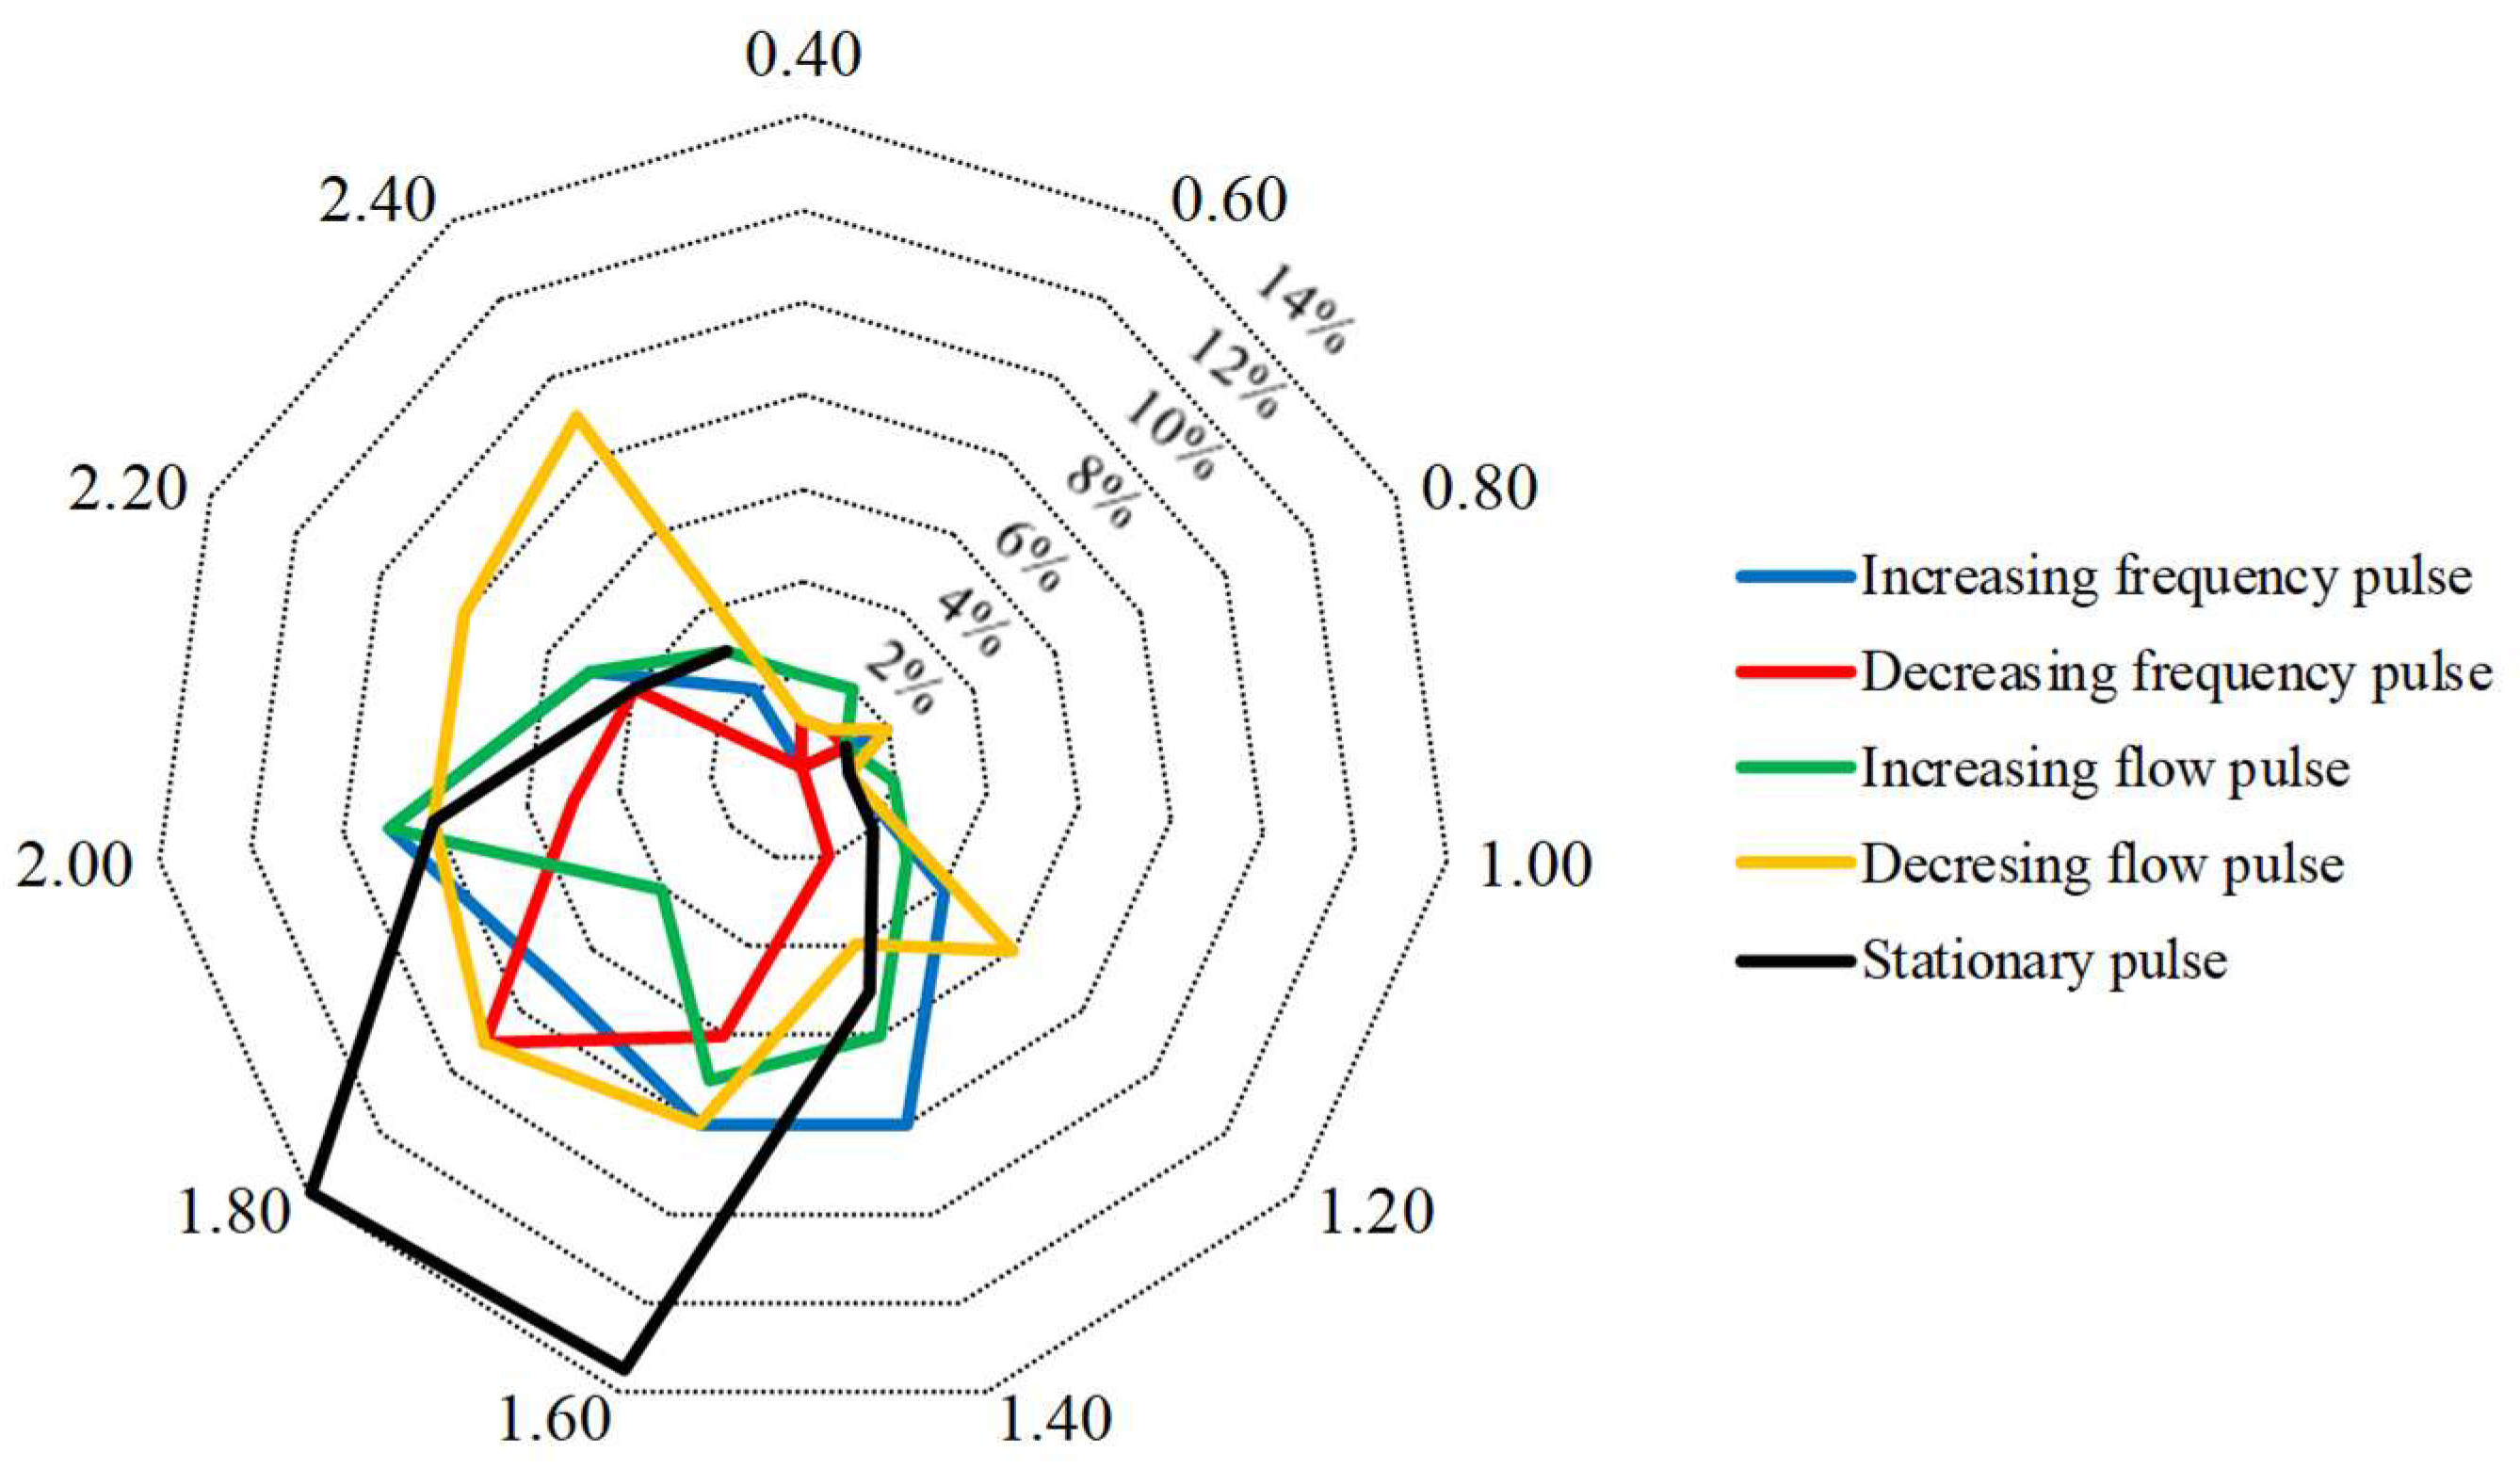
3.4. Transient Pulsation

The results of transient pulsation tests are divided into two categories based on the overall response observed for each experimental setup: (1) pulsation with progressively decreasing bed movement amplitude and (2) pulsation with progressively increasing bed movement amplitude.
Figure 14 and Table 4 display the partition curves and their respective indices for the tests with transient flow pulse of decreasing flow rate and increasing frequency (case 1 mentioned above). In general, concerning separation efficiency alone, no significant differences were observed between the partitions under fixed pulsation and under the considered transient pulsation conditions. However, there were some nuanced differences. The average separation density for decreasing flow rate remained at ρ 50 = 1.71 g/cm3, but with a more consistent level of regularity (standard deviation of only 0.88% compared to 1.71% for the steady-state case). For the increasing frequency condition, the separation density was slightly higher, at 1.73 g/cm3 (±1.08%). On the other hand, while the partition indices showed similar values, again oscillating close to Ep ≈ 0.1, their variation over time demonstrated greater inconsistency (Figure 15). In other words, the stratification became more unstable, making it harder to predict partitioning over time. The approximate oscillation period (between peaks and troughs) remained at 60 s.
Figure 16 and Table 5 depict partition curves and their respective indices for tests with transient flow pulses of increasing flow and decreasing frequency (case 2 previously mentioned). Despite the short circuits indicated at the curve limits (also observed in other operational conditions, suggesting contamination of light and dense products), it is noteworthy to observe the overlap of different partition curves within the ρ 25 ρ 75 interval, particularly for the transient flow pulse condition with increasing flow. This overlap indicates stability, as it suggests that the slope of the partition curve was not significantly affected by jigging time except in the initial moments (highlighted in the decreasing frequency curve in Figure 16b). Another way to assess this behavior is through the variability of the ρ 50 value. For decreasing frequency and increasing flow pulses, the mean values and standard deviations of ρ 50 were 1.73 g/cm3 (±1.08%) and 1.72 g/cm3 (±0.46%), respectively. The low standard deviations around the mean indicate minimal fluctuation in values, implying high stability of the separation density, practically independent of jigging time (for t > 60 s).
Figure 17 depicts the evolution of the mean probable deviation values over time compared to the stationary pulsation condition. More significant than the individual Ep values is their maintenance at values very close to each other from t = 120 s onwards. While, in the fixed pulsation condition, the average variation in Ep from this time onwards was ±22% every 60 s, it decreased to ±8% (decreasing frequency) and ±7.7% (increasing flow) under transient conditions.
Figure 18 compares the proportions of NGM in the light product across all tested conditions. It is worth noting that the base bed density (2.89 g/cm3) is higher than the density of all tracers, so a higher proportion of NGM in the light product can be understood as an approximation of ideal density-based separation. The concentration of denser tracers in the heavy product can be due to the combined effect of density, which is closer to the bed density, as well as differences in size and geometry between tracers and the bed, with the former being slightly coarser and spherical, favoring their movement toward lower layers of the bed [11,13].
It can be observed that the pulsation conditions of decreasing frequency and increasing airflow rate provided the highest proportions of NGM from t = 120 s onwards, describing a progressive and non-oscillatory growth over time. In other conditions, however, an oscillating behavior is observed, which can be interpreted as an alternation of the vertical position of tracers (sometimes in the light zone, sometimes in the dense zone).
Finally, in Figure 19, the variation profiles of the mean percentage experimental error (MPE) for all the test conditions are compared. It can be observed that the conventional stationary condition has the highest MPE magnitude, while all transient pulse conditions, especially the decreasing frequency pulses and increasing flow pulses, exhibited lower MPE magnitudes (the errors remained below 8% within the NGM range). As discussed earlier, this is possibly due to greater stabilization in the concentration of the NGM fraction when using transient pulses, resulting in a lower experimental error for this operational condition.

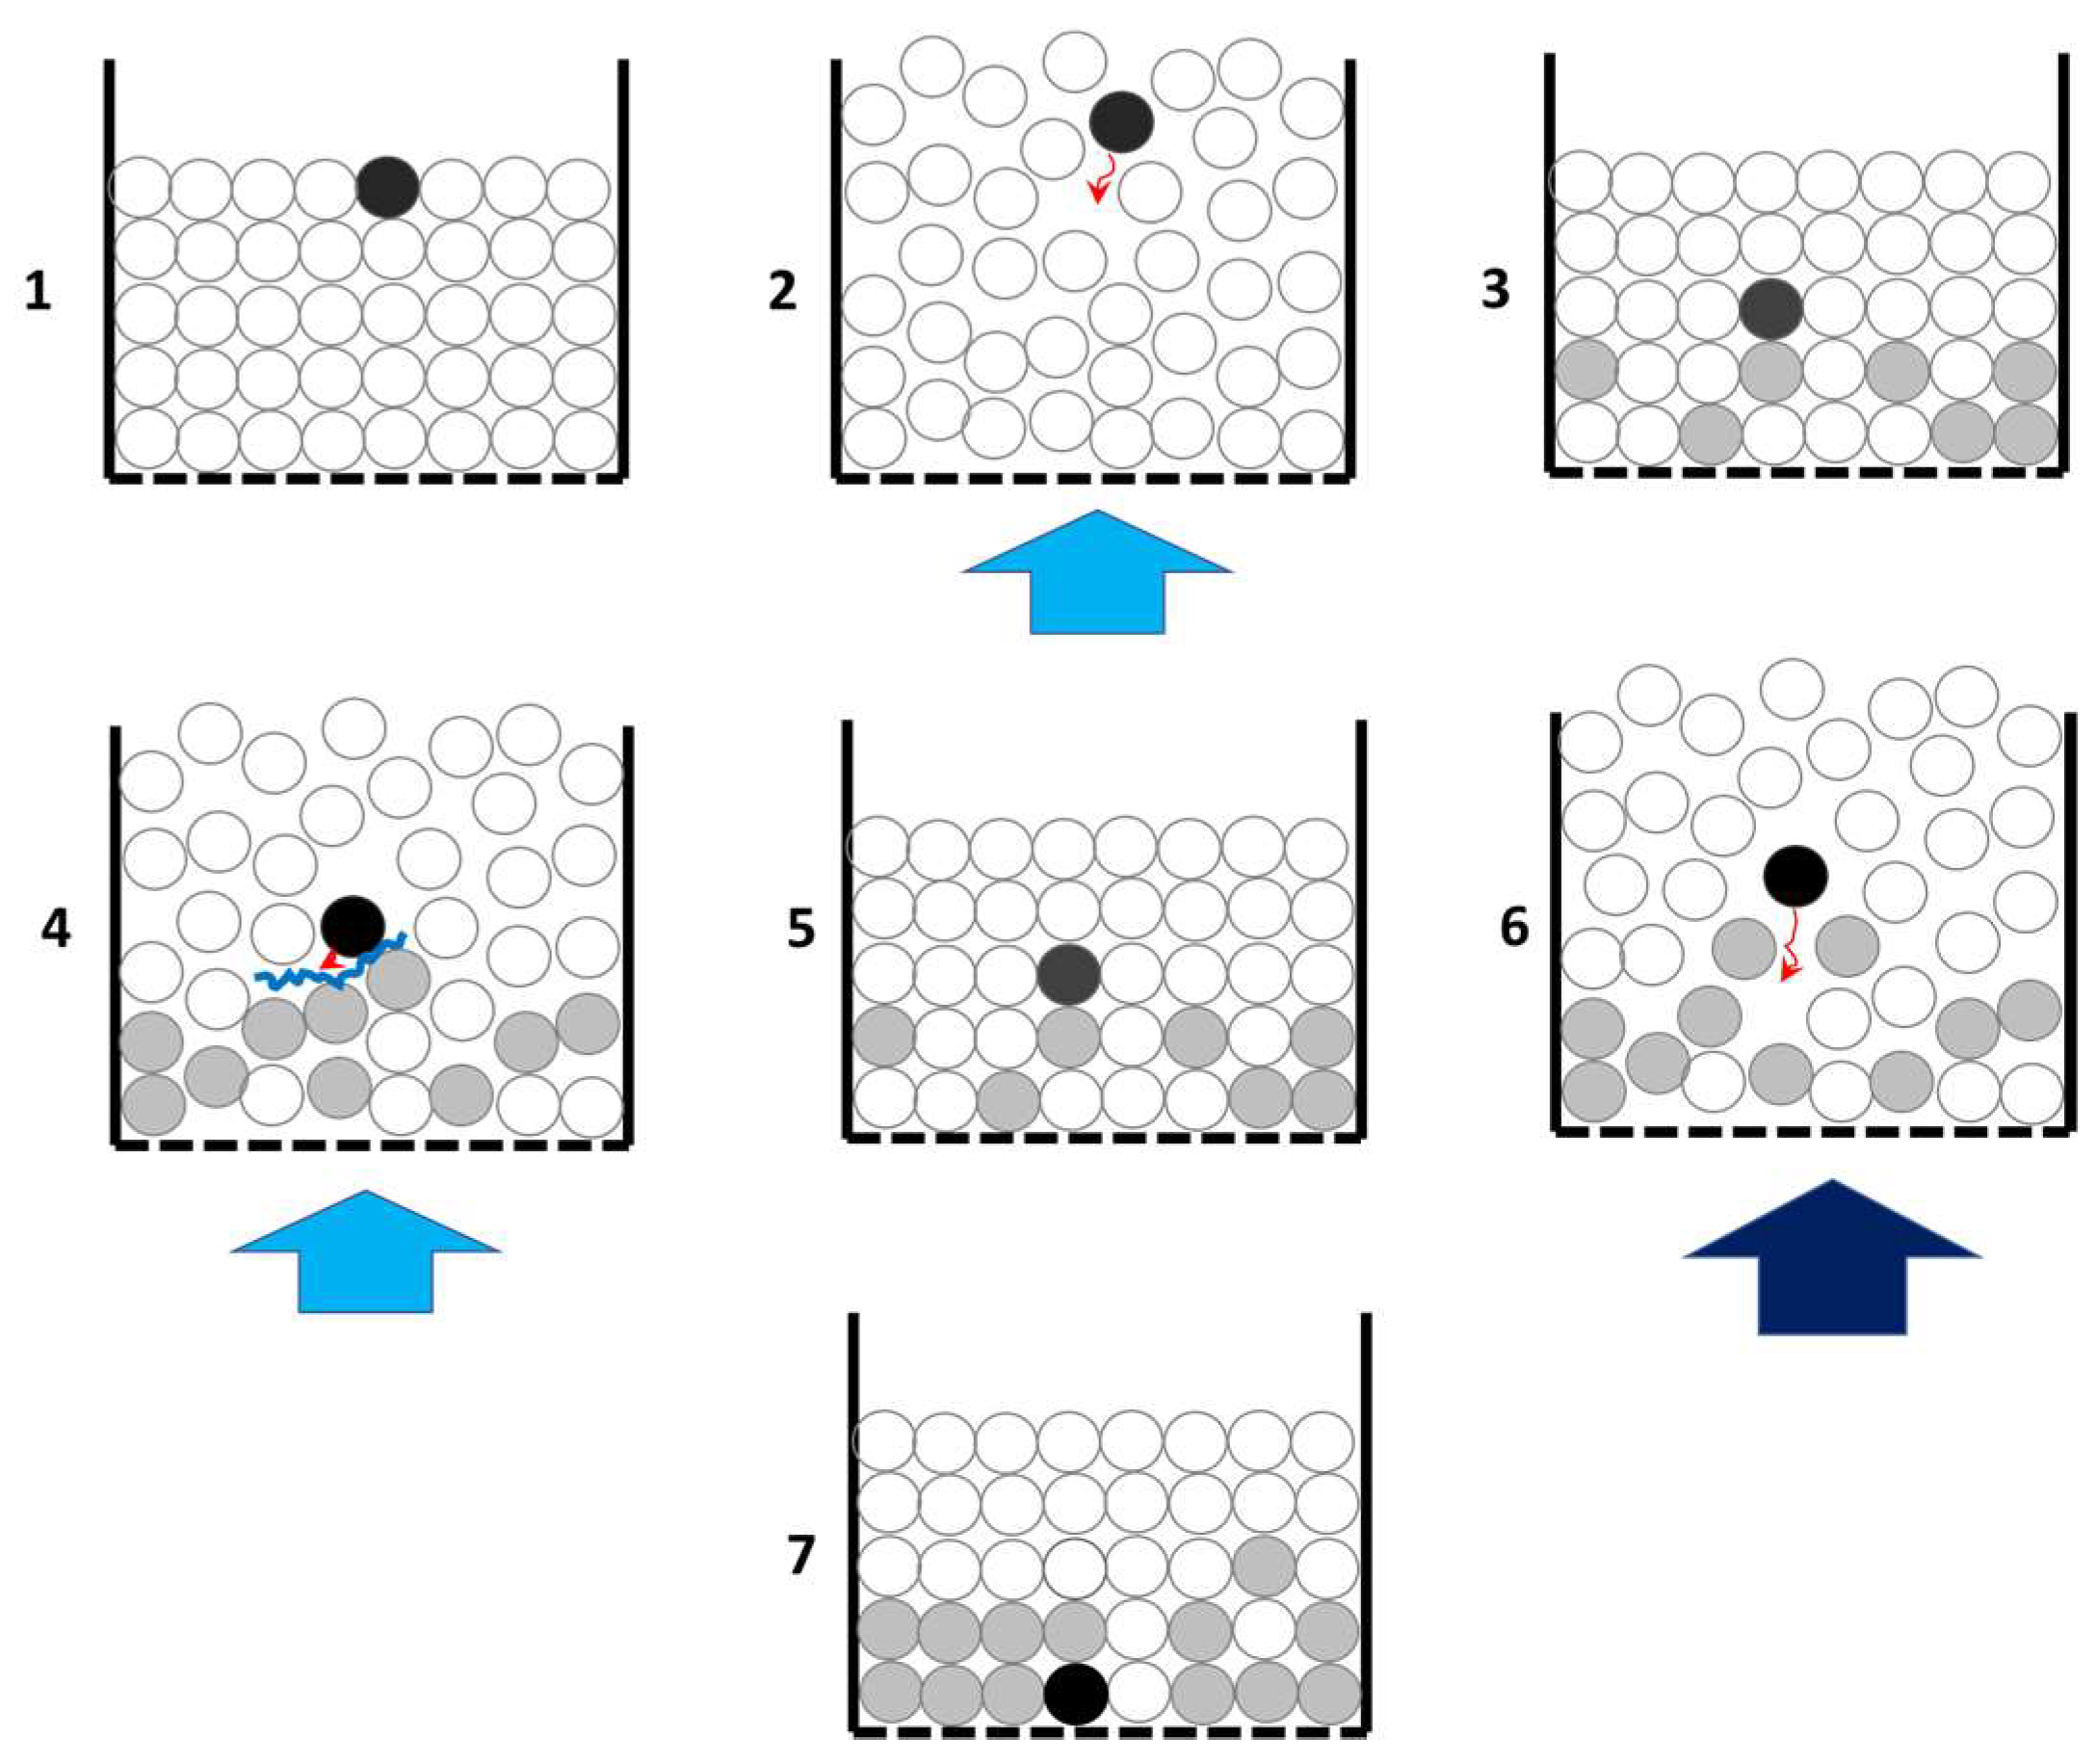
3.5. Transient Pulsation and Segregation: Preliminary Mechanism

The results show that using transient pulses, where flow or frequency conditions vary during material segregation, can change the level of bed segregation and the evolution of dry jigging over time. Overall, it was observed that transient pulsation conditions that decrease the amplitude of bed movement during jigging, such as cycles with decreasing airflow or increasing frequency, had a negative effect on the process, as they accentuated fluctuations in the segregation level over time. On the other hand, pulsation conditions that progressively increase the vertical displacement of the bed, such as those with increasing flow or decreasing frequency, resulted in slightly better segregation levels and more stable jigging evolution over time, with less dramatic variations in separation indices.
Based on the above, a preliminary possible mechanism is proposed to describe the effect of transient pulses on the stratification of the dry jigging bed. The key to this mechanism lies in the variation in the bed porosity throughout the jigging cycle and the subsequent mobility of particles with different densities while the bed is open. Figure 20 depicts a hypothetical situation representing a jigging bed immediately before the start of the pulse. The numbering from 1 to 7 represents the sequence of events presumed to occur during the variation in the pulse magnitude passing through the bed (in the case of pulses with increasing flow, for example), considering the possible movement of a dense particle. In this case, the following sequence can occur:
  • Initially, a dense particle (dark coloration) is positioned at the top portion of a stationary bed.
  • A pulse of air with intensity Y expands the bed, increasing porosity (free space between particles) and allowing heavier particles (denser and larger) to move toward the lower parts of the bed.
  • At the end of the first pulse, the dense particle is found at a middle height in the bed.
  • Another pulse of air with intensity Y crosses the bed, once again causing its dispersion and increasing porosity. However, the movement of the dense particle faces competition from other dense particles, which, due to their weight, move less than light particles in the system. Additionally, compaction increases as one descends into the bed, so the dense particle encounters increasing resistance to its downward movement.
  • The dense particle remains trapped within a restricted zone as new pulses of intensity Y cross the bed, with small-scale oscillations in the vertical position. If it is sufficiently dense (such as tracers with ρ > 2.0 g/cm3), it will remain in a nearly balanced position, while if it is within the NGM range, it may alternate positions in the light or dense product zones.
  • A pulse of air with intensity Z > Y traverses the bed, transferring momentum and causing greater dispersion than the original pulse. The higher magnitude of the new pulse increases the porosity of the zones where dense material accumulates (lower zones), clearing a path for the dense particle to reach a lower portion of the bed than before.
  • A new quasi-equilibrium configuration is established under the more intense pulse, in which the dense particle remains in a lower portion of the bed.
A similar representation could be made by considering a light particle initially positioned at the bottom of the bed, while an opposite behavior would occur if the injection of less intense pulses were considered. The proposed preliminary mechanism basically suggests that pulses that progressively expand the bed help particles to reach their equilibrium positions more efficiently. Once particles reach their equilibrium positions, additional pulses have little effect on their positions in the system. This partially justifies the high stability (i.e., low variation) observed in the distribution and partition of tracers over time when using pulses with an increasing flow rate or decreasing frequency.
Another way to interpret this phenomenon is by using the theory of the potential energy of jigging presented by Mayer [35]. According to this theory, the reduction in potential energy drives bed segregation, and the kinetic force induced by the air pulse only serves to release latent potential energy. A dense particle at the top of a bed (1), viewed in this way, has high potential energy due to its elevated position, requiring a small stimulus (pulse) to release this energy. Once released (2), part of the potential energy, converted into kinetic energy of particle movement, causes it to descend in the bed (3). As the particle moves to a lower height, its potential energy decreases. When released by the air pulse, the particle moves more gently due to the bed’s compaction resulting from the reduction in potential energy (4 and 5). Injecting a more intense pulse than the initial one transfers an additional package of kinetic energy to the particles, especially in the lower portion of the bed, temporarily increasing their potential energy.
It is worth noting that the proposed mechanism should be valid only for an operation within a restricted operational range of pulsation. If the injected pulse is excessively intense, it may cause a remixing of the bed, leading to an increase in the potential energy of the system by raising dense particles to upper portions. This possibility was only considered late in this study and could not be tested due to the large amount of material used, resulting in a massive bed (46.6 kg). As a result, the blower had to operate near its maximum capacity (above 90%) to move the bed, not having enough power to simulate an over-pulse situation. Additionally, the proposed mechanism does not consider other phenomena that may be present during the movement of the bed in dry jigging, such as granular convection and wall effects [26]. Finally, the mechanism, like any results analysis, is based on the movement of individual particles (tracers), requiring additional tests to verify if the observed trends are reproduced for large-scale stratification (high proportions of dense and light particles).

4. Conclusions

Among the few existing studies on dry jigging, the focus has been on analyzing stratification considering different case studies, with little attention given to the specific characteristics of the process, such as its pulsation and stratification evolution over time. A better understanding of these characteristics could enable the development of new operational strategies to improve the process. In the present study, we aimed to analyze these characteristics and, based on the results obtained, we proposed an alternative strategy of using transient pulses. Therefore, the main conclusions obtained were as follows:
  • The use of density tracers distributed in a base bed was shown to be a useful method for analyzing segregation levels in dry jigging. This approach has the advantage of expediting tests and allowing for the calibration of partition curves.
  • Detecting pressure drops in the jigging chamber proved to be a promising strategy for monitoring and adjusting airflow and jigging cycles in air jigs, providing insights into the shape of the pulse and the employed jigging cycle.
  • Measuring the useful power required across the entire operational spectrum of the dry jig used indicated that the blower drive consumes the most energy. These data allowed us to calibrate power vs. airflow curves and make predictions for total consumption (kW or kWh) and specific consumption (kW/kg of processed material).
  • Tests under stationary (fixed) pulsation conditions demonstrated oscillatory and unstable behavior, with tracer distributions and partition indices varying over time, especially in the case of the NGM fraction, thus differing from the kinetics reported in the literature for traditional hydraulic jigs.
  • Tests under transient pulsation conditions indicated two behaviors compared to fixed pulsation: (1) for a decreasing flow rate or increasing frequency, there was a discrete reduction in separation quality and a significant increase in partition index fluctuations over time; (2) for an increasing flow rate or decreasing frequency, there was a discrete increase in separation quality and a significant reduction in partition index fluctuations over time.
  • Based on the results obtained, a preliminary mechanism was proposed to describe the effect of transient pulsation on particle segregation within the jig bed. The mechanism considers the effect of pulses of varied intensities on bed porosity and the exchange of potential and kinetic energy, following the original model proposed by Mayer [35].
Future work should focus on testing different profiles of transient pulse variation and analyzing their impact on real cases (ores, coals, and waste materials). Proper treatment of the ΔP signal and its correlation with bed stratification may also enable the creation of regulation and control functions for segregation in the jig.

Author Contributions

Conceptualization, W.M.A. and F.L.Q.R.; methodology, F.L.Q.R.; validation, F.L.Q.R. and W.M.A.; formal analysis, W.M.A. and F.L.Q.R.; investigation, F.L.Q.R., C.O.P. and W.M.A.; data curation, F.L.Q.R.; writing—original draft preparation, W.M.A.; writing—review and editing, W.M.A.; visualization, W.M.A.; supervision, C.O.P.; project administration, C.O.P. and W.M.A.; funding acquisition, C.O.P. and W.M.A. All authors have read and agreed to the published version of the manuscript.

Funding

This research received no external funding.

Data Availability Statement

This is a partial translation of the thesis [36] of the author Fortunato L. Q. Raposo, under supervision of the other authors, and openly available in the Digital Repository of the Federal University of Rio Grande do Sul in http://hdl.handle.net/10183/257558 accessed on 30 April 2024.

Acknowledgments

The author Fortunato L. Q. Raposo thanks the Brazilian National Research Council (CNPq) for the doctoral scholarship awarded.

Conflicts of Interest

The authors declare no conflicts of interest.

References

  1. Chelgani, S.C.; Neisiani, A.A. Dry Mineral Processing; Springer: Berlin/Heidelberg, Germany, 2022. [Google Scholar]
  2. Weinstein, R.; Snoby, R. Advances in dry jigging improves coal quality. Min. Eng. 2007, 59, 29–34. [Google Scholar]
  3. Mijał, W.; Tora, B. Development of dry coal gravity separation techniques. IOP Conference Series. Mater. Sci. Eng. 2018, 427, 012003. [Google Scholar]
  4. Fu, Z.; Zhu, J.; Barghi, S.; Zhao, Y.; Luo, Z.; Duan, C. Mixing and segregation behavior in an air dense medium fluidized bed with binary mixtures for dry coal beneficiation. Powder Technol. 2020, 371, 161–169. [Google Scholar] [CrossRef]
  5. He, J.; Bai, Q.; Du, T. Beneficiation and upgrading of coarse sized low-grade bauxite using a dry-based fluidized bed separator. Adv. Powder Technol. 2020, 31, 181–189. [Google Scholar] [CrossRef]
  6. Luo, Z.; Zhao, Y.; Lv, B.; Fu, Y.; Xu, X.; Chen, C. Dry coal beneficiation technique in the gas–solid fluidized bed: A review. Int. J. Coal Prep. Util. 2022, 42, 986–1014. [Google Scholar] [CrossRef]
  7. Wills, B.A.; Finch, J. Wills’ Mineral Processing Technology: An Introduction to the Practical Aspects of Ore Treatment and Mineral Recovery; Butterworth-Heinemann: Oxford, UK, 2015. [Google Scholar]
  8. Czerski, G.; Grzywacz, P.; Dziok, T.; Śpiewak, K.; Makowska, D. Experimental evaluation of the dry coal deshaling by pneumatic vibrating FGX separator on the CO2 gasification process. Int. J. Energy Res. 2021, 45, 5412–5422. [Google Scholar] [CrossRef]
  9. Śpiewak, K.; Soprych, P.; Czerski, G. Influence of dry coal deshaling by pneumatic vibrating FGX separator on steam gasification of coal. Thermochim. Acta 2022, 713, 179233. [Google Scholar] [CrossRef]
  10. Jambal, D.; Kim, B.-G.; Jeon, H.-S. Dry beneficiation of coal on KAT air table. Int. J. Coal Prep. Util. 2022, 42, 1866–1878. [Google Scholar] [CrossRef]
  11. Ambrós, W.M. Jigging: A review of fundamentals and future directions. Minerals 2020, 10, 998. [Google Scholar] [CrossRef]
  12. Burt, R.O. Gravity Concentration Technology; U.S. Department of Energy Office of Scientific and Technical Information: Oak Ridge, TN, USA, 1984. [Google Scholar]
  13. Sampaio, C.H.; Tavares, L.M.M. Beneficiamento Gravimétrico: Uma Introdução aos Processos de Concentração Mineral e Reciclagem de Materiais por Densidade; Editora da UFRGS: Porto Alegre, Brazil, 2005. [Google Scholar]
  14. Taggart, A.F.; Behre, H.A. Handbook of Mineral Dressing: Ores and Industrial Minerals; Wiley: Hoboken, NJ, USA, 1945. [Google Scholar]
  15. Ambrós, W.M.; Sampaio, C.H.; Cazacliu, B.G.; Conceição, P.N.; dos Reis, G.S. Some observations on the influence of particle size and size distribution on stratification in pneumatic jigs. Powder Technol. 2019, 342, 594–606. [Google Scholar] [CrossRef]
  16. Gouri Charan, T.; Chattopadhyay, U.; Singh, K.; Kabiraj, S.; Haldar, D. Beneficiation of high-ash, Indian non-coking coal by dry jigging. Min. Metall. Explor. 2011, 28, 21–23. [Google Scholar]
  17. Kademli, M. A review of all aspects of dry coal cleaning methods and evaluation of widely used applications. Int. J. Oil Gas Coal Technol. 2023, 32, 246–272. [Google Scholar] [CrossRef]
  18. Sampaio, C.; Aliaga, W.; Pacheco, E.; Petter, E.; Wotruba, H. Coal beneficiation of Candiota mine by dry jigging. Fuel Process. Technol. 2008, 89, 198–202. [Google Scholar] [CrossRef]
  19. Sampaio, C.H.; Ambrós, W.M.; Cazacliu, B.; Moncunill, J.O.; José, D.S.; Miltzarek, G.L.; Brum, I.A.S.d.; Petter, C.O.; Fernandes, E.Z.; Oliveira, L.F.S. Destoning the moatize coal seam, Mozambique, by Dry Jigging. Minerals 2020, 10, 771. [Google Scholar] [CrossRef]
  20. Ambros, W.M.; Sampaio, C.H.; Cazacliu, B.G.; Miltzarek, G.L.; Miranda, L.R. Usage of air jigging for multi-component separation of construction and demolition waste. Waste Manag. 2017, 60, 75–83. [Google Scholar] [CrossRef] [PubMed]
  21. Cazacliu, B.; Sampaio, C.H.; Miltzarek, G.; Petter, C.; Le Guen, L.; Paranhos, R.; Huchet, F.; Kirchheim, A.P. The potential of using air jigging to sort recycled aggregates. J. Clean. Prod. 2014, 66, 46–53. [Google Scholar] [CrossRef]
  22. Hoffmann Sampaio, C.; Ambrós, W.M.; Cazacliu, B.G.; Oliva Moncunill, J.; Veras, M.M.; Miltzarek, G.L.; Silva, L.F.; Kuerten, A.S.; Liendo, M.A. Construction and demolition waste recycling through conventional jig, air jig, and sensor-based sorting: A comparison. Minerals 2021, 11, 904. [Google Scholar] [CrossRef]
  23. Hoffmann Sampaio, C.; Cazacliu, B.G.; Ambrós, W.M.; Kronbauer, M.A.; Tubino, R.M.; Dal Molin, D.C.; Oliva, J.; Miltzarek, G.L.; Waskow, R.P.; Dos Santos, V.L. Demolished concretes recycling by the use of pneumatic jigs. Waste Manag. Res. 2020, 38, 392–399. [Google Scholar] [PubMed]
  24. Malysz, G.N.; Cappellesso, V.G.; Silvestro, L.; Dal Molin, D.C.C.; Masuero, A.B. Natural and accelerated carbonation in concrete associated with recycled coarse aggregate treated by air jigging technology. J. Mater. Civ. Eng. 2022, 34, 04022133. [Google Scholar] [CrossRef]
  25. Waskow, R.P.; Dos Santos, V.L.; Ambrós, W.M.; Sampaio, C.H.; Passuello, A.; Tubino, R.M. Optimization and dust emissions analysis of the air jigging technology applied to the recycling of construction and demolition waste. J. Environ. Manag. 2020, 266, 110614. [Google Scholar] [CrossRef] [PubMed]
  26. Ambrós, W.M.; Cazacliu, B.G.; Sampaio, C.H. Wall effects on particle separation in air jigs. Powder Technol. 2016, 301, 369–378. [Google Scholar] [CrossRef]
  27. Boylu, F.; Talı, E.; Çetinel, T.; Çelik, M. Effect of fluidizing characteristics on upgrading of lignitic coals in gravity based air jig. Int. J. Miner. Process. 2014, 129, 27–35. [Google Scholar] [CrossRef]
  28. Sahoo, M.; Kumar, A.; Chalavadi, G.; Gupta, A.; Singh, R.K. Enhancement of dry beneficiation of coal by air distributor design modification in an air-pulsated stratifier. Nat. Resour. Res. 2021, 30, 3643–3658. [Google Scholar] [CrossRef]
  29. Aziz, M.A.; Isa, K.M.; Miles, N.; Rashid, R. Pneumatic jig: Effect of airflow, time and pulse rates on solid particle separation. Int. J. Environ. Sci. Technol. 2019, 16, 11–22. [Google Scholar] [CrossRef]
  30. Coelho, A.; de Brito, J. Environmental analysis of a construction and demolition waste recycling plant in Portugal–Part I: Energy consumption and CO2 emissions. Waste Manag. 2013, 33, 1258–1267. [Google Scholar] [CrossRef] [PubMed]
  31. King, R. A quantitative model for gravity separation unit operations that rely on stratification. In Proceedings of the Twentieth International Symposium on the Application of Computers and Mathematics in the Mineral Industries, Johannesburg, South Africa, 19–23 October 1987; pp. 147–151. Available online: http://saimm.org.za/Conferences/Apcom87Metallurgy/141-King.pdf (accessed on 30 April 2024).
  32. Warke, S.; Puranik, V. Comparison of energy consumption of ABS and PLA while 3 D printing with fused deposition modeling process. Mater. Today Proc. 2022, 66, 2098–2103. [Google Scholar] [CrossRef]
  33. Woollacott, L.; Tripathy, A.; Potgieter, H. The effect of operating conditions on density stratification in a batch jig I: The influence on the equilibrium stratification profile. Miner. Eng. 2021, 170, 106838. [Google Scholar] [CrossRef]
  34. Woollacott, L.; Tripathy, A.; Potgieter, J. The effect of operating conditions on density stratification in a batch jig II: The influence on stratification kinetics. Miner. Eng. 2021, 164, 106846. [Google Scholar] [CrossRef]
  35. Mayer, F. Fundamentals of a potential theory of the jigging process. In Proceedings of the 7th International Mineral Processing Congress, New York, NY, USA, 20–24 September 1964; pp. 75–86. [Google Scholar]
  36. Raposo, F.L.Q. Investigação das Características Operacionais na Jigagem a Seco, Visando à Adoção de Novas Estratégias do Processo. Ph.D. Thesis, Universidad Federal de Río Grande del Sur, Porto Alegre, Brazil, 2023. Available online: http://hdl.handle.net/10183/257558 (accessed on 30 April 2024).
Figure 1. Illustrative scheme of the pulsation mechanism of dry jigs.
Minerals 14 00678 g001
Figure 2. Minimum fluidization velocity of coal (1300 kg/m3) and quartz (2600 kg/m3) particles calculated according to Equation (2) for different particle diameters. (a) Fluidization in air (µ = 1.85 × 10⁻⁵ N·s/m2); (b) Fluidization in water (µ = 1.0 × 10⁻³ N·s/m2). The calculation was performed considering a bed of spherical particles with porosity of 0.35. The green arrow relates the equivalent diameter of the quartz bed with minimum fluidization velocity equal to a 10 mm coal bed.
Minerals 14 00678 g002
Figure 3. (a) Pilot-scale dry jig used in the tests and its main components: control panel (1), air valve (2), field logger recorder (3), pneumatic hoses (4), container (5), and dust suction duct for bag filter (6); (b) Detail of hose insertion ports and illustration of pressure tap points.
Minerals 14 00678 g003
Figure 4. (a) Manufacturing scheme for high-density tracers (+1.2 g/cm3) by steel sphere insertion and image of a 1.4 g/cm3 tracer; (b) tracers distributed over the stationary bed surface of the jig.
Minerals 14 00678 g004
Figure 5. Variation in airflow over time from the onset of a pulse at 2.9 m3/s and 85 CPM (time step of 1.4 s).
Minerals 14 00678 g005
Figure 6. Airflow variation in pulses with different blower powers and pulsation frequency of 20 CPM (period of 3 s).
Minerals 14 00678 g006
Figure 7. Variation in instantaneous ∆P over time, with the blower airflow rate increasing from 0 to 100% power at irregular intervals, measured in 0.1-s increments.
Minerals 14 00678 g007
Figure 8. Consumed active power curve on the air blower of the jig.
Minerals 14 00678 g008
Figure 9. Partition curves of jigging tests at different pulsation times and conducted at f = 70 CPM and a flow rate of 2.9 m3/s.
Minerals 14 00678 g009
Figure 10. Variation in tracer concentration in the light product, assuming an initial concentration of 50% (perfect mixture).
Minerals 14 00678 g010
Figure 11. Variation in NGM content in the light product.
Minerals 14 00678 g011
Figure 12. Comparison between concentration criterion (CC) for air separation of bed tracer particles and the concentration of tracers of different densities in the light product, considering the test with t = 90 s.
Minerals 14 00678 g012
Figure 13. Mean percentage error across the tests for each tracer density.
Minerals 14 00678 g013
Figure 14. Partition curves for transient pulsation with decreasing flow rate (a) and increasing frequency (b).
Minerals 14 00678 g014
Figure 15. Comparison of Ep values over time (transient pulsation with decreasing flow rate and increasing frequency).
Minerals 14 00678 g015
Figure 16. Partition curves for transient pulsation with increasing flow (a) and decreasing frequency (b).
Minerals 14 00678 g016
Figure 17. Comparison of Ep values over time (transient pulsation with increasing flow rate and decreasing frequency).
Minerals 14 00678 g017
Figure 18. Proportions of NGM in the light product under different jigging conditions.
Minerals 14 00678 g018
Figure 19. Comparison of the average percentage error magnitude between stationary and transient pulsating conditions.
Minerals 14 00678 g019
Figure 20. Illustration of the sequence of events associated with the proposed mechanism.
Minerals 14 00678 g020
Table 1. Characteristics of the density tracers used.
Density (g/cm3)ColorPLA (g)Steel (g)Steel Sphere (mm)
0.4Silver1.60.13
0.6Light blue2.40.13
0.8White3.30.13
1.0Marble4.10.13
1.2Yellow2.52.58.5
1.4Dark blue3.42.58.5
1.6Green4.22.58.5
1.8Red2.25.411
2.0Orange35.411
2.2Grey3.85.411
2.4Black4.06.311.5
Table 2. Transient pulsation conditions variation for the tests with a jigging time of 60 s.
t (s)Δt (s)Increasing Freq.Decreasing Freq.Increasing Amp.Decreasing Amp.
F (CPM)F (CPM)Flow (%)Flow (%)
00558590100
1515657593.396.6
3015756596.693.3
4515855510090
6015----
Table 3. Partition indices of jigging tests at different pulsation times.
Index/Time30 s60 s90 s120 s150 s180 s210 s240 s270 s300 s
ρ 50 (g/cm3)1.751.721.721.721.681.691.701.721.701.68
Ep0.170.080.080.120.120.090.090.110.100.09
Table 4. Partition indices for tests with transient pulsation—decreasing flow rate and increasing frequency.
Index/TimeDecreasing Flow RateIncreasing Frequency
60 s120 s180 s240 s300 s60 s120 s180 s240 s300 s
ρ 50 (g/cm3)1.721.711.691.711.691.701.731.741.721.75
Ep0.150.070.100.070.100.090.130.120.080.14
Table 5. Partition indices for tests with transient pulsation—increasing flow and decreasing frequency.
Index/TimeDecreasing Flow RateIncreasing Frequency
60 s120 s180 s240 s300 s60 s120 s180 s240 s300 s
ρ 50 (g/cm3)1.731.711.721.731.731.721.731.741.731.73
Ep0.120.090.100.090.100.120.070.090.080.09
Disclaimer/Publisher’s Note: The statements, opinions and data contained in all publications are solely those of the individual author(s) and contributor(s) and not of MDPI and/or the editor(s). MDPI and/or the editor(s) disclaim responsibility for any injury to people or property resulting from any ideas, methods, instructions or products referred to in the content.

