Article

Enhancing Rare Earth Element Recovery from Coal Ash Using High-Voltage Electrical Pulses and Citric Acid Leaching

1
Institute of Combustion Problems, Almaty 050012, Kazakhstan
2
Faculty of Chemistry and Chemical Technology, Al-Farabi Kazakh National University, Almaty 050040, Kazakhstan
*
Author to whom correspondence should be addressed.
Minerals 2024, 14(7), 693; https://doi.org/10.3390/min14070693
Submission received: 2 June 2024 / Revised: 25 June 2024 / Accepted: 2 July 2024 / Published: 3 July 2024
(This article belongs to the Section Mineral Processing and Extractive Metallurgy)

Abstract

:
The study investigates the application of high-voltage electrical pulses (HVEP) as a pretreatment to enhance the leaching efficiency of rare earth elements (REE) from coal ash (CA) produced from the combustion of Ekibastuz Basin coal in Almaty, Kazakhstan. HVEP treatment was applied to the finest (<40 µm) non-magnetic fraction of CA under controlled conditions, optimizing discharge current, voltage, and treatment duration. Leaching experiments with 1 M citric acid at various solid-to-liquid ratios, temperatures, and durations were conducted on both treated and untreated samples. Results indicated that HVEP-treated CA significantly improved REE recovery rates compared to untreated samples, with optimal conditions achieving 74% cerium, 79% yttrium, and 77% lanthanum recovery. The leaching of untreated CA under the specified conditions allowed no more than 28% REE to be extracted into the solution. The leaching process was found to follow first-order kinetics, with the chemical reaction of metal dissolution being the rate-limiting step.

1. Introduction

Rare earth elements (REE), including 15 lanthanides, as well as yttrium and scandium, are attracting increasing attention in modern industry due to their key role in various high-tech applications, including the production of electronics, magnetic materials, catalysts, and other products [1,2,3]. Traditional sources of REE are ore deposits of minerals such as monazite, brockite, cerite, etc. [4,5]. However, the decrease in the REE content in ores and the increasing complexity of their processing leads to the search for alternative sources of these elements. One of the most promising sources of REEs is waste from coal combustion, or coal ash (CA). The REE content in CA depends on the coal’s origin and exceeds that by 8–10 times since REEs are concentrated mainly in ash [6,7,8,9,10,11]. On average, the content of REE in coal is 68 ppm and 404 ppm in CA [12]. Thus, in Indian coal fly ash (CFA), the sum of REE content was found in the range of 234 µg/g to 533 µg/g [13]. REE contents of coal ash from four coal-fired power plants in China ranged from 310 to 683 μg/g (or ppm), with critical REEs accounting for more than 30%, higher than the US Department of Energy’s recommended recovery concentration of 300 μg/g [14]. Thus, CA can be considered to be an attractive raw material for the extraction of REE.
REE is extracted from CA by leaching, i.e., treatment with solutions of leaching agents; in this case, the target elements are transferred into the solution. REEs are then recovered from the solution by precipitation or other methods [15,16,17]. Mostly inorganic acids (sulfuric, hydrochloric, nitric) are used as leaching agents [18,19,20]. To enrich REEs in CA, the source ash can be enriched by physical methods, in particular, by gravity enrichment, magnetic separation, or flotation [17]. To enhance REE recovery, CA is often exposed to high temperatures before leaching, including high-temperature plasma treatment [17]. The recovery of REE into solution during acid leaching varies significantly depending on conditions. When acid leaching with hydrochloric acid is used, the percentage of REE extracted from ash can reach from 60% to 80% [21]. The recovery percentage when using sulfuric acid can be around 50% to 70%, depending on the acid concentration and process conditions. This method is effective for extracting elements such as yttrium, neodymium, and cerium [22]. When comparing sulfuric and hydrochloric acids, the latter is more effective for REE leaching [23]. In the case of sulfuric acid, calcium ions combine with sulfate ions to form poorly soluble calcium sulfate, which blocks the leachant from reaching the surface of the CFA. However, leaching with hydrochloric acid requires the use of corrosion-resistant equipment; in addition, the release of hydrogen chloride vapors poses significant health risks.
The use of organic so-called green reagents for REE leaching looks very promising. They are much less toxic and less aggressive than conventionally used mineral acids, which reduces the risk of environmental pollution and simplifies safety requirements [24,25,26,27]. Citric acid is one of the attractive leaching agents due to its environmental safety, low toxicity, and ability to effectively dissolve REE from various mineral matrices, such as NdFeB magnets [28], cropland soil [29], phosphogypsum [30], phosphate ore [31], as well as spent NiMH batteries [32]. Prihutami et al. studied citric acid leaching of REE from Indonesian CA [33]; the extraction of target metals did not exceed 45% even when using high (up to 90 °C) temperatures and a leaching duration of 250 min. Pan et al. showed the possibility of extracting 55% REE from CA by alkaline pretreatment [34]. In turn, Rosita et al. achieved a significant increase in REE extraction from CA due to preliminary alkaline pretreatment and subsequent citric acid leaching, up to 77.6% [35]. At the same time, pre-alkaline treatment of the material to increase leachability has several significant disadvantages, such as the formation of soluble silicates and aluminates, the need to dispose of highly alkaline solutions, as well as the high corrosive activity of alkalis [36]. Segsworth and Kuhn, in the late 1970s, showed the possibility of using high-voltage pulses to break rocks [37]. The mechanism of action for HVEP used in the pretreatment of minerals to enhance leaching efficiency involves several key processes. When a high-voltage discharge occurs in a liquid, it forms a plasma channel that generates a shock wave and cavitation. The shock wave and the collapse of cavitation bubbles create high pressures and temperatures, which break down the mineral structures and facilitate their subsequent leaching. HVEP leads to a reduction in particle sizes and increases the amorphous content of the treated material by creating defects within the crystal lattice. This deformation and fragmentation enhance the accessibility of leaching agents to the minerals, therefore improving the efficiency of metal dissolution. Overall, HVEP treatment enhances the recovery rates of valuable elements from minerals by creating conditions that facilitate the breakdown of mineral structures, making the target elements more accessible for extraction during the leaching process. This method proves particularly effective when combined with various leaching agents, leading to significant improvements in recovery rates compared to untreated samples [38,39,40,41]. High-voltage electrical pulse (HVEP) technology has been applied in the pretreatment of magnetite [42], precious and base metal ores and slags [43], lithium spodumene [44], and printed circuit boards [45]. However, HVEP has not yet been applied toward CA. To fill this gap, this study investigates the use of HVEP as a pretreatment operation for citric acid leaching of CA produced from the combustion of Ekibastuz Basin coal in Combined Heat and Power plants in Almaty, Kazakhstan. The optimal conditions for CA electrical breaking (discharge current, voltage, process duration) and subsequential leaching (temperature, leaching duration, liquid-to-solid ratio, citric acid concentration) are explored through experiments. The kinetic parameters of the leaching process are obtained.

2. Materials and Methods
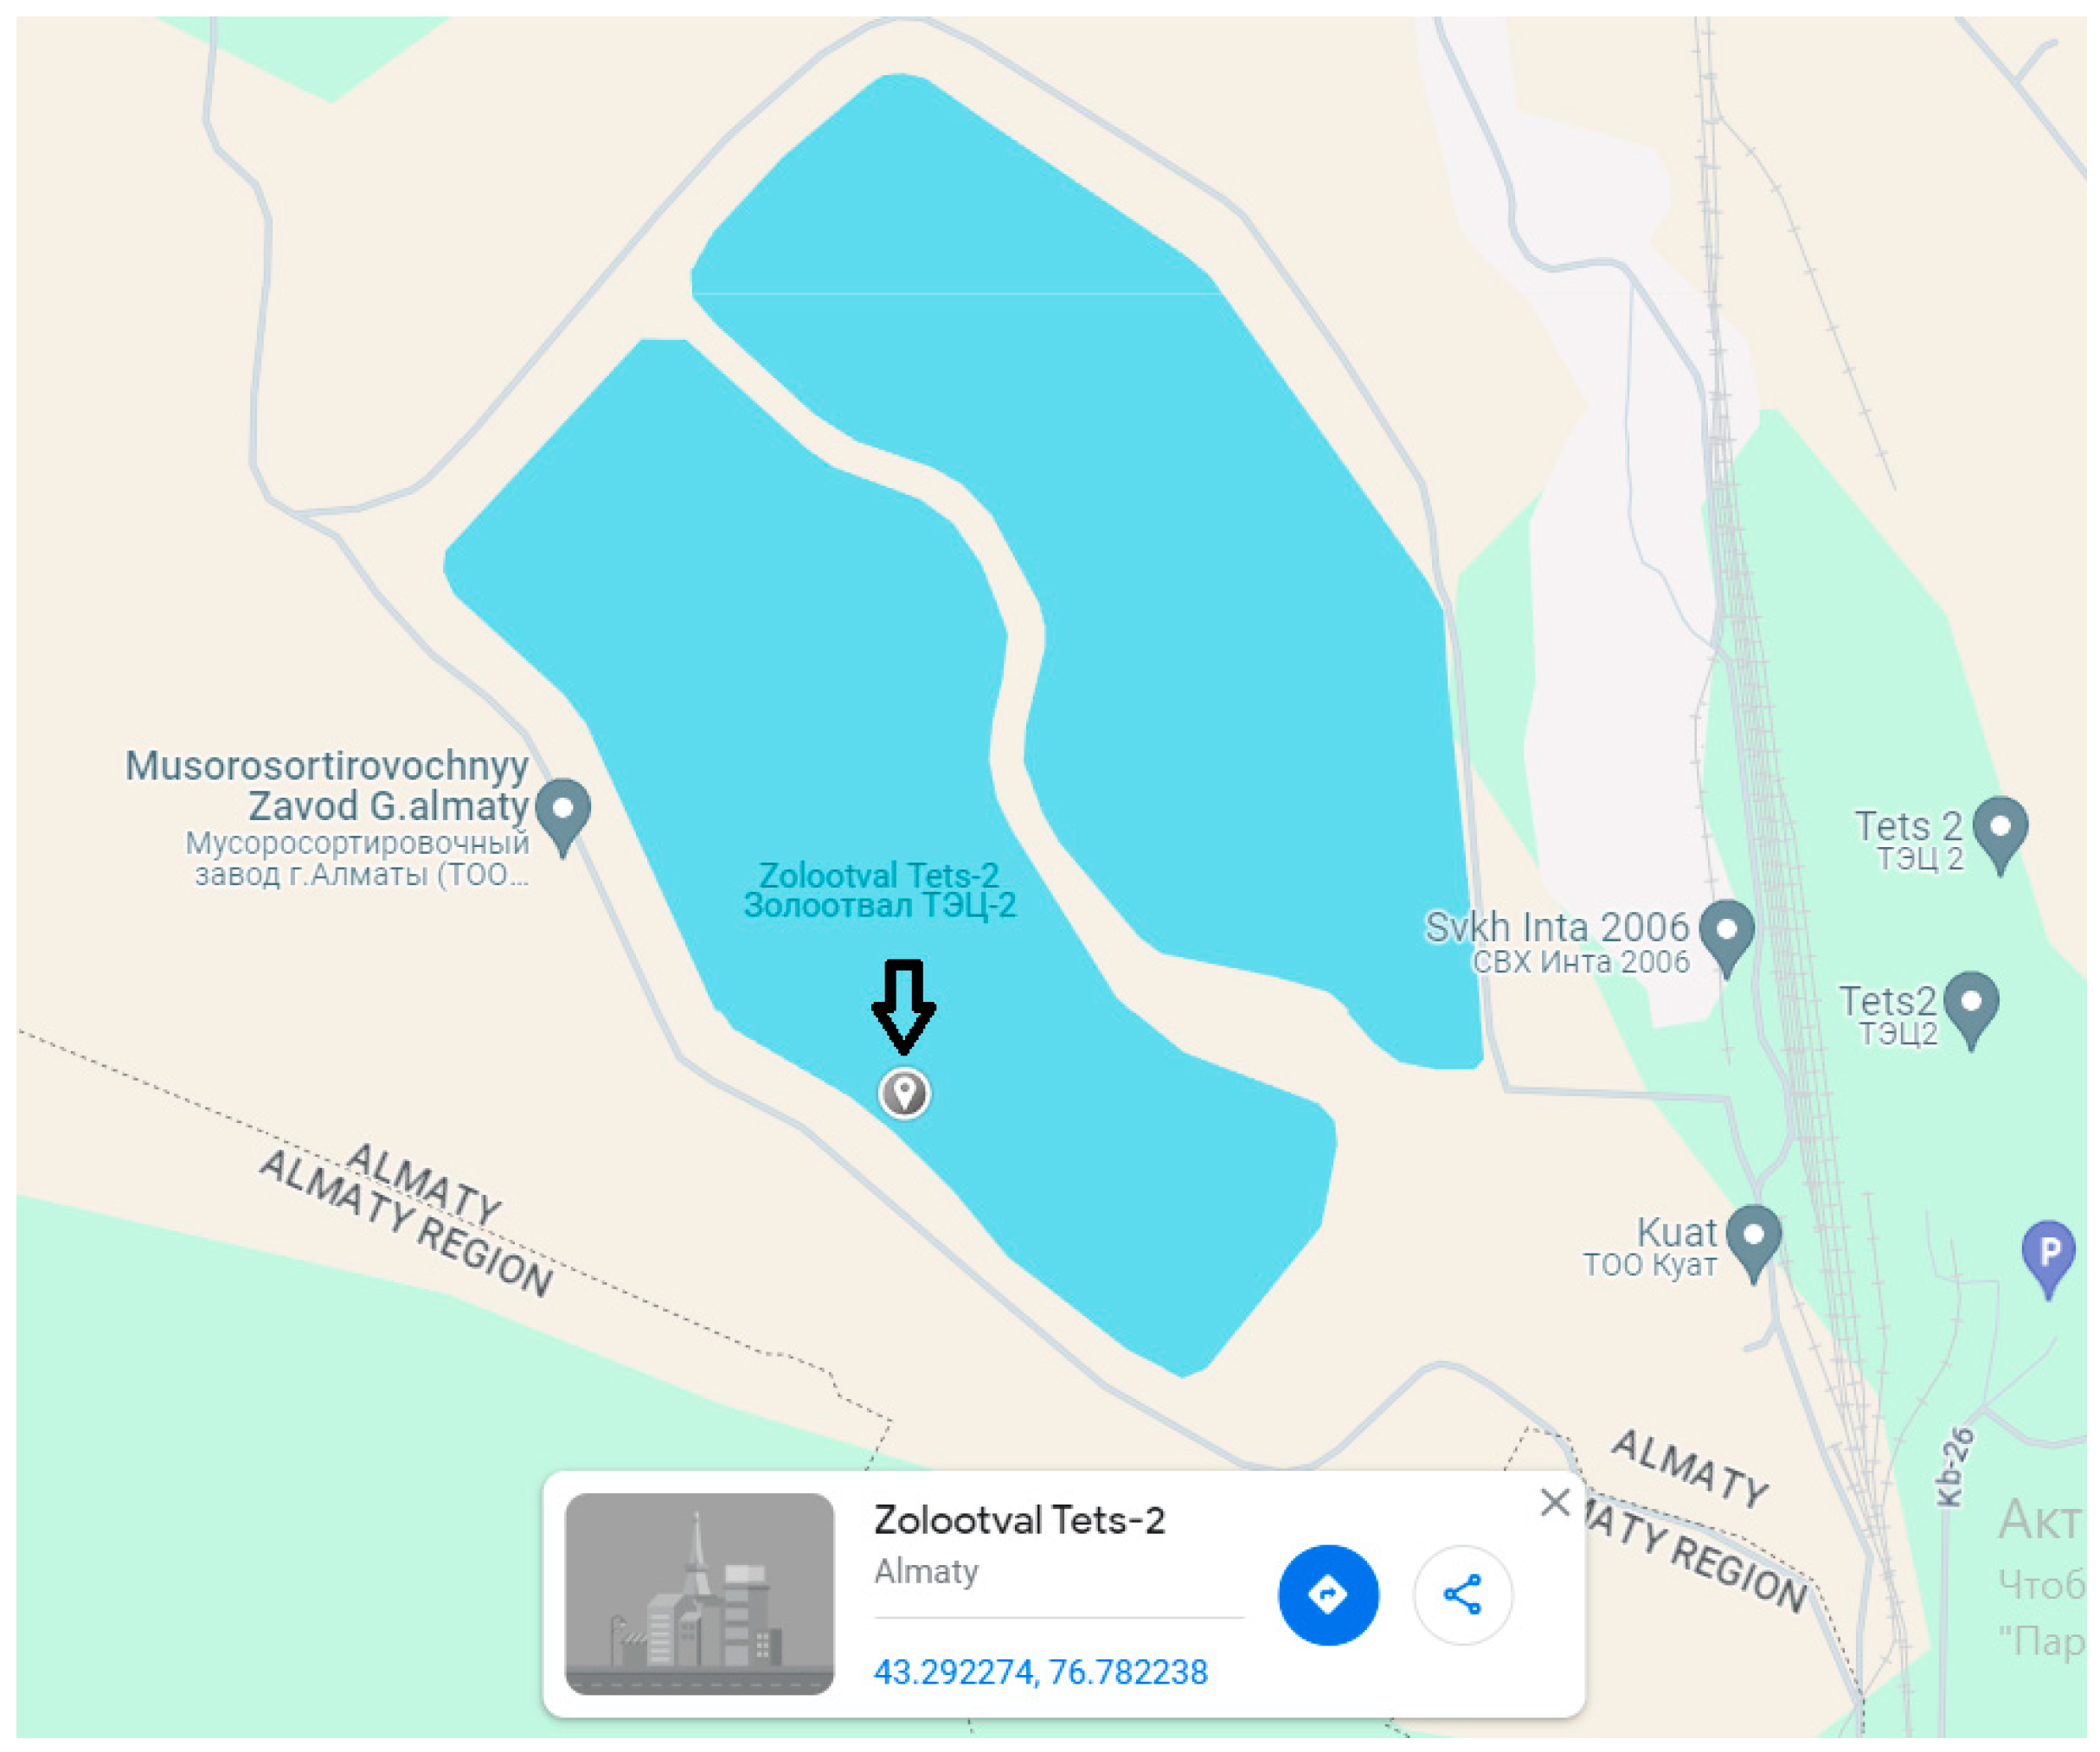
2.1. Materials

A batch of CA was sourced from the CHPP-2 power plant in Almaty, Kazakhstan; the sampling location is shown in Figure 1. Approximately 120 kg of ash was collected directly from the ash dump. The collection process involved the use of sterile, non-reactive containers to prevent contamination. Once collected, the ash was sealed in airtight containers, labeled with collection details, and transported to the laboratory. In the laboratory, the ash was stored in a dry area at room temperature and homogenized to ensure uniformity for subsequent experiments.
Citric acid (≥99/5%) for leaching was purchased from Sigma-Aldrich, Moscow, Russia.

2.2. Classification, Magnetic Separation and Mechanical Grinding

The ash was subjected to size classification using a laboratory vibrating sieve DY-200. The <100 µm fraction was used for the studies. This faction was then divided into 3 factions: <40 µm, −40 + 80 µm, −80 + 100 µm. These fractions (weighing 7–8 kg each) were then subjected to magnetic separation using a magnetic separator, “SMS-20-PM 1” (Itomak, Novosibirsk, Russia). The magnetic field is set at a level of 0.2 Tesla to attract and isolate ferromagnetic materials from the rest of the ash. The efficiency of the separation was continually monitored by sampling the output streams. The magnetic fraction, enriched with ferromagnetic materials, and the non-magnetic fraction, predominantly composed of other ash components, were collected separately.
Mechanical grinding was performed using planetary ball mill Activator-2SL (Activator, Novosibirsk, Russia) to reduce the particle size of CA without HVEP treatment.

2.3. High-Voltage Pulse Treatment

The high-voltage discharge system depicted in Figure 2 was utilized to administer electrical pulses to CA samples submerged in deionized water with an electrical conductivity of less than 10 µS/cm.
The core of the experimental setup was the impulse voltage generator, capable of delivering controlled and repetitive electrical discharges. The generator was connected to a treatment chamber (5 dm3) where the 1000 g of CA sample was placed. This chamber was specifically designed to withstand the extreme conditions generated by the high-voltage pulses and to ensure the safety and integrity of the experiments. It was equipped with copper electrodes (discharge electrode, 15 mm diameter, and grounded electrode as a plate). The high-voltage pulse generator employed in this experiment was the IVG-80B model (Pulse Electronic Engineering Co., Ltd., Tokyo, Japan).
This apparatus, featuring adjustable settings, enables the processing of nanofluid in two distinct modes: (a) low-current mode, Mode 1, characterized by a rod separation distance of 1.0 mm, a discharge current of 10 A, a voltage of 10 kV, a frequency of 1 kHz, and a pulse duration 50 µs; (b) a high-current mode, Mode 2, with a rod separation distance of 1.0 mm, a discharge current of 15 A, a voltage of 80 kV, a frequency of 1 kHz, and a pulse duration 50 µs. For both modes, treatment duration was varied from 10 to 50 s.
Before initiating the treatment, the CA sample was loaded into the treatment chamber, and a series of high-voltage pulses were applied. The duration, intensity, and frequency of the pulses were carefully controlled and varied according to the experimental design to evaluate the impact of these parameters on the liberation process.
After the treatment, the treated fly ash was retrieved from the chamber and subjected to a series of post-treatment analyses. The particle size distribution was measured to assess the extent of liberation, and the chemical composition was re-evaluated to detect any changes due to the high-voltage pulse treatment.

2.4. Leaching Experiments

Leaching tests were also conducted on both treated and untreated samples to compare the efficiency of metal recovery.
The leaching experiments were conducted using a 100 mL round-bottom glass reactor, which included a thermometer. The reactor was filled with 100 mL of a 1 M citric acid aqueous solution. Subsequently, the reactor was positioned on a magnetic stirrer (IKA RT 5, Staufen, Germany) and set to the required temperature. After reaching the target temperature, 100–700 g of CA sample was introduced into the solution, resulting in a solid-to-liquid ratio of 100–700 g/L. Stirring speed was maintained at 300 rpm in all the leaching experiments. Periodically, every 20 min, liquid samples were extracted from the solution using a micropipette to determine the concentrations of cerium (Ce), yttrium (Y), and lanthanum (La).
The leaching efficiency was assessed by calculating the recovery rate of the desired metal (α) using the formula:
α = m 1 m 0 × 100 %
Here, m 1 represents the mass of the metal in the solution and m 0 is the mass of the metal in the initial sample.
Upon completion of the leaching process, the dried solid residue was analyzed through XRD.

2.5. Analytical Techniques

Scanning electron microscopy (SEM) images were obtained using a Quanta 200i 3D electron microscope (FEI Company, Wortham, TX, USA).
X-ray diffraction (XRD) patterns of initial samples and the leaching residues were captured using a D8 Advance diffractometer (Bruker, Ettlingen, Germany), employing CuKα radiation at 40 kV and 40 mA.
The elemental composition of the solids and liquids was analyzed through atomic absorption spectrometry (AAS) using a Savant AA spectrometer (GBC, Kuala Lumpur, Malaysia). The solid samples underwent preliminary decomposition with concentrated nitric acid at a temperature of 90–95 °C and a pressure of 10 atm, using a Tank-Eco microwave decomposition system (Sineo, Shanghai, China).

3. Results and Discussion

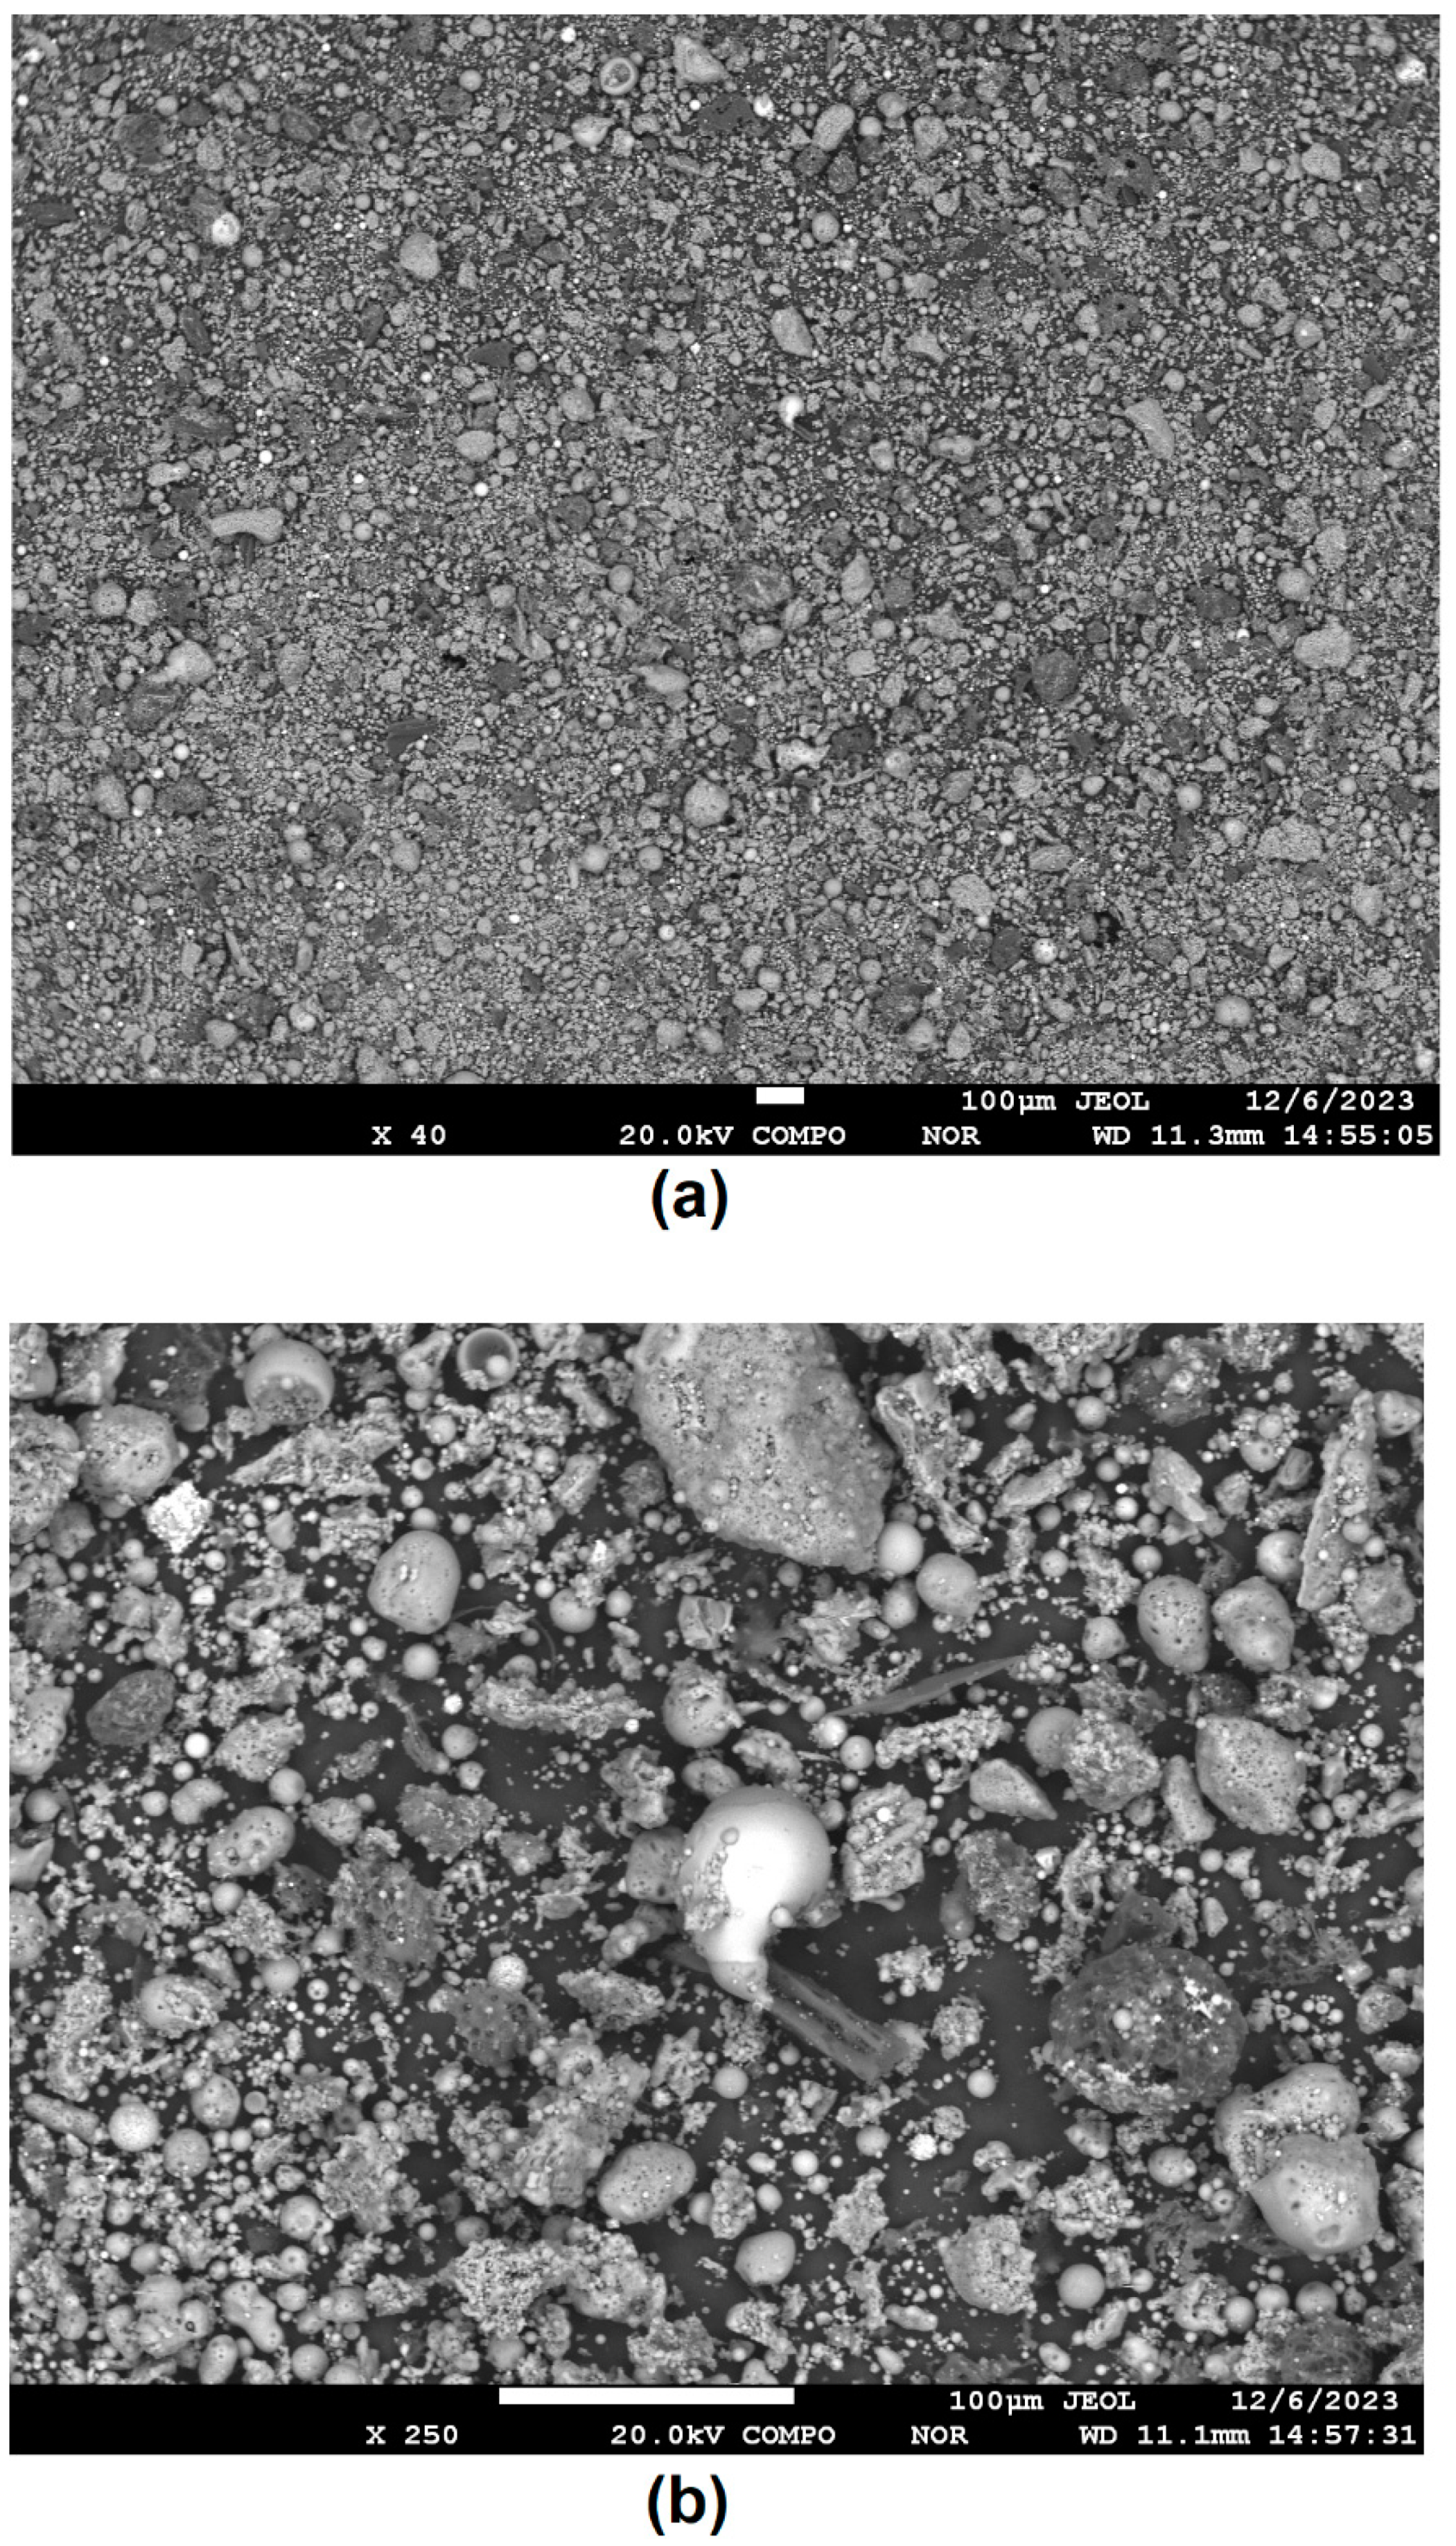
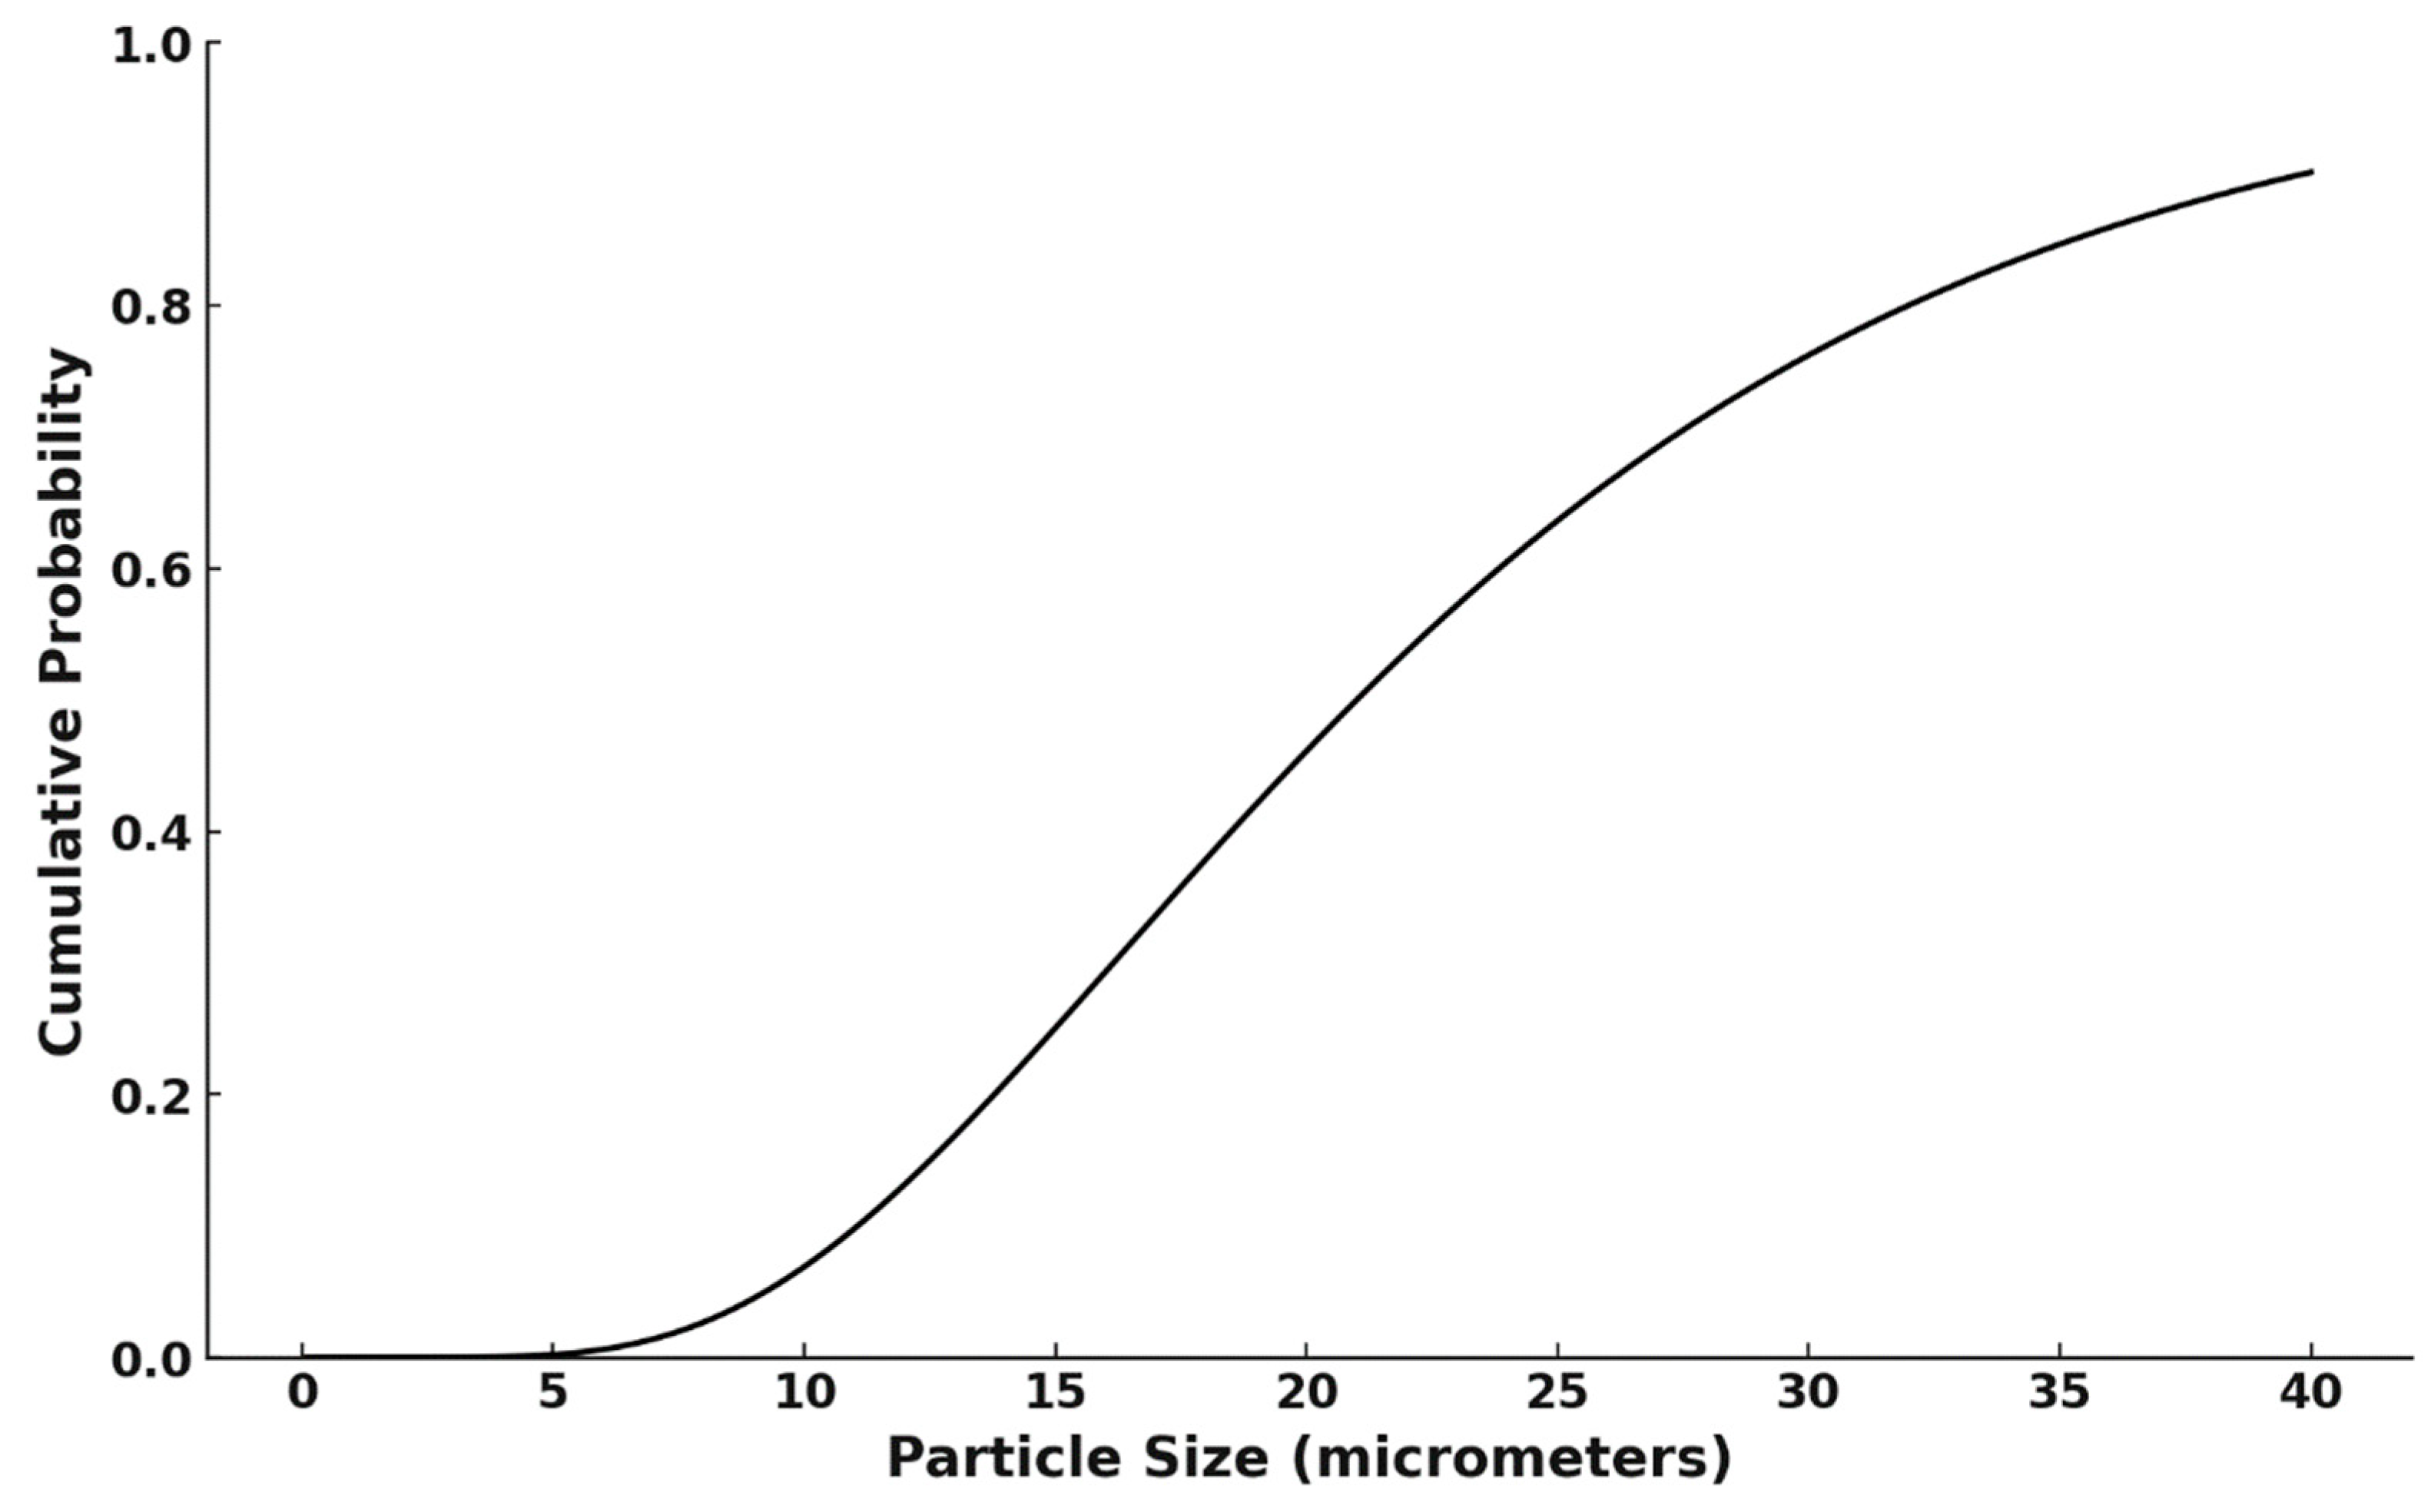
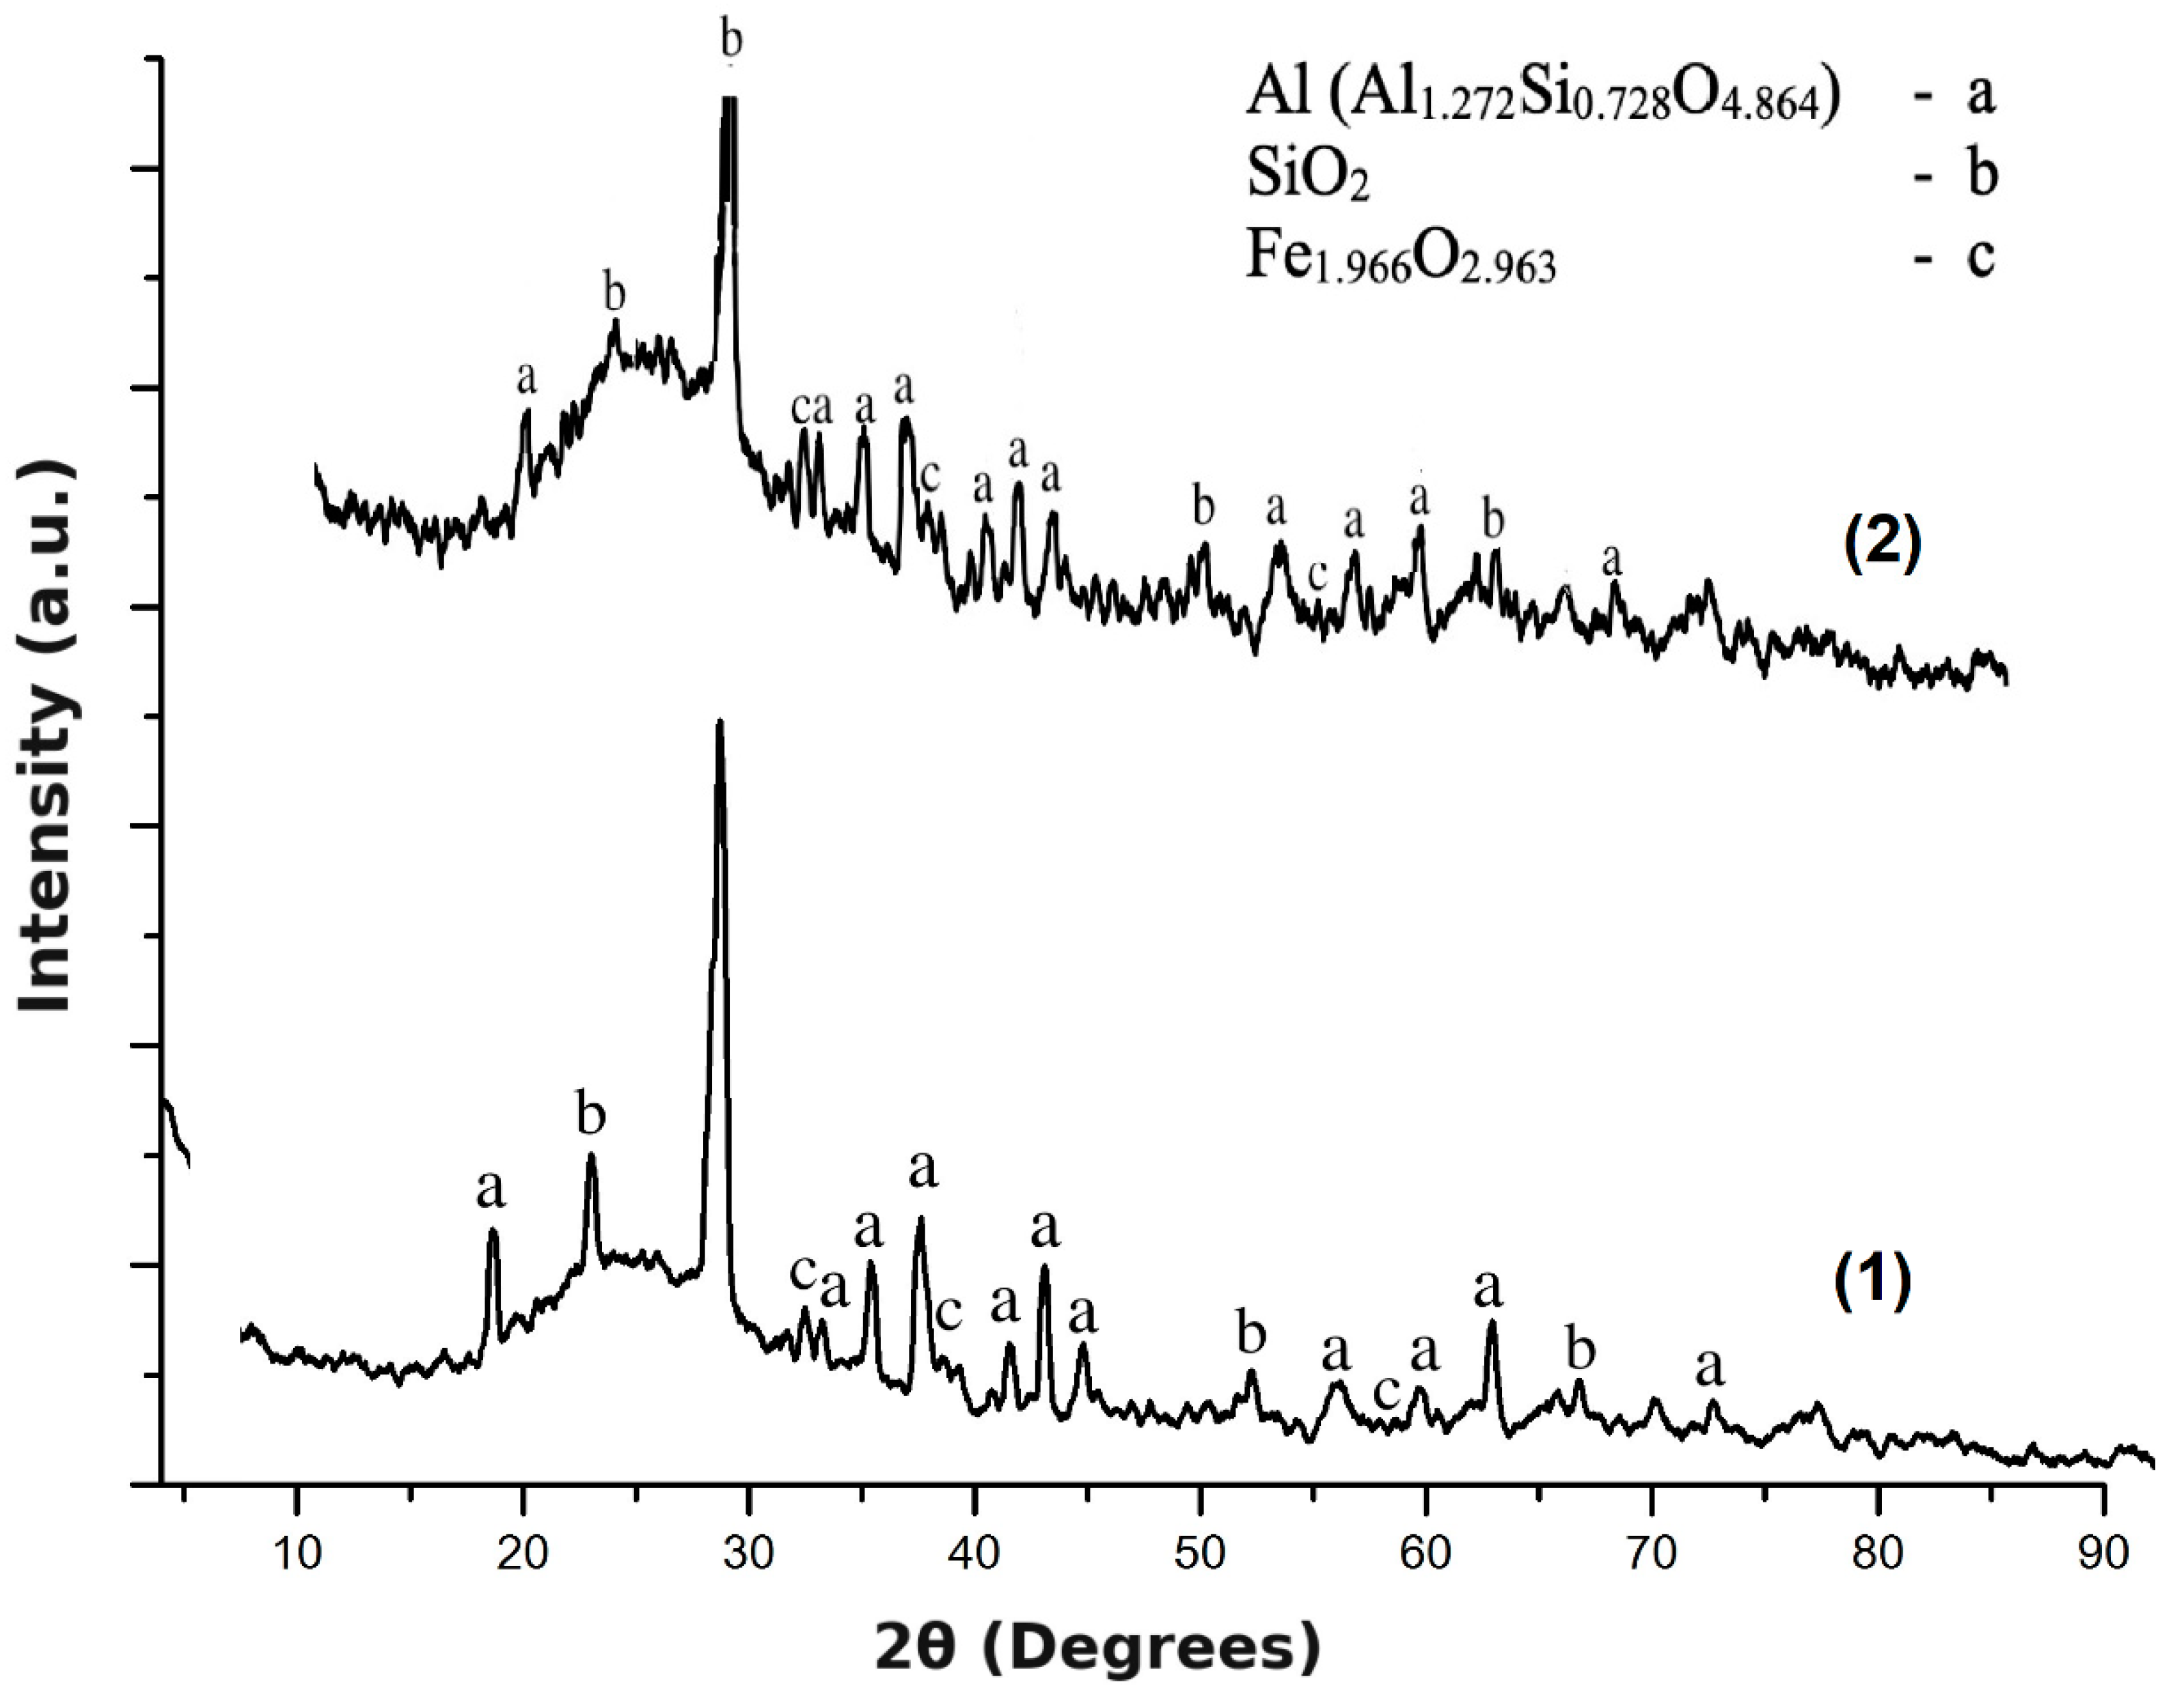
3.1. Characterization of Initial CA and Fraction Obtained

The elemental composition of the CA was wt.%: SiO2—60.14; Al2O3—28.21, Fe2O3—8.17, CaO—4.35, MgO—1.16, Ti—0.68. The following components were found in the sample, ppb: Ce—55682, Y—27582, La—21959.
The masses of the magnetic and non-magnetic parts of all three fractions (<40 µm; −40 + 80 µm; −80 + 100 µm) are given in Table 1.
It can be seen that the yield of the magnetic fraction was 7.8–12.6% by weight of the initial CA, and with increasing particle size, the yield of the magnetic fraction also increased.
The REE content in each of the six studied fractions is shown in Table 2.
The data in Table 2 show that REE was concentrated in the smallest (in terms of particle size) non-magnetic fraction; the highest concentrations of RREs were observed in the <40 μm non-magnetic fraction. The highest degree of enrichment was observed for Ce, the contents of which increased by approximately 1.36 times compared to that in the original CA. The non-magnetic fraction of CA consists mainly of silicates, aluminosilicates, and glassy phases, which are good carriers of rare earth elements. Moreover, rare earth elements tend to form strong complexes with silicon and aluminum oxides and have a lower affinity for magnetite. Thus, it can be concluded that focusing on smaller non-magnetic particles could enlarge the efficiency of REE extraction from CA. Similar observations of REE concentration in the finest non-magnetic fraction were also made by Wu et al. [46]. Based on this, a non-magnetic fraction (<40 µm), weighing 1.9 kg, was taken for further research, hereafter referred to as an untreated CA sample.
XRD patterns of untreated CA samples are presented in Figure 3. Mullite (Al(Al1.272Si0.728O4.864)), quartz (SiO2), and maghemite (Fe1.966O2.963) were identified as major phases of the crystalline part of the sample.
Figure 4 shows SEM images of untreated CA with magnitudes 40 (a) and 250 (b). The particles were irregular in shape and ranged in size from microns to 40 microns. The surface of the particles was smooth, with visible microcracks and porous areas.
The particle distribution has a lognormal shape; the median (D50) is 21 µm, the maximum particle size is 40 µm, and the P80 (D80) value is approximately 29 µm (see Figure 5).

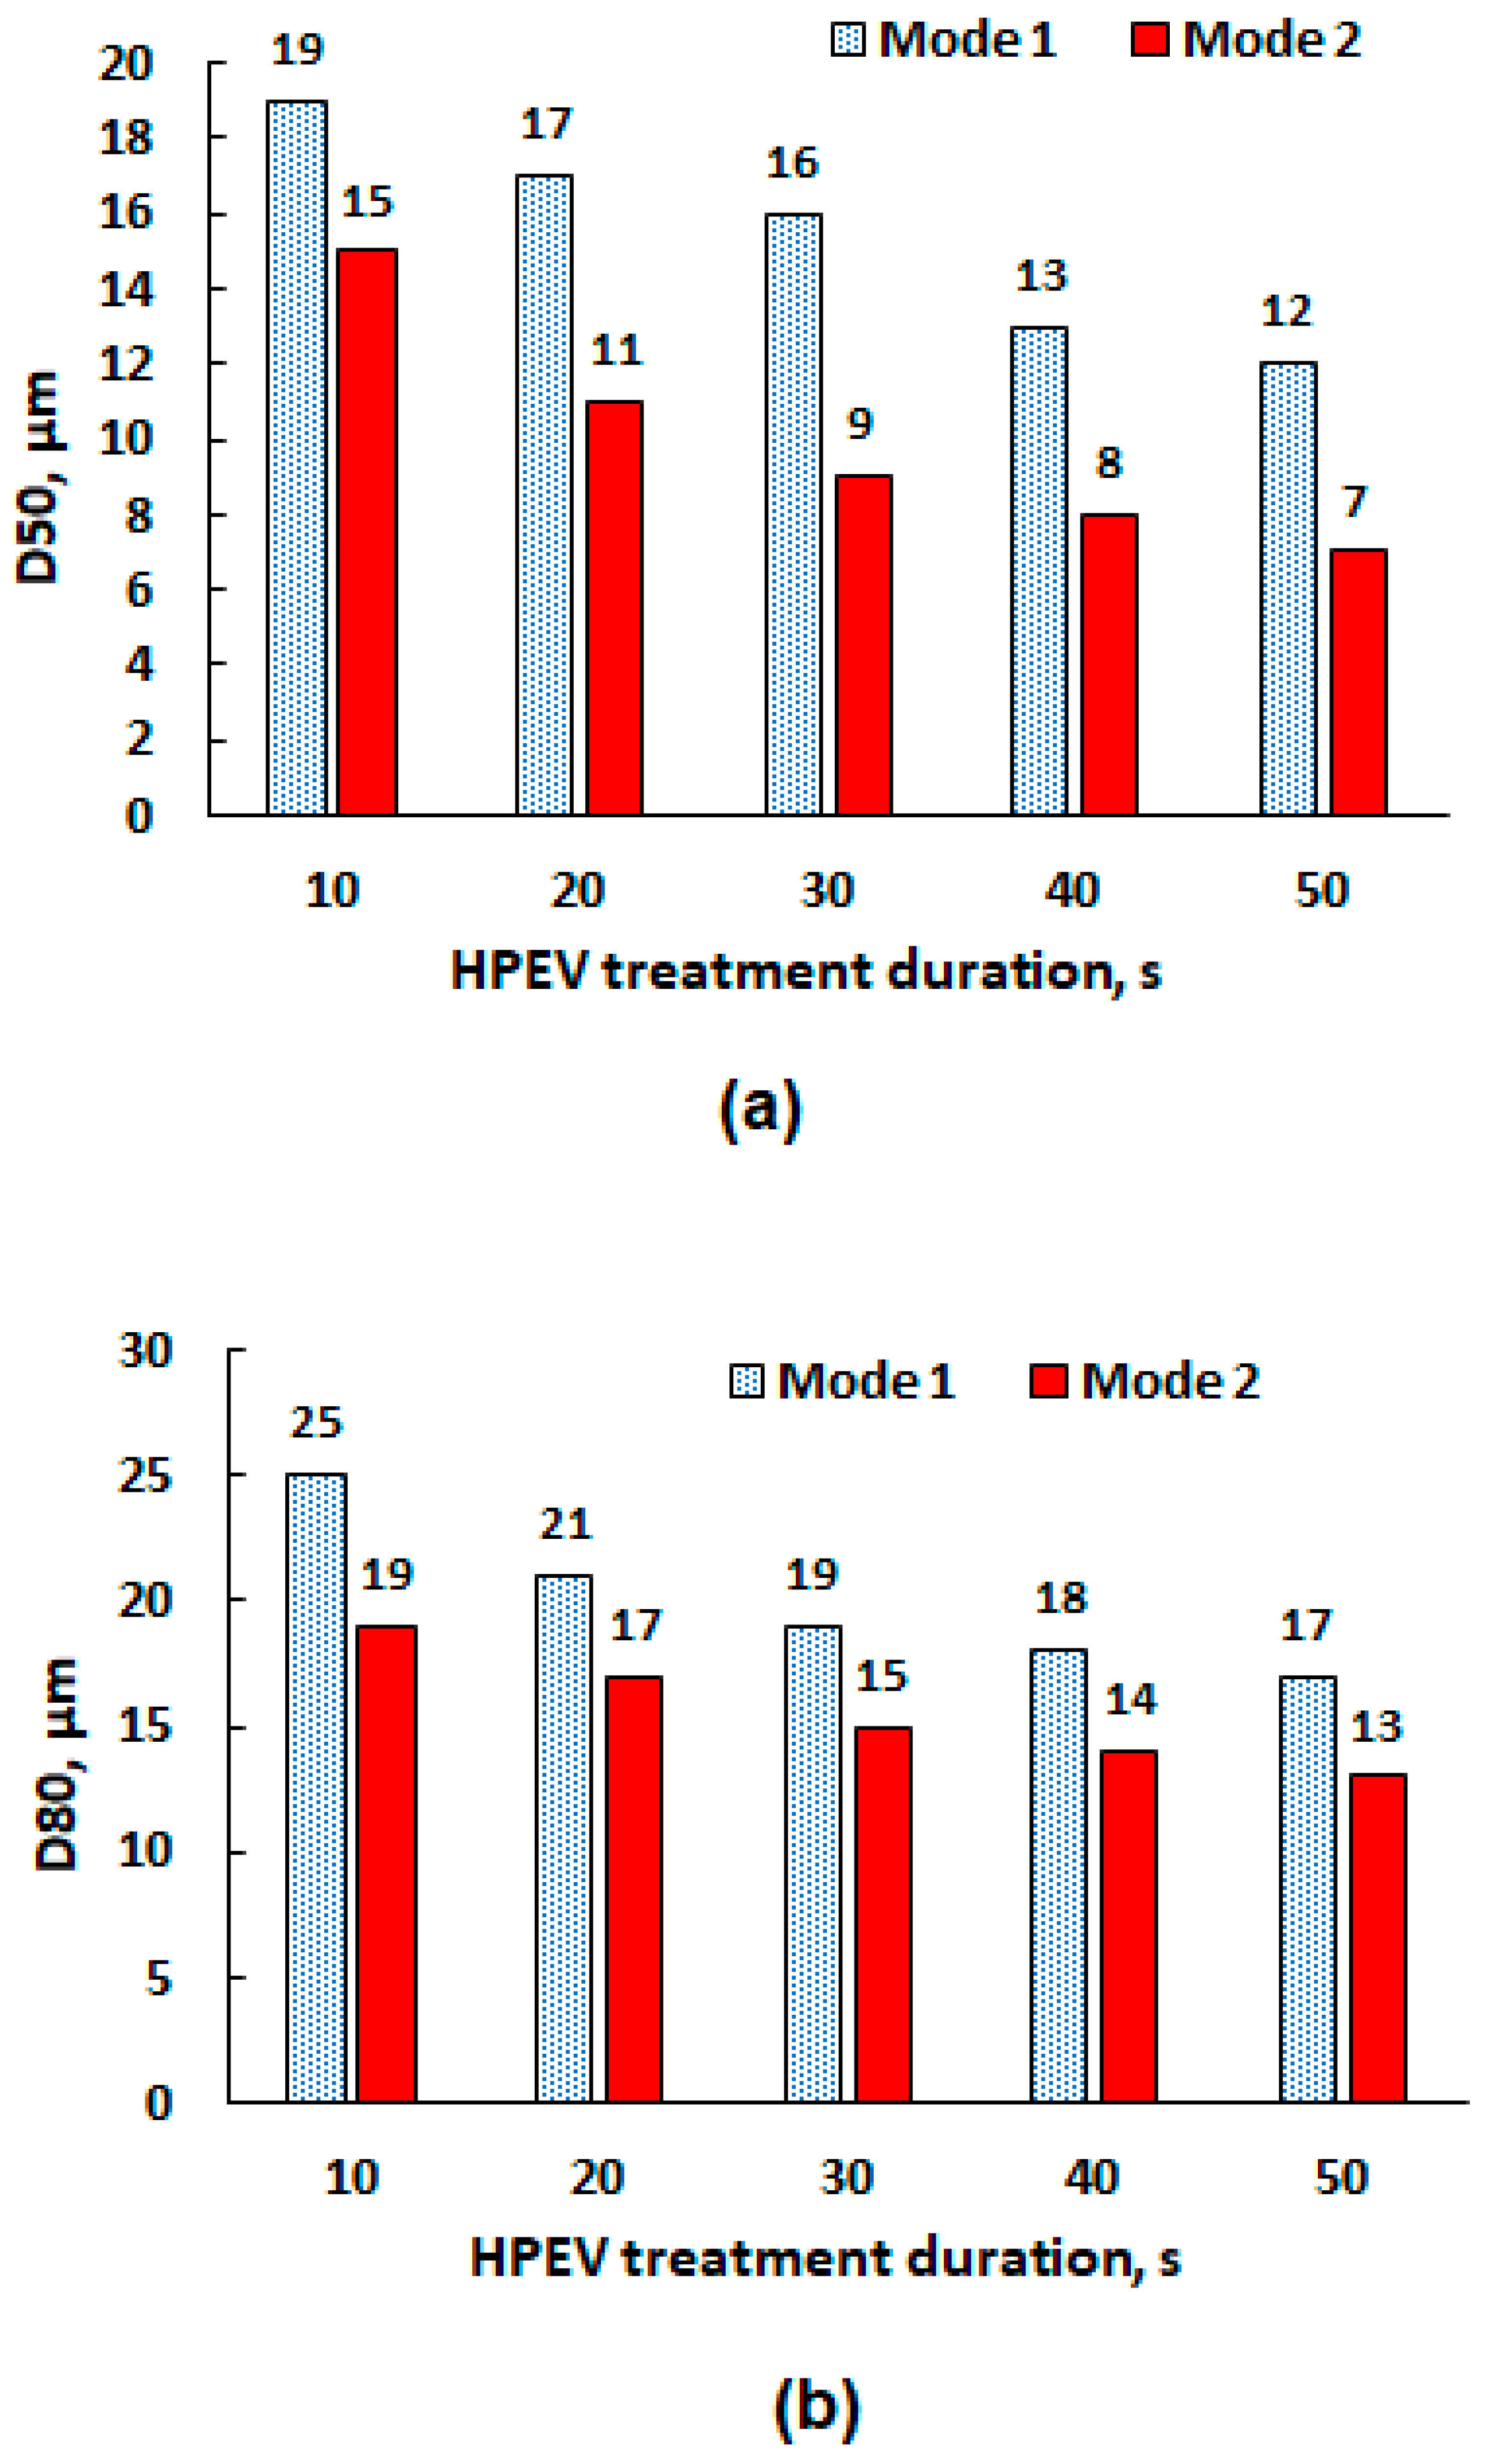
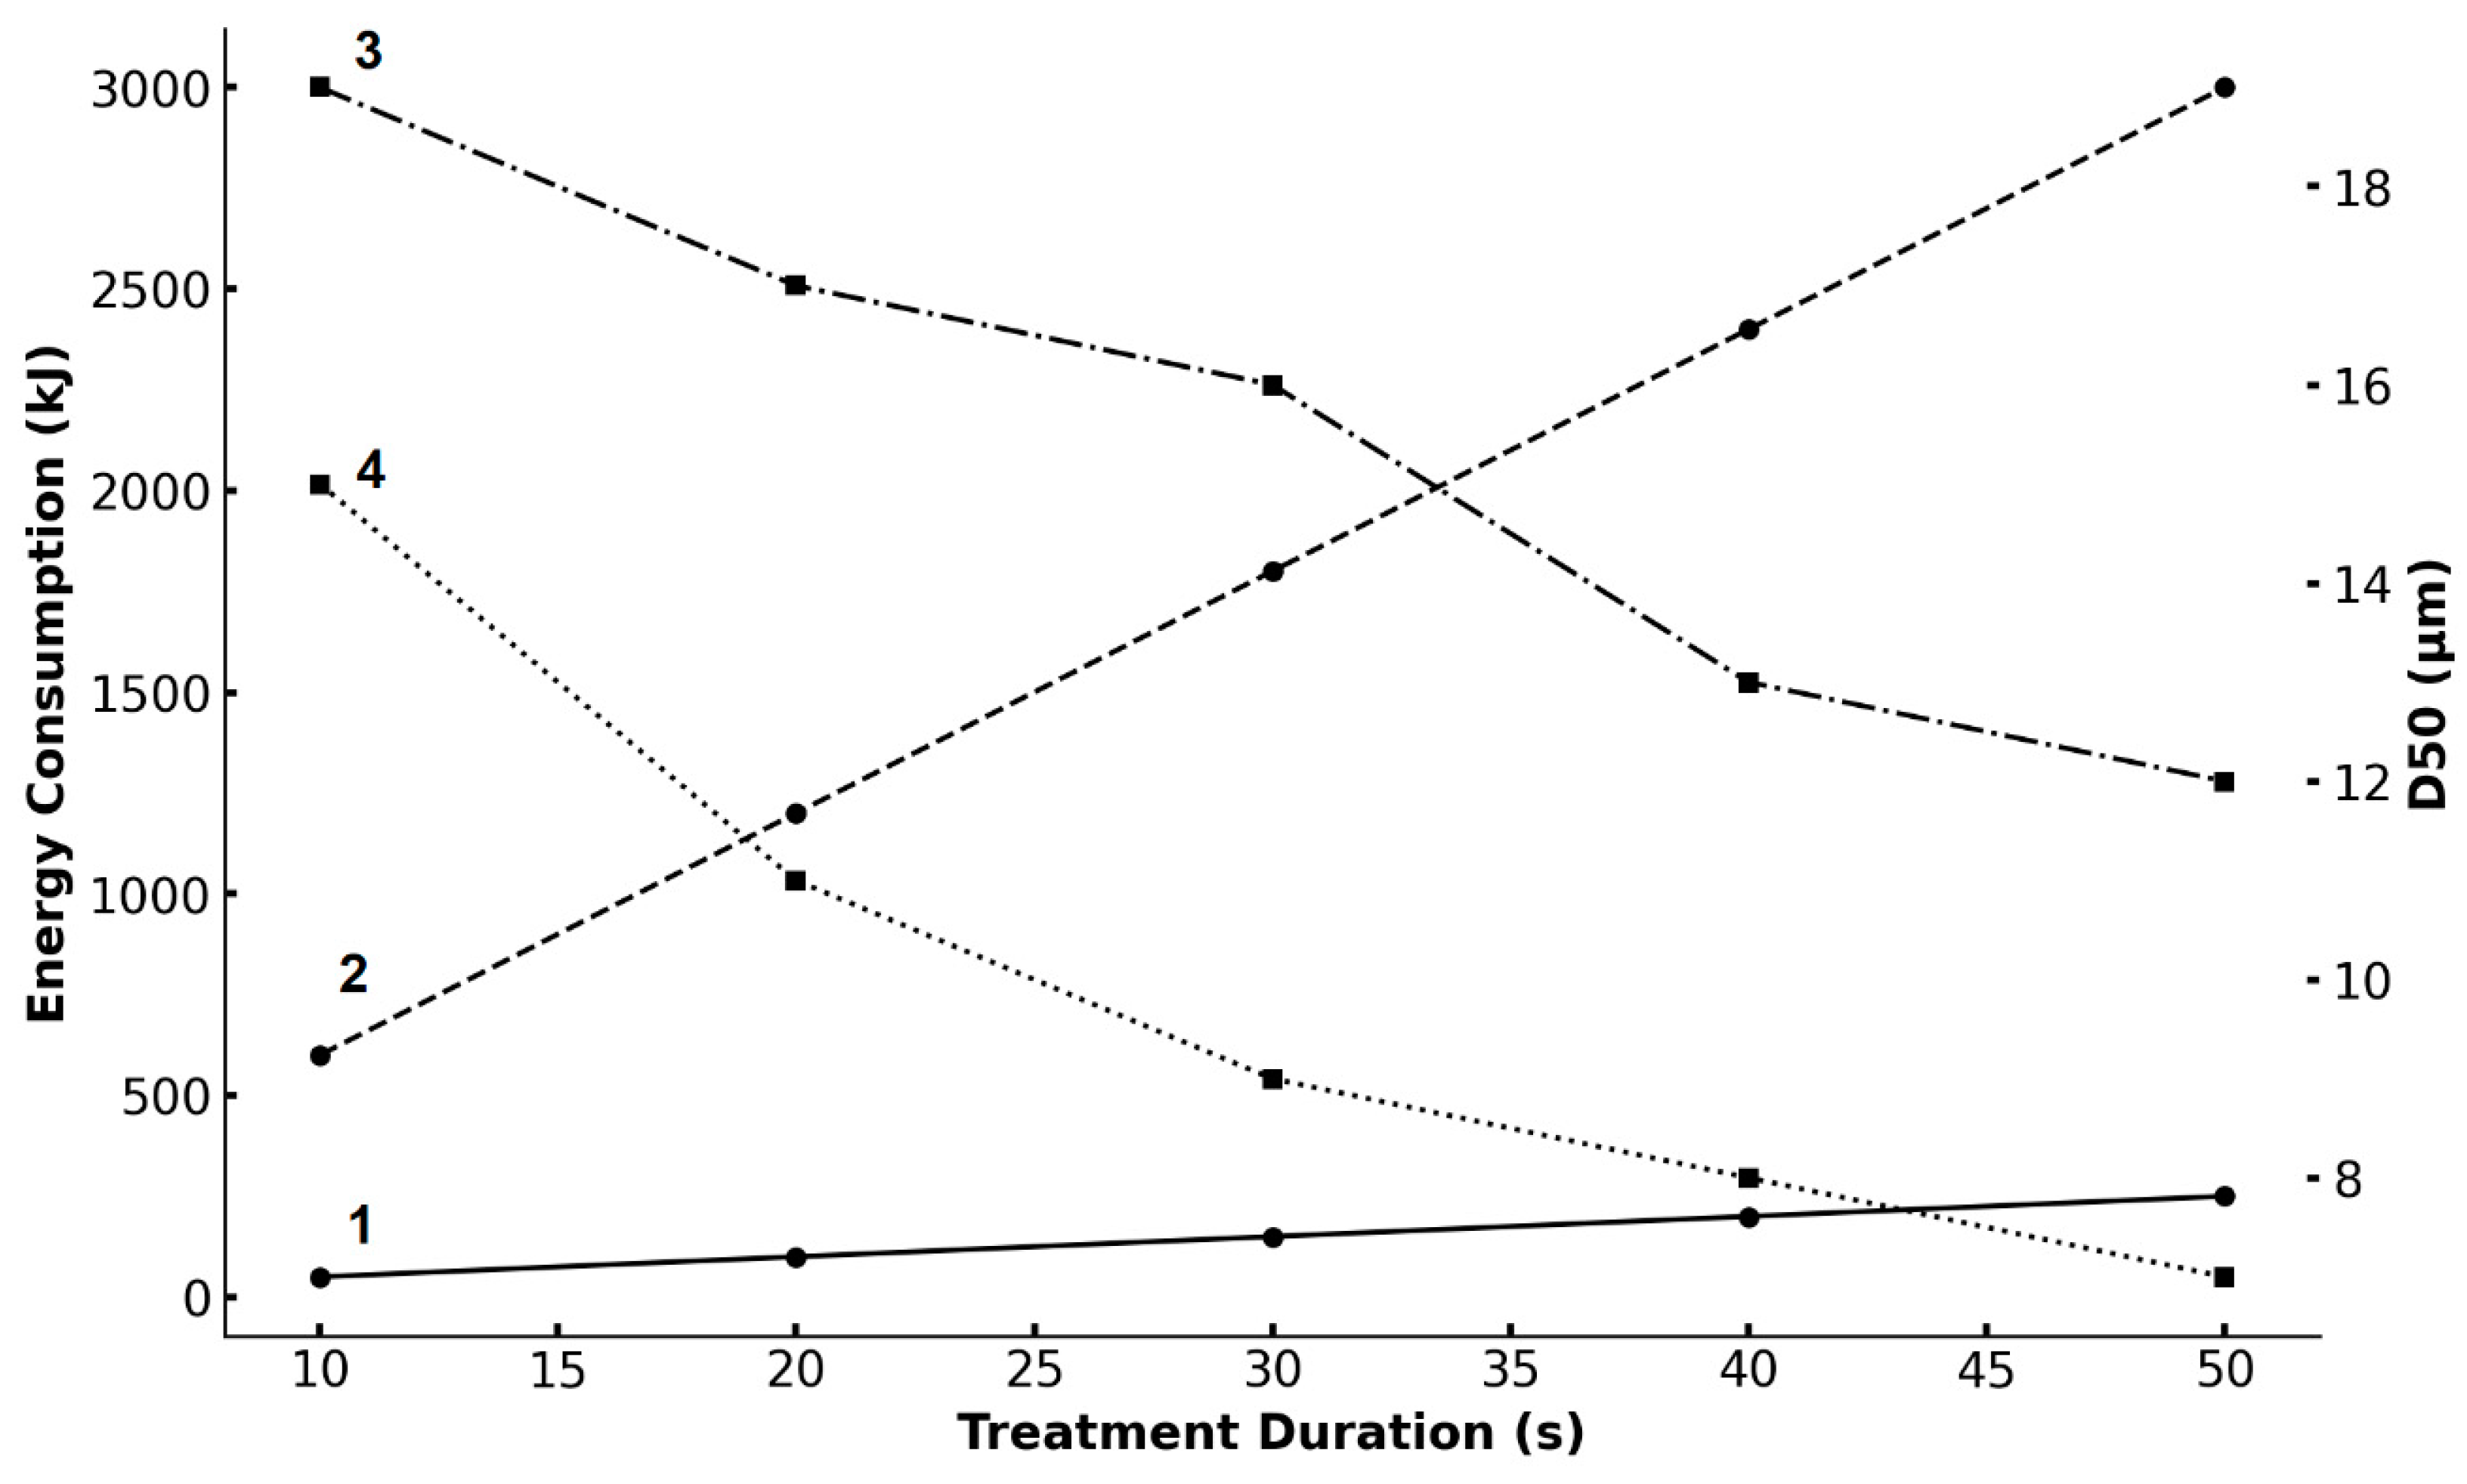
3.2. High-Voltage Pulse Treatment

Figure 6 shows the XRD patterns of CA, treated using HPEV for 50 s in Modes 1 and 2. There is a broadening of the peaks and a decrease in their intensity caused by a reduction in crystallite sizes and an increase in defects within the crystal lattice after exposure to electrical pulses. This indicates an increase in the amorphous content of the treated material, with a greater degree of amorphization observed after treatment in Mode 1, which involved a higher current.
Figure 7 shows the cumulative particle size distribution curve for CA treated by HPEV in Modes 1 and 2 for 30 and 50 s. Increasing the degree of exposure (current intensity and duration of treatment) shifted the distribution curves to the left towards smaller particle sizes. The smallest particle size was observed after treatment in Mode 2 for 50 s (D50 = 7 µm, D80 = 13 µm). The comparative effect of HPEV treatment conditions on the D50 and D80 values of ash is presented in Figure 8a,b.
To select the optimal CA processing mode, energy consumption values for each mode and processing duration were calculated using the following formulas:
E = V × I × τ
E s = E × f
E t o t a l = E s × t
where E is the energy of one pulse, J; V is the voltage, V; τ is the duration of one pulse, s; E s is the energy in one second, J; f is the frequency; E t o t a l is the total energy during treatment, J; t is the treatment duration.
The dependence of energy consumption on the mode and treatment duration is presented in Figure 9; the corresponding D50 values are also shown there.
In both modes, energy consumption increased linearly with treatment duration, but in Mode 2, the growth rate was much higher. The lowest energy consumption occurred in Mode 1 for 10 s (50 kJ), while the highest energy consumption occurred in Mode 2 for 50 s (3000 kJ). Treatment in Mode 2 resulted in lower D50 values than in Mode 1, but the difference was not as significant as the power consumption. In Mode 1, the D50 value decreased from 21 µm (initial CA) to 16 µm (in 30 s) and further to 12 µm (40 s) and 12 µm (50 s).
For leaching experiments, the sample after 40 s treatment in Mode 1 was selected, with an energy consumption of 200 kJ. Taking into account the mass of the initial CA in the chamber (1000 g), the specific energy consumption was about 56 kW h/t, which is acceptable for industrial use.
No significant differences were found in water after HVEP treatment compared to the original water.

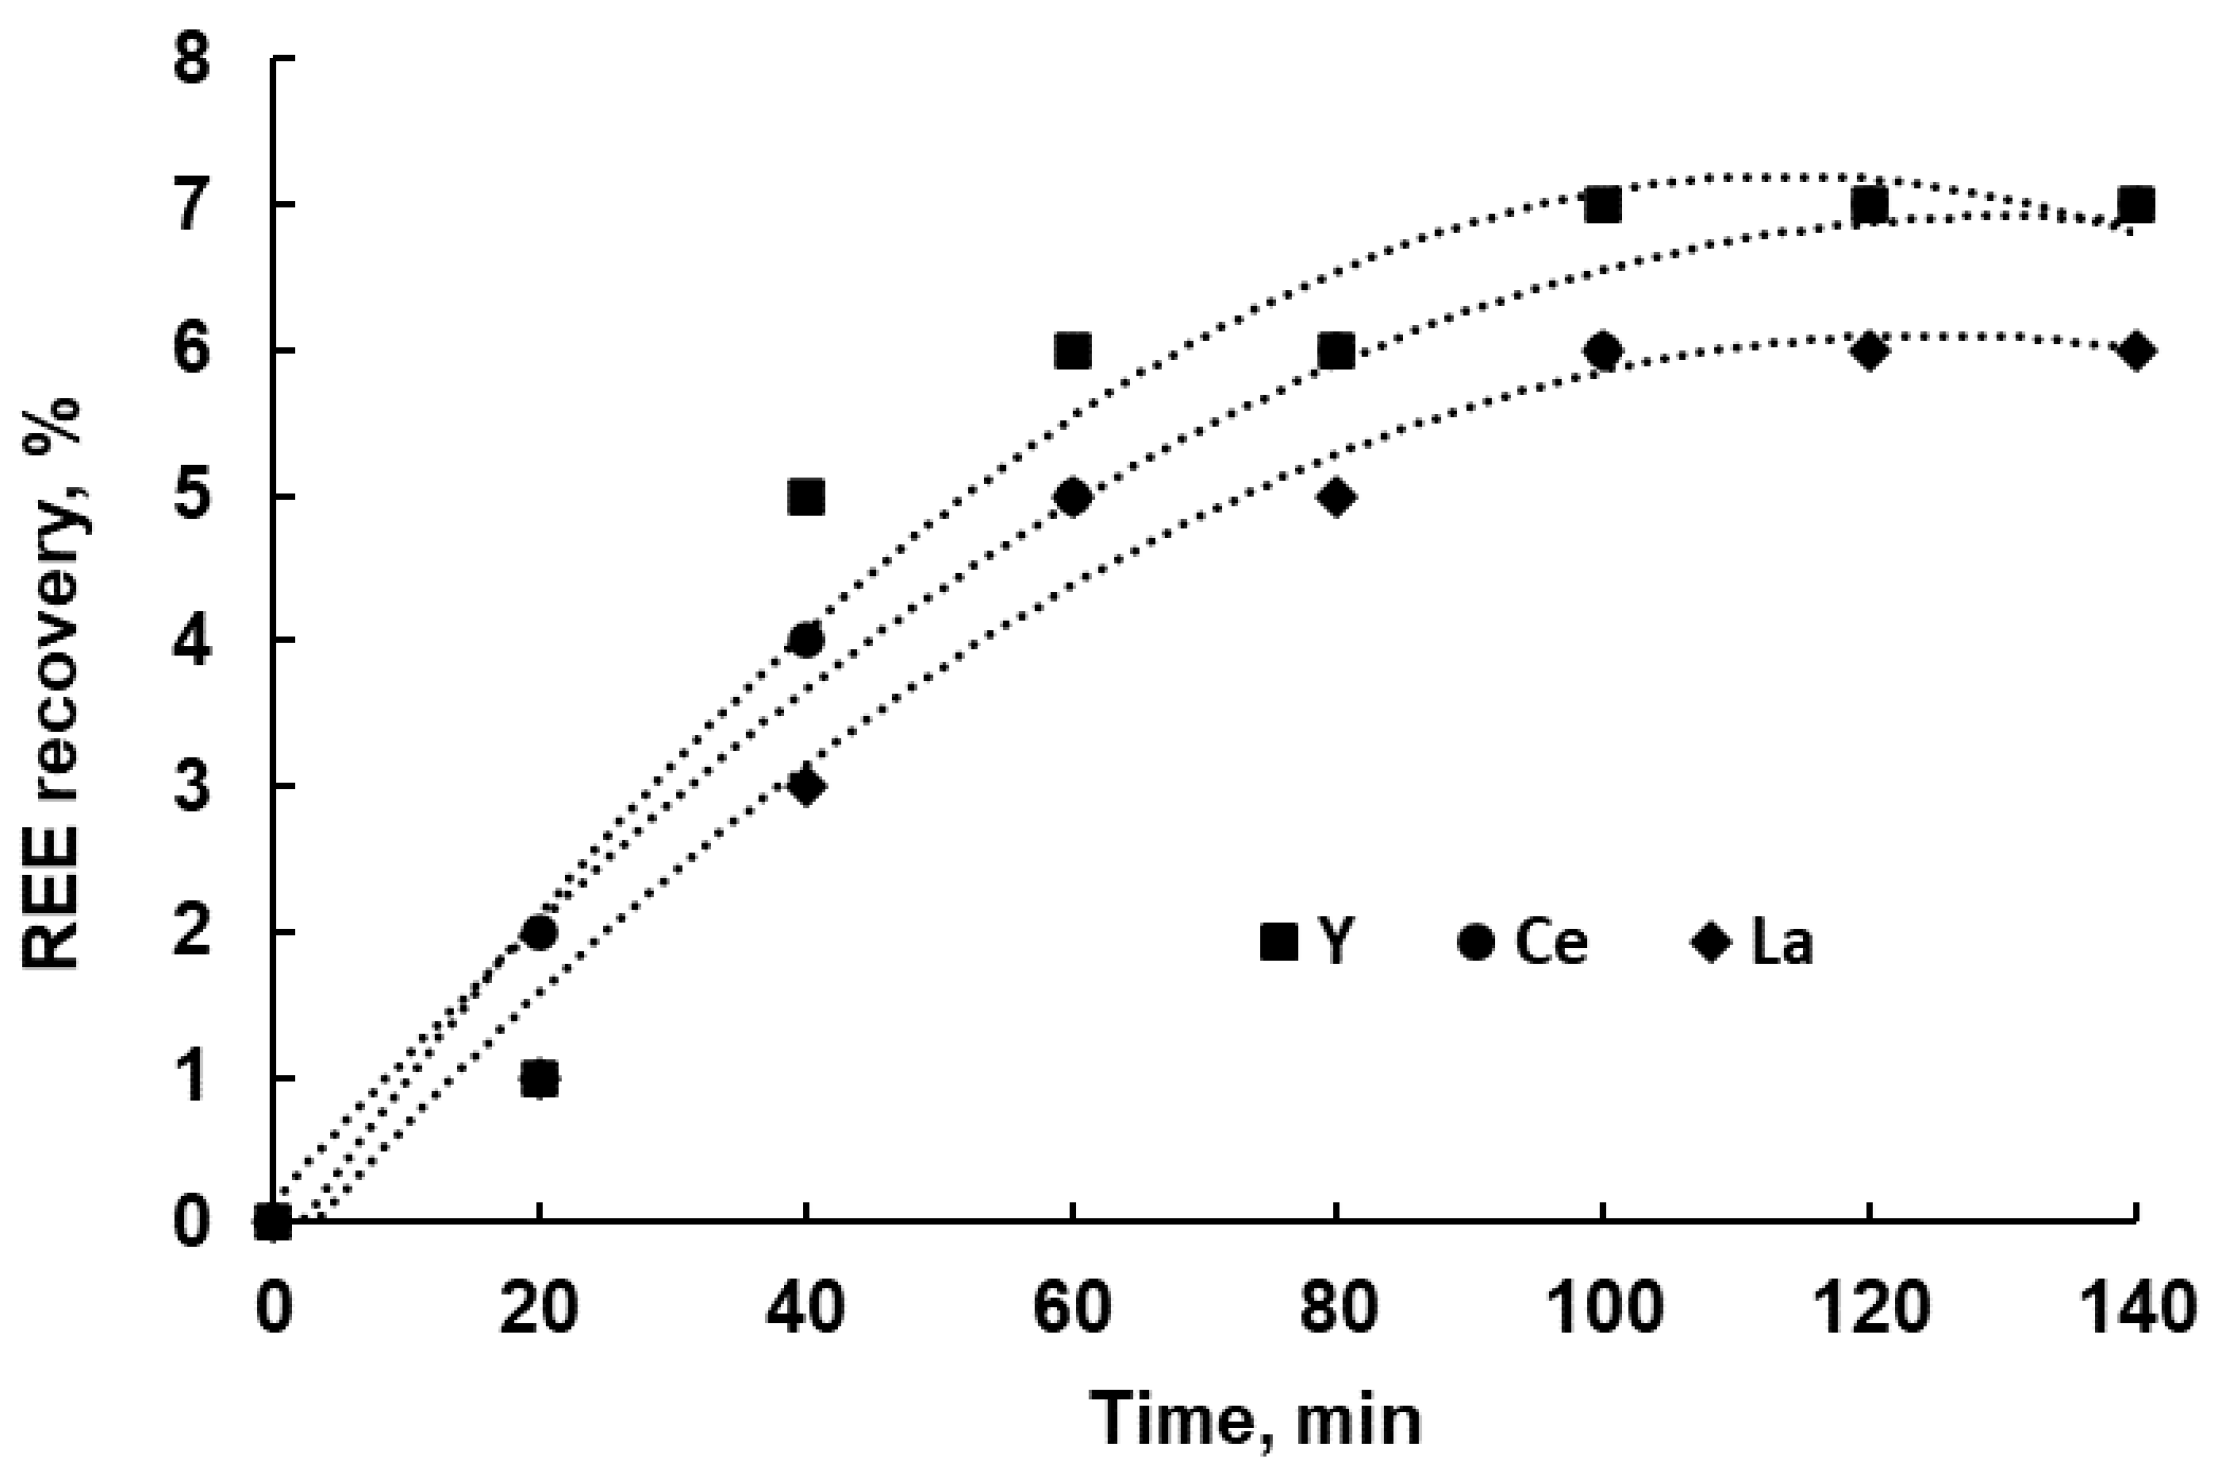
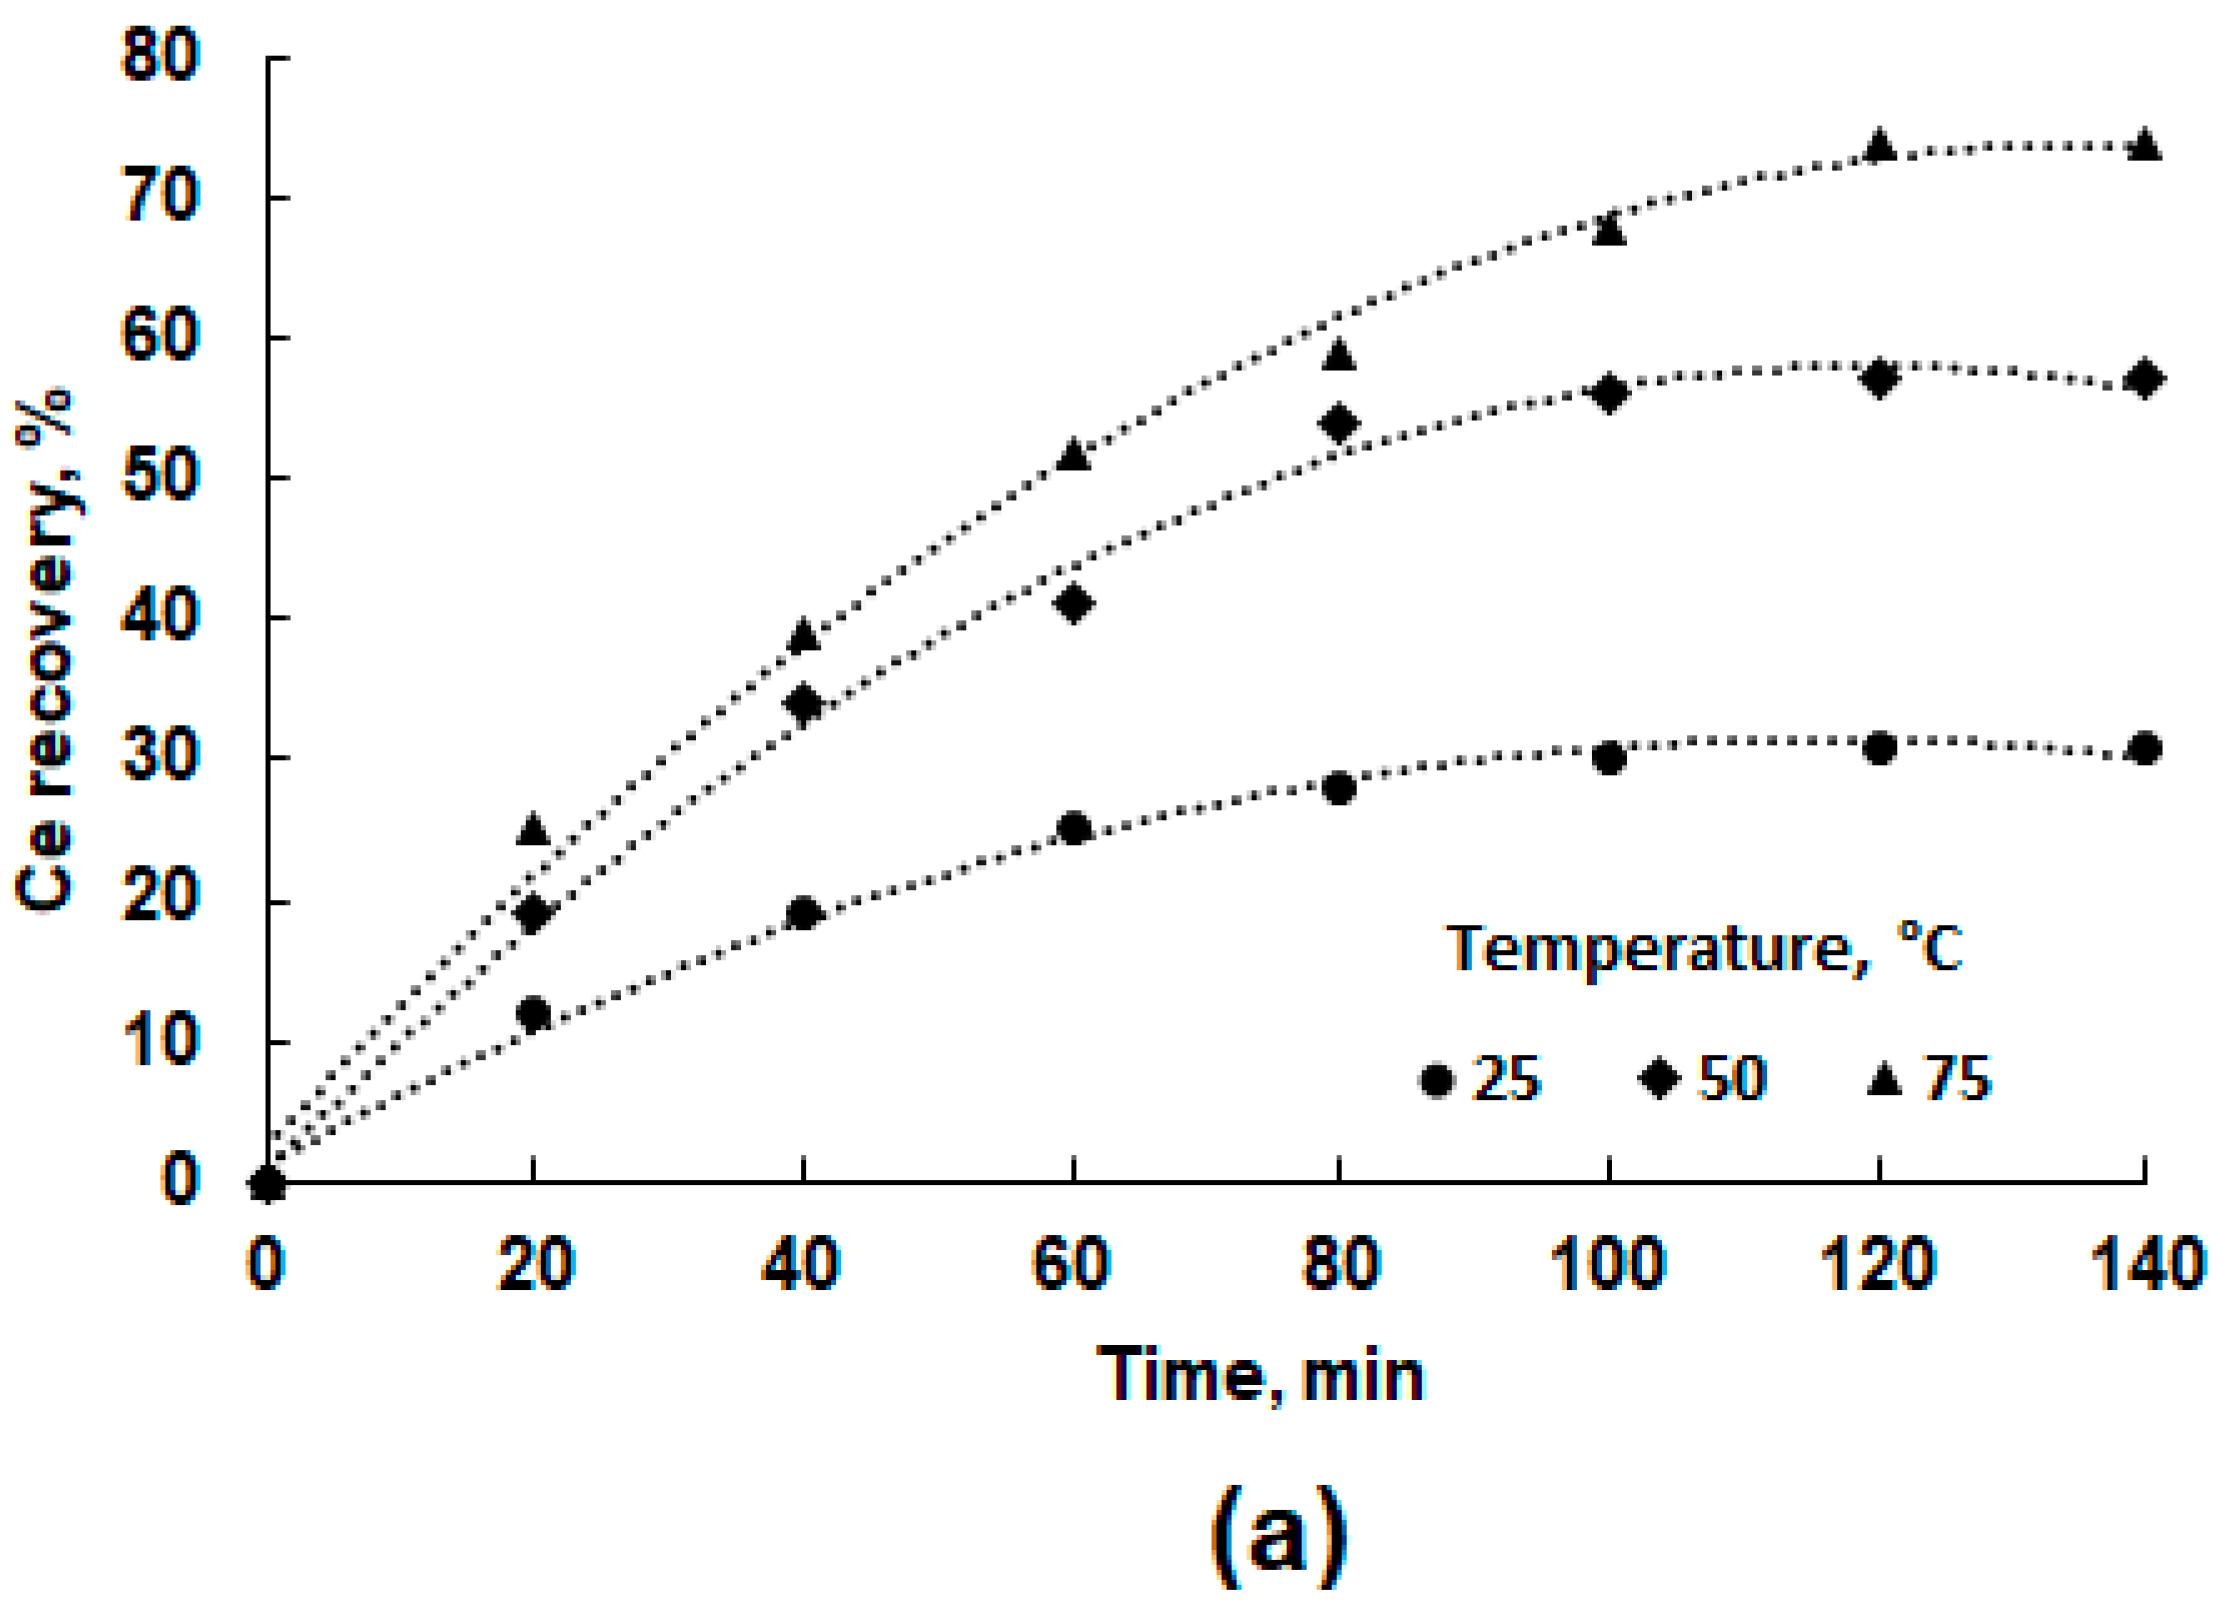
3.3. Leaching Experiments

The first series of leaching experiments were carried out with the original CA sample. Figure 10 shows the dependences of the degree of REEs leaching from the original (untreated) CA sample on the leaching duration under the following conditions: 1 M citric acid, S:L = 100 g/L, 25 °C.
The extraction of REEs did not exceed 7% for the entire leaching time (140 min). This indicator cannot be considered satisfactory from a practical point of view.
Subsequent leaching experiments were performed with the CA sample treated with HVEP in Mode 1 for 40 s. Figure 11 shows the dependences of Ce, Y, and La recovery on the S:L ratio and the duration of leaching in 1 M citric acid solution at 25 °C.
Recovery efficiencies for all three metals increased with leaching time but decreased with higher S:L value, with Y showing the highest efficiency. The optimal ratio was 100 g/L for all three metals. For Ce, recovery efficiency increased with time, reaching 32% at a 10 g/L ratio after 100 min, and decreased with higher S:L ratios, achieving only 19% at 700 g/L after 140 min. La followed a similar pattern, with 33% extraction at 10 g/L after 120 min, dropping to 17% at 700 g/L after 140 min. Y showed the highest recovery, reaching 39% at 10 g/L after 140 min and 24% at 700 g/L.
Reducing the S:L value from 300 to 100 g/L reduced the maximum recovery of all metals considered by only 2–3%; at the same time, a three-fold decrease in S:L significantly worsens the technical and economic indicators of the process. Therefore, further leaching studies were carried out at S:L = 300 g/L.
The next series of experiments was aimed at identifying the effect of temperature on REE recovery at different leaching times. (Figure 12a–c). Increasing the temperature significantly boosted the extraction efficiency of all three metals. For Ce, extraction at 25 °C plateaued at 31% after 100 min of leaching. In contrast, at 75 °C, the extraction rate surged to 74% after 120 min. La exhibited similar trends to Ce but with slightly higher efficiency: 77% extraction after 120 min, which then stabilized. Y showed the highest extraction rates; at 25 °C, 36% was extracted after 140 min, while raising the temperature to 75 °C resulted in 79% extraction after just 120 min.
Thus, the following CA treatment conditions are optimal for the extraction of La, Y, and Ce in 1 M citric acid:
(1).
HPEV treatment under the conditions of a rod separation distance of 1.0 mm, a discharge current of 10 A, a voltage of 10 kV, a frequency of 1 kHz, a pulse duration of 50 µs, treatment duration of 40 s;
(2).
Leaching at 75 °C, S:L = 300 g/L, 120 min, 300 rpm.
Under these conditions of CA treatment, metal extractions and their content in solution after leaching were: La 77% (7 mg/L), Y 79% (8 mg/L), Ce 74% (21 mg/L).
To answer the question of whether these REE recovery rates are due solely to the reduction in CA particle size, CA was leached at the same dispersion as after HVEP (Mode 1, treatment duration 40 s); however, this dispersion was achieved by mechanical grinding in a planetary mill for 15 min. The results are shown in Figure 13. It can be seen that the REE extraction in 1 M citric acid solution at 25 °C and S:L = 100 g/L did not exceed 28% over the entire leaching period (140 min). Thus, the role of HVEP in increasing the recovery of REEs in CA leaching is not only to reduce particle size but also to increase their chemical activity when interacting with citric acid.

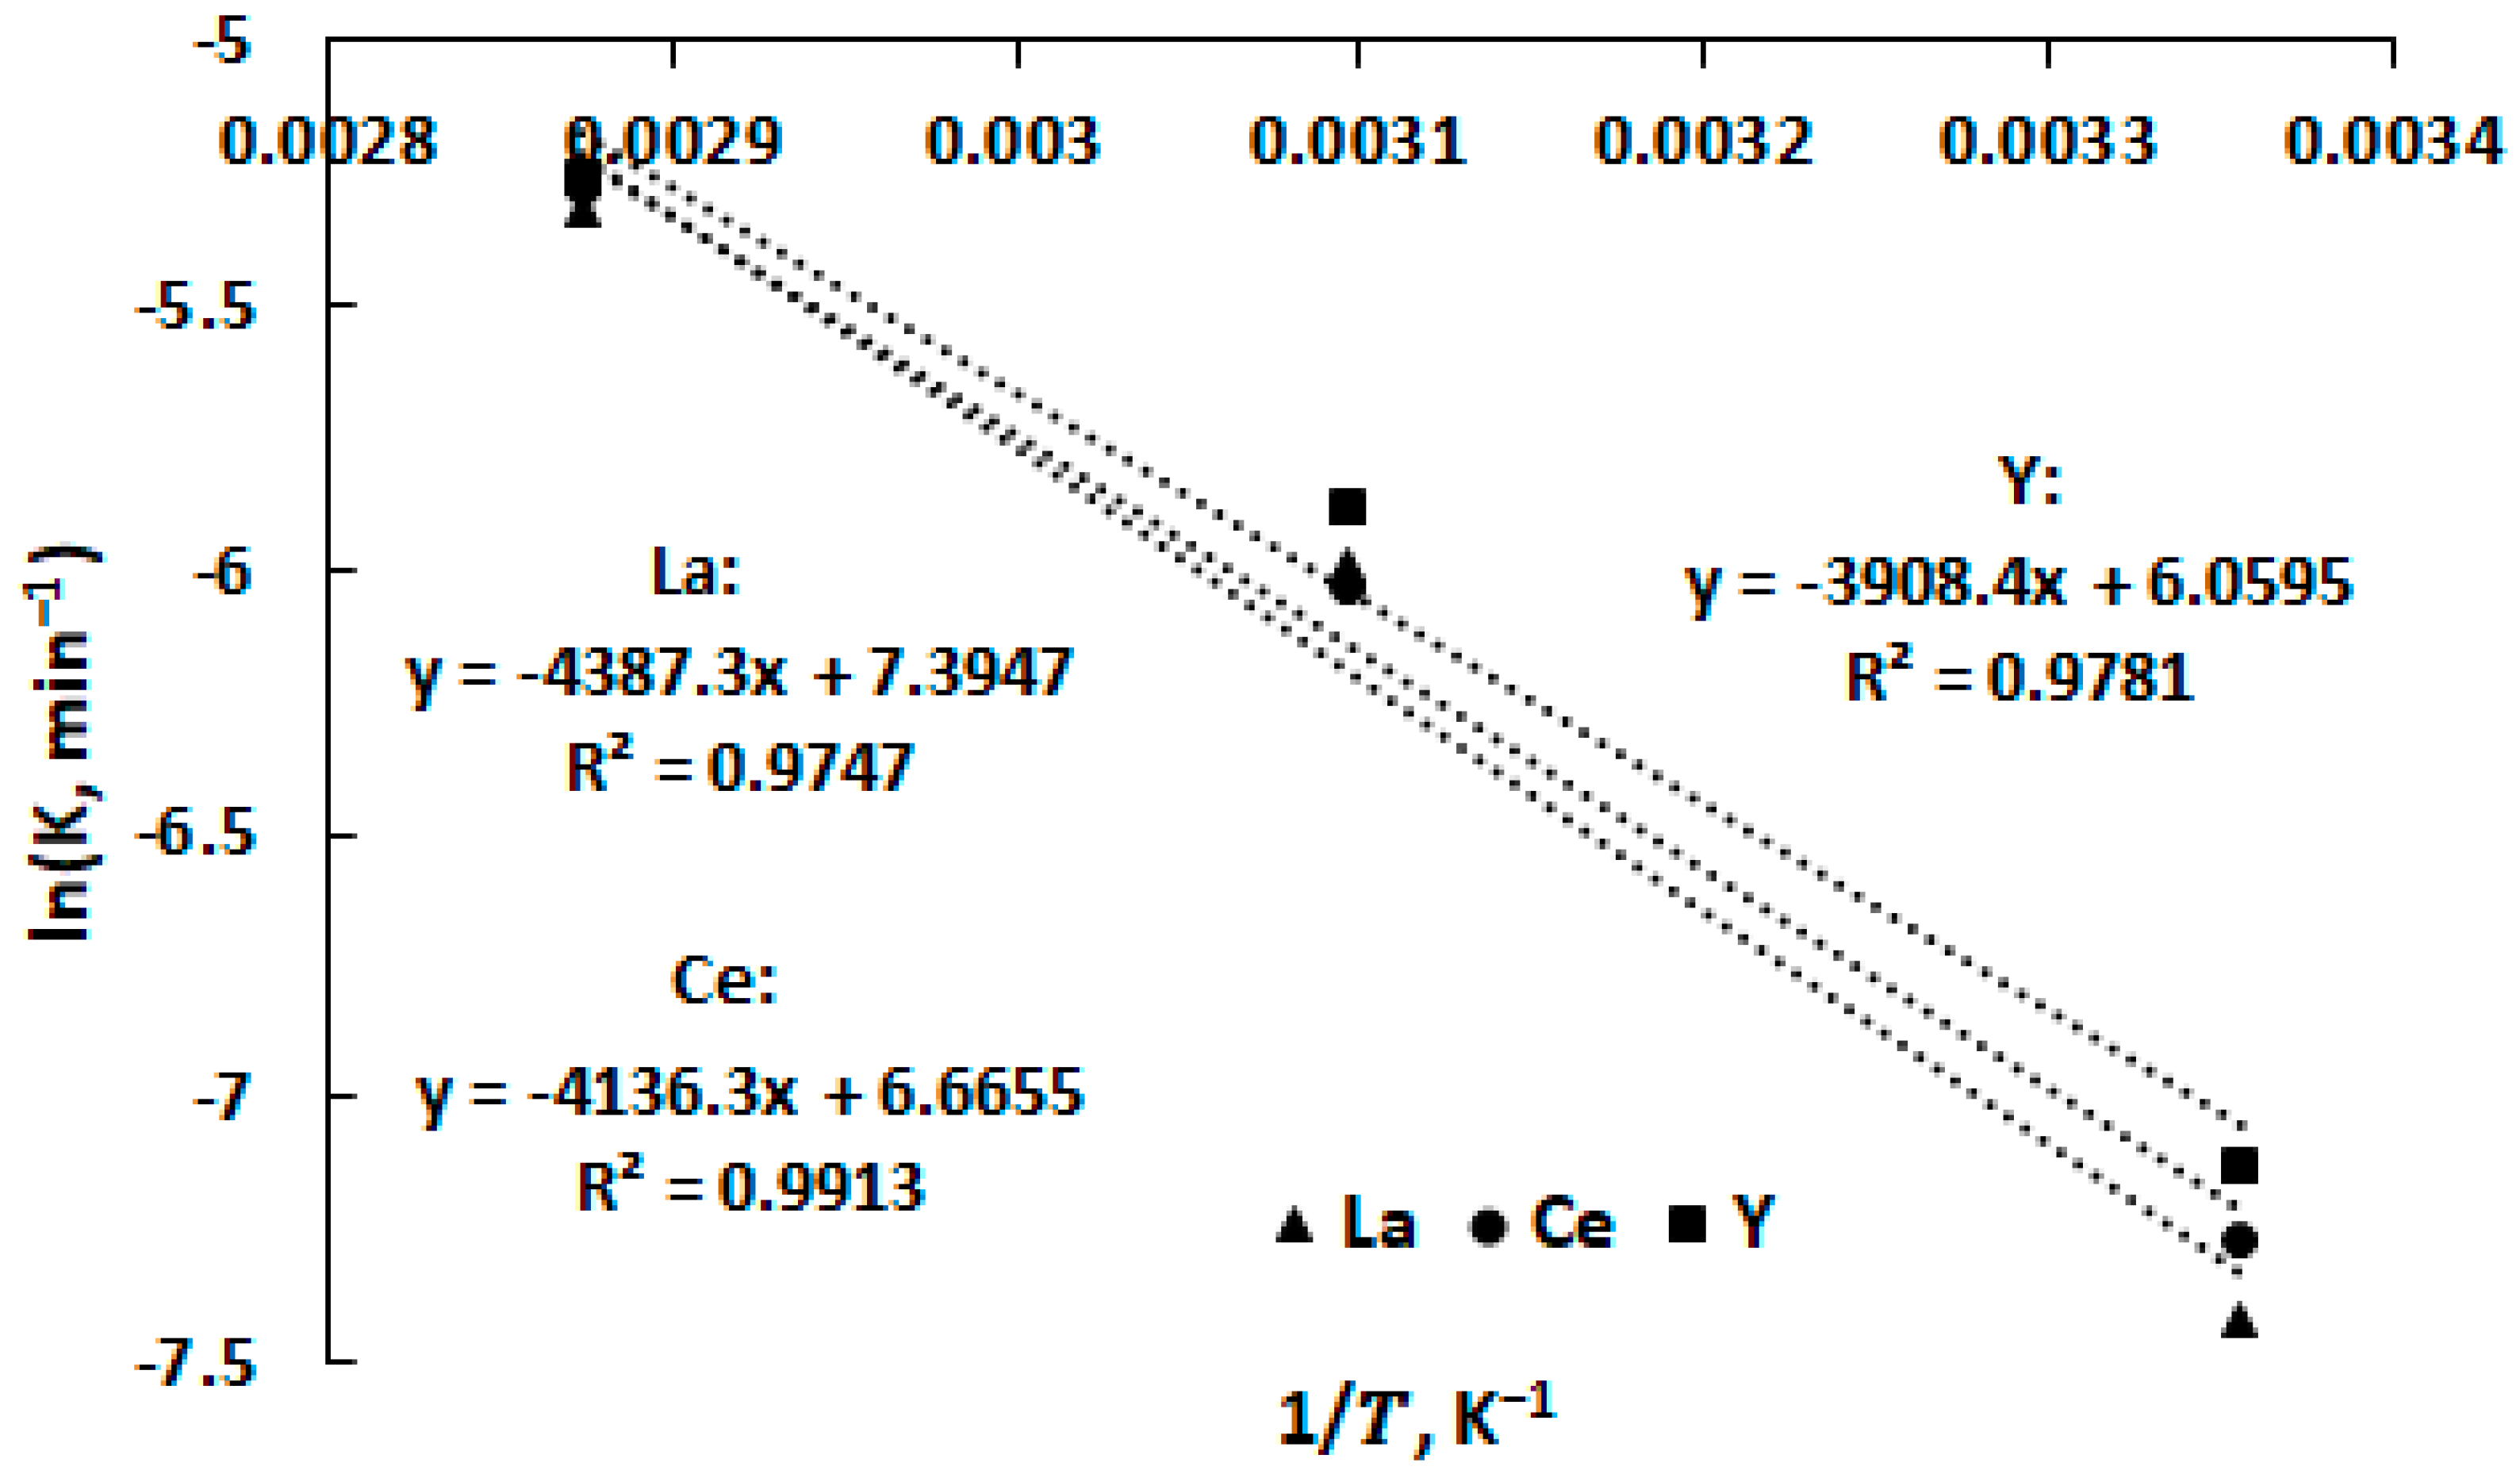
3.4. Leaching Kinetics

In studying the kinetics of leaching, the so-called shrinking core model is most often used [47,48,49]. According to this model, the leached particles are represented as spheres; over the course of leaching, the surface of the spheres dissolves uniformly. This leads to a decrease in the radius and volume of the spheres, although the shape of the spheres is preserved. Depending on which stage of the leaching process is the slowest (i.e., limiting), the following linear dependencies are observed:
1 2 3 X ( 1 X ) 2 3 = k τ
1 ( 1 X ) 1 3 = k τ
1 3 ln 1 X 1 + ( 1 X ) 1 3 = k τ
where X is the fraction of solid leached, k is the rate constant of chemical reaction of leaching, and τ is the leaching time.
Equation (5) describes leaching processes in which the rate-limiting step is the transfer of the leaching agent to the target solid (diffusion). If the rate-limiting step is the dissolution of the target mineral (chemical reaction), the process is described by Equation (6). If both diffusion and the rate of chemical reaction are rate-limiting steps, then Relationship (7) holds.
The data presented in Figure 12 were used to construct Dependencies (5)–(7), and for all three metals at the three temperatures studied, the determination coefficients R2 were determined (Table 3).
The data in Table 3 show that Equation (6) most closely describes the leaching processes of all three metals; this means that the rate-limiting step is the chemical reaction of dissolution of the target metal.
The data in Figure 10, in combination with Equation (6), were used to create plots of 1 ( 1 X ) 1 3 vs. leaching time for all studied temperatures (Figure 14).
The slopes of the equations of the straight lines in Figure 14 are equal to the rate constants of the leaching reaction; these values are summarized in Table 4.
Arrhenius plots for REE extraction from CA were created using the rate constants presented in Table 4; these plots are shown in Figure 15.
The high R2 values for all three metals indicate that the extraction of REE into solution follows first-order kinetics, and the temperature dependence of the reaction rate is fully described by the Arrhenius model [50]. It should be noted that the REE extraction process follows the same mechanism at different temperatures. The absence of significant deviations from linearity indicates the stability of the extraction mechanism and its insensitivity to changes in conditions other than temperature.
Using Arrhenius’s law (Equation (8)) [50], the activation energy (Ea) of the overall chemical reaction determining REE extraction into solution was calculated:
l n k = E a R T
where k is the rate constant of chemical reaction (min−1), R is the universal gas constant (J/(mol × K)), and T is absolute temperature (K).
The activation energies of the leaching reactions of Ce, Y, and La were kJ/mol: Ce—34.4, Y—32.5, La—36.5. The activation energy values for all three elements are in a narrow range, which indicates the similarity of their leaching mechanisms. In addition, the Ea values indicate the correctness of the assumption that the limiting stage for the leaching of all three REEs is the chemical reaction.

4. Conclusions

This study demonstrates for the first time the potential of high-voltage electrical pulses (HVEP) as an effective pretreatment method for enhancing the leaching efficiency of rare earth elements (REE) from coal ash (CA) in 1 M citric acid. Optimal conditions for HVEP treatment were identified as a rod separation distance of 1.0 mm, discharge current of 10 A, voltage of 10 kV, frequency of 1 kHz, pulse duration of 50 µs, and treatment duration of 40 s. Leaching tests conducted on HVEP-treated CA showed enhanced REE recovery rates. The optimal leaching conditions were determined to be a temperature of 75 °C, a solid-to-liquid ratio of 300 g/L, and a leaching duration of 120 min at a stirring speed of 300 rpm. Under these conditions, the recovery achieved was 74% for Ce, 79% for Y, and 77% for La. The leaching process followed first-order kinetics, with the rate-limiting step being the chemical reaction of the dissolution of the target metals.

Author Contributions

Conceptualization, T.K. and R.N.; methodology, K.K. and L.M.; investigation, L.M. and A.B.; resources, R.N. and T.K.; writing—original draft preparation, R.N.; writing—review and editing, T.K.; visualization, A.B. and K.K.; project administration, T.K.; funding acquisition, R.N. All authors have read and agreed to the published version of the manuscript.

Funding

This research was funded by the Science Committee of the Ministry of Science and Higher Education of the Republic of Kazakhstan (Grant no. BR21882017).

Data Availability Statement

Data are contained within the article.

Conflicts of Interest

The authors declare no conflict of interest.

References

  1. Peelman, S.; Sun, Z.H.; Sietsma, J.; Yang, Y. Leaching of rare earth elements: Review of past and present technologies. In Rare Earths Industry; Elsevier: Amsterdam, The Netherlands, 2016; pp. 319–334. [Google Scholar] [CrossRef]
  2. Balaram, V. Rare earth elements: A review of applications, occurrence, exploration, analysis, recycling, and environmental impact. Geosci. Front. 2019, 10, 1285–1303. [Google Scholar] [CrossRef]
  3. Charalampides, G.; Vatalis, K.I.; Apostoplos, B.; Ploutarch-Nikolas, B. Rare earth elements: Industrial applications and economic dependency of Europe. Procedia Econ. Financ. 2015, 24, 126–135. [Google Scholar] [CrossRef]
  4. Jordens, A.; Cheng, Y.P.; Waters, K.E. A review of the beneficiation of rare earth element bearing minerals. Miner. Eng. 2013, 41, 97–114. [Google Scholar] [CrossRef]
  5. Moore, M.; Chakhmouradian, A.R.; Mariano, A.N.; Sidhu, R. Evolution of rare-earth mineralization in the Bear Lodge carbonatite, Wyoming: Mineralogical and isotopic evidence. Ore Geol. Rev. 2015, 64, 499–521. [Google Scholar] [CrossRef]
  6. Dodbiba, G.; Fujita, T. Trends in extraction of rare earth elements from coal ashes: A review. Recycling 2023, 8, 17. [Google Scholar] [CrossRef]
  7. Franus, W.; Wiatros-Motyka, M.M.; Wdowin, M. Coal fly ash as a resource for rare earth elements. Environ. Sci. Pollut. Res. 2015, 22, 9464–9474. [Google Scholar] [CrossRef]
  8. Dai, S.; Zhao, L.; Hower, J.C.; Johnston, M.N.; Song, W.; Wang, P.; Zhang, S. Petrology, mineralogy, and chemistry of size-fractioned fly ash from the Jungar power plant, Inner Mongolia, China, with emphasis on the distribution of rare earth elements. Energy Fuels 2014, 28, 1502–1514. [Google Scholar] [CrossRef]
  9. Praharaj, T.; Powell, M.A.; Hart, B.R.; Tripathy, S. Leachability of elements from sub-bituminous coal fly ash from India. Environ. Int. 2002, 27, 609–615. [Google Scholar] [CrossRef]
  10. Jegadeesan, G.; Al-Abed, S.R.; Pinto, P. Influence of trace metal distribution on its leachability from coal fly ash. Fuel 2008, 87, 1887–1893. [Google Scholar] [CrossRef]
  11. Kashiwakura, S.; Kumagai, Y.; Kubo, H.; Wagatsuma, K. Dissolution of rare earth elements from coal fly ash particles in a dilute H2SO4 solvent. Open J. Phys. Chem. 2013, 3, 69–75. [Google Scholar] [CrossRef]
  12. Abaka-Wood, G.B.; Addai-Mensah, J.; Skinner, W. The concentration of rare earth elements from coal fly ash. J. South. Afr. Inst. Min. Metall. 2022, 122, 21–28. [Google Scholar] [CrossRef]
  13. Sandeep, P.; Maity, S.; Mishra, S.; Chaudhary, D.K.; Dusane, C.B.; Pillai, A.S.; Kumar, A.V. Estimation of rare earth elements in Indian coal fly ashes for recovery feasibility as a secondary source. J. Hazard. Mater. Adv. 2023, 10, 100257. [Google Scholar] [CrossRef]
  14. Wu, G.; Ma, Z.; Li, G.; Bo, C. The distribution and enrichment characteristics of rare earth elements between coals and coal ashes from four coal-fired power plants. RSC Adv. 2024, 14, 2678–2686. [Google Scholar] [CrossRef] [PubMed]
  15. Cao, S.; Zhou, C.; Pan, J.; Liu, C.; Tang, M.; Ji, W.; Hu, T.; Zhang, N. Study on influence factors of leaching of rare earth elements from coal fly ash. Energy Fuels 2018, 32, 8000–8005. [Google Scholar] [CrossRef]
  16. Pan, J.; Hassas, B.V.; Rezaee, M.; Zhou, C.; Pisupati, S.V. Recovery of rare earth elements from coal fly ash through sequential chemical roasting, water leaching, and acid leaching processes. J. Clean. Prod. 2021, 284, 124725. [Google Scholar] [CrossRef]
  17. Zhang, W.; Noble, A.; Yang, X.; Honaker, R. A comprehensive review of rare earth elements recovery from coal-related materials. Minerals 2020, 10, 451. [Google Scholar] [CrossRef]
  18. Mokoena, K.; Mokhahlane, L.S.; Clarke, S. Effects of acid concentration on the recovery of rare earth elements from coal fly ash. Int. J. Coal Geol. 2022, 259, 104037. [Google Scholar] [CrossRef]
  19. Rosita, W.; Bendiyasa, I.; Perdana, I.; Anggara, F. Recovery of rare earth elements and Yttrium from Indonesia coal fly ash using sulphuric acid leaching. In AIP Conference Proceedings; AIP Publishing: Melville, NY, USA, 2020; Volume 2223. [Google Scholar]
  20. Peiravi, M.; Ackah, L.; Guru, R.; Mohanty, M.; Liu, J.; Xu, B.; Zhu, X.; Chen, L. Chemical extraction of rare earth elements from coal ash. Miner. Metall. Process. 2017, 34, 170–177. [Google Scholar] [CrossRef]
  21. Tang, M.; Zhou, C.; Pan, J.; Zhang, N.; Liu, C.; Cao, S.; Hu, T.; Ji, W. Study on extraction of rare earth elements from coal fly ash through alkali fusion–Acid leaching. Miner. Eng. 2019, 136, 36–42. [Google Scholar] [CrossRef]
  22. Seferinoğlu, M.; Paul, M.; Sandström, Å.; Köker, A.; Toprak, S.; Paul, J. Acid leaching of coal and coal-ashes. Fuel 2003, 82, 1721–1734. [Google Scholar] [CrossRef]
  23. Borra, C.R.; Pontikes, Y.; Binnemans, K.; Van Gerven, T. Leaching of rare earths from bauxite residue (red mud). Miner. Eng. 2015, 76, 20–27. [Google Scholar] [CrossRef]
  24. Kim, J.A.; Dodbiba, G.; Tanimura, Y.; Mitsuhashi, K.; Fukuda, N.; Okaya, K.; Matsuo, S.; Fujita, T. Leaching of rare-earth elements and their adsorption by using blue-green algae. Mater. Trans. 2011, 52, 1799–1806. [Google Scholar] [CrossRef]
  25. Liu, P.; Zhao, S.; Xie, N.; Yang, L.; Wang, Q.; Wen, Y.; Chen, H.; Tang, Y. Green approach for rare earth element (REE) recovery from coal fly ash. Environ. Sci. Technol. 2023, 57, 5414–5423. [Google Scholar] [CrossRef] [PubMed]
  26. Park, S.; Liang, Y. Bioleaching of trace elements and rare earth elements from coal fly ash. Int. J. Coal Sci. Technol. 2019, 6, 74–83. [Google Scholar] [CrossRef]
  27. Turan, M.D.; Silva, J.P.; Sarı, Z.A.; Nadirov, R.; Toro, N. Dissolution of chalcopyrite in presence of chelating agent and hydrogen peroxide. Trans. Indian Inst. Met. 2022, 75, 273–280. [Google Scholar] [CrossRef]
  28. Belfqueh, S.; Seron, A.; Chapron, S.; Arrachart, G.; Menad, N. Evaluating organic acids as alternative leaching reagents for rare earth elements recovery from NdFeB magnets. J. Rare Earths 2023, 41, 621–631. [Google Scholar] [CrossRef]
  29. Tang, H.; Shuai, W.; Wang, X.; Liu, Y. Extraction of rare earth elements from a contaminated cropland soil using nitric acid, citric acid, and EDTA. Environ. Technol. 2017, 38, 1980–1986. [Google Scholar] [CrossRef]
  30. Lütke, S.F.; Oliveira, M.L.; Waechter, S.R.; Silva, L.F.; Cadaval, T.R., Jr.; Duarte, F.A.; Dotto, G.L. Leaching of rare earth elements from phosphogypsum. Chemosphere 2022, 301, 134661. [Google Scholar] [CrossRef]
  31. Jian-Rui, W.; Jie, Z. Study on the selective leaching of low-grade phosphate ore for beneficiation of phosphorus and rare earths using citric acid as leaching agent. Russ. J. Appl. Chem. 2016, 89, 1196–1205. [Google Scholar] [CrossRef]
  32. Constantine, J.; Lie, J.; Liu, J.C. Recovery of rare earth elements from spent NiMH batteries using subcritical water extraction with citric acid. J. Environ. Chem. Eng. 2022, 10, 108000. [Google Scholar] [CrossRef]
  33. Prihutami, P.; Prasetya, A.; Sediawan, W.B.; Petrus, H.T.B.M.; Anggara, F. Study on rare earth elements leaching from magnetic coal fly ash by citric acid. J. Sustain. Metall. 2021, 7, 1241–1253. [Google Scholar] [CrossRef]
  34. Pan, J.; Zhang, L.; Wen, Z.; Nie, T.; Zhang, N.; Zhou, C. The mechanism study on the integrated process of NaOH treatment and citric acid leaching for rare earth elements recovery from coal fly ash. J. Environ. Chem. Eng. 2023, 11, 109921. [Google Scholar] [CrossRef]
  35. Rosita, W.; Perdana, I.; Bendiyasa, I.M.; Anggara, F.; Petrus, H.T.B.M.; Prasetyo, A.; Rodliyah, I. Sequential alkaline-organic acid leaching process to enhance the recovery of rare earth elements from Indonesian coal fly ash. J. Rare Earths 2023, 42, 1366–1374. [Google Scholar] [CrossRef]
  36. Behera, S.K.; Kumari, U.; Meikap, B.C. A review of chemical leaching of coal by acid and alkali solution. J. Min. Metall. A Min. 2018, 54, 1–24. [Google Scholar] [CrossRef]
  37. Segsworth, R.S.; Kuhn, K. Electrical rock breaking. IEEE Trans. Ind. Appl. 1977, IA-13, 53–57. [Google Scholar] [CrossRef]
  38. Zhu, X.; Luo, Y.; Liu, W.; He, L.; Gao, R.; Jia, Y. On the mechanism of high-voltage pulsed fragmentation from electrical breakdown process. Rock Mech. Rock Eng. 2021, 54, 4593–4616. [Google Scholar] [CrossRef]
  39. Zhang, Z.; Nie, B.; Hou, Y. Investigation on energy characteristics of shock wave in rock-breaking tests of high voltage electric pulse based on Hilbert-Huang transform. Energy 2023, 282, 128871. [Google Scholar] [CrossRef]
  40. Andres, U.; Jirestig, J.; Timoshkin, I. Liberation of minerals by high-voltage electrical pulses. Powder Technol. 1999, 104, 37–49. [Google Scholar] [CrossRef]
  41. Yan, G.; Zhang, M.; Sun, Z.; Zhao, P.; Zhang, B. Research on high voltage pulse breakage technology. Part 1: The breakdown characteristics of water. Miner. Eng. 2024, 205, 108478. [Google Scholar] [CrossRef]
  42. Gao, P.; Yuan, S.; Han, Y.; Li, Y.; Chen, H. Experimental study on the effect of pretreatment with high-voltage electrical pulses on mineral liberation and separation of magnetite ore. Minerals 2017, 7, 153. [Google Scholar] [CrossRef]
  43. Andres, U.; Timoshkin, I.; Jirestig, J.; Stallknecht, H. Liberation of valuable inclusions in ores and slags by electrical pulses. Powder Technol. 2001, 114, 40–50. [Google Scholar] [CrossRef]
  44. Ouattara, D.; Somot, S.; Faraji, F.; Bouafif, H. Application of High-Voltage Electric Pulse Fragmentation for Liberating Lithium Spodumene from Pegmatite Hard Rocks. In Conference of Metallurgists; Springer Nature: Cham, Switzerland, 2023; pp. 517–524. [Google Scholar]
  45. Zherlitsyn, A.A.; Alexeenko, V.M.; Kumpyak, E.V.; Kondratiev, S.S. Fragmentation of printed circuit boards by sub-microsecond and microsecond high-voltage pulses. Miner. Eng. 2022, 176, 107340. [Google Scholar] [CrossRef]
  46. Wu, L.; Ma, L.; Huang, G.; Li, J.; Xu, H. Distribution and Speciation of Rare Earth Elements in Coal Fly Ash from the Qianxi Power Plant, Guizhou Province, Southwest China. Minerals 2022, 12, 1089. [Google Scholar] [CrossRef]
  47. Nadirov, R.; Karamyrzayev, G. Selective ozone-assisted acid leaching of copper from copper smelter slag by using isopropanol as a solvent. Minerals 2022, 12, 1047. [Google Scholar] [CrossRef]
  48. Kenzhaliyev, B.; Ketegenov, T.; Kamunur, K.; Batkal, A.; Nadirov, R. Efficient Copper Recovery from Chalcopyrite Using an «Isopropanol–Sulfuric Acid–Sodium Dodecyl Sulfate» System. Minerals 2023, 13, 1346. [Google Scholar] [CrossRef]
  49. Nadirov, R.; Karamyrzayev, G. Enhancing Synthetic Zinc Ferrite Hydrochloric Acid Leaching by Using Isopropanol as a Solvent. Min. Metall. Explor. 2022, 39, 1743–1751. [Google Scholar] [CrossRef]
  50. Faraji, F.; Alizadeh, A.; Rashchi, F.; Mostoufi, N. Kinetics of leaching: A review. Rev. Chem. Eng. 2022, 38, 113–148. [Google Scholar] [CrossRef]
Figure 1. Sampling location at the CHPP-2 power plant in Almaty, Kazakhstan.
Minerals 14 00693 g001
Figure 2. High-voltage pulse-treatment scheme.
Minerals 14 00693 g002
Figure 3. XRD patterns of initial CA sample.
Minerals 14 00693 g003
Figure 4. SEM images of untreated CFA sample with magnitudes 40 (a) and 250 (b).
Minerals 14 00693 g004
Figure 5. Cumulative particle size distribution curve for untreated CA.
Minerals 14 00693 g005
Figure 6. XRD patterns of the initial CA sample were treated using HPEV for 50 s (1—Mode 1; 2—Mode 2).
Minerals 14 00693 g006
Figure 7. Cumulative particle size distribution curve for CA treated by HPEV at Modes 1 and 2 and treatment duration of 30 and 50 s (1—Mode 1, 30 s; 2—Mode 1, 50 s; 3—Mode 2, 30 s; 4—Mode 2, 50 s).
Minerals 14 00693 g007
Figure 8. Influence of PEPV conditions on D50 (a) and D80 (b) of the particle size distribution for treated CA.
Minerals 14 00693 g008
Figure 9. Effect of mode and duration of HPEV treatment on energy consumption and D50 (1—energy consumption in Mode 1; 2—energy consumption in Mode 1; 3—D50 value in Mode 1; 4—D50 value in Mode 2).
Minerals 14 00693 g009
Figure 10. REE recovery from the original untreated CA sample (1 M citric acid, 25 °C).
Minerals 14 00693 g010
Figure 11. Effect of S:L and leaching duration on REE ((a)–Ce, (b)–Y, (c)–La) recovery from CA samples treated with HVEP (1 M citric acid, 25 °C).
Minerals 14 00693 g011
Figure 12. Effect of temperature and leaching duration on REE ((a)–Ce, (b)–Y, (c)–La) recovery (1 M citric acid, S:L = 300 g/L).
Minerals 14 00693 g012aMinerals 14 00693 g012b
Figure 13. REE recovery from mechanically ground CA sample with D50 = 13 µm (1 M citric acid, 25 °C).
Minerals 14 00693 g013
Figure 14. A plot of 1 − (1 − X)1/3 vs. leaching time for REE ((a)–Ce, (b)–Y, (c)–La) recovery from CA in 1 M citric acid at S:L = 300 g/L.
Minerals 14 00693 g014aMinerals 14 00693 g014b
Figure 15. Arrhenius plot REE recovery from CA in 1 M citric acid at S:L = 300 g/L.
Minerals 14 00693 g015
Table 1. Yield of magnetic and non-magnetic fraction after magnetic separation of CA.
Size of Particles<40 µm−40 + 80 µm−80 + 100 µm
Magnetic FractionNon-Magnetic FractionMagnetic FractionNon-Magnetic FractionMagnetic FractionNon-Magnetic Fraction
Yield, %7.892.19.390.712.687.4
Table 2. REE content of CA different fraction.
Size FractionTypeCe (ppb)Y (ppb)La (ppb)
<40 µmMagnetic42,15029,88823,834
<40 µmNon-Magnetic75,68434,40628,946
−40 + 80 µmMagnetic43,18823,99120,750
−40 + 80 µmNon-Magnetic54,77327,64622,689
−80 + 100 µmMagnetic39,56521,18716,510
−80 + 100 µmNon-Magnetic48,98521,76918,923
Table 3. Determination coefficients (R2) for linear dependencies according to Equations (5)–(7), calculated from the data in Figure 10.
EquationMetalTemperature, °C
255075
5CeR2 = 0.9037R2 = 0.8881R2 = 0.9012
YR2 = 0.8634R2 = 0.9213R2 = 0.7659
LaR2 = 0.8174R2 = 0.8762R2 = 0.8314
6CeR2 = 0.9598R2 = 0.9885R2 = 0.9820
YR2 = 0.9405R2 = 0.9682R2 = 0.9535
LaR2 = 0.9085R2 = 0.9775R2 = 0.9913
7CeR2 = 0.7459R2 = 0.7973R2 = 0.8065
YR2 = 0.8062R2 = 0.6746R2 = 0.9017
LaR2 = 0.7961R2 = 0.8760R2 = 0.7839
Table 4. REE leaching reaction rate constants at different temperatures.
MetalLeaching Reaction Rate Constant, min−1
25 °C50 °C75 °C
Ce0.00130.00270.0032
Y0.00140.00290.0039
La0.00120.00280.0040
Disclaimer/Publisher’s Note: The statements, opinions and data contained in all publications are solely those of the individual author(s) and contributor(s) and not of MDPI and/or the editor(s). MDPI and/or the editor(s) disclaim responsibility for any injury to people or property resulting from any ideas, methods, instructions or products referred to in the content.

