Article

Investigating Dynamic Behavior in SAG Mill Pebble Recycling Circuits: A Simulation Approach

1
Mining R&D, FLSmidth A/S, Vigerslev Allé 77, 2500 Valby, Denmark
2
Department of Industrial and Materials Science, Chalmers University of Technology, 412 96 Gothenburg, Sweden
*
Author to whom correspondence should be addressed.
Minerals 2024, 14(7), 716; https://doi.org/10.3390/min14070716
Submission received: 14 June 2024 / Revised: 9 July 2024 / Accepted: 11 July 2024 / Published: 16 July 2024
(This article belongs to the Section Mineral Processing and Extractive Metallurgy)

Abstract

:
The dynamics of milling circuits, particularly those involving Semi-Autogenous Grinding (SAG) mills, are not adequately studied, despite their critical importance in mineral processing. This paper aims to investigate the dynamic behavior of an SAG mill pebble recycling circuit under varying feed ore conditions, focusing on both uncontrollable parameters (such as ore hardness) and controllable parameters (including circuit layout and pebble crusher configurations). The study is carried out with Simulink dynamic simulations. Our findings reveal several key insights. Firstly, plant designs based solely on static simulations may not be adequate for large or complex circuits, as they fail to account for the dynamic nature of milling processes. Second, incorporating stockpiles after pebble crushing can effectively mitigate the impact of dynamic fluctuations, leading to more stable circuit performance. Third, different circuit layouts can facilitate easier maintenance and operational flexibility. Notably, finer pebble crushing can enhance circuit throughput by 5% to 10%.

1. Introduction

The dynamics of AG or SAG milling circuits can be quite complex due to changes in the feed size, ore hardness and turbulence from other machines. Despite their critical importance in mineral processing, these factors are not adequately studied. SAG mills are widely used in the mining industry to grind raw ore into smaller particles for further processing. Although their energy efficiency is relatively low, SAG mills have a large throughput, making them popular for processing a wide range of ores. However, traditional approaches often rely on static simulations, which may not fully capture the complexities and fluctuations inherent in these systems.
Current research on SAG mill pebble circuits often focuses on individual mill studies, neglecting the dynamic interactions within the grinding circuit. Due to the inherent breakage mechanisms of AG/SAG mills, particles in the 25–55 mm range (the critical size fraction) are not easily broken thoroughly and tend to accumulate in the mill charge [1]. This buildup of critical particles consumes a significant amount of energy and reduces the mill throughput. Therefore, these pebble-sized particles need to be discharged from the mill and processed by an external crusher, typically a cone crusher.
To enhance understanding of the comminution process for control and optimization, various approaches have been developed for modeling AG/SAG mills. These methods include empirical black-box modeling [2], fundamental dynamic modeling [3,4,5], the discrete element method [6], and data-driven methods [7,8,9]. Similarly, numerous studies have focused on modeling cone crushers, with a fundamental breakage model proposed by Evertsson [10], cone crusher wear dynamics modeling performed by Lindqvist [11], and an active speed control algorithm proposed by Hulthén [12].
However, these models primarily focus on optimizing mills and cone crushers separately, with few considering the connection between these two machines and investigating them as an integrated system. The power draw of a large SAG mill can be up to 20 MW, while its pebble crusher typically consumes only 300 to 1000 kW. Notably, the recycling load constitutes around 20% of the total SAG mill throughput and can reach up to 50% in an AG mill circuit. Additionally, Evertsson and Powell reported the generally poor utilization of pebble crushers in many grinding circuits [13].
Research has consistently shown that finer pebble crushing can lead to significant throughput improvements. For example, a recent study by Erwin [14] found that refining the pebble size in the crushing stage can increase the circuit throughput by up to 10%. They highlight the need for proper control strategies and a thorough understanding of the ore type to fully utilize the installed crushing capacity. The influence of the ore hardness and feed size on circuit performance is well documented. Work by Tavares and Powell [15,16] indicates that these factors are critical in determining the efficiency of the milling process. Harder ores and larger feed sizes generally require more energy for grinding, impacting the overall performance and cost-effectiveness of the circuit.
Recent advancements have highlighted the importance of integrating dynamic simulations to capture the transient behavior of grinding circuits. For instance, the long-term simulation of an industrial coke breeze grinding circuit by de Carvalho et al. [17] employs pseudo-dynamic models to predict circuit responses over extended periods. This study underscores the need for continuous adjustments to the operational parameters to maintain optimal performance and product consistency. The integration of control strategies, such as manipulating the mill rotation speed and adjusting circuit feed rates, was found to significantly enhance the efficiency and reduce variability in the product quality.
Additionally, the application of Design of Experiments (DoE) in evaluating crushing the and screening performance, as discussed by Bhadani [18], offers a systematic method to optimize the interaction between crushers and screens. By utilizing DoE, the study quantifies the effects of the crusher closed side setting (CSS) and eccentric speed on performance, highlighting the importance of these variables in achieving efficient operations. This approach allows for a more comprehensive understanding of the circuit’s behavior under various conditions, leading to more robust and adaptable plant designs.
The purpose of this paper is to systematically study and investigate the dynamics of the SAG mill pebble circuit using a simulation tool developed with Simulink together with DoE. The study focuses on understanding the effects of different feed types (hardness and size), pebble crusher settings, and the presence of a stockpile for pebbles. By incorporating these variables into dynamic simulations, this research aims to provide a more comprehensive understanding of the circuit’s behavior under various conditions, leading to more robust and adaptable plant designs. The findings from this study will contribute to optimizing SAG mill operations, improving efficiency, and reducing operational costs.

2. Materials and Methods

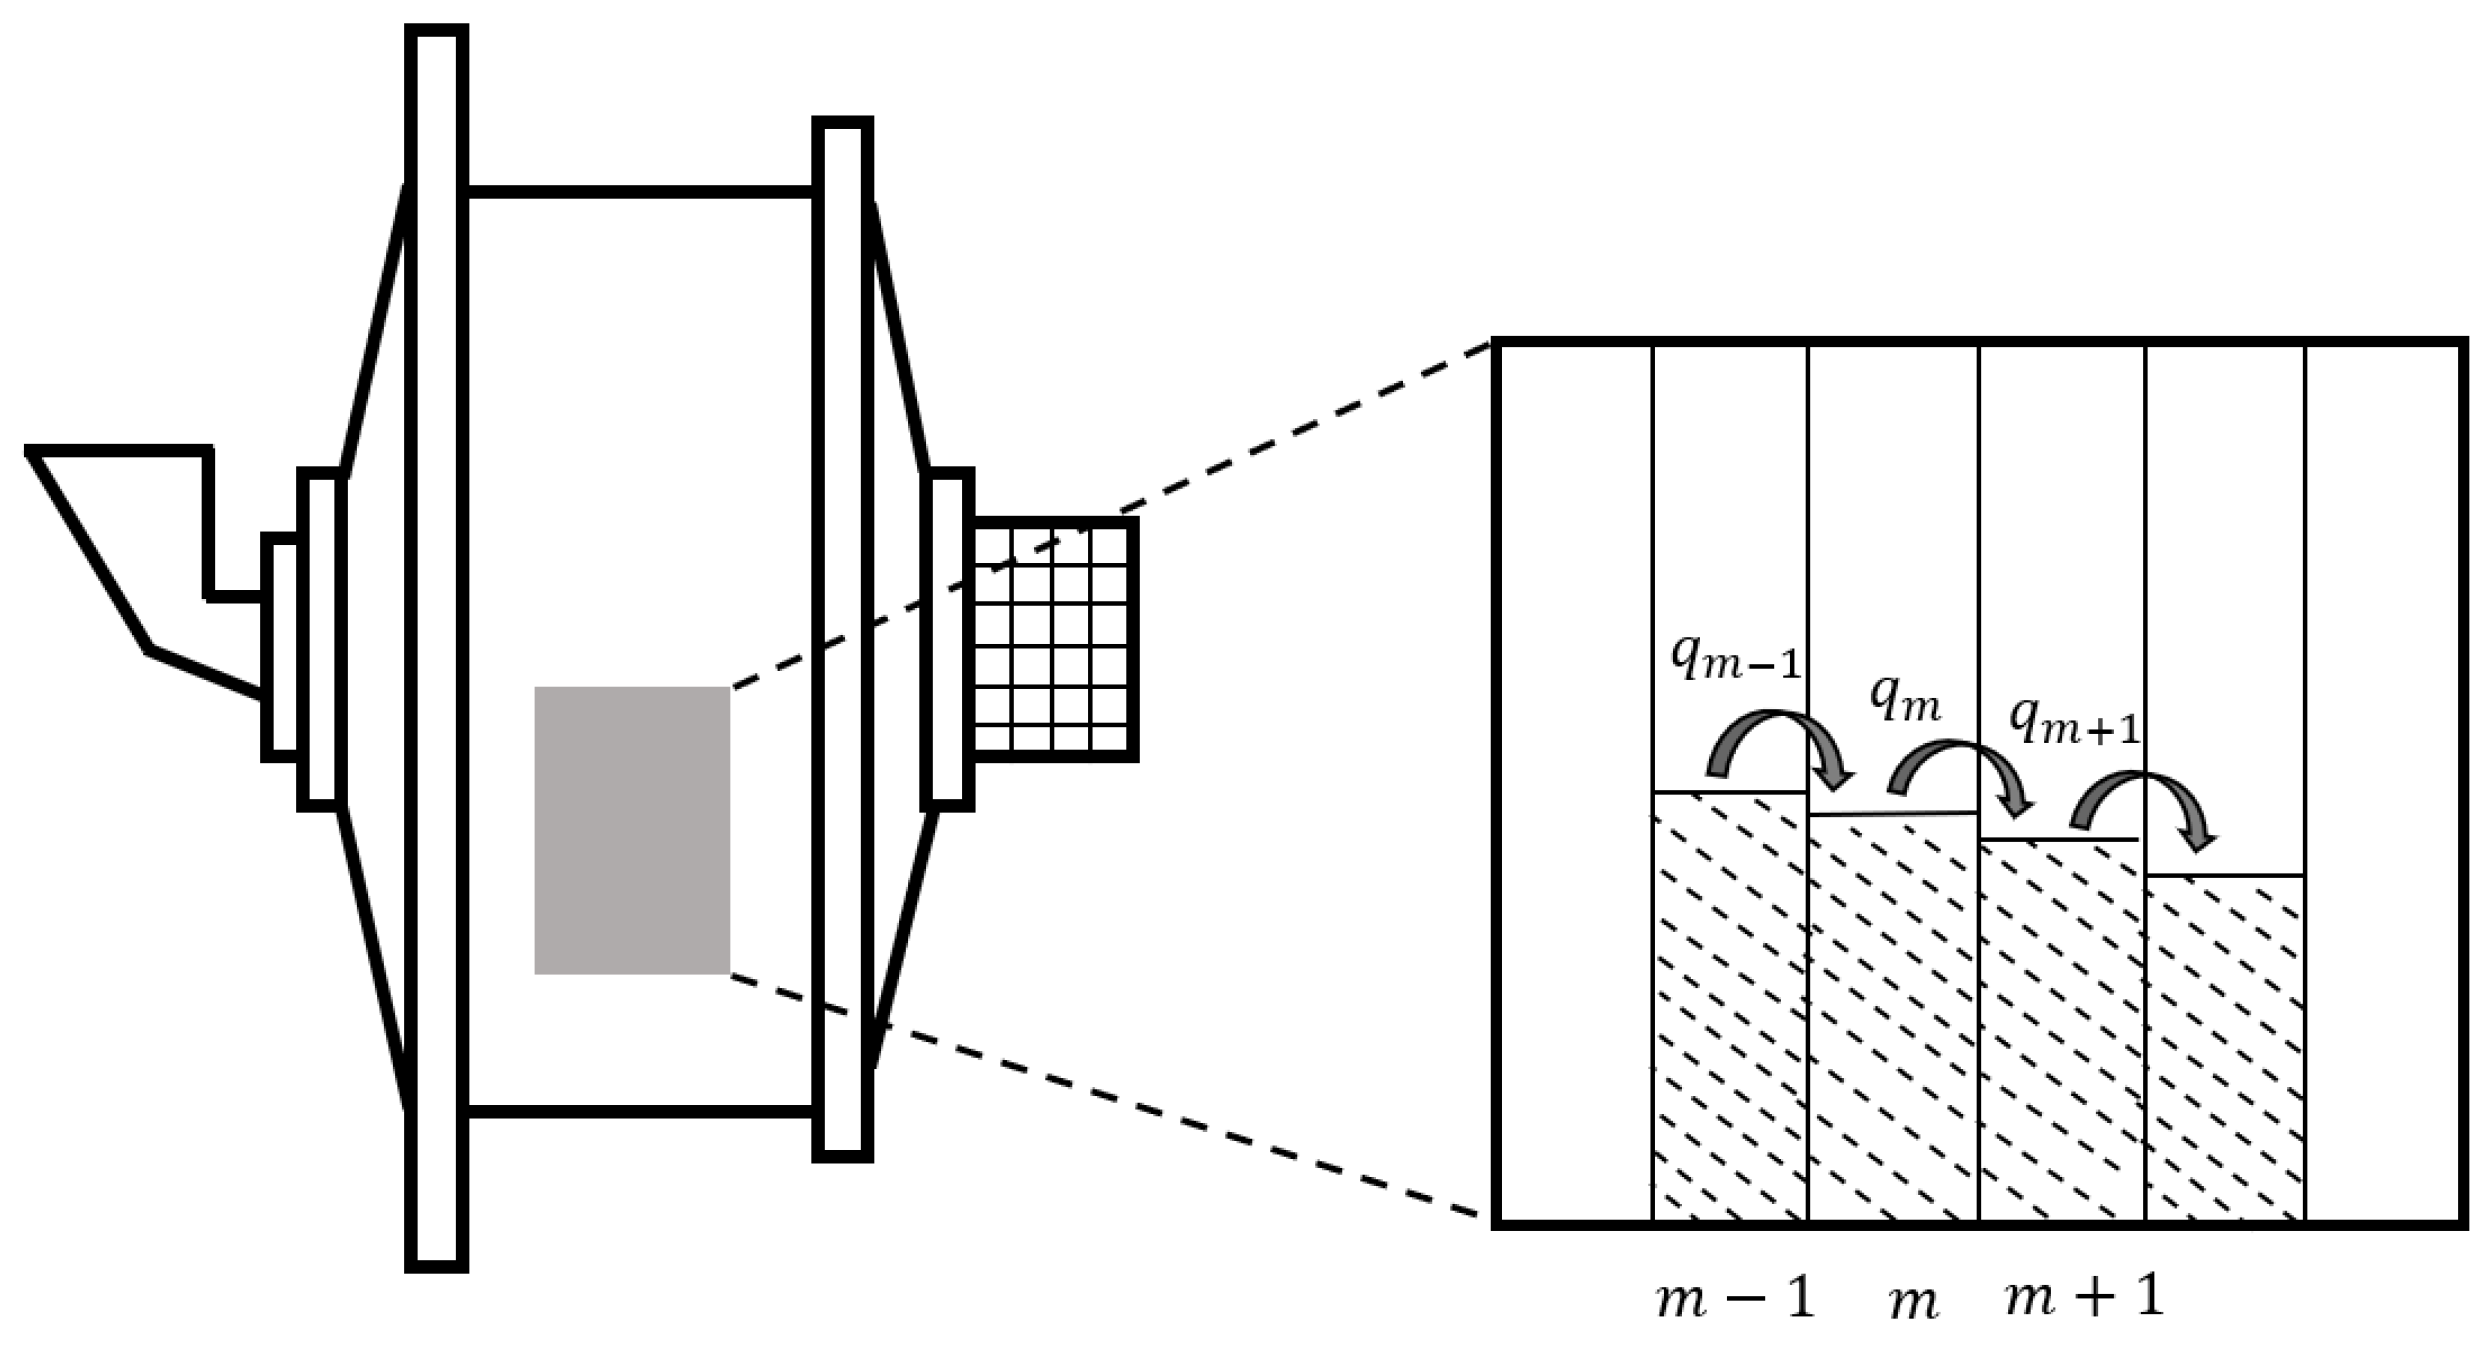
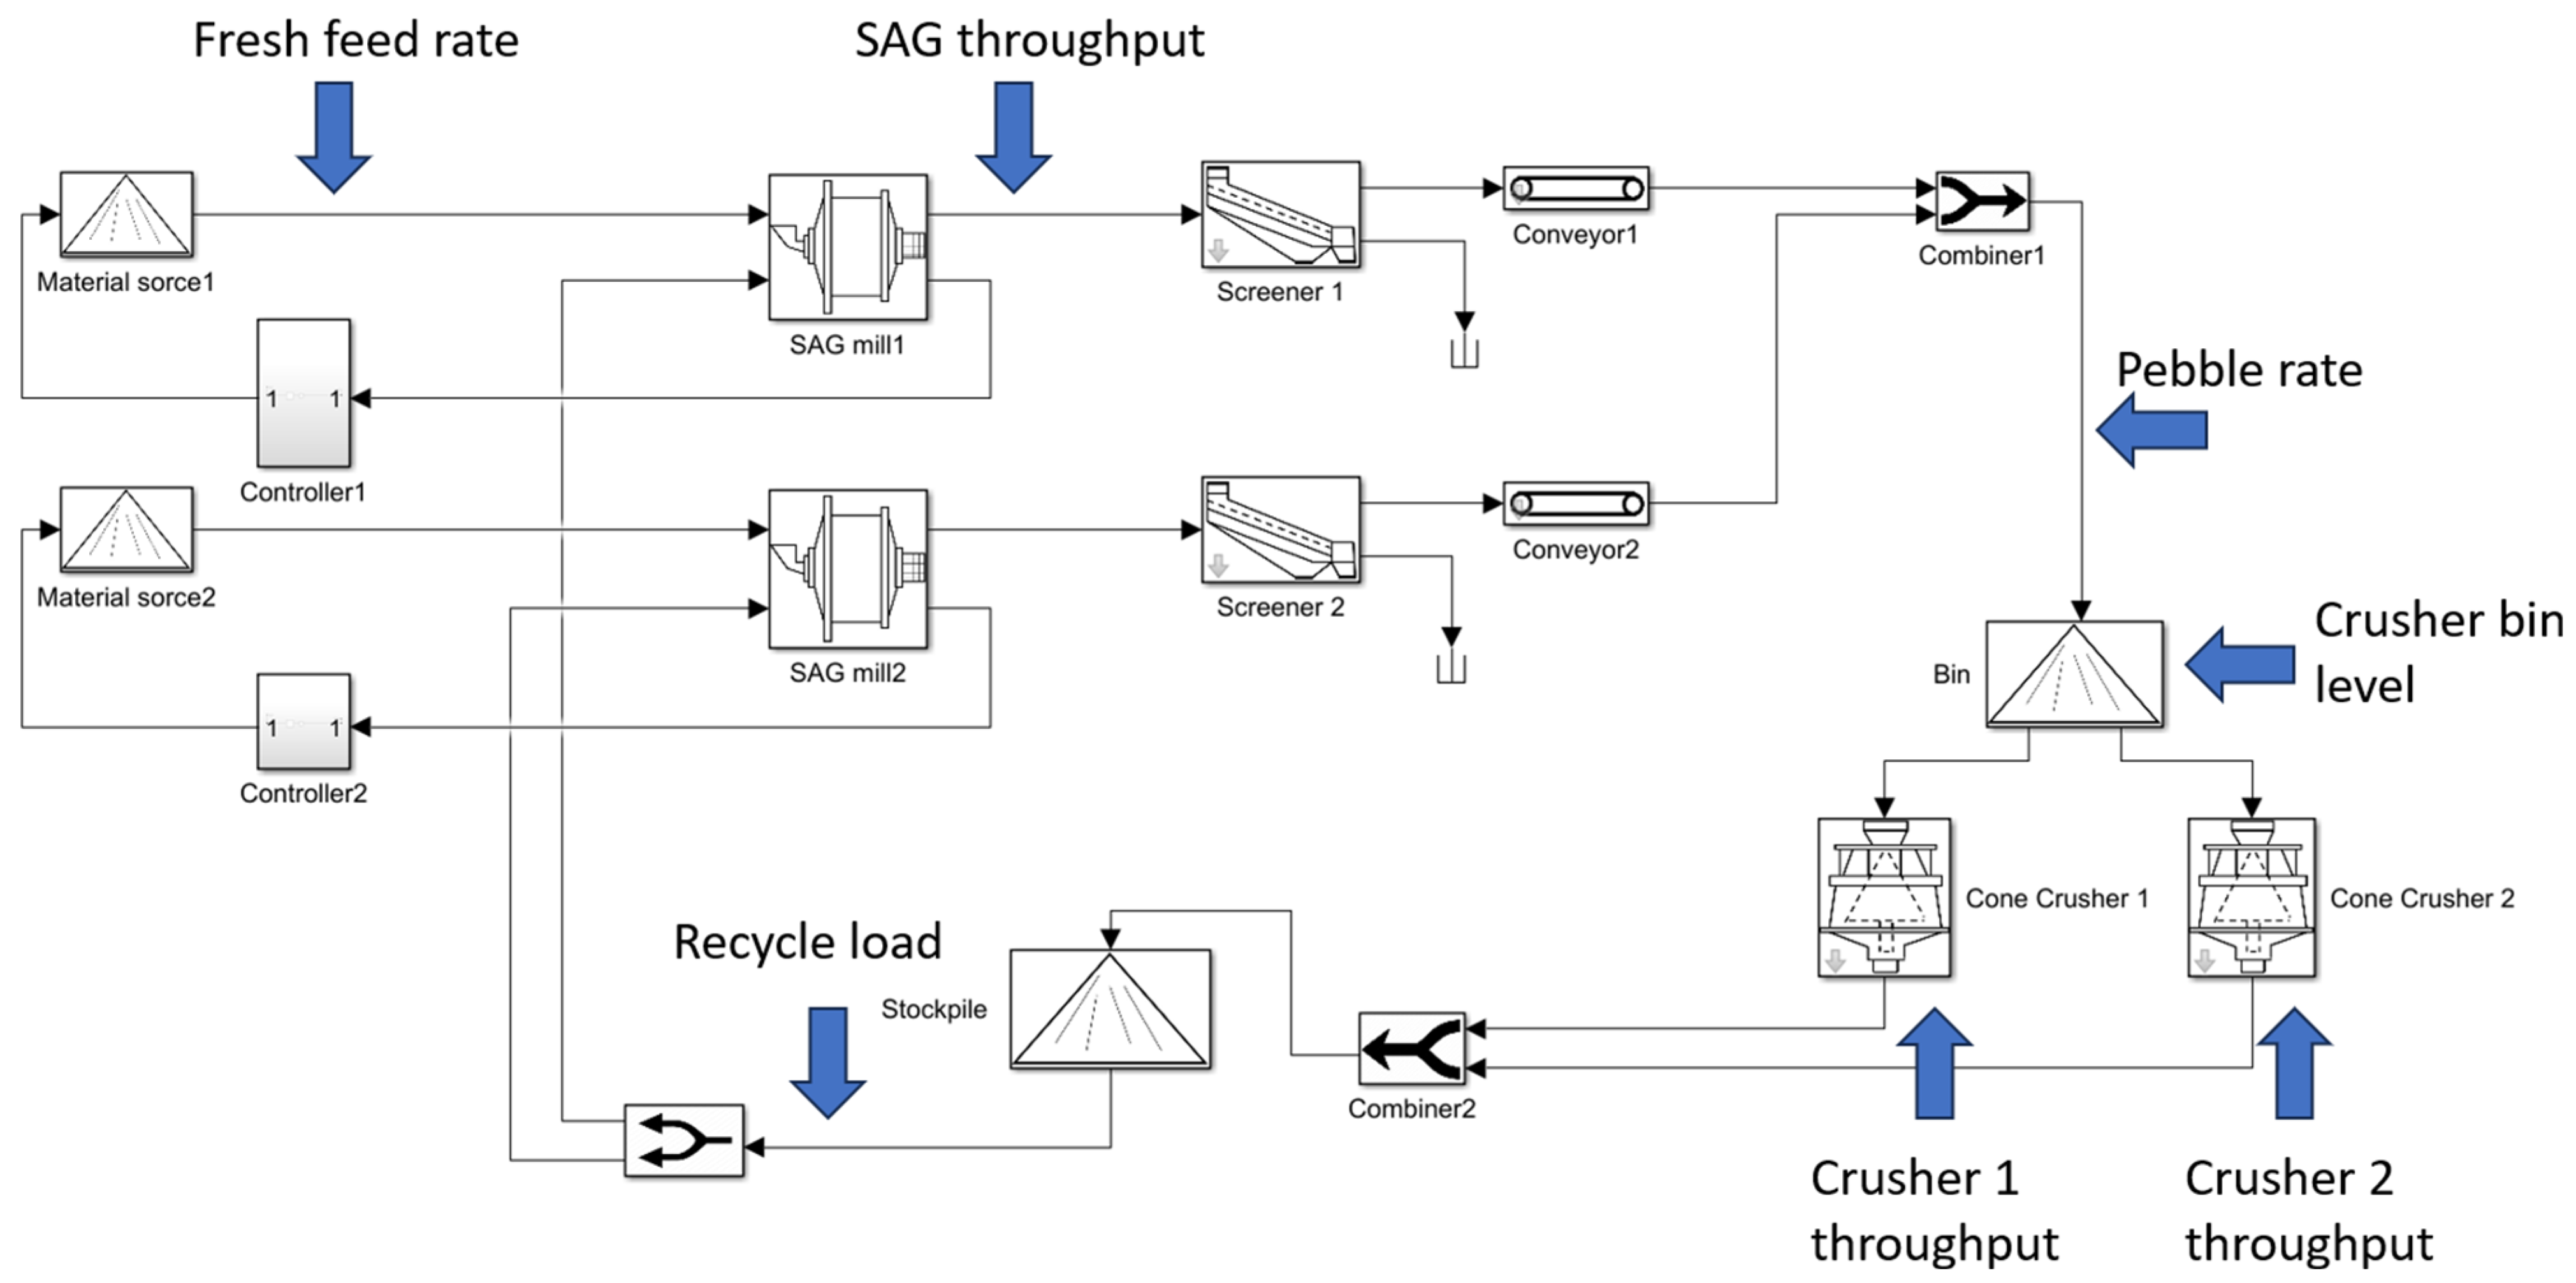
2.1. Mill, Cone Crusher and Other Equipment Modelling

The detailed modellings are explained in the author’s previous study [19] but the below section gives a brief description of the SAG mill modelling structure. In this work, the dynamic model of an AG/SAG mill includes several interlinked sub-process modules that can be updated individually. As shown in Figure 1, the mill is divided into n sections, each containing datasets of particle information updated continuously, such as the size, mass and breakage rate. Particles are ground into new particles based on the breakage rate and appearance function, and their movement to the next section is estimated using the transport function.
The breakage function or so-called selection function describes the possibility of the particles in each section being ground. Austin introduced a simple algebraic equation set that describes a time-independent breakage model and treats the mill as a series of fully mixed reactors [20], as in Equation (1).
S e l i = A 1 x i x 0 α 1 1 1 + x i μ x 0 Λ + A 2 x i x 0 α 2
where S e l i is the selection function of the size interval indexed by i , x i is the upper size of the size interval indexed by i , and x 0 is a standard size (usually 1 mm). A 1 , α 1 , μ and Λ are for the nipping breakage of smaller particles by larger grinding media, while A 2 , α 2 is for the breakage of large lumps by collision with media and lumps of similar size (self-breakage). The units of A 1 and A 2 are t i m e 1 . The parameters α 1 , α 2 , μ , Λ are dimensionless.
The appearance function uses the T10 model developed by JKMRC [21]; the corresponding A × b value and input energy can be found in the Appendix A.
The transport function is used to describe how the particles move from the previous section to the next section. The transport function in the simulation has a significant influence on the particle size distribution, mill load, throughput, resident time, and other parameters [4]. In this work, the mill is modeled as a combination of a series of sections. The particles in each section are considered to be perfectly mixed. The diffusion relations for each ore size class are described in Equation (2).
q i = D i d ρ i d x
where i indicates the i th size class of particles, q is the mass flux through the controlled area, D i is the mass transfer coefficient and d ρ / d x is slurry density changing along the mill sections. The transfer coefficient needs to be tested and updated from pilot or plant data.
The discharge function for each particle size class in AG/SAG mills can be expressed as the maximum discharge rate ( D m a x ) times the classification parameter c i ; see Equation (3). The classification function c i has three values and uses the size of the slurry (particles smaller than this size behaves like liquid), the size of the grate aperture, and the pebble port size [3].
d i = D m a x c i
where d i is the discharge rate of size class i , and c i is the classification function for size class i .
Valery and Morrell [22] developed a conceptual dynamic model for AG/SAG mills to provide an accurate dynamic response for the power draw, mill charge level, product size distribution, feed hardness, etc. The dynamic equations are updated based on Valery and Morrell’s equation, and the particle population model for each section in a mill is described in Equation (4). In this dynamic equation, the material change in each section is calculated individually:
d s i t d t = q i i n q i o u t + j = 1 i r j s j a i j r i s i
where s i is the section content of size class i at time t , q i i n is the particles transported from the previous section of size class i , q i o u t is the particles transported to the next section of size class i , r i is the particles breakage rate of size class i , a i j is the appearance function, and size class i breaks from size class j . In the first section, q i i n is the feed particles of size class i , and at the last section, q i o u t is the discharged particles of size class i .
The dynamic framework presented in this paper treats a mill as a series of perfectly mixed sections, along with a selection function and a mass transfer function. This method applies basic calculation rules and avoids relying heavily on empirical relations. At each simulated time step, the fresh feed, product, and mill operating parameters are considered. The status of all particles is calculated with regard to the breakage probability, motion behavior, position in the mill, chance of discharge, and other factors. If the system reaches stable operation within a certain period, it is considered to be in a steady state. This model is based on real plant data and is designed to back-calculate the sub-process functions previously used, leading to extensive applications and more accurate predictions.
The dynamic behavior of the entire system, including the SAG mill and cone crusher operating in a closed circuit, is examined. Therefore, in addition to the SAG mill model, the dynamic simulation of cone crushers, conveyors, bins, and screens is also included. Asbjörnsson [23] studied the dynamic crushing plant behavior and discussed the machinery bottlenecks that affect throughput. Here, dynamic models similar to those presented by Asbjörnsson were used to model conveyors and screens. A fixed time delay is used for the conveyor model, accounting for its length and speed. The screens are modeled with a constant time delay, which depends on the screen size. The large surge bin for material storage is assumed to be perfectly mixed, with the level in the bin being a function of mass flow and the bin dimensions.
A small bin is modeled for the cone crusher chamber, where the particles are perfectly mixed. The product particle size distribution (PSD) of the cone crusher is shown in Figure 2 and Figure 3. The eccentric speed settings in Figure 2 are 280, 360, and 440 rpm. It can be seen from the plot that the CSS and eccentric speed of a cone crusher can significantly affect the final PSD. A change in the CSS of the crusher shifts the product PSD horizontally, while changes in the eccentric speed pivot the curve around a point [10]. Furthermore, the crusher capacity is also a function of the CSS and eccentric speed, as shown in Figure 3. For a given CSS, the capacity decreases with a higher eccentric speed.

2.2. DOE for SAG Mill Pebble Crushing Circuit Study

To investigate the performance of the SAG mill pebble circuit, a DoE with a full factorial design containing 4 factors and a 2-level approach is applied in this study, see Figure 4 and Table 1. The DoE considers the following parameters and conditions:
  • Parameters and conditions:
Hardness of Feed Material:
  • Levels: Two levels of hardness (e.g., hard and soft, see Table A3).
  • Condition: The hardness of the feed material can vary significantly. This affects the efficiency of the grinding process in the SAG mill.
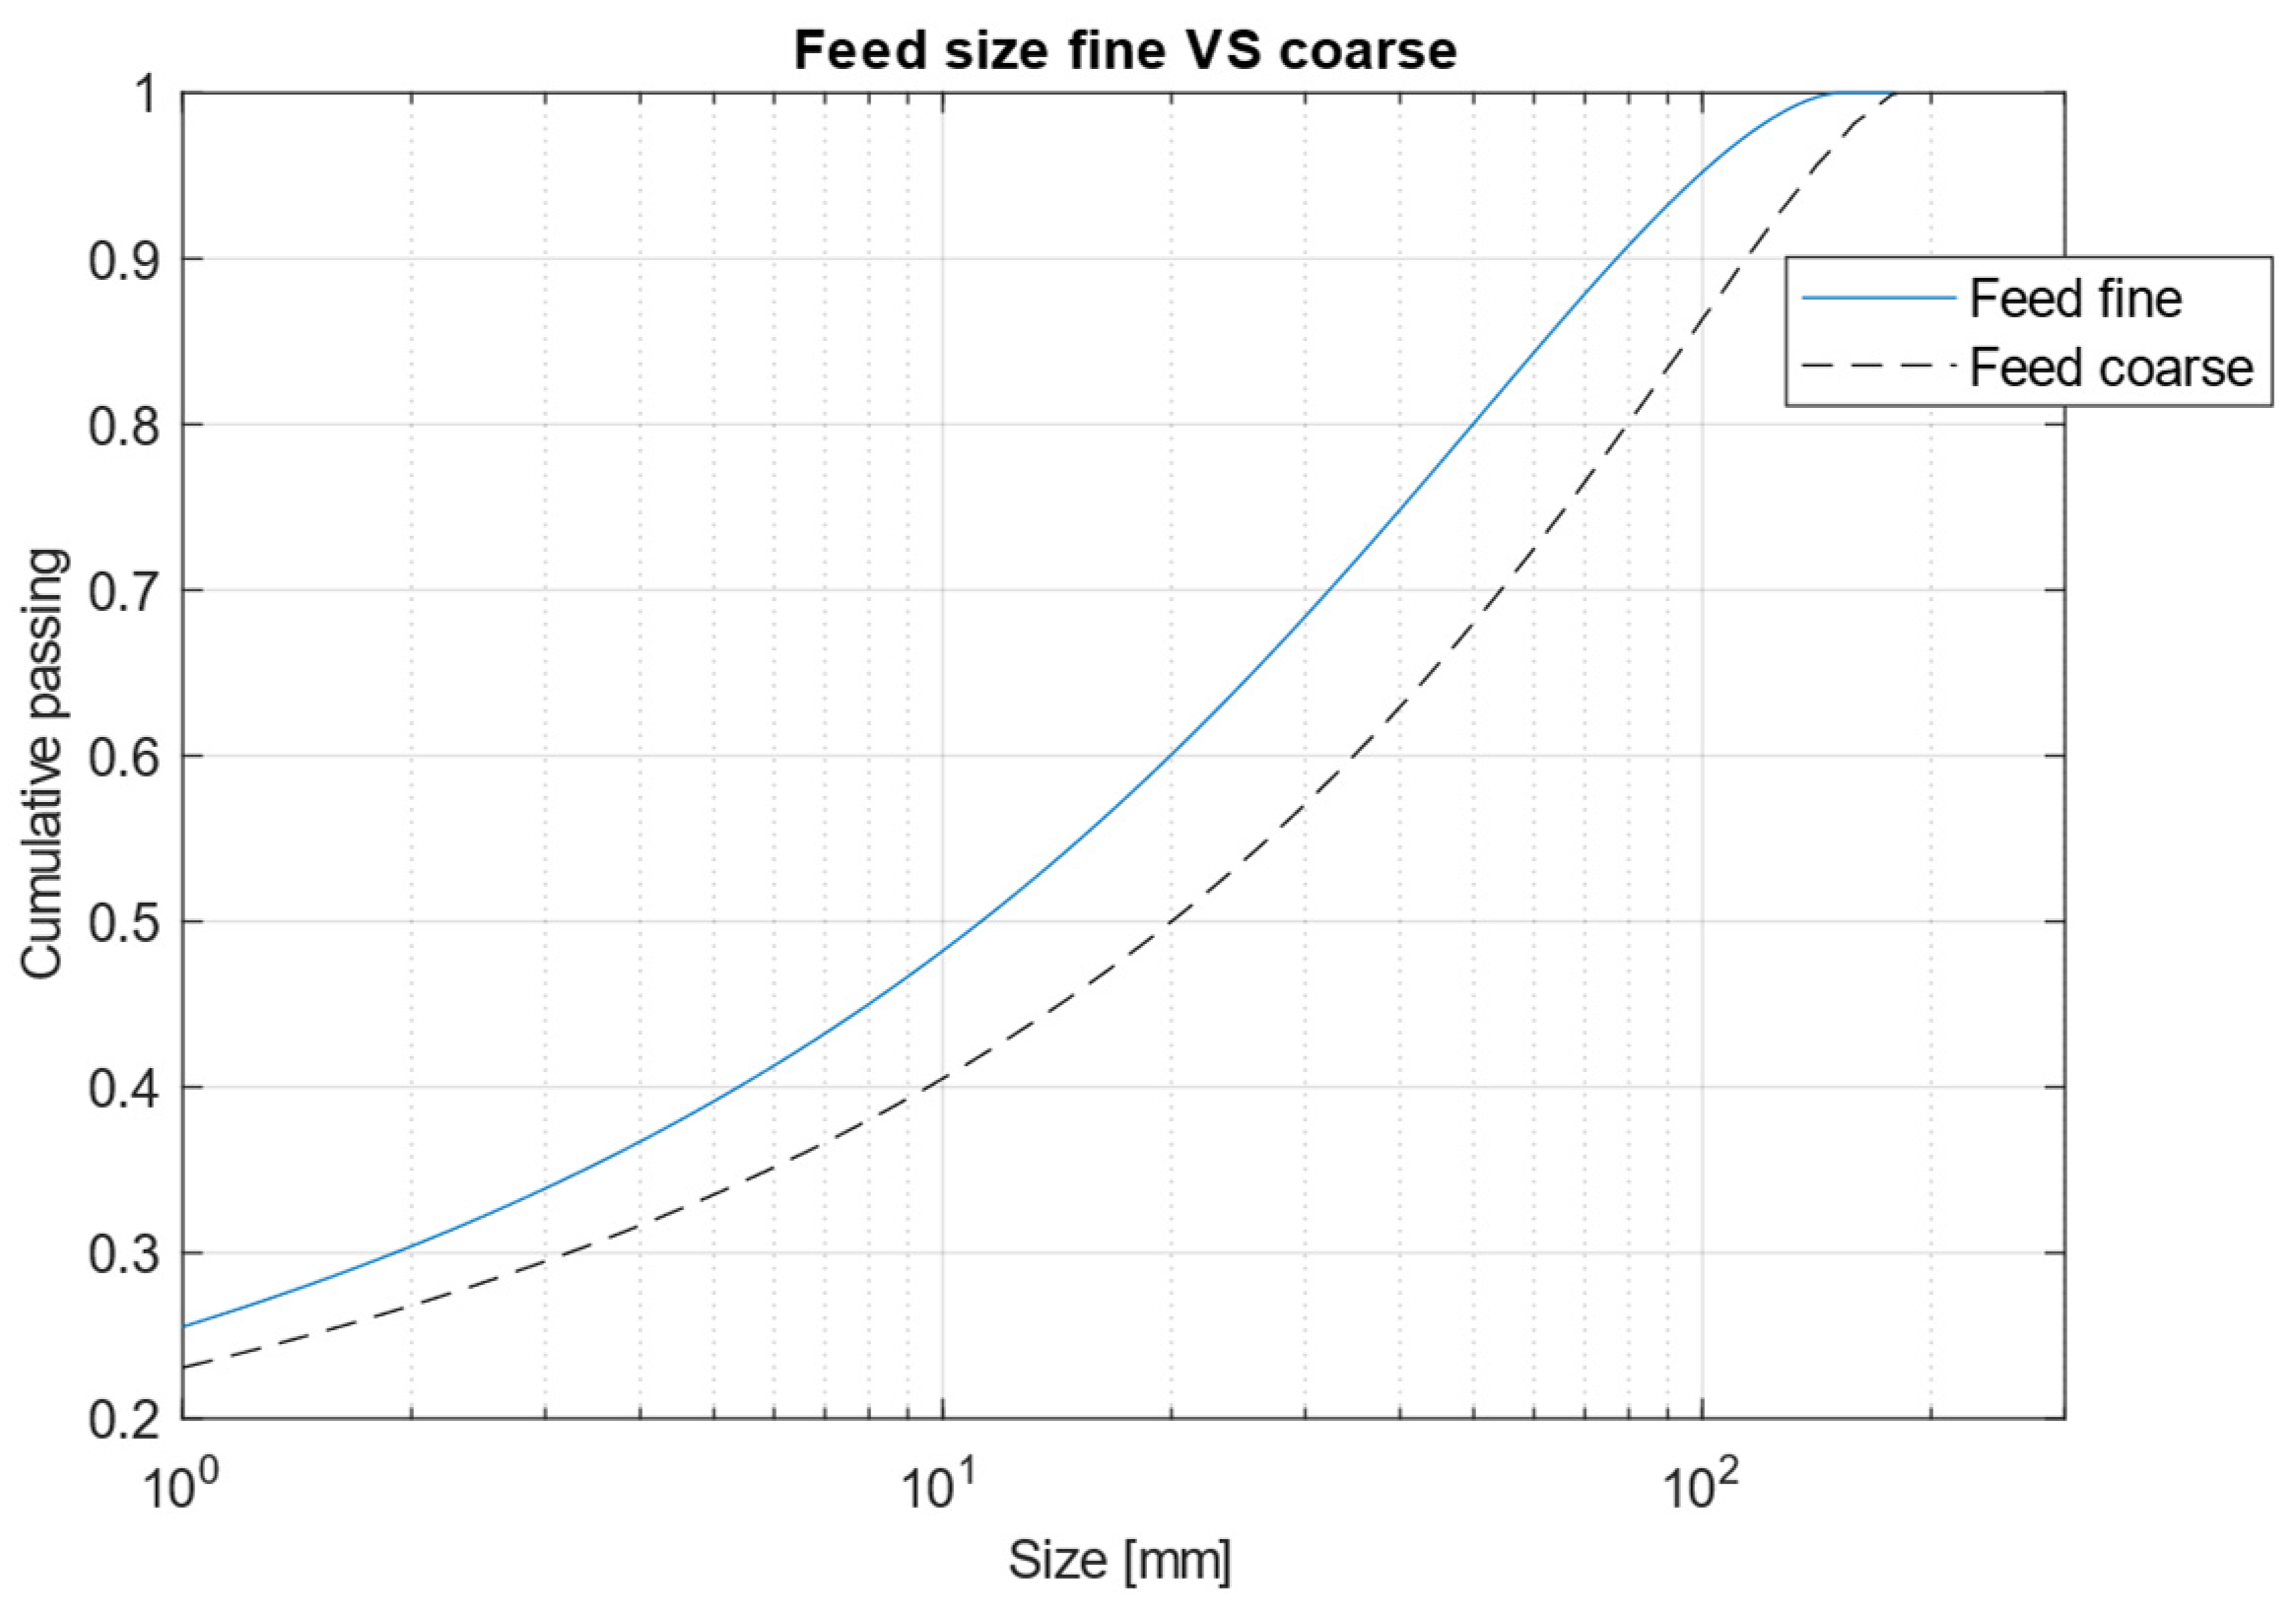
  • Feed Size to SAG Mill:
  • Levels: Two levels of feed size (e.g., coarse and fine, see Figure A2).
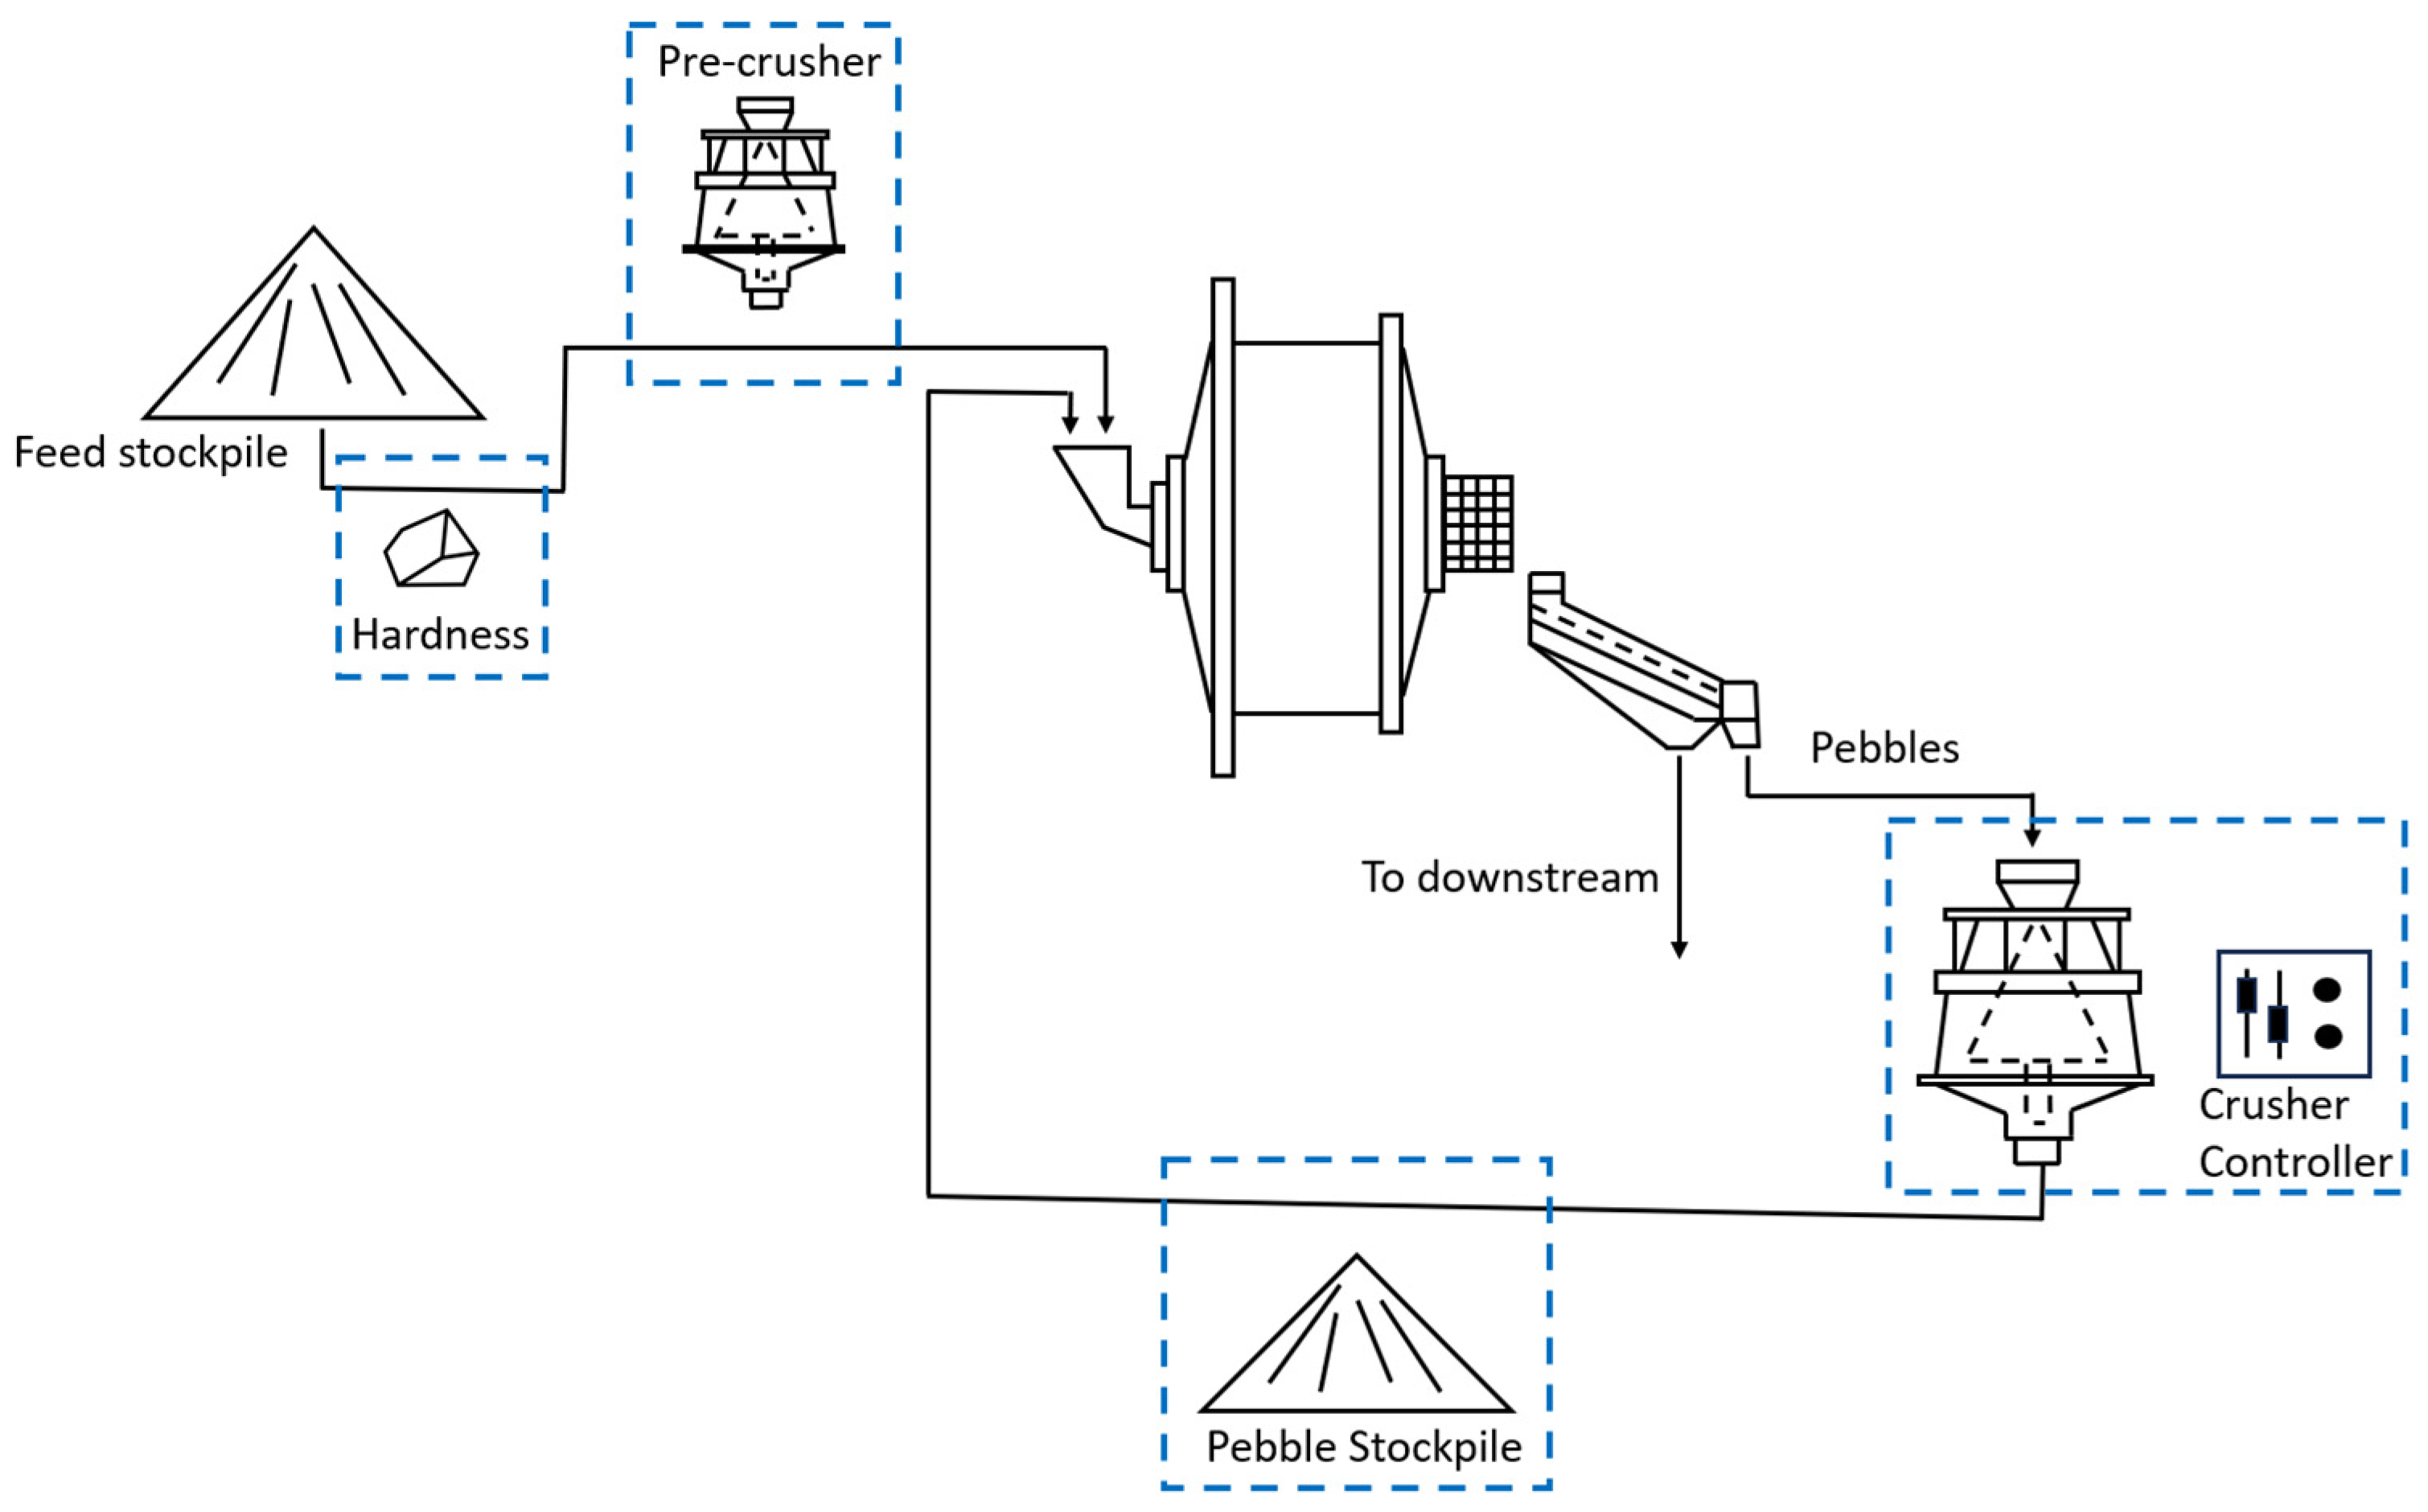
  • Condition: Adding a pre-crusher before the feed enters the SAG mill. This helps to reduce the size of the feed material, improving the grinding efficiency of the SAG mill.
  • Presence of Pebble Stockpile:
  • Levels: With stockpile and Without stockpile.
  • Condition: Including a stockpile for pebbles. This allows for better management of the pebbles extracted from the SAG mill, ensuring a consistent feed to the pebble crusher and improving the overall circuit efficiency. In this study, a simple on/off controller based on the stockpile level is applied.
  • Crusher Controller Implementation:
  • Levels: With controller and Without controller.
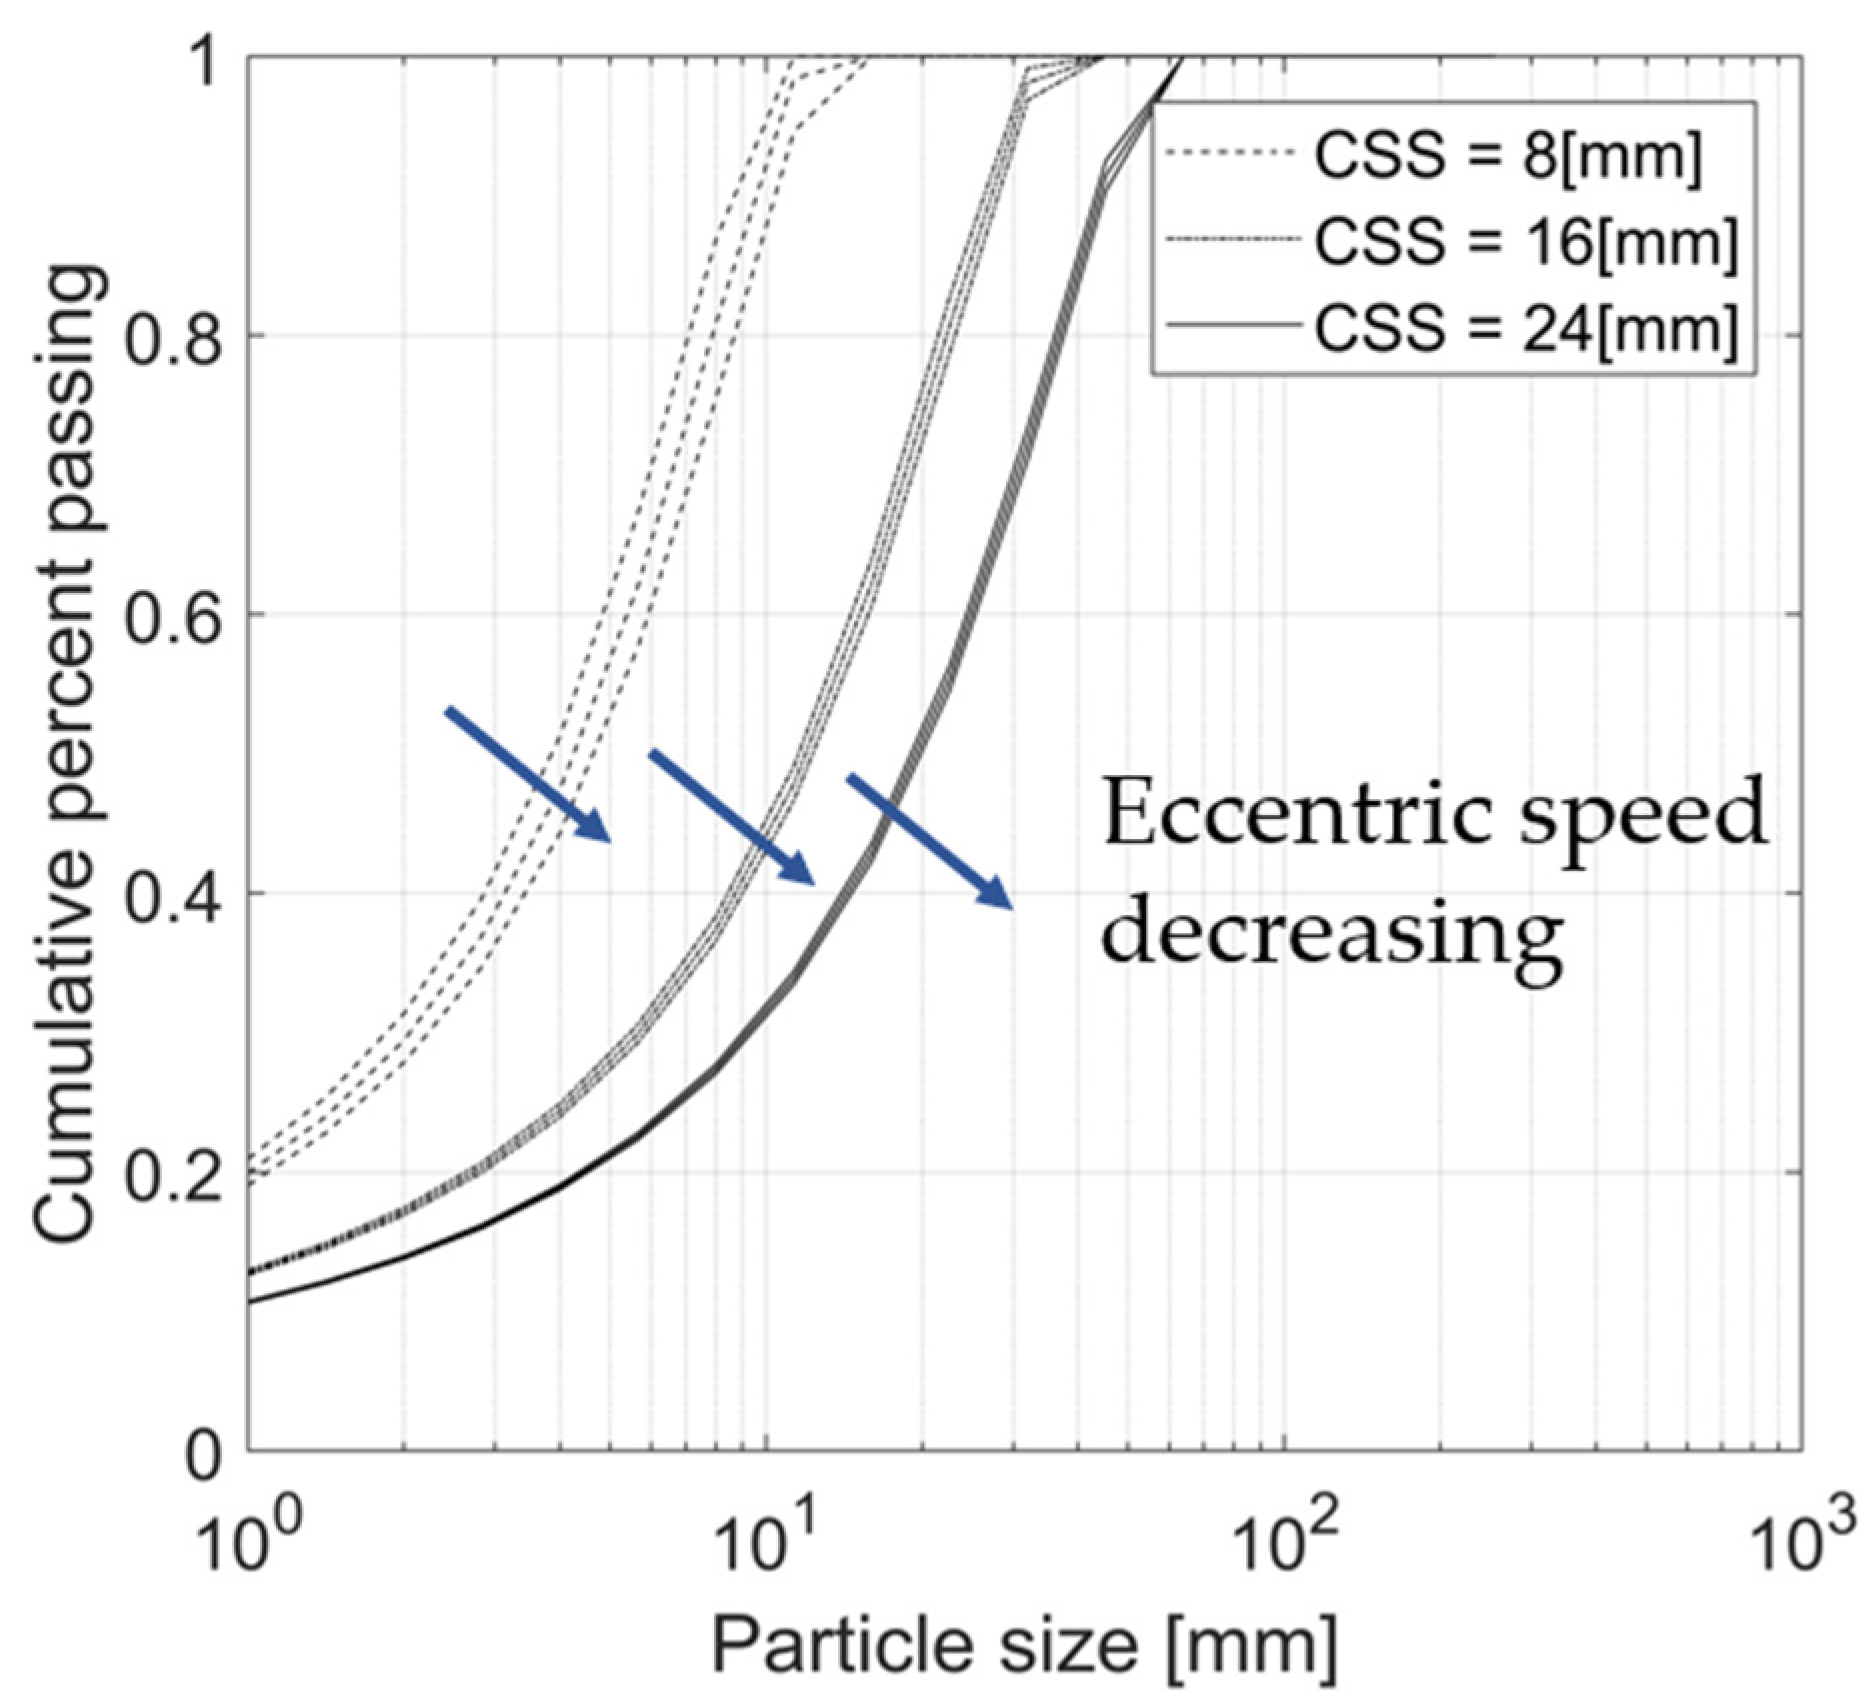
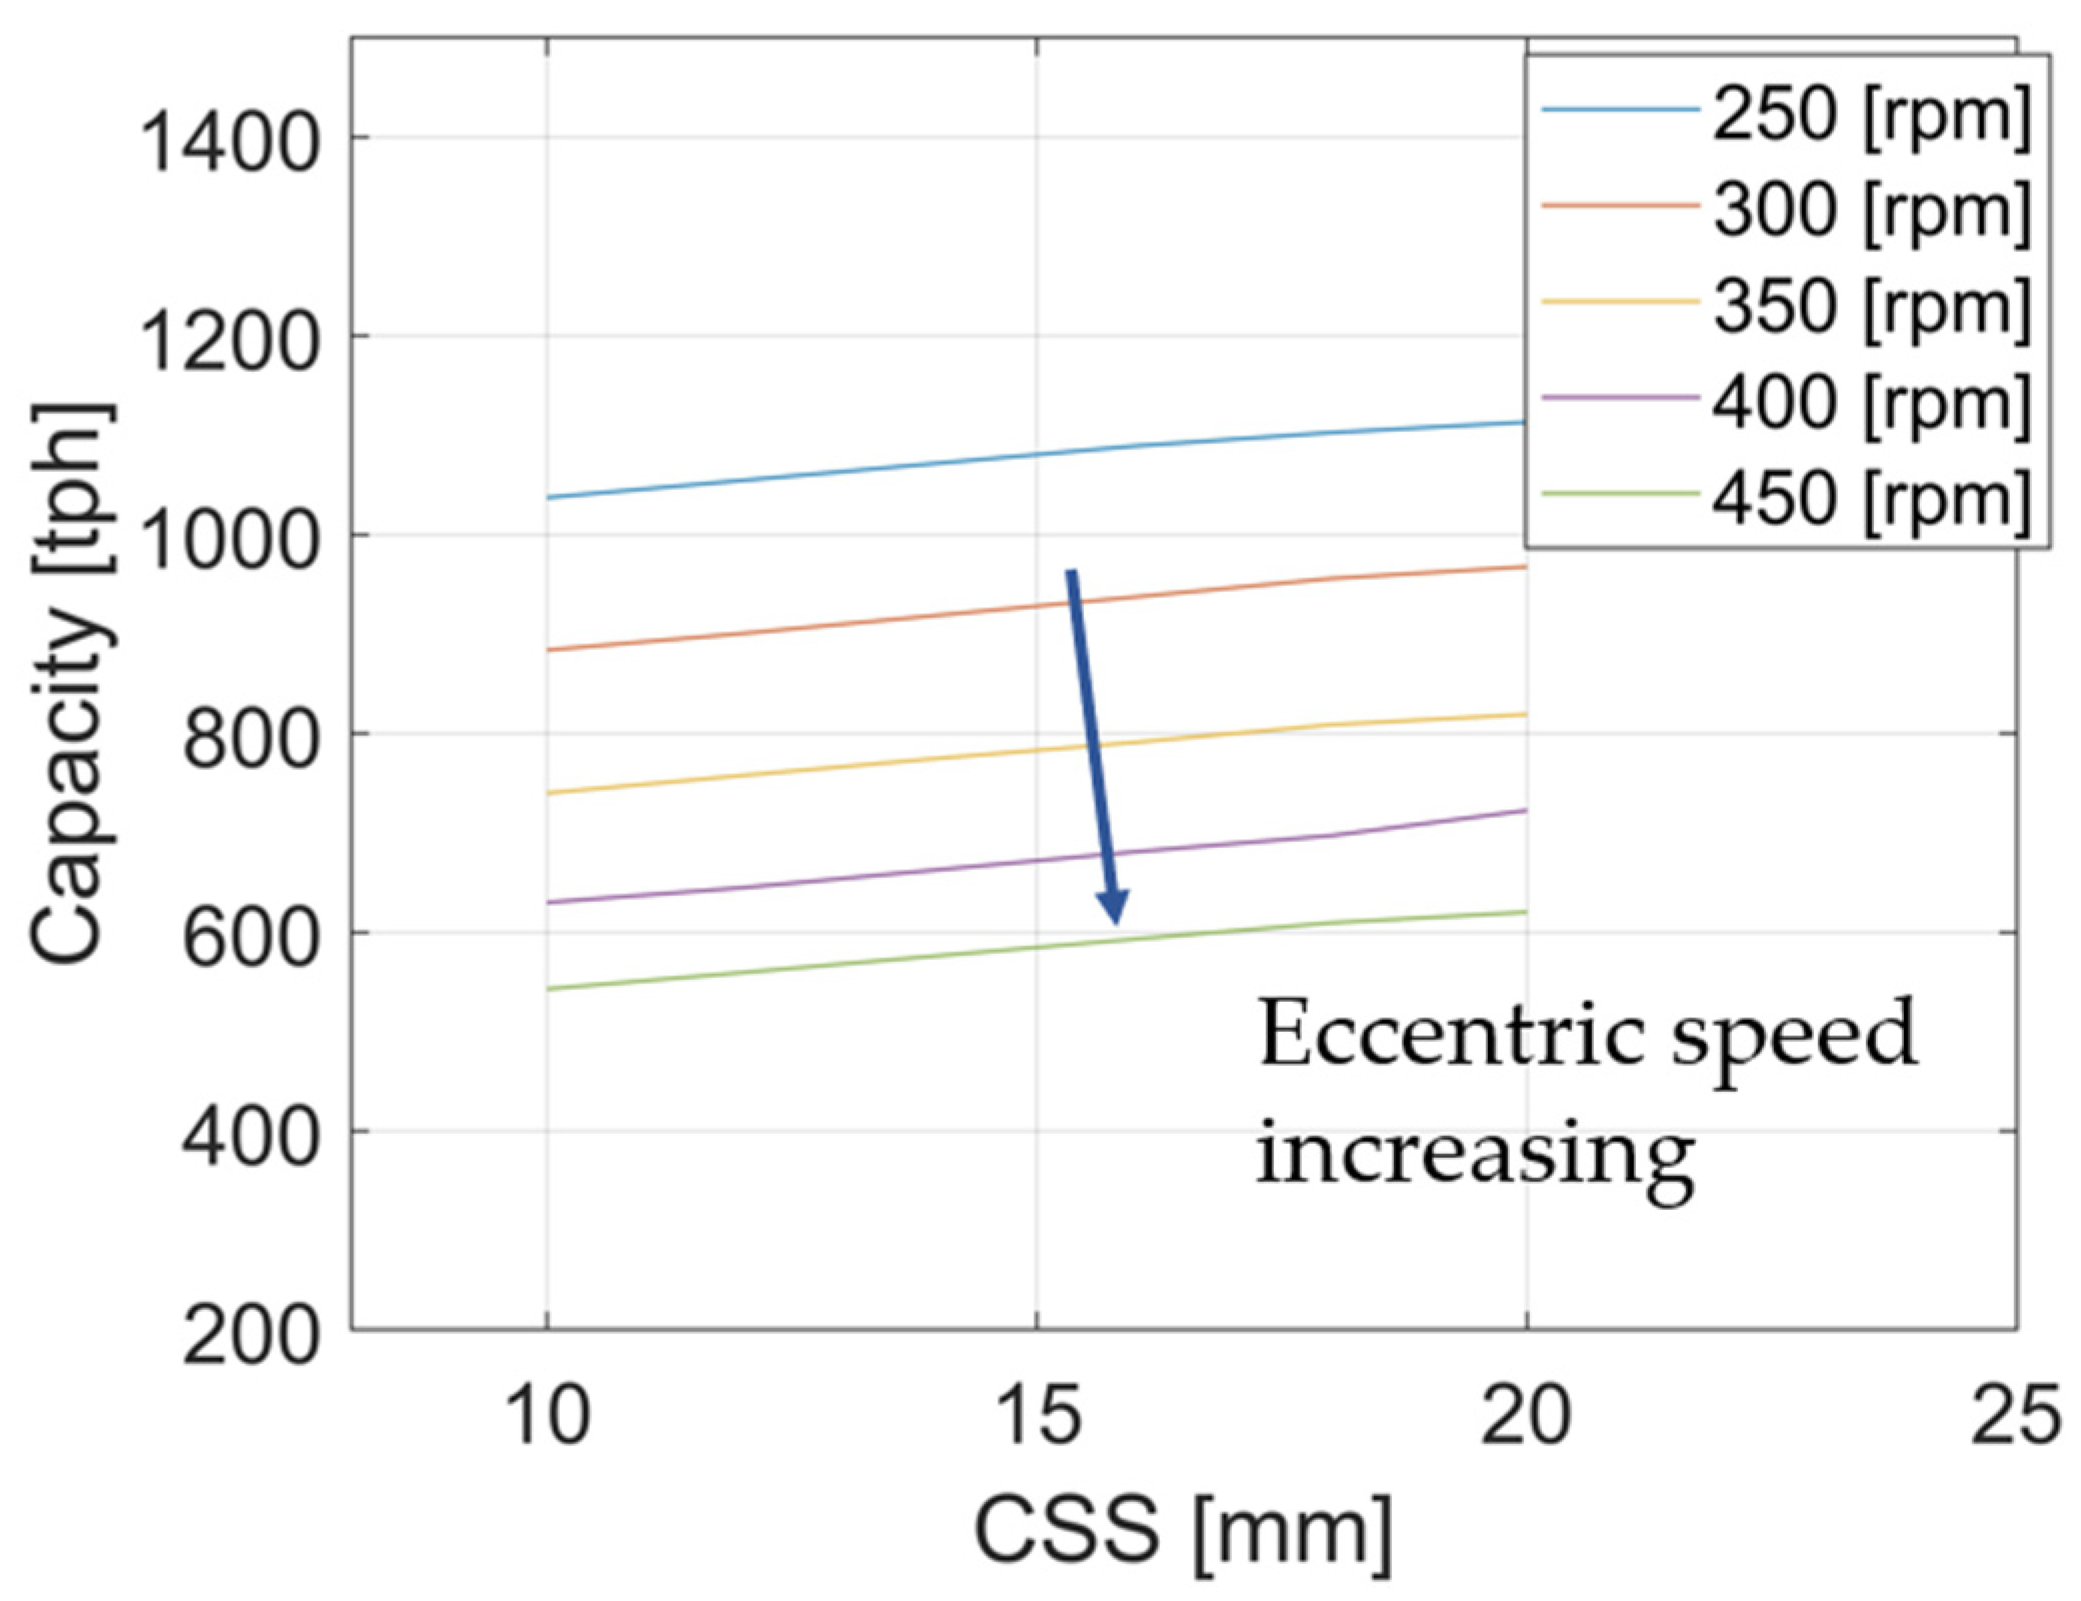
  • Condition: Implementing a controller for the pebble crusher optimizes the operation by adjusting the settings based on the real-time conditions, thereby improving the efficiency of the crushing process. The main control parameters in this study are the closed side setting and speed. The settings of the pebble crusher are CSS = 10 mm and speed = 400 rpm, versus CSS = 28 mm and speed = 280 rpm, at two different levels. It should be noted that the capacity of the crusher decreases with a tighter CSS and a higher eccentric speed. In the simulations, we apply a 25% capacity loss to account for these changes, as presented in Figure 3.
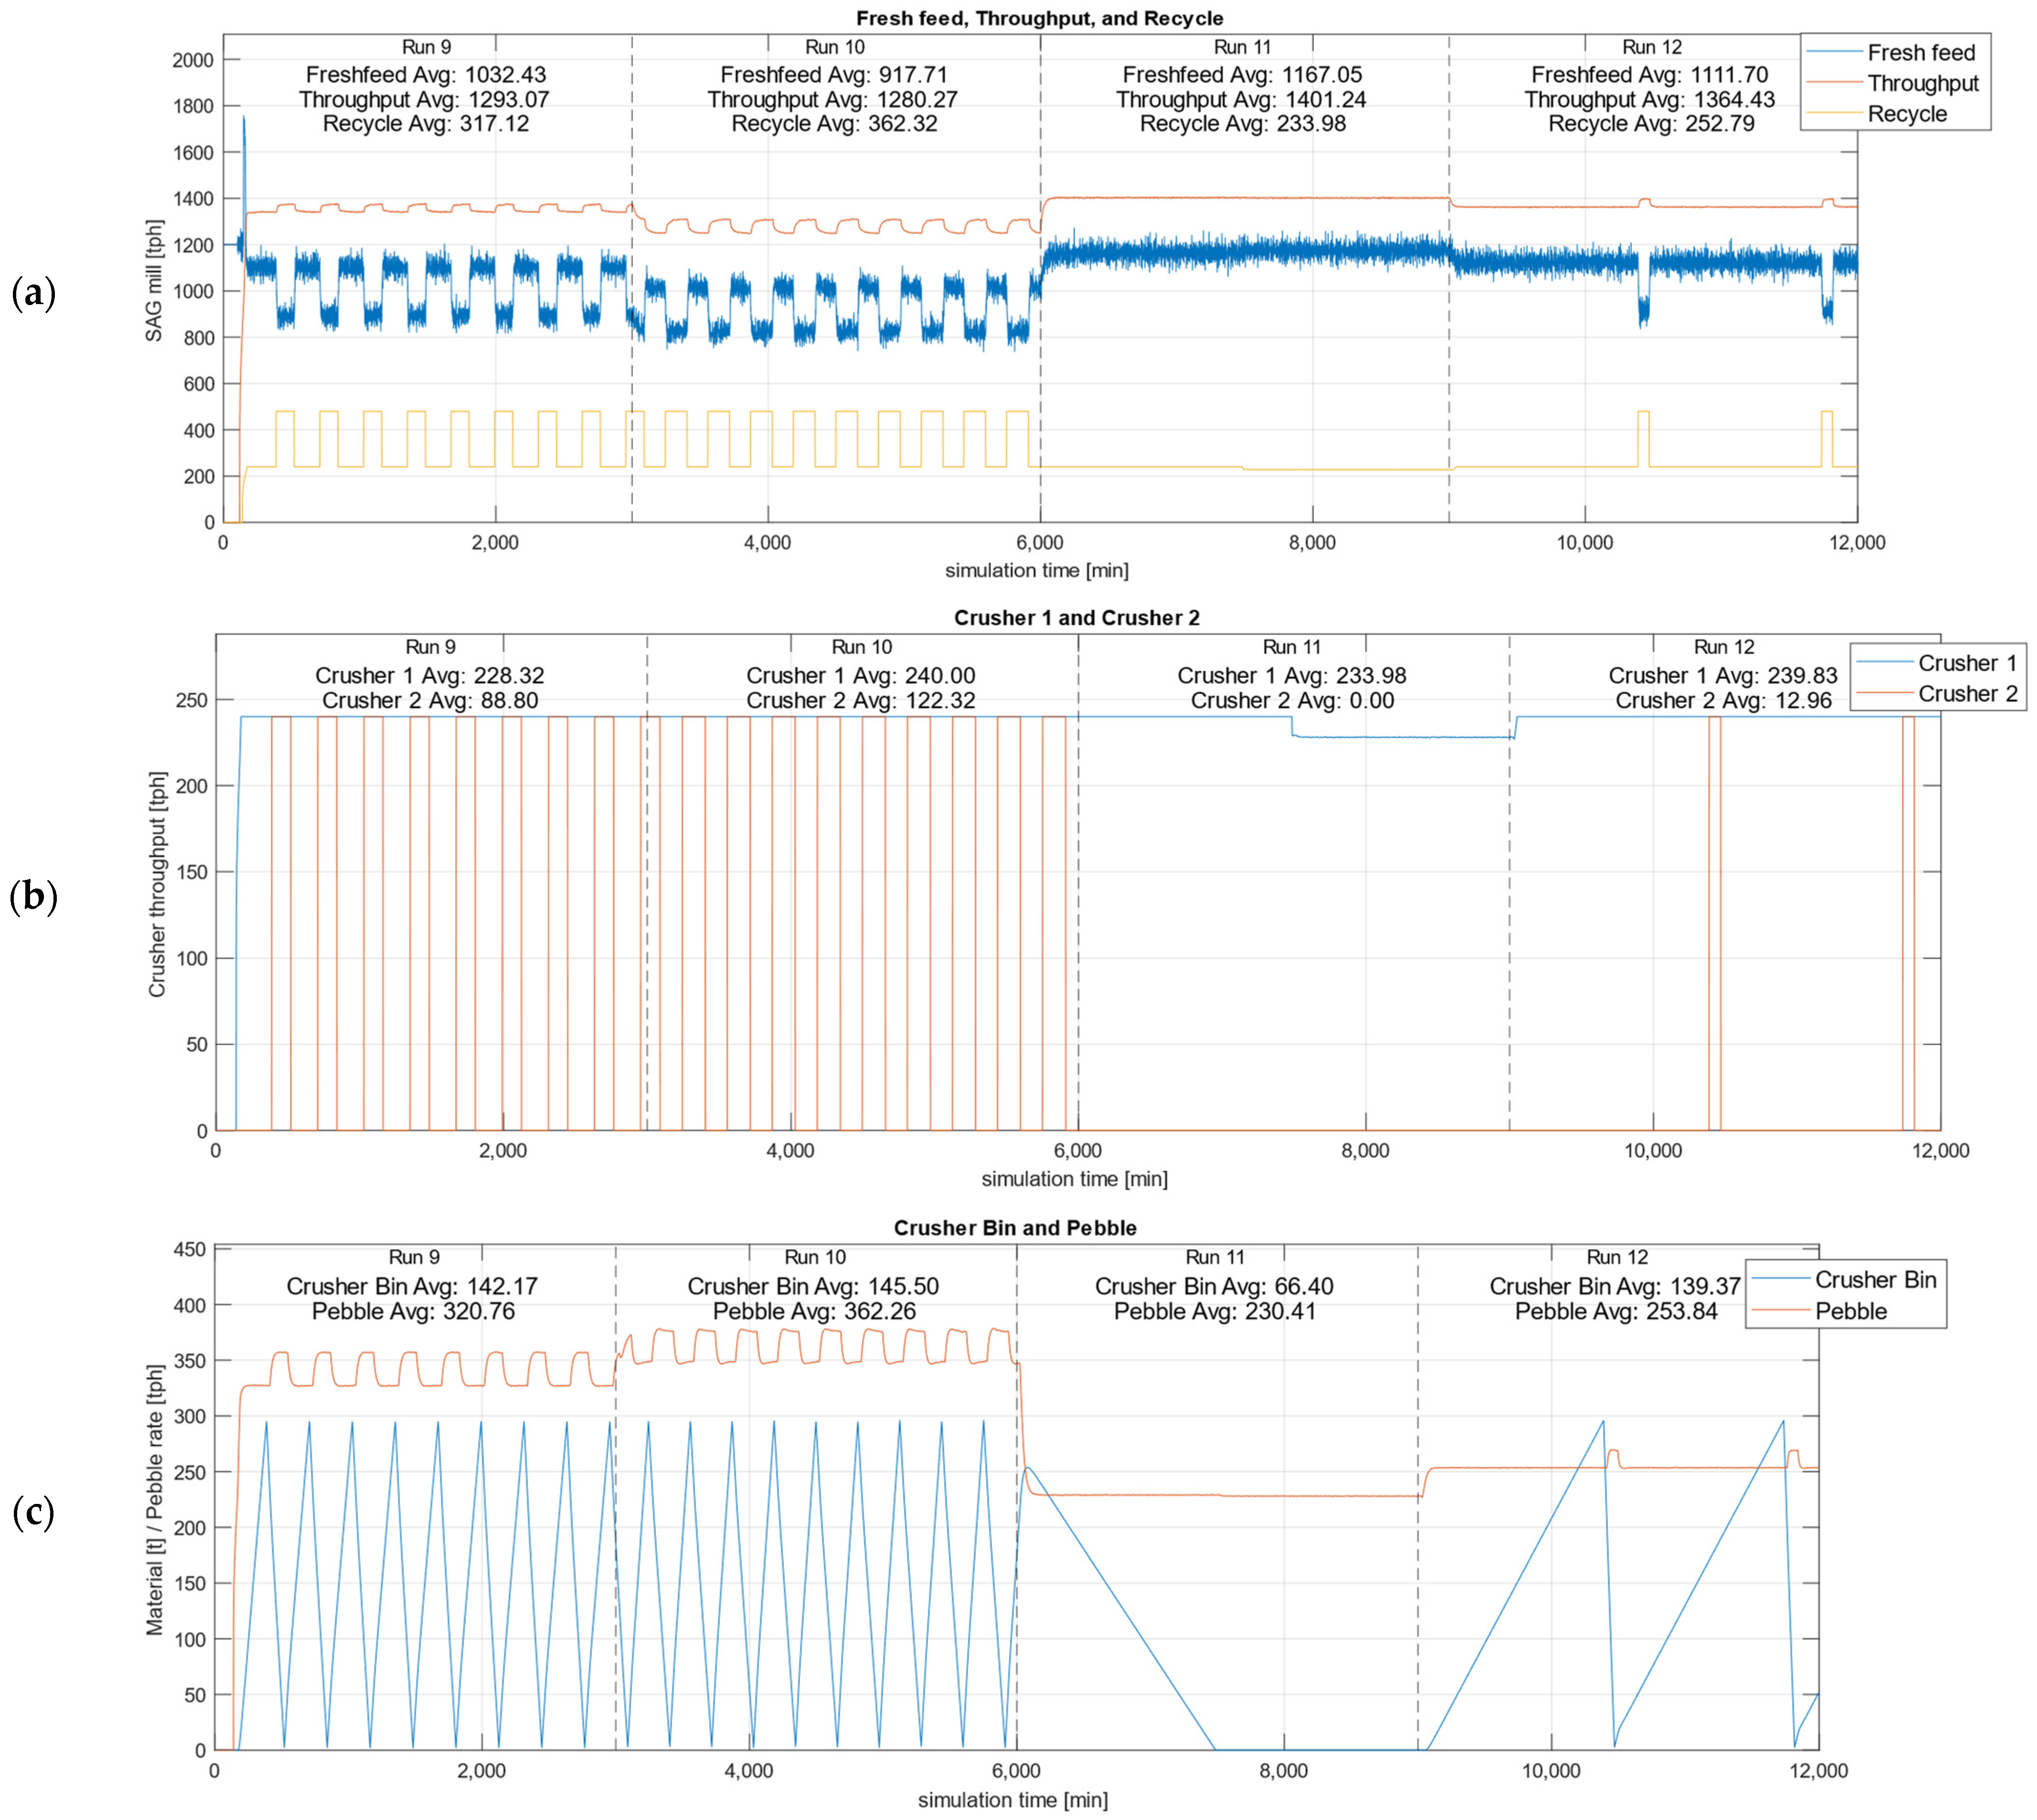
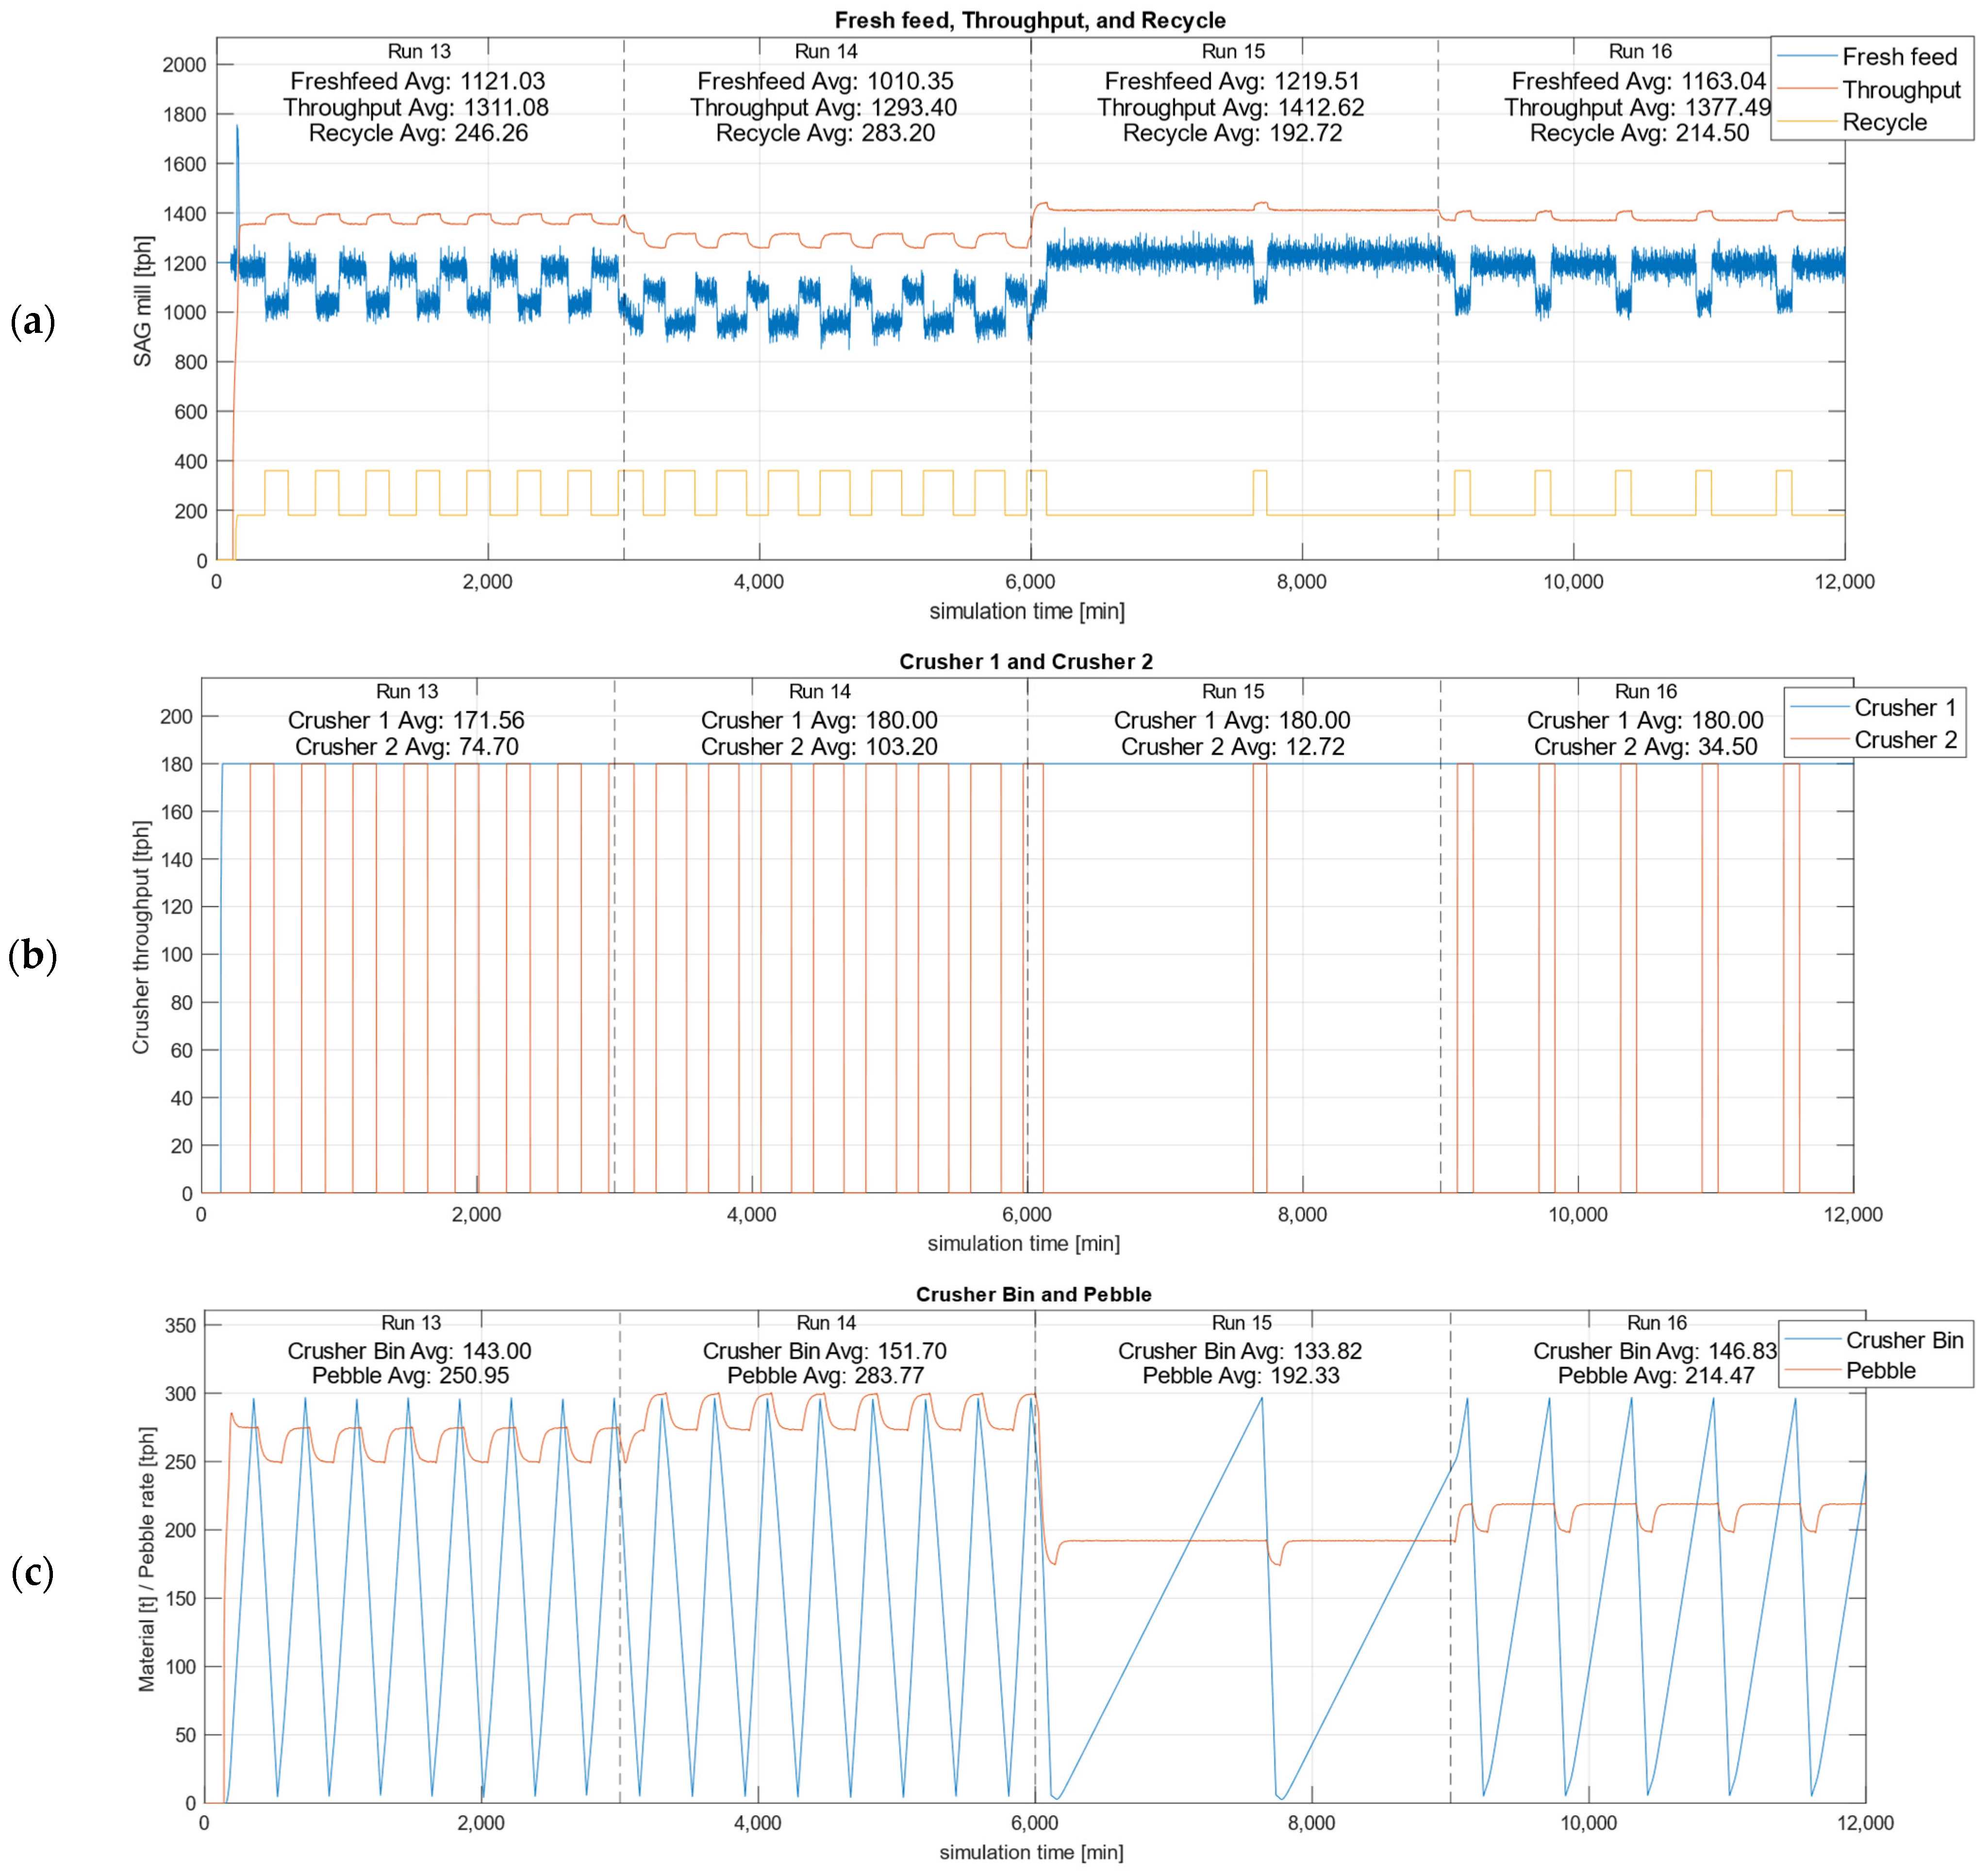
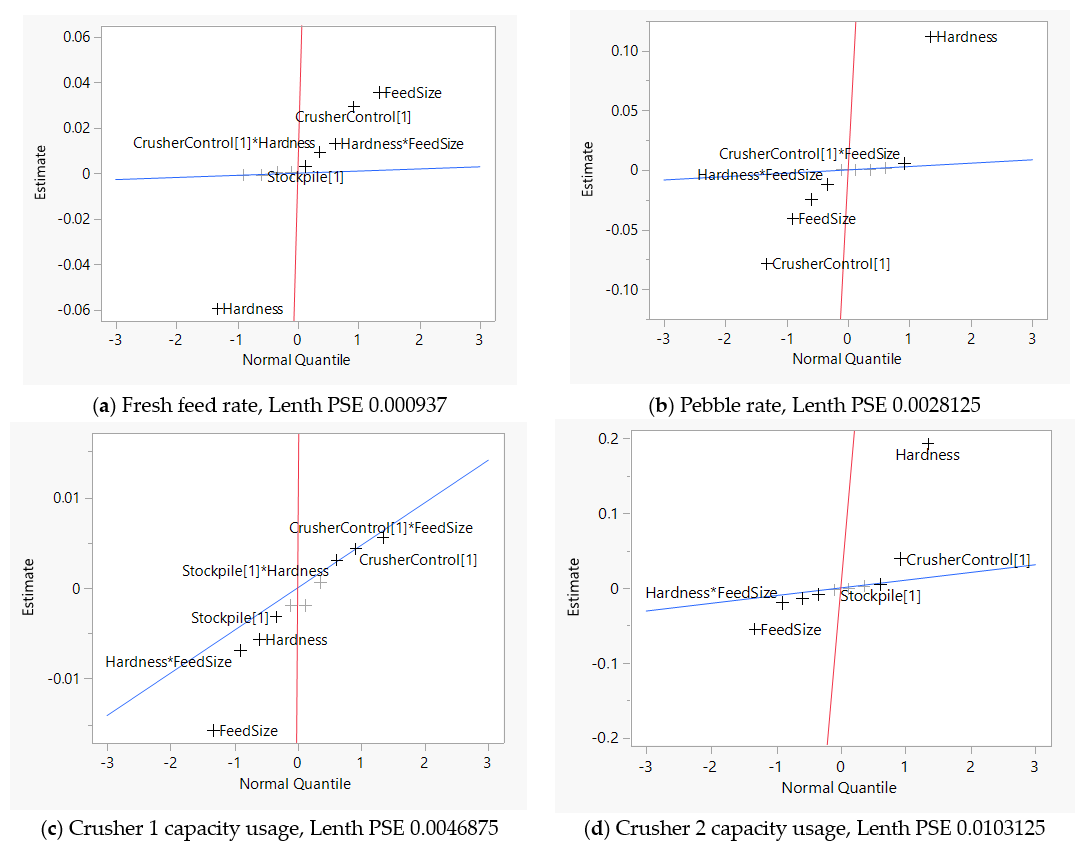
Using the DoE method with these parameters, the efficiency and performance of the SAG mill pebble circuit could be systematically evaluated. Key conditions such as the variability in rock hardness, the addition of a pre-crusher, the implementation of a crusher controller, and including a pebble stockpile can be optimized by analyzing the results of these experimental runs. The details of the ore hardness and particle feed sizes are listed in Appendix A.
The simulation in Simulink, illustrated in Figure 5, includes two identical SAG mills operating in parallel, with two pebble crushers positioned after the screens and a surge bin designated for critical size particles. In this setup, a single cone crusher cannot manage the entire recycling product. Therefore, a second cone crusher must be intermittently activated to maintain the surge bin level below 100%.
The assumptions for this scenario are as follows:
Wear: Wear is not considered; the capacity of all components remains constant regardless of wear.
Cone crusher: Cone crusher 1 operates continuously at 100% capacity. When the bin level reaches 300 tonnes, the second cone crusher is activated, also running at 100% capacity.
Crusher bin and stockpile: The crusher bin and pebble stockpile function as perfect mixing surge bins, with first in–first out configurations. Bin1 has a full load capacity of 300 tonnes, while the stockpile storage capacity is 1000 tonnes.
SAG mill: A PI controller of the SAG mill is applied to keep the mill load level and adjust the fresh feed rate accordingly. The SAG mill model is validated using a full-scale SAG mill; for details, see Appendix A.
Others: Ideal screens and splitters are used to evenly distribute the recycling load between the two mills.

3. Results

The simulation results of the pre-described flowsheet are presented in this section, where only the first four runs are shown in Figure 6. All simulation results can be found in Appendix B.
Figure 6 shows the dynamics of the studied twin SAG mill with a two-pebble crusher circuit. The four runs are considered with crusher control (smaller CSS, higher eccentric speed, but lower capacity) and a pebble stockpile for the crushed pebbles.
From Figure 6a, it can be seen that the average fresh feed rate is highest when the feed ore is soft and has been pre-crushed (Run 3). Due to the presence of the pebble stockpile, the recycling load back to the SAG mill can be managed by the stockpile control strategy. In this case, only the on/off controller is applied to the stockpile, resulting in a clear corresponding pattern between the fresh feed rate and the recycling rate.
Figure 6b presents the crushers’ capacity usage, showing that Crusher 1 is almost fully utilized while Crusher 2 operates when the bin level is high, as shown in Figure 6c. When the feed ore is soft and pre-crushed, the SAG mill generates significantly fewer pebbles, resulting in the low utilization of Crusher 2. Conversely, when the feed is coarse and hard (Run 1 and Run 2), the pebble rate is relatively high, and Crusher 2’s capacity is half occupied.
More simulation results can be found in the Appendix B. The summary of all 16 simulations is presented in Table 2. The results are normalized based on their average values for each simulation run.
  • Key Dynamics and Observations:
  • Crusher Controller’s Role:
Implementing the crusher controller with a smaller CSS and higher speed settings results in a finer product output from the pebbles. This leads to a finer total feed to the SAG mill, and a 5 to 10% increase in the overall fresh feed rate is observed. It also reduces the overall pebble rate. Consequently, both Crushers 1 and 2 can operate with high-capacity usage. For instance, in Run 1 and Run 2 (with controller), Crusher 1’s capacity usage is 0.96, and Crusher 2’s is around 0.5, indicating efficient processing with support from Crusher 2. When there is no crusher control, the SAG mill generates more pebbles. As shown in Run 2 and Run 6, the pebble rate increased by around 20%, and Crusher 2 had similar capacity loads of around 0.5. Since the crusher capacity drops with a tighter CSS and higher eccentric speed, this indicates that without the crusher control, the crushers are busy but not working efficiently.
  • Feed Size Impact (with Pre-crusher):
The addition of a pre-crusher results in finer feed, leading to higher fresh feed averages compared to coarse feed. This is particularly notable in soft ore conditions, where fine feed (e.g., Run 3) achieved the highest fresh feed rate, at 1.0. Coarse feed generally led to increased pebble rates and higher-capacity usage in the crushers, as seen in Run 2 and Run 4 compared with Run 1 and Run 3.
  • Pebble Stockpile Effect:
The presence of a pebble stockpile does not directly improve the fresh feed rate or reduce the pebble rate, but it contributes to the enhanced manageability of the recycling rate. This is particularly evident when comparing runs with similar other conditions, with and without a stockpile, as seen in the dynamic plots in Figure 6 and the figures in the Appendix B.
In Figure 6a, with a varying hardness and feed size, the recycling load is well managed, and a clear on/off behavior is observed due to the use of the on/off stockpile control. In Figure A5 and Figure A6, without a stockpile, the pebbles are crushed and directly fed back to the SAG mill. This unmanageable behavior can lead to more turbulence in the feed, thereby reducing the mill performance. The pebble stockpiles had similar effects in a study by Cornish et al., in which over ten SAG mill grinding circuits were observed [24].
  • Material Hardness Influence:
Softer feed material typically leads to a higher throughput and lower pebble rate. The highest fresh feed rate, highlighted in orange in Table 2, underscores the significant impact of ore hardness on the overall performance of the mill circuit. However, the ore hardness is largely uncontrollable. Moreover, changes in hardness can introduce dynamic turbulence into the circuit.
In Figure 7, the normal plots of DoE are presented. The blue lines represent the expected distribution of effects if they were all due to random noise. Points that deviate significantly from the line are considered significant effects. These deviations suggest that the corresponding factors have a meaningful impact on the response variable.
Since Crusher 1 is almost fully utilized in all scenarios, all factors seem to have a minor impact, as shown in Figure 7c. However, the rest of the normal plots in Figure 7a,b,d highlight the significant effect of ore hardness. A harder ore feed leads to a lower fresh feed rate and a higher pebble rate, resulting in the increased usage of Crusher 2.
The second important factor is feed size. A finer feed size not only increases the fresh feed rate but also reduces the number of pebbles generated by the SAG mill. The presence of the cone crusher controller (with smaller CSS, higher eccentric speed, but lower capacity) appears to have a positive effect on both the feed rate and reduces the pebble rate.
  • Interactions and Optimizations:
  • Optimal Conditions for Maximum Throughput:
The highest fresh feed rates were observed under fine feed and soft ore conditions, particularly with the cone crusher controller active. This combination maximized the efficiency of the SAG mill, minimized the pebble rate, and optimized the crusher usage.
  • Strategic Use of Crusher Controller:
The crusher controller’s ability to adjust the operational parameters dynamically based on the real-time conditions plays a crucial role in optimizing the circuit. By maintaining a smaller CSS and higher speed, the controller reduces the pebble load and enhances the fresh feed throughput of the SAG mill by 5 to 10% (see Table 2, Runs with fine/coarse crusher settings, such as Run 2 vs. Run 6). The crusher controller also balances the crusher’s utilization.
  • Recycling Rate and Stockpile Management:
The presence of a pebble stockpile allows for the better management of the recycling rate, which primarily depends on the feed material. The stockpile’s ability to stabilize the recycling rate provides advanced control systems with better opportunities to optimize performance.

4. Conclusions

The dynamic simulation framework presented in this study models a twin SAG mill circuit with pebble crushers and stockpile management using Simulink. Using the DoE approach, the key findings indicate that implementing a crusher controller with a smaller CSS and higher speed settings results in a finer product output. This leads to a finer feed to the SAG mill and a 5 to 10% increase in the overall fresh feed rate, as well as a reduction in the overall pebble rate, allowing both crushers to operate efficiently.
Softer feed materials lead to a higher throughput and lower pebble rates. The highest fresh feed rates were observed with fine feed and soft ore conditions, underscoring the significant impact of ore hardness on mill circuit performance. Conversely, a harder ore feed results in lower fresh feed rates and higher pebble rates, increasing the usage of Crusher 2. A finer feed size generated by a pre-crusher enhances the fresh feed rate and reduces pebble generation.
While the presence of a pebble stockpile does not directly improve the fresh feed rate or reduce the pebble rate, it significantly enhances the manageability of the recycling rate. This manageability is crucial for stabilizing the circuit and preventing turbulence in the feed, thereby improving the overall mill performance.
In conclusion, the integration of dynamic models and control strategies, particularly the implementation of a crusher controller and the use of a pebble stockpile, significantly improves the fresh feed rate of the SAG mill circuit. These findings provide valuable insights for optimizing grinding processes and enhancing the throughput in mineral processing plants.

Author Contributions

Conceptualization, H.L.; methodology, H.L. and G.A.; software, H.L., G.A. and K.B.; investigation, H.L.; resources, H.L.; data curation H.L.; writing—original draft preparation, H.L.; writing—review and editing, H.L., G.A. and K.B.; visualization, H.L., G.A. and K.B.; supervision, G.A. and M.E. All authors have read and agreed to the published version of the manuscript.

Funding

This research received no external funding.

Data Availability Statement

This data is subject to limited access as it is the property of FLSmidth A/S.

Conflicts of Interest

Author Haijie Li is the employee of the company Mining R&D, FLSmidth A/S. The authors declare no conflict of interest.

Appendix A

The details of the simulation settings (see Table A1 and Figure A1) and SAG mill modelling information (see Table A2 and Table A3 and Figure A2) can be found in this section.
Table A1. Simulation parameters used in the case studies.
ParametersValueParameterValue
A 1 0.1 D m a x 0.7
A 2 5 × 10⁻⁴ c 1 2 mm
α 1 0.9 c 2 (SAG discharge)60 mm
α 2 1.8 D i 0.35
α 2 2.6Screen aperture10 mm
μ 1.8
Table A2. SAG mill data from a copper mine. The SAG mill model used in this study is validated and calibrated based on these site data.
ParameterDiameterLengthBall ChargeInstalled PowerSpeed
Value34′15′~10%9000 kW9.94 rpm
Table A3. The ore hardness and SAG mill energy are taken from a copper mine and used for this study.
Soft OreHard Ore
A × b70–8040–50
SAG Spec energy3.7 kWh/t6.1 kWh/t
Figure A1. The SAG mill model used in this study was validated and calibrated using data from a copper mine. This plot shows the simulation data versus the plant survey data. It should be noted that the results shown in this plot do not represent a specific simulation in the DoE, but the selection function parameters and hard ore A × b values are used.
Minerals 14 00716 g0a1
Figure A2. Fresh feed size distribution used in the simulation. The fine feed has a F80 = 50 mm and coarse feed F80 = 84 mm.
Minerals 14 00716 g0a2

Appendix B

Detailed simulation results can be found in this section with the rest of the DoE runs, from Run 5 to Run 16, see Figure A3, Figure A4 and Figure A5.
Figure A3. Simulation results of the SAG mill product size P80, transfer size T80 (undersize) and pebble size P80 (oversize).
Minerals 14 00716 g0a3
Figure A4. The simulation results from Run 5 to Run 8 include the circuit with stockpile and coarse crusher settings.
Minerals 14 00716 g0a4
Figure A5. The simulation results from Run 9 to Run 12 include the circuit with NO stockpile and coarse crusher settings.
Minerals 14 00716 g0a5
Figure A6. The simulation results from Run 13 to Run 16 include the circuit with NO stockpile and with fine crusher settings.
Minerals 14 00716 g0a6

References

  1. Yu, P. A Generic Dynamic Model Structure for Tumbling Mills. Ph.D. Thesis, University of Queensland, Brisbane, Australia, 2017. [Google Scholar]
  2. Morrell, S. Power draw of wet tumbling mills and its relationship to charge dynamics. Pt. 2: An empirical approach to modelling of mill power draw. Transactions of the Institution of Mining and Metallurgy. Section C. Miner. Process. Extr. Metall. 1996, 105, C43–C51. [Google Scholar]
  3. Kojovic, T.; Hilden, M.; Powell, M.; Bailey, C. Updated Julius Kruttschnitt semi-autogenous grinding mill model. In Proceedings of the 11th AusIMM Mill Operators’ Conference 2012, Hobart, Australia, 29–31 October 2012. [Google Scholar]
  4. Yu, P.; Xie, W.; Liu, L.; Powell, M. Development of a dynamic mill model structure for tumbling mills. In Proceedings of the XXVII International Mineral Processing Congress-IMPC 2014 Conference Proceedings, Santiago, Chile, 1 January 2014. [Google Scholar]
  5. Morrell, S.; Valery, W.; Banini, G.; Latchireddi, S. Developments in AG/SAG mill modelling. In Proceedings of the Autogenous and Semiautogenous Grinding Technology, Vancouver, BC, Canada, 30 September–3 October 2001; pp. 71–84. [Google Scholar]
  6. de Carvalho, M. Mechanistic Modelling of Semi-Autogenous Grinding. Ph.D. Thesis, University of Rio de Janeiro, Rio de Janeiro, Brazil, 2013. [Google Scholar]
  7. Hoseinian, F.S.; Faradonbeh, R.S.; Abdollahzadeh, A.; Rezai, B.; Soltani-Mohammadi, S. Semi-autogenous mill power model development using gene expression programming. Powder Technol. 2017, 308, 61–69. [Google Scholar] [CrossRef]
  8. Saldaña, M.; Gálvez, E.; Navarra, A.; Toro, N.; Cisternas, L.A. Optimization of the SAG grinding process using statistical analysis and machine learning: A case study of the Chilean copper mining industry. Materials 2023, 16, 3220. [Google Scholar] [CrossRef] [PubMed]
  9. Avalos, S.; Kracht, W.; Ortiz, J.M. Machine learning and deep learning methods in mining operations: A data-driven SAG mill energy consumption prediction application. Min. Metall. Explor. 2020, 37, 1197–1212. [Google Scholar] [CrossRef]
  10. Evertsson, C.M. Cone Crusher Performance. Ph.D. Thesis, Chalmers University of Technology, Gothenburg, Sweden, 2000. [Google Scholar]
  11. Quist, J. Simulation of Wear in Cone Crushers. Ph.D. Thesis, Chalmers University of Technology, Gothenburg, Sweden, 2016. [Google Scholar]
  12. Hulthén, E. Real-Time Optimization of Cone Crushers. Ph.D. Thesis, Chalmers University of Technology, Gothenburg, Sweden, 2010. [Google Scholar]
  13. Powell, M.; Evertsson, C.M.; Mainza, A. Redesigning SAG Mill Recycle Crusher Operation. In Proceedings of the SAG Conference 2019 Vancouver, Vancouver, BC, Canada, 22–26 September 2019. [Google Scholar]
  14. Erwin, K.; Meinke, C.; Chandramohan, R.; Lane, G.; Foggiatto, B. Pebble Crushing Circuits: A SAG Mill’s Unappreciated Saviour. In Proceedings of the SAG Conference 2023 Vancouver, Vancouver, BC, Canada, 24–28 September 2023. [Google Scholar]
  15. Tavares, L.M.; de Carvalho, R.M. Modeling breakage rates of coarse particles in ball mills. Miner. Eng. 2009, 22, 650–659. [Google Scholar] [CrossRef]
  16. Powell, M.S.; Mainza, A.N.; Hilden, M.; Yahyaei, M. Full pre-crush to SAG mills–the case for changing this practice. In Proceedings of the 6th International Conference on Semi-Autogenous and High-Pressure Grinding Technology, Canadian Institute of Mining and Metallurgy (CIM), Vancouver, BC, Canada, 20–24 September 2015. [Google Scholar]
  17. de Carvalho, R.M.; Gama, T.S.; da Silva, B.P.; Tavares, L.M. Long-term simulation of an industrial coke breeze grinding circuit. Miner. Eng. 2024, 205, 108498. [Google Scholar] [CrossRef]
  18. Bhadani, K.; Asbjörnsson, G.; Hofling, K.; Hulthén, E.; Evertsson, M. Application of design of experiments (DoE) in evaluating crushing-screening performance for aggregates production. Miner. Eng. 2024, 209, 108616. [Google Scholar] [CrossRef]
  19. Li, H.; Evertsson, M.; Lindqvist, M.; Hulthén, E.; Asbjörnsson, G. Dynamic modeling and simulation of a SAG mill-pebble crusher circuit by controlling crusher operational parameters. Miner. Eng. 2018, 127, 98–104. [Google Scholar] [CrossRef]
  20. Austin, L.G.; Cho, H. An alternative method for programming mill models. Powder Technol. 2002, 122, 96–100. [Google Scholar] [CrossRef]
  21. Powell, M.; Hilden, M.; Ballantyne, G.; Liu, L.; Tavares, M. The appropriate, and inappropriate, application of the JKMRC t10 relationship. In Proceedings of the XXVII International Mineral Processing Congress–IMPC, Santiago, Chile, 20–24 October 2014. [Google Scholar]
  22. Jnr, W.V.; Morrell, S. The development of a dynamic model for autogenous and semi-autogenous grinding. Miner. Eng. 1995, 8, 1285–1297. [Google Scholar]
  23. Asbjörnsson, G. Crushing Plant Dynamics. Ph.D. Thesis, Chalmers University of Technology, Gothenburg, Sweden, 2015. [Google Scholar]
  24. Cornish, B.; Butar, B.; Muzinda, I.; Peacock, R. Evaluating the Operating Performance of 40-Foot SAG Mill Circuit Designs. In Proceedings of the SAG Conference 2023 Vancouver, Vancouver, BC, Canada, 24–28 September 2023. [Google Scholar]
Figure 1. Schematic of data structure in the SAG mill simulation.
Minerals 14 00716 g001
Figure 2. Product PSD of different cone crusher settings. Data from Evertsson [8], tested on a Svedala Hydrocone cone crusher.
Minerals 14 00716 g002
Figure 3. The capacity of cone crushers with different settings. Data from Lindqvist [9], tested on an FLS Raptor 900 cone crusher.
Minerals 14 00716 g003
Figure 4. Flowsheet of a typical SAG mill pebble crusher circuit with options adding pre-crushers, stockpiles and other circuit configurations. These different layouts will be simulated using a DoE approach.
Minerals 14 00716 g004
Figure 5. Simulation setup in Simulink involves two identical SAG mills paired with two pebble crushers. The highlighted signals are shown in the simulation results.
Minerals 14 00716 g005
Figure 6. The simulation results from Run1 to Run4 include the circuit with stockpile and fine crusher settings. Figure (a) shows the throughput, fresh feed rate, and recycle rate of each SAG mill. Figure (b) shows the pebble crusher utilization rate. Figure (c) shows the pebble rate and crusher bin level.
Minerals 14 00716 g006
Figure 7. Normal plots to assess the significance of effects in the DoE results. (a) is the fresh feed rate, (b) is the pebble rate, (c,d) are the crusher capacity utilization. The blue line has a slope equal to Lenth’s PSE, and the red line slope is 1.
Minerals 14 00716 g007
Table 1. The DoE table for the simulation conditions of a SAG mill pebble circuit, where Yes indicates presence and No indicates absence.
RunPebble StockpileCrusher ControllerFeed SizeHardness
1YesFineFineHard
2YesFineCoarseHard
3YesFineFineSoft
4YesFineCoarseSoft
5YesCoarseFineHard
6YesCoarseCoarseHard
7YesCoarseFineSoft
8YesCoarseCoarseSoft
9NoCoarseFineHard
10NoCoarseCoarseHard
11NoCoarseFineSoft
12NoCoarseCoarseSoft
13NoFineFineHard
14NoFineCoarseHard
15NoFineFineSoft
16NoFineCoarseSoft
Table 2. Simulation results of all DoE runs are normalized and highlight both the highest (in orange) and lowest (in blue) fresh feed rates.
RunPebble StockpileCrusher SettingsFeed SizeHardnessFresh Feed
Avg
Pebble Rate
Avg
Pebble/
Freshfeed
Crusher1 UsageCrusher2
Usage
SAG T80 (mm)
1YesFineFineHard0.930.690.220.960.422.2
2YesFineCoarseHard0.830.770.2810.582.5
3YesFineFineSoft10.530.160.990.111.1
4YesFineCoarseSoft0.960.580.180.990.181.3
5YesCoarseFineHard0.860.870.30.950.382.4
6YesCoarseCoarseHard0.7510.410.522.6
7YesCoarseFineSoft0.960.630.20.950.021.3
8YesCoarseCoarseSoft0.920.690.2210.061.4
9NoCoarseFineHard0.840.870.310.950.372.4
10NoCoarseCoarseHard0.750.990.410.512.7
11NoCoarseFineSoft0.960.630.20.9801.2
12NoCoarseCoarseSoft0.910.690.2310.051.4
13NoFineFineHard0.920.680.220.960.422.3
14NoFineCoarseHard0.830.770.2810.572.5
15NoFineFineSoft10.520.1610.071.1
16NoFineCoarseSoft0.950.580.1810.191.3
Disclaimer/Publisher’s Note: The statements, opinions and data contained in all publications are solely those of the individual author(s) and contributor(s) and not of MDPI and/or the editor(s). MDPI and/or the editor(s) disclaim responsibility for any injury to people or property resulting from any ideas, methods, instructions or products referred to in the content.

