Article

Discovery and Exploration of the Luming Porphyry Mo Deposit, Northeastern China: Implications for Regional Prospecting

by
Bangfei Gao
1,*,
Minghua Dong
2,
Hui Xie
1,
Zhiliang Liu
2,
Yihang Li
1 and
Tong Zhou
3
1
China Railway Resources Group Co., Ltd., Beijing 100039, China
2
China Railway Resources Group Survey and Design Co., Ltd., Langfang 065000, China
3
Yichun Luming Mining Co., Ltd., Yichun 152500, China
*
Author to whom correspondence should be addressed.
Minerals 2024, 14(7), 718; https://doi.org/10.3390/min14070718
Submission received: 13 May 2024 / Revised: 14 July 2024 / Accepted: 14 July 2024 / Published: 16 July 2024

Abstract

:
Over the past two decades, significant deposit discoveries were made in Northeastern China, including the super-large Chalukou, Daheishan, and Luming porphyry Mo deposits. The discovery of the Luming deposit was accomplished through verification of stream sediment anomalies, with mineralization closely associated with early Jurassic monzogranite and granite porphyry. Previous studies primarily focused on the mineralization mechanisms of these deposits without adequately addressing the exploration methods and prospecting criteria. This study involved a comprehensive re-evaluation of geological observations, analysis of rock primary halo, gravity and magnetic surveys, and induced polarization surveys conducted during exploration campaigns at the Luming porphyry Mo deposit. The results suggest that hydrothermal breccias play a critical role in controlling the mineralization by forming a central low-grade core within the deposit while the Mo mineralization and hydrothermal alteration exhibit a donut-shaped distribution around it. The primary halo shows a distinct metal zonation moving from a central W-Bi-Mo-(Sb) to a peripheral Cu-Co-Ni and a distal Pb-Zn-Ag-In. The mineralization zone exhibits a low Bouguer gravity anomaly, negative magnetic anomaly, medium to low resistivity, and moderate to high chargeability, indicating the effectiveness of geophysical methods in defining the extent of the ore body. The Luming porphyry Mo deposit and distal skarn-epithermal Pb-Zn mineralization are parts of a porphyry-related magmatic-hydrothermal system. The results of this study offer valuable insights into the genesis of porphyry Mo deposits and their implications for prospecting in the forested region of Northeastern China.

1. Introduction

Molybdenum (Mo) is a critical metal that plays a significant role in economic and social development [1]. Porphyry Mo deposits represent the dominant type worldwide, at over 90% [2,3]. Globally, porphyry Mo deposits are primarily found within the Circum-Pacific Metallogenic Belt and the Tethys Metallogenic Belt, which are linked to plate subduction processes [3,4,5,6,7]. China has a significant concentration of Mo deposits, with proven reserves of approximately 5.80 million metric tons accounting for around 38.6% of global reserves [8]. Most Mo deposits in China are located within the eastern Qinling-Dabie Orogenic Belt and the eastern Central Asian Orogenic Belt (i.e., Xing-Meng Metallogenic Belt) [9,10,11,12].
Over the past two decades, significant porphyry Mo deposits were discovered in the forested regions of the Lesser Xing’an Range–Zhangguangcai Range. These include super-large Mo deposits at Chalukou [13], Daheishan [11], and Luming [14], as well as large Mo deposits at Fu’anpu [15], Huojihe [16], Dashihe [17], Jidetun [18], Chang’anpu [19], and numerous other locations (Figure 1). Consequently, this region has emerged as a prominent area for mineral deposit research, with extensive studies conducted in this field [4,6,7,9,20,21,22,23,24,25,26,27,28,29]. Previous studies primarily focused on the ore-forming tectonic setting and ore genesis, such as rock geochemistry, geochronology, isotope geochemistry, and fluid circulation [16,30,31,32,33,34,35,36,37,38,39]. Limited literature exists discussing mineral prospecting [29,40,41,42,43,44,45]. As a result, there is currently a lack of comprehensive overview regarding prospecting methodologies for porphyry Mo deposits in forested regions of Northeastern China.
The Luming porphyry Mo deposit (Luming PMD) is situated in the northern region of the Lesser Xing’an Range–Zhangguangcai Range Metallogenic Belt (LXRZRMB) (Figure 1). The Luming PMD was initially discovered by stream sediment geochemistry, after which its three-dimensional extent was delineated through drilling exploration. The Luming PMD is estimated to possess indicated and inferred resources totaling 814 million metric tons, with an average Mo grade of 0.092% and a total Mo metal content of 751 thousand metric tons. Furthermore, the ore body exhibits an associated Cu grade averaging 0.015%, corresponding to a Cu metal quantity of 118 thousand metric tons. Notably distinguished by its large-scale operations (processing approximately 15 million metric tons of ores annually), shallow burial conditions (average overburden thickness is about 10 m), and low stripping ratio (approximately 1.0), the Luming PMD demonstrates favorable economic features. Consequently, extensive research has been conducted on the Luming PMD, resulting in the accumulation of substantial fundamental geological data, essential for investigating ore genesis and mineral prospecting [43,46,47,48,49,50,51,52,53,54,55].
The purpose of this study is to provide a comprehensive overview of the exploration methods and criteria employed in the Luming PMD, with a particular focus on its discovery history, and a detailed analysis of its geological, geochemical, and geophysical characteristics. The findings derived from this study can offer valuable insights into the genesis of porphyry Mo deposits and their implications for prospecting concealed resources in Northeastern China.

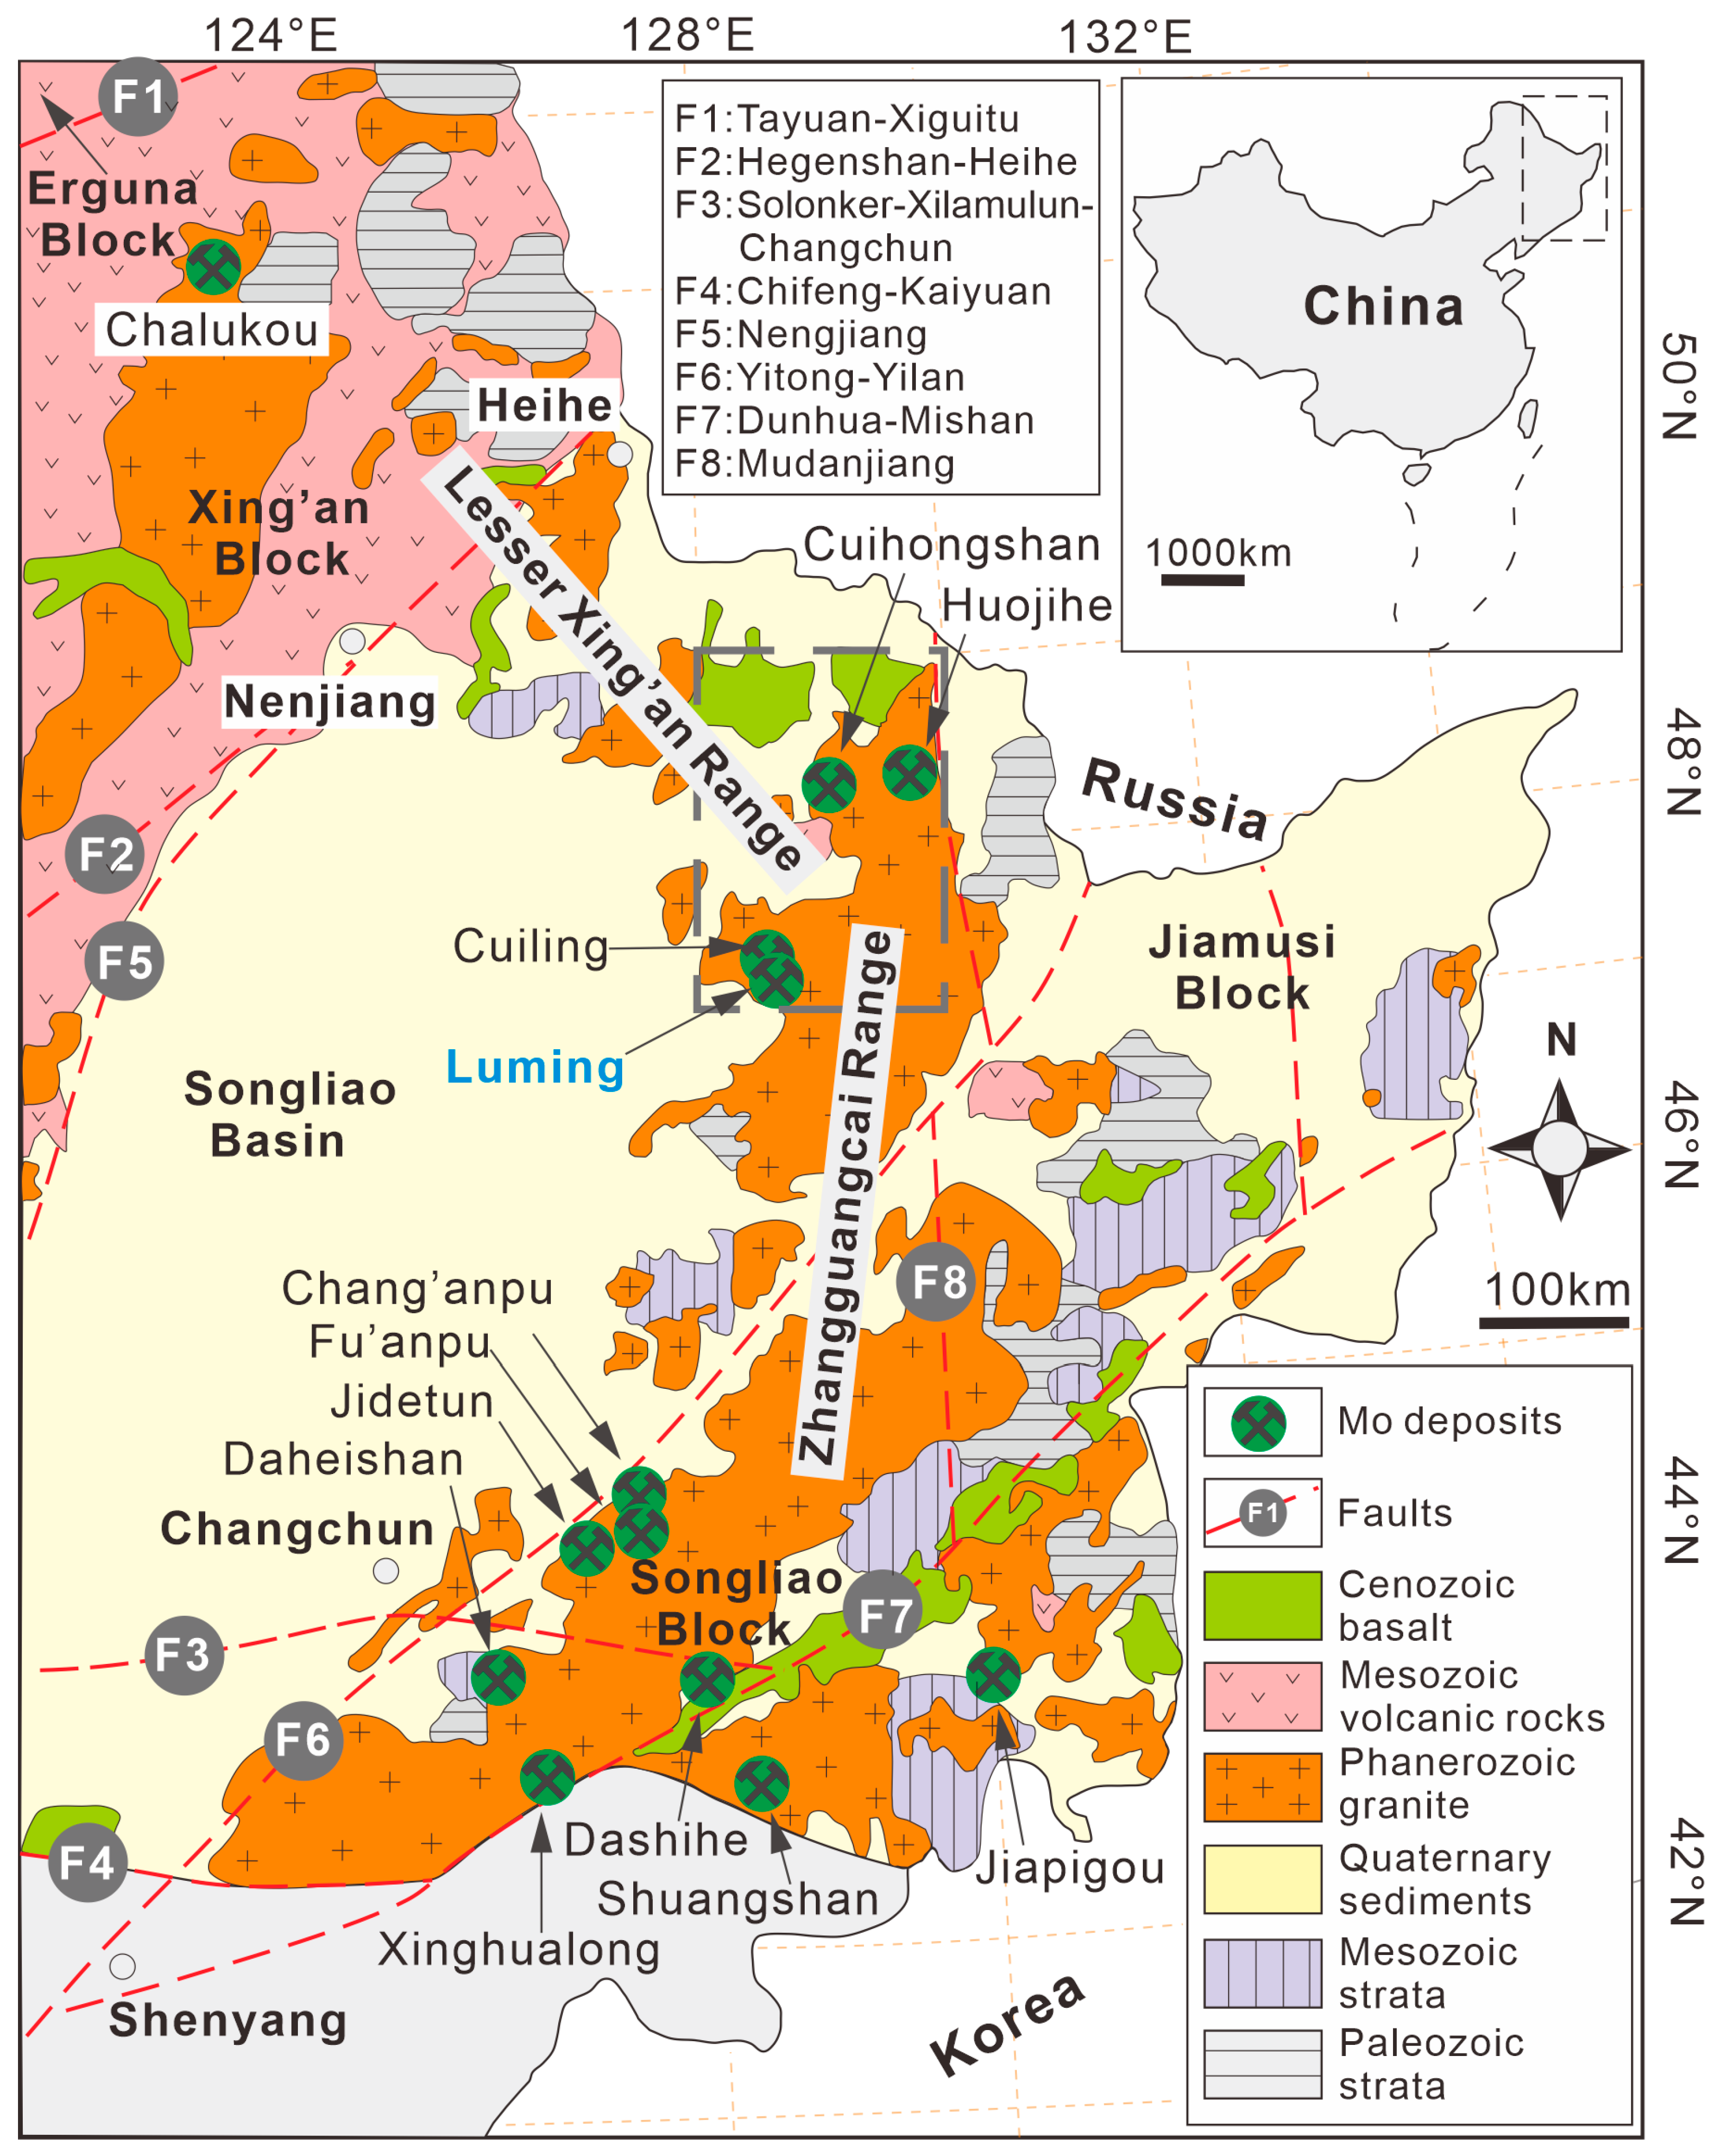
2. Regional Geology and Geophysics

Geologically, the region is situated in the eastern part of the Central Asian Orogenic Belt and at the junction of the Circum-Pacific Orogenic Belt [25,27,56]. Northeastern China can be divided into four blocks from north to south: Erguna, Xing’an, Songliao, and Jiamusi (Figure 1). These blocks are delineated by the Tayuan-Xiguitu Fault, Hegenshan-Heihe Fault, and Mudanjiang Fault [16,27,54]. The combined Erguna, Xing’an, and Songliao blocks are collectively referred to as the Xing’an-Mongolian (Xing-Meng) Orogenic Belt [5,21,28,57]. The tectonic evolution of this region since the Paleozoic era can be divided into three successive stages: the closure of the Palaeo-Asian Ocean, the subduction and closure of the Mongol-Okhotsk Ocean, and subsequent subduction events related to the Palaeo-Pacific Ocean [4,16,19,31,54,58].
The LXRZRMB is situated in the central-eastern part of Northeastern China [6,25,34], spanning across the Xing’an and Songliao Blocks [30,55]. This region is characterized by deep-seated faults that predominantly trend NE, NNE, NNW, and E–W (Figure 1). The distribution of magmatic rocks in the area is controlled by NNE and NE-oriented faults, often intersected by NNW and E–W trending faults [54]. The widespread occurrence of Mesozoic magmatic rocks in this region is believed to be associated with the evolution of the northern Mongol-Okhotsk Ocean and eastern Paleo-Pacific Ocean [24,27,54]. Paleozoic and Mesozoic formations are intermittently distributed within these intrusive rocks. The principal types of mineral deposits in this region are associated with magmatic processes, including porphyry-type, skarn-type, as well as vein-type molybdenum, tungsten, iron, copper, lead-zinc, and gold mineralization [35,36,59]. Porphyry Mo deposits are predominantly located within a NE-trending Jurassic granite belt, as illustrated in Figure 1.
The morphology of the NE-trending tectonic-magmatic belt in this region can be effectively delineated by magnetic anomalies, which exhibit varying intensities ranging from –300 to 500 nT, with a maximum value recorded at 1000 nT (Figure 2).
These anomalies display alternating patterns but predominantly show positive characteristics. It is well established that a consistently negative anomaly is typically found in low-grade metamorphic rocks as well as I-type granite belts; conversely, a positive anomaly suggests occurrences related to S-type granites or volcanic belts [64,65]. In this context, Luming PMD is situated within an area characterized by moderate to high intensity levels, with values ranging between 300 and 500 nT. Extensive areas display negative magnetic anomalies on its western, northern, and eastern sides, with intensities ranging from –100 to –200 nT. Most molybdenum and polymetallic deposits in the region are situated within or near the transition zone between positive and negative magnetic anomalies adjacent to the positive anomaly area (Figure 2A).
The aerogravity data exhibit a mirror-image relationship with the aeromagnetic anomaly, indicating predominantly low Bouguer gravity anomalies in the region. The contours of the gravity anomaly exhibit a distribution pattern oriented towards the NE and N–S directions, with values ranging from −20 to 15 × 10−6 m/s2 (Figure 2B). Low gravity anomalies are primarily associated with igneous rock belts, while high gravity anomalies are attributed to residual sedimentary or metamorphic formations within these igneous rocks [63]. The Luming PMD is situated on a gravity gradient zone that shifts from high to low gravity (Figure 2B). The regional occurrence of both elevated and depressed gravity anomalies facilitates the localization of mineral deposits [64]. For example, the presence of depressed gravity anomalies at Huojihe (points 15–17, 21–26 in Figure 2) and Luming (points 1–4, 27 in Figure 2), and an elevated gravity anomaly at Qianjin-Xiling-XiaoXilin (points 5–7, 18–20 in Figure 2) serve as indicators of numerous mineral occurrences. Regions exhibiting sharp boundaries, curvatures, or distortions in gravitational gradients are often associated with intricate geological structures and intense magmatic-hydrothermal activities, which collectively constitute the most favorable locations for mineralization [64].

3. Discovery History and Exploration Campaigns
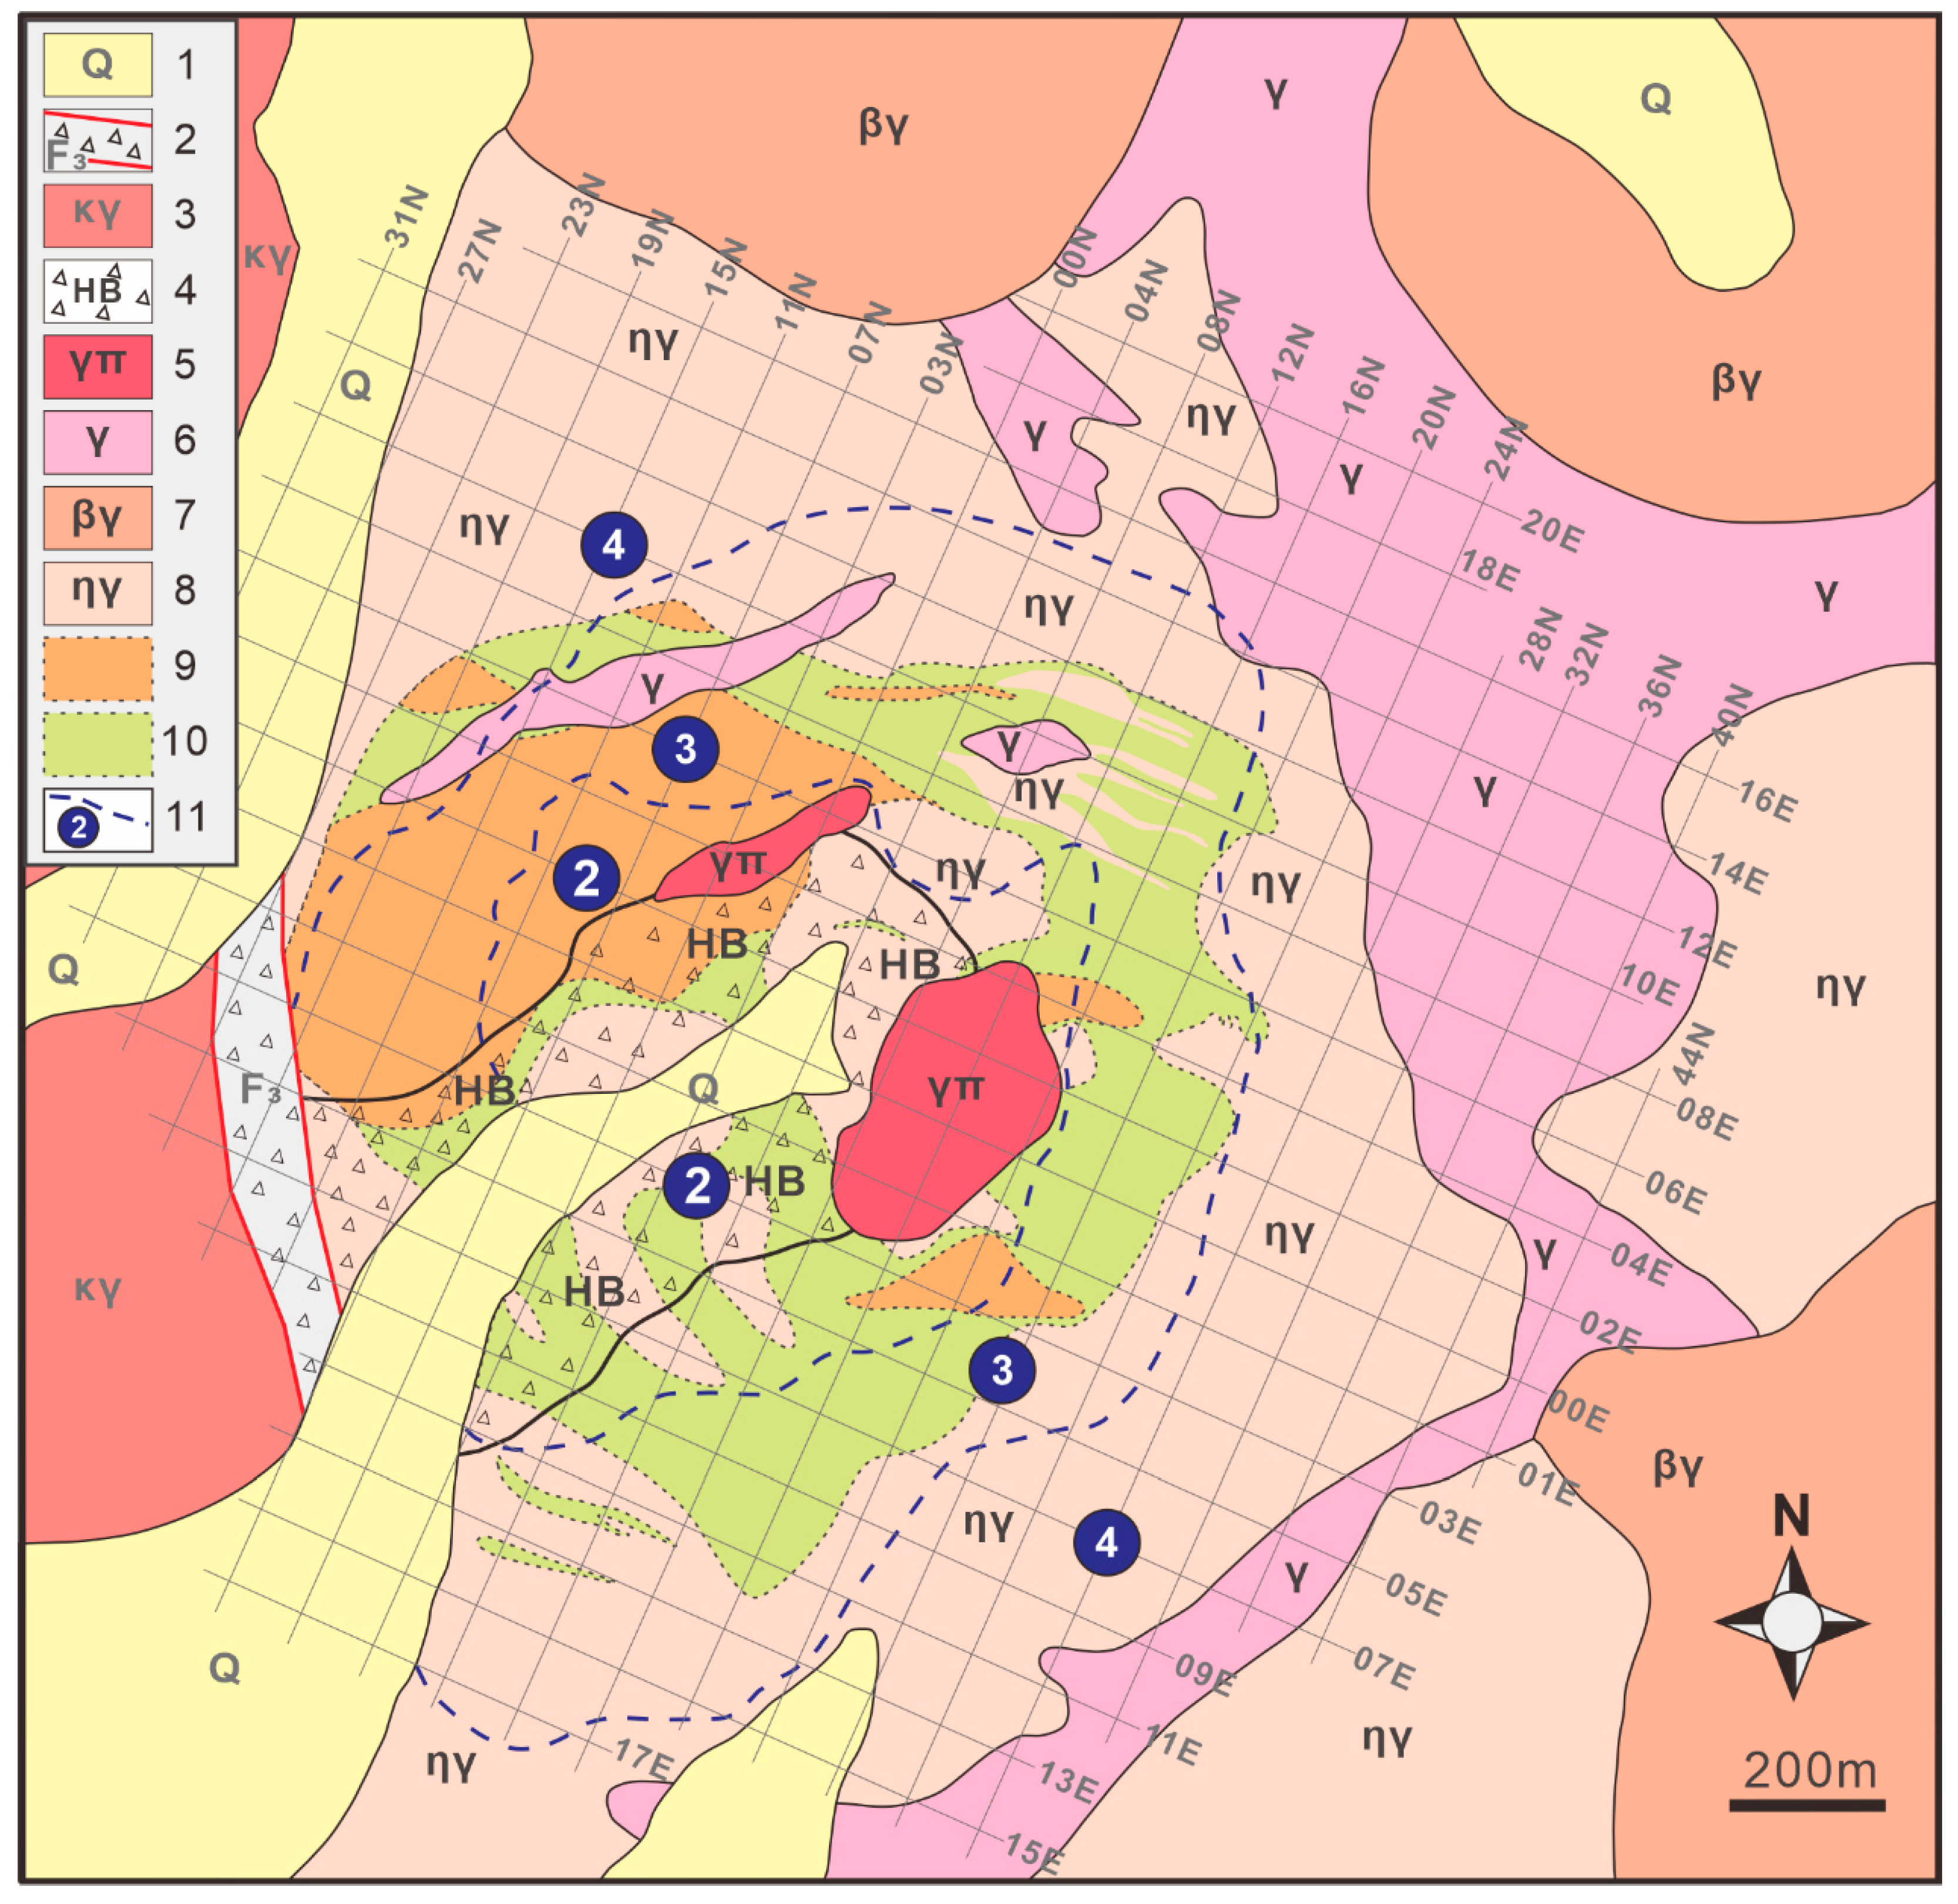
The study area is in the densely forested covered region of the Lesser Xing’an Range, which presents significant challenges for mineral exploration [42,44]. The discovery of the Luming PMD originated from the verification of regional stream sediment geochemical anomalies (Figure 3), leading to a shift in exploration focus from Cu-Pb-Zn deposits to Mo deposits. The exploration work can be categorized into several phases, as outlined below.
Between 1968 and 1970, the First Regional Geological Survey Brigade of the Geological and Mineral Resources Bureau of Heilongjiang Province (GMRBHP) conducted a regional geological survey at a scale of 1:200,000. The findings revealed the significant mineralization potential of the late Indosinian-early Yanshanian granites.
In 1987 and 1988, the Geophysical Exploration Brigade of the GMRBHP surveyed streams at a scale of 1:200,000. This study found a multi-element anomaly, including Ag-Cu-Pb-Zn-W-Mo. In 1991, the Second Geological Brigade of the GMRBHP conducted a more detailed stream sediment survey for these anomalies at a scale of 1:50,000. The results exhibited zonation, characterized by the concentration of W-Mo-Cu in the core and the distribution of Pb-Zn-Ag on the periphery [41,44] (Figure 3). Several concentration centers for Mo anomalies were identified at Luming, 712 Highland, and Cuiling.
From 2003 to 2005, the Fifth Geological Survey Institute of the GMRBHP conducted a verification on the concentration center of the 1:50,000 stream sediment anomalies around Luming with the objective of discovering Cu-Pb-Zn deposits [66]. The prospecting work comprised geological mapping, soil geochemistry analysis, and geophysical survey. Nevertheless, no economically significant Cu-Pb-Zn deposits were identified during this initial investigation. The soil geochemistry analysis included the elements Au, Ag, Cu, Pb, Zn, W, Mo, and Bi. Of these elements, only Mo displayed a distinct bimodal distribution in the histogram [44]. Following the verification of surface trenches at the site of the soil geochemical anomaly, a mineralized alteration zone covering approximately 1.5 square kilometers was discovered, delineating two potentially economic Mo ore bodies with an estimated resource of around 20,000 metric tons of Mo [66].
A general exploration was conducted by the Fifth Geological Survey Institute of the GMRBHP during the period 2005–2006 [67]. In March 2008, the technical report was finalized, which estimated an inferred molybdenum resource with a metal content equivalent to 304.2 thousand metric tons.
In 2009, a mineral resource audit and verification was conducted by China Railway Resources Mineral Exploration Co., Ltd. (CRRME), Beijing, China, which involved the drilling of 65 holes at 200 m × 200 m intervals (Figure 4). The estimated mineral resource of that work is 814 million metric tons, with an average Mo grade of 0.092%, containing a total Mo metal of 751 thousand metric tons [68].
From 2010, CRRME conducted complementary exploration to provide comprehensive geological information for mining design. The spacing of drilling for the primary mining area was increased to 100 × 100 m (Figure 4). Furthermore, ground geophysics and soil geochemistry investigation (to be reported in the following) were also conducted during this phase (in 2011).

4. Deposit Geology

The exploration area of Luming PMD exhibits extensive surface coverage, with a well-developed humus horizon and residual slope deposits that range in thickness from 0.8 to 30.75 m, with an average of 10.36 m [68]. The primary methodology employed in geological mapping is the use of point pits and trenches. In contrast, the drilling information is employed to adjust the projection at the topographic surface of the ore body (Figure 5 and Figure 6).

4.1. Faults

The principal fault structure within the exploration area is an NNW-trending fault (F3), which was identified through drilling. The dip is towards the northeast, with dip angles of 50° to 60°. The fractured zone has a width ranging from 9 m to 72.3 m. The post-mineralization fault hosts the ore body on its hanging wall, which is primarily composed of monzogranite [68]. The footwall displays no evidence of mineralization or alteration and is predominantly composed of K-feldspar granite. A subsequent NE-trending fault occurred at a later stage and was concealed by Quaternary sediments (Figure 5).

4.2. Intrusive Rocks

The Luming PMD is intruded by a suite of granitic rocks, including monzogranite (ηγ), biotite monzogranite (βγ), fine-grained granite (γ), granite porphyry (γπ), and K-feldspar granite (κγ) [68] (Figure 5). The monzogranite was intruded at an early stage, and subsequent alteration processes occurred predominantly in this area (Figure 5 and Figure 7A). Biotite monzogranite is distributed in the northern part and southeast corner of the exploration area. Jia et al. [67] proposed a regional phase transition relationship between biotite monzogranite and monzogranite. However, direct evidence within the exploration area is lacking. Fine-grained granite is observed to intrude as vein-like bodies into both monzogranite and biotite monzogranite (Figure 5). Field observations indicate at least two stages of vein-like activity for fine-grained granite. The early-stage fine-grained granite underwent silicification and kaolinization alteration (Figure 7B), whereas the late-stage fine-grained granite encloses angular fragments of mineralized monzogranite (Figure 7C). Granite porphyry displays well-developed quartz-feldspar phenocrysts without evident K-feldsparization and biotitization (Figure 7D,E). The drilling results indicate that granite porphyry intruded into the monzogranite (Figure 7D), suggesting that it was emplaced contemporaneously with the fine-grained granites. K-feldspar granite is distributed in the western part of the exploration area (Figure 5), exhibiting no signs of mineralization (Figure 7F,G). This suggests that it was emplaced after mineralization.
In terms of geochronology, the ages of monzogranite and granite porphyry at Luming PMD have been determined to be between 201.1 ± 3.90 Ma and 174 ± 2 Ma [14,16,22,46,47,48,52], while mineralization of Mo occurred between 182.4 and 176.7 Ma [16,46,47,49,52]. This indicates that the mineralization may be closely associated with the intrusive rocks.

4.3. Hydrothermal Breccias

The hydrothermal breccias are distributed in a northeasterly direction within the central and western regions of the deposit (Figure 5). In cross section, the hydrothermal breccias exhibit a pipe-like structure above the granite porphyry, gradually transitioning into monzogranite (Figure 6). These breccias are primarily composed of K-feldspathized monzogranite, with a minor proportion of granite porphyry [68]. They exhibit excellent cohesion (Figure 7H,I) and are predominantly composed of siliceous cement. The hydrothermal breccias constitute the primary component of the low-grade core within the ore deposit (Figure 5, Figure 6 and Figure 7I), while the high-grade ores occur in proximity to their contact zone with monzogranite (Figure 5, Figure 6 and Figure 7H). These observations lead to the conclusion that hydrothermal brecciation occurred subsequent to silicification-K-feldsparization but prior to silicification-illitization.

4.4. Ore Body Characteristics

The Luming PMD is defined by a dominant orebody (Figure 8), which is distributed within monzogranite, granite porphyry, and hydrothermal breccias between exploration lines 27N and 28N (Figure 5). The orebody exhibits a donut-shaped configuration on the plane, with an approximate surface exposure length and width of 1200 m and an area of about 1.5 km2 (Figure 5). The elevation depth of the orebody ranges from 540 m to –220 m. On cross sections, the boundaries converge towards the center, with dip angles ranging from 30° to 70° (Figure 6). The F3 fault cuts across the southwest boundary of the ore body, while K-feldspar granite serves as its footwall. In three-dimensional morphology, this deposit displays a bowl-shaped occurrence (Figure 8), which facilitates reduced stripping ratios during open-pit mining operations. The central portion of the deposit displays a low degree of mineralization, forming a low-grade core within the donut-shaped structure. It is possible to delineate intercalated rock separately within this low-grade core, which dips deeper towards the southeast (Figure 8). From an industrial perspective, the near-surface portion of Luming PMD is primarily composed of oxide ores. The thickness of the oxide zone ranges from 0.8 m to 42.4 m, with an average thickness of 16 m. The oxidation rates of the zone range from 10.7% to 92.9%, with an average of 28% [68]. Below this zone are all sulfide ores, without mixed ore zones.

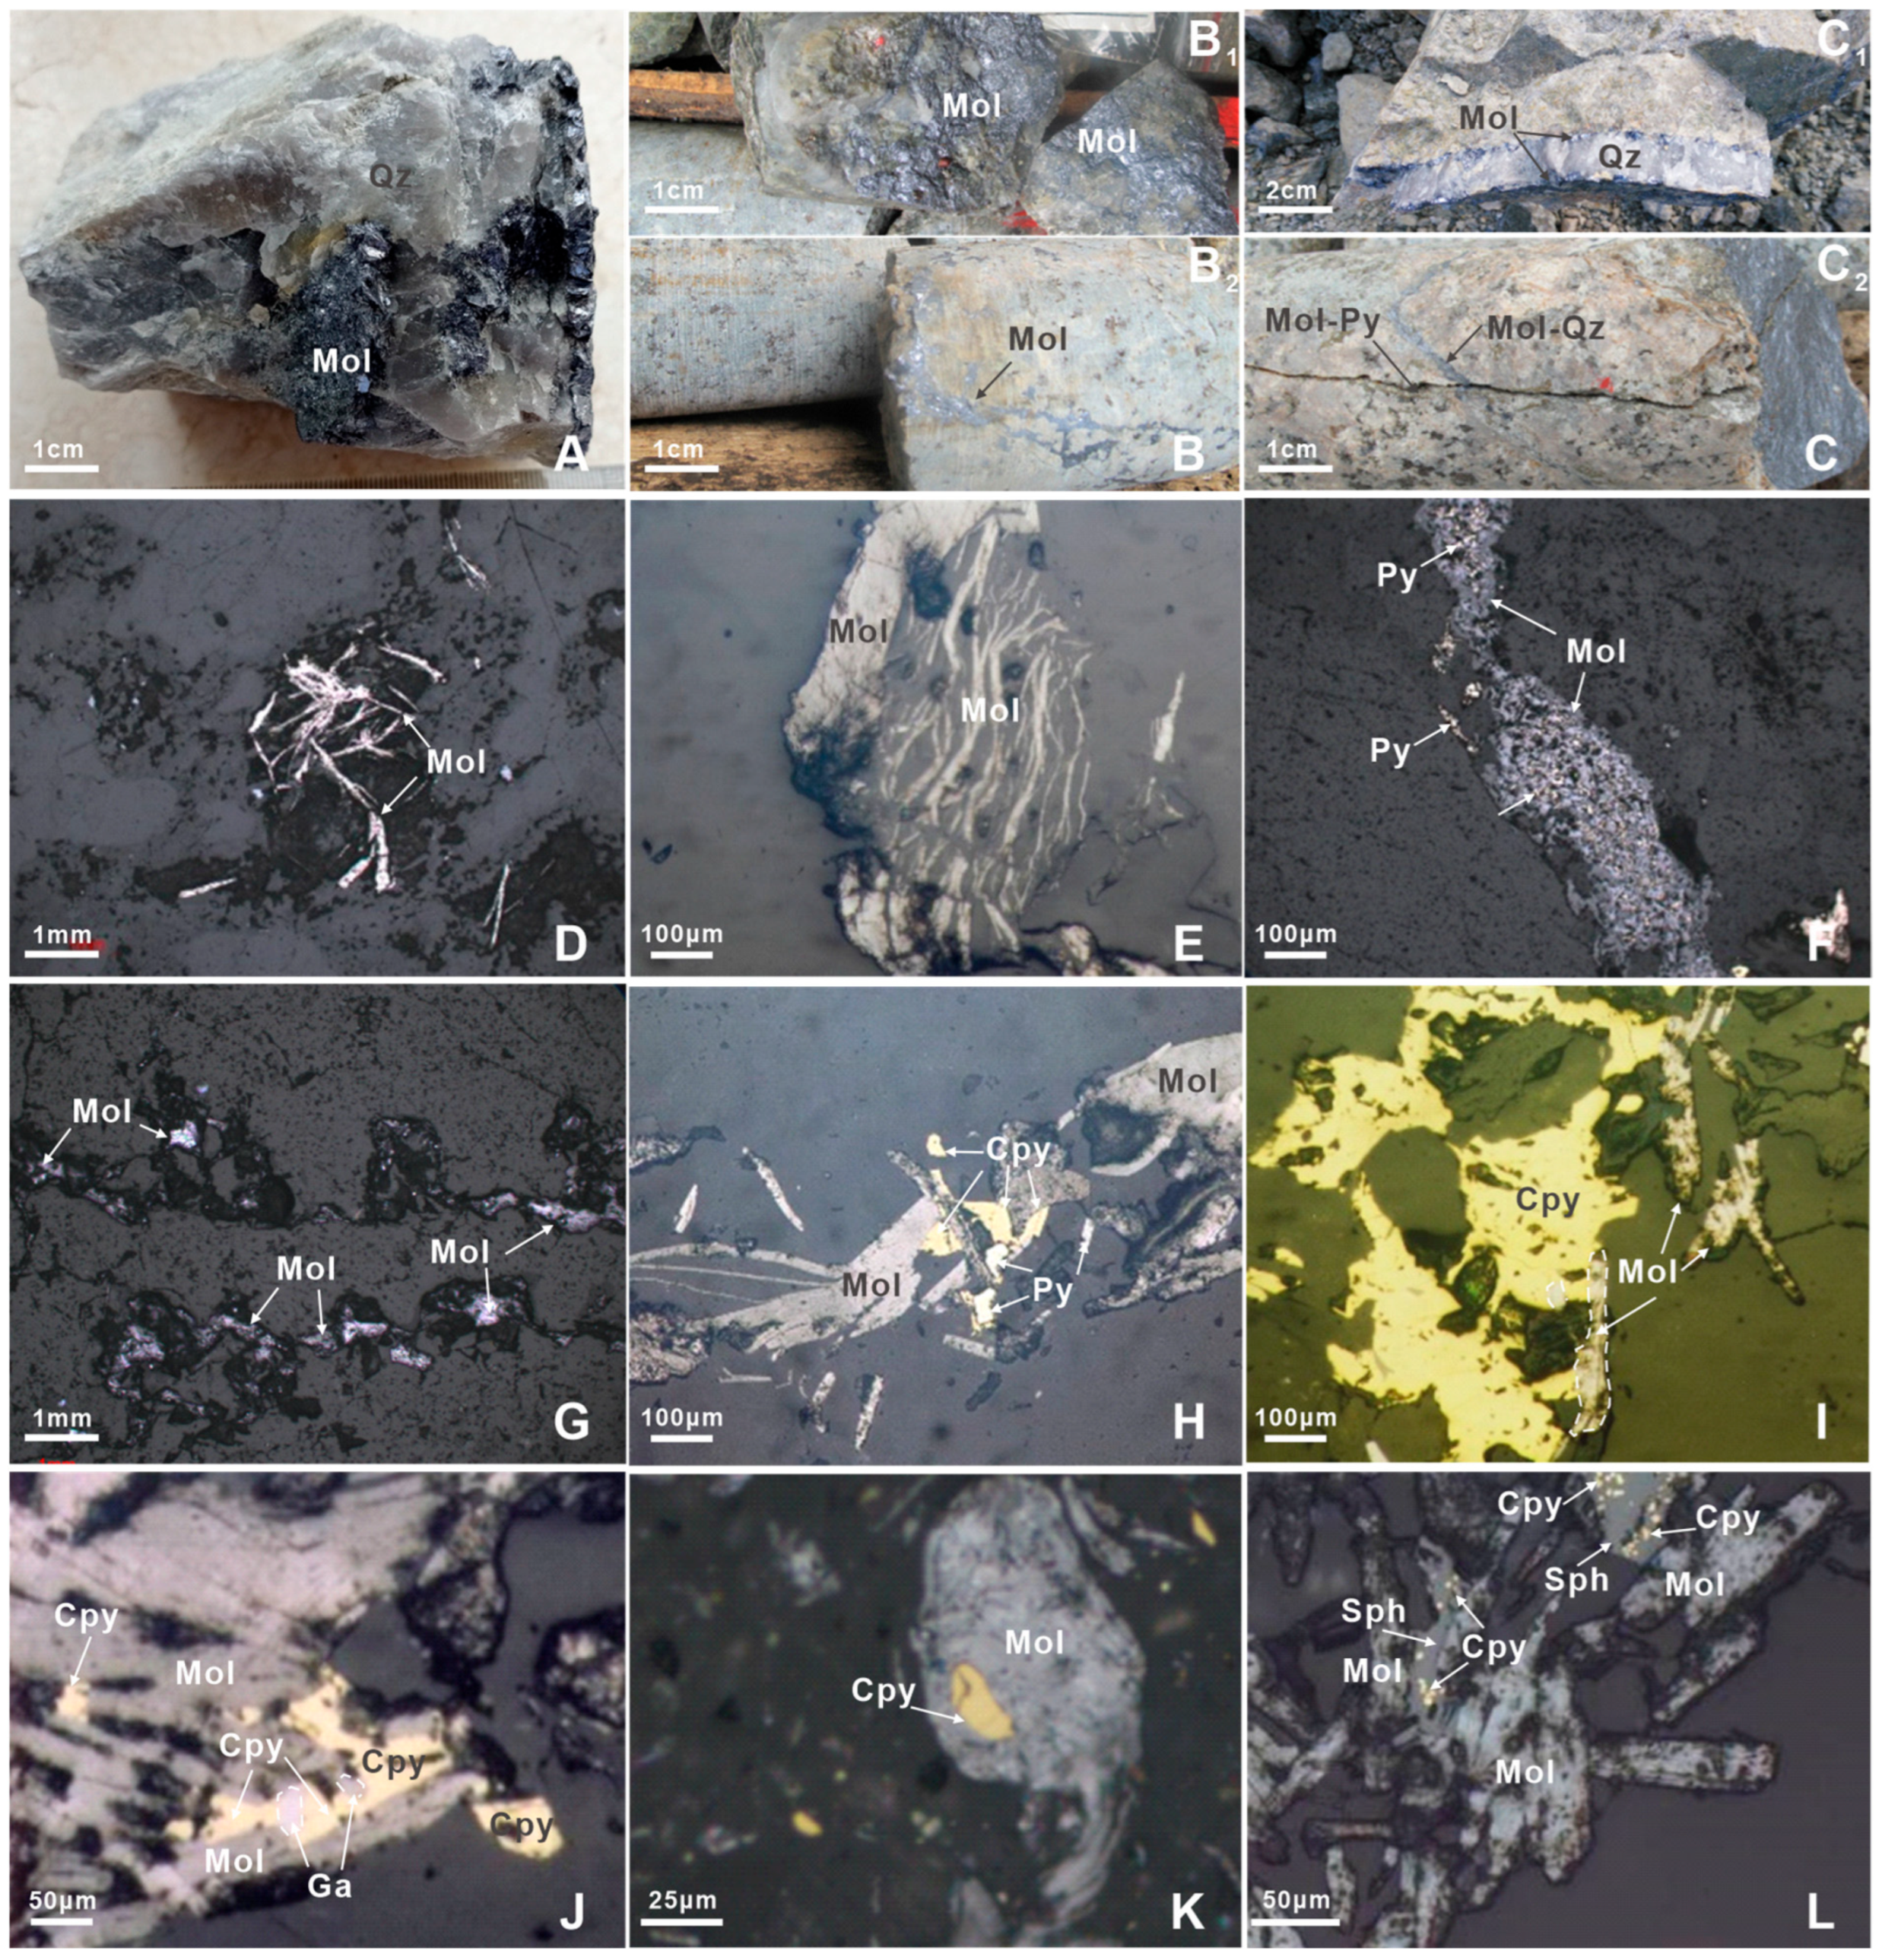
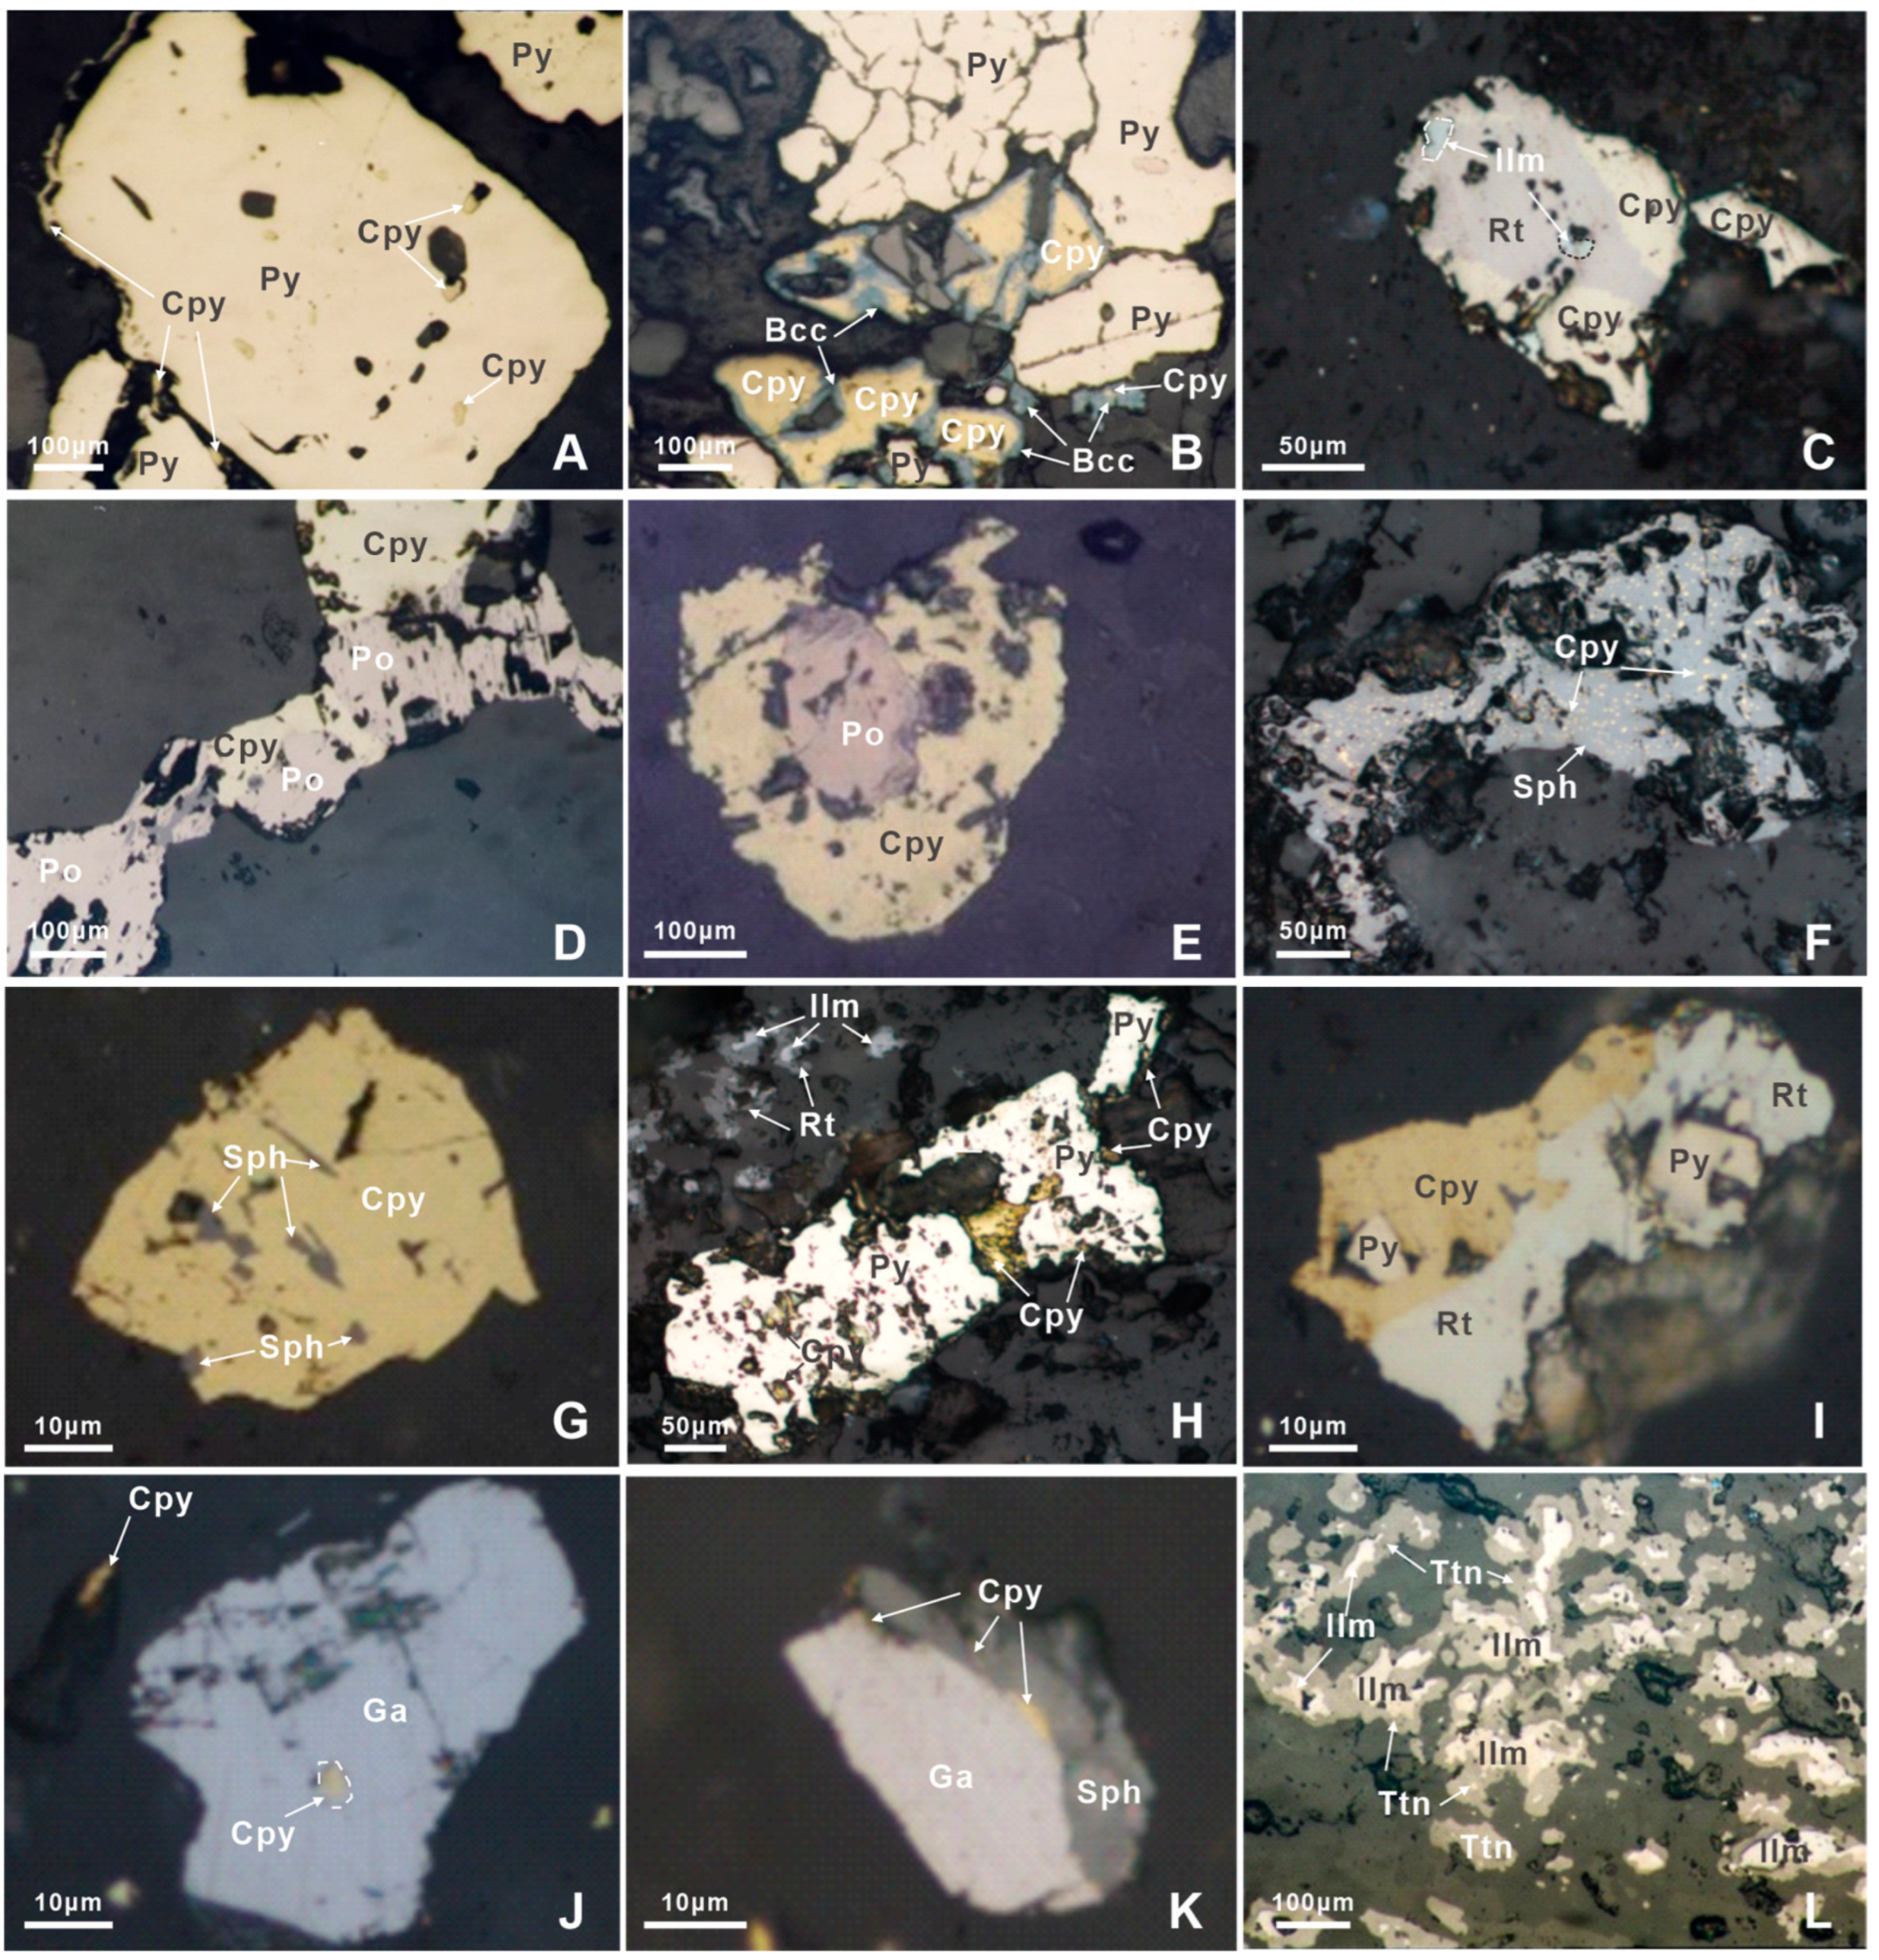
4.5. Ore Compositions and Textures

The economic molybdenum ore is primarily composed of sulfide ores (Figure 9 and Figure 10), with a minor occurrence of oxidized ores near the surface [68]. The primary ore minerals include molybdenite, pyrite, pyrrhotite, ilmenite, chalcopyrite, galena, and sphalerite, accompanied by small amounts of bornite and arsenopyrite. Secondary ore minerals include molybdite, covellite, blue chalcocite, and jarosite. Gangue minerals are primarily composed of quartz, K-feldspar, plagioclase, and biotite, with lesser amounts of illite (sericite), montmorillonite, chlorite, kaolinite, chloritoid, calcite, rutile, titanite, and apatite.
The most common textures observed in ores are euhedral or subhedral crystal textures (Figure 9D,E,H and Figure 10A,I), inclusive texture (Figure 9E,J,K), interstitial texture (Figure 9H,J), metasomatic texture (Figure 9C,D,K,L), cataclastic texture (Figure 10B), and emulsion texture (Figure 9L and Figure 10F). The ore structures mainly include disseminated structure (Figure 10A), veinlet structure (Figure 7E, Figure 9B,C and Figure 10D), stockwork structure (Figure 10E,F), vein structure (Figure 9A and Figure 10G), and brecciated structure (Figure 7H,I and Figure 10A,G). Molybdenite occurs mainly as sheets, plates, or aggregates, with varying degrees of flexibility within fractures or intergranular spaces within the ores. They are distributed either as veinlet-disseminated (Figure 9A,B,D) or as quartz-molybdenite veinlets or stockwork fillings within the ores (Figure 9C,F,G). Most molybdenites coexist with rock-forming minerals such as feldspar and quartz along with illite and chlorite, while a few coexist with sulfide minerals such as pyrite, chalcopyrite, and sphalerite (Figure 9C,F,H,I,J,L). Occasionally, molybdenites also coexist with ilmenite, titanite, pyrrhotite, and galena (Figure 9J,K).

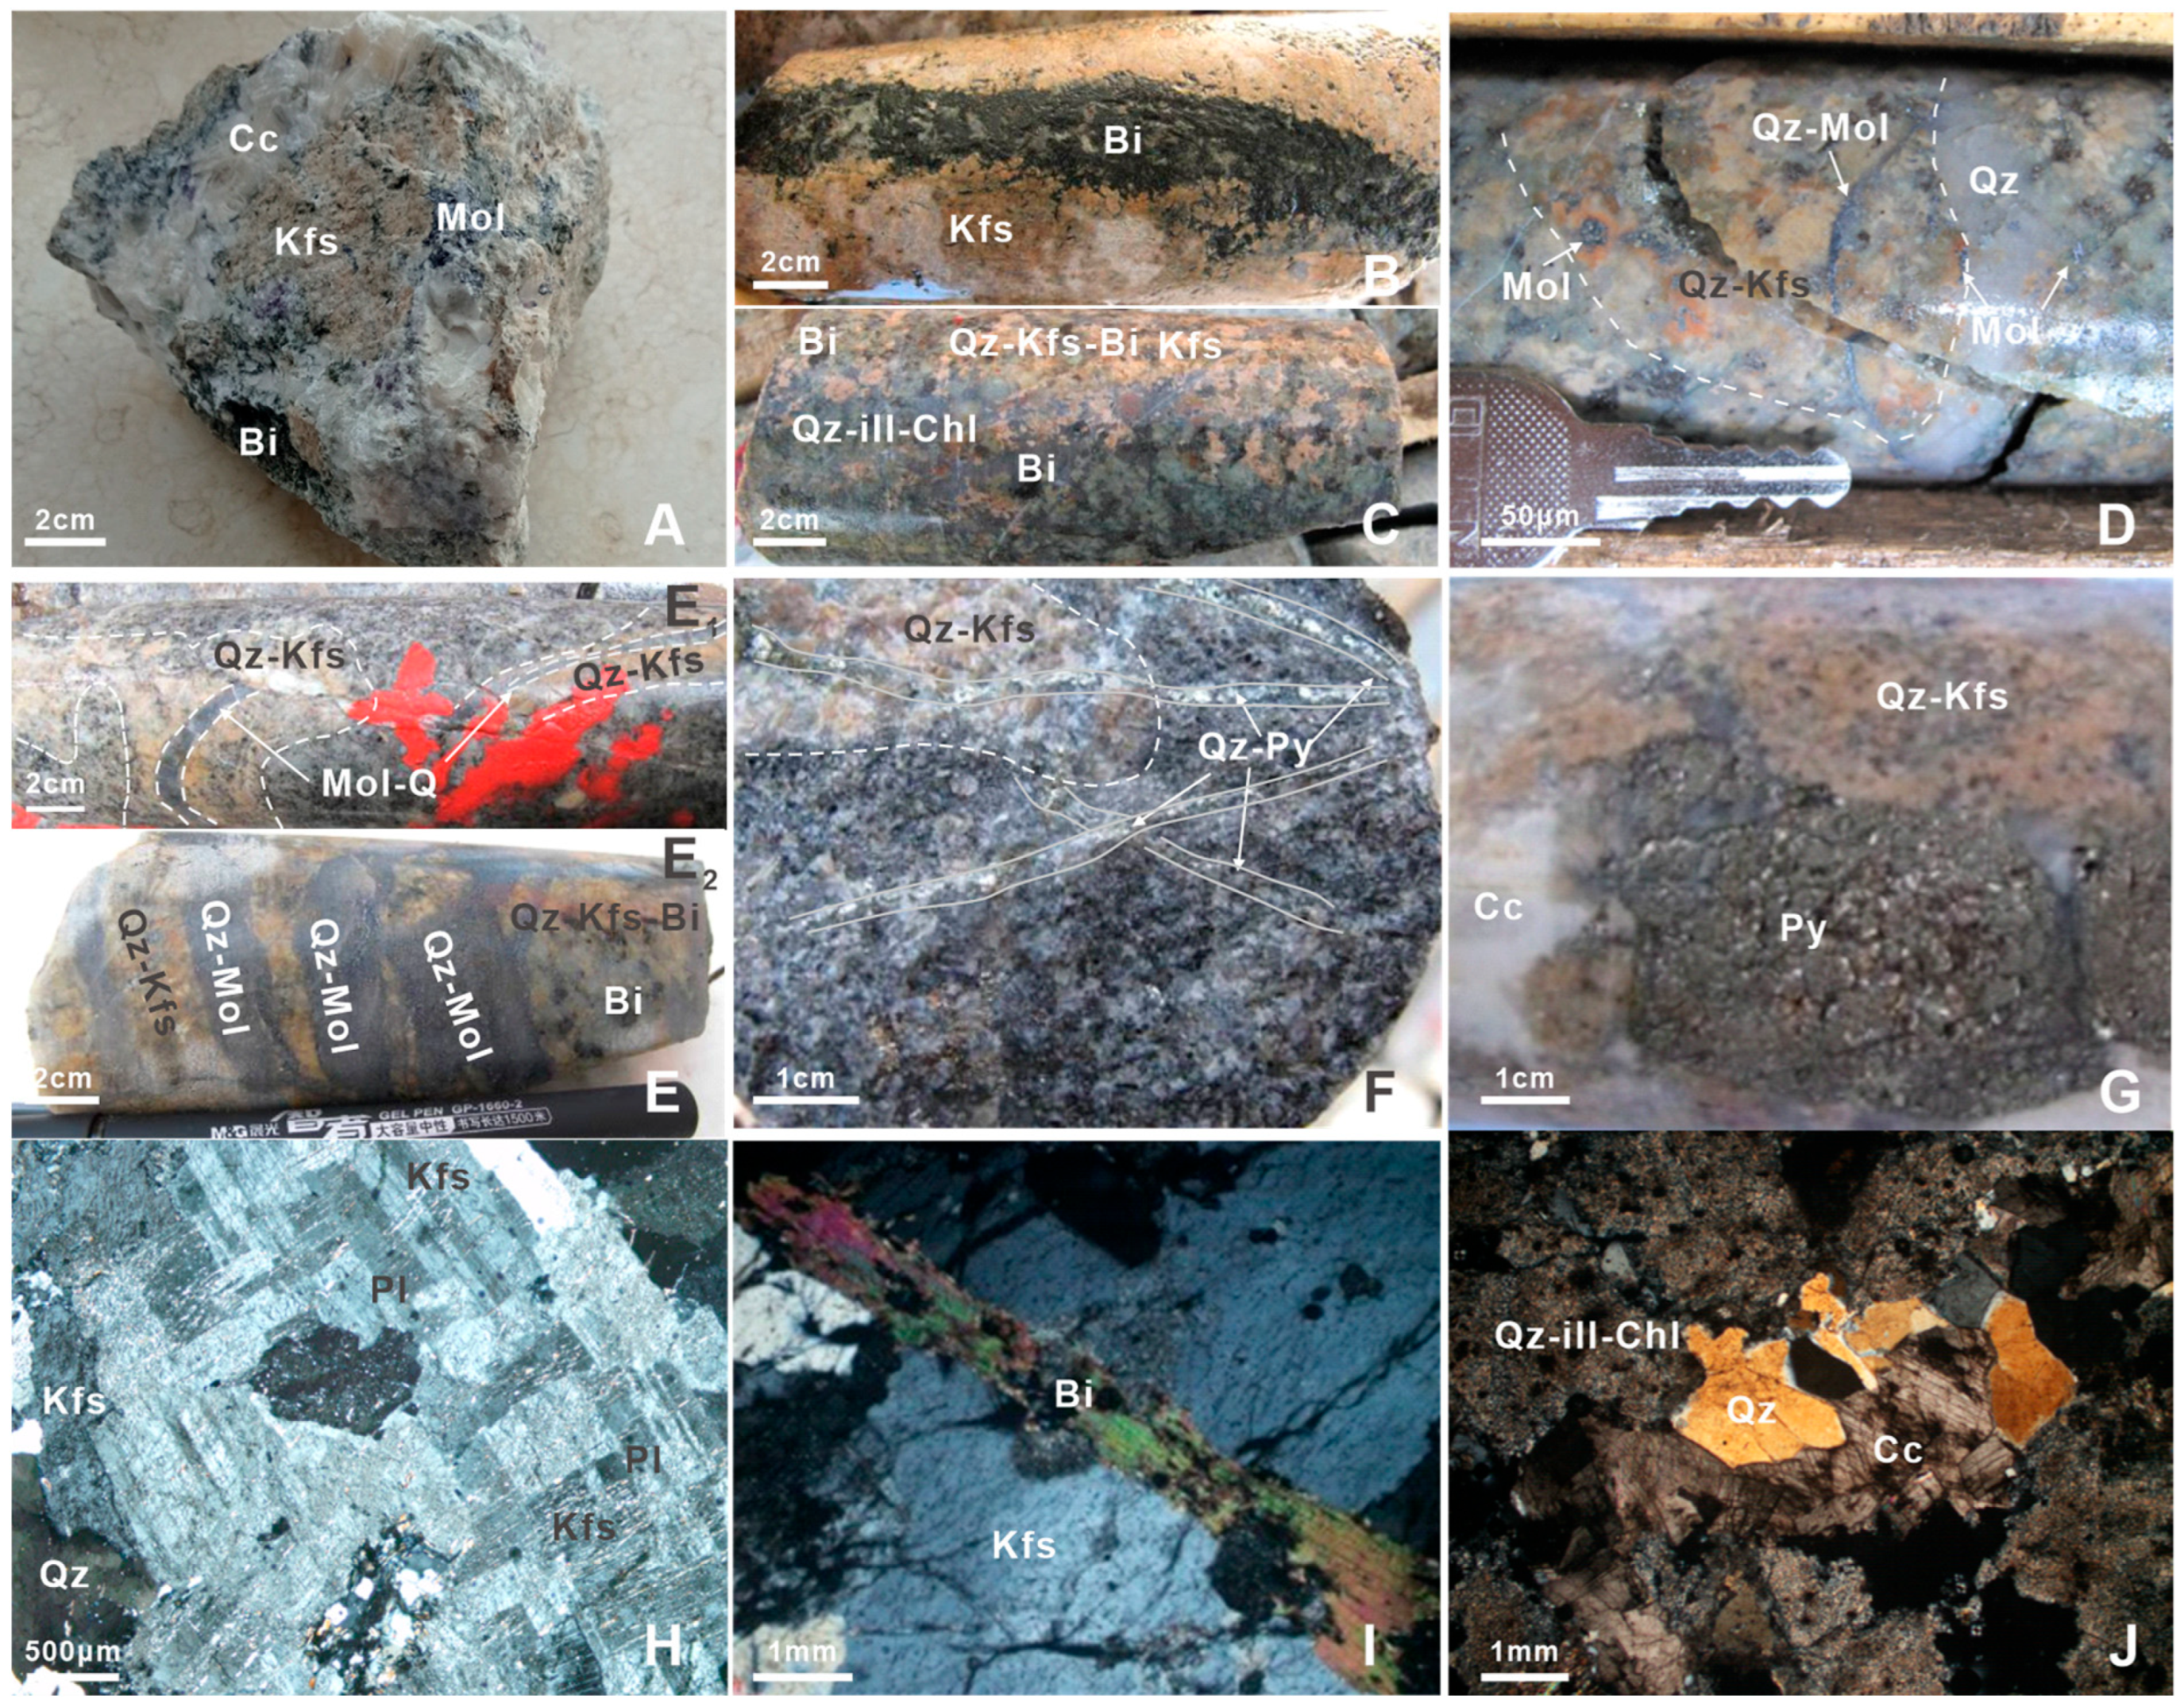
4.6. Wall Rock Alteration

Hydrothermal activity at Luming results in various alterations, including silicification (Figure 9A–C and Figure 11D–F), illitization (Figure 9A,B and Figure 11C,J), potassic alteration (primarily K-feldsparization followed by biotitization) (Figure 11A–C,I), and chloritization, epidotization, kaolinitization and carbonatization (Figure 7A–C and Figure 11A,G,J). Silicification, potassic alteration, illitization, and chloritization are particularly noteworthy due to their close association with Mo mineralization. They exhibit a wide spatial distribution that includes both disseminations and veinlets.
Four alteration zones developed around the orebody: silicification-K-feldsparization-biotitization zone, silicification-illitization-K-feldsparization zone, silicification-illitization-chloritization zone, and silicification-pyritization-chloritization zone [68] (Figure 5 and Figure 6). The central distribution of the silicification-K-feldsparization-biotitization zone is primarily associated with the economic Mo mineralization occurring at its periphery (Figure 6). The silicification-illitization-K-feldsparization zone is characterized by quartz and illite replacement on feldspar, with some residual early-stage K-feldsparization (Figure 11H). The majority of economic ore bodies are found within this alteration zone. The degree of silicification and illitization is relatively limited in the silicification-illitization-chloritization zone. Chloritization is most prevalent at the margins of this alteration zone, where economic ores and low-grade ores are found (Figure 5 and Figure 6). Outside the periphery of the silicification-illitization-chloritization zone, the silicification-pyritization-chloritization zone exhibits slightly different characteristics in different areas [68]. In the northern and northeastern parts of the exploration area, the dominant alteration is extensive high-intensity pyritization and chloritization, which is occasionally accompanied by veinlets of molybdenum mineralization associated with pyritization (Figure 11F). In contrast, in the southern and southeastern parts, carbonatation and pyritization are the dominant processes, occurring primarily in the form of calcite-pyrite veins (Figure 11G,J). The orebody in these areas is composed primarily of low-grade ores, exhibiting a gradual decrease in alteration intensity.

4.7. Mineralization Phases

The development of alteration and mineralization at the Luming PMD is closely related to intrusions and associated hydrothermal activity, which can be divided into several phases (Figure 7, Figure 9, Figure 10 and Figure 11). Based on field observations and microscopic examinations, four distinct phases of mineralization were identified: a quartz-pyrite phase; a quartz-molybdenite-chalcopyrite phase; a quartz-polymetallic (molybdenite-chalcopyrite-galena-sphalerite) phase; and a quartz-calcite-pyrite phase (Figure 12).

5. Material and Methods

In order to enhance comprehension of the factors that influence ore formation and the criteria employed in prospecting, a series of investigations were conducted between 2009 and 2011. These investigations included major and trace elements analysis, rock primary halo geochemistry, and ground geophysical surveys.
Samples for rock geochemistry analysis were obtained from all the drill holes. The sampling technique employed was essentially a whole-hole sampling method, with the exception of a few control holes where no significant alteration or mineralization was observed. The split-center method was employed, with one-half of the sample sent for analysis and the other half retained. Each sample was 2.00 m in length, although it could extend to 3.00 m. Sample preparation and analysis were conducted at the Central Laboratory of the Institute of Geophysical and Geochemical Exploration, Chinese Academy of Geological Sciences. The sample was crushed by a jaw crusher, rollers, and a grinder to a particle size of 100 mesh. Subsequently, the sample was mixed and reduced, with a portion of the material retained at 800–1600 g to 200 mesh by means of rod milling. The sample was then placed in kraft paper bags, while the remainder was stored in bags as analyzed sub-samples for preservation.
The primary halo elements, including Mo, Ag, Bi, Co, Cu, In, Ni, Pb, Sb, W, and Zn, were determined using inductively coupled plasma mass spectrometry (ICP-MS), with high content Mo reanalyzed using inductively coupled plasma optical emission spectrometry (ICP-OES). The test material was initially dried and weighed. It was then decomposed with hydrofluoric acid, nitric acid, and perchloric acid, dissolved with aqua regia, transferred to a polyethylene test tube, fixed, and shaken vigorously. A portion of the solution was analyzed on an ICP-MS instrument (Thermo Fisher Scientific Xseries II, Waltham, MA, USA). The measurement conditions were as follows: nebulizer flow rate (Ar) 0.8–0.9 L/min, residence time 20 ms, scan number 50, number of each mass channel 1, injection pump speed 40 rpm, sampling depth 150–250, and data acquisition mode peak hopping. For samples with more than 250 μg/g Mo, a single determination was conducted using the ICP-OES instrument (Thermo Fisher Scientific IRIS Intrepid II, Waltham, MA, USA). To ensure the reliability and validity of the results, blanks, national standards, and duplicates were included in the test. The sample must undergo retesting with a minimum 95% pass rate. A comprehensive internal quality assurance and quality control (QA/QC) inspection, including duplicates at a ratio of 5%, was conducted on the selected batch. Subsequently, an external QA/QC inspection was conducted, with samples from the analyzed sub-samples sent to the Tianjin Institute of Geology and Mineral Resources for testing at a ratio of 10%. It is imperative that both the internal and external laboratory inspections achieve a success rate of 90%.
A subset of samples from the primary halo investigation was subjected to major and trace element analysis, with the exclusion of weathered or altered rock samples. The major element compositions were analyzed by X-ray fluorescence (XRF) spectrometry, while the trace element compositions were determined using ICP-MS. The major element analysis was conducted in the following steps: (1) The 200-mesh sample was dried in an oven at 105 °C for 2–4 h. (2) Then, a test material was melted with lithium tetraborate and ammonium nitrate, which served as the oxidizing agent, followed by melting with flux at 1150–1250 °C to create glass slides. (3) Finally, the analysis was conducted using a PANalytical Axios PW4400 (Shanghai Spectris Instrument Systems Co., Ltd., Shanghai, China) with a 50 kV X-ray tube, 50 mA current, coarse collimator, and 30 mm field of view. The reference materials were prepared using national standard substances. The relative error for the major element test was within 5%.
The geophysical surveys were conducted by the China Railway Resources Group Survey & Design Co., Ltd. Initially, selected drill core samples were subjected to physical properties measurements. Subsequently, representative profiles were selected for the gravity and magnetic surveys (four profiles: A–A’, B–B’, C–C’, and D–D’) and induced polarization survey (four profiles: A–A’, E–E’, F–F’, and G–G’). The approximate locations of these profiles are depicted in Figure 4.
The gravity survey was conducted using a CG-5 gravimeter with a point spacing of 20 m. Two readings were taken at each point, ensuring that the difference between the two readings was less than 0.005 mGal. After applying zero drift correction and base point network adjustment, the Bouguer gravity anomaly was obtained by normal field correction and Bouguer correction. The potential field was then separated (extending 500 m upwards as the regional field) to obtain the final gravity anomaly values expressed in gravity units (gu; 1 gu = 0.1 mGal).
A magnetic survey was carried out using an EVEIN magnetometer with a point spacing of 20 m. The raw data were subjected to correction and polarization using GeoIPAS V2.0, thereby deriving magnetic anomaly data expressed in nanotesla (nT).
The Induced Polarization Intermediate Gradient survey employed the Phoenix V8 multi-function electric instrument with parameters AB = 3000 m, MN = 40 m, and point spacing of 20 m. The acquired data were then processed and filtered using GeoIPAS V2.0 to derive resistivity values in Ω·m and chargeability expressed as a percentage (%).

6. Results

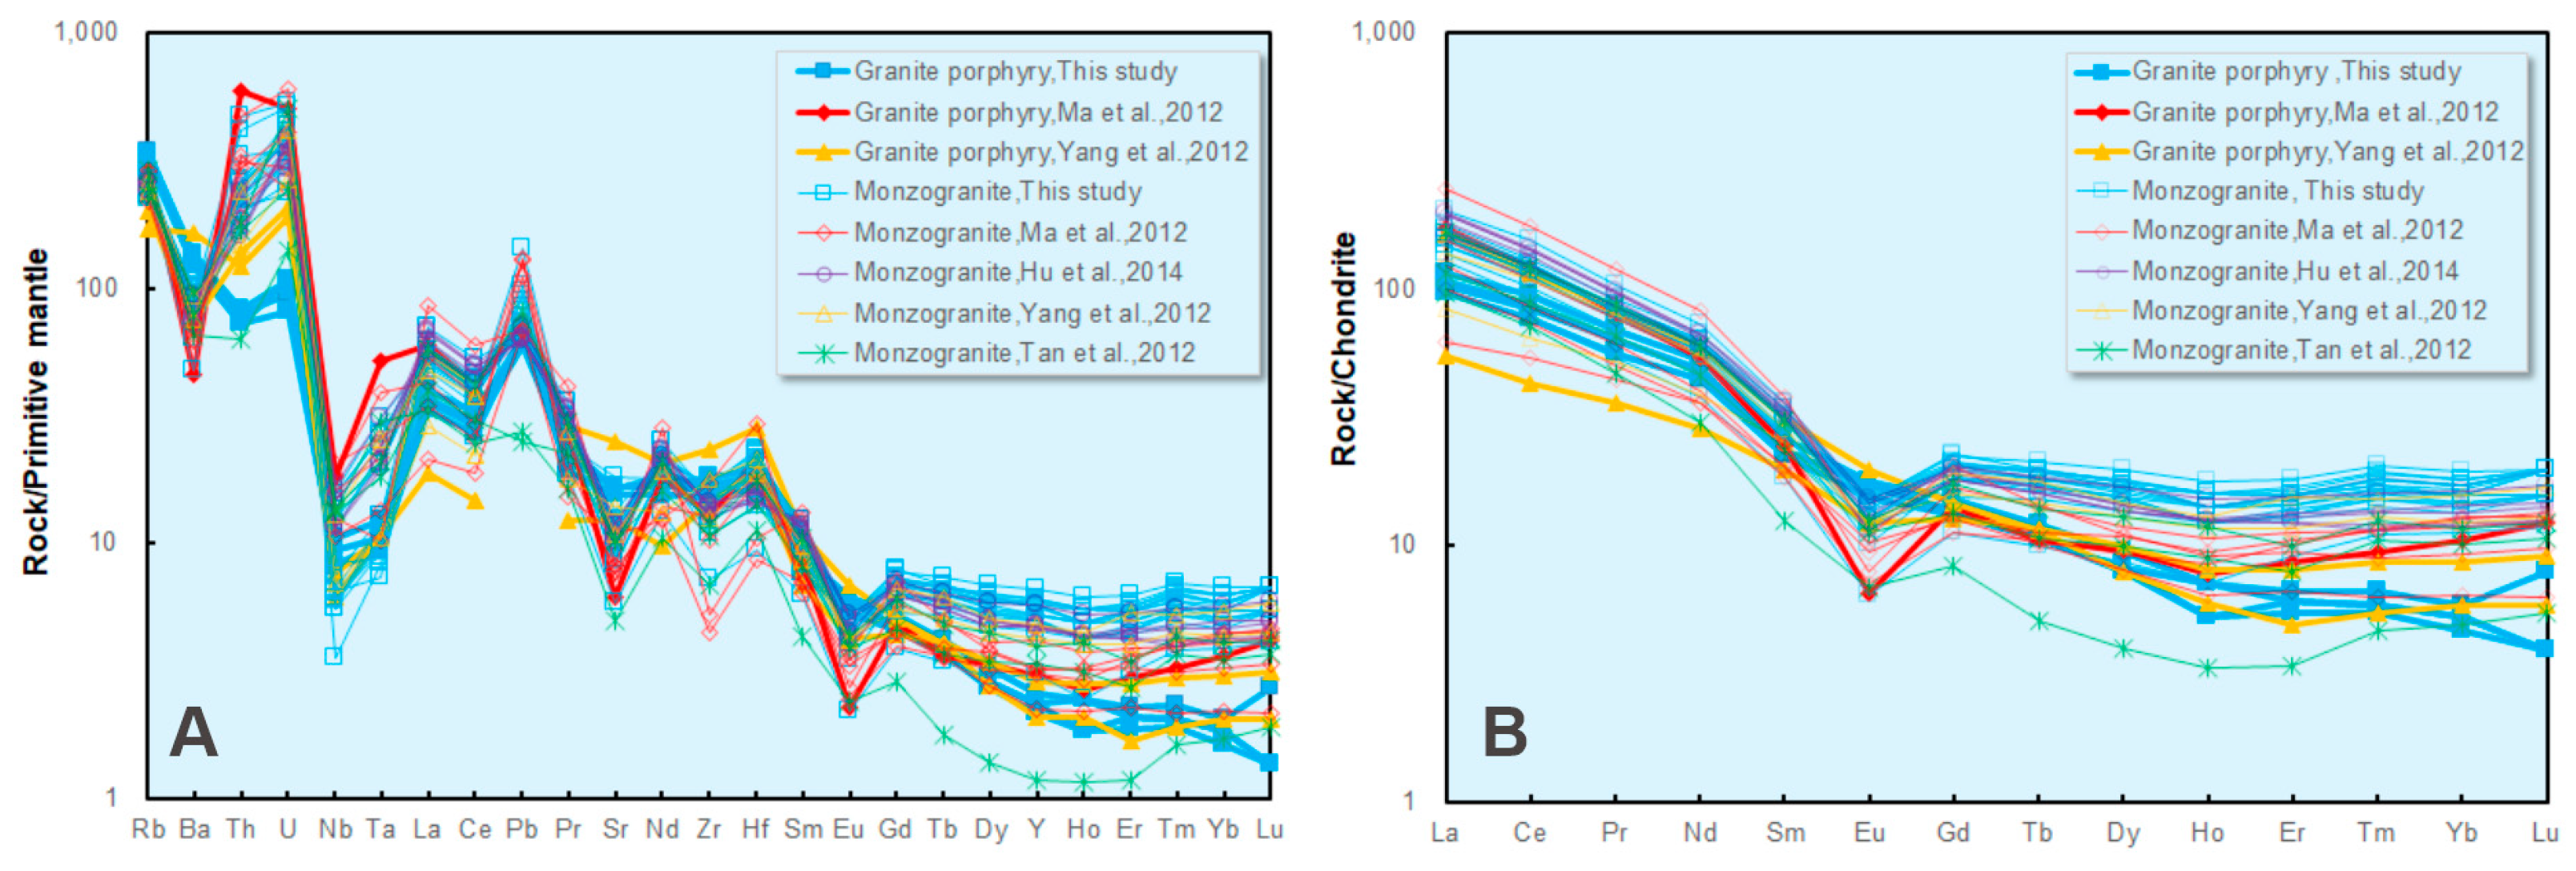
6.1. Major and Trace Elements
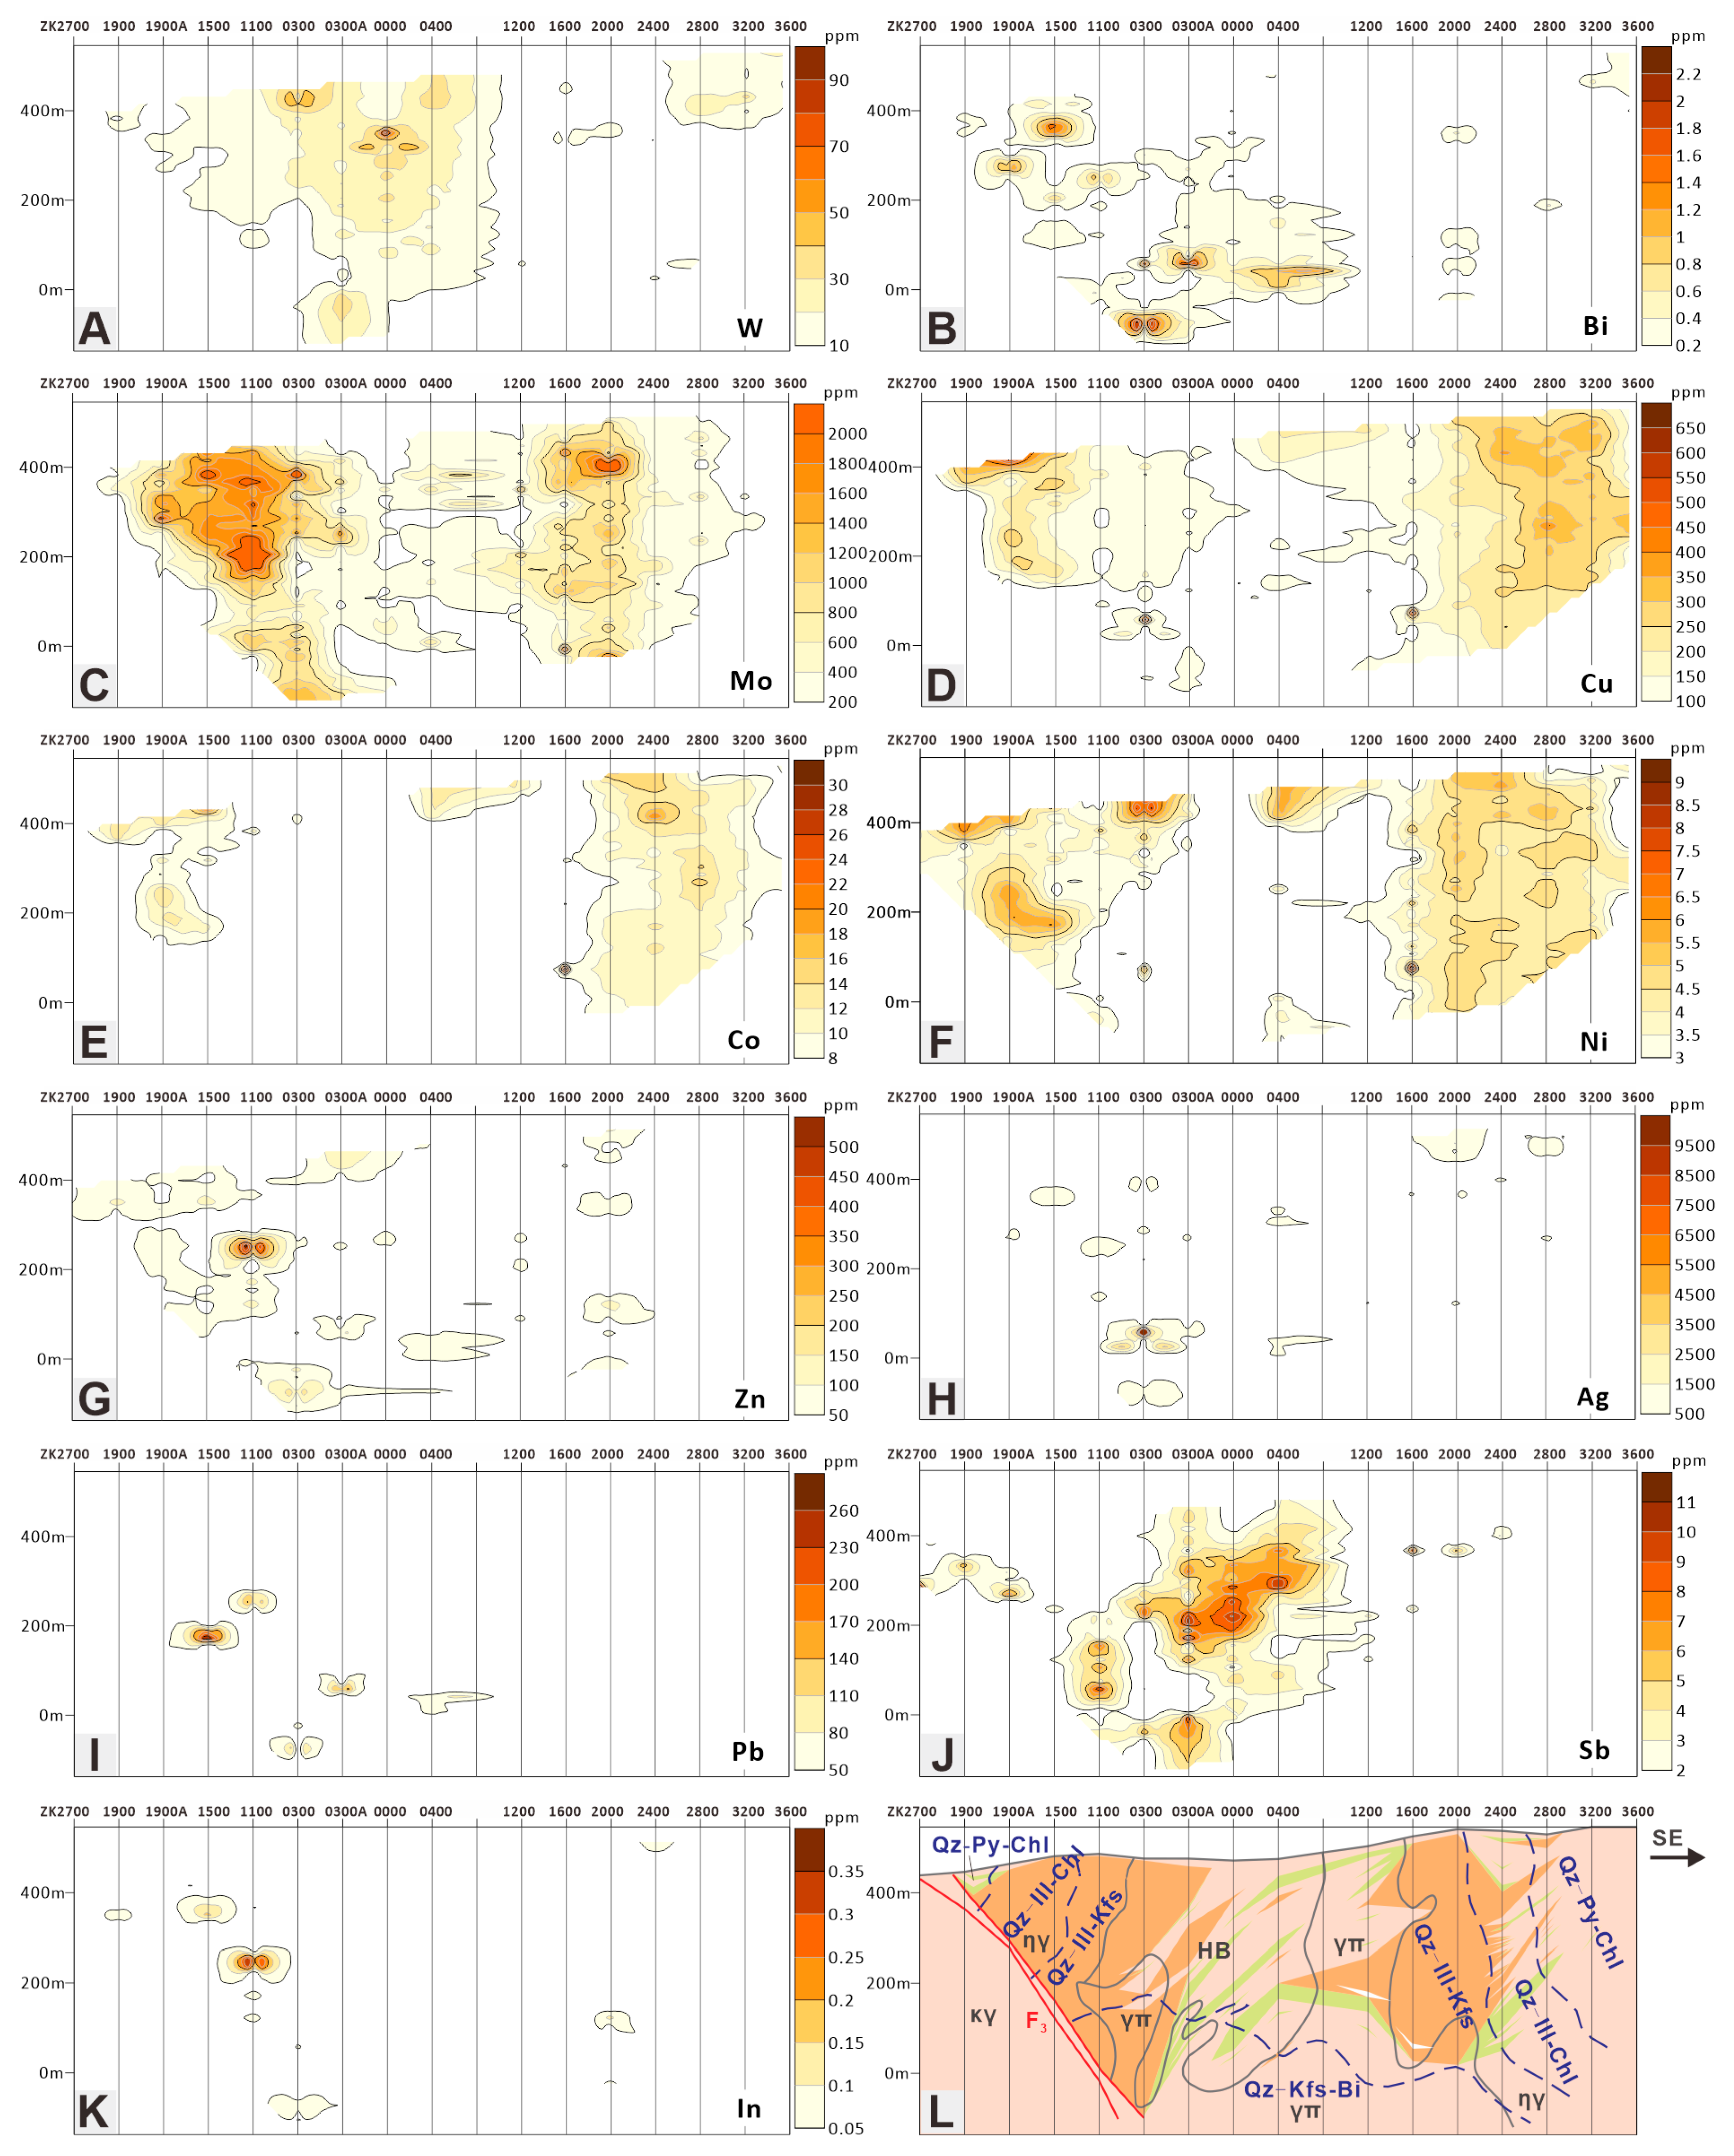
The major and trace element compositions of the monzogranites and granite porphyry in the Luming are presented in Tables S1 and S2. The rocks exhibit relatively high SiO2 contents, ranging from 65.78% to 77.17%. The Na2O + K2O content varies from 5.4% to 9.46%, while the Al2O3 content ranges from 11.09% to 15.73%. The samples are enriched in MgO (0.21%–2.325%) but low in TiO2 (0.14%–0.69%) and P2O5 (0.01%–0.22%). On the Na2O + K2O versus SiO2 diagram, the samples fall within the subalkaline granite and quartz monzonite field (Figure 13A). On the K2O versus SiO2 diagram, the samples plot predominantly within the high-K calc-alkaline to shoshonitic field (Figure 13B). On the A/NK versus A/CNK diagram, a trend towards peraluminous to metaluminous compositions is observed for the samples (Figure 13C). Most of the samples on the Fe2O3/FeO versus SiO2 plot lie within the porphyry Mo granite field, which aligns with the Endako-type Mo deposits (Figure 13D).
The total rare earth element (ΣREE) concentrations in monzogranites and granite porphyry range from 80.71 to 233.88 ppm and from 68.9 to 162.18 ppm, respectively. On the chondrite-normalized diagram for rare earth elements, all samples exhibit enrichment of light rare earth elements (LREEs) and depletion of heavy rare earth elements (HREEs), indicating moderate differentiation characteristics (Figure 14B). The LREE/HREE ratios range from 6.4 to 19.07, while the (La/Yb) N ratios range from 6.3 to 28.04. Monzogranites (δEu = 0.37–0.66) exhibit a more pronounced Eu anomaly than granite porphyry (δEu = 0.75–0.93, with the exception of LM-11-B3) (Figure 14B). On the primitive mantle-normalized diagram, the samples exhibit an overall enrichment of large ion lithophile elements, including Rb, Th, U, and Pb, while simultaneously depleting Ba and high field strength elements, including HREE, Nb, and Ta (Figure 14A).

6.2. Primary Halo

The statistical characteristics of 26,900 samples of primary halo data from drilling (27,942 samples specifically for Mo) are presented in Table 1. Coefficients of variation for Mo, Cu, Co, and Ni have comparatively low values (≤200%), while those for other elements range from 247% to 795%. Skewness values indicate varying degrees of right skew for the multi-element data. All kurtosis values are greater than 3, indicating a heavy-tailed characteristic.
From the perspective of primary halo features along section 00E, the elements W, Bi, and Sb are predominantly enriched in the central area where hydrothermal breccias are distributed (Figure 15A,B,J,L); Mo, Cu, Co, and Ni show a symmetrical distribution on both sides outside the hydrothermal breccias (Figure 15C–F); Pb, Zn, Ag, and In are sparsely distributed outside the Mo mineralization (Figure 15G–I,K).
Overall, the elemental distribution shows a zonation from the center to the outer zone of the deposit as follows: W-Bi-(Sb)→Mo→Cu-Co-Ni→Pb-Zn-Ag-In. The enrichment center of Mo mineralization is located near the contact zone between the silicification-illitization-K-feldsparization zone and the silicification-K-feldsparization-biotitization zone or silicification-illitization-chloritization zone (Figure 15C,L).

6.3. Sample Physical Properties

Physical property measurements on drill core samples are presented in Table 2 and show significant variations in the physical parameters across the different alteration zones. The resistivity (mean values ranging from 22,636 Ω·m to 7211 Ω·m to 4050 Ω·m to 5340 Ω·m), chargeability (ranging from 12.8% to 29.6% to 50.5% to 56.3%), and magnetic susceptibility (ranging from 234.7 × 10−6 × 4πSI to 7.4 × 10−6 × 4πSI to 12.5 × 10−6 × 4πSI to 35.2 × 10−6 × 4πSI) show a systematic variation from unaltered monzogranite→silicification-K-feldsparization-biotitization zone→silicification-illitization-K-feldsparization zone→silicification-illitization-chloritization zone. Compared to the unaltered monzogranite, the mineralized rock (Mo ≥ 300 ppm) exhibits characteristics such as low magnetic susceptibility, low resistivity, relatively high chargeability, and low density (Table 2). These differences in rock physical properties provide a basis for delineating the mineralized rock mass, alteration zones, and unaltered surrounding rocks using gravity and magnetic anomalies and the induced polarization method [43].

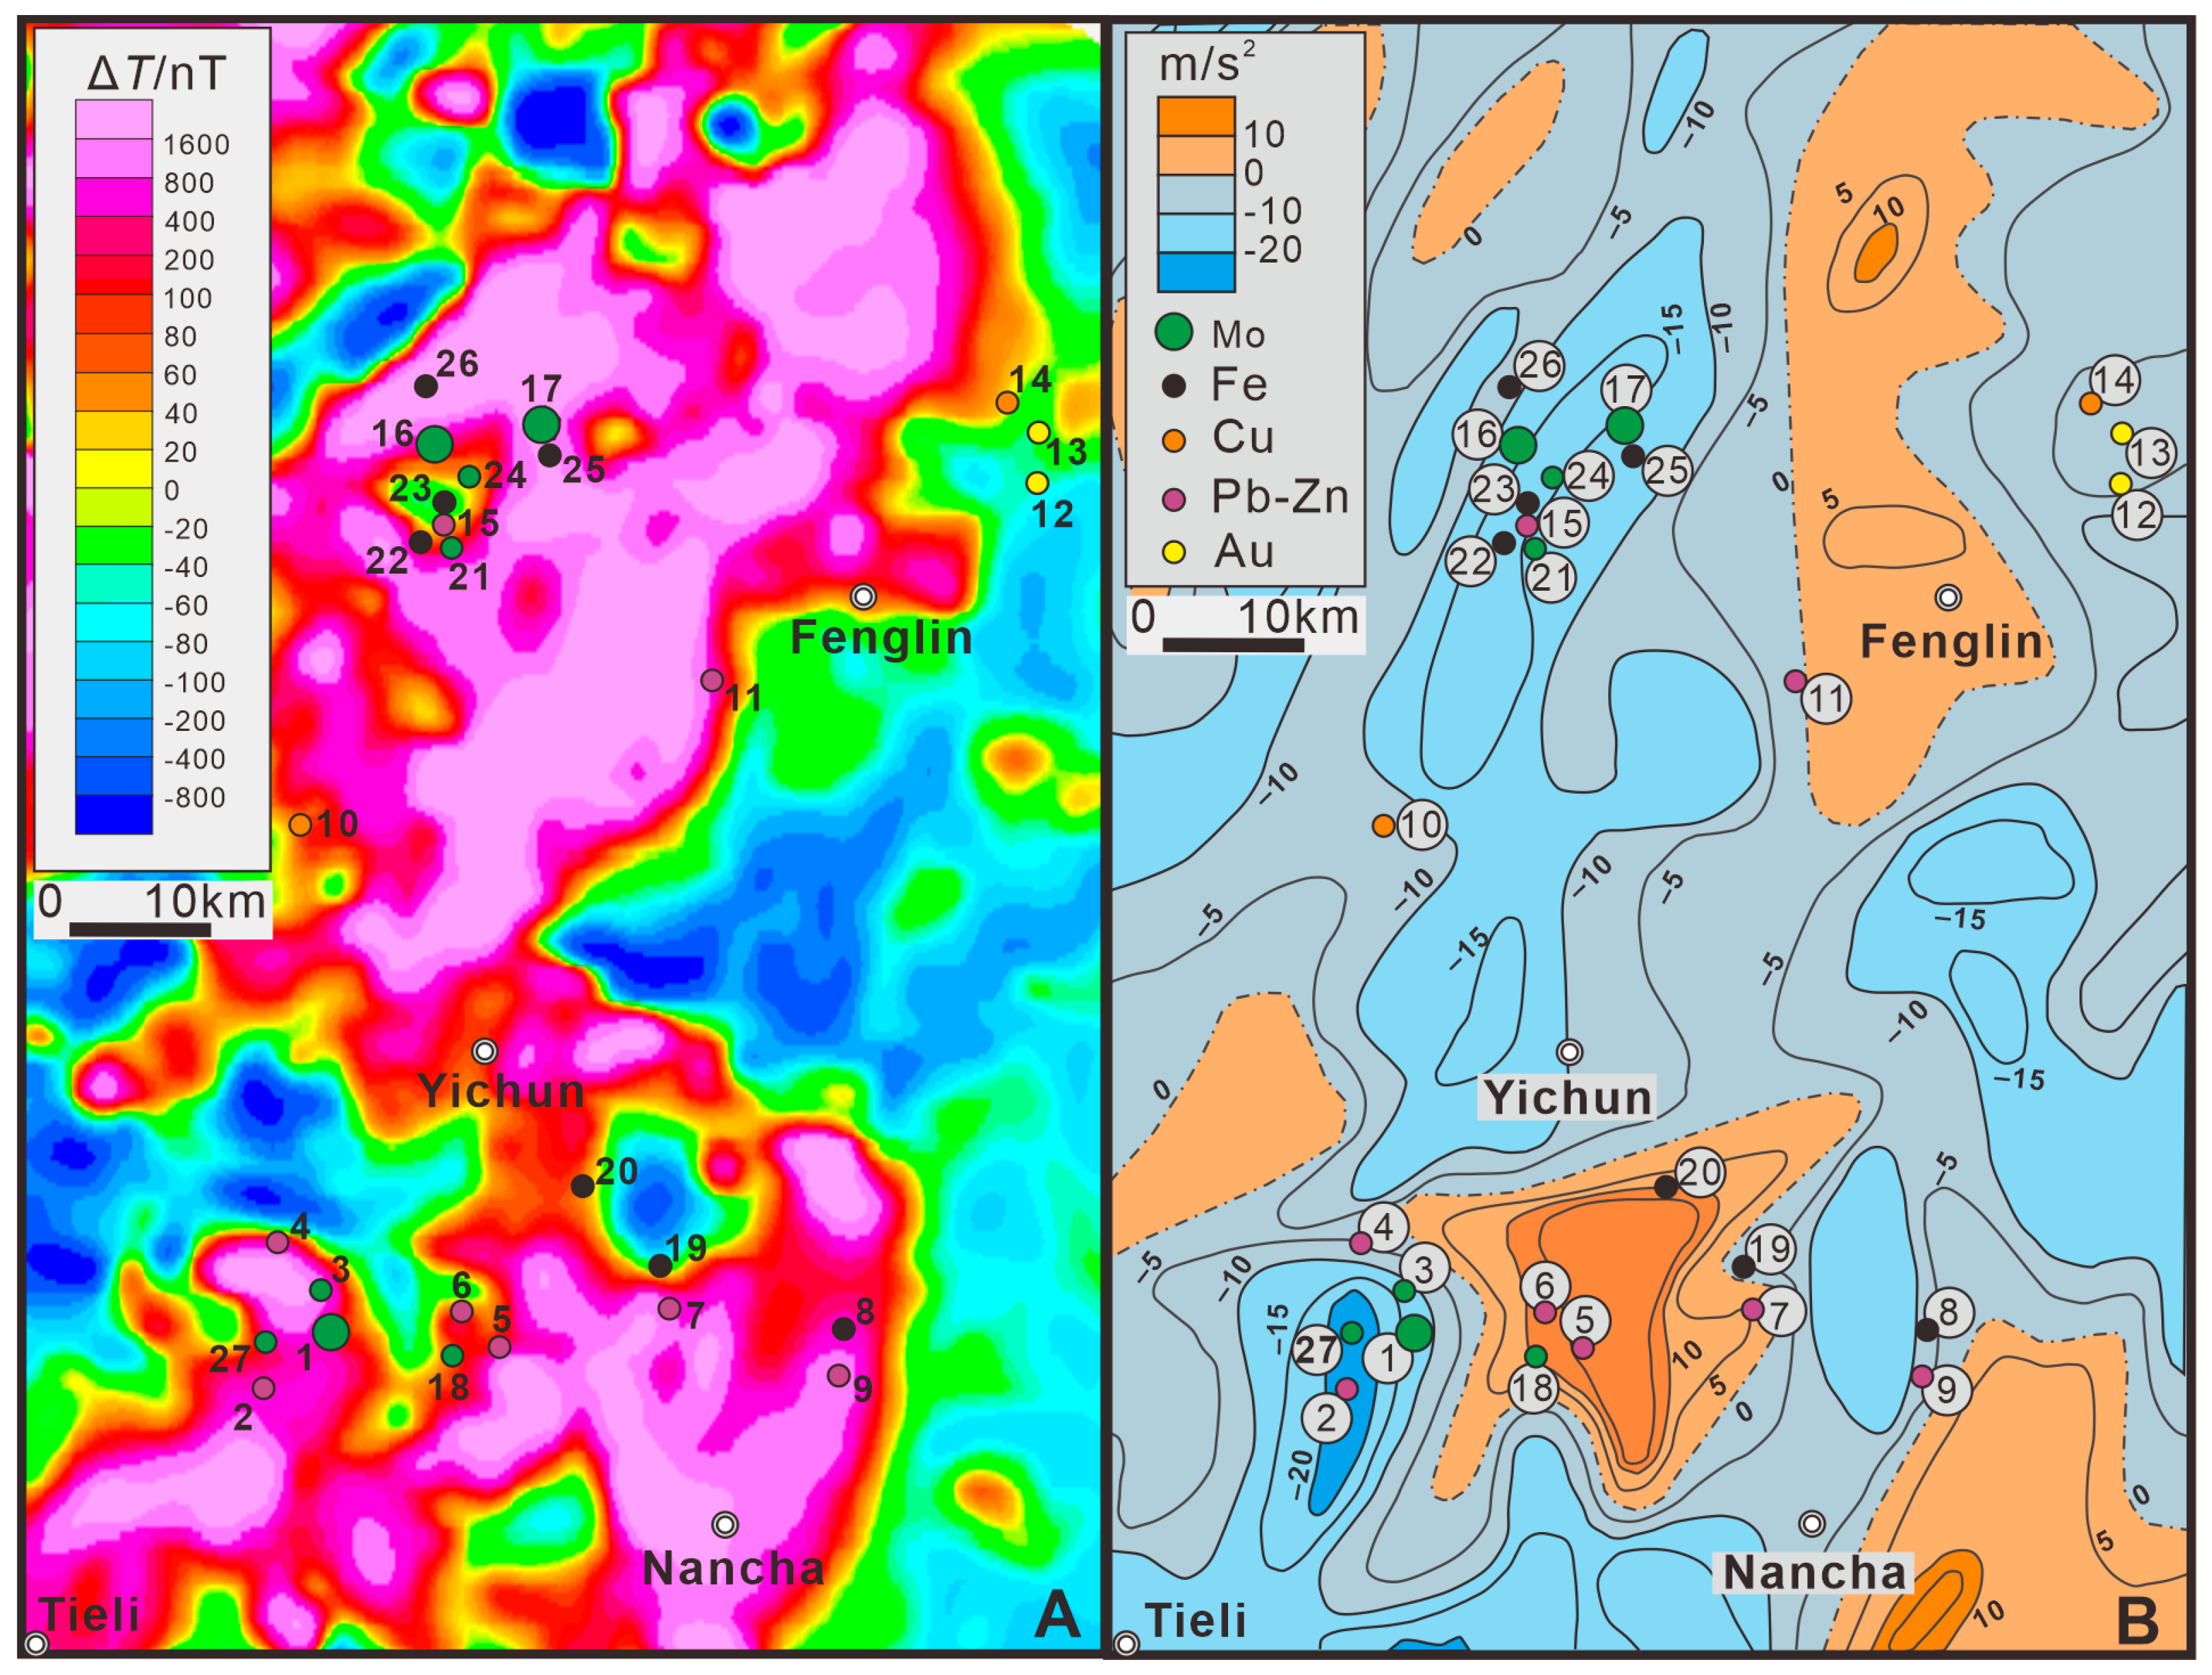
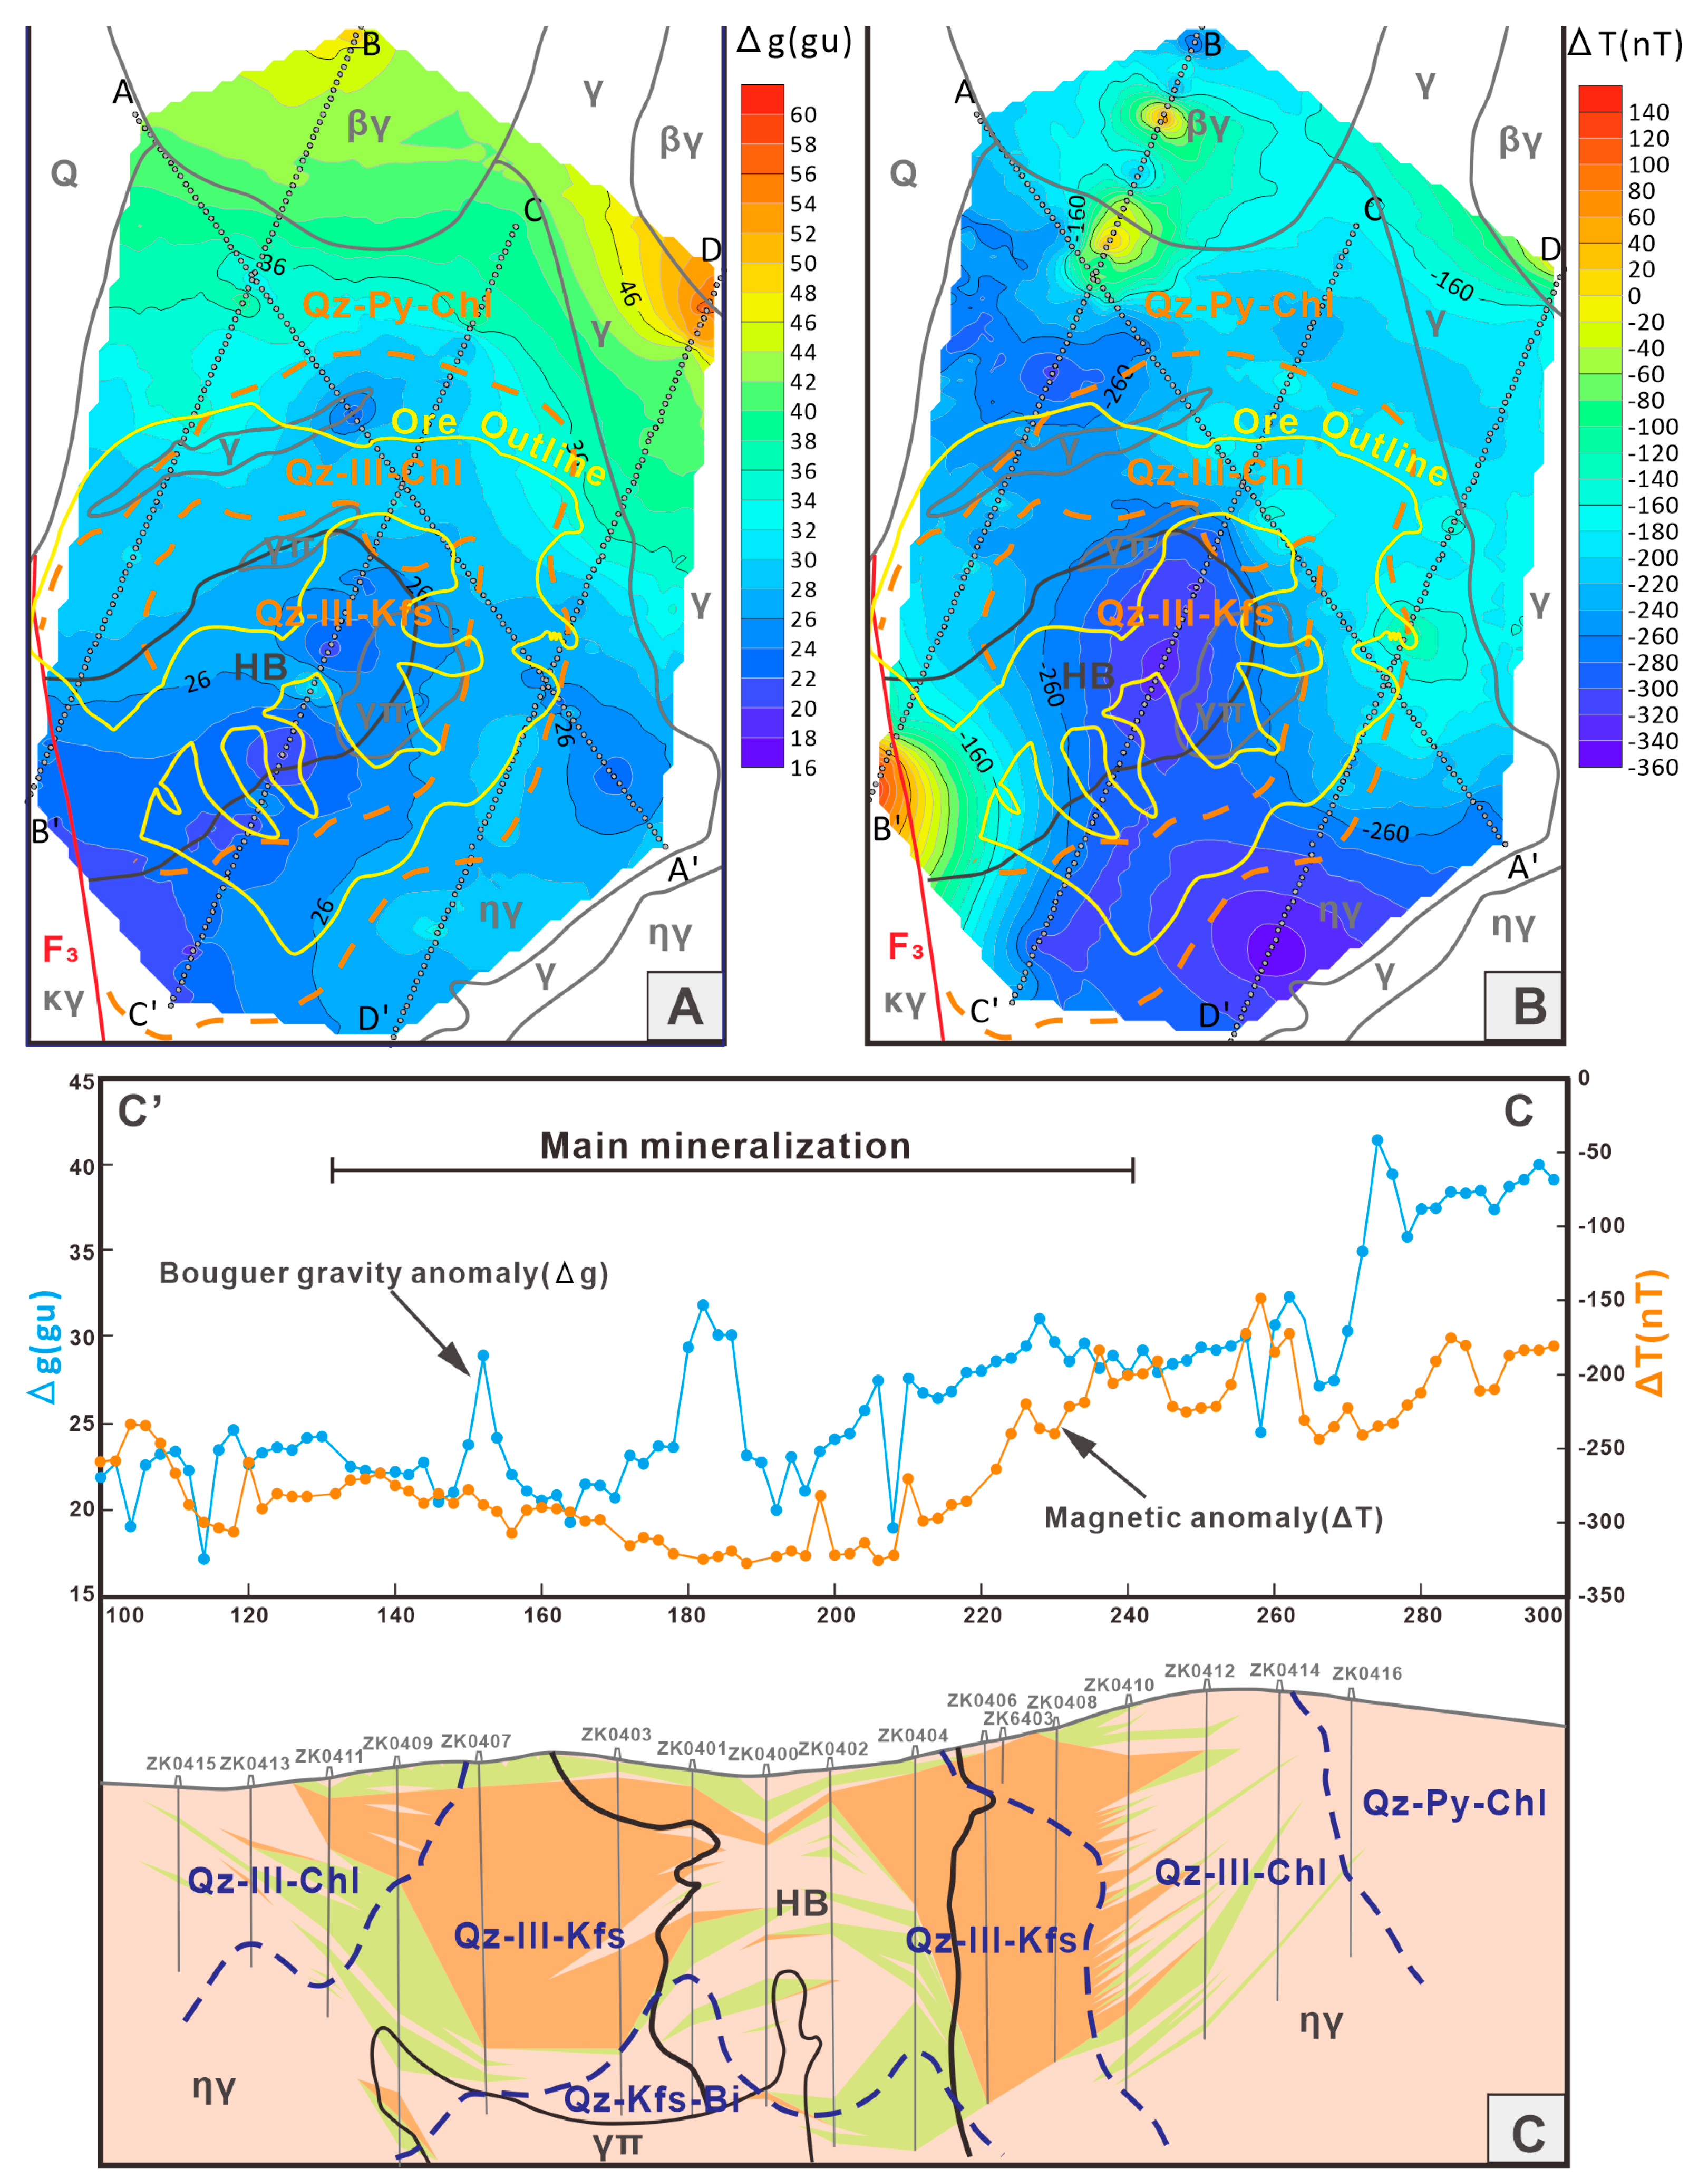
6.4. Bouguer Gravity and Magnetic Anomalies

The results of the Bouguer gravity and magnetic anomalies are shown in Figure 16. The observed NE distribution in the low value area of the Bouguer gravity anomalies corresponds well with the extent of mineralization and alteration zones (Figure 16A,C). On the plane, areas below 26 gu show a consistent distribution of hydrothermal breccias and low-grade ores (Figure 16A). Similarly, the B–B’ profile of the Bouguer gravity anomalies shows that the main mineralization (survey points 130–240, Bouguer gravity anomalies = 18.9–31.8 gu, average 24.9 gu) exhibits characteristics of lower gravity anomalies compared to the altered surrounding rocks (survey points 100–130 and 240–300, Bouguer gravity anomalies = 16.9–41.4 gu, average 29.8 gu) (Figure 16C). In unaltered areas, biotite monzogranite and fine-grained granite north of the silicification-pyritization-chloritization zone represent regions of high Bouguer gravity anomalies (>36 gu).
The magnetic survey shows predominantly negative anomalies throughout the deposit, with positive anomalies observed only within the K-feldspar granite distribution area in the southwest corner (Figure 16B). In contrast to the Bouguer gravity anomaly, low magnetic anomalies (≤−260 nT) generally trend northwest. On a planar scale, the main mineralization is mainly located in regions with magnetic anomalies lower than (−160 nT (Figure 16B). The magnetic anomaly profile (Figure 16C) also shows that the main zone of mineralization coincides with an area of low magnetic anomalies (−394.7~−137.1 nT, averaging −281.3 nT), while altered wall rocks and weakly mineralized areas have relatively higher magnetic anomalies (−306.9~−148.9 nT, averaging −228.3 nT). The hydrothermal breccias have the lowest level of magnetic anomalies along the profile (Figure 16C).

6.5. Resistivity and Chargeability

The results of the Induced Polarization Intermediate Gradient survey are shown in Figure 17. At the surface, the entire deposit has low resistivity (Figure 17A). The main mineralization shows medium to low resistivity, generally below 1000 Ω·m. High resistivity (>1000 Ω·m) is observed in the western area of the deposit where K-feldspar granite is distributed (chargeability less than 3.5%) and in the southeastern area with weaker mineralization but developed pyritization (chargeability greater than 5.5%). The orebody is characterized by moderate to high chargeability, ranging from 3.5% to 8.0% (Figure 17B). High chargeability areas are located within the silicification-pyritization-chloritization zone (chargeability greater than 5.5%). Areas of low chargeability (less than 3.5%) coincide with the central part of the orebody, corresponding to the distribution of hydrothermal breccias (Figure 17B).
The induced polarization profile (Figure 17C) shows that the main mineralization is characterized by moderate to low resistivity (survey points 160–260, resistivity ranging from 264 to 1020 Ω·m, with an average of 655 Ω·m) and moderate to high chargeability (chargeability ranging from 1.4% to 6.1%, with an average of 4.2%). The alteration zone in the northwest region of the deposit is characterized by low resistivity (survey points 90–160, resistivity ranging from 361 to 987 Ω·m, with an average of 565 Ω·m) and high chargeability (chargeability ranging from 4.6% to 9.4%, with an average of approximately 7.0%). The alteration zone in the southeast region is characterized by high resistivity (survey points 260–300, resistivity ranging from 394 to 1600 Ω·m, with an average of 959 Ω·m) and high chargeability (chargeability ranging from 4.9% to 10.7%, with an average of 6.9%).

7. Discussion

7.1. Porphyry-Related Magmatic-Hydrothermal System

Numerous studies have shown that porphyry Cu-Mo-Au deposits, together with their associated distal skarn and epithermal Pb-Zn-Au-Ag deposits, may be parts of a single porphyry-related magmatic-hydrothermal system [73,74,75,76,77,78]. Skarn and epithermal mineralization commonly occur within 2–6 km of the periphery of porphyry deposits [77], which has significant implications for exploration criteria and targeting of prospective areas. The Luming PMD and Cuiling porphyry Mo-Au deposits are surrounded by skarn and epithermal Pb-Zn deposits such as Xulaojiugou, Kunlunqi, Qianjin Dongshan, and Xiling Nanshan (Figure 2), indicating the presence of a polymetallic metallogenic system associated with porphyry Mo mineralization. Similar patterns can also be observed at other large porphyry Mo deposits in the LXRZRMB. For example, the Chalukou Mo deposit exhibits vein-type Pb-Zn mineralization in its upper portion adjacent to a deeper porphyry Mo orebody [13,32,42]; the Cuihongshan and Huojihe porphyry-skarn Mo deposits are surrounded by skarn and epithermal Fe-Pb-Zn deposits [34,35,36] (Figure 2).
Jin et al. [77] argued that a comprehensive analysis is needed to determine whether porphyry deposits and distal skarn-epithermal deposits belong to the same metallogenic system, considering factors such as their spatiotemporal distribution, mineral paragenesis, and the evolution of fluid and material sources. The comparable compositions and closely related ages of the mineralized porphyries of the Luming PMD (180.7 ± 1.6 Ma, 181.2 ± 1.1 Ma) and the Xulaojiu Pb-Zn deposit (179.9 ± 1.0 Ma) indicate an origin from a common magmatic-hydrothermal system [49]. Furthermore, 1:50,000 scale stream sediment anomalies indicate the presence of central Mo-W-Cu anomalies with peripheral Pb-Zn-Ag distributions [41] (Figure 3), which may exhibit a spatial correlation with this magmatic-hydrothermal system. In the Cuihongshan-Huojihe area, geochronological studies indicate two episodes of magmatic intrusion activity that resulted in the formation of two distinct Mo-polymetallic ore subsystems: the early Cuihongshan porphyry and skarn Mo-Fe-W deposit (207–190 Ma) and the late Huojihe porphyry Mo and skarn Pb-Zn deposit (197–160 Ma) [33,34,35,36,62].

7.2. Control of Hydrothermal Breccias on Ore Distribution

The presence of breccias in porphyry deposits is well documented historically [73,79,80,81,82]. Lowell [79] reported that of twenty-seven porphyry deposits examined, twenty were found to contain breccias. Within the LXRZRMB, in addition to the Luming deposit, other deposits such as Chalukou [32,42,80], Huojihe [16], and Daheishan [28,30,58] have been identified as containing breccias. Based on their characteristics, Sillitoe [73] classified breccias associated with porphyry deposits into four types: magmatic hydrothermal breccias, phreatic porphyry Cu-level breccias, phreatic epithermal-level breccias, and phreatomagmatic breccias. Although the ore-controlling characteristics vary between the different deposits, most of the breccias host mineralization [79].
The breccias in the Luming PMD consist of K-feldsparization monzogranite and granite porphyry, with silica and sulfide cement, indicating the genesis of magmatic hydrothermal breccias during mineralization (Figure 7H,F). From the 3D geological model (Figure 18), it is clear that the hydrothermal breccias at Luming PMD have significant controls on the ore distribution. They consist of a low-grade core in the center (including the intercalated rock) and high-grade economic mineralization at the periphery. Regionally, a similar configuration of breccias and mineralization has also been observed in the Huojihe Mo deposit [16].
The control mechanism of hydrothermal breccias on mineralization is the fragmentation of porphyries by magma-hydrothermal fluids and volatiles, resulting in the formation of highly permeable zones that facilitate fluid transport and ore accumulation [28,73,79,83]. Therefore, the presence of a central low-grade core consisting of silicification-K-feldsparization hydrothermal breccias at the Luming PMD may indicate a conduit for fluid flow during the early stage of moderate–high temperature magmatic hydrothermal activity [80]. Molybdenum tends to accumulate in the fractured surrounding rock, resulting in a circular distribution pattern on planar surfaces resembling the shape of a donut (Figure 18).

7.3. Primary Halo and Metal Zonation

Understanding primary halo or metal zonation in ore deposits is crucial for the analysis of mineralization mechanisms and the evaluation of the potential of deep-seated ore bodies [81,84,85,86,87,88,89]. The zoning characteristics of W-Bi-(Sb) →Mo →Cu-Co-Ni →Pb-Zn-Ag-In in the Luming PMD generally conform to the ideal zonation from Cu-Mo to Pb-Zn, as previously observed in other studies [73,76,90]. This can serve as an indicator for targeting the center of porphyry mineralization [81]. However, there is a discrepancy in the distribution of Sb, which is expected to be present along with Pb-Zn-Ag-In outside of Mo mineralization as a front halo. However, its anomaly is clearly located in the central part of the orebody (Figure 15). One potential explanation for this inversion is the possibility of later-stage hydrothermal activity in deeper parts of known ore bodies [87]. Based on the spatial distribution characteristics of existing fine-grained granite, hydrothermal breccias, hydrothermal alterations and ore shells, as well as geophysical anomalies, it can be inferred that ore-forming fluids may have migrated from southwest depths to northeast shallower levels during the mineralization process. This inference is supported by the findings presented in Figure 5, Figure 8, Figure 15, Figure 17 and Figure 18. Further investigation is necessary to ascertain whether the distribution of Sb indicates the presence of an additional superimposed mineralization in the deep southwest side or a genetic connection with the Mo mineralization observed at 712Higland (Figure 2 and Figure 3) on the western side of the Luming PMD.

7.4. Indication of Geophysical Survey

The geophysical properties of rocks are affected by numerous factors, including lithology, type(s)of alteration and mineralization, fracturing, hydraulic conditions, weathering, burial depth, and thickness of surface coverings [91,92]. Therefore, it is necessary to conduct a comprehensive analysis and interpretation from diverse disciplines [93]. The lowest Bouguer gravity values are observed in hydrothermal breccias, indicating the presence of significant fracturing at the center of the Luming PMD (Figure 16A, Table 2). The main mineralization zones at the deposit are closely associated with silicification-illitization, displaying medium-low resistivity characteristics [94]. In contrast, the high pyrite content typically found in the periphery of Cu-Mo mineralization corresponds to the high chargeability anomaly generally observed in the outermost zone of alteration, which is characterized by silicification-pyritization-chloritization (Figure 17B). In general, intense fracturing and fluid flow processes resulted in widespread silicification, illitization, and chloritization overlying K-feldsparization and biotitization. These processes resulted in the destruction of ferromagnetic minerals, resulting in low magnetic susceptibility and negative anomalies at Luming PMD [78,91,93,94,95,96] (Figure 16B). Consequently, negative magnetic anomalies serve as an effective indirect technique for the exploration of porphyry deposits [94,97]. This is corroborated by the characteristics of the Duobaoshan Cu deposit [45] and the Chalukou Mo deposit [42], which exhibit characteristics of negative magnetic anomalies within their mineralized or altered zones.

7.5. Exploration Methods and Criteria

In light of the preceding discussion, this paper presents an overview of the exploration criteria and prospecting targets at different scales for Luming-type porphyry Mo deposits.
At the regional scale, prospecting criteria and targets can be defined as follows: (1) tectonic intersection area of the Central Asian Metallogenic Belt and the Circum-Pacific Metallogenic Belt; (2) regions occupied by the NE-trending peraluminous to metaluminous, high-K calc-alkaline to shoshonitic intrusive rocks associated with early Jurassic subduction of the Pacific Plate; (3) anomalous gradient belts in aeromagnetic and aerogravity surveys, which are characterized by moderate–high magnetic anomalies and low Bouguer gravity anomalies; (4) regions with anomalous stream sediment geochemistry exhibiting W-Bi-Cu-Mo anomalies or Pb-Zn-Ag anomalies towards the center; (5) the central area of potential porphyry Mo and polymetallic mineralization systems.
The criteria for exploration and location prediction for ore deposits are as follows: (1) the presence of molybdite in the surface oxidation zone; (2) areas exhibiting typical alteration observed in porphyry deposits, characterized by a central silicification-K-feldsparization-biotitization transitioning to a peripheral silicification-illitization-chloritization and silicification-pyritization-chloritization; (3) the occurrence of hydrothermal breccias; (4) deep or central positions of the Pb-Zn mineralization; (5) primary halo or soil geochemical anomalies indicating W-Bi-Mo, surrounded by Cu-Co-Ni and Pb-Zn-Ag anomalies; (6) areas displaying low Bouguer gravity anomalies and negative magnetic anomalies as revealed through ground geophysical surveys; (7) induced polarization demonstrating moderate–low resistivity and moderate–high chargeability at the center of the target, while featuring low resistance and high chargeability at its periphery.
Further progress could be achieved by application of advanced techniques such as deep-penetration geochemical techniques (such as Geo-gas, [98]), primary halo axial zoning (like CoBA, [88]), three-dimensional geochemical modeling [86], and alteration mapping based on SWIR, pXRF, and indicator minerals [93].

8. Conclusions

(1)
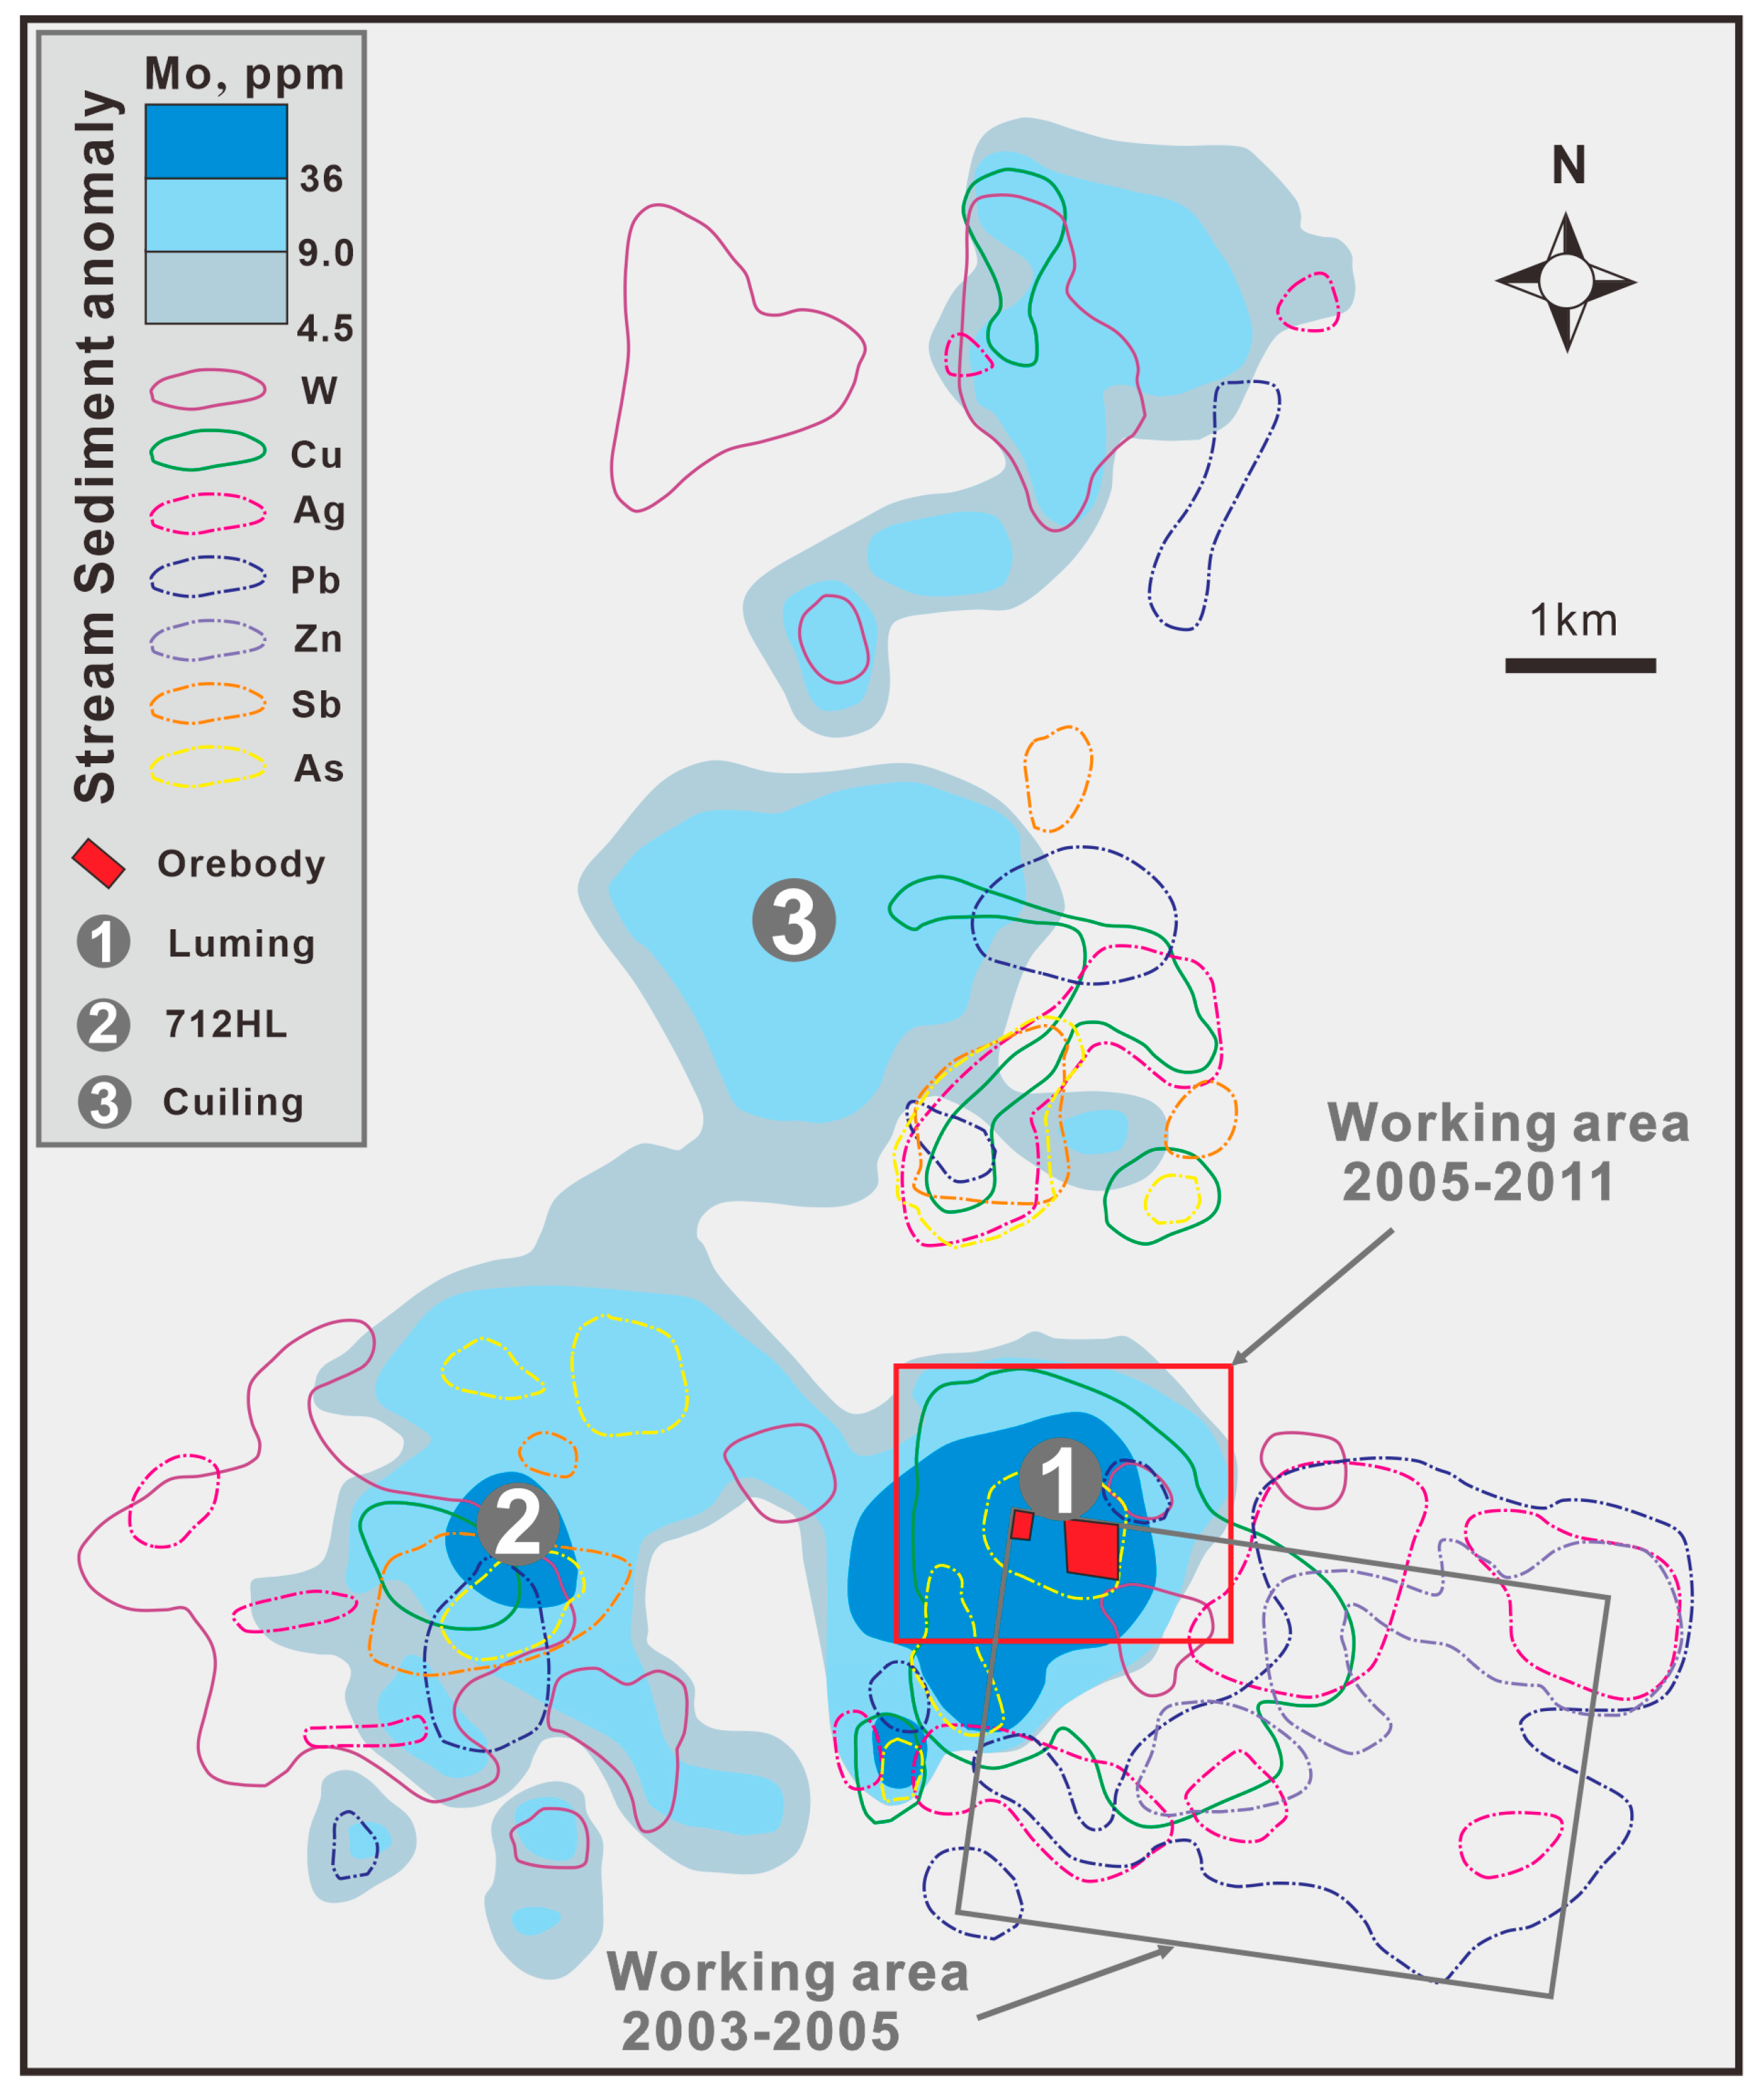
The identification of geochemical anomalies in stream sediments represents a pivotal element in the discovery of the Luming PMD. The combination of stream sediment geochemistry with large-scale soil geochemistry and geophysical surveys represents an effective exploration method. This integrated approach allows the rapid delineation of prospective targets for porphyry Mo deposits.
(2)
Hydrothermal breccias play a significant role in controlling mineralization and may act as conduits for ore-forming fluids.
(3)
The primary halo exhibits a distinct metal zonation, transitioning from a central W-Bi-Mo-(Sb) to a peripheral Cu-Co-Ni and distal Pb-Zn-Ag-In. The presence of Sb in the tail halo positions may suggest the possibility of deep-seated mineralization.
(4)
Gradient belts of aerogravity and aeromagnetic anomalies indicate the locations of the Luming PMD, while the deposit scale geophysical anomalies define the extent of mineralization and alteration. The mineralized rocks exhibit a low Bouguer gravity anomaly, a negative magnetic anomaly, moderate–low resistivity, and moderate–high chargeability.
(5)
It is proposed that the porphyry Mo and distal skarn-epithermal Pb-Zn mineralization at Luming may be parts of a single porphyry-related magmatic-hydrothermal system.

Supplementary Materials

The following supporting information can be downloaded at: https://www.mdpi.com/article/10.3390/min14070718/s1, Table S1: Major elements compositions of the monzogranites and granite porphyry of the Luming PMD; Table S2: Trace elements and REE compositions of the monzogranites and granite porphyry of the Luming PMD.

Author Contributions

Conceptualization, B.G.; methodology, B.G. and M.D.; software, Z.L. and H.X.; investigation, B.G., Z.L. and T.Z.; data curation, Y.L. and T.Z.; writing—original draft preparation, B.G., M.D. and H.X.; writing—review and editing, B.G. All authors have read and agreed to the published version of the manuscript.

Funding

This research was jointly funded by China Railway Engineering Corporation’s Science & Technology Projects (2011-Key-82) and China Railway Resources Group Co., Ltd.’s Science & Technology Projects (2011-Key-07, 2021-Key-02).

Data Availability Statement

Data are contained within the article.

Acknowledgments

The authors would like to express their gratitude to the anonymous reviewers and the academic editor for their invaluable comments and suggestions, which have significantly enhanced the quality of this manuscript. We would like to express our sincerest gratitude to the dedicated team members from the former China Railway Resources Mineral Exploration Co., Ltd., including Fangliu Dong, Yong Wang, Weiliang Wang, Haijun Yu, Bing Zhang, Xiuqin Chen, Yang Liu, Li Li, Huaixiang Li, Yaoxing Hu, and others for their invaluable contributions during the exploration process of the Luming Mo deposit. Bangfei Gao extends his gratitude to Guofeng Liu, from the Exploration Department of Tenke-Fungurume Mining (D.R. Congo), for his invaluable assistance with the Leapfrog Geo 2023.2 software.

Conflicts of Interest

Authors Bangfei Gao, Hui Xie and Yihang Li are employed by the company China Railway Resources Group Co., Ltd.; Authors Minghua Dong and Zhiliang Liu are employed by the company China Railway Resources Group Survey and Design Co., Ltd.; Author Tong Zhou is employed by the company Yichun Luming Mining Co., Ltd..

References

  1. Wang, D.H.; Dai, H.Z.; Liu, S.B.; Wang, C.H.; Yu, Y.; Zhao, Z. Progress in strategic critical minerals exploration and production and proposals for a new round of prospecting in China. Sci. Technol. Rev. 2024, 42, 7–25, (In Chinese with English abstract). [Google Scholar] [CrossRef]
  2. Sinclair, W.D. Porphyry deposits. In Mineral Deposits of Canada: A Synthesis of Mzajor Deposit-Types, District Metallogeny, the Evolution of Geological Provinces, and Exploration Methods; Goodfellow, W.D., Ed.; Geological Association of Canada, Special Publication: St. John’s, NL Canada, 2007; Volume 5, pp. 223–243. [Google Scholar]
  3. Li, C.Y.; Liao, R.Q. Formation mechanism and geochemical process of porphyry molybdenum deposits. Acta Petrol. Sin. 2020, 36, 77–84, (In Chinese with English abstract). [Google Scholar] [CrossRef]
  4. Wu, H.Y.; Zhang, L.C.; Pirajno, F.; Shu, Q.H.; Zhang, M.; Zhu, M.T.; Xiang, P. The Mesozoic Caosiyao giant porphyry Mo deposit in Inner Mongolia, North China and Paleo-Pacific subduction-related magmatism in the northern North China Craton. J. Asian Earth Sci. 2016, 127, 281–299. [Google Scholar] [CrossRef]
  5. Shu, Q.H.; Chang, Z.S.; Lai, Y.; Zhou, Y.T.; Sun, Y.; Cong, Y. Regional metallogeny of Mo-bearing deposits in Northeastern China, with new Re-Os dates of porphyry Mo deposits in the northern Xilamulun district. Econ. Geol. 2016, 111, 1783–1798. [Google Scholar] [CrossRef]
  6. Zeng, Q.D.; Guo, W.K.; He, H.Y.; Zhou, L.L.; Cheng, G.H.; Su, F.; Wang, Y.B.; Wang, R.L. He, Ar, and S isotopic compositions and origin of giant porphyry Mo deposits in the Lesser Xing’an Range–Zhangguangcai Range metallogenic belt, Northeast China. J. Asian Earth Sci. 2018, 165, 228–240. [Google Scholar] [CrossRef]
  7. Yang, J.H.; Xu, L.; Sun, J.F.; Zeng, Q.; Zhao, Y.N.; Wang, H.; Zhu, Y.S. Geodynamics of decratonization and related magmatism and mineralization in the North China Craton. Sci. China Earth Sci. 2021, 64, 1409–1427. [Google Scholar] [CrossRef]
  8. U.S. Geological Survey. Mineral Commodity Summaries 2024; USGS2024; U.S. Geological Survey: Reston, VA, USA, 2024; p. 212. [CrossRef]
  9. Zeng, Q.D.; Liu, J.M.; Chu, S.X.; Wang, Y.B.; Sun, Y.; Duan, X.X.; Zhou, L.L. Mesozoic molybdenum deposits in the east Xingmeng orogenic belt, Northeast China: Characteristics and tectonic setting. Int. Geol. Rev. 2012, 54, 1843–1869. [Google Scholar] [CrossRef]
  10. Fan, Y.; Zhou, T.F.; Zhang, D.Y.; Yuan, F.; Ren, Z.; White, N. Spatial and temporal distribution and metallogical background of the Chinese molybdenum deposits. Acta Geol. Sin. 2014, 88, 784–804, (In Chinese with English abstract). [Google Scholar]
  11. Han, C.M.; Xiao, W.J.; Windley, B.F.; Zhao, G.C.; Su, B.X.; Ao, S.J.; Zhang, J.E.; Zhang, Z.Y.; Wan, B.; Cui, B.; et al. Re-Os age of molybdenite from the Daheishan Mo deposit in the eastern Central Asian Orogenic Belt, NE China. Resour. Geol. 2014, 64, 379–386. [Google Scholar] [CrossRef]
  12. Shu, Q.H.; Chiaradia, M. Mesozoic Mo mineralization in northeastern China did not require regional-scale pre-enrichment. Econ. Geol. 2021, 116, 1227–1237. [Google Scholar] [CrossRef]
  13. Li, Z.Z.; Qin, K.Z.; Li, G.M.; Shunso, I.; Jin, L.Y.; Song, G.X.; Meng, Z.J. Formation of the giant Chalukou porphyry Mo deposit in northern Great Xing’an Range, NE China: Partial melting of the juvenile lower crust in intra-plate extensional environment. Lithos 2014, 202–203, 138–156. [Google Scholar] [CrossRef]
  14. Shao, J.; Yang, H.Z.; Jia, B.; Peng, M.S. Geological characteristics and ore-forming age of Luming Mo deposit in Heilongjiang Province. Miner. Depos. 2012, 31, 1301–1310, (In Chinese with English abstract). [Google Scholar] [CrossRef]
  15. Li, L.X.; Song, Q.H.; Wang, D.H.; Wang, C.H.; Qu, W.J.; Wang, Z.G.; Bi, S.Y.; Yu, C. Re-Os isotopic dating of molybdenite from the Fu′anpu molybdenum deposit of Jilin Province and discussion on its metallogenesis. Rock Miner. Anal. 2009, 28, 283–287, (In Chinese with English abstract). [Google Scholar] [CrossRef]
  16. Hu, X.L.; Yao, S.Z.; Zeng, G.P.; Liu, W.H.; Zhang, Z.J. Multistage magmatism resulting in large-scale mineralization: A case from the Huojihe porphyry Mo deposit in NE China. Lithos 2019, 326–327, 397–414. [Google Scholar] [CrossRef]
  17. Ju, N.; Ren, Y.S.; Wang, C.; Wang, H.; Zhao, H.L.; Qu, W.J. Ore genesis and molybdenite Re-Os dating of Dashihe molybdenum deposit in Dunhua, Jilin. Glob. Geol. 2012, 31, 68–76, (In Chinese with English abstract). [Google Scholar] [CrossRef]
  18. Wang, Z.G.; Wang, K.Y.; Wan, D.; Konare, Y.; Yang, T.N.; Liang, Y.H. Metallogenic age and hydrothermal evolution of the Jidetun Mo deposit in central Jilin Province, Northeast China: Evidence from fluid inclusions, isotope systematics, and geochronology. Ore Geol. Rev. 2017, 89, 731–751. [Google Scholar] [CrossRef]
  19. Zhang, J.; Yang, Y.C.; Han, S.J.; Wutiepu, W. Geochronology, geochemistry, and Lu-Hf Isotopic compositions of monzogranite intrusion from the Chang’anpu Mo deposit, NE China: Implications for tectonic setting and mineralization. Minerals 2022, 12, 967. [Google Scholar] [CrossRef]
  20. Zeng, Q.D.; Liu, J.M.; Qin, K.Z.; Fan, H.R.; Chu, S.X.; Wang, Y.B.; Zhou, L.L. Types, characteristics, and time-space distribution of molybdenum deposits in China. Int. Geol. Rev. 2013, 55, 1311–1358. [Google Scholar] [CrossRef]
  21. Ge, W.C.; Wu, F.Y.; Zhou, C.Y.; Zhang, J.H. Porphyry Cu-Mo deposits in the eastern Xing’an-Mongolian Orogenic Belt: Mineralization ages and their geodynamic implications. Chin. Sci. Bull. 2007, 52, 3416–3427. [Google Scholar] [CrossRef]
  22. Yang, Y.C.; Han, S.J.; Sun, D.Y.; Guo, J.; Zhang, S.J. Geological and geochemical features and geochronology of porphyry molybdenum deposits in the Lesser Xing’an Range-Zhangguangcai Range metallogenic belt. Acta Petrol. Sin. 2012, 28, 379–390, (In Chinese with English abstract). [Google Scholar]
  23. Zhang, Y.; Sun, J.G.; Chen, Y.J.; Zhao, K.Q.; Gu, A.L. Re-Os and U-Pb geochronology of porphyry Mo deposits in central Jilin Province: Mo ore-forming stages in Northeast China. Int. Geol. Rev. 2013, 55, 1763–1785. [Google Scholar] [CrossRef]
  24. Zhang, Y.; Sun, J.G.; Xing, S.W.; Zhao, K.Q.; Ma, Y.B.; Zhang, Z.J.; Wang, Y. Ore-forming granites from Jurassic porphyry Mo deposits, east-central Jilin Province, China: Geochemistry, geochronology, and petrogenesis. Int. Geol. Rev. 2016, 58, 1158–1174. [Google Scholar] [CrossRef]
  25. Wang, Z.G.; Wang, K.Y.; Konare, Y.; Yang, T.N.; Liang, Y.H. Metallogenesis and hydrothermal evolution of Middle Jurassic porphyry Mo deposits in the southern Zhangguangcai Range, NE China: Evidence from fluid inclusions, H-O-S isotopes, and Re-Os geochronology. Int. Geol. Rev. 2017, 59, 1391–1412. [Google Scholar] [CrossRef]
  26. Shu, S.P.; Li, Q.G.; Liu, S.W.; Chen, Y.J. The origin and significance of the differences in petrogenesis and mineralization of porphyry gold, copper and molybdenum deposits. Earth Sci. Front. 2018, 25, 237–250, (In Chinese with English abstract). [Google Scholar] [CrossRef]
  27. Qu, P.; Li, N.B.; Niu, H.C.; Shan, Q.; Weng, Q.; Zhao, X.C. Difference in ore-forming magma between the Mesozoic porphyry Cu-Mo and Mo deposits in NE China: Records from apatite and zircon geochemistry. Ore Geol. Rev. 2021, 135, 104218. [Google Scholar] [CrossRef]
  28. Ju, N.; Zhang, D.; Zhang, G.B.; Zhang, S.; Ren, C.T.; Ren, Y.S.; Wang, H.; Wu, Y.; Liu, X.; Shi, L.; et al. Geology and mineralization of the Daheishan supergiant porphyry molybdenum deposit (1.65 Bt), Jilin, China: A review. China Geol. 2023, 6, 494–530. [Google Scholar] [CrossRef]
  29. Li, X.G.; Yang, J.F.; Yang, Y.C. Comprehensive geological, physical and chemical characteristics of Xinantun molybdenum deposit in central area of Jilin Province, and prospecting potential analysis. J. Jilin Univ. (Earth Sci. Ed.) 2024, 54, 1–20, (In Chinese with English abstract). [Google Scholar] [CrossRef]
  30. Zheng, W.; Yu, X.F. Geochronological and geochemical constraints on the petrogenesis and geodynamic setting of the Daheishan porphyry Mo deposit, Northeast China. Resour. Geol. 2018, 68, 1–21. [Google Scholar] [CrossRef]
  31. Liu, J.; Mao, J.W.; Wu, G.; Wang, F.; Luo, D.F.; Hu, Y.Q. Geochemical signature of the granitoids in the Chalukou giant porphyry Mo deposit in the Heilongjiang Province, NE China. Ore Geol. Rev. 2015, 64, 35–52. [Google Scholar] [CrossRef]
  32. Zhao, Q.; Zhai, D.; Mathur, R.; Liu, J.; Selby, D.; Williams-Jones, A.E. The giant Chalukou porphyry Mo deposit, Northeast China: The product of a short-Lived, high flux mineralizing event. Econ. Geol. 2021, 116, 1209–1225. [Google Scholar] [CrossRef]
  33. Hu, X.L.; Ding, Z.J.; He, M.C.; Yao, S.Z.; Zhu, B.P.; Shen, J.; Chen, B. Two epochs of magmatism and metallogeny in the Cuihongshan Fe-polymetallic deposit, Heilongjiang Province, NE China: Constrains from U-Pb and Re-Os geochronology and Lu-Hf isotopes. J. Geochem. Explor. 2014, 143, 116–126. [Google Scholar] [CrossRef]
  34. Chen, X.; Liu, J.J.; Carranza, E.J.M.; Zhang, D.H.; Collins, A.S.; Yang, B.; Xu, B.W.; Zhai, D.G.; Wang, Y.H.; Wang, J.P.; et al. Geology, geochemistry, and geochronology of the Cuihongshan Fe-polymetallic deposit, Heilongjiang Province, NE China. Geol. J. 2018, 54, 1254–1278. [Google Scholar] [CrossRef]
  35. Fei, X.H.; Zhang, Z.C.; Cheng, Z.G.; Santosh, M.; Jin, Z.L.; Wen, B.B.; Li, Z.X.; Xu, L.J. Highly differentiated magmas linked with polymetallic mineralization: A case study from the Cuihongshan granitic intrusions, Lesser Xing’an Range, NE China. Lithos 2018, 302–303, 158–177. [Google Scholar] [CrossRef]
  36. Zhang, Y.; Sun, J.G.; Xing, S.W.; Zhang, Z.J. Geochronology and geochemistry of the Cuihongshan Fe-polymetallic deposit, Northeastern China: Implications for ore genesis and tectonic setting. Can. J. Earth Sci. 2018, 55, 475–489. [Google Scholar] [CrossRef]
  37. Xing, K.; Shu, Q.H.; Lentz, D.R.; Wang, F.Y. Zircon and apatite geochemical constraints on the formation of the Huojihe porphyry Mo deposit in the Lesser Xing’an Range, NE China. Am. Mineral. 2020, 105, 382–396. [Google Scholar] [CrossRef]
  38. Xing, K.; Shu, Q.H.; Lentz, D.R. Constraints on the formation of the giant Daheishan porphyry Mo deposit (NE China) from whole-Rock and accessory mineral geochemistry. J. Petrol. 2021, 62, egab018. [Google Scholar] [CrossRef]
  39. Shu, Q.H.; Chang, Z.S.; Lai, Y.; Hu, X.L.; Wu, H.Y.; Zhang, Y.; Wang, P.; Zhai, D.G.; Zhang, C. Zircon trace elements and magma fertility: Insights from porphyry (-skarn) Mo deposits in NE China. Miner. Depos. 2019, 54, 645–656. [Google Scholar] [CrossRef]
  40. Zhu, J.H. Role and significance of geochemical exploration in the discovery of the Dayangshugou molybdenum deposit, Liaoning. Geol. China 2007, 34, 342–346, (In Chinese with English abstract). [Google Scholar]
  41. Han, Z.Z.; Zhao, H.L.; Li, J.J.; Luo, J.; Zhang, W.L.; Li, W.L. Metallogenic prognosis of porphyry style molybdenum mineralization potential in Xing’an area, Tieli city, Heilongjiang province. Geol. Explor. 2009, 45, 253–259, (In Chinese with English abstract). [Google Scholar]
  42. Meng, Z.J.; Kan, X.S.; Li, X.C.; Wang, J.P.; Zhang, R.Z.; Lv, K.P.; Sun, Z.J.; Shi, Y.J.; Zhang, J.N.; Wang, H.Y.; et al. The discovery and exploration process of the Chalukou giant porphyry molybdenum polymetallic deposit in forest-covered area of Northeastern Da Higgnan Mountains and its geological significance. Geol. China 2011, 38, 1504–1517, (In Chinese with English abstract). [Google Scholar]
  43. Hu, Y.X.; Zhang, B. Geophysical characteristics and anomaly model of the Luming molybdenum deposit in Heilongjiang Province. Met. Mine 2015, 1, 82–85, (In Chinese with English abstract). [Google Scholar]
  44. Yin, G.L.; Liang, K.W.; Yang, F.S.; Wen, D.; Wang, Y. A discussion on the geochemical characteristics of stream sediments and ore-prospecting orientation in Weixing-Anquan area of Heilongjiang Province. Geophys. Geochem. Explor. 2017, 41, 402–409, (In Chinese with English abstract). [Google Scholar] [CrossRef]
  45. Zheng, J.; Yan, H.; Hua, L. The physical characteristics of rock(ore) and prospecting indicator of porphyry Cu-Mo deposits in Duobaoshan ore district. Chin. J. Eng. Geophys. 2018, 15, 788–797, (In Chinese with English abstract). [Google Scholar]
  46. Tan, H.Y.; Shu, G.L.; Lv, J.C.; Han, R.P.; Zhang, S.K.; Lin, L. LA-ICP-MS zircon U-Pb and molybdenite Re-Os dating for the Luming large-scale molybdenum deposit in Xiao Hinggan Mountains and its geological implication. J. Jilin Univ. (Earth Sci. Ed.) 2012, 42, 1757–1770, (In Chinese with English abstract). [Google Scholar]
  47. Ma, S.Q.; Chen, J. Geochronology and geochemistry of granite of the Luming molybdenum deposit in Heilongjiang and their geological significance. Geol. China 2012, 39, 1162–1171, (In Chinese with English abstract). [Google Scholar]
  48. Liu, C.; Deng, J.F.; Luo, Z.H.; Tian, S.P.; Zhang, Y.; Zhong, C.T.; Selby, D.; Zhao, H.D. Post-batholith metallogenesis: Evidence from Luming super large molybdenite deposit in Lesser Xing’an Range. Acta Petrol. Sin. 2014, 30, 3400–3418, (In Chinese with English abstract). [Google Scholar]
  49. Hu, X.L.; Ding, Z.J.; He, M.C.; Yao, S.Z.; Zhu, B.P.; Shen, J.; Chen, B. A porphyry-skarn metallogenic system in the Lesser Xing’an Range, NE China: Implications from U-Pb and Re-Os geochronology and Sr-Nd-Hf isotopes of the Luming Mo and Xulaojiugou Pb-Zn deposits. J. Asian Earth Sci. 2014, 90, 88–100. [Google Scholar] [CrossRef]
  50. Sun, Q.L.; Sun, J.G.; Zhao, K.Q.; Tang, C.; Zhang, Y.; Han, S.J.; Yang, F. Re-Os isotopic dating and geological significance of Luming porphyry molybdenum deposit in Heilongjiang. Glob. Geol. 2014, 33, 418–425, (In Chinese with English abstract). [Google Scholar]
  51. Zhan, C.P.; Wang, E.D.; Bi, Z.W.; Chen, J. Geochemical characteristics of mineralization rock from the Luming molybdenum deposit in Heilongjiang Province. J. Northeast. Univ. (Nat. Sci.) 2014, 35, 1039–1042, (In Chinese with English abstract). [Google Scholar] [CrossRef]
  52. Cheng, G.H.; Wang, R.L.; Zeng, Q.D.; Guo, Y.P.; Duan, X.X.; Wei, J.J.; Zhang, J.S.; Gao, X.H. Zircon U-Pb ages, Hf isotopes of the granitoids and Re-Os ages of the molybdenites in Luming molybdenum ore area, Heilongjiang Province, and its geological significance. Acta Petrol. Sin. 2015, 31, 2450–2464, (In Chinese with English abstract). [Google Scholar]
  53. Wang, L.L.; Sun, F.Y.; Xu, J.H.; Wang, K.Y.; Wang, L.; Xu, Q.L. Ore-forming fluid and evolution of Luming molybdenum deposit, Heilongjiang Province. Acta Petrol. Sin. 2015, 31, 979–990, (In Chinese with English abstract). [Google Scholar]
  54. Chen, L.; Zhang, Y. In situ major-, trace-elements and Sr-Nd isotopic compositions of apatite from the Luming porphyry Mo deposit, NE China: Constraints on the petrogenetic-metallogenic features. Ore Geol. Rev. 2018, 94, 93–103. [Google Scholar] [CrossRef]
  55. Xi, A.H.; Ge, Y.H.; Liu, J.; Xu, B.W.; Li, B.L.; Zhu, Y.D. Discovery of adakite in Tieli Luming-molybdenum mine, Heilongjiang Province and its geological implications. Acta Petrol. Sin. 2018, 34, 719–732, (In Chinese with English abstract). [Google Scholar]
  56. Chen, Y.J.; Zhang, C.; Wang, P.; Pirajno, F.; Li, N. The Mo deposits of Northeast China: A powerful indicator of tectonic settings and associated evolutionary trends. Ore Geol. Rev. 2017, 81, 602–640. [Google Scholar] [CrossRef]
  57. Sun, J.G.; Zhang, Y.; Xing, S.W.; Zhao, K.Q.; Zhang, Z.J.; Bai, L.A.; Ma, Y.B.; Liu, Y.S. Genetic types, ore-forming age and geodynamic setting of endogenic molybdenum deposits in the eastern edge of Xing-Meng orogenic belt. Acta Petrol. Sin. 2012, 28, 1317–1332, (In Chinese with English abstract). [Google Scholar]
  58. Li, Z.L.; Zeng, Q.D.; Liu, J.M.; Friis, H.; Zhang, Z.L.; Duan, X.X.; Lan, T.G. Geochronology of magmatism and mineralization of the Daheishan giant porphyry molybdenum deposit, JilinProvince, Northeast China: Constraints on ore genesis and implications for geodynamic setting. Int. Geol. Rev. 2014, 56, 929–953. [Google Scholar] [CrossRef]
  59. Tan, H.Y. Metallogenetic Series and Prospecting Assessment in Lesser Xing’an Range-Zhangguangcai Range Metallogenic Belt of Heilongjiang Province. Ph.D. Thesis, China University of Geosciences (Beijing), Beijing, China, 2013. [Google Scholar]
  60. Xiong, S.Q.; Ding, Y.Y.; Li, Z.K.; Zhang, H.R.; Fan, Z.G.; Guo, Z.H.; Tong, J.; Zhou, D.Q.; Huang, X.H. Geomagnetic and Geological Structures of the Chinese Mainland: Interpretation of the Chinese Mainland 1:1,000,000 Aeromagnetic Anomaly Map; Geological Publishing House: Beijing, China, 2016. (In Chinese) [Google Scholar]
  61. Li, Y.C.; Han, Z.Z.; Wu, G.G.; Zhang, D. Metallogenesis and metallogenic differences of the early Mesozoic granites in the Yichun area, Heilongjiang Province. Geol. Exploation 2013, 49, 28–38, (In Chinese with English abstract). [Google Scholar]
  62. Zeng, G.P.; Hu, X.L.; Yao, S.Z.; Dong, Z.L.; Zhou, M.; Yang, J. Two epochs of Mo mineralization in Cuihongshan Fe-Mo-polymetallic ore field, Heilongjiang Province. Earth Sci.-J. China Univ. Geosci. 2022, 47, 309–324, (In Chinese with English abstract). [Google Scholar] [CrossRef]
  63. Tian, S.P. Geochemical Characteristics of Ore Rock in the Luming and Culling Mo Deposit, Heilongjiang Province. Master’s Thesis, Jilin University, Jilin, China, 2013. (In Chinese with English abstract). [Google Scholar]
  64. Chen, J. Metallogenic Setting and Metallogenesis of Nonferrous-Precious Metals in Lesser Hinggan Mountain, Heilongjiang Province. Ph.D. Thesis, Jilin University, Jilin, China, 2011. (In Chinese with English abstract). [Google Scholar]
  65. Cai, W.J.; Feng, C.Y.; Ni, W.C. Analysis and study of aeromagnetic anomalous characteristics of lead-zinc polymetallic deposits in Yichun area. Geophys. Geochem. Explor. 2016, 40, 869–875, (In Chinese with English abstract). [Google Scholar] [CrossRef]
  66. Jia, W.L.; Sun, J.S. Non-ferrous metal mineral prospecting report in Luming and Ping’an, Tieli City, Heilongjiang Province. Unpublished Technical Report in Chinese. 2005. [Google Scholar]
  67. Jia, W.L.; Sun, J.S. Geological Exploration Report of Luming Mo Deposit, Tieli City, Heilongjiang Province. Unpublished Technical Report in Chinese. 2006. [Google Scholar]
  68. Wang, Y.; Wang, W.L.; Dong, F.L.; Chen, Y.B.; Gao, B.F.; Chen, X.Q.; Xu, J.L.; Li, L.; Yu, H.J.; Zhang, W.Q.; et al. Verification report on the resource and reserve of Luming Mo deposit, Tieli City, Heilongjiang Province. Unpublished Technical Report in Chinese. 2011. [Google Scholar]
  69. Middlemost, E.A.K. Naming materials in the magma/igneous rock system. Earth Sci. Rev. 1994, 37, 215–224. [Google Scholar] [CrossRef]
  70. Roberts, M.P.; Clemens, J.D. Origin of high-potassium, calc-alkaline, I-type granitoids. Geology 1993, 21, 825–828. [Google Scholar] [CrossRef]
  71. Maniar, P.D.; Piccoli, P.M. Tectonic discrimination of granitoids. Geol. Soc. Am. Bull. 1989, 101, 635–643. [Google Scholar] [CrossRef]
  72. Sun, S.S.; McDonough, W.F. Chemical and isotopic systematics of oceanic basalts: Implications for mantle composition and processes. In Magmatism in the Ocean Basins; Saunders, A.D., Norry, M.J., Eds.; Geological Society of London, Special Publications: Oxford, UK, 1989; Volume 42, pp. 313–346. [Google Scholar] [CrossRef]
  73. Sillitoe, R.H. Porphyry copper systems. Econ. Geol. 2010, 105, 3–41. [Google Scholar] [CrossRef]
  74. Mao, J.W.; Zhang, J.D.; Pirajno, F.; Ishiyama, D.; Su, H.M.; Guo, C.L.; Chen, Y.C. Porphyry Cu-Au-Mo-epithermal Ag-Pb-Zn-distal hydrothermal Au deposits in the Dexing area, Jiangxi province, East China-A linked ore system. Ore Geol. Rev. 2011, 43, 203–216. [Google Scholar] [CrossRef]
  75. Catchpole, H.; Kouzmanov, K.; Putlitz, B.; Seo, J.H.; Fontboté, L. Zoned base metal mineralization in a porphyry system: Origin and evolution of mineralizing fluids in the Morococha district Peru. Econ. Geol. 2015, 110, 39–71. [Google Scholar] [CrossRef]
  76. Li, Z.K.; Bi, S.J.; Li, J.W.; Zhang, W.; Cooke, D.R.; Selby, D. Distal Pb-Zn-Ag veins associated with the world-class Donggou porphyry Mo deposit, southern North China Craton. Ore Geol. Rev. 2017, 82, 232–251. [Google Scholar] [CrossRef]
  77. Jin, L.Y.; Qin, K.Z.; Li, G.M.; Zhao, J.X.; Li, Z.Z. Characteristics, controlling factors and exploration implications of porphyry molybdenum-hydrothermal vein-style lead-zinc-silver metallogenic systems. Acta Petrol. Sin. 2020, 36, 3813–3839. [Google Scholar] [CrossRef]
  78. Chitalin, A.F.; Baksheev, I.A.; Nikolaev, Y.N.; Nagornaya, E.V.; Khabibullina, Y.N.; Nikolaeva, I.Y.; Kalko, I.A.; Müller, D. Porphyry-epithermal Cu-Mo-Au–Ag mineralization in the Nakhodkaore field, Baimka Trend, Chukotka, Russia: A geological, mineralogical, and geochemical perspective. Miner. Depos. 2023, 58, 287–306. [Google Scholar] [CrossRef]
  79. Lowell, J.D.; Guilbert, J.M. Lateral and vertical alteration-mineralization zoning in porphyry ore deposits. Econ. Geol. 1970, 65, 373–408. [Google Scholar] [CrossRef]
  80. Li, Z.Z.; Li, G.M.; Meng, Z.J.; Qin, K.Z.; Song, G.X.; Jin, L.Y.; Kan, X.S.; Wang, J.; Zhang, X.N. Petrofacies classification, characteristics and formation mechanism of breccias in Chalukou giant molybdenum deposit of Da Hinggan Mountains. Miner. Depos. 2014, 33, 607–624, (In Chinese with English abstract). [Google Scholar]
  81. Qing, M.; Wang, W.C.; Li, W.B.; Zhang, L.J.; Zhang, D.; Han, X.J. Exploration of porphyry Cu±Mo±Au deposits in island arc and continental margin arc environment: Application of geological indexes. Miner. Depos. 2019, 38, 1223–1244, (In Chinese with English abstract). [Google Scholar] [CrossRef]
  82. Escolme, A.; Cooke, D.R.; Hunt, J.; Berry, R.F.; Maas, R.; Creaser, R.A. The productor a Cu-Au-Mo deposit, Chile: A Mesozoic magmatic-hydrothermal breccia complex with both porphyry and iron oxide Cu-Au affinities. Econ. Geol. 2020, 115, 543–580. [Google Scholar] [CrossRef]
  83. Landtwing, M.R.; Dillenbeck, E.D.; Heinrich, C.A. Evolution of the breccia-hosted porphyry Cu-Mo-Au deposit at Agua Rica, Argentina: Progressive unroofing of a magmatic hydrothermal system. Econ. Geol. 2002, 97, 1273–1292. [Google Scholar] [CrossRef]
  84. Carranza, E.J.M.; Sadeghi, M. Primary geochemical characteristics of mineral deposits implications for exploration. Ore Geol. Rev. 2012, 45, 1–4. [Google Scholar] [CrossRef]
  85. Borden, R.K. Environmental geochemistry of the Bingham Canyon porphyry copper deposit, Utah. Environ. Geol. 2003, 43, 752–758. [Google Scholar] [CrossRef]
  86. Moradpouri, F.; Ahmadi, S.M.H.; Ghaedrahmati, R.; Barani, K. Geochemical evaluation of the surface erosion for a hidden Cu-Au porphyry deposit using soil samples along with 3D ore-body modeling. Arab. J. Geosci. 2022, 15, 1164. [Google Scholar] [CrossRef]
  87. Sun, W.T.; Zheng, Y.Y.; Wang, W.; Feng, X.; Zhu, X.S.; Zhang, Z.Y.; Hou, H.X.; Ge, L.S.; Lv, H.Q. Geochemical characteristics of primary halo and prospecting significance of the Qulong porphyry copper-molybdenum deposit in Tibet. Minerals 2023, 13, 333. [Google Scholar] [CrossRef]
  88. Liu, Y.; Xia, Q.L. Compositional balance analysis: A novel method for tectono-geochemical anomaly identification and blind ore deposit prediction. Appl. Geochem. 2024, 164, 105939. [Google Scholar] [CrossRef]
  89. Shu, Q.H.; Deng, J.; Chang, Z.S.; Wang, Q.F.; Niu, X.D.; Xing, K.; Sun, X.; Zhang, Z.K.; Zeng, Q.W.; Zhao, H.S.; et al. Skarn zonation of the giant Jiama Cu-Mo-Au deposit in Southern Tibet, SW China. Econ. Geol. 2024, 119, 1–22. [Google Scholar] [CrossRef]
  90. Stoltnow, M.; Weis, P.; Korges, M. Hydrological controls on base metal precipitation and zoning at the porphyry-epithermal transition constrained by numerical modeling. Sci. Rep. 2023, 13, 3786. [Google Scholar] [CrossRef] [PubMed]
  91. Clark, D.A. Magnetic effects of hydrothermal alteration in porphyry copper and iron-oxide copper-gold systems: A review. Tectonophysics 2014, 624–625, 46–65. [Google Scholar] [CrossRef]
  92. Mitchinson, D.E.; Enkin, R.J.; Hart, C.J.R. Linking Porphyry Deposit Geology to Geophysics via Physical Properties: Adding Value to Geoscience BC Geophysical Data. Geoscience BC 2013, Report 2013-14, p. 116. Available online: http://www.geosciencebc.com/reports/gbcr-2013-14/ (accessed on 10 January 2024).
  93. Han, Z.H.; Wang, R.; Tong, X.S.; Sun, F.; Li, Y.Y.; Liu, S.Y.; Xue, Q.W. Multi-scale exploration of giant Qulong porphyry deposit in a collisional setting. Ore Geol. Rev. 2021, 139, 104455. [Google Scholar] [CrossRef]
  94. John, D.A.; Ayuso, R.A.; Barton, M.D.; Blakely, R.J.; Bodnar, R.J.; Dilles, J.H.; Gray, F.; Graybeal, F.T.; Mars, J.C.; McPhee, D.K.; et al. Porphyry Copper Deposit Model, Chap. B of Mineral Deposit Models for Resource Assessment; U.S. Geological Survey Scientific Investigations Report 2010-5070-B; USGS Central Mineral and Environmental Resources Science Center: Denver, CO, USA, 2010; 169p.
  95. Riveros, K.; Veloso, E.; Campos, E.; Menzies, A.; Véliz, W. Magnetic properties related to hydrothermal alteration processes at the Escondida porphyry copper deposit, Northern Chile. Miner. Depos. 2014, 49, 693–707. [Google Scholar] [CrossRef]
  96. Howe, B.; Devriese, S.G.R. An empirical geophysical model for porphyry copper deposits in the Laramide Copper Province. In Proceedings of the 4th AEGC: Geoscience-Breaking New Ground-13-18, Brisbane, Australia, 13–18 March 2023. [Google Scholar]
  97. Howe, B.; Kroll, A. The geophysical response of the Tupinda Cu-Au-Mo porphyry prospect, Tabar Islands, Papua New Guinea. ASEG Ext. Abstr. 2010, 2010, 1–5. [Google Scholar] [CrossRef]
  98. Wang, Q.; Wang, X.; Cheng, Z.; Zhang, B.; Du, Z.; Yan, T.; Yuan, H.; Li, X.; Qiao, Y.; Liu, H. Geogas-carried metal prospecting for concealed ore deposits: A review of case studies in China. Minerals 2023, 13, 1553. [Google Scholar] [CrossRef]
Figure 1. Geological map of the Lesser Xing’an Range–Zhangguangcai Range Metallogenic Belt (LXRZRMB) in Northeastern China and the distribution of Jurassic Mo deposits; the Luming porphyry Mo deposit is located in the northern section of the LXRZRMB [5,16].
Minerals 14 00718 g001
Figure 2. (A) Regional aeromagnetic anomaly and distribution of mineral deposits in the Yichun-Tieli area. (B) Regional aerogravity anomaly and mineral deposit distribution in the Yichun-Tieli area. The 1:1,000,000 aeromagnetic anomaly data are derived from [60], while the mineral deposit data are sourced from [41,61,62]. The 1:1,000,000 aerogravity anomaly data are based on [63]. 1 = Luming Mo(Cu); 2 = Xulaojiugou Pb-Zn; 3 = Cuiling Mo-Au; 4 = Kunlunqi Pb-Zn; 5 = Qianjin Dongshan Pb-Zn; 6 = Xiling Nanshan Pb-Zn; 7 = Xiaoxilin Pb-Zn; 8 = Fengmao Fe; 9 = Mantoushan Pb-Zn; 10 = Milin Cu-Fe; 11 = Wuxing Pb-Zn; 12 = Pingdingshan Au; 13 = Lianzhushan Au; 14 = Shouhushan Cu-Pb-Zn; 15 = Kubing Pb-Zn; 16 = Cuihongshan Mo-Fe-W-Pb-Zn; 17 = Huojihe Mo; 18 = Qianjin Nanshan Mo; 19 = Xilinshi’er Fe; 20 = Daxilin Fe; 21 = Hongqi Mo; 22 = Kuyuan Fe; 23 = Hongtieshan Fe-Mo; 24 = Yongxu Mo; 25 = Hongqishan Fe; 26 = Cuibei Fe; 27 = 712 Highland (712 HL).
Minerals 14 00718 g002
Figure 3. Regional stream sediment anomalies at scale of 1:50,000 show a zoning with W-Mo-Cu and Pb-Zn-Ag-As-Sb, modified after [41,44]. Two Mo ore bodies were discovered at the NW corner of the prospecting area during 2003–2005 (gray rectangle), offering valuable guidance for the following exploration campaigns during 2005–2011(red rectangle).
Minerals 14 00718 g003
Figure 4. The layout depicts diamond drilling and ground geophysical surveys, with the delineation of ore body outline following drilling exploration, modified after [68]. 1 = Quaternary; 2 = Indosinian-Yanshanian intrusive rocks; 3 = low-grade ores (0.03% ≤ Mo < 0.06%); 4 = economic ores (Mo ≥ 0.06%); 5 = drillings during general exploration; 6 = verification drillings after general exploration; 7 = drillings of resource verification stage; 8 = drillings of complementary exploration stage; 9 = exploration lines and numbers; 10 = locations of geophysical surveys. Gravity and magnetic surveys were conducted at A–A’, B–B’, C–C’, and D–D’, while induced polarization surveys were carried out at A–A’, E–E’, F–F’, and G–G’.
Minerals 14 00718 g004
Figure 5. Geological map of the Luming PMD, modified after [68]. 1 = Quaternary; 2 = F3 fault; 3 = K-feldspar granite; 4 = hydrothermal breccias; 5 = granite porphyry; 6 = fine-grained granite; 7 = biotite monzogranite; 8 = monzogranite; 9 = economic Mo ores; 10 = low-grade Mo ores; 11 = alteration zones; ② = silicification-illitization-K-feldsparization; ③ = silicification-illitization-chloritization; ④ = silicification-pyritization-chloritization.
Minerals 14 00718 g005
Figure 6. Geological cross section of the 04N exploration line at Luming PMD, modified after [68]. 1 = hydrothermal breccias; 2 = granite porphyry; 3 = monzogranite; 4 = economic Mo ores; 5 = low-grade Mo ores; 6 = alteration zones; ① = silicification-K-feldsparization-biotitization; ② = silicification-illitization-K-feldsparization; ③ = silicification-illitization-chloritization; ④ = silicification-pyritization-chloritization.
Minerals 14 00718 g006
Figure 7. Intrusive rocks and their alteration characteristics of the Luming PMD. (A) Monzogranite exhibits the silicification-K-feldsparization-biotitization overlain by silicification-illitization-chloritization. (B) Fine-grained granite intruded into the monzogranite, which underwent silicification-kaolinization while enveloping the earlier silicification-K-feldsparization. (C) Fine-grained granite encloses breccias of monzogranite. The fine-grained granite experienced silicification-pyrite-chloritization while monzogranite underwent silicification-K-feldsparization-biotitization. Both were superposed by late-stage veinlet silicification. (D) Granite porphyry was intruded into monzogranite; the former experienced strong silicification with residual plagioclase phenocrysts, while the latter underwent early silicification-K-feldsparization-biotitization and late veinlet silicification. (E) Granite porphyry, characterized by plagioclase phenocrysts, exhibited veinlet Mo mineralization. (F) K-feldspar granite underneath F3 fault without any mineralization. (G) F3 fault developed at the contact zone between the silicification-illitization monzogranite (grey) and the K-feldspar granite (red). (H) Mineralized hydrothermal breccias are composed of clasts of altered monzogranite and a cement matrix comprising silica and molybdenite. (I) Barren hydrothermal breccias comprise clasts made up of altered monzogranite within a silica-rich cement matrix. Qz = quartz; Kfs = K-feldspar; Pl = plagioclase; Bi = biotite; ill = illite; Kaol = kaolinite; Chl = chlorite; Py = pyrite; Mol = molybdenite; ηγ = monzogranite; γ = fine-grained granite; γπ = granite porphyry; κγ = K-feldspar granite; HB = hydrothermal breccias.
Minerals 14 00718 g007
Figure 8. The 3D geological model of the Luming PMD indicates a low strip ratio with a bowl-shaped structure, where intercalated rock can be separately delineated within the low-grade core, which is mainly composed of hydrothermal breccias.
Minerals 14 00718 g008
Figure 9. The occurrence of molybdenite at Luming PMD exhibits a multi-phase mineralization. (A) Molybdenite is found in clusters within quartz-molybdenite veins. (B) Molybdenite fills fractures in the monzogranite (D-type veinlet). (C) Molybdenite occurs as quartz-molybdenite veins (early phase, A-type veinlet) and pyrite-molybdenite veins (late phase, D-type veinlet). (D) Molybdenite in a radial aggregate. (E) Tabular crystals of molybdenite. (F) Molybdenite intergrowths with pyrite. (G) Molybdenite fills the cracks between mineral grains. (H) The paragenesis of molybdenite with pyrite and chalcopyrite. (I) Intergrowth of molybdenite and chalcopyrite. (J) Late-phase bornite and galena fill the spaces between early-phase molybdenite particles. (K) Molybdenite encases early-phase chalcopyrite. (L) The late-phase bornite-chalcopyrite solid solution fills the spaces between the early-phase molybdenite particles. (DL) were observed under reflected light; Qz = quartz; Mol = molybdenite; Py = pyrite; Cpy = chalcopyrite; Ga = galena; Sph = sphalerite.
Minerals 14 00718 g009
Figure 10. Characteristics of polymetallic mineralization under reflected light at Luming PMD. (A) Chalcopyrite (late phase) fills fractures of early pyrite. (B) Fractured pyrite was replaced by late-phase chalcopyrite, with oxidized edges forming blue chalcocite. (C) Late-phase pyrite replaces rutile encasing early ilmenite. (D) Chalcopyrite (late phase) replaces early pyrrhotite, forming a bay contact. (E) Chalcopyrite encases early pyrrhotite. (F) Chalcopyrite is dispersed in sphalerite. (G) Sphalerite is dispersed in chalcopyrite. (H) Chalcopyrite fills fractures of early pyrite cutting veinlets formed by rutile and ilmenite. (I) Chalcopyrite replaces rutile, both encasing early euhedral pyrite. (J) Late galena envelops early chalcopyrite. (K) Late galena replaces early sphalerites-chalcopyrite. (L) Titanite replaces early ilmenite. Ilm = ilmenite; Rt = rutile; Ttn = titanite; Po = pyrrhotite; Mol = molybdenite; Py = pyrite; Cpy = chalcopyrite; Ga = galena; Sph = sphalerite; Bcc = blue chalcocite.
Minerals 14 00718 g010
Figure 11. Alteration characteristics of the Luming PMD, showing a general evolution sequence of K-feldsparization-biotitization→illitization→chloritization→carbonatization, with silicification and pyritization throughout the hydrothermal processes. (A) Late calcite veins enclose the early K-feldsparization-biotitization monzogranite. (B) Potassic alteration characterized by pervasive K-feldsparization and veinlet biotitization. (C) Early silicification-K-feldsparization-biotitization overlain by late silicification-illitization-chloritization. (D) Quartz-molybdenite fills the early silicification-K-feldsparization monzogranite, which is cut by late silicification-molybdenite veinlets. (E) Early silicification-K-feldsparization ± biotitization overlain by late silicification-molybdenite veinlets shows brecciated structure. (F) Late silicification-pyritization intersects early silicification-K-feldsparization. (G) Early pyrite-calcite veins enclose early silicification-K-feldsparization. (H) Polysynthetic twinning plagioclase is replaced by perthite and quartz. (I) Veinlet biotitization. (J) Late quartz-calcite vein cut-through altered rocks of silicification-illitization-chloritization. Qz = quartz; Kfs = K-fedlspar; Pl = plagioclase; Bi = biotite; ill = illite; Chl = chlorite; Cc = calcite; Py = pyrite; Mol = molybdenite.
Minerals 14 00718 g011
Figure 12. Tentative timeframe for intrusion, brecciation, alteration, and mineralization of the Luming PMD, indicating multi-phase hydrothermal processes. Qz = quartz; Cc = calcite; Py = pyrite; Mol = molybdenite; Cpy = chalcopyrite; Ga = galena; Sph = sphalerite.
Minerals 14 00718 g012
Figure 13. Classification of the Luming monzogranite and granite porphyry samples. (A) (Na2O + K2O) vs. SiO2 [69]; (B) K2O vs. SiO2 [70]; (C) A/NK vs. A/CNK [71]; (D) Fe2O3/FeO vs. SiO2 diagrams [2]. Major element data are derived from [22,46,47,49].
Minerals 14 00718 g013
Figure 14. Primitive mantle-normalized trace element (A) and chondrite-normalized REE (B) spider diagrams for the Luming monzogranite and granite porphyry samples. Data for normalization are from [72]. Trace element data are derived from [22,46,47,49].
Minerals 14 00718 g014
Figure 15. The zoning characteristics of the primary halo at Luming PMD. (A) W. (B) Bi. (C) Mo (D) Cu. (E) Co. (F) Ni. (G) Zn. (H) Ag. (I) Pb. (J) Sb. (K) In. (L) Section 00E. Qz-Kfs-Bi = silicification-K-feldsparization-biotitization; Qz-Ill-Kfs = silicification-illitization-K-feldsparization; Qz-Ill-Chl = silicification-illitization-chloritization; Qz-Py-Chl = silicification-pyritization-chloritization; ηγ = monzogranite; γπ = granite porphyry; HB=hydrothermal breccias; F3 = F3 fault.
Minerals 14 00718 g015
Figure 16. Gravity and magnetic anomalies of the Luming PMD. (A) Contour map showing Bouguer gravity anomalies. (B) Contour map showing magnetic anomalies. (C) Cross section showing gravity and magnetic anomalies along C–C’. Qz-Kfs-Bi = silicification-K-feldsparization-biotitization; Qz-Ill-Kfs = silicification-illitization-K-feldsparization; Qz-Ill-Chl = silicification-illitization-chloritization; Qz-Py-Chl = silicification-pyritization-chloritization; Q = Quaternary; ηγ = monzogranite; βγ = biotite granite; γ = fine-grained granite; γπ = granite porphyry; κγ = K-feldspar granite; HB = hydrothermal breccias; F3 = F3 fault.
Minerals 14 00718 g016
Figure 17. Induced polarization anomalies of the Luming PMD. (A) Contour map shows resistivity anomalies. (B) Contour map shows chargeability anomalies. (C) Profile shows induced polarization anomalies along A–A’. Qz-Kfs-Bi =silicification-K-feldspathization-biotitization; Qz-Ill-Kfs = silicification-illitization-K-feldspathization; Qz-Ill-Chl = silicification-illitization-chloritization; Qz-Py-Chl = silicification-pyritization-chloritization; Q = Quaternary; ηγ = monzogranite; βγ = biotite granite; γ = fine-grained granite; γπ = granite porphyry; κγ = K-feldspar granite; HB = hydrothermal breccias; F3 = F3 fault.
Minerals 14 00718 g017
Figure 18. 3D geochemical model of the Luming PMD showing the influence of hydrothermal breccias on the distribution of mineralization. (A) Mineralization at 400 m elevation. (B) Mineralization at 100 m elevation. (C) Mineralization at 03N, 04N, and 12N cross sections. (D) Mineralization at 04E, 00E, and 03E cross sections. γπ = granite porphyry; HB = hydrothermal breccias.
Minerals 14 00718 g018
Table 1. Statistical characteristics of primary halo at Luming PMD.
Valid N Mean
ppm
Median
ppm
Minimum
ppm
Maximum
ppm
Std.Dev.
ppm
Coef.Var.
%
Skewness Kurtosis
Mo27,942516.40281.410.5224,790.0758.71477100
Ag26,900307.87190.990.3182,561.21149.8373422377
Bi26,9000.300.140.01162.31.9638483187
Co26,9007.797.860.07272.74.35510548
Cu26,900171.46159.841.005721.7121.3719308
In26,9000.040.020.0021.90.2612726478
Ni26,9003.713.780.07978.07.720610712,552
Pb26,90024.4012.710.4318,811.0194.0795625010
Sb26,9001.020.280.01231.82.5248322664
W26,90010.998.100.114757.531.228413219,976
Zn26,90052.2729.711.9931,259.7306.2586625392
Table 2. Statistics of physical properties of samples at Luming PMD.
ZoningLithologyNumber of
Samples
Mo
ppm
Resistivity
Ω·m
Chargeability
%
Magnetic Susceptibility
10−6 × 4πSI
Density
g/cm3
3ηr197475340 (596–19,313)56.3 (18–169)35.2 (10–109)2.54 (2.43–2.63)
2ηr + GP + HB586904050 (242–27,683)50.5 (6.4–204.7)12.5 (0–74.0)2.55 (2.40–2.72)
1HB1010157211 (949–20,520)29.6 (9.9–96.2)7.4 (0–64.0)2.61 (2.48–2.78)
0 *ηr1310322,636 (3451–47,698)12.8 (9.7–18.0)234.7 (87.0–408.0)2.58 (2.38–2.72)
* The data set was collected from ZK712-1 in the 712 Highland southwest of the Luming PMD, while other samples were collected from ZK0302 and ZK2001 at the Luming site. Data were summarized as mean (min.–max.) shapes. 0 = unaltered rock; 1 = silicification-K-feldspathization-biotitization zone; 2 = silicification-illitization-K-feldspathization zone; 3 = silicification-illitization-chloritization zone; ηγ = monzogranite; GP = granite porphyry; HB = hydrothermal breccias of monzogranite.
Disclaimer/Publisher’s Note: The statements, opinions and data contained in all publications are solely those of the individual author(s) and contributor(s) and not of MDPI and/or the editor(s). MDPI and/or the editor(s) disclaim responsibility for any injury to people or property resulting from any ideas, methods, instructions or products referred to in the content.

