Article

Effect of Solid Concentration on Particle Size Distribution and Grinding Kinetics in Stirred Mills

1
National Engineering Research Center of Coal Preparation and Purification, China University of Mining and Technology, Xuzhou 221116, China
2
State Key Laboratory of Coking Coal Resources Green Exploitation, China University of Mining and Technology, Xuzhou 221116, China
*
Author to whom correspondence should be addressed.
Minerals 2024, 14(7), 720; https://doi.org/10.3390/min14070720
Submission received: 11 June 2024 / Revised: 14 July 2024 / Accepted: 15 July 2024 / Published: 17 July 2024
(This article belongs to the Section Mineral Processing and Extractive Metallurgy)

Abstract

:
In this study, the evolution behavior of the particle size distribution during the grinding process was examined with fractal theory. According to the distribution index k of the Rosin–Rammler–Benne model, the relationship between the fractal dimension D of the fractal theory and the distribution index k is discussed. The fractal dimension D was used to evaluate the uniformity of the particle size distribution of the grinding product. In addition, the population balance model was used to simulate the breakage behavior of each size interval. The result indicates that the non-first-order model presented a better fitting performance in the breakage behavior of the coarse size and the desired size when compared with the other type of model. It can be found that the breakage rate increased with the solid concentration. However, the breakage distribution function is independent of the solid concentration in this study. These results suggest that the effect of the solid concentration on the fraction of the coarse size broken into the desired size was not significant. Furthermore, the simulated data are discussed and analyzed with the attainable region method as well as the difference in the change rate of the desired size and the overgrinding size. It can be found that to produce a higher fraction of the desired size in the grinding products, the residence time of the material in the mill needs be shortened with a higher solid concentration.

1. Introduction

It is highly challenging to study the grinding process since it has numerous parameters and complex issues. For a long time, researchers have conducted extensive works on grinding machines and obtained extensive results. The particle size distribution of grinding products has an important effect on downstream operations. Especially for mineral processing, materials with a narrower and more uniform particle size distribution are beneficial for sorting operations. For example, sulfide ores with a particle size of approximately 15–150 μm have higher recovery in flotation plants, while much finer and much coarser particles result in a decline in flotation plant recovery [1]. In the ceramic industry, ceramic powder with a narrower and more symmetrical particle size distribution requires lower sintering temperatures and shorter sintering times [2]. Therefore, it is important to optimize the operating condition to obtain an ideal particle size distribution for the grinding product.
A previous study revealed that wet and dry operating conditions affect the particle size distribution of the grinding product. The morphological characterization of particles was investigated for wet and dry grinding of coal in a laboratory-scale ball mill by Bu et al. [3]. The study indicated that the surface of particles obtained by dry grinding is rougher than that obtained by wet grinding. In addition, dry and wet grinding can affect the crystal structures of the material. A typical study of grinding was carried out by Zhu et al. [4] using spodumene. The results suggest that more exposed (110) and (100) planes of spodumene were found on wet ground, while more exposed (010) planes of spodumene were found on dry ground. Adding grinding aids to the slurry can change the rheological property of the slurry. Grinding aids reduce the viscosity of the slurry by adjusting the rheology and surface electrical properties of the particles, promoting dispersion between particles and thus making it difficult for particles to agglomerate on the grinding media or liner. For example, the impact of grinding aids and process parameters on a dry stirred mill was investigated by Prziwara et al. [5], who found that the powder flow behavior affects the capture process and stress between the approaching grinding media at the active grinding zone. If the powder flow is high, then particles are easily pushed out of the active grinding zone, resulting in less particles being captured between the approaching grinding media. Fan et al. [6] investigated the effect of sodium silicate on muscovite grinding and concluded that SiO(OH)3 increases the repulsion force between muscovite particles, resulting in better fluidity for the slurry. Furthermore, the material of the grinding media affects the surface property of the grinding product and the chemical property of the slurry. Zhang et al. [7] found that the grinding product produced from ceramic balls has a more even and smoother surface than that produced from cast iron balls.
The slurry’s properties has a significant influence on the grinding performance, including the solid concentration, viscosity, and chemical composition. The properties of slurry in a grinding chamber have three different effects on the grinding efficiency. The buoyancy and resistance of slurry in a grinding chamber affect the collision frequency and friction strength between the grinding media. When the solid concentration is too low, the slurry possesses high flowability. The particles are easily pushed out of the active grinding zone between the approaching grinding media. This not only accelerates wear on the grinding media but also reduces the mill’s efficiency. As the solid concentration is increased, a coating layer can form on the surface of the grinding media, and thus particles are easily captured between the approaching grinding media, thus increasing the grinding efficiency. A further increase in the solid concentration increases the viscosity of the slurry while decreasing the impact of the grinding ball, and it reduces wear on the steel balls, thus decreasing the grinding efficiency. The viscosity of the slurry is increased proportionally with its concentration, with a sharp increase in viscosity occurring when the concentration exceeds 75% [8].
In this work, the purpose of this study was to investigate the effect of the solid concentration of stirred mills on the product size distribution of the grinding product. The particle size distribution of the feed was divided into three size intervals: the coarse size, desired size, and overgrinding size. The revolution behavior of each size interval was simulated with the population balance model. The studies mentioned above never systematically discussed the three-size grinding kinetics model used to describe the grinding process. Based on the attainable region method, how to obtain the maximum fraction of the desired size in the grinding product with different solid concentrations was studied.

2. Theoretical Backgrounds

2.1. Population Balance Model

Several previous works [9,10,11] already aimed to quantify the evolution behavior of the particle size distribution during the grinding process. They predicted and simulated the particle size distribution with a time-continuous and size-discrete matrix model. The population balance model is mathematically expressed in the following form:
d m i t d t = j = 1 i > 1 i 1 b i j S j t m i t S i t m i t
where mi(t) is the mass fraction of size interval i at time t (as a percentage); Si(t) is the breakage rate function of size interval i (expressed as time−1); and bij is the breakage distribution function. When the size interval i = 1, the expression of the differential equation (Equation (1)) is as follows:
d m 1 t d t = S 1 t m 1 t
Here, S1(t) is a constant value with the increase in the grinding time when the grinding process follows the first-order model which is usually used for batch grinding experiments in the laboratory, especially for simulating the grinding process of single component materials. Integration of Equation (2) yields
m 1 t = m 1 0 exp S 1 t
In fact, the grinding of heterogeneous materials or mixed materials is quite common in laboratories and various industrial fields. Danha et al. [12] developed a hypothesis that ore is composed of two different hardness components, termed the ‘soft’ and ‘hard’ components. Based on this assumption, a two-component first-order model was established to predict the breakage behavior of ore. The dynamic expression of the interval number of i = 1 is as follows:
m 1 t = m 1 0 φ exp S 1 , A t + 1 φ exp S 1 , B t
where φ is the mass fraction of the soft component ‘A’ in the material, 1 − φ is the mass fraction of the hard component ‘B’ in the material, and S1,A and S1,B are the breakage rates of the soft component ‘A’ and the hard component ‘B’, respectively.
In addition, by analyzing a large number of experimental phenomena, it can be found that the breakage rate deviates from the first-order model. Tangsathitkulchai [13] as well as Bilgili and Scarlett [14] believed that this was mainly due to the temporally evolving material property and multi-particle interaction. They introduced the acceleration–deceleration parameter ai into Equation (3) with the following expression:
m 1 t = m 1 0 exp S 1 , i n i ( 1 + a 1 t ) t
where S1,ini is the breakage rate of the coarse size in the initial grinding process. In this equation, ai < 0 indicates a grinding process with a deceleration effect; ai = 0 indicates that the grinding process follows the first-order model; and ai > 0 indicates that the grinding process has an acceleration effect.
In case I, the breakage rate of the size interval i = 2 also follows the first-order model, while the integration of Equation (1) yields
m 2 t = m 2 0 exp ( S 2 t ) + b 21 S 1 m 1 0 S 2 S 1 exp ( S 1 t ) exp ( S 2 t )
In case II, the breakage rate of the size interval i = 2 also follows the two-component first-order model, while the integration of Equation (1) yields
m 2 t = φ m 2 0 exp ( S 2 , A t ) + b 21 , A S 1 , A m 1 0 S 2 , A S 1 , A exp ( S 1 , A t ) exp ( S 2 , A t ) + 1 φ m 2 0 exp ( S 2 , B t ) + b 21 , B S 1 , B m 1 0 S 2 , B S 1 , B exp ( S 1 , B t ) exp ( S 2 , B t )
In case III, the breakage rate of the size interval i = 2 deviates from the first-order model, while integration of Equation (1) yields
m 2 t = m 2 0 exp S 2 , i n i 1 + a 2 t t + b 21 S 1 , i n i 1 + a 1 t t m 1 0 S 2 , i n i 1 + a 2 t t S 1 , i n i 1 + a 1 t t exp ( S 1 , i n i 1 + a 1 t t ) exp ( S 2 , i n i 1 + a 2 t t )
Based on the mass balance, the equation for the size interval i = 3 is obtained as follows:
m 3 t = 100 m 1 t m 2 t

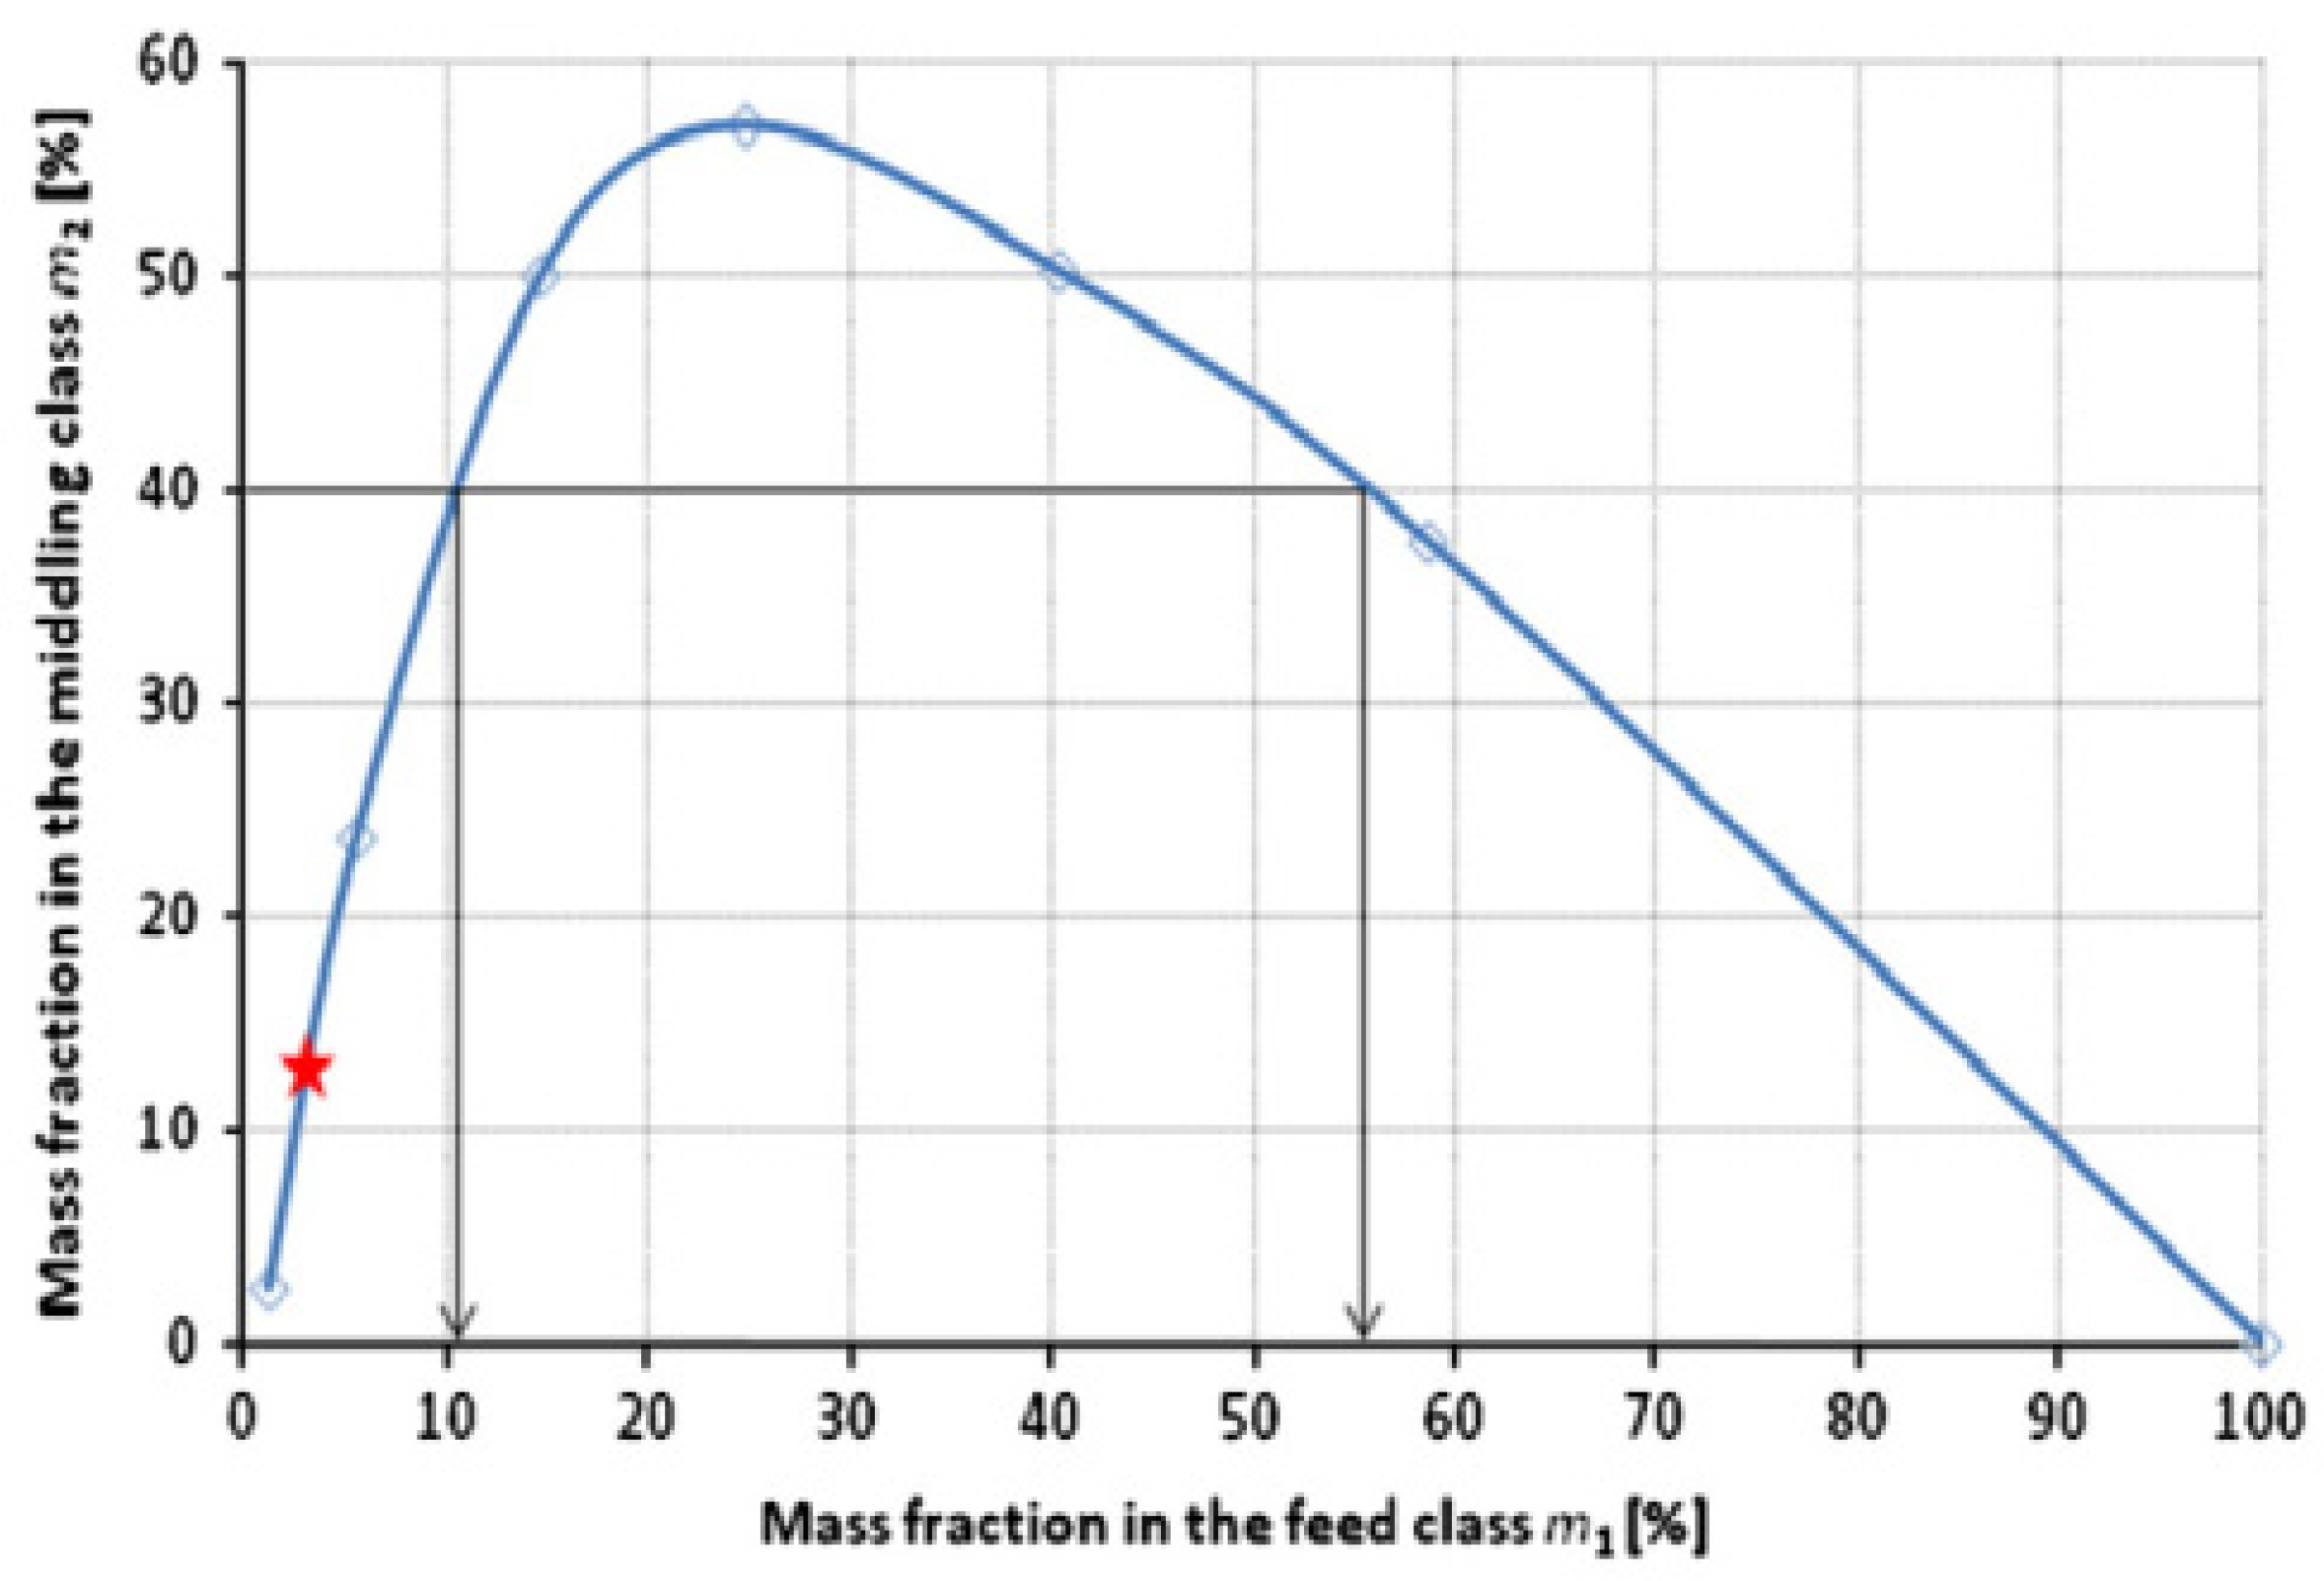
2.2. The Attainable Region Method

The attainable region method was introduced by Khumalo et al. [15] to optimize operating conditions. By constructing an attainable region, it can be more convenient to determine the test conditions for obtaining the maximum desired size. As shown in Figure 1, it can be found that as the fraction of the coarse size decreases, the fraction of the desired size first increases and then decreases. There is a point where the fraction of the desired size reaches its maximum value. When the fraction of the desired size is 40%, the corresponding fractions of the coarse size are 10% and 55%, respectively. However, a greater fraction for the overgrinding size is produced when the fraction of the coarse size is 10%.

2.3. The Fractal Theory and Rosin–Rammler–Benne Model

Particles exhibit self-similarity during the crushing and grinding process [17,18,19]. A fractal theory was introduced to describe the evolution behavior of the particle size distribution. The given equation for fractal features is expressed as follows:
F d = d d M 3 D
where F(d) is the fraction of the particle with a size smaller than the diameter d, dM is the diameter of the largest particle in the feed, and D is the fragmentation fractal dimension.
A number of mathematical equations, such as the Gates–Gaudin–Schumman, Gaudin–Melody, and Rosin–Rammler–Benne models, are usually used to describe the particle size distribution. Several previous works have already proved that the Rosin–Rammler–Benne model has better performance in fitting the particle size distribution of ground products [20,21]. The Rosin–Rammler–Benne model can be described as follows:
R d = 100 100 d d e k
Here, R(d) (as a percentage) is the cumulative undersize distribution, while de is the characteristic particle, corresponding to 63.21%. The characteristic particle de and the distribution index k were obtained through experimental data fitting. According to the results of a previous study [22,23], a higher distribution index k suggests higher uniformity and a narrower particle size distribution.

3. Materials and Experimental Methods

3.1. Materials

Quartz was used as the feed for the mill, which was obtained from Lingshou County, Hebei Province, China. The density of the quartz was about 2.65 g/cm3. A large bulk of quartz (size > 0.50 mm) was crushed down to -0.50 mm using a roll crusher. The crushed material and the uncrushed material were evenly mixed together as the feed for the mill. The particle size distribution of the feed, as shown in Figure 2, was measured with a Mastersizer-2000 (Malvern Instruments Ltd., Worcestershire, UK). In this study, the material was divided into three size intervals: the coarse size (+45 μm), desired size (-45 + 10 μm), and overgrinding size (-10 μm). The distribution of the coarse size, the desired size, and the overgrinding size in the feed was 59.72%, 26.53%, and 13.75%, respectively.

3.2. Batch Wet Grinding Tests

A laboratory stirred mill was used as grinding equipment. The type of stirrer was a rod-pin stirrer, and the cylinder diameter of the stirred mill was 100 mm. The stirrer’s tip speed was 3 m/s, and 2.76 kg ceramic balls with a diameter of 6 mm were used as the grinding media. A total mass of 512 g of quartz was used as the feed for each grinding test, resulting in a 0.70 powder filling rate for the bed porosity of the grinding media. The six prepared solid concentrations (40%, 45%, 50%, 55%, 60%, and 65%) were each ground. The definition of a solid concentration is the ratio of the mass fraction of the material to the total mass of the slurry. For each grinding experiment, the grinding was interrupted at different time intervals. At each time interval, the pulp and grinding media were cleaned out from the grinding chamber. Then, the part of slurry which adhered to the surface of the grinding media was washed down with water. The slurry was filtered, dried (<90 °C), and divided to prepare the sample required for the Mastersizer-2000.

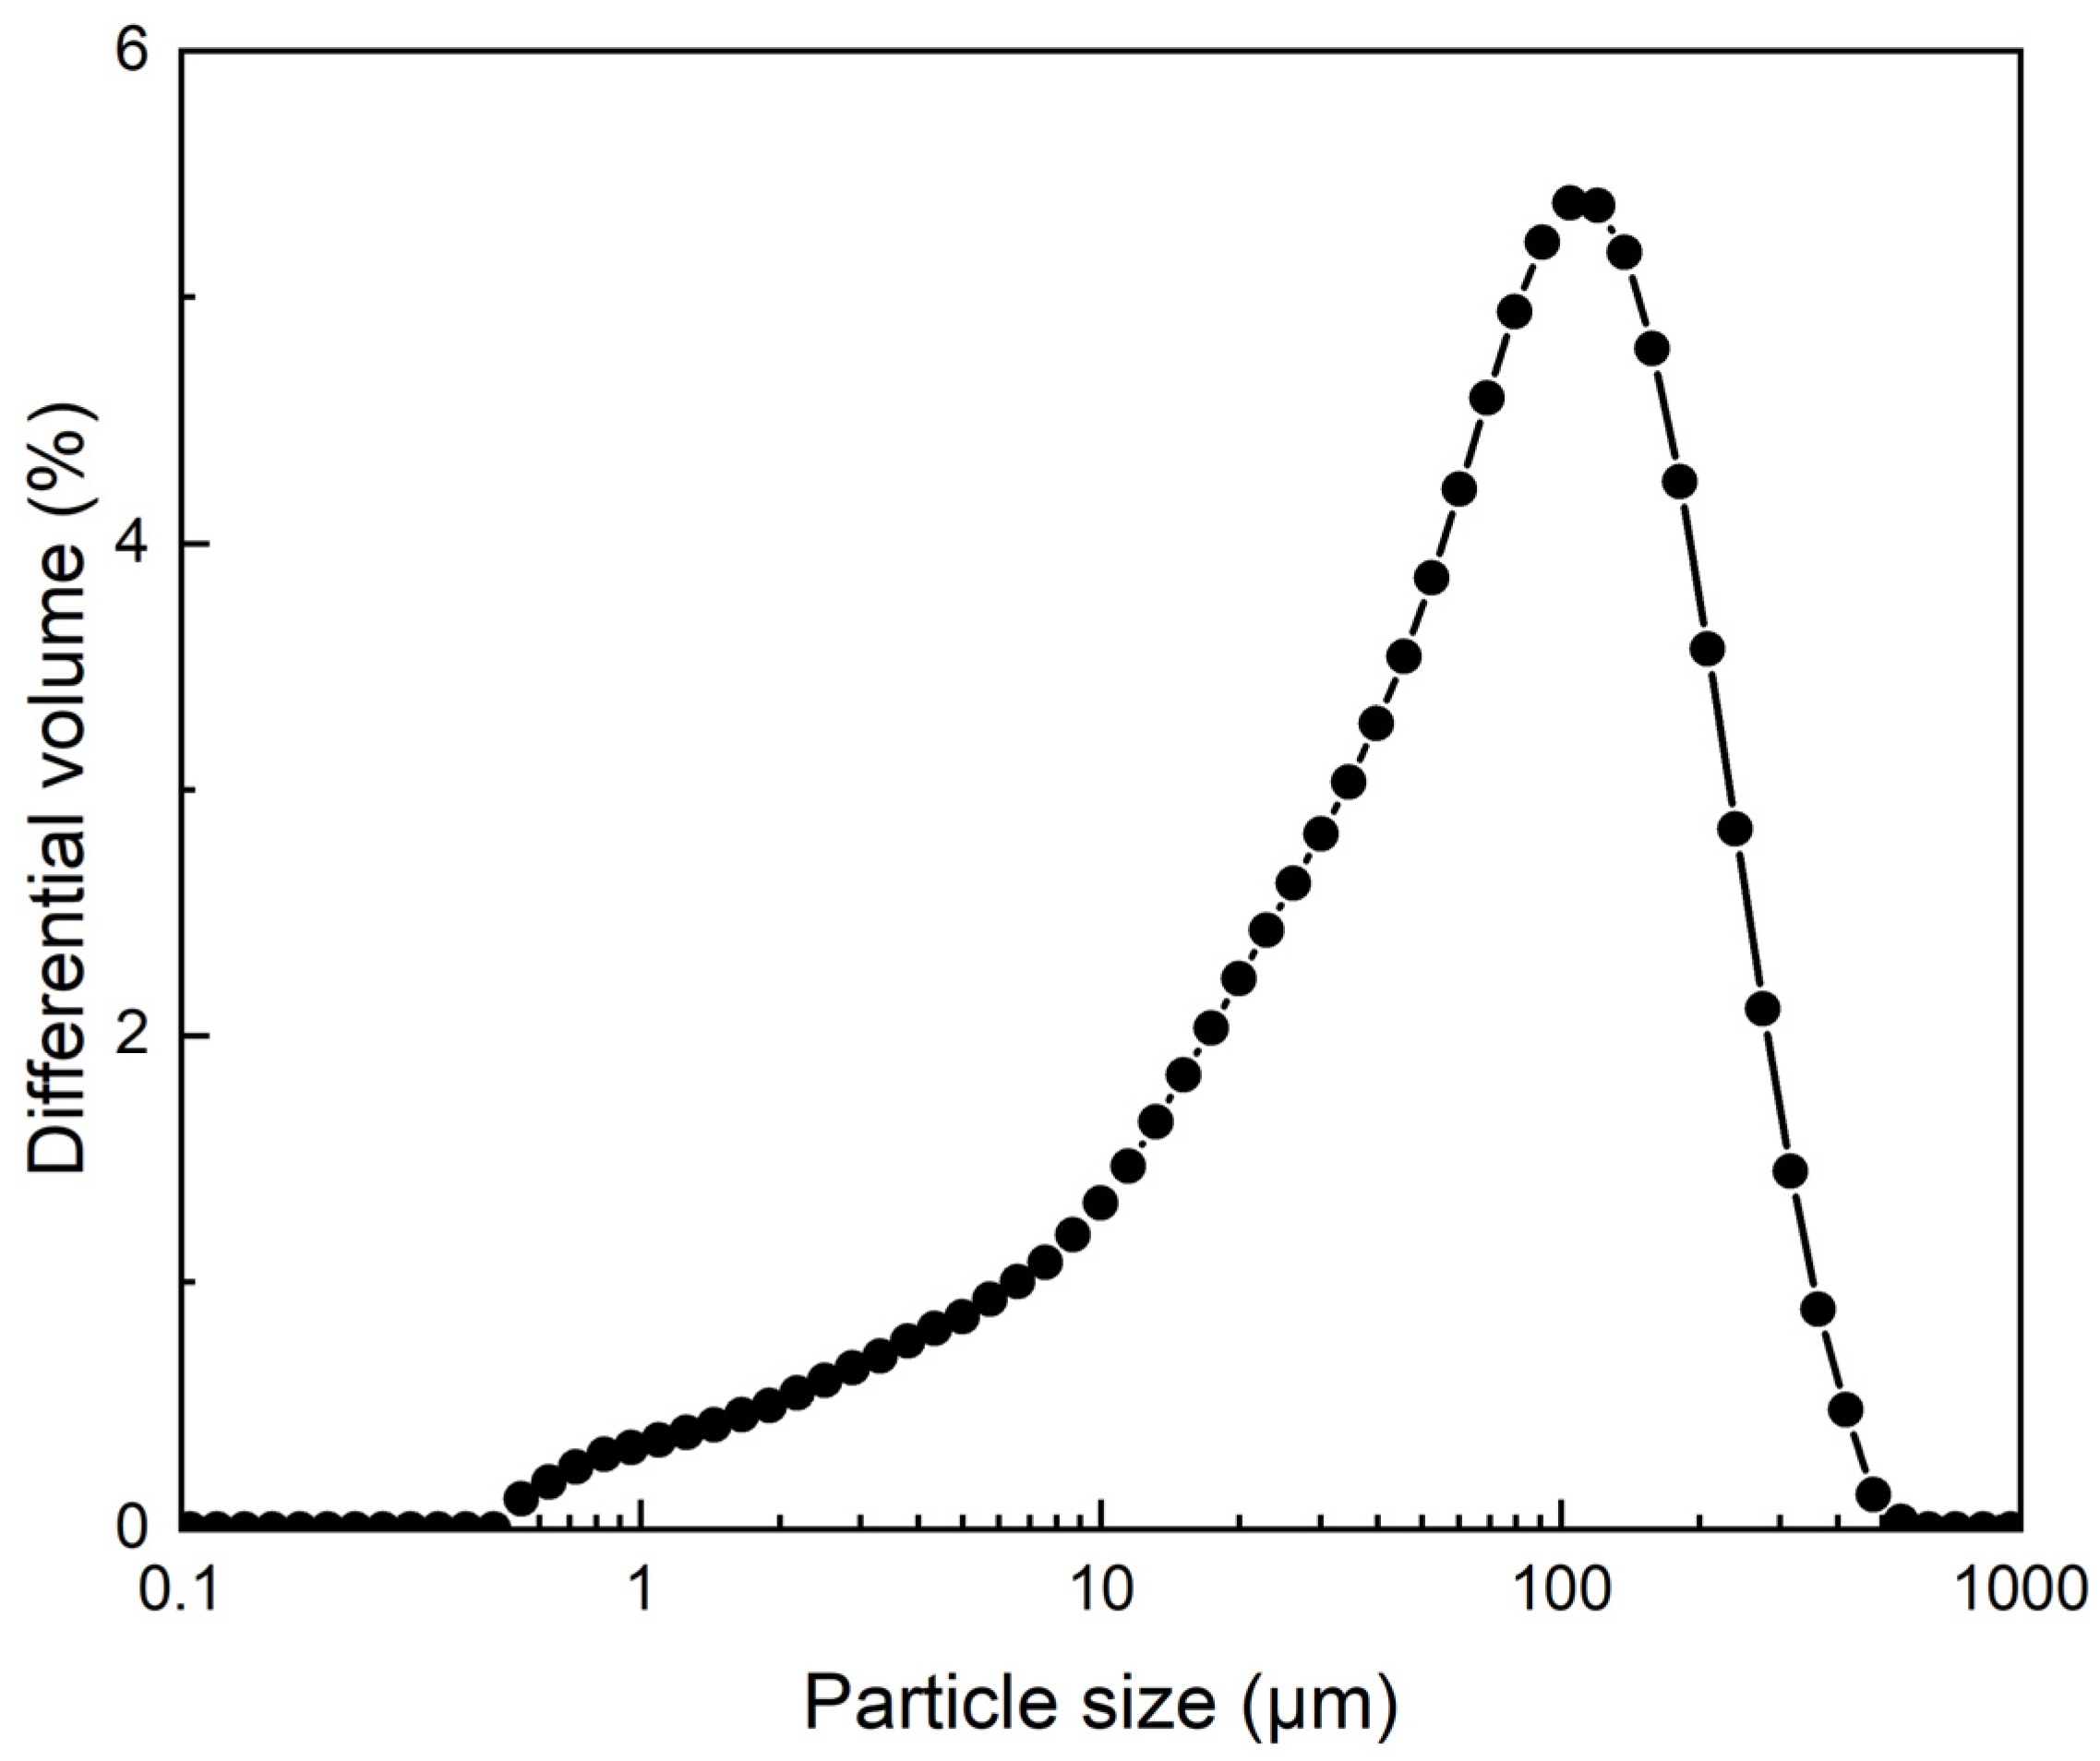
4. Particle Size Distribution Features

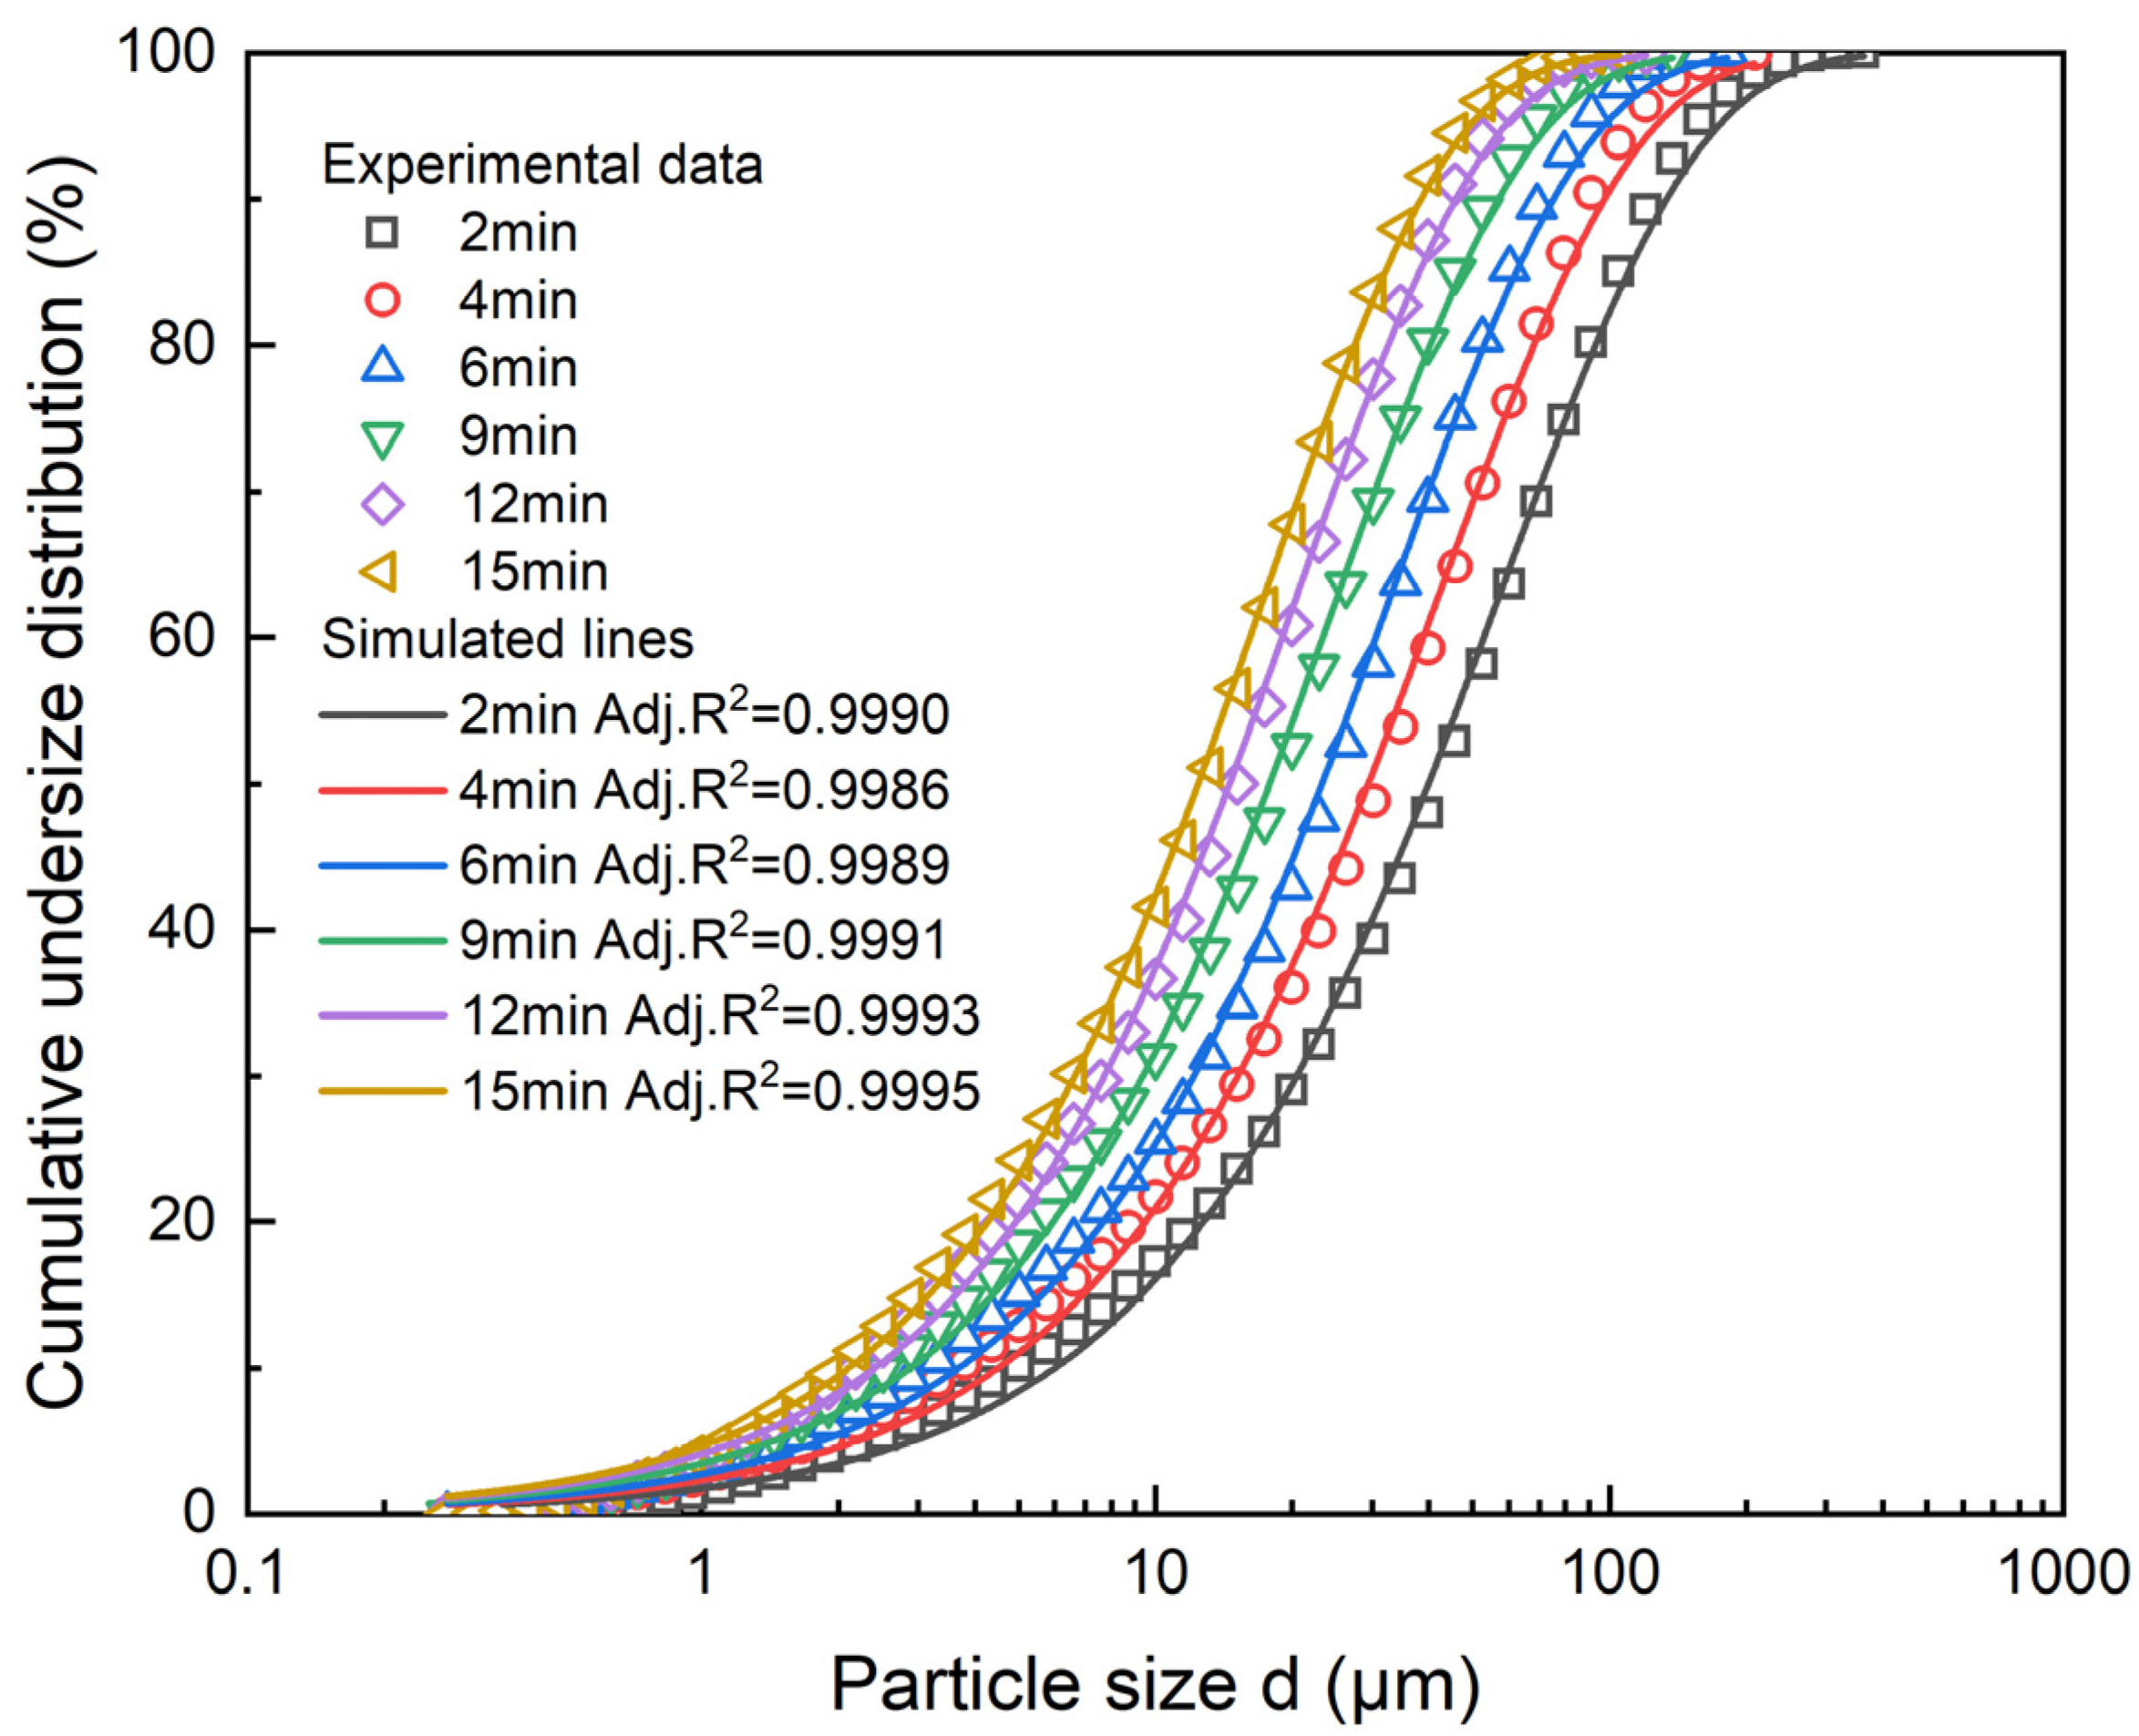
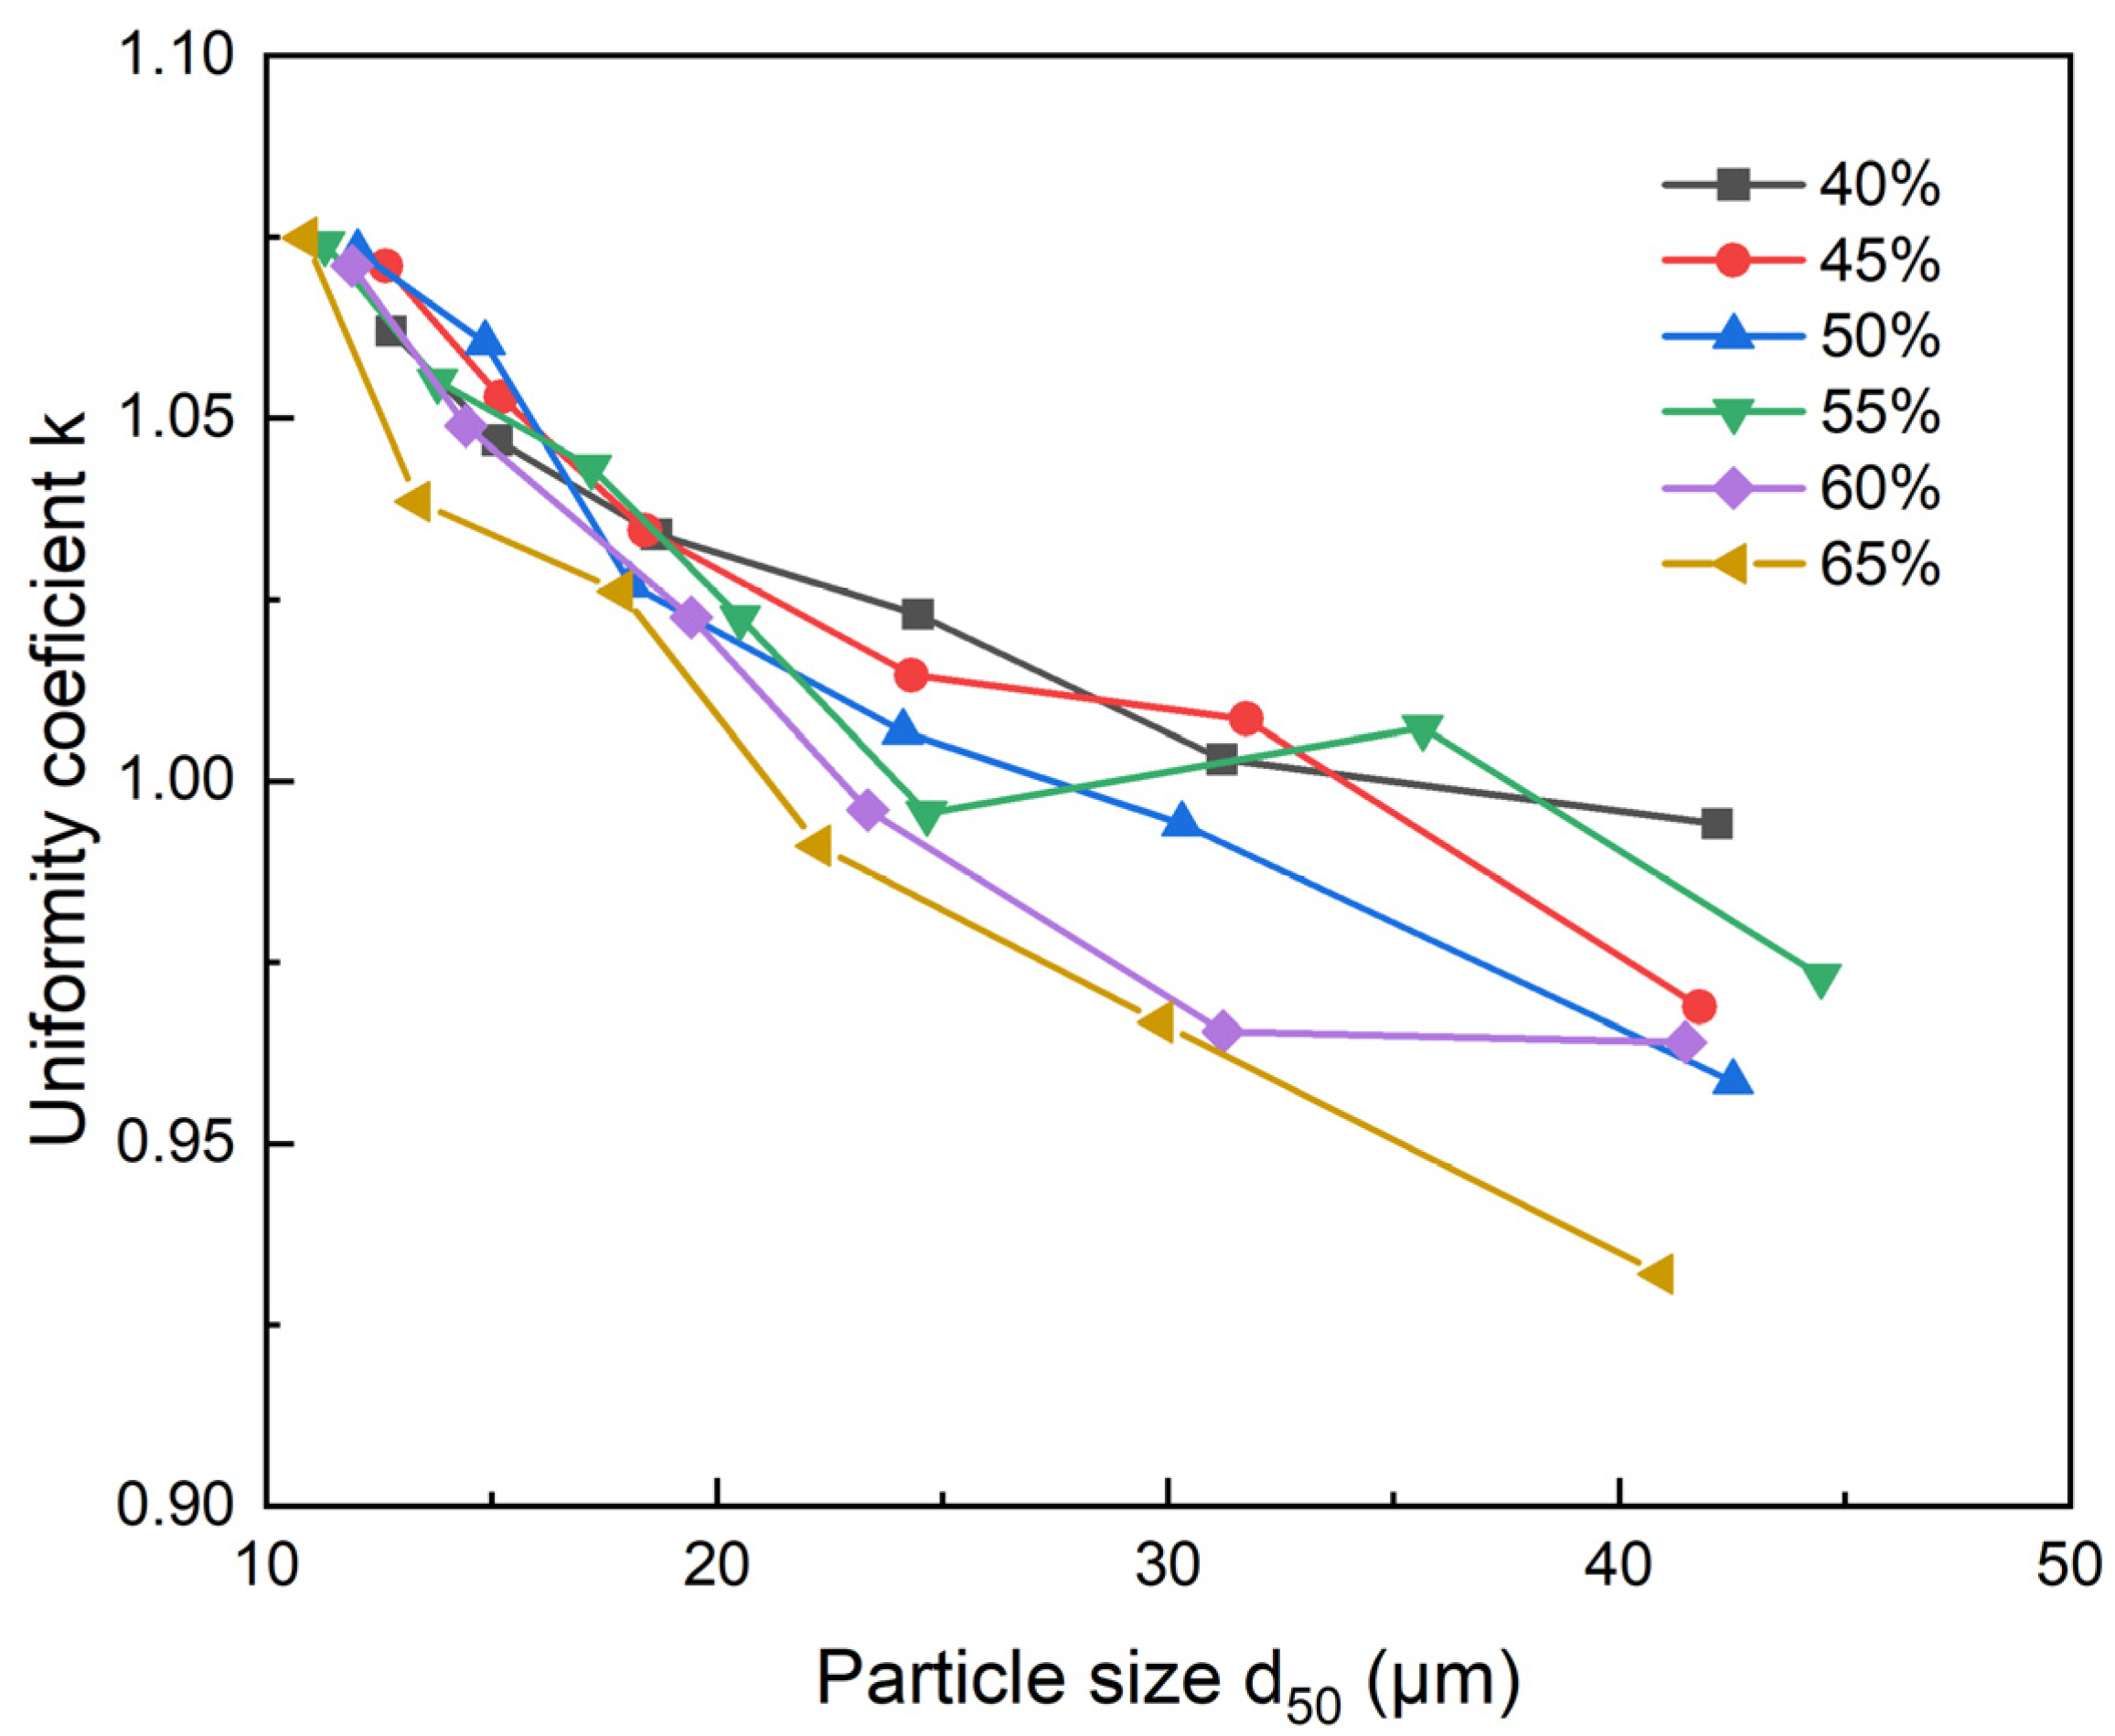
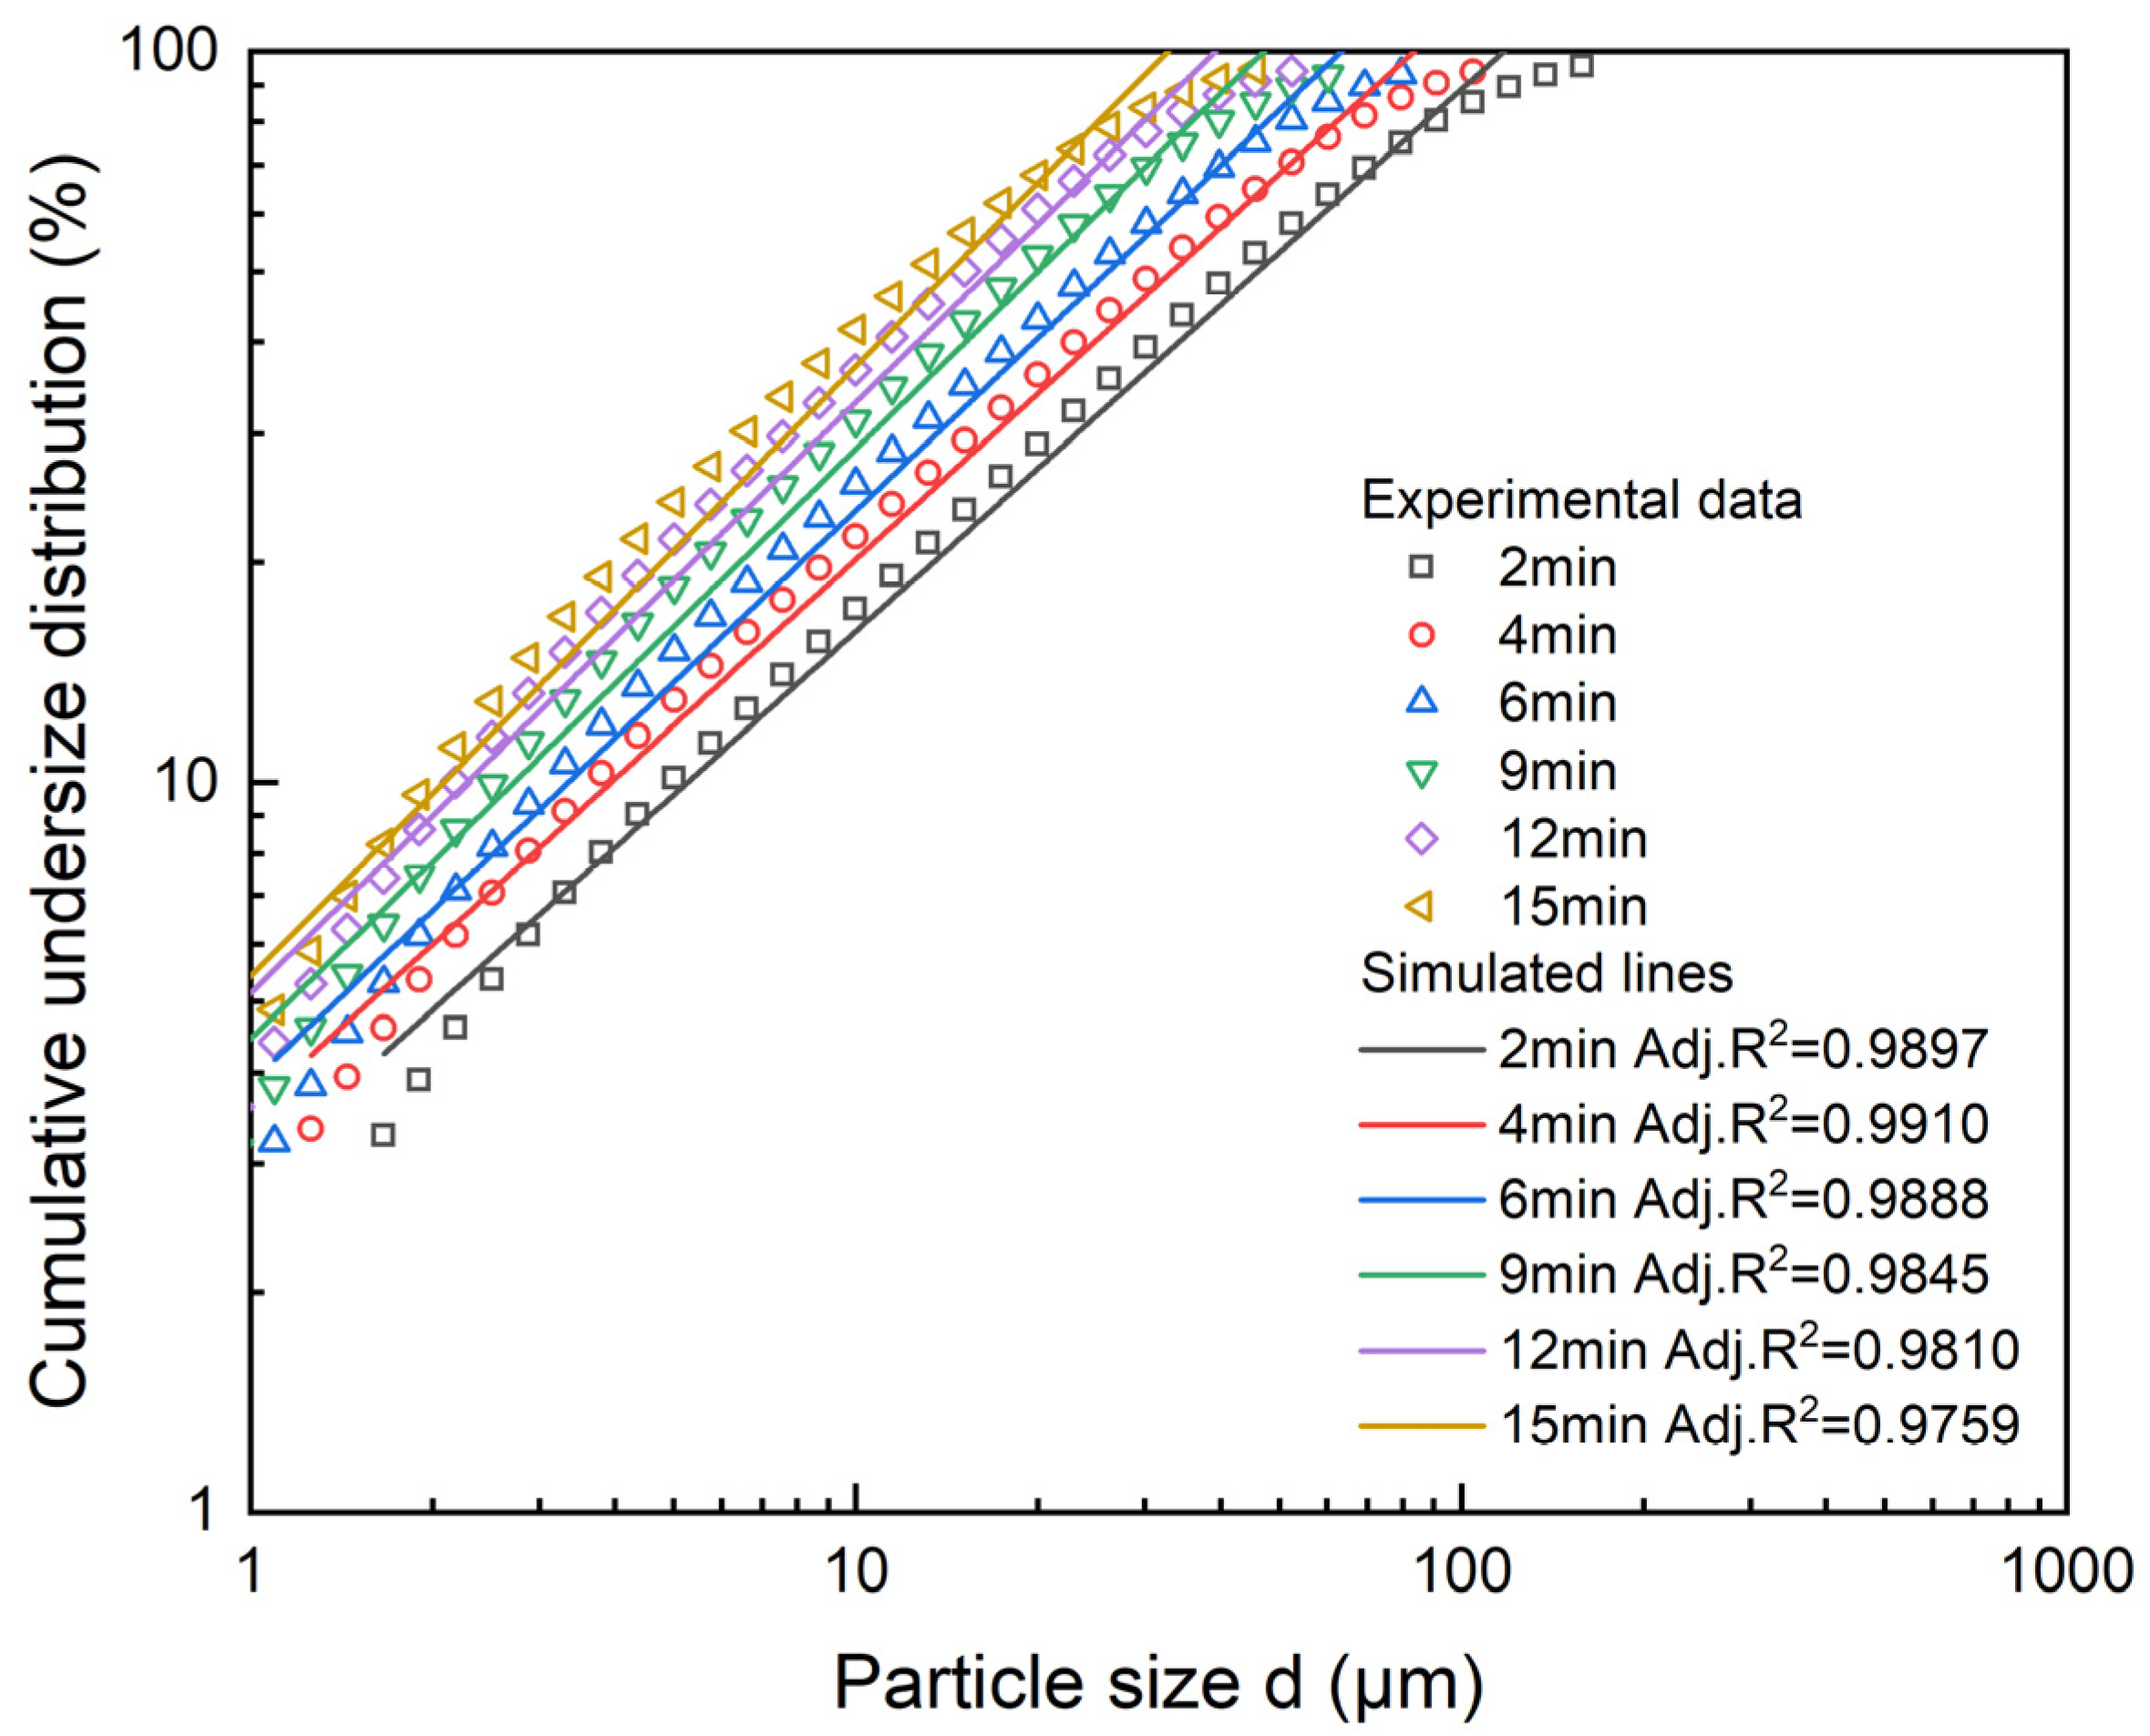
4.1. Rosin–Rammler–Benne Model

The particle size distribution of the grinding product with different solid concentrations was fitted with the Rosin–Rammler–Benne model. Figure 3 presents the evolution of the cumulative undersize distribution for different grinding times with a solid concentration of 40%. As shown in Figure 3, the Rosin–Rammler–Benne model described the particle size distribution of the ground products quite well. Figure 4 presents good agreement between the measured and calculated characteristic particle de for different solid concentrations. Similar results could be found for solid concentrations of 45%, 50%, 55%, 60%, and 65%. The Rosin–Rammler–Benne model was found to be suitable for fitting the particle size distribution in this study.
Figure 5 shows that the parameter k was inversely proportional to the particle size d50. For a given solid concentration, the parameter k decreased with an increase in the particle size d50, which indicates that the width of the particle size distribution became narrower with an increase in the grinding time. For a given particle size d50, the parameter k decreased with an increase in the solid concentration. This indicates that the particle size distribution of the grinding product became more heterogeneous and wider with an increase in the solid concentration.

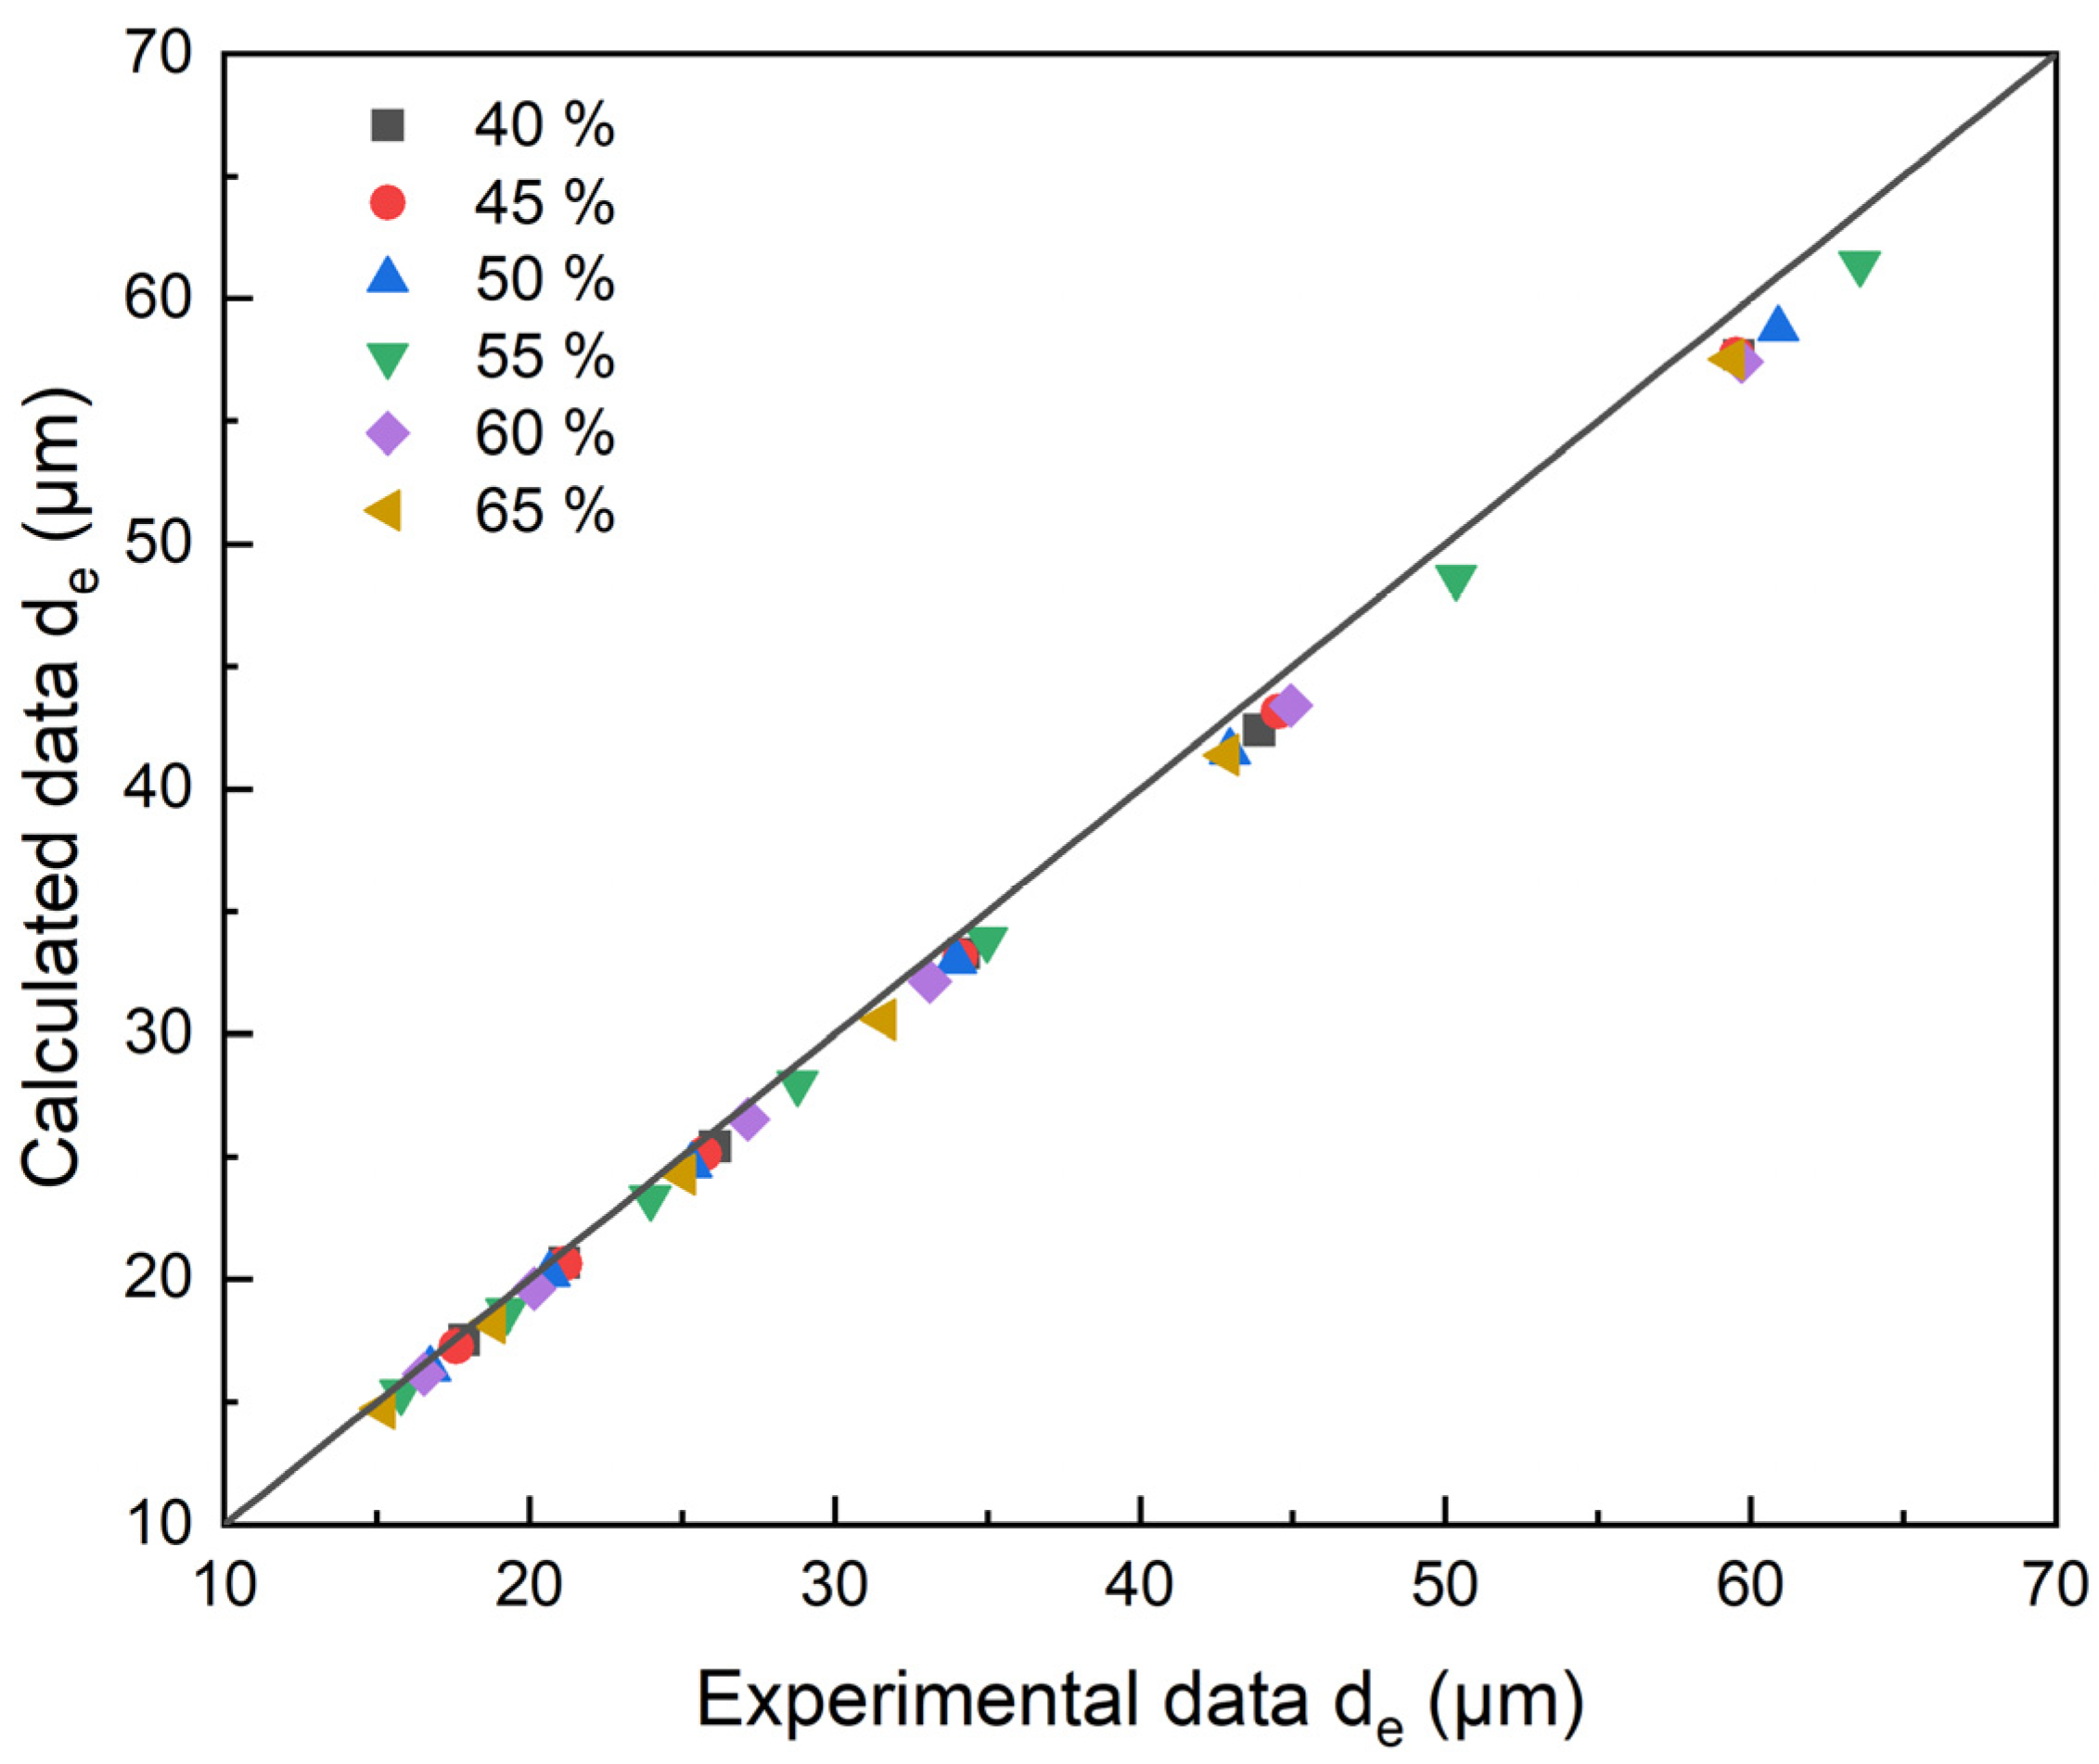
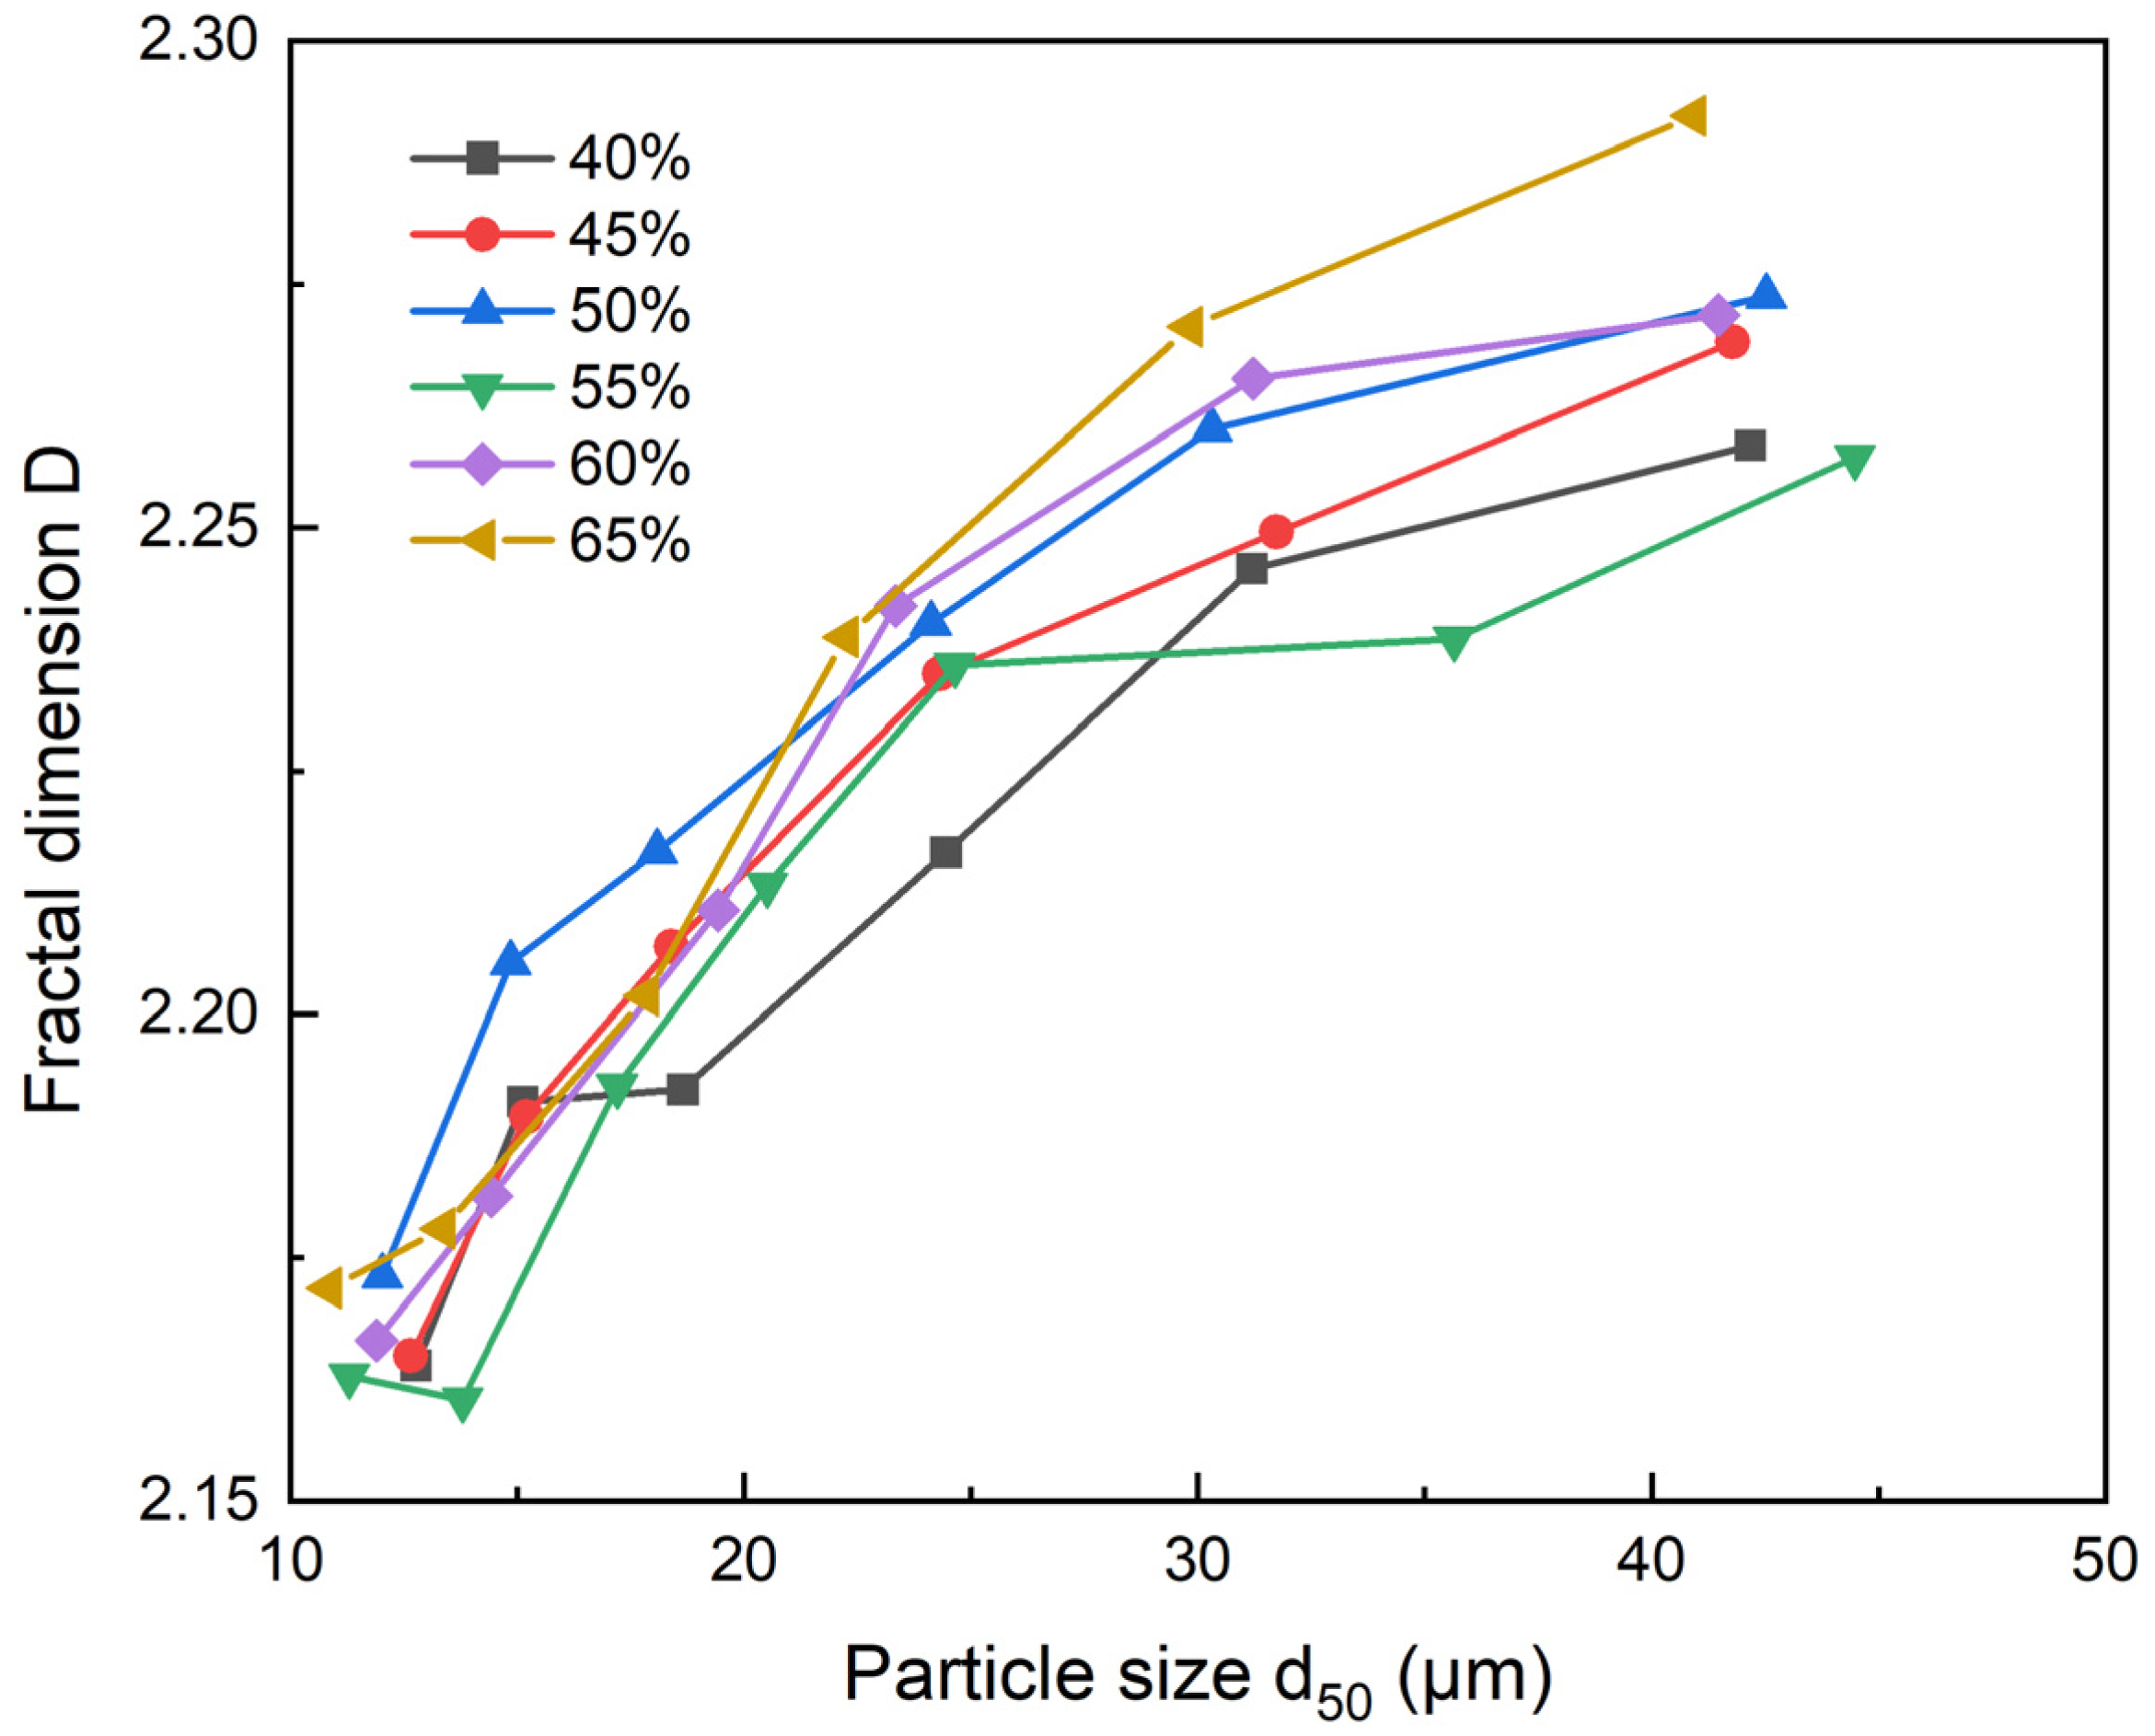
4.2. The Fractal Characteristic of Particle Size Distribution

According to Equation (10), Figure 6 shows that for a solid concentration of 40%, lg(F) presented an excellent linear relationship with lg(d) for the F(d) range of 3–95% when the coefficient Adj.R2 was higher than 0.97. This result indicates that the evolution of the particle size distribution followed the fractal theory during the fine grinding process. The slope of the regression lines is 3 − D.
The effect of the solid concentration on the fractal dimension is presented as a function of the grinding time in Figure 7. It is evident that the fractal dimension D was proportional to the particle size d50. For a given solid concentration, the fractal dimension decreased with an increase in the particle size d50. For the given particle size d50, the higher the solid concentration, the higher the fractal dimension. It can be found that the fractal dimension D displayed an opposite trend with the distribution index k. Therefore, the role of the fractal dimension D in the function can be defined, which indicates that a smaller fractal dimension D suggests higher uniformity and a narrower particle size distribution.

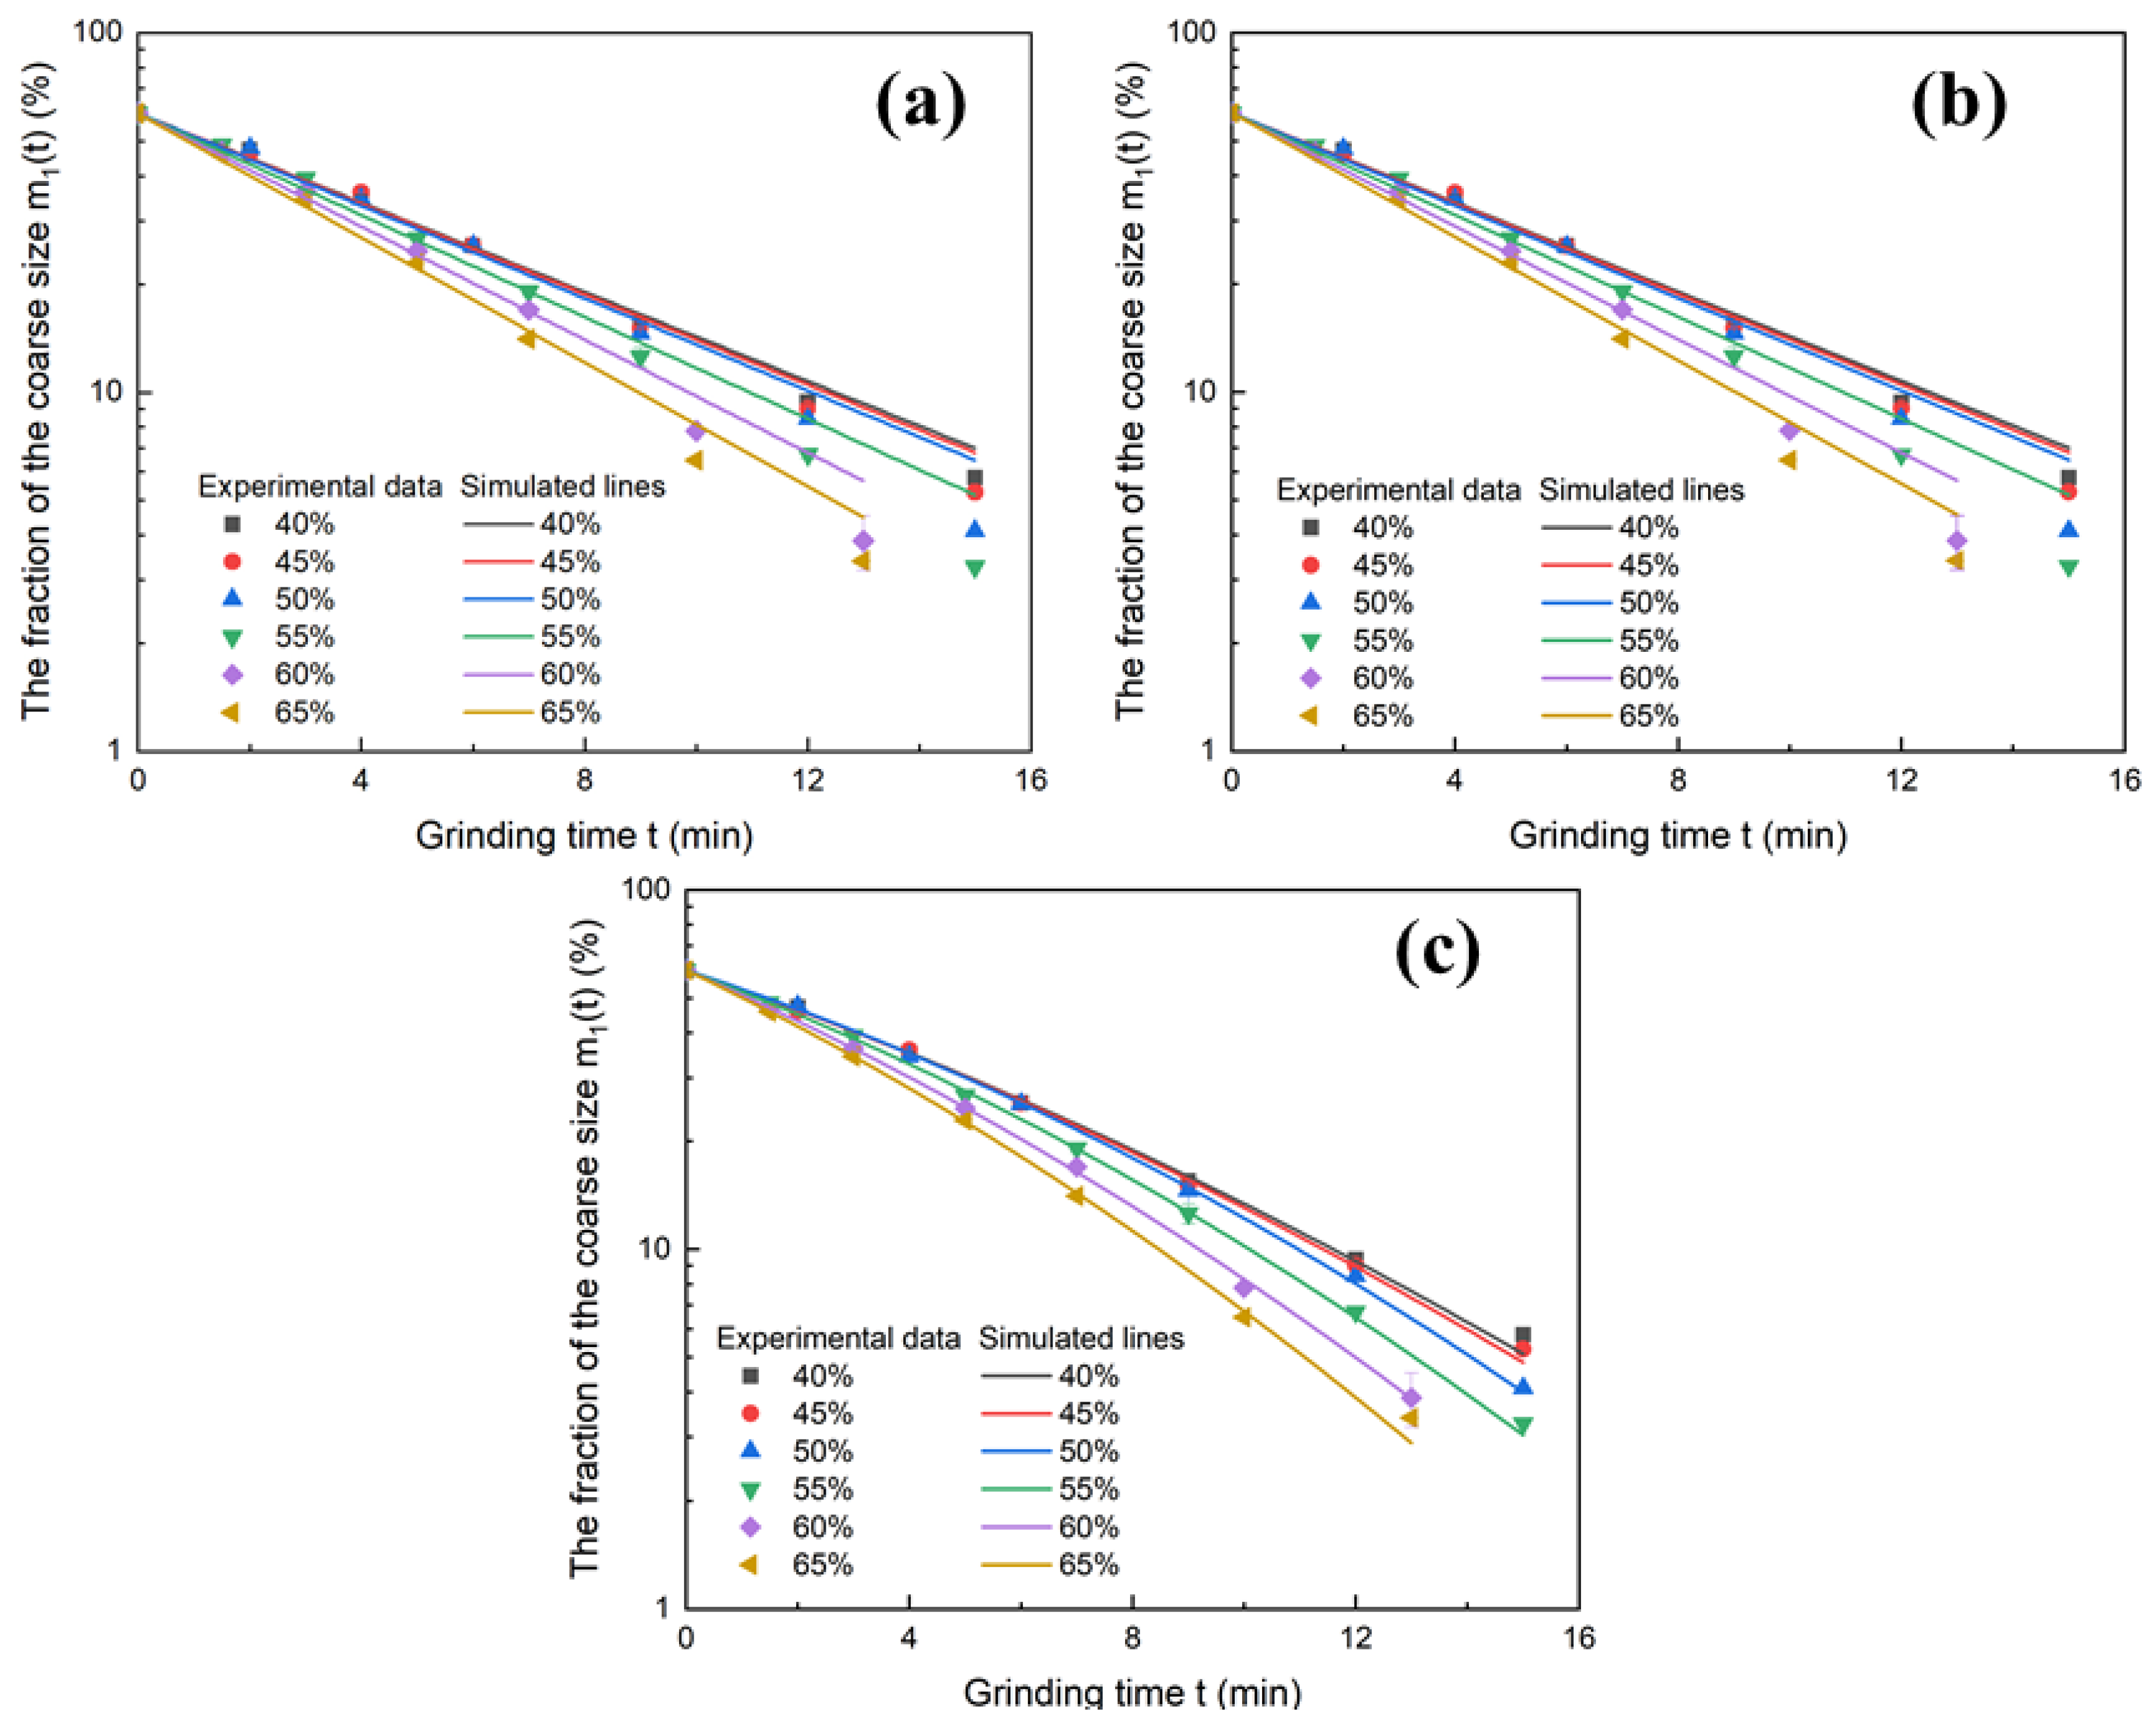
4.3. Kinetic Behavior of Each Size Interval

Figure 8 presents the fraction of the coarse size as a function of the grinding time under different solid concentrations. For a given grinding time, as the solid concentration increased, the fraction of the coarse size decreased. The curves of solid concentrations of 40%, 45%, and 50%, presented as a function of the grinding time, almost overlapped. The downward trend of a relatively high solid concentration is more obvious than that of a relatively low solid concentration with an increase in the grinding time, indicating that a relatively high solid concentration has a higher grinding efficiency.
The first-order model, the two-component first-order model, the and non-first-order model were used to describe the coarse size in the grinding process. As shown in Figure 8a, excellent fitting curves along with relatively high adjusted R-squared (Adj. R2 > 0.99) values were obtained from fitting the experimental data with Equation (3). This result indicates that the coarse size breakage behavior followed the first-order model. However, it can also be found that the grinding time increased, and the point of the experimental data marker deviated from the fitting line and became located below the fitted line. According to several previous studies [10,24,25], when the fraction of the coarse size broken is lower than 65%, it is considered that no or minimal secondary breakage of the coarse size occurs during the grinding process. It is evident that the fraction of the coarse size broken was already higher than 65% in this experiment. Furthermore, the two-component first-order model and the non-first-order model were used to describe the coarse size in the grinding process, as shown in Figure 8b,c. It can be found that the two-component first-order model and the first-order model had similar fitting performances, while the non-first-order model had better fitting performance than the above two models, which coincides with the results of previous studies [11,26].
Figure 9 presents the fitting effect evaluation parameter Adj. R2, the root mean square error (RMSE), and the sum of squares due to error (SSE) obtained by the first-order model, the two-component first-order model, and the non-first-order model under different solid concentrations. Based on the evaluation indexes of the Adj. R2 and RMSE, the non-first-order model performed the best, followed by the first-order model. However, based on the evaluation index of the SSE, the non-first-order model also performed the best, followed by the two-component first-order model. In addition, the non-first-order model had the smallest error fluctuation for the above three evaluation parameters.
Table 1 presents the values of the breakage rate and other parameters for various solid concentrations. It is evident that regardless of which dynamic model was used, the breakage rate S1 increased with an increase in the solid concentration, although when the first-order model was used, the fitting result shows that the breakage rate values of the two components were almost equal. In this study, since high-purity quartz was used as the material to grind, the deviation from the first-order model was not caused by the property of the material. In addition, the acceleration parameter a1 was positive, which indicates that the breakage rate of the coarse size became faster with an increase in the grinding time. With an increase in the solid concentration, the acceleration parameter a1 first increased and then decreased.
Based on the above result, it can be concluded that both the first-order model and the non-first-order model had better fitting performances. Therefore, the first-order-model and the non-first-order model were used to fit the remaining fraction of the desired size after a certain grinding time, as shown in Figure 9. The obtained breakage parameter for both models is listed in Table 2.
As shown in Figure 10, a fairly good fitting curve and a relatively high value for Adj-R2 for the fitted data could be obtained by both models. Both the first-order model and the non-first-order model could describe the breakage behavior of the desired size well. However, the correlation coefficient for the fitted data in the non-first-order model was slightly higher than that of the first-order model. For a given solid concentration, the fraction of the desired size first increased and then decreased with an increase in the grinding time. In addition, the grinding time at the peak point decreased with an increase in the solid concentration. Furthermore, the breakage rates S2 and S2,ini increased with an increase in the solid concentration. This demonstrates that increasing the solid concentration is beneficial for improving the breakage rate of a desired size. As the solid concentration increased, particles easily adhered to the surface of the grinding media, which led to an increase in the fraction of particles being effectively captured and broken. However, when the solid concentration exceeded a certain level, a decrease in the flowability of the slurry could be found, and the number of captured particles became too high for them to be broken by the grinding media. Thus, the grinding process became inefficient. The acceleration a2 was positive, which indicates that the breakage rate of the desired size increased with an increase in the grinding time. However, the acceleration a2 deceased with an increase in the solid concentration, which indicates that the breakage behavior of the desired size deviated from the first-order model and became weaker as the solid concentration increased. Moreover, the average values of the breakage distribution function simulated by the two models were roughly 0.7500 and 0.7312, indicating that the breakage distribution function was independent of the type of fitting model. In addition, the breakage distribution function b21 for both the first-order model and the non-first-order model did not change significantly with an increase in the solid concentration. This result indicates that the effect of the solid concentration on the fraction of the coarse size broken into the desired size was not significant.
Based on Equation (9), Figure 11 presents a plot of the experimental data for the overgrinding size fitted with least squares regression lines. It can also be found that the simulated results, as a function of the grinding time obtained from the non-first-order model, were more precise. Based on the non-first-order model, Table 3 presents the fraction of each size interval at the peak points for different solid concentrations. It can be found that the fraction of the desired size decreased with an increase in the solid concentration. The opposite effect could be found for the overgrinding size, whose fraction increased with an increase in the solid concentration. This result indicates that an increase in the solid concentration was not conducive to breaking the coarse size down to the desired size. There was little difference in the fractions of the coarse size obtained under different solid concentrations.

4.4. Analyses with Attainable Region Method

Based on the non-first-order model, the experimental data were highly consistent with the calculated data. The obtained parameter was used to predict the fraction of each size interval for different solid concentrations. The two plots in Figure 12 were built from a candidate attainable region plot from the calculated data, with all solid concentrations being presented in the same way. In addition, the curve of the desired size and the overgrinding size, which are presented as a function of the coarse size, almost overlapped. It can be concluded that the solid concentration had insignificant effects on the conversion of the coarse size to both the desired size and the overgrinding size.
Figure 12a shows that with the decrease in the fraction of the coarse size, the fraction of the desired size increased first before decreasing. There was a point where the fraction of the desired size was the highest, which corresponded to the peak point in Figure 10. In addition, with a decrease in the fraction of the coarse size, the boundary of the attainable region further deviated from the straight 45° line. Figure 12b shows that with a decrease in the fraction of the coarse size, the volume fraction of the overgrinding size kept increasing. It is evident that all six profiles increased slowly in the beginning of the grinding process, while the fraction of the overgrinding size then increased significantly. This indicates that the residence time of the materials in the mill should be as short as possible to improve the rate of converting the coarse size to the desired size in mineral processing.

4.5. Differences in the Change Rates

In Section 3.2, by setting the derivatives of Equations (5), (8) and (9) over the grinding time, it could be found that the change rate of the fraction of the coarse size was negative, the change rate of the fraction of the desired size was first positive and then became negative, and the change rate of the fraction of the overgrinding size was positive. Furthermore, the difference in the change rate between the desired size and the overgrinding size can be expressed as follows [22].
v 2 v 3 = d m 2 t d t d m 3 t d t
Figure 13 presents the difference in the change rates between the desired size and the overgrinding size as a function of the grinding time for different solid concentrations. It can be found that the higher the solid concentration, the higher the difference in the change rate between the desired size and the overgrinding size in the initial grinding process. With a further increase in the grinding time, the difference in the change rate between the desired size and the overgrinding size for a relatively high solid concentration was significantly reduced. The curve intersects with the y = 0 line at a point called the swtich point. According to previous researchers [23], using the grinding time at the switch poin as the the residence time of the materials in the mill can not only improve the time efficiency but also reduce energy consumption in closed-circuit grinding. On the left side of the swtich point, the change rate of the desired size was higher than that of the overgrinding size. In contrast to the phenomena observed on the right side of the swtich point, the grinding time at the swtich piont decreased with an increase in the solid concentration. The results indicate that to obtain the maximum yield of the desired size in grinding products, the grinding time should be shortened, and the solid concentration should be increased.
Table 4 presents the fraction of each size interval at the switch point for different solid concentrations. It can be found that the fraction of the desired size decreased with an increase in the solid concentration. The opposite effect could be found for the coarse size, whose fraction increased with an increase in the solid concentration. The fractions of the overgrinding size obtained under different solid concentrations were almost equal.

5. Conclusions

In this study, the grinding efficiencies of solid concentrations were studied in a lab-scale stirred mill. The results show that the evolution behavior of the particle size distribution presented fractal features during the grinding process. The fractal theory was generally conceived for breakage of the coarse particles, but it is also applicable to the fine grinding process. The particle size distribution of the grinding product, which was calculated using the Rosin–Rammler–Benne model, fit well with the experimental data. The values of the fractal dimension D and the parameter k presented opposite trends with an increase in the particle size d50. The particle size distribution of the grinding product became more heterogeneous and wider with an increase in the solid concentration.
A first-order model, two-component first-order model, and non-first-order model were used to describe the grinding process. The results indicate that the non-first-order model was superior to the other two models. The breakage rate and the breakage distribution function of the population balance model were obtained by fitting the experimental data. The breakage rates S1 (or S1,ini) and S2 (or S1,ini) had a positive relationship with the solid concentration while being independent of the form of the kinetic model. The breakage distribution function b21 was independent of the solid concentration and the form of the kinetic model. This result indicates that an increase in the solid concentration is beneficial for improving the grinding efficiency. However, the effect of the solid concentration on the fraction of the coarse size that has been broken into the desired size was not significant. In addition, the conversion of the coarse size into both the desired size and the overgrinding size was analyzed with the attainable region method. The results indicate that the residence time of the materials in a mill should be as short as possible to improve the rate of converting the coarse size to the desired size in the grinding process. Furthermore, based on the change rate of each size interval, it can be found that the fraction of the desired size decreased with an increase in the solid concentration at the switch point.

Author Contributions

Conceptualization, W.G.; methodology, W.G.; software, K.G.; validation, W.G. and K.G.; investigation, W.G.; resources, W.G.; data curation, W.G. and K.G.; writing—original draft preparation, W.G.; writing—review and editing, W.G. and K.G.; visualization, W.G. and K.G.; supervision, W.G. and K.G.; project administration, W.G. All authors have read and agreed to the published version of the manuscript.

Funding

This research was funded by National Natural Science Foundation of China, grant number “52204293”.

Data Availability Statement

All experimental data in this work are available upon request.

Conflicts of Interest

The authors declare no conflict of interest.

References

  1. Kohmuench, J.N.; Mankosa, M.J.; Thanasekaran, H.; Hobert, A. Improving coarse particle flotation using the HydroFloat™(raising the trunk of the elephant curve). Miner. Eng. 2018, 121, 137–145. [Google Scholar] [CrossRef]
  2. Yu, J.; Jin, S.H.; Raju, K.; Lee, Y.; Lee, H.K. Analysis of individual and interaction effects of processing parameters on wet grinding performance in ball milling of alumina ceramics using statistical methods. Ceram. Int. 2021, 47, 31202–31213. [Google Scholar] [CrossRef]
  3. Bu, X.; Chen, Y.; Ma, G.; Sun, Y.; Ni, C.; Xie, G. Differences in dry and wet grinding with a high solid concentration of coking coal using a laboratory conical ball mill: Breakage rate, morphological characterization, and induction time. Adv. Powder Technol. 2019, 30, 2703–2711. [Google Scholar] [CrossRef]
  4. Zhu, G.; Wang, Y.; Liu, X.; Yu, F.; Lu, D. The cleavage and surface properties of wet and dry ground spodumene and their flotation behavior. Appl. Surf. Sci. 2015, 357, 333–339. [Google Scholar] [CrossRef]
  5. Prziwara, P.; Hamilton, L.D.; Breitung-Faes, S.; Kwade, A. Impact of grinding aids and process parameters on dry stirred media milling. Powder Technol. 2018, 335, 114–123. [Google Scholar] [CrossRef]
  6. Fan, C.; Ren, L.; Zhang, Y.; Bao, S. Grinding effect of sodium silicate on muscovite and its mechanism analysis. Miner. Eng. 2023, 199, 108106. [Google Scholar] [CrossRef]
  7. Zhang, X.; Han, Y.; Gao, P.; Li, Y. Effects of grinding media on grinding products and flotation performance of chalcopyrite. Miner. Eng. 2020, 145, 106070. [Google Scholar] [CrossRef]
  8. Iwasaki, I.; Riemer, S.C.; Orlich, J.N.; Natarajan, K.A. Corrosive and abrasive wear in ore grinding. Wear 1985, 103, 253–267. [Google Scholar] [CrossRef]
  9. Austin, L.G. Introduction to the mathematical description of grinding as a rate process. Powder Technol. 1971, 5, 1–17. [Google Scholar] [CrossRef]
  10. Austin, L.G.; Klimpel, R.R.; Luckie, P.T. Process Engineering of Size Reduction: Ball Milling; Society of Mining Engineers of the AIME: San Ramon, CA, USA, 1984. [Google Scholar]
  11. Wang, X.; Gui, W.; Yang, C.; Wang, Y. Wet grindability of an industrial ore and its breakage parameters estimation using population balances. Int. J. Miner. Process. 2011, 98, 113–117. [Google Scholar] [CrossRef]
  12. Danha, G.; Hildebrandt, D.; Glasser, D.; Bhondayi, C. Application of basic process modeling in investigating the breakage behavior of UG2 ore in wet milling. Powder Technol. 2015, 279, 42–48. [Google Scholar] [CrossRef]
  13. Tangsathitkulchai, C. Acceleration of particle breakage rates in wet batch ball milling. Powder Technol. 2002, 124, 67–75. [Google Scholar] [CrossRef]
  14. Bilgili, E.; Scarlett, B. Population balance modeling of non-linear effects in milling processes. Powder Technol. 2005, 153, 59–71. [Google Scholar] [CrossRef]
  15. Khumalo, N.; Glasser, D.; Hildebrandt, D.; Hausberger, B.; Kauchali, S. The application of the attainable region analysis to comminution. Chem. Eng. Sci. 2006, 61, 5969–5980. [Google Scholar] [CrossRef]
  16. Katubilwa, F.O.M.; Moys, M.H.; Glasser, D.; Hildebrandt, D. An attainable region analysis of the effect of ball size on milling. Powder Technol. 2011, 210, 36–46. [Google Scholar] [CrossRef]
  17. Tavares, L.M.M.; King, R.P. Continuum damage modeling of particle fracture. ZKG Int. 2005, 58, 49–58. [Google Scholar]
  18. Xu, Y. The fractal evolution of particle fragmentation under different fracture energy. Powder Technol. 2018, 323, 337–345. [Google Scholar] [CrossRef]
  19. Turcotte, D.L. Fractals and fragmentation. J. Geophys. Res. 1986, 91, 1921–1926. [Google Scholar] [CrossRef]
  20. Liu, S.; Li, Q.; Song, J. Study on the grinding kinetics of copper tailing powder. Powder Technol. 2018, 330, 105–113. [Google Scholar] [CrossRef]
  21. Gómez, R.; Castro, R.L.; Casali, A.; Palma, S.; Hekmat, A.A. comminution model for secondary fragmentation assessment for block caving. Rock Mech. Rock Eng. 2017, 50, 3073–3084. [Google Scholar] [CrossRef]
  22. Wang, G.; Peng, G.; Zhidong, T.; Yuexin, H.; Xiangzhi, M. Effect of grinding media properties and stirrer tip speed on the grinding efficiency of a stirred mill. Powder Technol. 2021, 382, 556–565. [Google Scholar]
  23. Chimwani, N.; Mohale, T.M.; Bwalya, M.M. Tailoring ball mill feed size distribution for the production of a size-graded product. Miner. Eng. 2019, 141, 105891. [Google Scholar] [CrossRef]
  24. Austin, L.G.; Luckie, P.T. Methods for determination of breakage distribution parameters. Powder Technol. 1972, 5, 215–222. [Google Scholar] [CrossRef]
  25. Ozkan, A.; Yekeler, M.; Calkaya, M. Kinetics of fine wet grinding of zeolite in a steel ball mill in comparison to dry grinding. Int. J. Miner. Process. 2009, 90, 67–73. [Google Scholar] [CrossRef]
  26. Gao, P.; Zhou, W.; Han, Y.; Li, Y.; Ren, W. Enhancing the capacity of large-scale ball mill through process and equipment optimization: An industrial test verification. Adv. Powder Technol. 2020, 31, 2079–2091. [Google Scholar] [CrossRef]
Figure 1. Plot of the coarse size versus the desired size for silica sand with a particle size of 0.60 mm during the batch milling process [16]. Reproduced with permission from Katubilwa, F.O.M., Powder Technology; published by Elsevier, 2024.
Minerals 14 00720 g001
Figure 2. Particle size distribution of the feed.
Minerals 14 00720 g002
Figure 3. The evolution of the cumulative undersize distribution for different grinding times with a solid concentration of 40% (markers = experimental; data lines = regression).
Minerals 14 00720 g003
Figure 4. The measured and calculated de for different solid concentrations.
Minerals 14 00720 g004
Figure 5. The relationship between the parameter k and the particle size d50.
Minerals 14 00720 g005
Figure 6. The lg(F)-lg(d) curves for a solid concentration of 40% (lines = regression; markers = experimental data).
Minerals 14 00720 g006
Figure 7. The fractal dimension versus the particle size d50 under different solid concentrations.
Minerals 14 00720 g007
Figure 8. Temporal variation in the fraction of the coarse size under different solid concentrations (markers = experimental data; lines = regression). (a) First-order model. (b) Two-component model. (c) Non-first-order model.
Minerals 14 00720 g008
Figure 9. The values of the Adj. R2, RMSE, and SSE obtained by fitting different kinetic equations (means and error bars).
Minerals 14 00720 g009
Figure 10. Temporal variation in the fraction of the desired size under different solid concentrations (markers = experimental data; lines = regression). (a) First-order model. (b) Non-first-order model.
Minerals 14 00720 g010
Figure 11. Temporal variation in the fraction of the overgrinding size under different solid concentrations (markers = experimental data; lines = regression). (a) First-order model. (b) Non-first-order model.
Minerals 14 00720 g011
Figure 12. Construction of the attainable Region. (a) The fraction of the desired size versus the fraction of the coarse size. (b) The fraction of the overgrinding size versus the fraction of the coarse size.
Minerals 14 00720 g012
Figure 13. The difference in the change rates between the desired size and overgrinding size vs. the grinding times for different solid concentrations.
Minerals 14 00720 g013
Table 1. The values of the breakage rate and other parameters at various solid concentrations.
SchemeFirst Order ModelTwo-Component First-Order ModelNon-First-Order Model
S1 (min−1)S1,A (min−1)φS1,B (min−1)S1,ini (min−1)a1
400.14300.14290.92830.14300.12080.0238
450.14490.14500.91330.14490.12110.0256
500.14810.14820.89050.14810.11600.0369
550.16310.16320.89990.16310.13250.0333
600.18110.18120.84880.18110.15360.0288
650.19910.19800.74290.19800.16960.0288
Table 2. The value of the breakage parameter for the desired size at various solid concentrations.
Solid Concentration (%)First-Order ModelNon-First-Order Model
S2 (min−1)b21S2,ini (min−1)a2b21
400.01960.77270.00130.89050.7114
450.01800.75650.00440.21130.7210
500.01790.74410.00630.14550.7277
550.02320.77490.01230.06750.7525
600.02040.72390.01690.03350.7371
650.02500.72780.02100.02680.7377
Table 3. The grinding time and the fraction of each size interval at the peak point.
Solid Concentration (%)Grinding Time (min)Fraction of Each Size Interval (%)
Coarse Size (+45 μm)Desired Size (-45 + 10 μm)Overgrinding Size (-10 μm)
4011.499.8654.3135.82
4511.669.5454.5335.93
5011.389.1654.4436.40
5510.439.2954.3336.38
609.898.4853.9737.55
659.008.7553.3437.91
Table 4. The grinding time and the fraction of each size interval at the switch point.
Solid Concentration (%)Grinding Time (min)Fraction of Each Size Interval (%)
Coarse SizeDesired SizeOvergrinding Size
406.8722.4650.3327.21
456.8822.4250.4027.17
506.6922.6950.0827.23
555.9623.1749.8726.96
605.2723.5049.0427.46
654.6024.6948.1127.20
Disclaimer/Publisher’s Note: The statements, opinions and data contained in all publications are solely those of the individual author(s) and contributor(s) and not of MDPI and/or the editor(s). MDPI and/or the editor(s) disclaim responsibility for any injury to people or property resulting from any ideas, methods, instructions or products referred to in the content.

