Article

Exploring the Effect of Particle Loading Density on Respirable Dust Classification by SEM-EDX

by
Daniel Sweeney
,
Cigdem Keles
and
Emily Sarver
*
Department of Mining and Minerals Engineering, Virginia Polytechnic Institute and State University, Blacksburg, VA 24061, USA
*
Author to whom correspondence should be addressed.
Minerals 2024, 14(7), 728; https://doi.org/10.3390/min14070728 (registering DOI)
Submission received: 27 May 2024 / Revised: 13 July 2024 / Accepted: 16 July 2024 / Published: 20 July 2024
(This article belongs to the Special Issue Size Distribution, Chemical Composition and Morphology of Mine Dust)

Abstract

:
Exposure to respirable coal mine dust (RCMD) still poses health risks to miners. Scanning electron microscopy with energy-dispersive X-ray spectroscopy (SEM-EDX) is a powerful tool for RCMD characterization because it provides particle-level data, including elemental ratios (via the EDX signals) that can enable classification by inferred mineralogy. However, if the particle loading density (PLD) is high on the analyzed substrate (filter sample), interference between neighboring particles could cause misclassification. To investigate this possibility, a two-part study was conducted. First, the effect of PLD on RCMD classification was isolated by comparing dust particles recovered from the same parent filters under both low- and high-PLD conditions, and a set of modified classification criteria were established to correct for high PLD. Second, the modified criteria were applied to RCMD particles on pairs of filters, with each pair having one filter that was analyzed directly (frequently high PLD) and another filter from which particles were recovered and redeposited prior to analysis (frequently lower PLD). It was expected that application of the modified criteria would improve the agreement between mineralogy distributions for paired filters; however, relatively little change was observed for most pairs. These results suggest that factors other than PLD, including particle agglomeration, can have a substantial effect on the particle EDX data collected during direct-on-filter analysis.

1. Introduction

Exposure to respirable coal mine dust (RCMD) still poses health risks to miners. Indeed, the prevalence of occupational lung disease among coal miners continues to be reported in major coal producing countries, including China, Australia, and South Africa [1,2,3,4,5,6,7,8,9,10]. In the United States (US), there has been a resurgence of particularly severe disease [11,12,13], suggesting a better understanding of RCMD characteristics and sources is needed [14].
To study dust at the particle level, the scanning electron microscope (SEM) is a powerful tool—especially when paired with energy dispersive X-ray spectroscopy (EDX) [15,16,17]. The SEM can be used to visualize particles, enabling descriptions of size and morphology, and the elemental data derived from the EDX can be used to infer particle mineralogy. For airborne dust, it is most convenient to analyze the particles directly on the sampling substrate (typically a filter), as long as it has suitable properties. To sample respirable sized dust for SEM-EDX analysis, track-etched polycarbonate (PC) filters are often chosen due to their low impurities, smooth background, and uniform pore sizes [18]
SEM-EDX has been used in numerous studies of RCMD [19,20,21,22], including studies by the authors [23,24,25,26]. One focal point of the authors’ work has been the establishment of classification criteria for RCMD particles [23,25]. In essence, the criteria consist of a list of elemental content limits against which the EDX data from each particle can be compared. This approach enables binning particles into a limited number of predefined mineralogy classes such that RCMD samples can be described by their primary constituent distributions [24].
Table 1 shows the classification criteria that were previously established and used to evaluate RCMD samples from 25 US coal mines [25]. (Notably, the criteria were established by analyzing respirable sized particles of high-purity materials, including quartz, kaolinite and other silicates, calcite, and coal, and this analysis was conducted using the same SEM instrument and settings as all subsequent analyses of RCMD particles to which the criteria have been applied.) In [25], the criteria in Table 1 were applied to supramicron particles (1–10 µm in length) to bin them into seven primary classes: carbonaceous (C), mixed carbonaceous (MC), aluminosilicates (AS), other silicates (OS), silica (S), carbonates (CB), and heavy minerals (HM). Of the 171 RCMD samples included in that study, a small subset (n = 8) appeared to be dominated by AS particles (interpreted as dust sourced mainly from rock strata being cut or drilled in the mine) with virtually no C and MC particles (interpreted as coal dust) [25]. In a related discussion, the authors noted the possibility of particle interference during SEM-EDX analysis (i.e., coal dust particles might be misclassified as AS). A subsequent study looked at 93 of the same RCMD samples, which had duplicate filters available for additional analysis [27]. That study compared the dust composition derived from the SEM-EDX classification to that derived from an alternative method, thermogravimetric analysis (TGA). SEM-EDX frequently indicates less coal (C and MC) but more non-carbonate minerals (mostly AS and S) compared to TGA [27]. These results also point to the possibility of coal dust particle misclassification in some circumstances.
As shown in Table 1, mineral particle classification by SEM-EDX is based on a sufficient abundance of key elements. For example, to classify a particle as silica (S), it should have a sufficient abundance of silicon and a low abundance of all other elements except for carbon and oxygen—which are abundant in the PC filter substrate itself. Similarly, to classify a particle as an aluminosilicate (AS), it should have a sufficient abundance of both silicon and aluminum. However, for carbonaceous particles—which, in the supramicron range, are typically coal dust—the particle is classified by its relative absence of elements other than carbon and oxygen. These particles can be susceptible to interference from nearby non-carbonaceous particles. For instance, the EDX spectrum collected on a coal dust particle might include stray aluminum and silicon signals picked up from a nearby aluminosilicate particle. Depending on the strength of those signals, the coal dust particle might be binned into the AS or MC class per Table 1. In fact, the MC class was originally established by the authors to catch particles that are not clearly C, due either to interferences or impurities [23,28].
For the RCMD samples that were direct-on-filter analyzed, Figure 1 illustrates the two factors that are the most likely to contribute to particle misclassification: a high particle loading density (PLD) on the sample filter, and agglomeration of particles [29,30,31]. PLD refers to the number of particles observed per unit of analyzed area (#/µm2) during SEM-EDX analysis. When the PLD is high in composite dust samples (such as RCMD), carbonaceous particles—or other particles that are classified based on their absence of certain elements—are more likely to be misclassified due to interference from other particles that happen to deposit nearby on the sample filter. Using direct-on-filter RCMD analysis and essentially the same classification criteria shown in Table 1, Keles et al. [32] observed substantial particle interference when the PLD for supramicron particles was greater than about 0.03–0.04 particles/µm2. That study accordingly established a high PLD threshold at 0.035 particles/µm2.
In addition to PLD, the presence of agglomerated particles—meaning particles that are clustered together but not as a result of simply depositing on the filter together—can cause interference for direct-on-filter classification by SEM-EDX. In this case, an automated routine will typically identify the agglomerate as a single particle and return a mixed EDX spectrum. This means that, for instance, an agglomerate consisting of coal and aluminosilicate particles could be classified as a single AS particle if the aluminum signal of the mixed spectrum is sufficient. SEM images of RCMD have provided evidence of such agglomerates in several studies [29,30,31,33,34].
For direct-on-filter SEM-EDX analysis, evaluating the significance of PLD versus the agglomeration on particle classification is challenging. On the one hand, it can be difficult to control PLD during standard RCMD sampling because real-time estimates of particle concentrations in the environment are generally not feasible and the goal of most sampling campaigns is to collect samples that are representative of typical exposures (which requires relatively long sampling periods). On the other hand, wet methods that involve the recovery, dispersion, and redeposition of the sample to control PLD evidently affect the ability to observe inherent agglomeration (i.e., the sample preparation process will disturb agglomerates); this may result in an oversimplified view of the types and implications of particulates present in the exposure environment [35]. A recent study by Greth et al. [36] grappled with this challenge. It used SEM-EDX to analyze 44 pairs of RCMD filters, with each pair consisting of one PC filter for direct-on-filter analysis and another filter from which particles were recovered and redeposited for analysis. The criteria in Table 1 were applied to determine mineralogy distributions. The results showed that the filters that were analyzed directly and frequently appeared to have a higher abundance of AS particles (and conversely a lower abundance of C and MC particles) than their paired filters used for recovered dust analysis. This difference was generally correlated with differences in PLD as the filters used for direct analysis typically had a higher PLD than their recovered dust counterparts. However, the authors noted that effects of agglomeration could not be ruled out since the direct filters were also more likely to contain agglomerates than the recovered filters.
The current work represents a follow-up to several of the authors’ studies described above. Here, the aim is to isolate and explore the effect of high PLD. Using two sets of previously collected RCMD samples, the specific objectives of this study are to achieve the following: (1) establish a set of modified particle classification criteria to account for high PLD during SEM-EDX analysis, and (2) test the modified criteria to assess the relative effect of high PLD on the overall mineralogy distribution derived from SEM-EDX data.

2. Materials and Methods

2.1. Respirable Coal Mine Dust Filter Samples

Two distinct sets of RCMD filter samples were used in this work, representing a total of 22 active coal mines and various sampling locations. Set 1 was used to establish modified classification criteria for high PLD conditions and Set 2 was used to test the modified criteria.
Set 1 consists of filter pairs that were prepared from nine “parent” RCMD samples, which were collected in six mines. (See Table S1 in the Supplementary Materials for a summary of the Set 1 data by number and Table S2 for a summary of Set 1 by mass.) The parent samples were originally collected on 37 mm polyvinyl chloride filters (PVC, nominal 5 µm pore size) in closed cassettes using standard sampling trains for US coal mines (i.e., 10 mm nylon cyclone, air pump operated at 2 L/min). To prepare the filters for SEM-EDX analysis, two subsections were carefully cut from each of the parent PVC filters. One subsection represented about half of the original filter and the other represented about one quarter; these were used to create “recovered” filters with high and low PLD, respectively. For this, each subsection was submerged in isopropyl alcohol (IPA) in a clean glass test tube. The tube was sonicated for 3 min to dislodge the dust particles, and then the filter section was removed from the tube. Then, the recovered dust suspension was pulled through a clean 47 mm PC filter (track-etched, 0.4 µm pore size) in a vacuum filtration unit to deposit the particles. After the PC filter was completely dry, a 9 mm subsection was carefully cut, mounted on an aluminum stub, and sputter-coated (thin layer of Au/Pd) for SEM-EDX analysis. Figure 2 presents a schematic flow chart for the sample preparation for Set 1.
Set 2 consisted of the same 44 RCMD filter pairs that were the subject of the recent work by Greth et al. [36]. (See Table S3 for a summary of Set 2 by number and Table S4 for a summary of Set 2 by mass.) The original RCMD samples were collected in various locations of 16 mines. Each pair contained two 37 mm filters collected in closed cassettes and the same sampling trains described above were used. One filter was PC (track-etched, 0.4 μm pores) and was used for direct-on-filter analysis (Figure 3). The other filter was PVC (nominal 5 μm pore size), and the dust from this filter was recovered and redeposited using the same process described for Set 1 (generally with about one half of the parent filter). Again, for the SEM-EDX work, 9 mm subsections were cut, mounted, and sputter-coated to prepare.

2.2. SEM-EDX Analysis

All SEM-EDX analyses was conducted using an FEI Quanta 600 FEG environmental SEM (Hillsboro, OR, USA) equipped with secondary (SE) and backscatter electron (BSE) detectors and a Bruker Quantax 400 EDX spectroscope (Ewing, NJ, USA). The instrument was operated at 15 kV and a working distance of 12.5 mm. For the pairs of the recovered dust filters in Set 1, a preliminary scan of each filter was performed to verify that the PLD achieved during filter preparation was in the intended range—i.e., each pair had one filter with low PLD and one filter with high PLD per the 0.035 particles/μm2 threshold established by [11]. For context, Figure 4 shows example images from fields with varying PLDs.
All other SEM-EDX analyses (Sets 1 and 2) were conducted with an automated data collection routine, which was programmed in Bruker’s Esprit software (Version 1.9). The routine was for supramicron particles (length between 1–10 µm) and was described in detail by Sarver et al. [25]. In summary, it collects size and elemental data on about 500 particles per filter by moving between fixed field locations. The area of each field is 14,025 μm2 at a 1000× magnification (see Figure 4), and the routine is programmed to collect no more than 50 particles per field such that data are collected from at least 10 different areas across the filter. For each particle, the length and width are recorded, and the EDX spectra are used to report the normalized atomic percentage of eight elements (C, O, Al, Si, Ca, Mg, Fe, and Ti).

2.3. Particle Classification

The elemental data recorded by the automated SEM-EDX routine were used to bin each particle by its inferred mineralogy based on a given set of classification criteria (see below), and the resultant data were used to estimate the class distribution of particles on each filter. Notably, distributions can be computed on the basis of number percentage or mass percentage. For the latter, the mass of each particle was estimated using the approach described by Sarver et al. [25]. Briefly, the particle’s volume was estimated as the product of the measured length and width and assumed thickness (i.e., in the third dimension, not that measured by the SEM), which is based on its assigned mineralogy class; then, the volume was multiplied by an assumed specific gravity value, also based on the particle’s assigned class, to estimate its mass. (The assumptions for determining thickness and specific gravity per class are given in Table 1.)
For this study, classification criteria were used to bin the particles into the seven defined mineralogy classes shown in Table 1 (i.e., C, MC, AS, S, CB, OS, and HM). Particles that did not fit into one those classes were binned into an “others” class (O). Here, the classification criteria given in Table 1 were considered as the “standard” criteria (STD) and were always applied to the particles analyzed under low PLD conditions (i.e., <0.035 particles/µm2). Using the Set 1 filter data, modified criteria (MOD) were established for particles analyzed under high PLD conditions (i.e., >0.035 particles/µm2), as described below. Then, for the Set 2 filter data, both the STD and MOD criteria were applied and the difference between the resulting mineralogy distributions were evaluated. Notably, this exercise was completed using both number- and mass-based data.
Particle classification and all computations were conducted in MATLAB (2023b). The per particle data—including elemental percentages, length, width, associated PLD condition (low or high), and filter identifiers—were input as a single table, and a code was written to apply either the STD criteria or some modification of it based on the PLD condition. For the work with Set 1 data, the PLD condition was considered on a “per filter” basis since all the fields analyzed on each filter had a PLD condition that aligned with the filter condition (i.e., all fields on low PLD filters had low PLD, and all fields on high PLD filters had high PLD). For the work with Set 2 data, the PLD condition was considered on a “per field” basis. This is because some of the filters contained a mix of high and low PLD fields. The MATLAB code output a table of mineralogy distributions (both by number and mass percentage) considering all the supramicron particles analyzed on a filter.

3. Results and Discussion

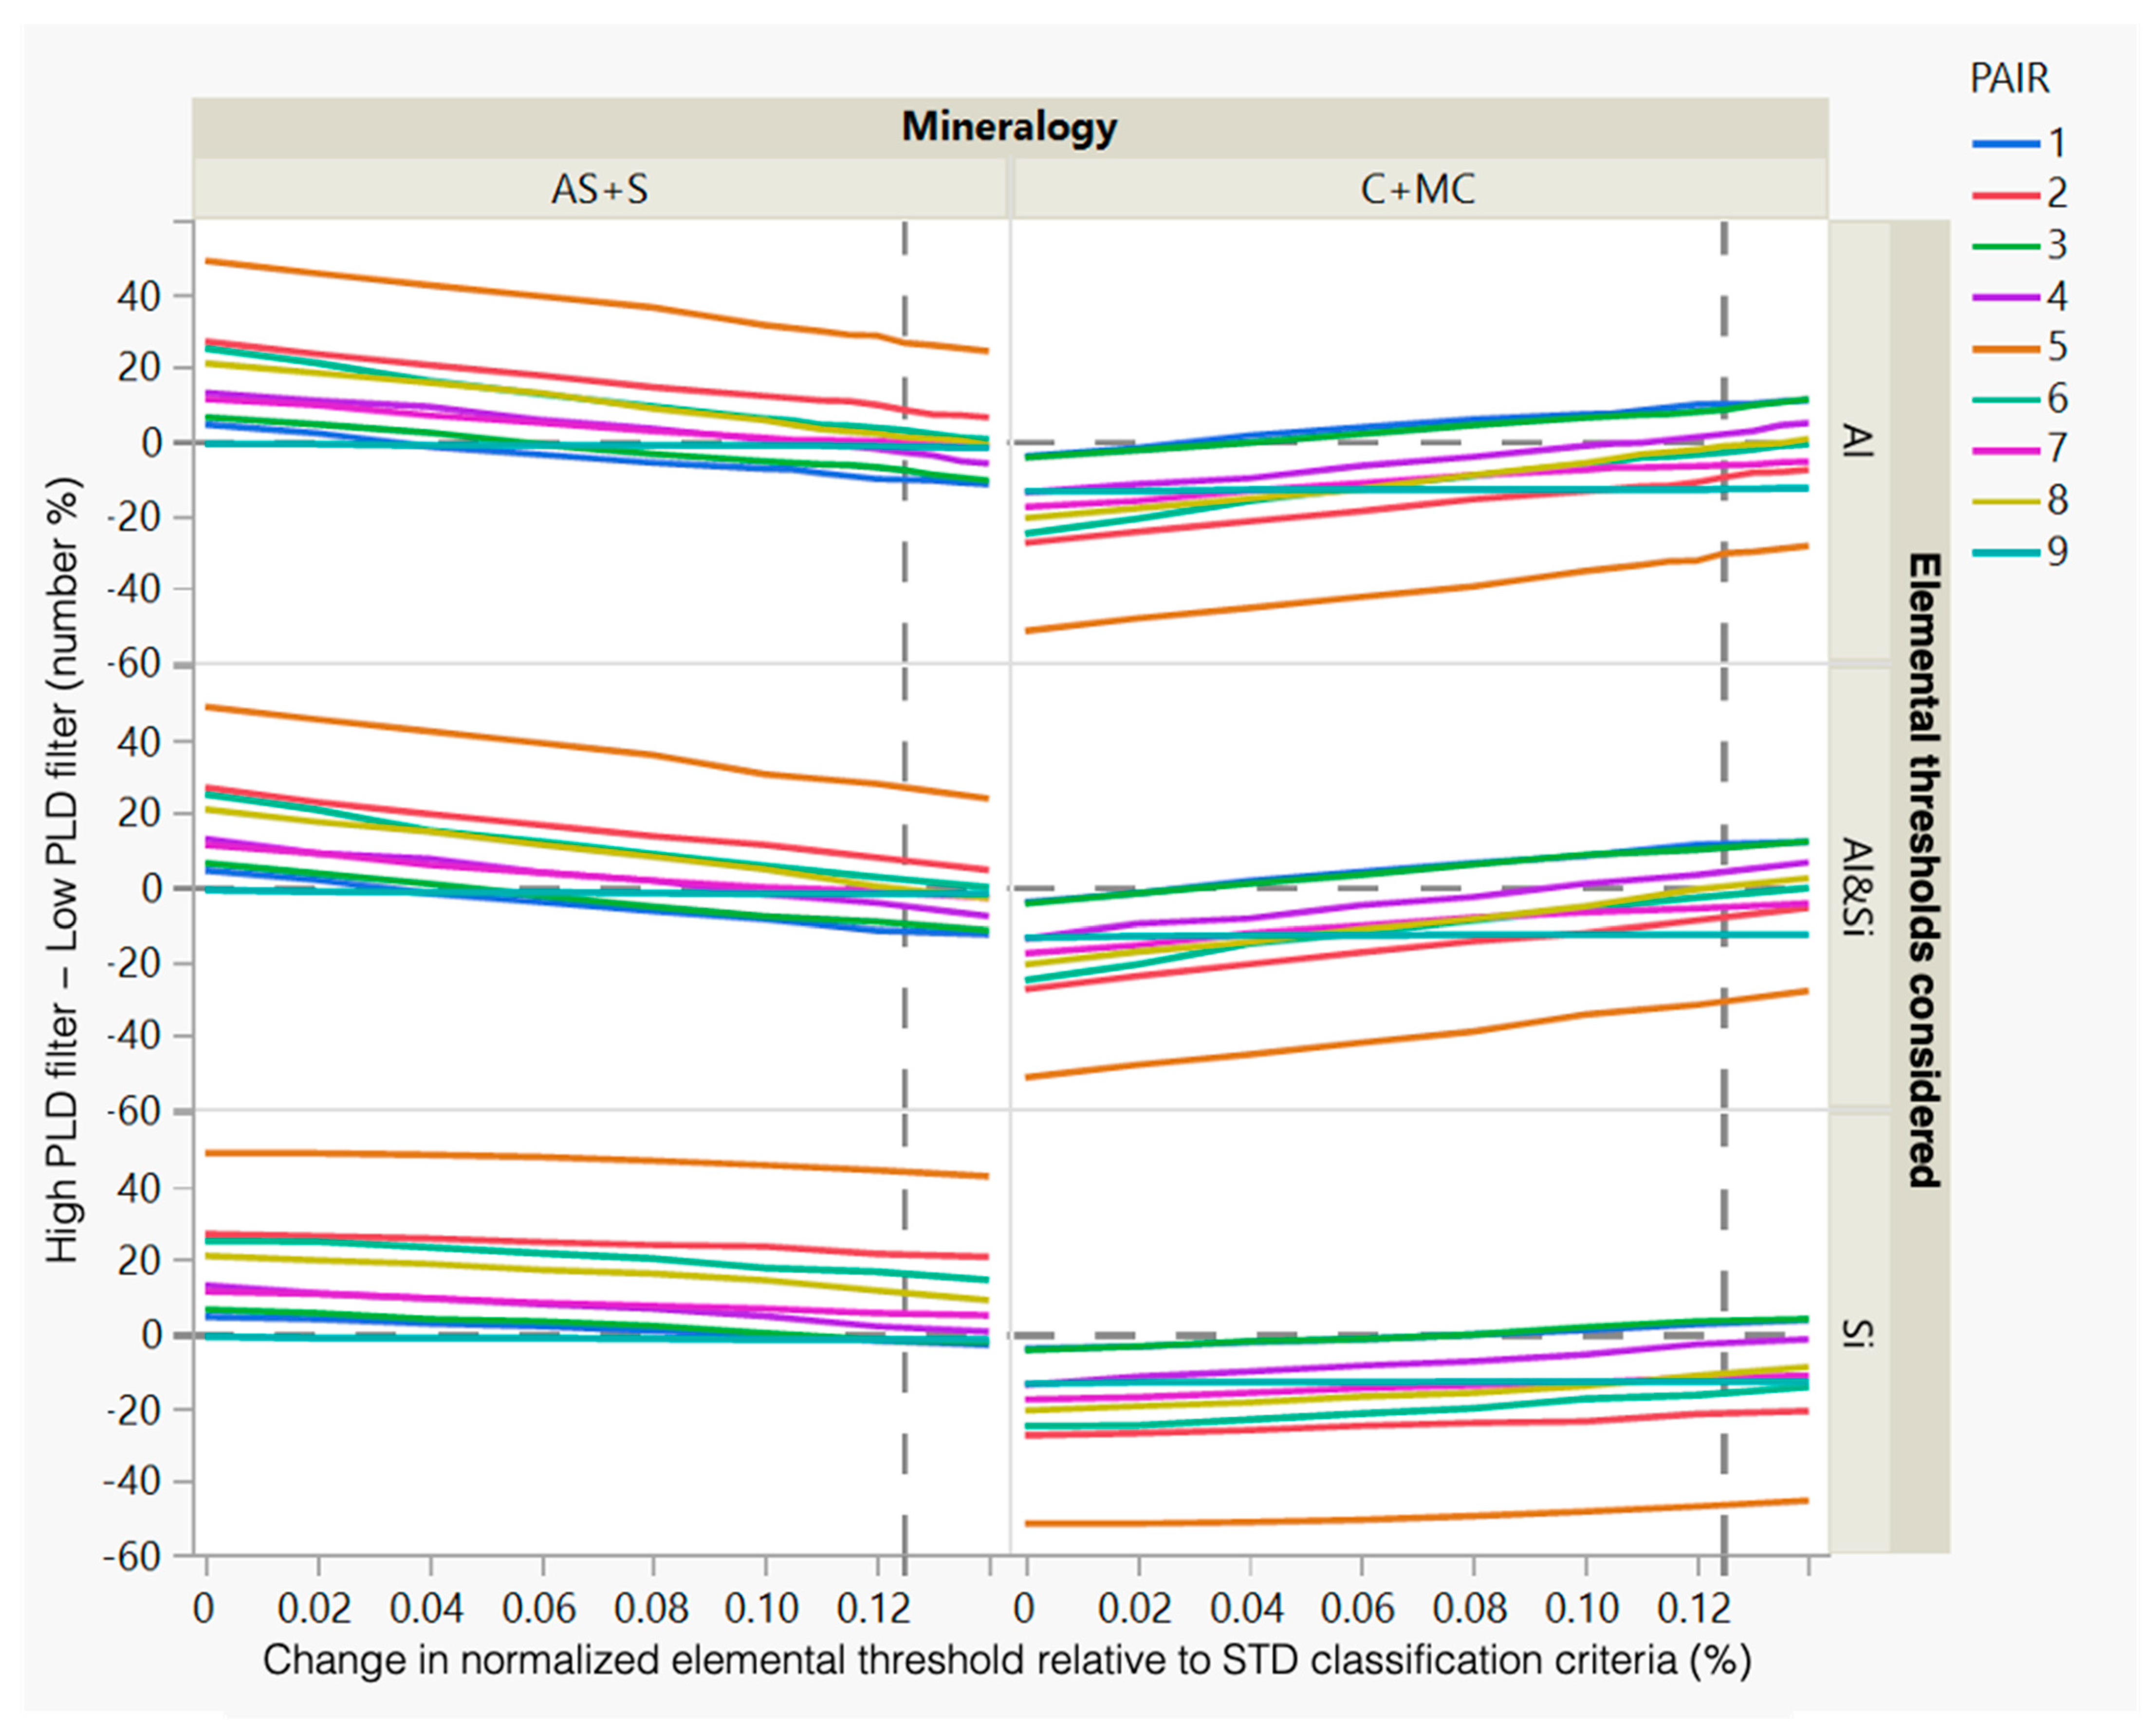
3.1. Modified Classification Criteria for High PLD Conditions

As mentioned, this portion of the work only used data from the Set 1 RCMD filter pairs (n = 9). Importantly, because the filters were prepared by recovering and redepositing the particles for analysis, they should be minimally impacted by agglomeration. The STD criteria were used as a baseline to observe the difference between the mineralogy class distributions for each low PLD/high PLD filter pair. Results are presented in Figure 5a. (Note, Pair 5 is excluded because it appeared to be an outlier, see discussion below.) The plot shows the difference in the number percentage of the particles in each major mineralogy class observed on each high PLD filter versus its low PLD counterpart as a function of the difference in PLD. As the difference in PLD increases (i.e., to the right side of the plot), the high PLD filter generally appears to have an increasingly greater abundance of AS particles relative to the low PLD filter, which is countered by an increasingly lower abundance of C particles. This fits with the expectation for misclassification of coal dust particles when there is significant interference from mineral particles (i.e., due to high PLD). (Mass-based results have trended similarly and are given in Figure S1.) The trend is also generally observable in Figure 4.
To establish the MOD criteria, an iterative approach was taken: For each iteration, the aluminum, or silicon, or aluminum and silicon limits were changed (relative to Table 1). This was done to allow for a slightly higher percentage of these elements in the C and MC classes, thereby also requiring slightly higher aluminum and/or silicon percentages for the particles to be classified as AS or S. In other words, the C and MC classes became more inclusive with each iteration, while the AS and S classes became more exclusive. For each iteration, the new results were compared to those obtained by applying the STD criteria. Figure 6 shows the difference in the number percentage of AS + S particles and C + MC particles as the aluminum and/or silicon limits were changed (mass-based results are given in Figure S2). The plots demonstrate that aluminum (rather than silicon) is the decisive factor for binning particles into the AS, S, C, and MC classes, meaning that the changing aluminum limits account for nearly all observed effects on classification. (Note that filter Pair 5 is included in Figure 6 for comparison with the other eight pairs. This pair appears to be an example of extreme mineral overestimation with high PLD, despite the fact that the difference between the high PLD and low PLD values for this pair was similar to that of the other pairs, as per Table S1. Based on the results with the STD criteria, i.e., the far left of each plot in Figure 6, Pair 5 was considered on outlier using the “1.5× outside the interquartile range” rule.)
Based on Figure 6, the final MOD criteria only include changes to the aluminum limits. They were chosen to minimize the mean difference between the AS + S (and C + MC) percentages observed with the MOD and STD criteria for each filter pair. These points are indicated by the dashed vertical lines in Figure 6, which yielded the MOD criteria for aluminum given in Table 2. (The mass-based MOD criteria are given in Table S5. Per the above discussion of filter Pair 5, its results were excluded from the analysis to establish the MOD criteria.)
Figure 5b shows the difference in minerology distributions for each filter pair in Set 1 after applying the MOD criteria. The results demonstrate how the MOD criteria help correct for high PLD. Compared to using the STD criteria, the MOD criteria yield fewer particles in the AS class. Notably, most of these particles moved to the MC class rather than the C class. This implies that the limits between the C and MC classes could be further investigated, but such work is considered out of the scope of the current study since, here, all particles in the C and MC classes are interpreted as coal dust. It should also be noted that the MOD criteria do not substantially change the percentages of particles in the S and CB classes, which is consistent with expectations since only the aluminum limits were changed.

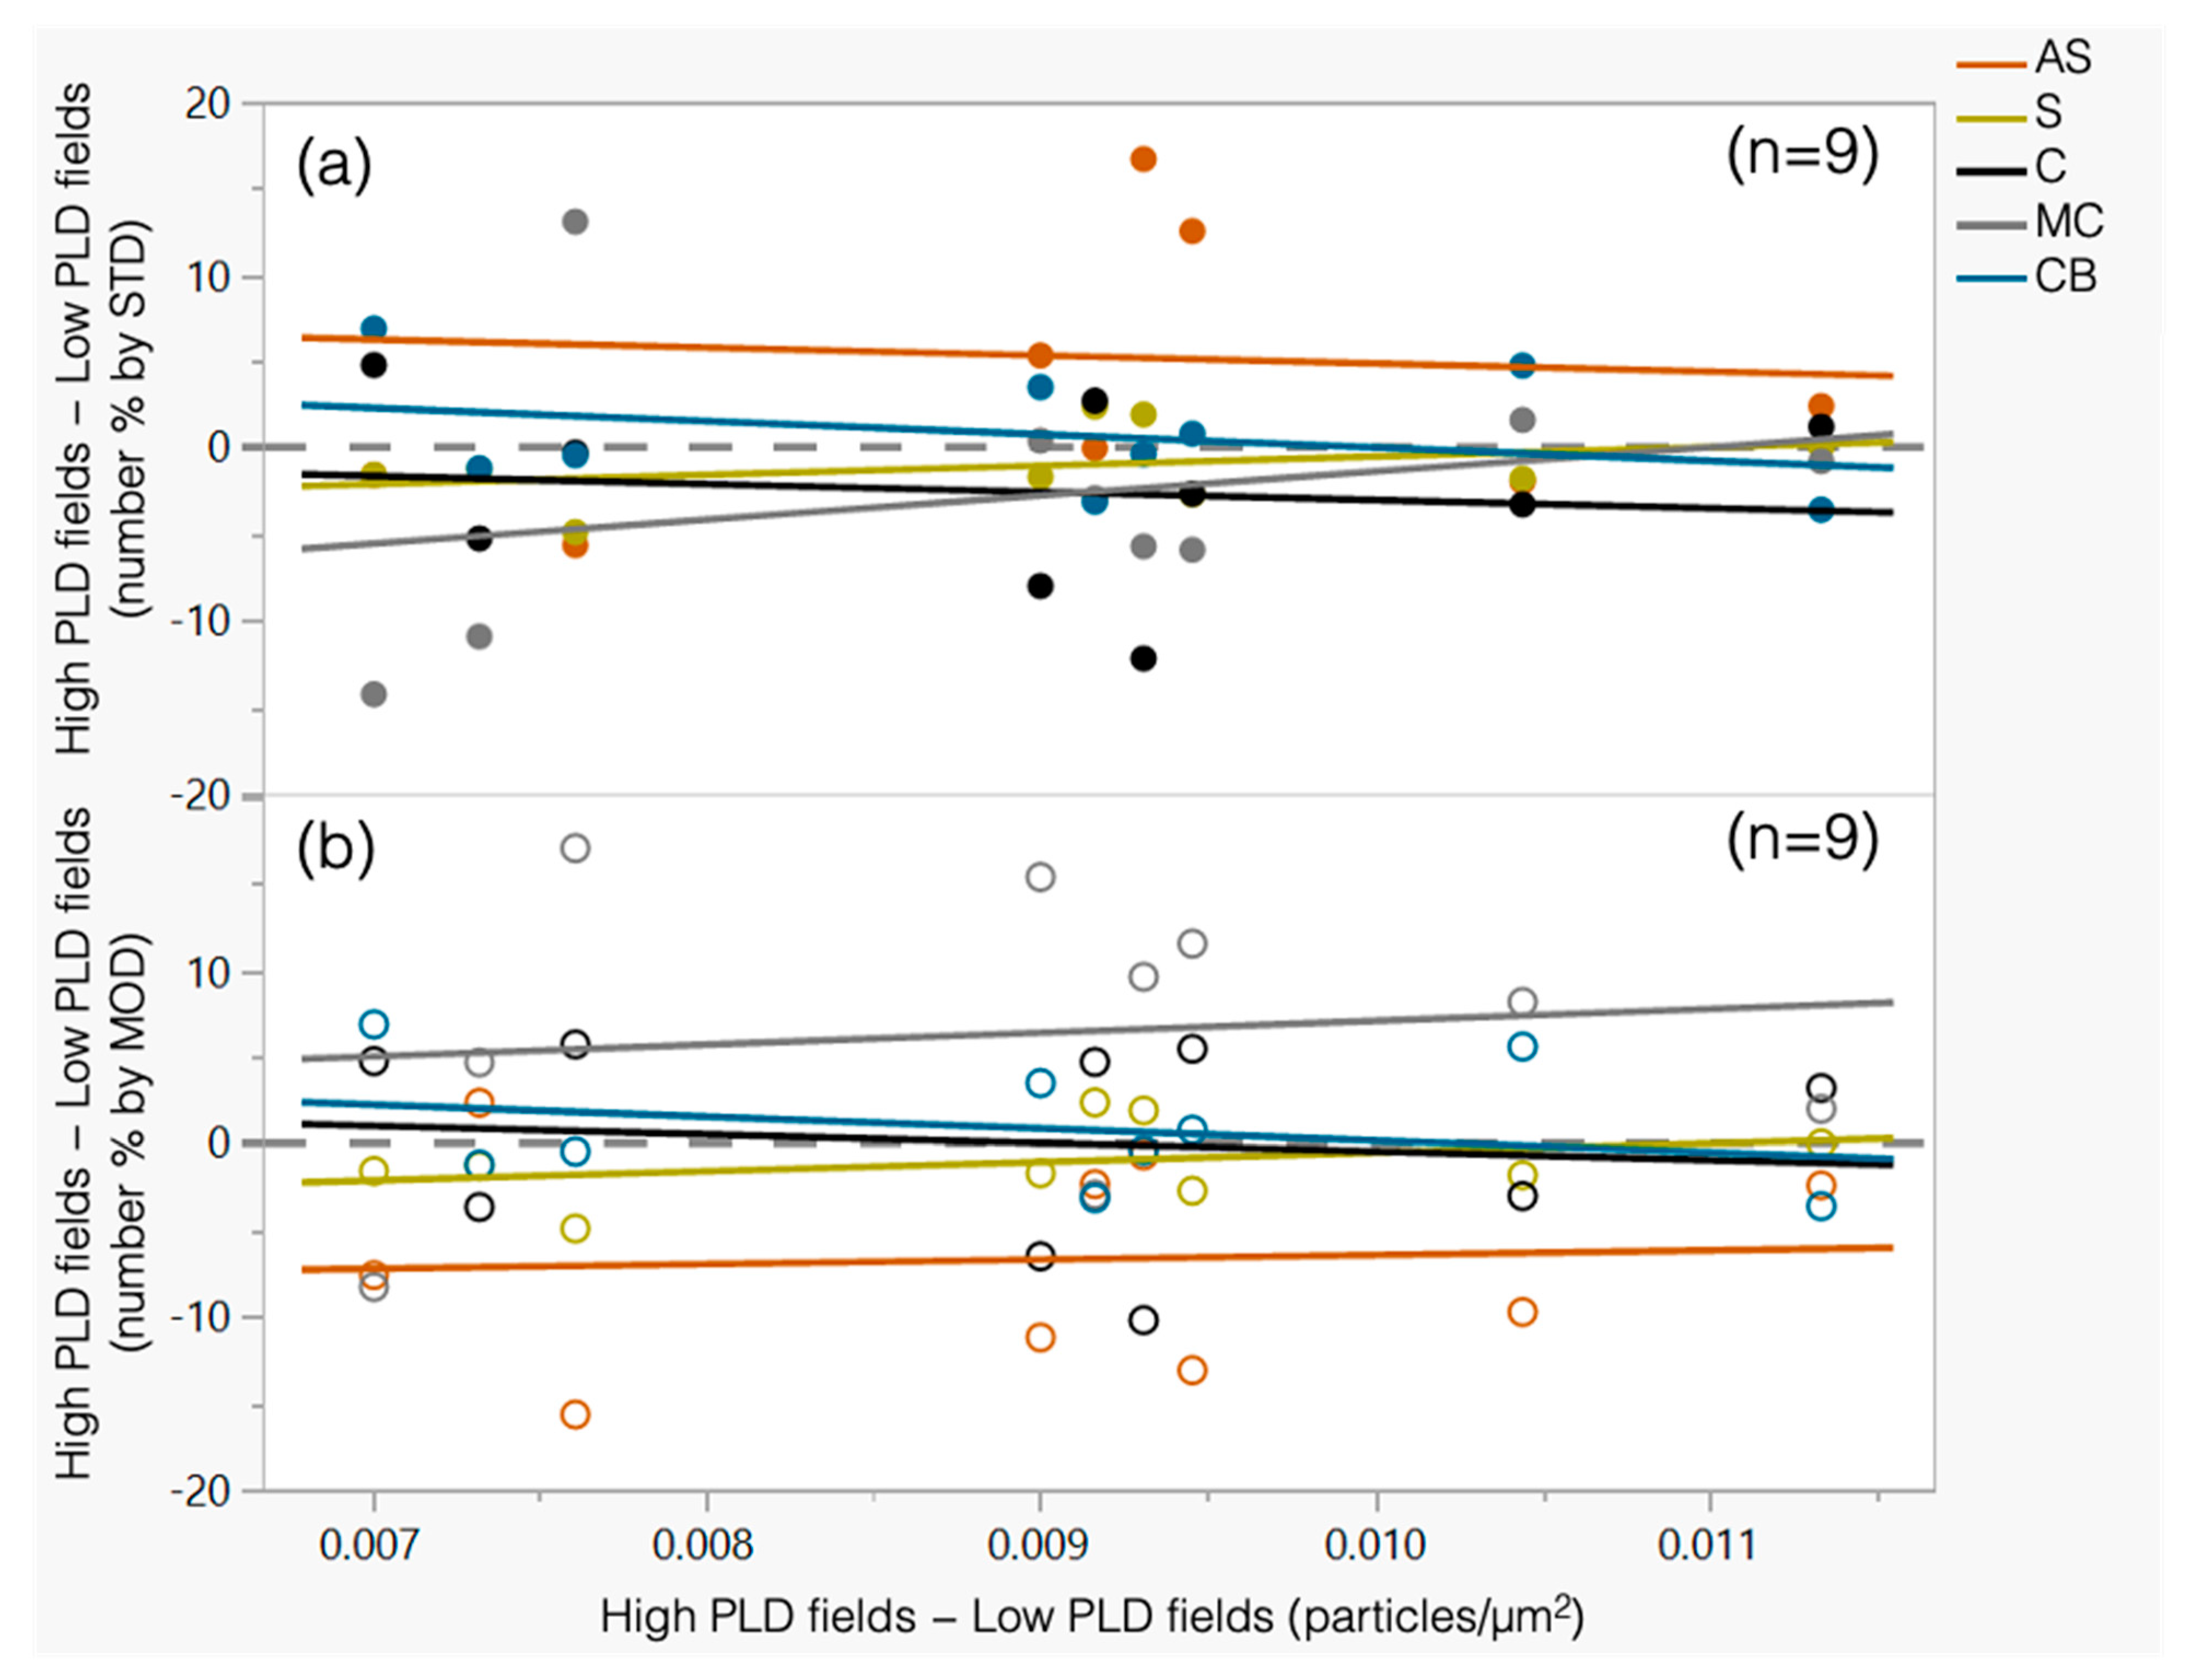
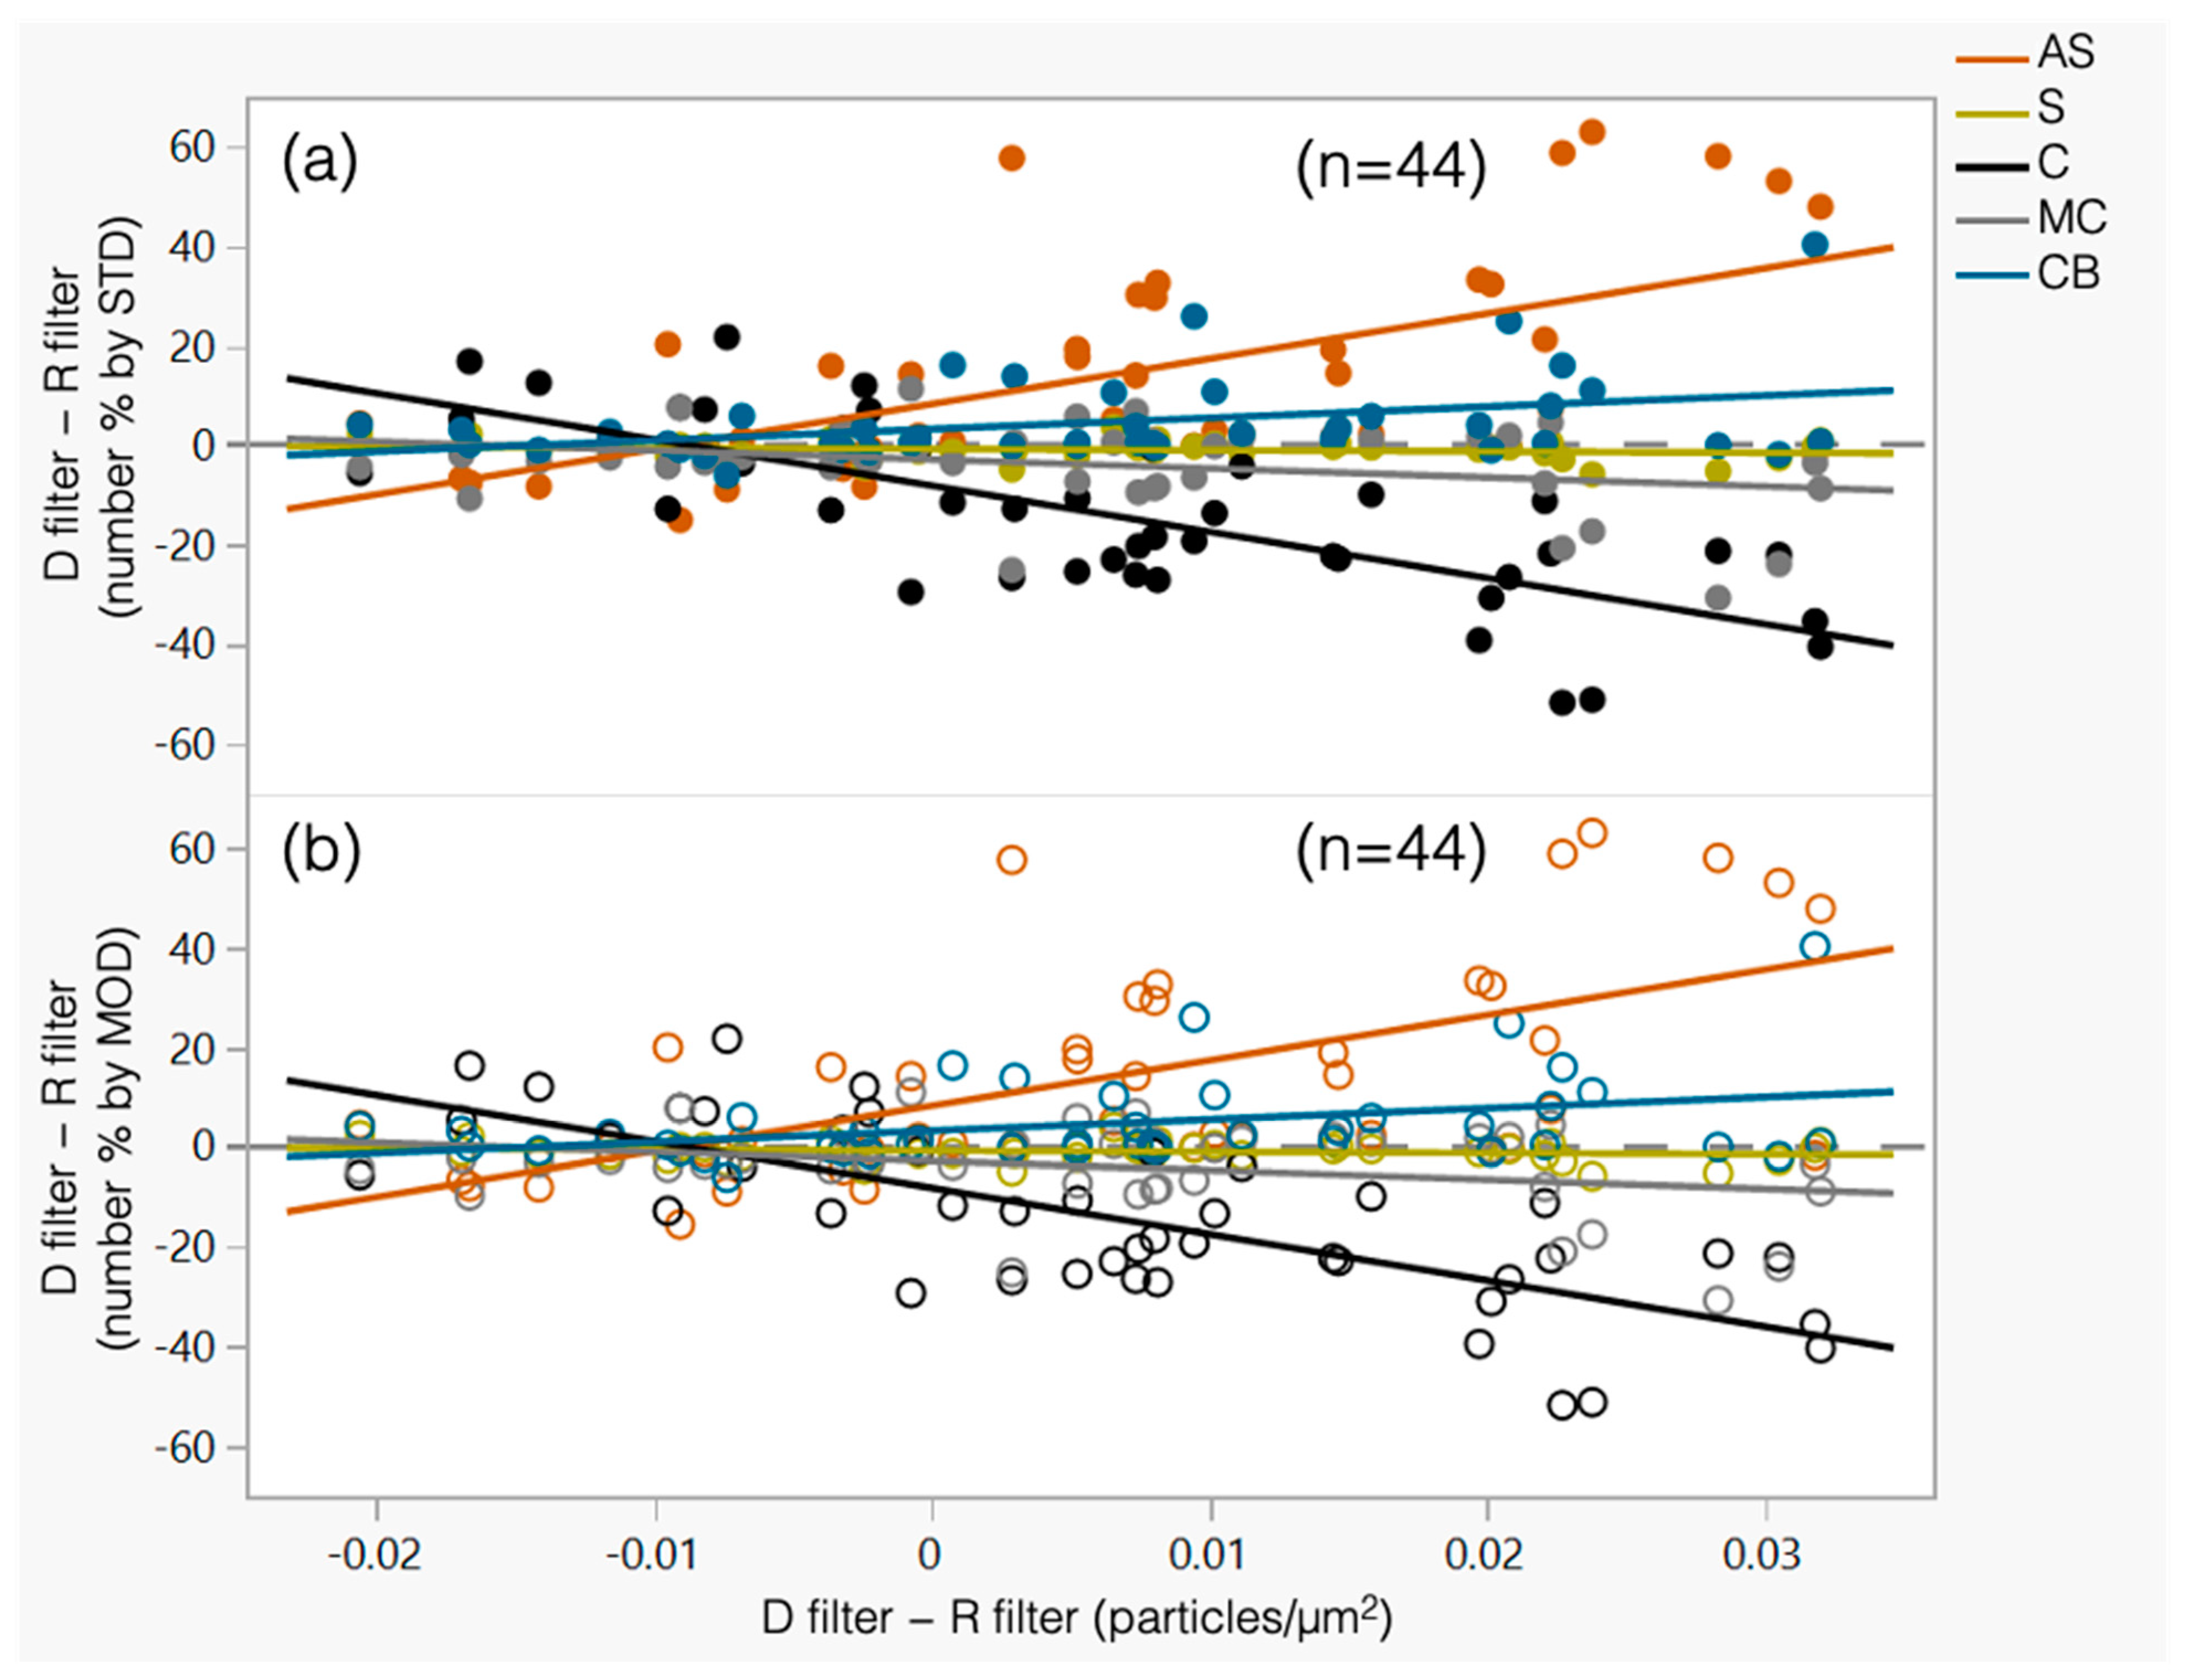
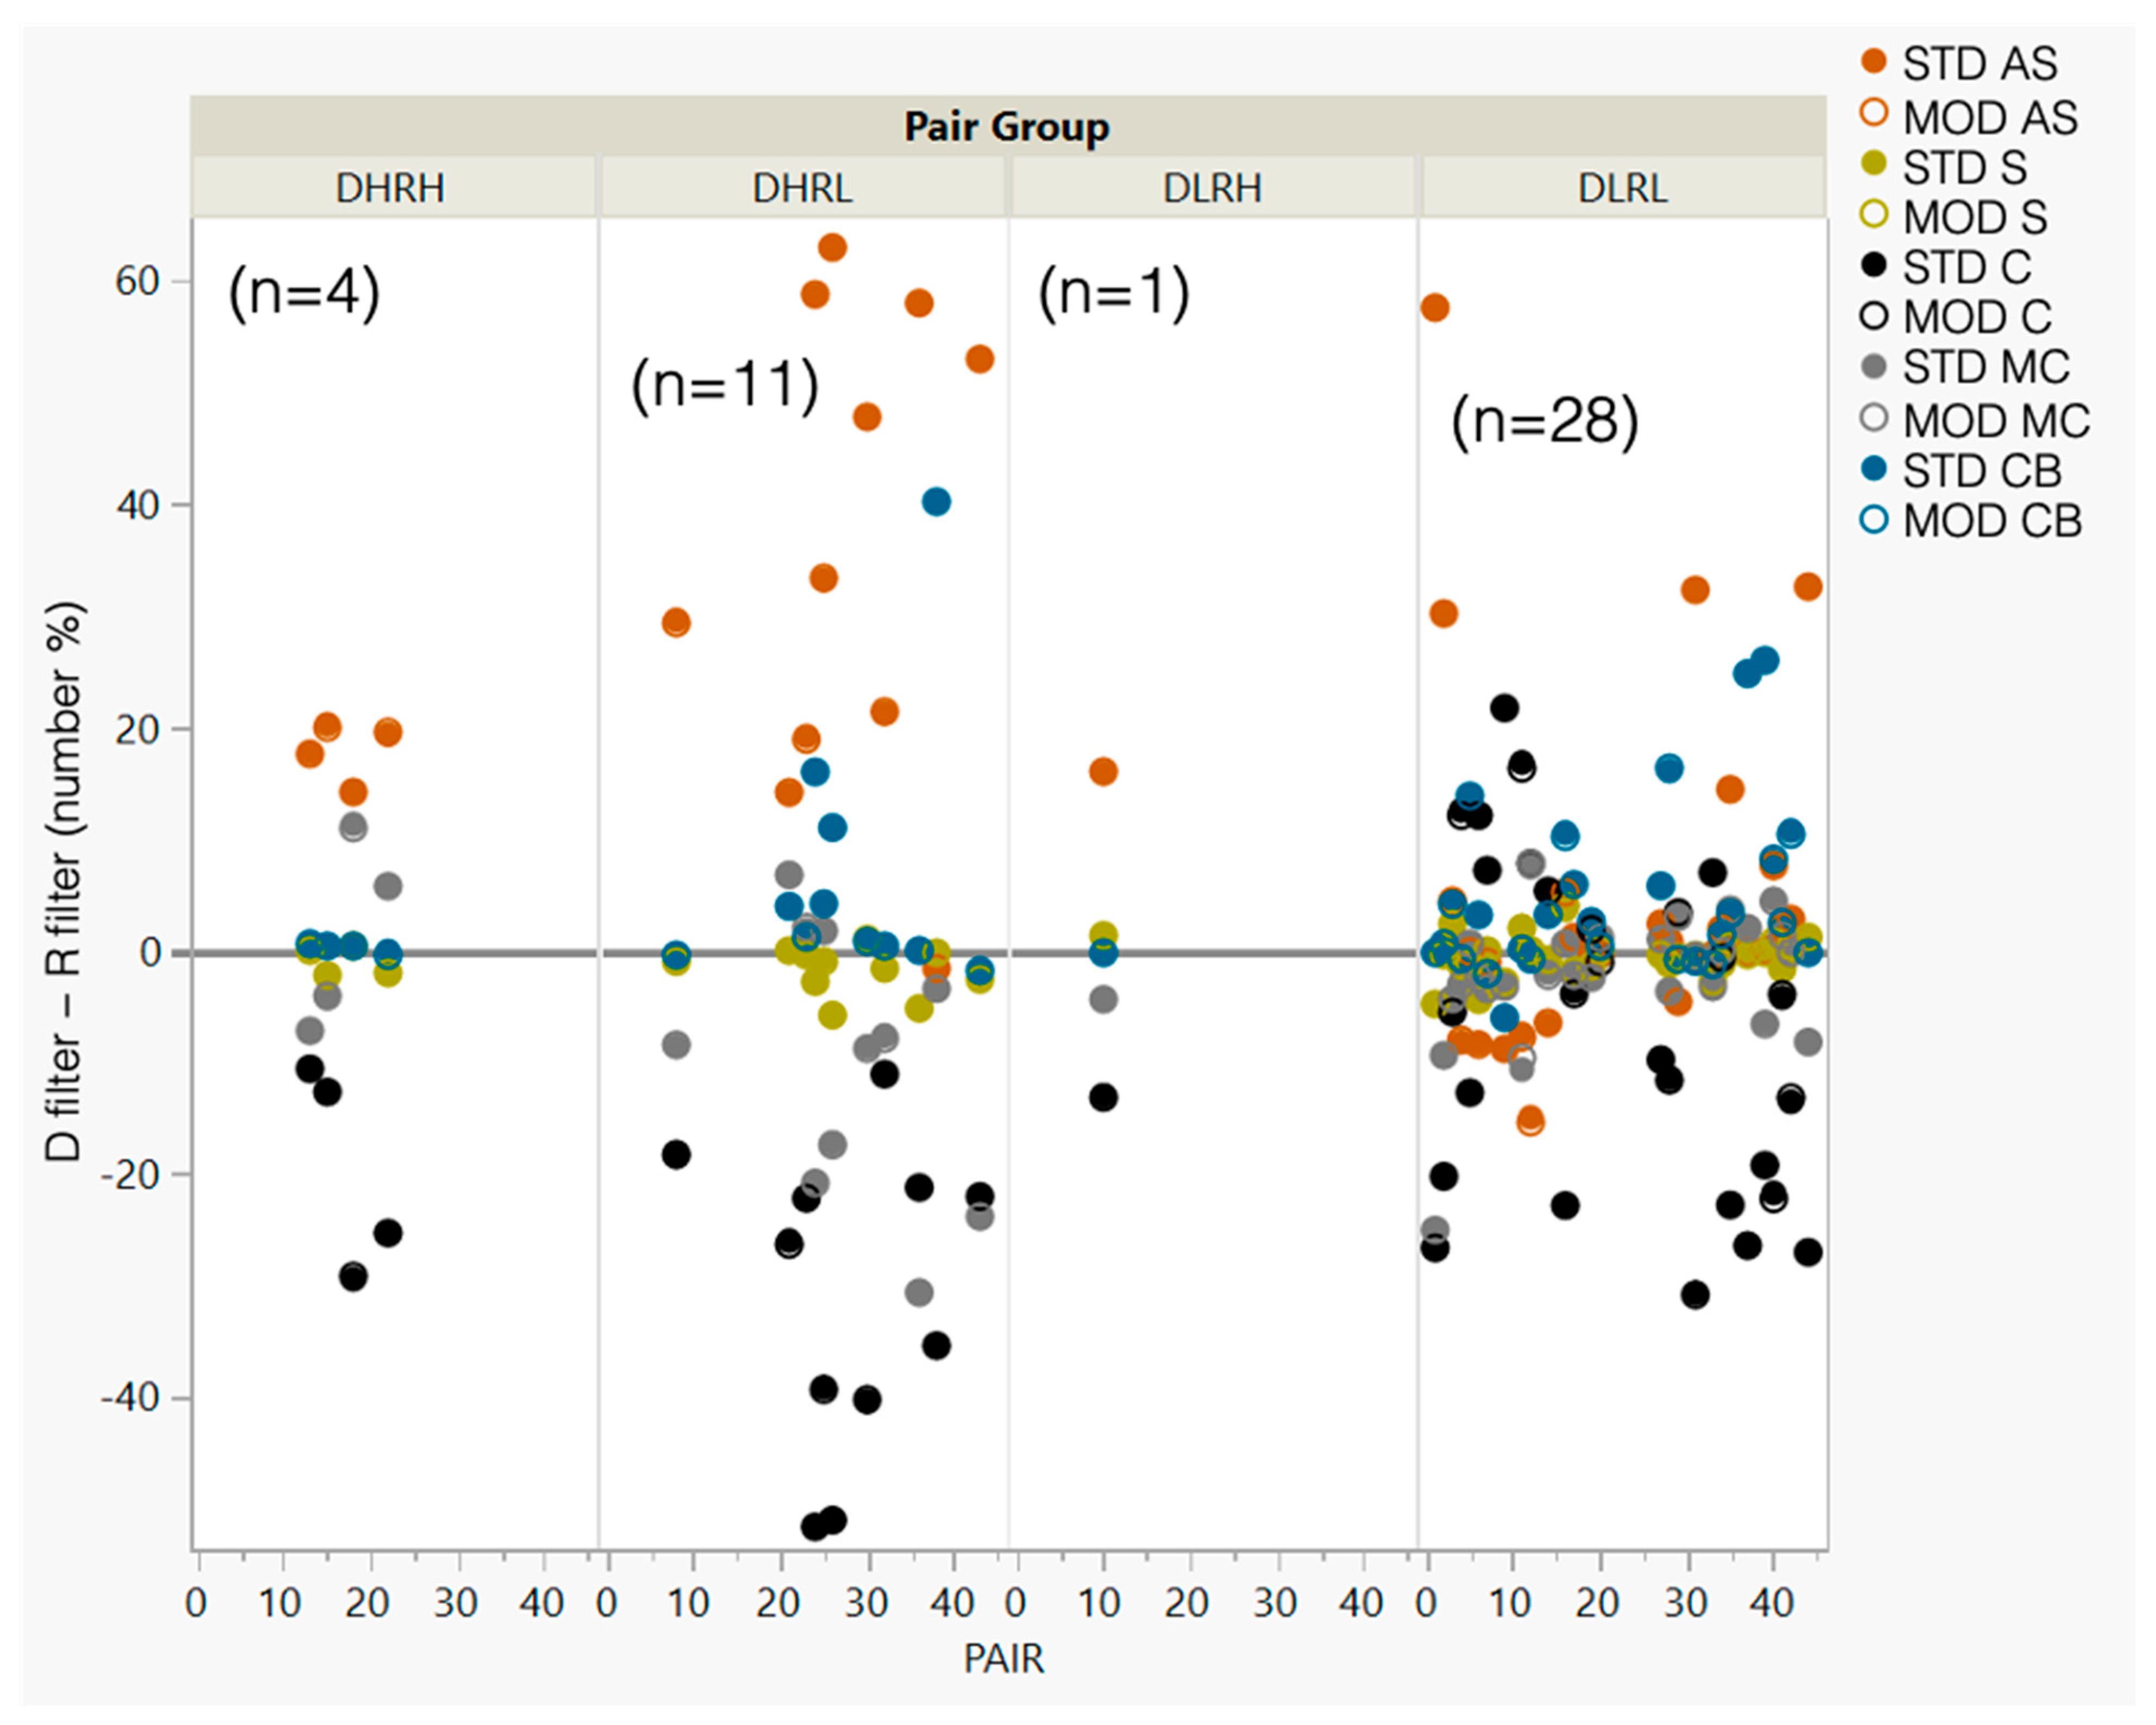
3.2. Relative Effect of High PLD on Mineralogy Distributions

Before testing the MOD classification criteria on all RCMD filters from Set 2, a preliminary analysis was conducted. This was limited to a subset of the recovered filters (n = 9), which were observed to have both high PLD and low PLD fields. Assuming that the inherent composition of dust across the filter should be uniform and not dependent on PLD, all fields should have similar mineralogy distributions. Thus, these filters were selected for analysis to explore how the MOD criteria might affect the agreement between the distributions observed in high PLD versus low PLD fields. Figure 7 shows the results; it is similar in presentation to Figure 5, but now the axes represent the difference between the mean values observed on high PLD versus low PLD fields on the same filter rather than on paired high PLD and low PLD filters. (Mass-based results are given in Figure S3.) While the results with STD criteria (Figure 7a) do generally show that high PLD fields have slightly higher AS percentages (and conversely lower C and MC percentages) than low PLD fields, the differences are not as great as those observed for the Set 1 results (paired high PLD versus low PLD filters). This is likely due to the relatively smaller difference in PLD values being compared along the x-axis. Indeed, application of the MOD criteria (Figure 7b) appears to overcorrect for high PLD, with the MOD results indicating that high PLD fields now have lower AS percentages (and higher MC percentages) than low PLD fields. Nevertheless, the MOD results do trend in the expected directions.
Next, the MOD criteria were tested on all filters from Set 2 (n = 44 pairs), and the results were compared to those with the STD criteria. Figure 8 shows the results, and now the plot axes show the difference between the direct (D) and recovered (R) filters in each pair (Figure S4 presents the mass-based results). As noted, the results using STD criteria were previously published by Greth et al. [36] using a similar presentation to that shown in Figure 8a, but the data were reproduced for the current study and are presented here to enable direct comparisons to the results with MOD criteria in Figure 8b. To recap, the results using STD criteria show that, as the difference in PLD between the paired D and R filters increases, the D filter appears to have a much higher AS percentage (and conversely much lower C percentage) than the R filter. To evaluate the agreement between the mineralogy distributions between the D and R filters in each pair, Greth et al. [36] used the Freeman–Halton (FH) exact test of independence. The null hypothesis in this case is that the mineralogy distribution is independent of the analysis type (i.e., direct-on-filter or recovered), and the null hypothesis is rejected when the p-value is less than α (i.e., the results of the paired D and R filters disagree). Using the STD criteria, Greth et al. [36] found that 25 of the filter pairs were in disagreement (α = 0.05).
Surprisingly, however, Figure 8b shows that the application of the MOD criteria in the current work appeared to have very little effect. In fact, when the FH test was applied to the results with MOD criteria, the total number of disagreeing filter pairs did not change (see Table S6 for the FH test results based on number and Table S7 for results based on mass). While it is acknowledged that the MOD criteria were established based on a relatively small number of filter pairs (n = 8 from Set 1), the parent samples for these pairs are representative of a diverse group of mines and sampling locations—as is the case for the 44 sample pairs that comprise Set 2. Moreover, when considering all the sample pairs in Set 2, the range of PLD differences for paired D and R filters was similar to the range for the paired high PLD and low PLD filters in Set 1 (i.e., compare the x-axes in Figure 8 to Figure 5).
To further explore the unexpected finding that the MOD criteria had little effect on mineralogy distributions for the Set 2 filters, the results shown in Figure 8 were replotted in Figure 9, where the D and R filter pairs were split into four groups: the D and R filters both have high PLD (DHRH); the D filter has a high PLD and the R filter has a low PLD (DHRL); the D filter has a low PLD and the R filter has a high PLD (DLRH); and the D and R filters both have low PLD (DLRL). (Figure S5 presents the mass-based results.) A total of 39 out of the 44 filter pairs fell into two groups (DLRL, n = 28; and DHRL, n = 11). (To reiterate, the MOD criteria were only applied to fields with high PLD.)
For the DLRL group, Figure 9 shows that many of the datapoints were near the zero-difference line (i.e., y = 0), meaning they agree fairly well—and, in fact, the Freeman-Halton test indicated that just 11 of the 28 pairs in this group were in disagreement using the STD criteria. This is consistent with expectations. For the pairs in this group that do not agree well (i.e., substantial positive or negative values along the y-axis), the D filters generally had lower C percentages than their R counterparts. Coal dust misclassification due to high PLD is probably not having a strong effect on these filters; filters in this group are dominated by low PLD fields, and application of the MOD criteria yields little change (as is visualized in Figure 9 and confirmed by the FH test results in Table S6). However, agglomeration on the D filter could be a factor.
For the 11 filter pairs in the DHRL group, Figure 9 indicates the disagreement between the D and R filter results with the STD criteria is more pronounced, and the FH test showed statistical disagreement between all pairs (Table S6). While the application of the MOD criteria yielded visible improvement for some pairs in this group (i.e., the open circles move toward the y = 0 line), it is insufficient to change the statistical interpretation. Again, this suggests that particle agglomeration on the D filter may be a factor.

4. Conclusions

SEM-EDX is a powerful tool for dust particle analysis, and it has been used to improve the understanding of respirable coal mine dust characteristics including particle size and mineralogy constituents. Direct analysis on sample filters is convenient and, more importantly, enables characterization of particles that are minimally disturbed (i.e., as opposed to dust particles that have been dispersed and redeposited for analysis). This approach may be preferred for the investigation of particulates as they occur in the exposure atmosphere. However, both a high particle loading density (PLD) and agglomeration can cause interference between particles during analysis, which might affect particle classification by EDX data. Notably, PLD is a sampling artifact that can—perhaps with substantial effort—be controlled. On the other hand, agglomeration of particles might be due to the specific dust-generating processes and environment.
This study demonstrated a methodology for establishing modified classification criteria that can be used to account for high PLD conditions during SEM-EDX analysis. For this, the effect of PLD on RCMD classification was isolated by comparing the dust particles recovered from the same parent filter samples under both low PLD and high PLD conditions. Notably, while the modified criteria established here are specific to the RCMD samples collected and analyzed using the same methods outlined in this work, the methodology for evaluating the effect of PLD could be broadly applied.
In the current work, when the modified criteria were applied to RCMD particles that were direct-on-filter analyzed, relatively little change in the apparent mineralogy distributions were observed for most samples. These results are somewhat surprising, and they suggest that particle agglomeration may indeed have a substantial effect on EDX data collected during direct-on-filter analysis. Given that agglomerates may have important implications for exposure monitoring and health effects, this issue is deserving of further study. Such work could include strategies like image analysis (e.g., manually or through automated techniques capable of “grain” analysis) [31,37], or the sequential direct-on-filter analysis of samples, followed by the dispersion of agglomerates (e.g., as promoted by dust recovery and redeposition) [30].

Supplementary Materials

The following supporting information can be downloaded at: https://www.mdpi.com/article/10.3390/min14070728/s1, Table S1. Summary of Set 1 classification results by number percentage using for STD and MOD criteria; Table S2. Summary of Set 1 classification results by mass percentage using for STD and MOD criteria. Table S3. Summary of Set 2 classification results by number percentage using for STD and MOD criteria. Table S4. Summary of Set 2 classification results by mass percentage using for STD and MOD criteria. Table S5. Classification criteria for supramicron particles analyzed in RCMD samples on PC fil-ters using the SEM-EDX routine detailed in [25]; the STD thresholds for Al are the same as those given in Table 1, and the MOD thresholds are those determined from Figure S2 for high PLD con-ditions. Table S6. Summary of Freeman-Halton test P-values (at α=0.05) when comparing mean number percentage in the AS+S, C+MC, and CB classes between the direct and recovered filters in each Set 2 pair. Table S6. Summary of Freeman-Halton test P-values (at α=0.05) when comparing mean number percentage in the AS+S, C+MC, and CB classes between the direct and recovered filters in each Set 2 pair. Table S7. Summary of Freeman-Halton test P-values (at α=0.05) when comparing mean mass percentage in the AS+S, C+MC, and CB classes between the direct and recovered filters in each Set 2 pair. Figure S1. Difference between the mass percentage of particles in each major mineralogy class ob-served on the high PLD filter versus the low PLD filter in each Set 1 pair (excluding Pair 5), plotted as a function of the difference in the PLD observed on the high PLD filter versus the low PLD filter. Results show when particles were classified using (a) STD criteria (closed points) or (b) MOD criteria (open points). Figure S2. Difference between the mass percentage of particles in each major mineralogy class ob-served on the high PLD filter versus the low PLD filter in each Set 1 pair, plotted as a function of the increase in the normalized elemental percent relative to the STD classification criteria percent. The difference in PLD observed on the high PLD filter versus the low PLD filter. Figure S3. Difference between the mass percentage of particles in each major mineralogy class ob-served on the high PLD fields versus the low PLD fields for each filter with both high PLD and low PLD fields in Set 2, plotted as a function of the difference in the PLD observed on the high PLD fields versus the low PLD fields. Results show when particles were classified using (a) STD criteria 9closed points) or (b) MOD criteria (open points). Figure S4. Difference between the mass percentage of particles in each major mineralogy class ob-served on the D filter versus the R filter in each Set 2 pair, plotted as a function of the difference in the PLD observed on the D filter versus the R filter. Results show when particles were classified using (a) STD criteria (closed points) or (b) MOD criteria (open points). Figure S5. Difference between the mass percentage of particles in each major mineralogy class ob-served on the D filter versus the R filter in each Set 2 pair, plotted against filter pair number. Again, results with STD criteria are shown with closed points, and those with MOD criteria are shown with open points.

Author Contributions

Conceptualization, E.S.; Data curation, D.S.; Investigation, D.S., C.K., and E.S.; Methodology, D.S., C.K., and E.S.; Project administration, E.S.; Resources, E.S.; Supervision, E.S.; Writing—original draft, D.S.; Writing—review and editing, E.S. All authors have read and agreed to the published version of the manuscript.

Funding

This research was funded by the US Centers for Disease Control/National Institute Occupational Safety and health (contracts 75D30122C14433 and 75D30119C05529).

Data Availability Statement

All data are available in the article, the Supplementary Materials, or upon reasonable request from the corresponding authors.

Acknowledgments

The authors wish to thank Setareh Afrouz and August Greth for their assistance with dust filter preparation and data interpretation and Lizeth Jaramillo for their assistance with data presentation. We also wish to kindly acknowledge our industry partners and mine personnel for arranging mine access and providing logistical support for dust sampling. We acknowledge the Institute for Critical Technology and Applied Sciences’ Nanoscale Characterization and Fabrication Laboratory (NCFL), which houses the SEM-EDX facilities used in this study. The NCFL is supported by the Virginia Tech National Center for Earth and Environmental Nanotechnology Infrastructure (NanoEarth), which is a member of the National Nanotechnology Coordinated Infrastructure (NNCI) and is supported by NSF (ECCS 1542100 and ECCS 2025151). The views expressed in this study are those of the authors and not necessarily the views of sponsors or research partners.

Conflicts of Interest

The authors declare no conflicts of interest.

References

  1. Han, S.; Chen, H.; Harvey, M.; Stemn, E.; Cliff, D. Focusing on Coal Workers’ Lung Diseases: A Comparative Analysis of China, Australia, and the United States. Int. J. Environ. Res. Public Health 2018, 15, 2565. [Google Scholar] [CrossRef]
  2. Kamanzi, C.; Becker, M.; Jacobs, M.; Konečný, P.; Von Holdt, J.; Broadhurst, J. The Impact of Coal Mine Dust Characteristics on Pathways to Respiratory Harm: Investigating the Pneumoconiotic Potency of Coals. Environ. Geochem. Health 2023, 45, 7363–7388. [Google Scholar] [CrossRef] [PubMed]
  3. Li, J.; Yin, P.; Wang, H.; Wang, L.; You, J.; Liu, J.; Liu, Y.; Wang, W.; Zhang, X.; Niu, P.; et al. The Burden of Pneumoconiosis in China: An Analysis from the Global Burden of Disease Study 2019. BMC Public Health 2022, 22, 1114. [Google Scholar] [CrossRef] [PubMed]
  4. Lu, C.; Dasgupta, P.; Cameron, J.; Fritschi, L.; Baade, P. A Systematic Review and Meta-Analysis on International Studies of Prevalence, Mortality and Survival Due to Coal Mine Dust Lung Disease. PLoS ONE 2021, 16, e0255617. [Google Scholar] [CrossRef]
  5. McCall, C. Australia’s New Coal Mine Plan: A “Public Health Disaster”. Lancet 2017, 389, 588. [Google Scholar] [CrossRef] [PubMed]
  6. Naidoo, R.N.; Robins, T.G.; Murray, J. Respiratory Outcomes among South African Coal Miners at Autopsy. Am. J. Ind. Med. 2005, 48, 217–224. [Google Scholar] [CrossRef]
  7. Naidoo, R.N.; Robins, T.G.; Seixas, N.; Lalloo, U.G.; Becklake, M. Respirable Coal Dust Exposure and Respiratory Symptoms in South-African Coal Miners: A Comparison of Current and Ex-Miners. J. Occup. Environ. Med. 2006, 48, 581–590. [Google Scholar] [CrossRef]
  8. Ndlovu, N.; Nelson, G.; Vorajee, N.; Murray, J. 38 Years of Autopsy Findings in South African Mine Workers. Am. J. Ind. Med. 2016, 59, 307–314. [Google Scholar] [CrossRef]
  9. Shi, P.; Xing, X.; Xi, S.; Jing, H.; Yuan, J.; Fu, Z.; Zhao, H. Trends in Global, Regional and National Incidence of Pneumoconiosis Caused by Different Aetiologies: An Analysis from the Global Burden of Disease Study 2017. Occup. Environ. Med. 2020, 77, 407–414. [Google Scholar] [CrossRef]
  10. Zosky, G.R.; Hoy, R.F.; Silverstone, E.J.; Brims, F.J.; Miles, S.; Johnson, A.R.; Gibson, P.G.; Yates, D.H. Coal Workers’ Pneumoconiosis: An Australian Perspective. Med. J. Aust. 2016, 204, 414–418. [Google Scholar] [CrossRef]
  11. Almberg, K.S.; Halldin, C.N.; Blackley, D.J.; Laney, A.S.; Storey, E.; Rose, C.S.; Go, L.H.T.; Cohen, R.A. Progressive Massive Fibrosis Resurgence Identified in U.S. Coal Miners Filing for Black Lung Benefits, 1970–2016. Ann. Am. Thorac. Soc. 2018, 15, 1420–1426. [Google Scholar] [CrossRef] [PubMed]
  12. Blackley, D.J.; Halldin, C.N.; Laney, A.S. Resurgence of a Debilitating and Entirely Preventable Respiratory Disease among Working Coal Miners. Am. J. Respir. Crit. Care Med. 2014, 190, 708–709. [Google Scholar] [CrossRef] [PubMed]
  13. Hall, N.B.; Blackley, D.J.; Halldin, C.N.; Laney, A.S. Current Review of Pneumoconiosis among Us Coal Miners. Curr. Environ. Health Rep. 2019, 6, 137–147. [Google Scholar] [CrossRef] [PubMed]
  14. National Academies of Sciences, Engineering. Monitoring and Sampling Approaches to Assess Underground Coal Mine Dust Exposures; The National Academies Press: Washington, DC, USA, 2018. [Google Scholar]
  15. Goldstein, J.I.; Newbury, D.E.; Michael, J.R.; Ritchie, N.W.M.; Scott, J.H.J.; Joy, D.C. Scanning Electron Microscopy and X-ray Microanalysis; Springer New York: New York, NY, USA, 2017. [Google Scholar]
  16. Kuo, J. Electron Microscopy: Methods and Protocols; Humana Press: Totowa, NJ, USA, 2008. [Google Scholar]
  17. Reed, S.J.B. Electron Microprobe Analysis and Scanning Electron Microscopy in Geology; Cambridge University Press: Cambridge, UK, 2005. [Google Scholar]
  18. Willis, R.D.; Blanchard, F.T.; Conner, T.L. Guidelines for the Application of Sem/Edx Analytical Techniques to Particulate Matter Samples; National Exposure Research Laboratory Office of Research and Development U.S. Environmental Protection Agency: Washington, DC, USA, 2002.
  19. Abbasi, B.; Wang, X.; Chow, J.C.; Watson, J.G.; Peik, B.; Nasiri, V.; Riemenschnitter, K.B.; Elahifard, M. Review of Respirable Coal Mine Dust Characterization for Mass Concentration, Size Distribution and Chemical Composition. Minerals 2021, 11, 426. [Google Scholar] [CrossRef]
  20. Laskin, A.; Cowin, J.P. Automated Single-Particle Sem/Edx Analysis of Submicrometer Particles Down to 0.1 Μm. Anal. Chem. 2001, 73, 1023–1029. [Google Scholar] [CrossRef] [PubMed]
  21. Lu, S.; Hao, X.; Liu, D.; Wang, Q.; Zhang, W.; Liu, P.; Zhang, R.; Yu, S.; Pan, R.; Wu, M.; et al. Mineralogical Characterization of Ambient Fine/Ultrafine Particles Emitted from Xuanwei C1 Coal Combustion. Atmos. Res. 2016, 169, 17–23. [Google Scholar] [CrossRef]
  22. Pan, L.; Golden, S.; Assemi, S.; Sime, M.F.; Wang, X.; Gao, Y.; Miller, J. Characterization of Particle Size and Composition of Respirable Coal Mine Dust. Minerals 2021, 11, 276. [Google Scholar] [CrossRef]
  23. Johann-Essex, V.; Keles, C.; Sarver, E. A Computer-Controlled Sem-Edx Routine for Characterizing Respirable Coal Mine Dust. Minerals 2017, 7, 15. [Google Scholar] [CrossRef]
  24. Keles, C.; Jaramillo Taborda, M.; Sarver, E. Updating “Characteristics of Respirable Dust in Eight Appalachian Coal Mines: A Dataset Including Particle Size and Mineralogy Distributions, and Metal and Trace Element Mass Concentrations” with Expanded Data to Cover a Total of 25 Us Mines. Data Brief 2022, 42, 108125. [Google Scholar] [CrossRef]
  25. Sarver, E.; Keles, C.; Afrouz, S. Particle Size and Mineralogy Distributions in Respirable Dust Samples from 25 Us Underground Coal Mines. Int. J. Coal Geol. 2021, 247, 103851. [Google Scholar] [CrossRef]
  26. Sarver, E.; Keles, C.; Rezaee, M. Beyond Conventional Metrics: Comprehensive Characterization of Respirable Coal Mine Dust. Int. J. Coal Geol. 2019, 207, 84–95. [Google Scholar] [CrossRef]
  27. Pokhrel, N.; Agioutanti, E.; Keles, C.; Afrouz, S.; Sarver, E. Comparison of Respirable Coal Mine Dust Constituents Estimated Using FTIR, TGA, and SEM–EDX. Min. Metall. Explor. 2022, 39, 291–300. [Google Scholar] [CrossRef]
  28. Sellaro, R.; Sarver, E.; Baxter, D. A Standard Characterization Methodology for Respirable Coal Mine Dust Using Sem-Edx. Resources 2015, 4, 939–957. [Google Scholar] [CrossRef]
  29. Gonzalez, J.; Keles, C.; Pokhrel, N.; Jaramillo, L.; Sarver, E. Respirable Dust Constituents and Particle Size: A Case Study in a Thin-Seam Coal Mine. Min. Metall. Explor. 2022, 39, 1007–1015. [Google Scholar] [CrossRef]
  30. Gonzalez, J.; Keles, C.; Sarver, E. On the Occurrence and Persistence of Coal-Mineral Microagglomerates in Respirable Coal Mine Dust. Min. Metall. Explor. 2022, 39, 271–282. [Google Scholar] [CrossRef]
  31. Keles, C.; Sarver, E. A Study of Respirable Silica in Underground Coal Mines: Particle Characteristics. Minerals 2022, 12, 1555. [Google Scholar] [CrossRef]
  32. Keles, C.; Pokhrel, N.; Sarver, E. A Study of Respirable Silica in Underground Coal Mines: Sources. Minerals 2022, 12, 1115. [Google Scholar] [CrossRef]
  33. Pandey, J.K.; Agarwal, D.; Gorain, S.; Dubey, R.K.; Vishwakarma, M.K.; Mishra, K.K.; Pal, A.K. Characterisation of Respirable Dust Exposure of Different Category of Workers in Jharia Coalfields. Arab. J. Geosci. 2017, 10, 183. [Google Scholar] [CrossRef]
  34. Su, X.; Ding, R.; Zhuang, X. Characteristics of Dust in Coal Mines in Central North China and Its Research Significance. ACS Omega 2020, 5, 9233–9250. [Google Scholar] [CrossRef]
  35. Armbruster, L. Agglomeration of Coal Mine Dust and Its Effect on Respirable Dust Sampling. Ann. Occup. Hyg. 1988, 12, 393–401. [Google Scholar]
  36. Greth, A.; Afrouz, S.; Keles, C.; Sarver, E. Characterization of Respirable Coal Mine Dust Recovered from Fibrous Polyvinyl Chloride Filters by Scanning Electron Microscopy. Min. Metall. Explor. 2024, 41, 1145–1154. [Google Scholar] [CrossRef]
  37. LaBranche, N.; Teale, K.; Wightman, E.; Johnstone, K.; Cliff, D. Characterization Analysis of Airborne Particulates from Australian Underground Coal Mines Using the Mineral Liberation Analyser. Minerals 2022, 12, 796. [Google Scholar] [CrossRef]
Figure 1. Conceptual illustration of low and high particle loading density (PLD) and particle agglomeration on RCMD sample filters. (Note that colors in this figure are arbitrary and are simply meant to illustrate, in general, different particle types.)
Minerals 14 00728 g001
Figure 2. Sample preparation process for Set 1.
Minerals 14 00728 g002
Figure 3. Sample preparation process for Set 2.
Minerals 14 00728 g003
Figure 4. Example images of SEM-EDX analysis fields (at 1000× magnification) on the recovered RCMD filters with varying PLDs. The top row of images are SE micrographs; the bottom row shows BSE images, with the first 50 particles color-coded according to their EDX spectra. (The legend shows relative descriptions of the primary elemental abundance since multiple particle classification criteria were applied in this study.)
Minerals 14 00728 g004
Figure 5. Difference between the number percentage of particles in each major mineralogy class observed on the high PLD filter versus the low PLD filter in each Set 1 pair (excluding Pair 5), plotted as a function of the difference in the PLD observed on the high PLD filter versus the low PLD filter. Results show when particles were classified using (a) STD criteria (closed points) or (b) MOD criteria (open points).
Minerals 14 00728 g005
Figure 6. Difference between the number percentage of particles in each major mineralogy class observed on the high PLD filter versus the low PLD filter in each Set 1 pair, plotted as a function of the increase in the normalized elemental percent relative to the STD classification criteria percent. The difference in PLD observed on the high PLD filter versus the low PLD filter.
Minerals 14 00728 g006
Figure 7. Difference between the number percentage of particles in each major mineralogy class observed on the high PLD fields versus the low PLD fields for each filter with both high PLD and low PLD fields in Set 2, plotted as a function of the difference in the PLD observed on the high PLD fields versus the low PLD fields. Results show when particles were classified using (a) STD criteria 9closed points) or (b) MOD criteria (open points).
Minerals 14 00728 g007
Figure 8. Difference between the number percentage of particles in each major mineralogy class observed on the D filter versus the R filter in each Set 2 pair, plotted as a function of the difference in the PLD observed on the D filter versus the R filter. Results show when particles were classified using (a) STD criteria (closed points) or (b) MOD criteria (open points).
Minerals 14 00728 g008
Figure 9. Difference between the number percentage of particles in each major mineralogy class observed on the D filter versus the R filter in each Set 2 pair, plotted against filter pair number. Again, results with STD criteria are shown with closed points, and those with MOD criteria are shown with open points.
Minerals 14 00728 g009
Table 1. Classification criteria for the supramicron particles analyzed in the RCMD samples on PC filters using the SEM-EDX routine detailed in [25].
ClassNormalized Atomic %Assumption for Estimating
Particle Mass
COAlSiCaMgTiFeS:ISG
C≥75<29≤0.30≤0.30≤0.41≤0.50≤0.06≤0.150.61.4
MC <0.35<0.35≤0.50≤0.50≤0.60≤0.600.61.4
AS ≥0.35≥0.35 0.42.6
OS 1 ≥0.33 0.42.6
S 2 ≥0.33 0.72.7
CB<88>9 >0.50>0.50 0.72.7
HM >1.00 >1.00>1.000.75.0
1 Additional limits for OS: Si/(Al + Si + Mg + Ca + Ti + Fe) < 0.5. 2 Additional limits for S: Al/Si < 1/3 and Si/(Al + Si + Mg + Ca + Ti + Fe) ≥ 0.5.
Table 2. Classification criteria for the supramicron particles analyzed in the RCMD samples on PC filters using the SEM-EDX routine detailed in [25]; the STD thresholds for Al are the same as those given in Table 1, and the MOD thresholds are those that were determined from Figure 5 for high PLD conditions.
ClassNormalized Atomic %Assumptions for Estimating Particle Mass
COAl (STD)Al (MOD)SiCaMgTiFeS:ISG
C≥75<29≤0.30≤0.425≤0.30≤0.41≤0.50≤0.06≤0.150.61.4
MC <0.35<0.475<0.35≤0.50≤0.50≤0.60≤0.600.61.4
AS ≥0.35≥0.475≥0.35 0.42.6
OS 1 ≥0.33 0.42.6
S 2 ≥0.33 0.72.7
CB<88>9 >0.50>0.50 0.72.7
HM >1.00>1.00 >1.00>1.000.75.0
1 Additional limits for OS: Si/(Al + Si + Mg + Ca + Ti + Fe) < 0.5. 2 Additional limits for S: Al/Si < 1/3 and Si/(Al + Si + Mg + Ca + Ti + Fe) ≥ 0.5.
Disclaimer/Publisher’s Note: The statements, opinions and data contained in all publications are solely those of the individual author(s) and contributor(s) and not of MDPI and/or the editor(s). MDPI and/or the editor(s) disclaim responsibility for any injury to people or property resulting from any ideas, methods, instructions or products referred to in the content.

