
Laser-Induced Breakdown Spectroscopy in Mineral Exploration and Ore Processing

Department of Marine, Earth, and Atmospheric Sciences, North Carolina State University, Raleigh, NC 27695, USA
Minerals 2024, 14(7), 731; https://doi.org/10.3390/min14070731 (registering DOI)
Submission received: 16 May 2024
/
Revised: 14 June 2024
/
Accepted: 9 July 2024
/
Published: 22 July 2024
(This article belongs to the Special Issue Understanding Geological Processes through Laser-Induced Breakdown Spectroscopy Analysis)
Abstract
:Laser-induced breakdown spectroscopy (LIBS) is a type of optical emission spectroscopy capable of rapid, simultaneous multi-element analysis. LIBS is effective for the analysis of atmospheric gases, geological fluids, and a broad spectrum of minerals, rocks, sediments, and soils both in and outside the traditional laboratory setting. With the recent introduction of commercial laboratory systems and handheld analyzers for use outside the laboratory for real-time in situ analysis in the field, LIBS is finding increasing application across the geosciences. This article first overviews the LIBS technique and then reviews its application in the domain of mineral exploration and ore processing, where LIBS offers some unique capabilities.
1. Introduction
Mineral commodities provide the foundation for the manufactured products of modern life, with 50 elements presently designated as critical by the USA [1]. Considered necessary for economic and national security, critical minerals are essential resources whose supply may be disrupted. Of particular current interest are those elements such as Li, Co, Ni, Cu, and the rare earth elements (REEs) that are necessary for the deployment of new green technologies that are necessary for the transition to a sustainable decarbonized future [2]. This situation has created an increased demand for these critical commodities and challenges to identify and develop new mineral resources at a time of ever-increasing discovery and extraction costs [3,4,5,6].
Mineral exploration is usually undertaken in sequential stages—target generation, prospect evaluation, and resource definition—with mining and ore processing following the successful location of an economic mineral deposit. Geological mapping, whether via remote sensing or on the ground, is the essential foundation for exploration, but geochemical analysis of rocks, sediments, and soils, together with their constituent minerals, is an important component of any mineral exploration program. Worldwide, well-established but lengthy and costly laboratory techniques for chemical analysis are employed by the mining industry for prospect evaluation and resource definition. Typically, this involves the identification of geochemical anomalies associated with mineralization and then defining the extent of these geochemical footprints through advanced statistical analysis and 3D visualization of huge analytical datasets [7,8,9,10]. Such datasets can be acquired from the analysis of surface samples and drill cores using sophisticated laboratory analytical instrumentation such as X-ray fluorescence spectrometry (XRF), optical emission spectroscopy (OES), laser-induced fluorescence (LIF), Raman spectroscopy (RS), vibrational spectroscopy (VS), inductively coupled laser ablation plasma mass spectrometry (LA-ICP-MS), secondary ion mass spectrometry (SIMS), and a suite of electron micro-beam techniques that can include energy-dispersive spectroscopy, wavelength-dispersive spectroscopy, and synchrotron micro-XRF. Typically occurring at a location remote from the area of active exploration, such laboratory analysis provides a rigorous approach to quantitative measurement of low-level elemental abundance. However, this situation requires extensive time, effort, and cost accrued from the in-field sample collection, transport, and subsequent off-site analysis. It also can involve a lengthy turnaround time for utilization of results that can create delay and potentially cause a disconnect between sample collection and drill target definition or mine operation decision making. Certainly, mineral exploration would benefit from new analytical tools and approaches to address the challenges of declining mineral reserves and increasing discovery costs, and ore processing operations could be made more efficient with in-line analytical systems.
During its first half-century, LIBS was an analytical technique primarily used in laser research laboratories to study the physics and chemistry of plasmas. This situation began to change in the late 1990s with the development of the first commercial benchtop LIBS systems and their application to the analysis of geological materials [11,12,13]. The recent commercial development in the mid-2010s of handheld LIBS analyzers [14,15] accelerated the use of LIBS across the geosciences. This review describes and illustrates how LIBS analysis is presently being used in the areas of mineral exploration and ore grade evaluation during processing, where it has a set of advantages that make it a particularly useful analytical tool for such applications.
2. Laser-Induced Breakdown Spectroscopy
LIBS is a type of atomic emission spectroscopy, a technique for chemical analysis that measures the intensity of light emitted from a flame, spark, electric arc, or plasma. It is a straightforward, reliable, and versatile technique with a wide-ranging capability for rapid and in situ elemental detection in any material (gas, liquid, or solid) with minimal sample preparation [16,17]. Every element has at least one optical emission line within the typical spectral range of 200–900 nm [18] covered by most commercial LIBS instruments. Thus, a single laser shot generates a broadband LIBS spectrum (Figure 1) that documents in real time the presence of all elements in a sample (Figure 2 and Figure 3) above their intrinsic limit of detection as determined by instrument design and the sample matrix.
LIBS analysis, whether undertaken with laboratory systems or using field-portable instruments, has broad application across the geosciences [20,21,22,23]. LIBS is highly sensitive to the lightest elements (i.e., H, He, Li, Be, B, C, N, O, Na, and Mg) that can be present in geomaterials at high concentrations but are difficult to measure by some other analytical techniques (e.g., XRF). LIBS can typically detect elements present in a sample down to μg/g abundance levels [17] to facilitate rapid multi-element compositional mapping at high spatial resolution. LIBS spectral analysis can be used to rapidly identify and discriminate unknown materials when used in conjunction with chemometric techniques and pre-established databases [24]. Quantitative analysis by LIBS is possible using an external calibration approach based on reference materials that are very closely matrix-matched to the type of samples being analyzed [25,26,27,28], and semi-empirical analysis is possible through internal calibration-free techniques [29,30].
2.1. LIBS Instrumentation
The four essential components of an LIBS instrument are (i) a laser, (ii) a set of focusing and light collection optics, (iii) a spectrometer/detector system, and (iv) a computer for operational control and data recording [19]. The most commonly utilized laser is a short-pulsed, Q-switched laser that quickly generates the large amount of energy needed to exceed the plasma generation threshold, cause material breakdown, and induce plasma formation. The time control system regulates the LIBS analytical sequence—the initiation of the laser pulse, the number of pulses fired, the interval between pulses, the beginning of plasma emission light capture, and the interval of signal acquisition. An optics system of mirrors and lenses tightly focuses the laser light onto the sample and then collects the resulting light emitted from the plasma. The detector/spectrometer system collects and spectrally separates the plasma light emission.
Initially created over half a century ago and primarily utilized during the following quarter-century by laser laboratories to study the physics and chemistry of plasmas, LIBS is still an emerging analytical technique within the geosciences. An inherent capability of LIBS is its versatility. The bespoke LIBS instrumentation typically used in laser laboratories for research can be assembled as required for specific experiments and variably configured as open-beam systems in which the laser is focused onto a sample in an unenclosed space. LIBS systems also have been developed for standoff analysis where the laser is targeted on a sample located at some distance from the detector/spectrometer, with the light emitted from the LIBS plasma collected by a telescope focused on the point of analysis. The most notable examples of such standoff LIBS systems are those for chemical analysis in the deep ocean by remotely operated vehicles [31,32,33] and the LIBS systems presently operating on Mars aboard NASA’s Curiosity and Perseverance rovers and the Chinese Zhurong rover [34,35,36] that are engaged in extraterrestrial geochemical analysis. Purpose-specific LIBS systems have been produced and implemented by the mining industry for online analysis and rapid processing and grading of ore [26,37,38,39,40,41] and ore slurry monitoring [42,43,44,45]. Laboratory benchtop LIBS instruments and handheld LIBS analyzers are presently being produced by multiple commercial manufacturers [15].
The introduction of field-portable instruments about two decades ago greatly facilitated on-site geochemical analysis in the field, at drilling locations, or in core storage facilities. However, both XRF analyzers and short-wavelength infrared spectrometers have technical limitations that restrict their detection ability. LIBS, which is the latest addition to this group of field-portable technologies, offers an unmatched capability for light element (Z < 13) analysis that can fill this gap.
2.2. LIBS Attributes
LIBS has a set of intrinsic characteristics that make it particularly useful for the analysis of geomedia including ore deposits (Table 1). All analytical techniques have certain limitations or disadvantages and LIBS is no exception. These must be understood and considered when undertaking LIBS analysis. The primary negative aspects of the LIBS technique are its shot-to-shot variability. Also, LIBS analysis is not entirely non-destructive as tens to hundreds of micrograms of a solid sample are removed from the surface of a solid sample during ablation.
Elemental limits of detection (LODs) for LIBS analysis are highly variable [17,46,47] (Figure 4) but have been steadily improving over the past two decades concomitant with technological progress in LIBS instrumentation. LODs for LIBS depend on the element being analyzed, the type and physical characteristics of the sample, the LIBS instrument, and the conditions of the analysis. LODs obtained with laboratory LIBS instruments are lower than those for field-portable analyzers because laser power and other instrumental operating parameters can be adjusted and precisely controlled to optimize the analysis for the specific type of sample being analyzed. LODs and levels of precision for LIBS analysis, typically at the tens of ppm level and 5 to 20% RSD, respectively, are not as good as some other methods used for geomedia analysis. Some elements with low ionization potentials (e.g., Li,) have quite low LODs, whereas elements with high ionization potentials (e.g., F, Cl, and S) have much higher LODs. Emission intensities can be enhanced through analysis in an inert atmosphere of He or Ar that confines the plasma.
The shot-to-shot variability inherent in LIBS analysis derives from multiple causes. The most important among these are sample inhomogeneity, the uneven distribution of energy within the pulses from one laser shot to the next of nanosecond lasers used in commercial LIBS systems and handheld analyzers, plasma heterogeneity resulting from the complex non-linear processes involved in the coupling of the laser with the sample matrix to produce a plasma, instabilities and self-absorption within the plasma, and matrix effects [16,48]. Ensemble averaging [49] or data normalization with respect to the emission intensity of a line associated with a major component [50] can ameliorate the shot-to-shot variability that is inherent in LIBS analysis.
2.3. Self-Absorption
Self-absorption occurs when a portion of the light emitted by an element in LIBS plasma is absorbed by that element in another part of the plasma to diminish the light intensity signal reaching the detector [16]. When self-absorption is negligible, as is the usual situation in the case of a trace or minor element in a geological sample, a linear relationship will be obtained between element concentration and measured emission intensity. However, self-absorption can occur when element abundances in a sample are high, but its effect can be mitigated by avoiding use of the most intense emission line for an element and instead using lower intensity lines (e.g., selecting the 422.7 or 445.8 nm emission lines when analyzing Ca-bearing minerals instead of the primary emission lines at 393.4 or 396.8 nm in order to reduce the probability that a photon emitted by a Ca atom or ion in the hot center of the plasma will be reabsorbed by another Ca atom or ion on its cooler periphery before exiting the plasma).
2.4. Matrix Effects
Both the chemical composition of a material and its physical character can affect the LIBS emission such that peak areas measured for an element in the LIBS spectrum are not proportional to element concentrations in the sample [48]. It is essential to limit such matrix effects for quantitative LIBS analysis, and chemometric techniques can be helpful in this regard.
Chemical matrix effects happen when an element in the LIBS plasma influences the emission behavior of one or more elements. An element of low ionization potential will inhibit the emission behavior of other elements in the plasma since the more readily ionizable species will increase the density of the plasma and consequently diminish the abundance of other ionic species [51]. Also, the easily ionizable element will enhance the electron concentration and increase electron–ion recombination to produce a greater number of neutral species in the plasma [52]. Also, different LIBS emission intensities will be observed for an element present in equal concentration in two different host materials [53]. This makes it necessary to find matrix-matched standards with which to perform quantitative LIBS analysis of natural samples. However, it should be noted that chemical matrix effects can impart unique signatures to LIBS spectra, thus contributing constructively to the spectral uniqueness needed for material discrimination.
Physical matrix effects are an unavoidable consequence of the variable surface character of natural geological materials. The surface texture and roughness, hardness, grain size, porosity, degree of induration or crystallinity, absorptivity and thermal conductivity, and optical transmissibility and reflectivity together will determine the amount of mass ablated by an incident laser pulse. For example, it is well documented that the roughness of the material surface will influence the magnitude of laser energy coupling with the surface and resultant intensity of the LIBS signal generated [20,54,55]. The effects of such physical inhomogeneities can be diminished by sampling with hundreds or even thousands of laser pulses.
2.5. Chemometrics in LIBS
As a spectroscopic technique, LIBS is affected by fluctuations in signal intensity that have to be addressed for meaningful analysis. The most common means of achieving this is to acquire 10 s, 100 s, or even 1000 s of LIBS spectra for a single sample analysis. Also, the processing of LIBS data through chemometrics is particularly useful because broadband emission spectra are highly complex and can be non-linear as a consequence of the factors influencing the plasma emission mentioned above that include differential laser–material coupling, differential self-absorption of strong lines, and matrix effects. The simultaneous consideration of multiple variables using chemometric analysis provides advantages that include noise reduction, the identification of outlier analyses, amelioration of spectral interferences and matrix effects, and the development of calibrations.
Chemometric methods are used in LIBS analysis spectral pre-processing, signal analysis, and quantification as well as for subsequent data analysis and interpretation [56,57,58]. The use of chemometrics is particularly helpful in the processing of the ultralarge datasets generated by LIBS imaging [59,60,61,62,63]. Chemometric analysis facilitates extraction of the maximum amount of information from a spectral dataset. Multivariate statistical analysis is a means of using all chemical information contained in a LIBS spectrum, instead of only that contained in a limited portion of it, and then relating this spectral information to the composition of a sample for identification and discrimination. Additionally, multivariate methods have been used to create novel approaches to semi-quantitative and quantitative analysis beyond the traditional univariate approach discussed here.
LIBS spectral pre-processing is an essential part of LIBS analysis. This can be especially helpful in ameliorating the consequences of variations in plasma emission intensity that arise from shot-to-shot fluctuations in laser–material coupling, baseline drift, differences in spectrometer resolution, spectral interferences, and background from the continuum emission that may be of significant magnitude. Besides wavelength calibration and denoising, Sobron et al. [63] describe a five-step sequential procedure for the pre-processing of LIBS spectra that consists of baseline correction, normalization, outlier rejection, spectral averaging, and resolution enhancement to separate overlapping peaks (Figure 5). Such pre-processing will minimize the influences of both variable experimental conditions and physical matrix effects, thus providing suitable spectra for quantification or other applications. Once an LIBS dataset has been appropriately pre-processed, it can be treated by chemometric techniques for other applications such sample classification and discrimination [64,65] or quantitative analysis [66,67].
2.6. LIBS Imaging
Another capability of LIBS, whether using laboratory LIBS systems or handheld analyzers, is its capability for rapid multi-element compositional mapping at high spatial resolution [68,69], which can be can be either qualitative or quantitative in character. The ability to visualize major and minor element distributions in a sample can reveal mineral compositions, complex structures, paragenesis, mineral growth history, etc. [70,71]. Exceptionally fast and highly spatially resolved laboratory techniques have been developed for the compositional imaging of geological samples. Scanning at kHz laser repetition rates at <50 μm spatial resolution has been demonstrated in the laboratory [25,72,73], while compositional imaging at a spatial resolution of 100–200 μm across a ~2 mm domain is possible using handheld LIBS analyzers [19,74].
As described by Motto-Ros et al. [75], the operational practice in LIBS imaging is to generate the plasma at different positions on a sample surface by rastering the laser light across a pre-defined spatial grid and then using real-time computer processing of each spectrum to extract the compositional information of interest that is then used to construct maps of elemental composition across the scanned domain. Typically, such images are displayed as false-color heat maps in which red and yellow colors denote high elemental abundances and green, blue, and violet colors indicate low abundances. The capability of megapixel LIBS imaging to discern both the distribution of minerals and elements in a sample simultaneously with high sensitivity at microscopic-scale resolution has been impressively demonstrated by the 2D and 3D compositional mapping of an ore sample from the Mountain Pass REE deposit in California, USA (Figure 6a), by Chirinos et al. [76] and through analysis of a specimen from the Nishâpûr turquoise deposit in Iran (Figure 6b) by Moncayo et al. [77].
Fabre et al. [78] created a data treatment methodology designed specifically for megapixel LIBS imaging of multi-phase geomaterials and then applied this approach to a hydrothermal ore sample from the Tighza mine in Morocco. The sample contained a complex paragenesis of sulfide ore minerals—galena [PbS], sphalerite [Zn,FeS], chalcopyrite [CuFeS2] and pyrite—within in a gangue of quartz and carbonates: calcite [CaCO3], siderite [FeCO3] and/or ankerite [Ca(Fe,Mg,Mn)(CO3)2]. The polished surface of the ore sample was interrogated at a spatial resolution of 15 μm to generate more than 2 million individual LIBS spectra across an area of ~5 cm2 (i.e., 1900 × 1100 pixels). This imaging (Figure 7) permitted the recognition of Ag, Sb, and Bi in galena; Sn in chalcopyrite; Cd in sphalerite; and Be and Al in quartz as well as the detection of Y and the light REE La in the carbonate host.
More recently, Alvarez-Llamas et al. [73] demonstrated LIBS analysis of a Li-bearing aplite pegmatite in western Europe using a kHz-µLIBS system with the capability to rapidly scan tens of cm2 areas at a high lateral resolution < 20 µm to generate compositional images containing 106 pixels (Figure 8). The high-spatial-resolution LIBS system used in this study was able to detect elements in tiny regions of interest at the tens of micron spatial scale level of only a few pixels in size. This capability facilitated the identification of tiny constituents whose element concentrations in the bulk sample are usually insignificant and would not be detectable using conventional LIBS analysis but provide unique petrochemical information for more comprehensive geological characterization and the formulation of petrogenetic models.
Demonstrating a similar approach of direct, rapid, and qualitative imaging of rocks and minerals by handheld LIBS at a spatial resolution of 200 μm, Lawley et al. [71] analyzed 3 mm× 3 mm areas on drill core surfaces of mantle xenoliths from kimberlites near Nunavut (Canada). Open-source machine learning tools were applied to the LIBS spectral data and then processed to generate feature-of-interest maps on which the primary mantle mineralogy of olivine [(Mg,Fe)2SiO4] and orthopyroxene [(Mg,Fe)2Si2O6] could be distinguished from a variety of metasomatic and alteration features that included Cr-diopside [CaMgSi2O6], cryptocrystalline kelyphite alteration rims on pyrope garnet [Mg3Al2(SiO4)3], and calcite veinlets (Figure 9). These results confirmed that the resolution of geochemical imaging by handheld LIBS was sufficient to define veinlets and grain boundaries lined with metasomatic minerals.
2.7. Qualitative and Quantitative LIBS
The most basic capability of LIBS is elemental detection. Since all elements have emission lines in the wavelength region between 200 and 900 nm [18] and because emission intensity is proportional to elemental abundance in the plasma, recording the position and intensity of characteristic wavelengths in an LIBS spectrum provides information on both the chemical species present in a sample and their concentration.
An element in any type of material can be detected by the presence of its atomic, ionic, or molecular emission lines in an LIBS spectrum (e.g., Figure 1, Figure 6a and Figure 7b). Additionally, all of the compositional information present in the entire broadband LIBS emission spectrum can be considered a geochemical fingerprint based on the premise that samples of different composition will generate a unique LIBS spectral signature [79,80] that can be used for applications such as the discrimination of minerals or rocks of similar bulk composition [81], stratigraphic correlation [82,83,84], and mineral or rock provenance discrimination [84,85,86,87].
LIBS can generate accurate and reliable quantitative analyses through a standard calibration approach, if the matrix being analyzed remains constant and all instrumental parameters are controlled and unchanged during the course of an analytical exercise. Using the calibration curve approach, the elemental abundances for a sample set can be determined through comparison of LIBS emission intensities recorded for a sample compared to the intensity–concentration relationships observed for set of standards over the expected concentration range of the unknown samples. The calibration curve directly relates the measured intensity of the peak area in the LIBS spectrum, resulting from the mass of ablated sample in the plasma, to standards of known composition measured under the same analytical conditions. As illustrated in Figure 10 from Pochon et al. [88], robust calibration curves can be created through the choice of appropriate emission lines and the use of linear or quadratic regression models.
The calibration-free LIBS method [29,30] is a conceptually different approach created to address the sample matrix issue. The premise for the CF-LIBS procedure is that the condition of local thermodynamic equilibrium is established everywhere within LIBS plasma. This permits calculation of the plasma internal characteristics from which the elemental composition of the sample can then be determined [89]. This procedure, which is capable of generating a semi-quantitative analysis without calibration standards, has been recently reviewed by [90] and is not discussed further here.
3. LIBS in Mineral Exploration and Ore Processing
The mining industry needs to measure the composition of rocks and minerals during both exploration and evaluation drilling as well as during ore extraction and processing. One factor determining the efficiency of surface mining operations is the time taken for compositional monitoring to measure ore grade during extraction and initial processing. Typically, samples are collected at the mining site, transported to a central facility on- or off-site, and analyzed in a laboratory using instrumentation requiring laborious and time-consuming sample preparation and analytical procedures, and the results are finally transmitted back to the mining site for action. LIBS has the potential to radically change this complex multi-stage process for management of the exploration, extraction, and evaluation processes.
Particularly important features of LIBS analysis in the context of mineral exploration and ore processing are its capabilities for (i) real-time chemical analysis in the field with little or no sample preparation [19], (ii) in situ analysis at spatial scales down to ~10 μm [71,88,91,92], (iii) analysis of thin crusts, coatings, or surface alterations without substrate interference [74,93], (iv) rapid and highly spatially resolved megapixel hyperspectral imaging of chemically zoned rocks, minerals, and mineralogically complex samples [58,61,94,95,96,97,98], (v) downhole compositional interrogation [99,100] (Figure 11) and drill core characterization [72,98,99,100,101,102,103,104,105,106], and (vi) online slurry monitoring during ore processing [42,43,44,107,108,109,110,111,112,113,114,115,116]. Stratigraphic analysis at a single point on a sample is also possible by depth profiling, as sequential ablation progressively bores down into a sample with successive laser pulses [19,76,92,117,118].
LIBS is a versatile technique that can be used in mineral exploration and ore processing to address any of the five typical use cases commonly presented to users of spectroscopy and spectrometry [119]:
- (i)
- Detection—Is an element of interest present in this sample?
- (ii)
- Identification—What is this sample?
- (iii)
- Confirmation—Is this sample attribution correct?
- (iv)
- Classification—What assemblage does this sample belong to?
- (v)
- Quantification—What is the concentration an element in this sample?
There is broad potential for LIBS use in mineral exploration and ore processing. During a field exploration campaign, analysis by handheld LIBS can rapidly identify and quantify elements of economic importance that are not able to be recognized by other techniques and can be used for on-site analysis of pathfinder minerals. It can also provide the micro-scale analysis necessary to understand elemental distribution and complex mineral parageneses in a set of samples. LIBS systems can be developed for quality control during ore processing. More broadly, LIBS analysis can be employed as a tool that can facilitate prospect evaluation and expedite management decision making.
LIBS use in mineral exploration and ore processing has been continuously growing since the first iron ore analysis in 1991 [120] and the development a decade later of a method for real-time automated quantitative analysis of mineral ores [26]. As noted in the recent review paper of Fabre [22], the study of ore deposits and their evaluation for exploitation has been both one of the most challenging and active areas of LIBS applications over the past quarter century, with the literature now exceeding 160 peer-reviewed publications (Figure 12). The sections that follow describe and illustrate the different applications of LIBS that have been applied across this domain.
3.1. Lithium
Lithium is a metal in widespread use across the modern industrial world [121]. For example, Li is used in the production of alloys, glass, lubricants, desiccants, and pharmaceuticals as well as being necessary for many chemical processing and manufacturing processes. Li is also central to the manufacture of the Li-ion batteries used in energy storage systems, the batteries that power electric vehicles, and those present in most modern electronic devices. Lithium does not occur naturally as a native element, with its current production coming from three different sources, natural brines, sedimentary lakebed deposits, and granite-associated pegmatites [122,123,124].
The recent development of commercial handheld LIBS analyzers together with the increase in global demand for Li in the context of the transition to a low-carbon economy have stimulated the application of LIBS as a field analytical tool, particularly for Li-pegmatite exploration and resource evaluation [19,27,71,97,125,126,127,128,129,130,131]. Studies of Li-pegmatite fields in North Carolina and Maine (USA) have described how the Li-K/Rb systematics of mica (Figure 13) can be used as a monitor of pegmatite fractionation [19,129,131]. This approach to identifying fractionated pegmatites can be used by exploration geologists to rapidly identify mineralized pegmatites in the field using a handheld LIBS analyzer. It has potential to be a pathfinder for buried Li mineralization through analysis of detrital mica or soil, as both Li content and K/Rb ratio can be calculated in real time from a single LIBS mica analysis by the on-board software of the handheld analyzer.
Müller and Meima [61] have illustrated how laboratory LIBS analysis can be used to identify minerals in Li-bearing pegmatites (Figure 14). Multiple drill cores from the Rapasaari lithium deposit in the Kaustinen Pegmatite Province (Finland) with bulk Li2O between 1 and 1.5 wt.% were analyzed with a prototype LIBS scanning system. A set of samples of known mineralogy was used to train linear discriminant analysis and vector machine classifiers, with primary and accessory pegmatite minerals effectively separated from unknown material through LIBS spatial mapping. The number of training samples was increased through an automated self-learning procedure that decreased the number of unknowns resulting from physical matrix effects within coherent crystals. The classification model achieved reliable results for the LIBS drill core analysis, successfully identifying both known aspects and three types of unknowns—single pixels inside of large mineral crystals wrongly classified as unknown due to physical matrix effects, mixed spectra at transition zones between two or more different minerals, minerals not represented by the training set, and holes. Rifai [127] described an ultra-fast system for LIBS analysis for compositional characterization of Li-pegmatite ore during processing. A commercial LIBS system for drill core analysis equipped with a 3D laser profiling system to ensure optimal sample positioning at the focal plane within a distance of <30 μm precision was utilized for automated LIBS analysis. Ore samples containing 0.01 to 1.5 wt. % Li from the pegmatite lithium deposit at Pilbara (Australia) were crushed to a size between 0.1 and 10 mm. Analyzed without any sample preparation, a good correlation was observed between Li concentrations obtained by ICP–AES and those observed from the automated LIBS analysis. Repeatability reported in terms of relative standard deviation was less than 15% for the crushed samples having a Li abundance > 0.6%, which meets the industrial processing limit in terms of accuracy at the ore cut-off grade. That the results were obtained in conditions simulating an LIBS analyzer installed over a conveyor belt for continuous ore grade monitoring is an important step toward industrial utilization.
3.2. Beryllium
Beryllium is an element with unique chemical properties that make it a critical metal indispensable to the computer, telecommunication, aerospace, medical, defense, and nuclear industries [132]. Commercially viable quantities of the Be ores beryl and/or bertrandite [Be4Si2O7(OH)2] are present in only three countries—the USA, Kazakhstan, and China. Beryl (~4% Be), which in its very pure crystalline form is known as the gemstones blue-green aquamarine and green emerald, is the principal mineral mined for beryllium worldwide except in the USA, where bertrandite (<1% Be) is the principal mineral mined for beryllium.
The gem forms of beryl, which can be chemically complex and compositionally highly variable, occur in many different geologic settings worldwide. Coupled ionic substitution is common in beryl, with Li+ substituting for Be2+; Mg2+, Fe2+, Fe3+, Mn2+, Cr3+, V3+, and Ti4+ substituting for Al3+; and Be2+ or Al3+ substituting for Si4+. Additionally, the alkali cations Na+, K+, Cs+, and Rb+ can be incorporated into its structure. Pure beryl is colorless, but the diverse range of trace elements able to enter the mineral structure produce gemstones of different color. LIBS analysis can be useful in determining beryl provenance and understanding the geological history of beryl deposits.
McMillan et al. [53] acquired broadband LIBS spectra for almost a hundred beryls and demonstrated provenance attribution with a high degree of success. A subsequent study by McManus et al. [133] observed a broad compositional similarity in beryls from pegmatites across the Maine, New Hampshire, and Connecticut region (northeastern USA) that had the same origin and geological history. In a detailed examination of the Palermo pegmatite in Maine, it was observed that beryl from the core margin was compositionally distinct from that in the intermediate and core zones which it physically separates. As principal component analysis indicated that the composition of the core margin was dominated by elements soluble in groundwater (Ca, Sr, Ba, Li), it was postulated that this portion of pegmatite formed late in the solidification history of the pegmatite after prior crystallization of the core and intermediate zones. Interestingly, LIBS analyses were observed to be insensitive as to whether the samples were the morganite (pink), heliodor (yellow), aquamarine (blue), or goshenite (colorless) variety of beryl. This is because the color in minerals can be caused as much by crystal lattice defects as it is by elemental chromophores and because the common beryl chromophores are transition metals (Ti, V, Cr, Mn, Fe) that do not generate as intense LIBS spectral peaks as the alkali and alkali earth elements Ca, Ni, and Li, so that a LIBS spectrum for beryl can be dominated by non-color-producing elements.
3.3. Carbon
Diamond is the high-temperature and high-pressure form of pure carbon. It is the hardest, least compressible, and stiffest of known materials and is also the best thermal conductor, is one of the few materials with a negative electron work function, is chemically inert to most acids and alkalis, has a high index of refraction, and is transparent from the deep ultraviolet through the visible to the far infrared portions of the electromagnetic spectrum. Thus, in addition to its historic use as a gemstone in jewelry, diamond that does not meet gem-quality standards for color, clarity, size, or shape has historic use principally as an abrasive, but today has a myriad of uses in the electronics, automotive, and medical industries [134].
Since the pioneering work by Gurney in the 1970s [135], pyrope garnet [Mg3Al2(SiO4)3] and clinopyroxene [Ca(Mg,Fe)Si2O6] have been used as pathfinder minerals in diamond kimberlite exploration, with the Cr-rich variety of these minerals associated with diamondiferous kimberlites. Harmon et al. [81] used chemometric analysis of broadband spectra acquired by handheld LIBS to illustrate how kimberlite garnets could be discriminated from other types of garnet and to distinguish different South African kimberlite localities (Figure 15). Other examples of geomaterial provenance determination by LIBS have been described in recent review papers by Fabre [22] and Harmon and Senesi [23].
Geological materials illicitly mined or sold in conditions of armed conflict and human rights abuse are known as conflict minerals. Diamond is the foremost conflict mineral, with the illicit sale of diamonds used by rebels engaged in armed struggles against legitimate governments having funded wars and refugee crises across eastern Africa over the past three decades. It has been estimated that up to 20% of the total diamond supply entering the commercial marketplace during the 1990s was conflict diamonds [136]. Thus, there has been a strong interest over the past decade in ways to identify and validate diamond sources so that legitimate sources can be distinguished from illicit ones.
McManus et al. [137] postulated that it might be possible the distinguish diamond sources based upon differences in the C-C and C-N molecular structure of an LIBS spectrum. A total of 2310 single-shot spectra were acquired by laboratory LIBS analysis for 30 diamonds from each of eight natural locations as well 30 diamonds from each of two manufacturers of synthetic diamonds, and a Bayesian model was used to compare each LIBS spectrum to the group average for each source based on the Euclidian distance between spectra. Then, the probability of a spectrum belonging to each group was calculated and the spectrum was assigned to the group of highest probability, with a success rate of 94 to 100%. A follow-on study [138] demonstrated that the mine of origin could be identified at >95% accuracy and that LIBS analysis could distinguish between natural and synthetic diamonds as well as by manufacturing method in different laboratories. These studies demonstrate the potential for LIBS use in diamond certification, as the LIBS analysis uses a unique signal produced from within the diamond structure. It is also worth noting that the general LIBS approach described here for distinguishing real from synthetic diamonds can also be applied to other synthetic and secondarily treated gem minerals [139,140].
3.4. Fluorine
The primary use of fluorine is to produce hydrofluoric acid, the feedstock for numerous organic and inorganic chemical compounds. Other uses include production of the UF6 and SF6, respectively, employed by the nuclear power industry for U isotope separation and as an insulating gas for high-power electricity transformers. It is also the source for a variety of industrial fluorochemicals [141]. The primary source of fluorine is the mineral fluorite [CaF2], with global production dominated by South Africa, Mexico, China, Mongolia, and Russia [142]. Typically, fluorite is a by-product of the mining and processing of fluorite-bearing metallic ore skarns by a froth flotation process. This methodology requires accurate knowledge of the F content in the ore feedstock, which is difficult and time-consuming to determine by conventional techniques.
Fluorine is a non-metallic element of low ionization energy that is difficult to analyze by LIBS because its strong emission lines are in the VUV spectral range between 110 and 190 nm. However, it can be measured using the CaF molecular bands in LIBS emission spectra. Quarles et al. [143] demonstrated LIBS analysis of fluorine for an REE ore containing bastnäsite, and the mass content of F in powdered fluorite ores was measured by Álvarez et al. [144]. Tang et al. [145] described the LIBS analysis of F in copper ore, which is of concern as a harmful element during smelting. A handheld LIBS analyzer was used by Foucaud et al. [146] to quantify the F content of rock samples from the tungsten ore deposit at Tabuaço (Portugal) that contains fluorite, scheelite [CaWO4], and a variety of silicate minerals using two CaF molecular bands located between 529 and 543 nm and between 590 and 606 nm and non-linear calibration models. This LIBS method avoids the tedious and costly analytical procedures presently employed in the mining industry for quantitative fluorine analysis.
3.5. Aluminum, Phosphorus, Sulfur, and Calcium
Bauxite, the primary ore for aluminum, is formed through weathering of Al-rich rocks to produce Al-rich oxide minerals that are low in alkalis, alkaline earths, and silica [147]. Fahad et al. [148] quantified the elemental content of bauxite ore using LIBS and, in a study of drill core through the karst bauxite deposits near Villeveyrac (France), Miema et al. [149] used LIBS analysis to recognize the major facies—black shale, marl, red bauxite, and basal limestone. LIBS spectra for the black shale facies were dominated by Fe emission lines with a significant presence of Al, Ca, and S emission lines. Ca emission lines dominated the marl horizon, with emission lines for Al, Fe, and Ti also present. Spectra for the basal carbonate horizon were dominated by just Ca emission lines. By contrast Al, Ti, and Fe emission lines dominated the spectra of the red bauxite unit, with the bauxite–shale boundary recognized by the sudden decrease in Ca and increase in Al emission intensities and the bauxite/karst boundary documented by a sharp increase in Ca and decrease in Al emission intensities.
The largest use of phosphorus compounds is in the production of the phosphoric acid to produce fertilizers and industrial chemicals. Phosphorus is also important in the production of steel, for the P-based negative electrodes in Li-ion batteries, and for its use in anticorrosion agents, cosmetics, fungicides, insecticides, food preservatives, pharmaceuticals, ceramics, and water treatment [150]. The primary sources of industrial phosphorus are marine phosphate rock and guano. There is a need for compositional monitoring during phosphate ore extraction process, as the most commonly used methods are cumbersome and time-consuming laboratory techniques that are expensive to implement.
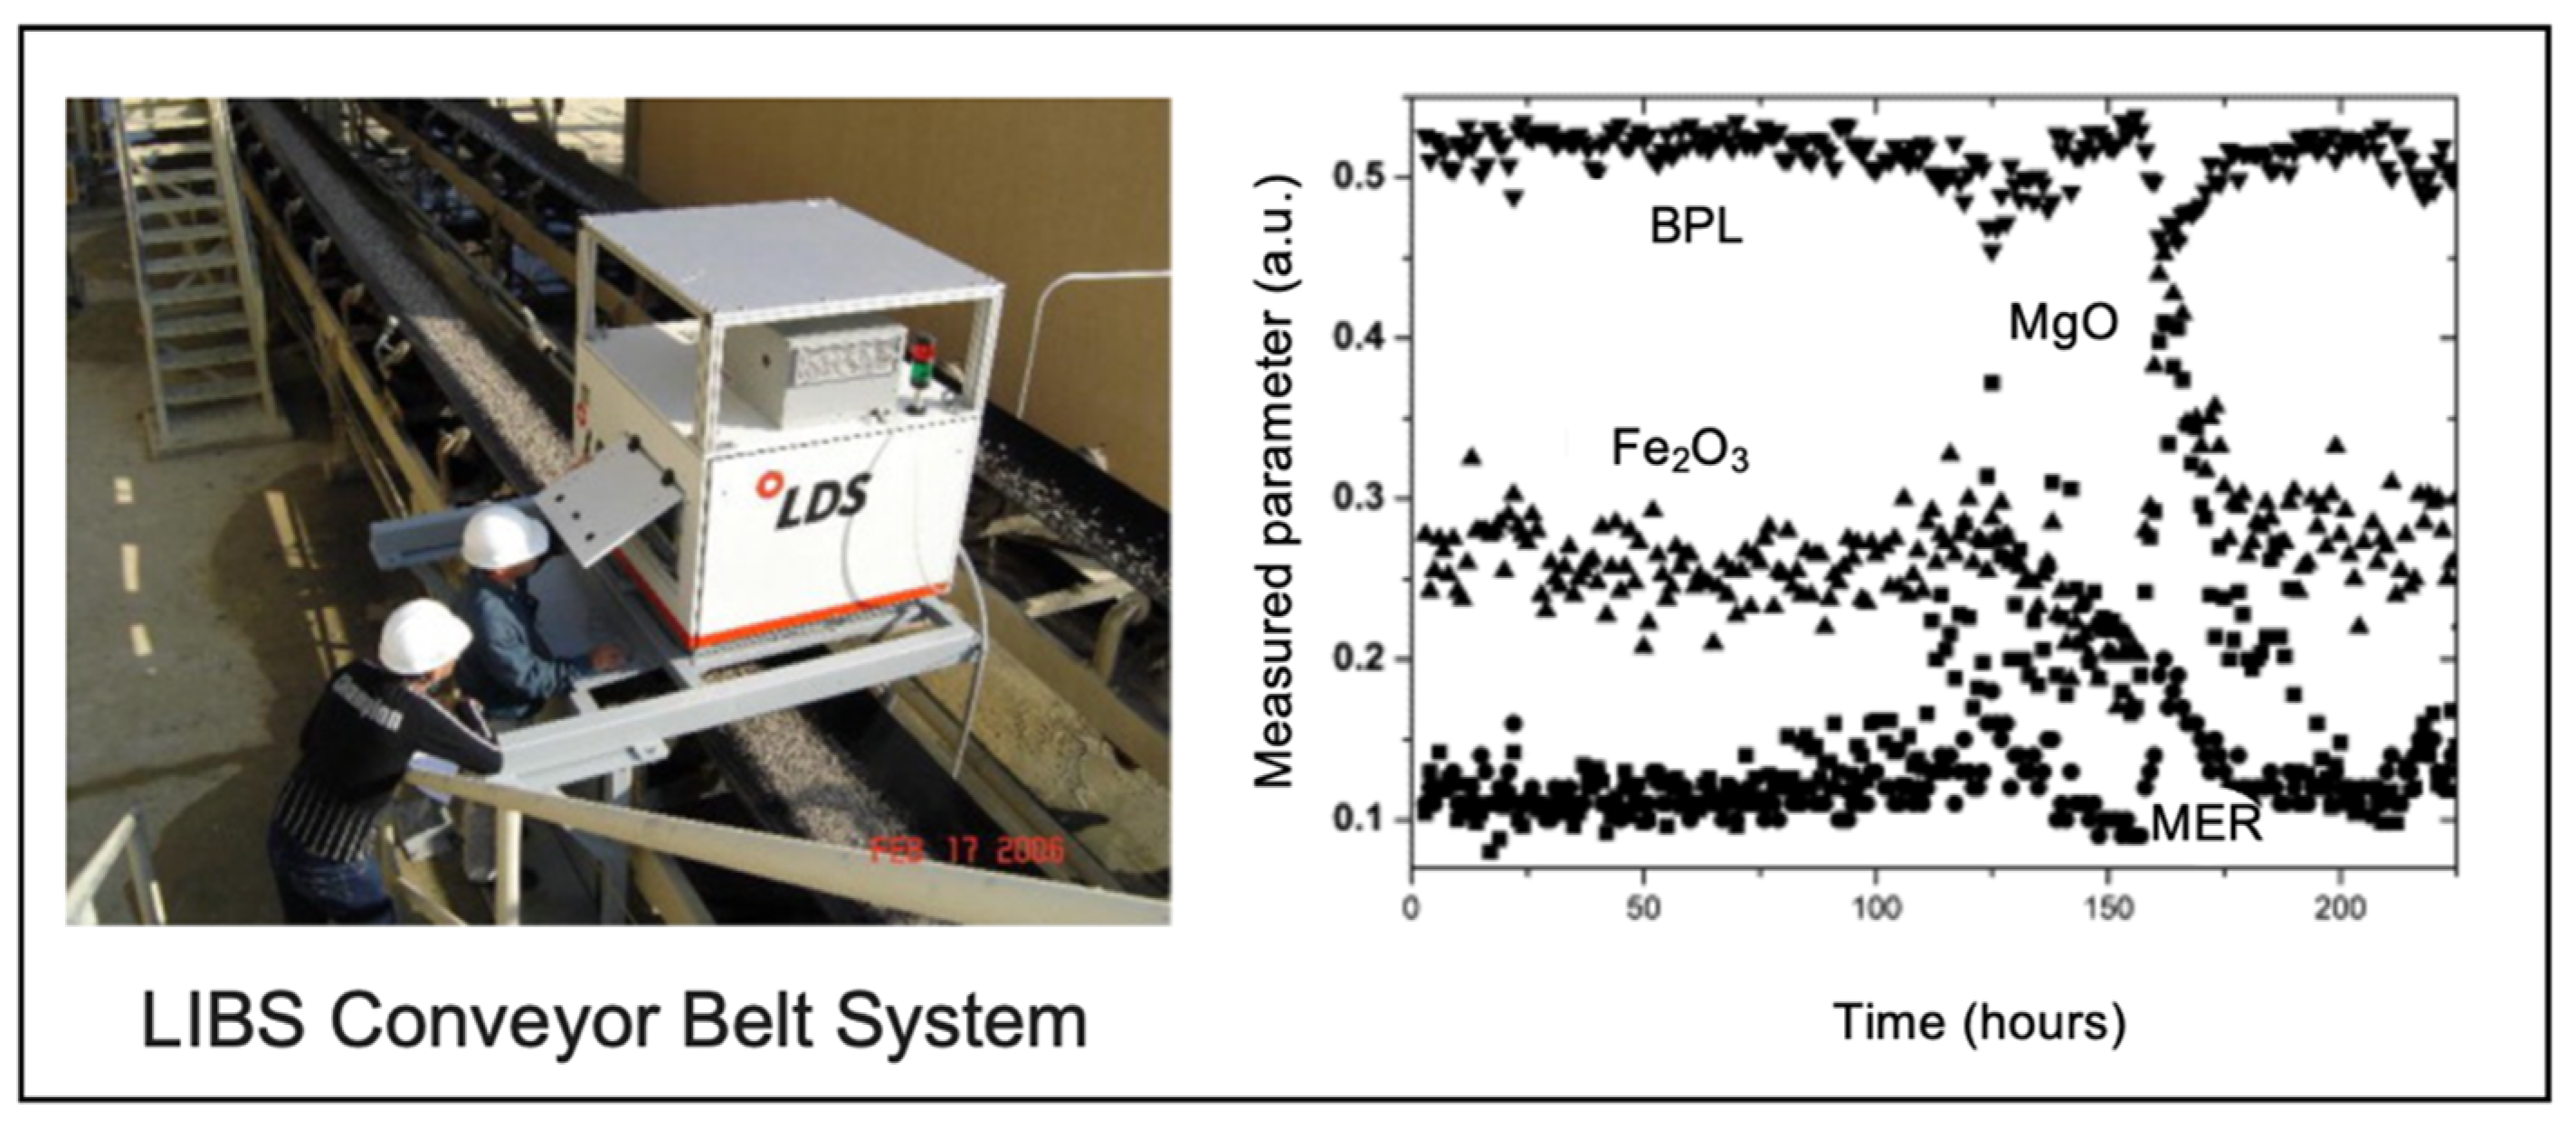
Rosenwasser et al. [26] developed a field-portable LIBS system for the analysis of phosphate ore that was demonstrated on-site for ore grading in an open-pit phosphate mine in Idaho (USA). Excellent calibrations were achieved, with relative standard deviations for analysis of P, Al, Ca, and Si in pressed pellets of ore material ranging between 2 and 4%. Subsequently, Asimellis et al. [151] described an LIBS method for on-site ore evaluation at a phosphate mining and beneficiation operation in Queensland (Australia). The P/Si ratio for each laser shot on unprocessed ore was calculated in real time early in the production process to separate high-silica components prior to beneficiation. The collophane mudstone, friable phosphorite, phosphatic siltstone, and indurated phosphorite of the ore group of lithologies had P/Si ratios > 1, whereas P/Si ratios for the siliceous phosphatic siltstone and chert, shale, coquina shellbed, and footwall siltstone of the non-ore group were <0.5. As illustrated in Figure 16, automated LIBS analysis systems also have been developed and applied to phosphate ore for online multi-element analysis of raw ores under field conditions [26,152,153], and the analysis of phosphate ore slurries has also been undertaken [154,155,156].
Sulfur is the leading source for the production of sulfuric acid, the world’s most used chemical, which is used in the manufacture of fertilizer, non-ferrous metals, synthetic rubbers, pigments, pharmaceuticals, and cosmetics [157]. Gaft et al. [158] investigated LIBS analysis of S in selected geomedia, demonstrating success with its determination in Cu and Ni ores, barite, gypsum [CaSO4·2H2O], and anhydrite [CaSO4].
Figure 16.
Automated LIBS system for real-time production line analysis, modified from [158]. (left) LIBS system installed and operating on a moving belt conveyer at an open-pit phosphate mine in Florida (USA). (right) LIBS measurements of MgO (■), Fe2O3 (▲), percentage bone phosphate lime, BPL (▼), and metal equivalent ratio, MER (●) as functions of time during a continuous operation over five days. Two different rock compositions were observed as documented by the changing values of MgO, Fe2O3, BPL, and MER. Such real-time recognition of unsuitable material by LIBS enables its removal from the conveyer before ore processing.
Lime deposits are another economic resource with important industrial uses, particularly in the metallurgy and construction industries and for flue gas desulfurization and water treatment [159]. Limestone is used as a raw material by the metallurgical, chemical, agriculture, manufacturing, and construction industries [160] where its usefulness for particular applications depends on its mineralogical characteristic and purity. Fahad et al. [161] described an LIBS calibration method for the quantitative measurement of Ca, Si, and Mg in quartz-bearing limestones, and Agresti et al. [162] developed a versatile portable LIBS system for characterizing the calcareous materials used in the lime industry that can be deployed as either a field-portable analyzer or a tabletop analytical instrument. LIBS analysis of samples from lime production quarries was undertaken to illustrate how LIBS analysis could be used to grade limestone and magnesian limestone, quantify their impurities, and perform the other quality controls that occur along the lime production chain.
3.6. Transition Metals
The transition metals—elements located in the middle of the periodic table that are variously characterized by multiple oxidation states, high melting and boiling points, high density and hardness, and/or strong conduction of heat and electricity—are widely utilized throughout both the traditional and modern industrial sectors. In addition to their use in steelmaking and metallurgy, other applications include their use as catalysts for industrial processes and chemical synthesis, in batteries and magnets, for galvanization, as colorants in paints and pigments, and in a variety of medical uses [163].
As might be expected, the grading of Fe ore has been the most widespread application of LIBS in ore processing. Starting with the initial studies by Grant et al. more than 30 years ago [121,164], much subsequent work has been directed towards quantitative compositional analysis of Fe ore, both in general and in site-specific contexts, in some instances in the laboratory [37,165,166,167,168,169,170,171] but also online during ore processing [42,116,120]. Other studies have investigated the classification of iron ore [172,173,174]. LIBS analyses of chromite and manganese ores have also been reported [106,175,176].
The eight different types of poly-elemental and poly-mineralogic hydrothermal base-metal sulfide deposits described by Sangster [177] are an important source of the transition metals Cu, Pb, and Zn. LIBS analysis has been applied to the characterization of such deposits over the past two decades, beginning with the work of Kaski et al. [91], who first demonstrated the identification of sulfide minerals in rock samples and then estimated the mineral distribution in a sulfide-bearing drill core (Figure 17) using reference spectra of pyrite, pyrrhotite [Fe(1−x)S], chalcopyrite, sphalerite, barite, calcite, and dolomite [CaMg(CO3)2] using a linear fitting procedure.
Haavisto et al. [38] investigated the potential of LIBS for online analysis of a Au-mineralized drill core from a mine in northern Finland, where Au was present primarily in the sulfide minerals pyrite and arsenopyrite [AsFeS2] but also contained within the carbonates, graphite, and silicates of the ore matrix. Elemental abundances measured by LIBS corresponded well to laboratory assay. Some recent studies have applied LIBS analysis to metal element quantification and trace element imaging in different base-metal deposits [60,178,179,180,181,182,183,184,185], whereas others with an ore-processing focus have used LIBS for the analysis of the ore concentrates produced during base-metal deposit mining operations [186,187,188,189,190,191].
Álvarez et al. [59] used chemometric analysis of laboratory-acquired LIBS spectral analysis to identify seven Cu-bearing sulfide minerals—bornite [Cu5FeS4], chalcocite [Cu2S], chalcopyrite, covellite [CuS], enargite [Cu3AsS4], molybdenite [MoS2], and pyrite—in unprocessed sulfide ores samples from different mine localities in Peru and Chile (Figure 18). The application of four chemometric models to LIBS broadband spectra achieved average classification accuracies between 96 and 100%. The best algorithm for predicting Cu-sulfide mineral species was a non-linear artificial neural network classifier, with very similar Cu-sulfide species such as bornite/chalcopyrite and chalcocite/covellite correctly identified. This study also examined and mapped the 3D arrangement primary metal phases and accessory minerals, illustrating how LIBS micro-imaging could be used for the identification of minerals and understanding their distribution in base-metal deposits. Subsequently, Veláquez et al. [184] described an analytical workflow for spectrum normalization, feature selection, and stratified data division to improve quantification for Cu ore analysis by LIBS. The normalization involves using an internal standard for the main components of the ore matrix (Al, Ca, Fe, Zn, and Si). Then, feature selection is undertaken by identifying linearly correlated wavelengths with the concentration of each target element. Finally, stratified data division is implemented by artificial neural network regression. Multi-element analysis was demonstrated for Cu, Ag, Mo, and As in more than a hundred powdered Cu-ore samples.
Sandoval-Muñoz et al. [96] demonstrated the rapid and detailed analysis of mineral species in copper ores through mineralogical characterization of three different ore types from deposits in northern Chile by the combination of micro-LIBS and hyperspectral imaging. One specimen was a primary Cu-sulfide ore comprised of quartz, albitic plagioclase [NaAlSi3O8], and a bornite–chalcopyrite–magnetite [Fe3O4] mineral association in which the Cu-sulfides comprised the groundmass and magnetite was present as mineral inclusions. Inclusions of bornite and chalcopyrite were present within the magnetite while bornite occurred as both inclusion and fracture fillings in the chalcopyrite. A second sample was a secondary Cu-sulfide association consisting intergrown covellite and chalcocite containing infrequent micro-inclusions of chalcopyrite, set in a matrix of quartz and anhydrite. The third sample contained crystals of enargite embedded in a clay matrix of pyrophyllite [Al2Si4O10(OH)2] and alunite [KAl3(SO4)2(OH)6]. The LIBS processing schema for the primary and secondary Cu-sulfide ores is shown in Figure 19. This study illustrated how HSI may be initially used as a rapid screening technique for a preliminary surface inspection of an ore specimen, with ensuing high-resolution elemental and mineralogical analysis by micro-LIBS directed to specific areas of interest.
In a multi-technique study, Varotis et al. [183] used LIBS in conjunction with Raman microscopy and Fourier transform infrared spectroscopy (µ-FTIR) to analyze Cu-sulfide minerals in whole-rock ore samples from mine workings in Skouriotissa (Cyprus). This combination of techniques permitted monitoring during passivation of Cu-sulfide minerals in the presence of Fe- and S-oxidizing bacteria because the molecular information was added to the compositional data. Three different single- and double-pulse combinations were used for the LIBS analysis of chalcopyrite and idaite [Cu5FeS6] to improve the intensity and reproducibility of emission signals over the single-pulse approach. Raman analysis was used to identify individual Cu-sulfide minerals, LIBS was used for elemental abundance determinations, and µ-FTIR analysis was undertaken to monitor the progressive conformational changes in amides during jarosite [KFe3(SO4)2(OH)6] formation and biofilm development on the Cu-sulfide ores during a bioleaching experiment.
Several recent projects have demonstrated that different approaches to LIBS analysis in the laboratory have the potential be translated into the field for practical application. Chen et al. [115] describe an LIBS system for real-time Fe analysis in an ore concentrate slurry on-site at a flotation plant that was run stably for over half a year after initial commissioning. The system, capable of sampling at 20 min intervals, measures the Fe content of the slurry ore in real time. Because typical multivariate linear models used for developing calibration models do not perform well for the iron ore slurry situation due to complex matrix effects and self-absorption within the plasma, a novel data processing schema was created based on a wavelet transform approach. In this schema, LIBS spectra are first transformed into 2D images by a wavelet transform that decomposes the signal into a series of frequency bands and then creates a convolutional neural network model for a quantitative analysis process that is more capable of modeling complex relationships compared to simple linear PLS-based models. Li et al. [116] developed and installed an in-line LIBS system to quantitatively analyze dry iron ore on a port conveyor belt transporting iron ore from a moored ship to a coastal steel mill. This telescoping and autofocusing system had a working distance range of 860 ± 80 mm and a focus depth of ±10 mm, with the customized reflectors covering the spectral range of 240 to 890 nm. Calibration and validation used emissions that are insensitive to detection distance, with the in-line LIBS system generating results consistent with laboratory analysis. Brinkmann et al. [186] undertook analysis of ore samples from volcanogenic massive sulfide deposits in Cyprus and sediment-hosted strata-bound copper deposits in Poland. Pressed powders were prepared by adding the Cu-bearing minerals chalcocite and chalcopyrite to matrices of basalt or schist and then analyzed using both a laboratory LIBS system and a handheld LIBS analyzer to develop calibrations using the Cu324.8 nm and Cu327.4 nm emission peaks. Univariate regression was observed to produce unsuitable calibrations because of matrix effects. A multivariate method of partial least squares regression was considered more suitable for quantification and validated using field samples.
3.7. Niobium and Tantalum
Niobium and tantalum are rare metals that occur primarily in the complex oxide minerals columbite and tantalite, which form a solid-solution series having the generalized composition of [(Fe,Mn)(Nb,Ta)2O6]. Niobium is used to make hardened steel alloys, and with unique properties for storing electrical charge, tantalum is an essential electronic component used in modern consumer electronics [192]. The Nb-dominant member of the group, columbite [FeNb2O6-MnNb2O6], and its Ta-rich counterpart, tantalite [Fe(Ta,Nb)2O6-MnTa2O6], have been commonly grouped together under the appellation coltan, the Nb-Ta ore that typically occurs in granite pegmatites and is the primary source for these two important elements. Coltan ores occur in many areas worldwide, with major occurrences in Australia, Brazil, and Africa. However, its exploitation has become problematic politically as coltan has become one of the most prominent of the African conflict minerals. The illicit export of ore from the Democratic Republic of Congo and neighboring regions is one of several revenue streams used by combatants to finance the ongoing civil conflicts across this region of the continent [193].
Laboratory-based techniques using quantitative elemental and isotope analysis have been utilized to match coltan from a given mine site to samples from the same mine previously cataloged in a global database [194,195]. However, the laboratory instrumentation needed to achieve this is expensive, requires time-consuming sample preparation, and is non-portable. However, multiple studies have validated the proposition that LIBS analysis might be a suitable field tool to identify a coltan ore source in real time [196,197]. Harmon et al. [87] examined two USA coltan suites from LCT-type pegmatites by handheld LIBS. Overall, the Connecticut and California sample groups could be distinguished by principal component analysis, with the California group comprising Mn-columbites and the Connecticut group consisting of Fe-columbites. Interestingly, all LIBS spectra for one Connecticut sample (Strickland) clustered with the California samples in the PCA score plot (Figure 20), an unsurprising result since it was Mn-tantalite. A second compositionally heterogeneous Strickland sample ranged from Mn-columbite to (Fe, Mn)-tantalite, explaining why its LIBS data were plotted between the Mn-rich and Fe-rich groups. These results illustrate the potential of LIBS application as a real-time screening tool in the field to discriminate coltan ores from different granite pegmatites based on chemical composition.
3.8. Platinum-Group Elements
The platinum-group elements (PGEs)—Pt, Pd, Rh, Ru, Ir, and Os—are metals with similar physical and chemical properties that generally occur together in nature. These very rare metals are essential for many industrial applications that include their use in crude oil refinement, catalytic converters, in a variety of components used in the electronics industry, in medical devices, and in the manufacture of nitric oxide [198]. Most PGEs occur in layered intrusions, either as native metals or as a secondary phase in Ni-Cu sulfide minerals [199].
Because of the economic importance of PGEs, their analysis has been of recent interest [200,201,202,203,204]. For example, Rifai et al. [200] used a bespoke industrial LIBS system designed to rapidly scan and analyze drill cores [25,72] for ultrafast compositional mapping of cores from Stillwater, Montana (USA). A 40 mm × 30 mm scan of a core surface at a spatial resolution of 50 µm was accomplished in about 8 min using a 1 KHz scanning speed. Maps for Pt, Pd, Ni, Cu, Fe, Si, and Mg were generated using the proprietary software integrated into the LIBS system. Then, composite maps were generated and PGE host minerals were identified by principal component analysis and correlations with the elemental maps (Figure 21). Subsequently, Selmani et al. [202] used LIBS scanning to determine Pd concentrations across a 1 m long segment of a drill core from the Lac des Îles igneous complex in northwestern Ontario (Canada). Pressed power pellets prepared from the three representative Lac des Îles mineralogies were doped with different amounts of PdCl2 solution to develop calibration curves based on the Pd348.1 nm spectral line that exhibited an estimated LOD of 5 ppm for a single laser shot and 0.5 ppm for 100 shots. Their LIBS analysis indicated significant variations in Pd concentration across the core segment but produced an average concentration of 5.2 ppm, close to the mine laboratory analysis of 4.9 ppm for its other half. In a follow-on study of Lac des Îles ore, Elhamdaoui et al. [203] measured the Pt and Pd concentrations of ore in a piece of drill core followed by analysis of the same core after pulverization using a combination of LIBS and laser-induced fluorescence (LIF). Pt and Pd abundances were determined from LIBS-LIF calibration curves, with measured concentrations similar to those obtained by conventional laboratory analysis for both solid and powdered samples, with two exceptions where Pd appeared to be very inhomogeneously distributed within the ore. This study demonstrated that a combined LIBS-LIF approach has the potential for the rapid in situ determination of sub-ppm average concentrations of precious metals in solid ore samples having a moderate degree of compositional inhomogeneity.
3.9. Precious Metals
The precious metals Ag and Au have multiple industrial applications, in addition to being used in jewelry and art and historically providing the basis for monetary systems. Silver is used in mirrors, electrical and electronic products, and photography, while gold is an essential component of spacecraft, jet aircraft engines, computers, communications equipment, and many other high-technology products [205].
The analysis of gold by LIBS, and to a lesser extent silver, has been well investigated using laboratory [58,190,206,207,208,209,210], industrial [38,72,210], and portable/handheld [83,88,187] analyzers. Several recent studies have illustrated how LIBS analysis and imaging can be used in the context of gold exploration. For example, Rifai et al. [58] developed a calibration curve up to 1000 ppm for Au then mapped its distribution in a drill core segment from a mine in Québec (Canada). Locally high abundances of up to few thousands ppm were observed, but Au distribution was extremely heterogeneous spatially at the mm scale (Figure 22a). Gervais et al. [211] used a commercial benchtop LIBS system designed for industrial use to demonstrate compositional elemental mapping and tomography for the 3D arrangements of minerals in rocks, in this case the geometry and spatial distribution of Au in an altered ultramafic schist from a mine in Val d’Or, Qúebec (Canada). The volume segmentation imaging of Au, Cu, and Al (Figure 22b) showed that gold was heterogeneously distributed and concentrated within a layer rich in tremolite [Ca2(Mg, Fe)Si8O22(OH)2] that contained small grains of chalcopyrite. In an example from the MacLellan gold deposit in Manitoba (Canada), Harmon et al. [70] demonstrated how handheld LIBS analysis might be used in gold exploration. The ability to detect minor to trace element signatures of sulfide phases was highlighted, because these minerals are frequently hosts for gold. The two main As-bearing phases at MacLellan, arsenian pyrite with As > 1 wt. % and arsenopyrite, were readily distinguished from other Fe-bearing minerals in the sample matrix by the LIBS raster mapping.
Haavisto et al. [38] investigated the potential of LIBS for online analysis of a Au-mineralized drill core from the ore zone of the Suurikuusikko gold deposit (northern Finland). The mineralized host rock here comprises intensively altered mafic volcanics subjected to post-depositional carbonization, albitization, silicification, and sulfidization. Gold is present in the sulfide minerals pyrite and arsenopyrite, and Au abundances determined by LIBS corresponded well to a laboratory assay by XRF analysis. Rifai et al. [72] used a prototype industrial benchtop LIBS system to map a 40 × 40 mm2 surface area of a drill core from the Woodstock gold mine in Val d’Or (Canada) having no prior surface preparation in 5 min for six elements—Ag, Au, Zn, Cu, Al, and Ca. The smallest detectable Au grain was estimated to be between 2 and 5 μm in size at the 50 μm resolution of the scanning system.
Native gold occurs as lode deposits in a wide range of geological settings. It is common to find gold in the placer accumulations created by gravity separation during weathering and fluvial transport processes because it is dense and resistant to chemical weathering. Since natural Au contains a wide range of elements as trace constituents and gold deposits display a wide range of Ag/Au ratios [212], this feature of placer gold can be used as an exploration tool for its lode source [213]. Harmon et al. [83] successfully discriminated native gold from 18 placer locations in New Zealand, Australia, and six states in the USA. A discrimination success rate of >98% was obtained using chemometric analysis of the full broadband LIBS spectra and >92% using only the 16 most prominent Ag and Au spectral lines. This study suggests that handheld LIBS would be a useful field analytical tool to determine the fineness of alluvial gold deposits and match them to their lode source. In a similar study, Pochon et al. [88] used handheld LIBS analysis to measure the Ag content of alluvial gold samples from French Guiana. A three-step procedure was developed (Figure 10) that generated a calibration model for Ag quantification having a mean average predictive error of 0.36 wt. % and good predictive power, with an RMSE value of 0.53 wt. % Ag. Statistical comparisons based on the Ag content in the five gold sample sites analyzed permitted their discrimination and even matched the two sets of silver samples belonging to the same alluvial deposit.
3.10. Tin
Tin is an element with a high industrial demand for use in electrically conductive coatings, as a corrosion-resistant coating on other metals, in anti-fouling paint for marine vessels, as a fire-retardant in plastics, and in the alloys used for soft solder, pewter, bronze, and superconducting magnets [214]. The primary ore for tin is cassiterite, which occurs naturally in hydrothermal veins associated with S-type granites, but because of its resistance to weathering, it is most commonly found as alluvial and placer accumulations. The high demand for tin and the large supply of cassiterite in underdeveloped parts of central Africa has contributed to its illicit mining and trading as a conflict mineral.
Hark and Harmon [80] investigated whether the geographic origin of cassiterite could be identified using laboratory LIBS analysis. Ore concentrates from South America and Southeast Asia were analyzed over three different wavelength regions (220 to 440 nm, 460 to 700 nm, and 680 to 910 nm), with the spectral data stitched together to create artificial broadband spectra. These were then processed chemometrically to build a robust PLSDA classifier model that provided an overall correct sample-level classification rate of > 97 % (Figure 23).
3.11. Rare Earth Elements
The rare earth elements (REEs) comprise the 15 elements of the lanthanide series (La, Ce, Pr, Nd, Pm, Sm, Eu, Gd, Tb, Dy, Ho, Er, Tm, Yb, Lu) together with the transition metals Sc and Y that exhibit similar properties and typically are found in the same ore minerals [215]. The REEs are critical components of many advanced technologies such as magnets, batteries, phosphors, and catalysts used in a variety of industrial sectors that include power generation and clean energy technologies, metallurgy, transportation, petroleum refining, consumer electronics, water treatment, and health care [215]. The detection of REEs in geological samples using LIBS is challenging as a consequence of both significant spectral interferences and the generally low content of REEs in most geological materials. Nevertheless, significant progress has been demonstrated in recent studies.
Abedin et al. [216] analyzed monazite sands from the beaches in southern Bangladesh, simultaneously detecting a number of REEs—Ce, La, Pr, Nd, Y, Yb, Ga, Dy, and Er. Romppanen et al. [217] examined REE ores from an alkaline complex in southern Sweden with Y detected in eudialyte [Na4(Ca,Ce)2(Fe,Mn,Y)ZrSi8O22] and catapleiite [(Na)2ZrSi3O9⋅2H2O]. Minerals present in the rock samples were classified using a singular value decomposition chemometric methodology, and mineralogical maps were constructed from which the percentage of the Y-bearing ore minerals was calculated. Subsequently, a number of studies have demonstrated micro-imaging and quantitative analysis of individual lanthanide elements with good LODs [106,218,219,220,221,222,223,224,225,226,227,228,229,230]. For example, Müller et al. [105] described how LIBS analysis with nearly no sample preparation could be used to rapidly identify REE-rich-domain drill cores at high spatial resolution. Following raster analysis over the sample, an automated k-means clustering approach was used to separate different minerals in the compositionally heterogeneous drill core and then extract REE-relevant features. Gaft et al. [219] used a laboratory LIBS system for both elemental and molecular imaging of REEs (Figure 24). First, reference spectra were obtained from macroscopically homogenous xenotime [YbPO4] and monazite [(Ce,La,Nd,Th)PO4]. Then, despite interference from major and minor elements such as Ca, Fe, Cu, Ce, and U, detection and identification of REEs were demonstrated in fluorapatite [Ca5(PO4)3F] and the compositionally complex mineral cerite [(Ce,La,Ca)9(Mg,Fe)(SiO4)6(SiO3OH)(OH)3] using LIBS atomic and ionic emissions. The emergence of molecular emissions for YO and LaO in the LIBS spectra at long delay times of >20 μs were used for quantification. Subsequently, Manard et al. [220] used a handheld LIBS analyzer to map REEs in a U3O8 matrix.
Several recent studies examined how REE analysis by LIBS can be improved. Deng et al. [226] compared spectral line intensities and sensitivities in REE-bearing ore samples between single-pulse and double-pulse LIBS analysis, observing that a double-pulse approach using 1064 nm wavelength light from a single Nd:YAG laser can improve the signal intensity and sensitivity for Y, La, Yb, and Dy. Fayyaz et al. [227] applied a CF-LIBS approach to the analysis in pressed pellets prepared from REE-bearing phosphorites. Calibration curves were developed for La, Ce, Nd, Sm, and Yb, with LIBS elemental abundances exhibiting excellent agreement with results from scanning electron microscopy and energy-dispersive X-ray analysis. Yang et al. [230] applied a neural network chemometric methodology to develop a calibration model for La analysis in pressed pellets, observing an enhancement over a univariate calibration approach. This methodology effectively diminished the impact of matrix effects, thus providing a methodology for accurate determination of La in rare earth minerals by LIBS. Also, improvements in REE analysis have been observed in recent studies that combined LIBS analysis with LIF [224] and LA-ICP-MS [228]. Liu et al. [229] used wavelet transformed LIBS spectra as input variables to calibration models based on interval partial least squares and variable importance projection for the development of calibration curves for Lu and Y that exhibited improved analytical performance compared to using a calibration model just based on the original LIBS spectra. Akhmetzhanov and Popov [223] demonstrated that calibration curves developed using PLS regression provided better analytical performance for La, Nd, and Sm quantification in ores rather than simple univariate regression. Additionally, it was concluded that even a low-resolution spectrometer, of the kind used in handheld analyzers, can accomplish La determination through the coupling of LIBS and chemometrics. This led to a follow-on study [225] that quantitatively analyzed La and Ce in REE ores using a handheld LIBS analyzer.
3.12. Uranium
Uranium is one of the most common elements in the Earth’s crust, being 40 times more common than silver and 500 times more common than gold [231], and occurs in potentially recoverable concentrations in many types of geological settings. Although a variety of U minerals occur in specific deposits, the major U ore mineral is uraninite (UO2), which, because of partial oxidation, typically contains a variable proportion of U3O8. The primary use of U is for electricity generation, with a small proportion used for marine propulsion and medical isotopes and by the defense industry; it is also the primary source material from which other synthetic trans-uranium elements are made [232].
In the first LIBS study of U ore, Sirven et al. [233] demonstrated that ore concentrate from 11 different geographic sources could be recognized and discriminated on the basis of chemometric processing of their broadband LIBS spectra. Subsequently, a number of studies have investigated how to improve the sensitivity and LOD of LIBS uranium analysis, developed U calibrations, and undertaken compositional mapping of U-ore mineralization [234,235,236,237,238,239,240,241]. In three studies conducted on uranium deposits in the Czech Republic, Klus et al. [238] produced high-resolution U distribution maps for sandstone-hosted ores at Břevniště, Holá et al. [239] used both LIBS and LA-ICP-MS to image the distribution of U in an ore from Rožná near Brno, and Krempl et al. [240] used LIBS imaging to distinguish primary from secondary U mineralization in an ore sample from the hydrothermally altered Zálesí deposit (Figure 25). Most recently, Andrews et al. [241] employed the high-speed analytical capability of LIBS to screen calcretes from the Southern High Plains Uranium Province in the USA for their elemental constituents. Then, after LIBS identification of the location of uranium inclusions, high-resolution LA-ICP-MS was used to discern the chemical form of U as well as the 235U/2382U isotopic composition.
4. Tandem LIBS Methods
Increasingly, LIBS is being used in conjunction with one or more other analytical techniques and this has been an increasing tendency in mineral exploration. Studies over the past decade have utilized combinations of LIBS/EMP-EDX [240], LIBS/XRF [102,104,111,126,242], LIBS/LIF [203,219,224,237], LIBS/RS [183,243,244], LIBS/VS [96, 111,183,189,190,245], and LIBS-ICP-MS [77,105,194,239,241,242] for specific investigations. In fact, one of the most exciting recent advances in analytical geochemistry is the recent appearance of commercial tandem LIBS/LA-ICP-MS instruments able to produce a comprehensive chemical and isotopic analysis that typically would require three to five separate analytical instruments. Since laser sampling is the same for LIBS and LA-ICP-MS, this very important development in analytical technology makes possible both qualitative and quantitative analysis of the full periodic table, including the determination of isotopic compositions [246], with a single laser ablation event. In addition to elemental analysis and surface micromapping, depth profiling is also possible with tandem LIBS-ICPMS analysis (Figure 6).
The recent studies by Müller et al. [105] and Holá et al. [239] provide illustrative examples for the potential of tandem LIBS-LA-ICP-MS analysis. Müller et al. [105] used elemental concentrations obtained by LA-ICP-MS to develop accurate calibration models for pegmatitic drill cores samples that were also analyzed by LIBS. Both methods were applied to segments of the drill core to generate two spatially resolved datasets for the same areas. Pixel-by-pixel alignment allowed a uniform reference area to be created that subsequently enabled accurate spatial quantification of the constituent minerals in the drill core for Li2O, SiO2, Al2O3, Na2O, and K2O from the LIBS measurements (Figure 26). Holá et al. [239] used LIBS to rapidly image the spatial distribution of elements at 80 μm resolution for 51 × 290 locations across an 4 mm × 23 mm area of ore sample comprising a metasomite consisting mostly of calcite, dolomite, and chlorite [Mg5Al(AlSi3O10)(OH)8] with subordinate quartz, smectite [(Na,Ca)0.33(Al,Mg)2(Si4O10)(OH)2.nH2O], and apatite, a hydrothermal carbonate vein, and massive uraninite from the Czech Republic (Figure 27). After appropriate normalization of selected emission lines, element images of the sample were created to identify areas of interest within individual minerals. Then, LA-ICP-MS analysis focused in detail on these areas to create isotopic compositional maps for Ca, V, U, and Pb plus the three radiogenic Pb isotopes at a resolution of 20 μm across 3 mm × 2 mm areas (150 × 100 pixels) that required 5 h per map to acquire. Such images portray an overall view of sample chemical character as well detailed compositional information about specific components and structures where individual zones of the uraninite aggregates have different concentrations of major and trace elements.
5. Summary and Future Prospects
Laser-induced breakdown spectroscopy offers a versatile analytical tool for a wide range of natural materials that can provide reliable, reproducible, and robust results. LIBS technology has advanced over the past two decades from laboratory instrumentation to handheld analyzers for field use. Although not yet a fully mature analytical technology, LIBS is demonstrated to be efficacious for rapid qualitative and quantitative elemental analysis in the laboratory or in situ in the field for minerals, rocks, sediments, and soils. Concomitant with progress in LIBS analytical capability has been a parallel improvement in LIBS compositional imaging so that KHz rate megapixel imaging for geological characterization is now routine. The rapid development of solid-state microchip lasers, sensitive light detection systems, and efficient spectrometers has been the stimulating force driving the development of both commercial LIBS laboratory systems and robust field-portable LIBS analyzers, both of which should continue to diminish in size and improve in performance in the immediate future.
Interest in compositional analysis within the geosciences varies widely from purely scientific investigations to more practical applications such as mineral resource exploration and ore characterization for beneficiation operations. There has been a persistent need for analytical instrumentation for rapid and effective chemical analysis of geologic materials outside of the traditional analytical laboratory setting in this and many other contexts. The versatility and low cost of field-portable and handheld LIBS analyzers address this need.
The continuing and growing demand for the specific mineral resources essential to modern technology, and for the transition to a future green economy, is driving R&D activity to develop more efficient approaches to the exploration and development of ore bodies at reduced developmental costs and environmental impact. The major strengths of LIBS from the perspective of exploration geologist are (i) the field suitability of the method, (ii) its ability for rapid multi-element analysis, typically reaching detection limits in the low ppm range, with minimal sample preparation, and (iii) its ability to process large numbers of samples in a short amount of time. Thus, it is expected that LIBS use will spread progressively across the resource exploration community, that tandem LIBS analytical approaches will increasingly be applied to strategic metal exploration, and that monitoring by LIBS will provide a means for rapid assessment and decision making during resource development and mine site restoration. For example, the recent capability to link a handheld LIBS analyzer directly to a GPS receiver has the potential enhance mineral exploration in remote areas, enabling compositional information to quickly reach management so that near-real-time decisions can be made with reasonable confidence. The capability of LIBS to measure the platinum-group and rare earth elements requires further research and technology development to improve its performance for these applications, but nevertheless should find increasing exploration use, both on land and on the seafloor. Such continuing improvement in LIBS technology together with the ongoing enhancement of LIBS data quantity and quality provided by chemometric processing is expected to result in the construction of robust databases that can be processed by the techniques of artificial intelligence and machine learning to gain new insights into complex geological applications, particularly those related to economic geology.
Funding
This review paper received no external funding.
Conflicts of Interest
The author declares no conflict of interest.
References
- U.S. Geological Survey Releases 2022 List of Critical Minerals. Available online: https://www.usgs.gov/news/national-news-release/us-geological-survey-releases-2022-list-critical-minerals (accessed on 14 April 2024).
- Graedel, T.E.; Harper, E.M.; Nassar, N.T.; Reck, B.K. On the materials basis of modern society. Proc. Natl. Acad. Sci. USA 2015, 112, 6295–6300. [Google Scholar] [CrossRef]
- Price, J.G.; Bickford, M.E. The challenges of mineral resources for society. In The Impact of the Geological Sciences on Society; Bickford, M.E., Ed.; Geological Society of America: Boulder, CO, USA, 2013; Special Paper 501; pp. 1–19. [Google Scholar]
- Ali, S.H.; Giurco, D.; Arndt, N.; Nickless, E.; Brown, G.; Demetriades, A.; Durrheim, R.; Enriquez, M.A.; Kinnaird, J.; Littleboy, A.; et al. Mineral supply for sustainable development requires resource governance. Nature 2017, 543, 367–372. [Google Scholar] [CrossRef] [PubMed]
- Lusty, P.A.J.; Gunn, A.G. Challenges to global mineral resource security and options for future supply. In Ore Deposits in an Evolving Earth; Jenkin, G.R., Lusty, P.A., McDonald, I., Smith, M.P., Boyce, A.J., Wilkinson, J.J., Eds.; Geological Society of London: London, UK, 2016; Special Publication 393; pp. 65–276. [Google Scholar]
- Arndt, N.; Fontboté, L.; Hedenquist, J.; Kesler, S.; Thompson, J.; Wood, D. Future global mineral resources. Geochem. Perspect. 2017, 6, 171. [Google Scholar] [CrossRef]
- Harris, J.R.; Wilkinson, L.; Grunsky, E.C. Effective use and interpretation of lithogeochemical data in regional mineral exploration programs: Application of Geographic Information Systems (GIS) technology. Ore Geol. Rev. 2000, 16, 107–143. [Google Scholar] [CrossRef]
- Govett, G.J.S. Rock Geochemistry in Mineral Exploration; Elsevier: Amsterdam, The Netherlands, 2013. [Google Scholar]
- Kyser, K.; Barr, J.; Ihlenfeld, C. Applied geochemistry in mineral exploration and mining. Elements 2015, 11, 241–246. [Google Scholar] [CrossRef]
- Zuo, R.; Wang, J.; Xiong, Y.; Wang, Z. The processing methods of geochemical exploration data: Past, present, and future. Appl. Geochem. 2021, 132, 105072. [Google Scholar] [CrossRef]
- Biqoqi Product List LIBS2500plus LIBS Systems. Available online: http://www.gzbiaoqi.com/ProductShowen.asp?ArticleID=12 (accessed on 5 April 2024).
- Applied Spectra J200 Laser-Induced Breakdown Spectroscopy (LIBS) Instrument. Available online: http://appliedspectra.com/products/j200-libs-instrument.html (accessed on 5 April 2024).
- DM6 M LIBS Material Analysis Microscope. Available online: http://Leica-microsystems.com/products/light-microscopes/p/libs-module/ (accessed on 5 April 2024).
- Connors, B.; Somers, A.; Day, D. Application of handheld laser-induced breakdown spectroscopy (LIBS) to geochemical analysis. Appl. Spectrosc. 2016, 70, 810–815. [Google Scholar] [CrossRef]
- Senesi, G.S.; Harmon, R.S.; Hark, R.R. Field-portable and handheld laser-induced breakdown spectroscopy: Historical review, current status, and future prospects. Spectrochim. Acta Part B At. Spectrosc. 2021, 175, 106013. [Google Scholar] [CrossRef]
- Noll, R. Laser-Induced Breakdown Spectroscopy: Fundamentals and Applications; Springer: Berlin, Germany, 2012. [Google Scholar]
- Cremers, D.; Radziemski, L. Handbook of Laser-Induced Breakdown Spectroscopy; Wiley: Hoboken, NJ, USA, 2013. [Google Scholar]
- NIST Atomic Spectra Databases. Available online: https://www.nist.gov/pml/atomic-spectra-database (accessed on 5 April 2024).
- Wise, M.A.; Harmon, R.S.; Curry, A.C.; Jennings, M.; Grimac, Z.; Khashchevskaya, D. Handheld LIBS for Li exploration: An example from the Carolina Tin-Spodumene Belt, USA. Minerals 2022, 12, 77. [Google Scholar] [CrossRef]
- Harmon, R.S.; De Lucia, F.C.; Miziolek, A.W.; McNesby, K.L.; Walters, R.A.; French, P.D. Laser-induced breakdown spectroscopy (LIBS)—An emerging field-portable sensor technology for real-time, in-situ geochemical and environmental analysis. Geochem. Explor. Environ. Anal. 2005, 5, 21–28. [Google Scholar] [CrossRef]
- Harmon, R.S.; Russo, R.E. Laser-induced breakdown spectroscopy. In Treatise on Geochemistry, Analytical Geochemistry and Inorganic Instrumental Analysis; McDonough, W., Ed.; Elsevier: Amsterdam, The Netherlands, 2014; Volume 15, pp. 245–272. [Google Scholar]
- Fabre, C. Advances in Laser-Induced Breakdown Spectroscopy analysis for geology: A critical review. Acta Part B At. Spectrosc. 2020, 166, 105799. [Google Scholar] [CrossRef]
- Harmon, R.S.; Senesi, G.S. Laser-induced breakdown Spectroscopy—A geochemical tool for the 21st century. Appl. Geochem. 2021, 128, 104929. [Google Scholar] [CrossRef]
- Lemière, B.; Harmon, R.S. XRF and LIBS for field geology. In Portable Spectroscopy and Spectrometry; Crocombe, R., Leary, P., Kammrath, B., Eds.; John Wiley and Sons: Hoboken, NJ, USA, 2021; pp. 455–497. [Google Scholar]
- Rifai, K.; Michaud Paradis, M.C.; Swierczek, Z.; Doucet, F.; Özcan, L.; Fayad, A.; Li, J.; Vidal, F. Emergence of new technology for ultrafast automated mineral phase identification and quantitative analysis using the CORIOSITY laser-induced breakdown spectroscopy (LIBS) system. Minerals 2020, 10, 918. [Google Scholar] [CrossRef]
- Rosenwasser, S.; Asimellis, G.; Bromley, B.; Hazlett, R.; Martin, J.; Pearce, T.; Zigler, A. Development of a method for automated quantitative analysis of ores using LIBS. Spectrochim. Acta Part B At. Spectrosc. 2001, 56, 707–714. [Google Scholar] [CrossRef]
- Fabre, C.; Ourti, N.E.; Ballouard, C.; Mercadier, J.; Cauzid, J. Handheld LIBS analysis for in situ quantification of Li and detection of the trace elements (Be, Rb and Cs). J. Geochem. Explor. 2022, 236, 106979. [Google Scholar] [CrossRef]
- Rifai, K.; Özcan, L.; Doucet, F.; Vidal, F. Quantification of copper, nickel and other elements in copper-nickel ore samples using laser-induced breakdown spectroscopy. Spectrochim. Acta Part B At. Spectrosc. 2020, 165, 105766. [Google Scholar] [CrossRef]
- Tognoni, E.; Cristoforetti, G.; Legnaiolia, S.; Palleschi, V. Calibration-free laser-induced breakdown spectroscopy: State of the art. Spectrochim. Acta Part B At. Spectrosc. 2010, 65, 1–14. [Google Scholar] [CrossRef]
- Praher, B.; Palleschi, V.; Viskup, P.; Heitz, J.; Pedarnig, J. Calibration free laser induced breakdown spectroscopy of oxide materials. Spectrochim. Acta Part B At. Spectrosc. 2010, 65, 671–679. [Google Scholar] [CrossRef]
- Thornton, B.; Takahashi, T.; Sato, T.; Sakka, T.; Tamura, A.; Matsumoto, A.; Nozaki, T.; Ohki, T.; Ohki, K. Development of a deep-sea laser-induced breakdown spectrometer for in situ multi-element chemical analysis. Deep Sea Res. 2015, 95, 20–36. [Google Scholar] [CrossRef]
- Guo, J.; Lu, Y.; Cheng, K.; Song, J.; Ye, W.; Li, N.; Zheng, R. Development of a compact underwater laser-induced breakdown spectroscopy (LIBS) system and preliminary results in sea trials. Appl. Opt. 2017, 56, 8196–8200. [Google Scholar] [CrossRef]
- Takahashi, T.; Yoshino, S.; Takaya, Y.; Nozaki, T.; Ohki, K.; Ohki, T.; Sakka, T.; Thornton, B. Quantitative in situ mapping of elements in deep-sea hydrothermal vents using laser-induced breakdown spectroscopy and multivariate analysis. Deep Sea Res. 2020, 158, 103232. [Google Scholar] [CrossRef]
- Wiens, R.C.; Wan, X.; Lasue, J.; Maurice, S. Laser-induced breakdown spectroscopy in planetary science. In Laser-Induced Breakdown Spectroscopy; Singh, J.P., Thakur, S.N., Eds.; Elsevier: Amsterdam, The Netherlands, 2020; pp. 441–471. [Google Scholar]
- Wiens, R.C.; Maurice, S.; MSL Science Team. ChemCam: Chemostratigraphy by the first Mars microprobe. Elements 2015, 11, 33–38. [Google Scholar] [CrossRef]
- Xu, W.; Liu, X.; Yan, Z.; Li, L.; Zhang, Z.; Kuang, Y.; Jiang, H.; Yu, H.; Yang, F.; Liu, C.; et al. The MarSCoDe instrument suite on the Mars Rover of China’s Tianwen-1 mission. Space Sci. Rev. 2021, 217, 1–58. [Google Scholar] [CrossRef]
- Death, D.L.; Cunningham, A.P.; Pollard, L.J. Multi-element and mineralogical analysis of mineral ores using laser induced breakdown spectroscopy and chemometric analysis. Spectrochim. Acta Part B At. Spectrom. 2009, 64, 1048–1058. [Google Scholar] [CrossRef]
- Haavisto, O.; Kauppinen, T.; Häkkänen, H. Laser-induced breakdown spectroscopy for rapid elemental analysis of drillcore. IFAC-PapersOnLine 2013, 46, 87–91. [Google Scholar] [CrossRef]
- Pořízka, P.; Demidov, A.; Kaiser, J.; Keivanian, J.; Gornushkin, I.; Panne, U.; Riedel, J. Laser-induced breakdown spectroscopy for in situ qualitative and quantitative analysis of mineral ores. Spectrochim. Acta Part B At. Spectrom. 2014, 101, 155–163. [Google Scholar] [CrossRef]
- Pedarnig, J.D.; Trautner, S.; Grünberger, S.; Giannakaris, N.; Eschlböck-Fuchs, S.; Hofstadler, J. Review of element analysis of industrial materials by in-line laser-induced breakdown spectroscopy (LIBS). Appl. Sci. 2021, 11, 9274. [Google Scholar] [CrossRef]
- Barrette, L.; Turmel, S. On-line iron-ore slurry monitoring for real-time process control of pellet making processes using laser-induced breakdown spectroscopy: Graphitic vs. total carbon detection. Spectrochim. Acta Part B At. Spectrom. 2001, 56, 715–723. [Google Scholar] [CrossRef]
- Eseller, K.E.; Tripathi, M.M.; Yueh, F.Y.; Singh, J.P. Elemental analysis of slurry samples with laser induced breakdown spectroscopy. Appl. Opt. 2010, 49, C21–C26. [Google Scholar] [CrossRef]
- Khajehzadeh, N.; Haavisto, O.; Koresaar, L. On-stream and quantitative mineral identification of tailing slurries using LIBS technique. Miner. Eng. 2016, 98, 101–109. [Google Scholar] [CrossRef]
- Cheng, X.; Yang, X.; Zhu, Z.; Guo, L.; Li, X.; Lu, Y.; Zeng, X. On-stream analysis of iron ore slurry using laser-induced breakdown spectroscopy. Appl. Opt. 2017, 56, 9144–9149. [Google Scholar] [CrossRef] [PubMed]
- Ytsma, C.R.; Knudson, C.A.; Dyar, M.D.; McAdam, A.C.; Michaud, D.D.; Rollosson, L.M. Accuracies and detection limits of major, minor, and trace element quantification in rocks by portable laser-induced breakdown spectroscopy. Spectrochim. Acta Part B At. Spectrom. 2020, 171, 105946. [Google Scholar] [CrossRef]
- Buckley, S. Geochemical analysis using laser-induced breakdown spectroscopy. Spectroscopy 2021, 36, 9–15. [Google Scholar] [CrossRef]
- Hahn, D.W.; Omenetto, N. Laser-induced breakdown spectroscopy (LIBS), part II: Review of instrumental and methodological approaches to material analysis and applications to different fields. Appl. Spectrosc. 2012, 66, 347–419. [Google Scholar] [CrossRef] [PubMed]
- Wisbrun, R.; Schechter, I.; Niessner, R.; Schroeder, H.; Kompa, K.L. Detector for trace elemental analysis of solid environmental samples by laser plasma spectroscopy. Anal. Chem. 1994, 66, 2964–2975. [Google Scholar] [CrossRef]
- Cáceres, J.O.; López, J.T.; Telle, H.H.; Ureña, A.G. Quantitative analysis of trace metal ions in ice using laser-induced breakdown spectroscopy. Spectrochim. Acta Part B At. Spectrom. 2001, 56, 831–838. [Google Scholar] [CrossRef]
- Russo, R.E.; Mao, X.L.; Chan, W.T.; Bryant, M.F.; Kinard, W.F. Laser ablation sampling with inductively coupled plasma atomic emission spectrometry for the analysis of prototypical glasses. J. Anal. At. Spectrom. 1995, 10, 295–301. [Google Scholar] [CrossRef]
- Eppler, A.S.; Cremers, D.A.; Hickmott, D.D.; Ferris, M.J.; Koskelo, A.C. Matrix effects in the detection of Pb and Ba in soils using laser-induced breakdown spectroscopy. Appl. Spectrosc. 1996, 50, 1175–1181. [Google Scholar] [CrossRef]
- Gornushkin, S.I.; Gornushkin, I.B.; Anzano, J.M.; Smith, B.W.; Winefordner, J.D. Effective normalization technique for correction of matrix effects in laser-induced breakdown spectroscopy detection of magnesium in powdered samples. Appl. Spectrosc. 2002, 56, 433–436. [Google Scholar] [CrossRef]
- McMillan, N.J.; McManus, C.E.; Harmon, R.S.; De Lucia, F.C., Jr.; Miziolek, A.W. Laser-induced breakdown spectroscopy analysis of complex silicate minerals—beryl. Anal. Bioanal. Chem. 2006, 385, 263–271. [Google Scholar] [CrossRef]
- Radziemski, L.; Cremers, D. A A brief history of laser-induced breakdown spectroscopy: From the concept of atoms to LIBS 2012. Spectrochim. Acta Part B At. Spectrom. 2013, 87, 3–10. [Google Scholar] [CrossRef]
- Pořízka, P.; Klus, J.; Mašek, J.; Rajnoha, M.; Prochazka, D.; Modlitbová, P.; Novotný, J.; Burget, R.; Novotný, K.; Kaiser, J. Multivariate classification of echellograms: A new perspective in laser-induced breakdown spectroscopy analysis. Sci. Rep. 2017, 7, 3160. [Google Scholar] [CrossRef] [PubMed]
- Gottfried, J.L. Chemometric analysis in LIBS. In Handbook of Laser-Induced Breakdown Spectroscopy; Cremers, D.A., Radziemski, L.J., Eds.; John Wiley and Sons: Hoboken, NJ, USA, 2013; pp. 223–255. [Google Scholar]
- Zhang, T.; Tang, H.; Li, H. Chemometrics in laser-induced breakdown spectroscopy. J. Chemom. 2018, 32, e2983. [Google Scholar] [CrossRef]
- Rifai, K.; Laflamme, M.; Constantin, M.; Vidal, F.; Sabsabi, M.; Blouin, A.; Bouchard, P.; Fytas, K.; Castello, M.; Kamwa, B.N. Analysis of gold in rock samples using laser-induced breakdown spectroscopy: Matrix and heterogeneity effects. Spectrochim. Acta Part B At. Spectrom. 2017, 134, 33–41. [Google Scholar] [CrossRef]
- Álvarez, J.; Velásquez, M.; Myakalwar, A.K.; Sandoval, C.; Fuentes, R.; Castillo, R.; Sbarbaro, D.; Yáñez, J. Determination of copper-based mineral species by laser induced breakdown spectroscopy and chemometric methods. J. Anal. At. Spectrom. 2019, 34, 2459–2468. [Google Scholar] [CrossRef]
- Nardecchia, A.; Fabre, C.; Cauzid, J.; Pelascini, F.; Motto-Ros, V.; Duponchel, L. Detection of minor compounds in complex mineral samples from millions of spectra: A new data analysis strategy in LIBS imaging. Anal. Chim. Acta 2020, 1114, 66–73. [Google Scholar] [CrossRef] [PubMed]
- Müller, S.; Meima, J.A. Mineral classification of lithium-bearing pegmatites based on laser-induced breakdown spectroscopy: Application of semi-supervised learning to detect known minerals and unknown material. Spectrochim. Acta Part B At. Spectrom. 2022, 189, 106370. [Google Scholar] [CrossRef]
- El Haddad, J.; Harhira, A.; Képeš, E.; Vrábel, J.; Kaiser, J.; Pořízka, P. Chemometric Processing of LIBS Data. In Laser Induced Breakdown Spectroscopy (LIBS) Concepts, Instrumentation, Data Analysis and Applications; Singh, V.K., Tripathi, D.K., Deguchi, Y., Wang, Z., Eds.; John Wiley and Sons: Hoboken, NJ, USA, 2023; Volume 1, pp. 241–275. [Google Scholar]
- Sobron, P.; Wang, A.; Sobron, F. Extraction of compositional and hydration information of sulfates from laser-induced plasma spectra recorded under Mars atmospheric conditions—Implications for ChemCam investigations on Curiosity rover. Spectrochim. Acta Part B At. Spectrom. 2012, 68, 1–6. [Google Scholar] [CrossRef]
- Fontana, F.F.; Tassios, S.; Stromberg, J.; Tiddy, C.; van der Hoek, B.; Uvarova, Y.A. Integrated laser-induced breakdown spectroscopy (LIBS) and multivariate wavelet tessellation: A new, rapid approach for lithogeochemical analysis and interpretation. Minerals 2021, 11, 312. [Google Scholar] [CrossRef]
- Yan, J.; Li, Q.; Qin, F.; Xiao, L.; Li, X. A polynomial interactive reconstruction method based on spectral morphological features for the classification of gem minerals using portable LIBS. J. Anal. At. Spectrom. 2022, 37, 1862–1868. [Google Scholar] [CrossRef]
- Boucher, T.F.; Ozanne, M.V.; Carmosino, M.L.; Dyar, M.D.; Mahadevan, S.; Breves, E.A.; Lepore, K.H.; Clegg, S.M. A study of machine learning regression methods for major elemental analysis of rocks using laser-induced breakdown spectroscopy. Spectrochim. Acta Part B At. Spectrom. 2015, 107, 1–10. [Google Scholar] [CrossRef]
- Pagnotta, S.; Lezzerini, M.; Campanella, B.; Legnaioli, S.; Poggialini, F.; Palleschi, V. A new approach to non-linear multivariate calibration in laser-induced breakdown spectroscopy analysis of silicate rocks. Spectrochim. Acta Part B At. Spectrom. 2020, 166, 105804. [Google Scholar] [CrossRef]
- Limbeck, A.; Brunnbauer, L.; Lohninger, H.; Pořízka, P.; Modlitbová, P.; Kaiser, J.; Janovszky, P.; Kéri, A.; Galbács, G. Methodology and applications of elemental mapping by laser induced breakdown spectroscopy. Anal. Chim. Acta 2021, 1147, 72–98. [Google Scholar] [CrossRef] [PubMed]
- Jolivet, L.; Leprince, M.; Moncayo, S.; Sorbier, L.; Lienemann, C.P.; Motto-Ros, V. Review of the recent advances and applications of LIBS-based imaging. Spectrochim. Acta Part B At. Spectrom. 2019, 151, 41–53. [Google Scholar] [CrossRef]
- Harmon, R.S.; Lawley, C.J.; Watts, J.; Harraden, C.L.; Somers, A.M.; Hark, R.R. Laser-induced breakdown spectroscopy—An emerging analytical tool for mineral exploration. Minerals 2019, 9, 718. [Google Scholar] [CrossRef]
- Lawley, C.J.; Somers, A.M.; Kjarsgaard, B.A. Rapid geochemical imaging of rocks and minerals with handheld laser induced breakdown spectroscopy (LIBS). J. Geochem Explor. 2021, 222, 106694. [Google Scholar] [CrossRef]
- Rifai, K.; Doucet, F.; Özcan, L.; Vidal, F. LIBS core imaging at kHz speed: Paving the way for real-time geochemical applications. Spectrochim. Acta Part B At. Spectrom. 2018, 150, 43–48. [Google Scholar] [CrossRef]
- Alvarez-Llamas, C.; Tercier, A.; Ballouard, C.; Fabre, C.; Hermelin, S.; Margueritat, J.; Duponchel, L.; Dujardin, C.; Motto-Ros, V. Ultrafast μLIBS imaging for the multiscale mineralogical characterization of pegmatite rocks. J. Anal. At. Spectrom. 2024, 39, 1077–1086. [Google Scholar] [CrossRef]
- Harmon, R.S.; Khashchevskaya, D.; Morency, M.; Owen, L.A.; Jennings, M.; Knott, J.R.; Dortch, J.M. Analysis of rock varnish from the Mojave Desert by handheld laser-induced breakdown spectroscopy. Molecules 2021, 26, 5200. [Google Scholar] [CrossRef]
- Motto-Ros, V.; Moncayo, S.; Fabre, C.; Busser, B. LIBS imaging applications. In Laser-Induced Breakdown Spectroscopy; Singh, J.P., Thakur, S., Eds.; Elsevier: Amesterdam, The Netherlands, 2020; pp. 329–346. [Google Scholar]
- Chirinos, J.R.; Oropeza, D.D.; Gonzalez, J.J.; Hou, H.; Morey, M.; Zorba, V.; Russo, R.E. Simultaneous 3-dimensional elemental imaging with LIBS and LA-ICP-MS. J. Anal. At. Spectrom. 2014, 29, 1292–1298. [Google Scholar] [CrossRef]
- Moncayo, S.; Duponchel, L.; Mousavipak, N.; Panczer, G.; Trichard, F.; Bousquet, B.; Pelascini, F.; Motto-Ros, V. Exploration of megapixel hyperspectral LIBS images using principal component analysis. J. Anal. At. Spectrom. 2018, 33, 210–220. [Google Scholar] [CrossRef]
- Fabre, C.; Devismes, D.; Moncayo, S.; Pelascini, F.; Trichard, F.; Lecomte, A.; Bousquet, B.; Cauzid, J.; Motto-Ros, V. Elemental imaging by laser-induced breakdown spectroscopy for the geological characterization of minerals. J. Anal. At. Spectrom. 2018, 33, 1345–1353. [Google Scholar] [CrossRef]
- Harmon, R.S.; Remus, J.; McMillan, N.J.; McManus, C.; Collins, L.M.; Gottfried, J.L., Jr.; DeLucia, F.C., Jr.; Miziolek, A.W. LIBS analysis of geomaterials: Geochemical fingerprinting for the rapid analysis and discrimination of minerals. Appl. Geochem. 2009, 24, 1125–1141. [Google Scholar] [CrossRef]
- Hark, R.R.; Harmon, R.S. Geochemical fingerprinting using LIBS. In Laser Induced Breakdown Spectroscopy—Theory & Applications; Musazzi, S., Perini, U., Eds.; Springer: Heidelberg, Germany, 2014; pp. 309–348. [Google Scholar]
- Harmon, R.S.; Throckmorton, C.S.; Hark, R.R.; Gottfried, J.L.; Wörner, G.; Harpp, K.; Collins, L.M. Discriminating volcanic centers with handheld laser-induced breakdown spectroscopy (LIBS). J. Archaeol. Sci. 2018, 98, 112–127. [Google Scholar] [CrossRef]
- McMillan, N.J.; Montoya, C.; Chesner, W.H. Correlation of limestone beds using laser-induced breakdown spectroscopy and chemometric analysis. Appl. Opt. 2012, 51, B213–B222. [Google Scholar] [CrossRef] [PubMed]
- Harmon, R.S.; Hark, R.R.; Throckmorton, C.S.; Rankey, E.C.; Wise, M.A.; Somers, A.M.; Collins, L.M. Geochemical fingerprinting by handheld laser-induced breakdown spectroscopy. Geostand. Geoanal. Res. 2017, 41, 563–584. [Google Scholar] [CrossRef]
- Farnsworth-Pinkerton, S.; McMillan, N.J.; Dutrow, B.L.; Henry, D.J. Provenance of detrital tourmalines from Proterozoic metasedimentary rocks in the Picuris Mountains, New Mexico, using laser-induced breakdown spectroscopy. J. Geosci. 2018, 63, 193. [Google Scholar] [CrossRef]
- McMillan, N.J.; Curry, J.; Dutrow, B.L.; Henry, D.J. Identification of the host lithology of tourmaline using laser-induced breakdown spectroscopy for application in sediment provenance and mineral exploration. Can. Mineral. 2018, 56, 393–410. [Google Scholar] [CrossRef]
- Syvilay, D.; Bousquet, B.; Chapoulie, R.; Orange, M.; Le Bourdonnec, F.X. Advanced statistical analysis of LIBS spectra for the sourcing of obsidian samples. J. Anal. At. Spectrom. 2019, 34, 867–873. [Google Scholar] [CrossRef]
- Harmon, R.S.; Throckmorton, C.S.; Haverstock, G.; Baron, D.; Yohe, R.M.; Hark, R.R.; Knott, J.R. Connecting obsidian artifacts with their sources using multivariate statistical analysis of LIBS spectral signatures. Minerals 2023, 13, 1284. [Google Scholar] [CrossRef]
- Pochon, A.; Desaulty, A.M.; Bailly, L. Handheld laser-induced breakdown spectroscopy (LIBS) as a fast and easy method to trace gold. J. Anal. At. Spectrom. 2020, 35, 254–264. [Google Scholar] [CrossRef]
- Ciucci, A.; Corsi, M.; Palleschi, V.; Rastelli, S.; Salvetti, A.; Tognoni, E. New procedure for quantitative elemental analysis by laser-induced plasma spectroscopy. Appl. Spectros. 1999, 53, 960–964. [Google Scholar] [CrossRef]
- Hu, Z.; Zhang, D.; Wang, W.; Chen, F.; Xu, Y.; Nie, J.; Chu, Y.; Guo, L. A review of calibration-free laser-induced breakdown spectroscopy. TrAC Trends Anal. Chem. 2022, 152, 116618. [Google Scholar] [CrossRef]
- Kaski, S.; Häkkänen, H.; Korppi-Tommola, J. Sulfide mineral identification using laser-induced plasma spectroscopy. Miner. Eng. 2003, 16, 1239–1243. [Google Scholar] [CrossRef]
- Fabre, C.; Boiron, M.C.; Dubessy, J.; Moissette, A. Determination of ions in individual fluid inclusions by laser ablation optical emission spectroscopy: Development and applications to natural fluid inclusions. J. Anal. At. Spectrom. 1999, 14, 913–922. [Google Scholar] [CrossRef]
- Lanza, N.L.; Ollila, A.M.; Cousin, A.; Wiens, R.C.; Clegg, S.; Mangold, N.; Bridges, N.; Cooper, D.; Schmidt, M.; Berger, J.; et al. Understanding the signature of rock coatings in laser-induced breakdown spectroscopy data. Icarus 2015, 249, 62–73. [Google Scholar] [CrossRef]
- Khajehzadeh, N.; Kauppinen, T.K. Fast mineral identification using elemental LIBS technique. IFAC-PapersOnLine 2015, 48, 119–124. [Google Scholar] [CrossRef]
- Sweetapple, M.; Tassios, S. Laser-induced breakdown spectroscopy (LIBS) as a tool for in situ mapping and textural interpretation of lithium in pegmatite minerals. Am. Mineral. 2015, 100, 2141–2151. [Google Scholar] [CrossRef]
- Sandoval-Muñoz, C.; Velásquez, G.; Álvarez, J.; Pérez, F.; Velásquez, M.; Torres, S.; Sbarbaro-Hofer, D.; Motto-Ros, V.; Yáñez, J. Enhanced elemental and mineralogical imaging of Cu-mineralized rocks by coupling μ-LIBS and HSI. J. Anal. At. Spectrom. 2022, 37, 1981–1993. [Google Scholar] [CrossRef]
- Janovszky, P.; Jancsek, K.; Palásti, D.J.; Kopniczky, J.; Hopp, B.; Tóth, T.M.; Galbács, G. Classification of minerals and the assessment of lithium and beryllium content in granitoid rocks by laser-induced breakdown spectroscopy. J. Anal. At. Spectrom. 2021, 36, 813–823. [Google Scholar] [CrossRef]
- Bolger, J.A. Semi-quantitative laser-induced breakdown spectroscopy for analysis of mineral drill core. Appl. Spectrosc. 2000, 54, 181–189. [Google Scholar] [CrossRef]
- Fontana, F.F.; van der Hoek, B.; Stromberg, J.; Tiddy, C.; Francis, N.; Tassios, S.; Uvarova, Y.A. On the use of laser-induced breakdown spectroscopy data for mineralogical investigations–constraints and application of a clustering method. Geochem. Explor. Environ. Anal. 2023, 23, geochem2023-003. [Google Scholar] [CrossRef]
- Noll, R.; Fricke-Begemann, C.; Brunk, M.; Connemann, S.; Meinhardt, C.; Scharun, M.; Sturm, V.; Makowe, J.; Gehlen, C. Laser-induced breakdown spectroscopy expands into industrial applications. Spectrochim. Acta Part B 2014, 93, 41–51. [Google Scholar] [CrossRef]
- Kim, T.; Lin, C.; Yoon, Y. Compositional mapping by laser-induced breakdown spectroscopy. J. Phys. Chem. B 1998, 102, 4284–4287. [Google Scholar] [CrossRef]
- Kuhn, K.; Meima, J.; Rammlmair, D.; Ohlendorf, C. Chemical mapping of mine waste drill cores with laser-induced breakdown spectroscopy (LIBS) and energy dispersive X-ray fluorescence (EDXRF) for mineral resource exploration. J. Geochem. Explor. 2016, 161, 72–84. [Google Scholar] [CrossRef]
- Streubel, L.; Jacobsen, L.; Merk, S.; Thees, M.; Rammlmair, D.; Meima, J.; Mory, D. Rapid analysis of geological drill-cores with LIBS. Opt. Photon. 2016, 11, 23–27. [Google Scholar] [CrossRef]
- Müller, S.; Meima, J.A.; Rammlmair, D. Detecting REE-rich areas in heterogeneous drill cores from Storkwitz using LIBS and a combination of k-means clustering and spatial raster analysis. J. Geochem. Explor. 2021, 221, 106697. [Google Scholar] [CrossRef]
- Müller, S.; Meima, J.A.; Gäbler, H.E. Improving spatially-resolved lithium quantification in drill core samples of spodumene pegmatite by using laser-induced breakdown spectroscopy and pixel-matched reference areas. J. Geochem. Explor. 2023, 250, 107235. [Google Scholar] [CrossRef]
- Meima, J.A.; Rammlmair, D. Investigation of compositional variations in chromitite ore with imaging laser induced breakdown spectroscopy and spectral angle mapper classification algorithm. Chem. Geol. 2020, 532, 119376. [Google Scholar] [CrossRef]
- Michaud, D.; Proulx, E.; Chartrand, J.G.; Barrette, L. Shooting slurries with laser-induced breakdown spectroscopy: Sampling is the name of the game. Appl. Opt. 2003, 42, 6179–6183. [Google Scholar] [CrossRef]
- Michaud, D.; Leclerc, R.; Proulx, É. Influence of particle size and mineral phase in the analysis of iron ore slurries by laser-induced breakdown spectroscopy. Spectrochim. Acta Part B At. Spectrom. 2007, 62, 1575–1581. [Google Scholar] [CrossRef]
- Oh, S.Y.; Miller, T.; Yueh, F.Y.; Singh, J.P. Comparative study of laser-induced breakdown spectroscopy measurement using two slurry circulation systems. Appl. Opt. 2007, 46, 4020–4025. [Google Scholar] [CrossRef] [PubMed]
- Ayyalasomayajula, K.K.; Dikshit, V.; Yueh, F.Y.; Singh, J.P.; Smith, L.T. Quantitative analysis of slurry sample by laser-induced breakdown spectroscopy. Anal. Bioanal. Chem. 2011, 400, 3315–3322. [Google Scholar] [CrossRef] [PubMed]
- Khajehzadeh, N.; Haavisto, O.; Koresaar, L. On-stream mineral identification of tailing slurries of an iron ore concentrator using data fusion of LIBS, reflectance spectroscopy and XRF measurement techniques. Miner. Eng. 2017, 113, 83–94. [Google Scholar] [CrossRef]
- Ayyalasomayajula, K.K.; Yueh, F.Y.; Singh, J.P. LIBS of slurry samples. In Laser-Induced Breakdown Spectroscopy; Singh, J.P., Thakur, S.N., Eds.; Elsevier: Amsterdam, The Netherlands, 2020; pp. 263–274. [Google Scholar]
- Guo, L.B.; Cheng, X.; Tang, Y.; Tang, S.S.; Hao, Z.Q.; Li, X.Y.; Lu, Y.F.; Zeng, X.Y. Improvement of spectral intensity and resolution with fiber laser for on-stream slurry analysis in laser-induced breakdown spectroscopy. Spectrochim. Acta Part B At. Spectrom. 2019, 152, 38–43. [Google Scholar] [CrossRef]
- Chen, T.; Sun, L.; Yu, H.; Qi, L.; Shang, D.; Xie, Y. Efficient weakly supervised LIBS feature selection method in quantitative analysis of iron ore slurry. Appl. Opt. 2022, 61, D22–D29. [Google Scholar] [CrossRef] [PubMed]
- Chen, T.; Sun, L.; Yu, H.; Zeng, P.; Qi, L. Online Fe grade monitoring of iron ore slurry by Morse wavelet transform and lightweight convolutional neural network based on LIBS. Spectrochim. Acta Part B At. Spectrom. 2023, 210, 106821. [Google Scholar] [CrossRef]
- Li, A.; Zhang, X.; Liu, X.; He, Y.; Shan, Y.; Sun, H.; Yi, W.; Liu, R. Real time and high-precision online determination of main components in iron ore using spectral refinement algorithm based LIBS. Opt. Exp. 2023, 31, 38728–38743. [Google Scholar] [CrossRef]
- Fabre, C.; Boiron, M.C.; Dubessy, J.; Cathelineau, M.; Banks, D.A. Palaeofluid chemistry of a single fluid event: A bulk and in-situ multi-technique analysis (LIBS, Raman spectroscopy) of an Alpine fluid (Mont-Blanc). Chem. Geol. 2002, 182, 249–264. [Google Scholar] [CrossRef]
- Derome, D.; Cuney, M.; Cathelineau, M.; Fabre, C.; Dubessy, J.; Bruneton, P.; Hubert, A. A detailed fluid inclusion study in silicified breccias from the Kombolgie sandstones (Northern Territory, Australia): Inferences for the genesis of middle-Proterozoic unconformity-type uranium deposits. J. Geochem. Explor. 2003, 80, 259–275. [Google Scholar] [CrossRef]
- Crocombe, R.A. Portable spectroscopy. Appl. Spectrosc. 2018, 72, 1701–1751. [Google Scholar] [CrossRef] [PubMed]
- Grant, K.J.; Paul, G.L.; O’Neill, J.A. Time-resolved laser-induced breakdown spectroscopy of iron ore. Appl. Spectrocsc. 1991, 44, 1711–1714. [Google Scholar] [CrossRef]
- Kavanagh, L.; Keohane, J.; Garcia Cabellos, G.; Lloyd, A.; Cleary, J. Global lithium sources—Industrial use and future in the electric vehicle industry: A review. Resources 2018, 7, 57. [Google Scholar] [CrossRef]
- Gruber, P.W.; Medina, P.A.; Keoleian, G.A.; Kesler, S.E.; Everson, M.P.; Wallington, T.J. Global lithium availability: A constraint for electric vehicles? J. Ind. Ecol. 2011, 15, 760–775. [Google Scholar] [CrossRef]
- Grosjean, C.; Miranda, P.H.; Perrin, M.; Poggi, P. Assessment of world lithium resources and consequences of their geographic distribution on the expected development of the electric vehicle industry. Renew. Sustain. Energy Rev. 2012, 16, 1735–1744. [Google Scholar] [CrossRef]
- Kesler, S.E.; Gruber, P.W.; Medina, P.A.; Keoleian, G.A.; Everson, M.P.; Wallington, T.J. Global lithium resources: Relative importance of pegmatite, brine and other deposits. Ore Geol. Rev. 2012, 48, 55–69. [Google Scholar] [CrossRef]
- Fabre, C.; Boiron, M.C.; Dubessy, J.; Chabiron, A.; Charoy, B.; Crespo, T.M. Advances in lithium analysis in solids by means of laser-induced breakdown spectroscopy: An exploratory study. Geochim. Cosmochim Acta 2002, 66, 1401–1407. [Google Scholar] [CrossRef]
- Ribeiro, R.; Capela, D.; Ferreira, M.; Martins, R.; Jorge, P.; Guimarães, D.; Lima, A. X-ray fluorescence and laser-induced breakdown spectroscopy analysis of Li-rich minerals in veins from Argemela Tin Mine, Central Portugal. Minerals 2021, 11, 1169. [Google Scholar] [CrossRef]
- Rifai, K.; Constantin, M.; Yilmaz, A.; Özcan, L.Ç.; Doucet, F.R.; Azami, N. Quantification of lithium and mineralogical mapping in crushed ore samples using laser induced breakdown spectroscopy. Minerals 2022, 12, 253. [Google Scholar] [CrossRef]
- Días, F.; Ribeiro, R.; Gonçalves, F.; Lima, A.; Roda-Robles, E.; Martins, T. Calibrating a handheld LIBS for Li exploration in the Barroso–Alvão Aplite-Pegmatite Field, Northern Portugal: Textural precautions and procedures when analyzing spodumene and petalite. Minerals 2023, 13, 470. [Google Scholar] [CrossRef]
- Harmon, R.S.; Wise, M.A.; Curry, A.C.; Mistele, J.S.; Mason, M.S.; Grimac, Z. Rapid analysis of muscovites on a lithium pegmatite prospect by handheld LIBS. Minerals 2023, 13, 697. [Google Scholar] [CrossRef]
- Romppanen, S.; Pölönen, I.; Häkkänen, H.; Kaski, S. Optimization of spodumene identification by statistical approach for laser-induced breakdown spectroscopy data of lithium pegmatite ores. Appl. Spectrosc. Rev. 2023, 58, 297–317. [Google Scholar] [CrossRef]
- Wise, M.A.; Curry, A.C.; Harmon, R.S. Reevaluation of the K/Rb-Li Systematics in muscovite as a potential exploration tool for identifying Li mineralization in granitic pegmatites. Minerals 2024, 14, 117. [Google Scholar] [CrossRef]
- Beryllium: Economic Geology, Material Flow, and Global Importance of a Key Critical Mineral. Available online: https://www.usgs.gov/centers/geology-energy-and-minerals-science-center/science/beryllium-economic-geology-material-flow (accessed on 28 April 2024).
- McManus, C.E.; McMillan, N.J.; Harmon, R.S.; Whitmore, R.C.; De Lucia, F.C., Jr.; Miziolek, A.W. Use of laser induced breakdown spectroscopy in the determination of gem provenance: Beryls. Appl. Opt. 2008, 47, G72–G79. [Google Scholar] [CrossRef] [PubMed]
- Industrial Diamond Statistics and Information. Available online: http://www.usgs.gov/centers/national-minerals-information-center/industrial-diamond-statistics-and-information (accessed on 28 April 2024).
- Gurney, J.J.; Switzer, G.S. The discovery of garnets closely related to diamonds in thee Finsch pipe, South Africa. Contrib. Mineral. Petrol. 1973, 39, 103–116. [Google Scholar] [CrossRef]
- Bieri, F. From Blood Diamonds to the Kimberley Process How NGOs Cleaned up the Global Diamond Industry; Routledge: New York, NY, USA, 2016. [Google Scholar]
- McManus, C.E.; Dowe, J.; McMillan, N.J. Use of CC and CN molecular emissions in laser-induced breakdown spectroscopy data to determine diamond provenance. Microsc. Microanal. 2017, 23, 2282–2283. [Google Scholar] [CrossRef]
- McManus, C.E.; McMillan, N.J.; Dowe, J.; Bell, J. Diamonds certify themselves: Multivariate statistical provenance analysis. Minerals 2020, 10, 916. [Google Scholar] [CrossRef]
- Krzemnicki, M.S.; Hänni, H.A.; Walters, R.A. A new method for detecting Be diffusion-treated sapphires: Laser-induced breakdown spectroscopy (LIBS). Gems Gemol. 2004, 40, 314–322. [Google Scholar] [CrossRef]
- Agrosì, G.; Tempesta, G.I.; Scandale, E.; Legnaioli, S.; Lorenzetti, G.; Pagnotta, S.; Palleschi, V.; Mangone, A.; Lezzerini, M. Application of laser induced breakdown spectroscopy to the identification of emeralds from different synthetic processes. Spectrochim. Acta Part B At. Spectrom. 2014, 102, 48–51. [Google Scholar] [CrossRef]
- Fluorine. Available online: https://www.rsc.org/periodic-table/element/9/fluorine (accessed on 28 April 2024).
- Fluorine. Available online: https://www.usgs.gov/publications/fluorine (accessed on 28 April 2024).
- Quarles, C.D.; Gonzalez, J.J.; East, L.J.; Yoo, J.H.; Morey, M.; Russo, R.E. Fluorine analysis using laser induced breakdown spectroscopy (LIBS). J. Anal. At. Spectrom. 2014, 29, 1238–1242. [Google Scholar] [CrossRef]
- Álvarez, C.; Pisonero, J.; Bordel, N. Quantification of fluorite mass-content in powdered ores using a laser-induced breakdown spectroscopy method based on the detection of minor elements and CaF molecular bands. Spectrochim. Acta Part B At. Spectrom. 2014, 100, 123–128. [Google Scholar] [CrossRef]
- Tang, Z.; Zhou, R.; Hao, Z.; Zhang, W.; Li, Q.; Zeng, Q.; Li, X.; Zeng, X.; Lu, Y. Determination of fluorine in copper ore using laser-induced breakdown spectroscopy assisted by the SrF molecular emission band. J. Anal. At. Spectrom. 2020, 35, 754–761. [Google Scholar] [CrossRef]
- Foucaud, Y.; Fabre, C.; Demeusy, B.; Filippova, I.V.; Filippov, L.O. Optimisation of fast quantification of fluorine content using handheld laser induced breakdown spectroscopy. Spectrochim. Acta Part B At. Spectrom. 2019, 158, 105628. [Google Scholar] [CrossRef]
- Gow, N.N.; Lozej, G.P. Bauxite. Geosci. Can. 1993, 20, 9–16. [Google Scholar]
- Fahad, M.; Ali, S.; Shah, K.H.; Shahzad, A.; Abrar, M. Quantitative elemental analysis of high silica bauxite using calibration-free laser-induced breakdown spectroscopy. Appl. Opt. 2019, 58, 7588–7596. [Google Scholar] [CrossRef] [PubMed]
- Meima, J.A.; Orberger, B.; Piña, C.G.; Prudhomme, A.; Dittrich, C. Increasing resource efficiency of bauxite using LIBS. Mater. Proc. 2021, 5, 81. [Google Scholar] [CrossRef]
- Phosphorus. Available online: https://www.rsc.org/periodic-table/element/15/phosphorus (accessed on 4 July 2024).
- Asimellis, G.; Giannoudakos, A.; Kompitsas, M. Phosphate ore beneficiation via determination of phosphorus-to-silica ratios by Laser Induced Breakdown Spectroscopy. Spectrochim. Acta Part B At. Spectrom. 2006, 61, 1253–1259. [Google Scholar] [CrossRef]
- Gaft, M.; Sapir-Sofer, I.; Modiano, H.; Stana, R. Laser induced breakdown spectroscopy for bulk minerals online analyses. Spectrochim. Acta Part B At. Spectrosc. 2007, 62, 1496–1503. [Google Scholar] [CrossRef]
- Gaft, M.; Nagli, L.; Groisman, Y.; Barishnikov, A. Industrial online raw materials analyzer based on laser-induced breakdown spectroscopy. Appl. Spectrosc. 2014, 68, 1004–1015. [Google Scholar] [CrossRef]
- Rifai, K.; Özcan, L.; Doucet, F.; Azami, N.; Deshays, L.; Lebbardi, A.; Vidal, F. Rapid analysis of phosphate slurries and pressed pellets using laser-induced breakdown spectroscopy. Spectrochim. Acta Part B At. Spectrosc. 2020, 163, 105735. [Google Scholar] [CrossRef]
- Dong, H.; Sun, L.; Qi, L.; Yu, H.; Zeng, P. A lightweight convolutional neural network model for quantitative analysis of phosphate ore slurry based on laser-induced breakdown spectroscopy. J. Anal. At. Spectrom. 2021, 36, 2528–2535. [Google Scholar] [CrossRef]
- Zhang, P.; Sun, L.; Qi, L.; Yu, H. On-line quantitative analysis of major elements in phosphate slurry using LIBS assisted by plasma information from orthogonal directions imaging. Measurement 2024, 234, 114827. [Google Scholar] [CrossRef]
- About Sulfur. Available online: https://www.sulphurinstitute.org/about-sulphur/introduction-to-sulphur/ (accessed on 3 May 2024).
- Gaft, M.; Nagli, L.; Fasaki, I.; Kompitsas, M.; Wilsch, G. Laser-induced breakdown spectroscopy for on-line sulfur analyses of minerals in ambient conditions. Spectrochim. Acta Part B At. Spectrosc. 2009, 64, 1098–1104. [Google Scholar] [CrossRef]
- Lime/Limestone. Available online: https://www.spglobal.com/commodityinsights/en/ci/products/lime-chemical-economics-handbook.html (accessed on 3 May 2024).
- Oates, J.A.H. Lime and Limestone: Chemistry and Technology, Production and Uses; John Wiley and Sons: Hoboken, NJ, USA, 1998. [Google Scholar]
- Fahad, M.; Farooq, Z.; Abrar, M. Comparative study of calibration-free laser-induced breakdown spectroscopy methods for quantitative elemental analysis of quartz-bearing limestone. Appl. Opt. 2019, 58, 3501–3508. [Google Scholar] [CrossRef] [PubMed]
- Agresti, J.; Indelicato, C.; Perotti, M.; Moreschi, R.; Osticioli, I.; Cacciari, I.; Mencaglia, A.A.; Siano, S. Quantitative compositional analyses of calcareous rocks for lime industry using LIBS. Molecules 2022, 27, 1813. [Google Scholar] [CrossRef] [PubMed]
- Transition Metals: Definition, Properties, Use, and Types. 2024. Available online: https://www.xometry.com/resources/materials/transition-metals/ (accessed on 6 May 2024).
- Grant, K.J.; Paul, G.L.; O’Neill, J.A. Quantitative elemental analysis of iron ore by laser-induced breakdown spectroscopy. Appl. Spectrosc. 1991, 45, 701–705. [Google Scholar] [CrossRef]
- Sun, Q.; Tran, M.; Smith, B.W.; Winefordner, J.D. Determination of Mn and Si in iron ore by laser-induced plasma spectroscopy. Anal. Chim. Acta 2000, 413, 187–195. [Google Scholar] [CrossRef]
- Death, D.L.; Cunningham, A.P.; Pollard, L.J. Multi-element analysis of iron ore pellets by laser-induced breakdown spectroscopy and principal components regression. Spectrochim. Acta Part B At. Spectrosc. 2008, 63, 763–769. [Google Scholar] [CrossRef]
- Yaroshchyk, P.; Death, D.L.; Spencer, S.J. Comparison of principal components regression, partial least squares regression, multi-block partial least squares regression, and serial partial least squares regression algorithms for the analysis of Fe in iron ore using LIBS. J. Anal. At. Spectrom. 2012, 27, 92–98. [Google Scholar] [CrossRef]
- Hao, Z.Q.; Li, C.M.; Shen, M.; Yang, X.Y.; Li, K.H.; Guo, L.B.; Li, X.Y.; Lu, Y.F.; Zeng, X.Y. Acidity measurement of iron ore powders using laser-induced breakdown spectroscopy with partial least squares regression. Opt. Exp. 2015, 23, 7795–7801. [Google Scholar] [CrossRef]
- Guo, Y.M.; Guo, L.B.; Hao, Z.Q.; Tang, Y.; Ma, S.X.; Zeng, Q.D.; Tang, S.S.; Li, X.Y.; Lu, Y.F.; Zeng, X.Y. Accuracy improvement of iron ore analysis using laser-induced breakdown spectroscopy with a hybrid sparse partial least squares and least-squares support vector machine model. J. Anal. At. Spectrom. 2018, 33, 1330–1335. [Google Scholar] [CrossRef]
- Wang, P.; Li, N.; Yan, C.; Feng, Y.; Ding, Y.; Zhang, T.; Li, H. Rapid quantitative analysis of the acidity of iron ore by the laser-induced breakdown spectroscopy (LIBS) technique coupled with variable importance measures-random forests (VIM-RF). Anal. Methods 2019, 11, 3419–3428. [Google Scholar] [CrossRef]
- Su, P.; Wu, X.; Li, C.; Yan, C.; An, Y.; Liu, S. A versatile method for quantitative analysis of total iron content in iron ore using laser-induced breakdown spectroscopy. Appl. Spectrosc. 2023, 77, 140–150. [Google Scholar] [CrossRef]
- Sheng, L.; Zhang, T.; Niu, G.; Wang, K.; Tang, H.; Duan, Y.; Li, H. Classification of iron ores by laser-induced breakdown spectroscopy (LIBS) combined with random forest (RF). J. Anal. At. Spectrom. 2015, 30, 453–458. [Google Scholar] [CrossRef]
- Yang, Y.; Hao, X.; Zhang, L.; Ren, L. Application of scikit and keras libraries for the classification of iron ore data acquired by laser-induced breakdown spectroscopy (LIBS). Sensors 2020, 20, 1393. [Google Scholar] [CrossRef]
- Zhao, W.; Li, C.; Yan, C.; Min, H.; An, Y.; Liu, S. Interpretable deep learning-assisted laser-induced breakdown spectroscopy for brand classification of iron ores. Anal. Chim. Acta 2021, 1166, 338574. [Google Scholar] [CrossRef] [PubMed]
- Meima, J.A.; Rammlmair, D.; Junge, M. The use of laser induced breakdown spectroscopy for the mineral chemistry of chromite, orthopyroxene and plagioclase from Merensky Reef and UG-2 chromitite, Bushveld Complex, South Africa. Chem. Geol. 2021, 589, 120686. [Google Scholar] [CrossRef]
- Soulamidis, G.; Jatteau, M.; Stouraiti, C.; Voudouris, P.; Mavrogonatos, C.; Soukis, K.; Fabre, C.; Caumon, M.C.; Cauzid, J.; Tarantola, A. Application of portable spectroscopic tools in the exploration of manganese oxide minerals: Preliminary results from the case study of Drama Mn-oxide deposits, northern Greece. Mater. Proc. 2023, 15, 54. [Google Scholar] [CrossRef]
- Sangster, D.F. Geology of base metal deposits. In Encyclopedia of Life Support Systems; Cholakov, G.S., Nath, B., Eds.; UNESCO-EOLLS Publishers: Oxford, UK, 2009; Volume 6, pp. 91–116. [Google Scholar]
- Ahmad, N.; Ahmed, R.; Umar, Z.A.; Liaqat, U.; Manzoor, U.; Baig, M.A. Qualitative and quantitative analyses of copper ores collected from Baluchistan, Pakistan using LIBS and LA-TOF-MS. Appl. Phys. B 2018, 124, 160–170. [Google Scholar] [CrossRef]
- Ahmad, A.; Hafeez, M.; Abbasi, S.A.; Khan, T.M.; Faruque, M.R.I.; Khandaker, M.U.; Ahmad, P.; Rafique, M.; Haleem, N. Compositional analysis of chalcopyrite using calibration-free laser-induced breakdown spectroscopy. Appl. Sci. 2020, 10, 6848. [Google Scholar] [CrossRef]
- Hafeez, M.; Abbasi, S.A.; Rafique, M.; Hayder, R.; Sajid, M.; Iqbal, J.; Ahmad, N.; Shahida, S. Calibration-free laser-induced breakdown spectroscopic analysis of copper-rich mineral collected from the Gilgit-Baltistan region of Pakistan. Appl. Opt. 2020, 59, 68–76. [Google Scholar] [CrossRef]
- Baele, J.M.; Bouzahzah, H.; Papier, S.; Decrée, S.; Verheyden, S.; Burlet, C.; Pirard, E.; Franceschi, G.; Dejonghe, L. Trace-element imaging at macroscopic scale in a Belgian sphalerite-galena ore using laser-induced breakdown spectroscopy (LIBS). Geol. Belg. 2021, 24, 125–137. [Google Scholar] [CrossRef]
- Álvarez, J.; Velásquez, M.; Sandoval-Muñoz, C.; Castillo, R.D.P.; Bastidas, C.Y.; Luarte, D.; Sbárbaro, D.; Rammlmair, D.; Yáñez, J. Improved mineralogical analysis in copper ores by laser-induced breakdown spectroscopy. J. Anal. At. Spectrom. 2022, 37, 1994–2004. [Google Scholar] [CrossRef]
- Varotsis, C.; Tselios, C.; Yiannakkos, K.A.; Andreou, C.; Papageorgiou, M.; Nicolaides, A. Application of double-pulse laser-induced breakdown spectroscopy (DP-LIBS), Fourier transform infrared micro-spectroscopy and Raman microscopy for the characterization of copper-sulfides. RSC Adv. 2022, 12, 631–639. [Google Scholar] [CrossRef]
- Velásquez, M.; Álvarez, J.; Sandoval, C.; Ramírez, E.; Bravo, M.; Fuentes, R.; Myakalwar, A.K.; Castillo, R.; Luarte, D.; Sbarbaro, D.; et al. Improved elemental quantification in copper ores by laser-induced breakdown spectroscopy with judicious data processing. Spectrochim. Acta Part B At. Spectrom. 2022, 188, 106343. [Google Scholar] [CrossRef]
- Velásquez, M.; Myakalwar, A.K.; Manzoor, S.; Vadillo, J.M.; Laserna, J.; Yanez, J. Progress in arsenic determination at low levels in copper ores by laser-induced breakdown spectroscopy. Spectrochim. Acta Part B At. Spectrom. 2022, 195, 106501. [Google Scholar] [CrossRef]
- Brinkmann, P.; Köllner, N.; Merk, S.; Beitz, T.; Altenberger, U.; Löhmannsröben, H.G. Comparison of handheld and echelle spectrometer to assess copper in ores by means of laser-induced breakdown spectroscopy (LIBS). Minerals 2023, 13, 113. [Google Scholar] [CrossRef]
- Łazarek, Ł.; Antończak, A.J.; Wójcik, M.R.; Drzymała, J.; Abramski, K.M. Evaluation of the laser-induced breakdown spectroscopy technique for determination of the chemical composition of copper concentrates. Spectrochim. Acta Part B At. Spectrom. 2014, 97, 74–78. [Google Scholar] [CrossRef]
- Ormachea, O.; Villazón, A.; Terceros, I. Analysis of mining ore concentrates with a low cost portable LIBS system. Investig. Desarrollo 2018, 18, 81–90. [Google Scholar] [CrossRef]
- Fuentes, R.; Luarte, D.; Sandoval, C.; Myakalwar, A.K.; Yáñez, J.; Sbarbaro, D. Data fusion of laser induced breakdown spectroscopy and diffuse reflectance for improved analysis of mineral species in copper concentrates. Miner. Eng. 2021, 173, 107193. [Google Scholar] [CrossRef]
- Fuentes, R.; Luarte, D.; Sandoval, C.; Myakalwar, A.K.; Alvarez, J.; Yáñez, J.; Sbarbaro, D. Laser-induced breakdown spectroscopy and hyperspectral imaging data fusion for improved mineralogical analysis of copper concentrates. IFAC-PapersOnLine 2022, 55, 85–90. [Google Scholar] [CrossRef]
- Koh, E.J.; Amini, E.; Spier, C.A.; McLachlan, G.J.; Xie, W.; Beaton, N. A mineralogy characterisation technique for copper ore in flotation pulp using deep learning machine vision with optical microscopy. Miner. Eng. 2024, 205, 108481. [Google Scholar] [CrossRef]
- Niobium and Tantalum Statistics and Information. Available online: https://www.usgs.gov/centers/national-minerals-information-center/niobium-and-tantalum-statistics-and-information (accessed on 8 May 2024).
- Montague, D. Stolen goods: Coltan and conflict in the Democratic Republic of Congo. SAIS Rev. Intl. Aff. 2002, 22, 103. [Google Scholar] [CrossRef]
- Gäbler, H.E.; Melcher, F.; Graupner, T.; Bahr, A.; Sitnikova, M.A.; Henjes-Kunst, F.; Oberthür, T.; Brätz, H.; Gerdes, A. Speeding up the analytical workflow for Coltan fingerprinting by an integrated mineral liberation analysis/LA-ICP-MS approach. Geostand. Geoanal. Res. 2011, 35, 431–448. [Google Scholar] [CrossRef]
- Savu-Krohn, C.; Rantitsch, G.; Auer, P.; Melcher, F.; Graupner, T. Geochemical fingerprinting of coltan ores by machine learning on uneven datasets. Nat. Resour. Res. 2011, 20, 177–191. [Google Scholar] [CrossRef]
- Harmon, R.S.; Shughrue, K.M.; Remus, J.J.; Wise, M.A.; East, L.J.; Hark, R.R. Can the provenance of the conflict minerals columbite and tantalite be ascertained by laser-induced breakdown spectroscopy? Anal. Bioanal. Chem. 2011, 400, 3377–3382. [Google Scholar] [CrossRef] [PubMed]
- Hark, R.R.; Remus, J.J.; East, L.J.; Harmon, R.S.; Wise, M.A.; Tansi, B.M.; Shughrue, K.M.; Dunsin, K.S.; Liu, C. Geographical analysis of “conflict minerals” utilizing laser-induced breakdown spectroscopy. Spectrochim. Acta Part B At. Spectrom. 2012, 74, 131–136. [Google Scholar] [CrossRef]
- Platinum-Group Elements. Available online: https://www.usgs.gov/publications/platinum-group-elements# (accessed on 8 May 2024).
- Maier, W.D. Platinum-group element (PGE) deposits and occurrences: Mineralization styles, genetic concepts, and exploration criteria. J. Afr. Earth Sci. 2005, 41, 165–191. [Google Scholar] [CrossRef]
- Rifai, K.; Özcan, L.Ç.; Doucet, F.R.; Rhoderick, K.; Vidal, F. Ultrafast elemental mapping of platinum group elements and mineral identification in platinum-palladium ore using laser induced breakdown spectroscopy. Minerals 2020, 10, 207. [Google Scholar] [CrossRef]
- Mohamed, N.; Rifai, K.; Selmani, S.; Constantin, M.; Doucet, F.R.; Özcan, L.Ç.; Sabsabi, M.; Vidal, F. Chemical and mineralogical mapping of platinum-group element ore samples using laser-induced breakdown spectroscopy and micro-X-ray fluorescence. Geostand. Geoanal. Res. 2021, 45, 539–550. [Google Scholar] [CrossRef]
- Selmani, S.; Mohamed, N.; Elhamdaoui, I.; Fernandes, J.; Bouchard, P.; Constantin, M.; Sabsabi, M.; Vidal, F. Laser-induced breakdown spectroscopy analysis of palladium in rock ore. Spectrochim. Acta Part B At. Spectrom. 2022, 196, 106523. [Google Scholar] [CrossRef]
- Elhamdaoui, I.; Selmani, S.; Sabsabi, M.; Constantin, M.; Bouchard, P.; Vidal, F. Quantifying platinum and palladium in solid ore using laser-induced breakdown spectroscopy assisted by the laser-induced fluorescence (LIBS-LIF) technique. Appl. Spectrosc. 2023, 77, 1382–1392. [Google Scholar] [CrossRef] [PubMed]
- Selmani, S.; Elhamdaoui, I.; Mohamed, N.; Bouchard, P.; Constantin, M.; Sabsabi, M.; Vidal, F. Laser-produced craters in minerals of a palladium ore sample. Appl. Phys. A 2023, 129, 737. [Google Scholar] [CrossRef]
- Precious Metals: Definition, Properties, Uses, and Types. 2024. Available online: https://www.xometry.com/resources/materials/precious-metals/ (accessed on 4 July 2024).
- Díaz, D.; Hahn, D.W.; and Molina, A. Quantification of gold and silver in minerals by laser-induced breakdown spectroscopy. Spectrochim. Acta Part B At. Spectrom. 2017, 136, 106–115. [Google Scholar] [CrossRef]
- Díaz, D.; Molina, A.; Hahn, D. Effect of laser irradiance and wavelength on the analysis of gold-and silver-bearing minerals with laser-induced breakdown spectroscopy. Spectrochim. Acta Part B At. Spectrom. 2018, 145, 86–95. [Google Scholar] [CrossRef]
- Fahad, M.; Ali, S.; Shahzad, A.; Shah, K.H. Determination of base metals and gold in Pb-Sb sulfosalt mineral boulangerite using laser-induced breakdown spectroscopy and inductively coupled plasma optical emission spectrometry. Laser Phys. 2020, 30, 095701. [Google Scholar] [CrossRef]
- Díaz, D.; Molina, A.; Hahn, D.W. Laser-induced breakdown spectroscopy and principal component analysis for the classification of spectra from gold-bearing ores. Appl. Spectrosc. 2020, 74, 42–54. [Google Scholar] [CrossRef]
- Elhamdaoui, I.; Rifai, K.; Iqbal, J.; Mohamed, N.; Selmani, S.; Fernandes, J.; Bouchard, P.; Constantin, M.; Laflamme, M.; Sabsabi, M.; et al. Measuring the concentration of gold in ore samples by laser-induced breakdown spectroscopy and comparison with the gravimetry/atomic absorption techniques. Spectrochim. Acta Part B At. Spectrom. 2021, 183, 106256. [Google Scholar] [CrossRef]
- Gervais, F.; Rifai, K.; Plamondon, P.; Özcan, L.; Doucet, F.; Vidal, F. Compositional tomography of a gold-bearing sample by laser-induced breakdown spectroscopy. Terra Nova 2019, 31, 479–484. [Google Scholar] [CrossRef]
- Sillitoe, R.H.; Hedenquist, J.W. Linkages between volcanotectonic settings, ore-fluid compositions, and epithermal precious metal deposits. Soc. Econ. Geol. Sp. Pub. 2003, 10, 315–343. [Google Scholar]
- Loen, J.S. Use of placer gold characteristics to locate bedrock gold mineralization. Explor. Mining Geol. 1995, 4, 335–339. [Google Scholar]
- Tin. Available online: https://www.rsc.org/periodic-table/element/50/tin (accessed on 4 July 2024).
- Rare Earth Elements. Available online: https://www.smenet.org/What-We-Do/Technical-Briefings/Rare-Earth-Elements (accessed on 10 May 2024).
- Abedin, K.M.; Haider, A.F.M.Y.; Rony, M.A.; Khan, Z.H. Identification of multiple rare earths and associated elements in natural monazite sands by laser induced breakdown spectroscopy. Opt. Laser Technol. 2011, 43, 45–49. [Google Scholar] [CrossRef]
- Romppanen, S.; Häkkänen, H.; Kaski, S. Singular value decomposition approach to the yttrium occurrence in mineral maps of rare earth element ores using laser-induced breakdown spectroscopy. Spectrochim. Acta Part B At. Spectrom. 2017, 134, 69–74. [Google Scholar] [CrossRef]
- Bhatt, C.R.; Jain, J.C.; Goueguel, C.L.; McIntyre, D.L.; Singh, J.P. Determination of rare earth elements in geological samples using laser-induced breakdown spectroscopy (LIBS). Appl. Spectrosc. 2018, 72, 114–121. [Google Scholar] [CrossRef]
- Gaft, M.; Raichlin, Y.; Pelascini, F.; Panzer, G.; Ros, V.M. Imaging rare-earth elements in minerals by laser-induced plasma spectroscopy: Molecular emission and plasma-induced luminescence. Spectrochim. Acta Part B At. Spectrom. 2019, 151, 12–19. [Google Scholar] [CrossRef]
- Manard, B.T.; Wylie, E.M.; Willson, S.P. Analysis of rare earth elements in uranium using handheld laser-induced breakdown spectroscopy (HH LIBS). Appl. Spectrosc. 2018, 72, 1653–1660. [Google Scholar] [CrossRef] [PubMed]
- Bhatt, C.R.; Hartzler, D.; Jain, J.C.; McIntyre, D.L. Evaluation of analytical performance of double pulse laser-induced breakdown spectroscopy for the detection of rare earth elements. Opt. Laser Technol. 2020, 126, 106110. [Google Scholar] [CrossRef]
- Afgan, M.S.; Hou, Z.; Song, W.; Liu, J.; Song, Y.; Gu, W.; Wang, Z. On the spectral identification and wavelength dependence of rare-earth ore emission by laser-induced breakdown spectroscopy. Chemosensors 2022, 10, 350. [Google Scholar] [CrossRef]
- Akhmetzhanov, T.F.; Popov, A.M. Direct determination of lanthanides by LIBS in REE-rich ores: Comparison between univariate and DoE based multivariate calibrations with respect to spectral resolution. J. Anal. At. Spectrom. 2022, 37, 2330–2339. [Google Scholar] [CrossRef]
- Li, J.; Tang, Z.; Hao, Z.; Huang, Z.; Zhu, C.; Li, Q.; He, B.; Chen, J.; Li, X. Determination of La in ore using laser-induced breakdown spectroscopy combined with laser-induced fluorescence and standard addition method. J. Anal. At. Spectrom. 2022, 37, 2176–2181. [Google Scholar] [CrossRef]
- Akhmetzhanov, T.F.; Labutin, T.A.; Korshunov, D.M.; Samsonov, A.A.; Popov, A.M. Determination of Ce and La in REE-rich ores using handheld LIBS and PLS regression. J. Anal. At. Spectrom. 2023, 38, 2134–2143. [Google Scholar] [CrossRef]
- Deng, Z.; Hao, Z.; Liu, L.; Xu, Z.; Zhao, Z.; Lu, Y.; Shi, J.; He, X. Detection of Y, La, Yb, and Dy elements in rare earth ores by double-pulse laser-induced breakdown spectroscopy. J. Laser Appl. 2023, 35, 022003. [Google Scholar] [CrossRef]
- Fayyaz, A.; Asghar, H.; Alshehri, A.M.; Alrebdi, T.A. LIBS assisted PCA analysis of multiple rare-earth elements (La, Ce, Nd, Sm, and Yb) in phosphorite deposits. Heliyon 2023, 9, e13957. [Google Scholar] [CrossRef] [PubMed]
- Fayyaz, A.; Ali, R.; Waqas, M.; Liaqat, U.; Ahmad, R.; Umar, Z.A.; Baig, M.A. Analysis of rare earth ores using laser-induced breakdown spectroscopy and laser ablation time-of-flight mass spectrometry. Minerals 2023, 13, 787. [Google Scholar] [CrossRef]
- Liu, X.; Yan, C.; An, D.; Yue, C.; Zhang, T.; Tang, H.; Li, H. Rapid quantitative analysis of rare earth elements Lu and Y in rare earth ores by laser induced breakdown spectroscopy combined with iPLS-VIP and partial least squares. RSC Adv. 2023, 13, 15347–15355. [Google Scholar] [CrossRef] [PubMed]
- Yang, J.; Liu, Z.; Yang, C.; Gao, J.; Zhu, Z.; Sun, S.; Liu, X.; Liu, Z. Determination of La in rare earth ores using laser-induced breakdown spectroscopy combined with bidirectional long short-term memory. Appl. Phys. B 2024, 130, 1–9. [Google Scholar] [CrossRef]
- Uranium Overview. Available online: https://www.cameco.com/uranium_101/uranium-overview (accessed on 28 April 2024).
- Uranium. Available online: https://www.rsc.org/periodic-table/element/92/uranium (accessed on 10 May 2024).
- Sirven, J.B.; Pailloux, A.; M’Baye, Y.; Coulon, N.; Alpettaz, T.; Gosse, S. Towards the determination of the geographical origin of yellow cake samples by laser-induced breakdown spectroscopy and chemometrics. J. Anal. At. Spectrom. 2009, 24, 451–459. [Google Scholar] [CrossRef]
- Kim, Y.S.; Han, B.Y.; Shin, H.S.; Kim, H.D.; Jung, E.C.; Jung, J.H.; Na, S.H. Determination of uranium concentration in an ore sample using laser-induced breakdown spectroscopy. Spectrochim. Acta Part B At. Spectrom. 2012, 74, 190–193. [Google Scholar] [CrossRef]
- Barefield II, J.E.; Judge, E.J.; Campbell, K.R.; Colgan, J.P.; Kilcrease, D.P.; Johns, H.M.; Wiens, R.C.; McInroy, R.E.; Martinez, R.K.; Clegg, S.M. Analysis of geological materials containing uranium using laser-induced breakdown spectroscopy. Spectrochim. Acta Part B At. Spectrom. 2016, 120, 1–8. [Google Scholar] [CrossRef]
- Ji, J.; Song, W.; Hou, Z.; Li, L.; Yu, X.; Wang, Z. Raw signal improvement using beam shaping plasma modulation for uranium detection in ore using laser-induced breakdown spectroscopy. Anal. Chim. Acta. 2022, 1235, 340551. [Google Scholar] [CrossRef]
- Li, Q.; Zhang, W.; Tang, Z.; Zhou, R.; Yan, J.; Zhu, C.; Liu, K.; Li, X.; Zeng, X. Determination of uranium in ores using laser-induced breakdown spectroscopy combined with laser-induced fluorescence. J. Anal. At. Spectrom. 2020, 35, 626–631. [Google Scholar] [CrossRef]
- Klus, J.; Mikysek, P.; Prochazka, D.; Pořízka, P.; Prochazková, P.; Novotný, J.; Trojek, T.; Novotný, K.; Slobodník, M.; Kaiser, J. Multivariate approach to the chemical mapping of uranium in sandstone-hosted uranium ores analyzed using double pulse laser-induced breakdown spectroscopy. Spectrochim. Acta Part B At. Spectrom. 2016, 123, 143–149. [Google Scholar] [CrossRef]
- Holá, M.; Novotný, K.; Dobeš, J.; Krempl, I.; Wertich, V.; Mozola, J.; Kubeš, M.; Faltusová, V.; Leichmann, J.; and Kanický, V. Dual imaging of uranium ore by laser ablation inductively coupled plasma mass spectrometry and laser induced breakdown spectroscopy. Spectrochim. Acta Part B At. Spectrom. 2021, 186, 106312. [Google Scholar] [CrossRef]
- Krempl, I.; Novotný, K.; Wertich, V.; Škoda, R.; Kanický, V.; Leichmann, J. Distinguishing secondary uranium mineralizations in uranium ore using LIBS imaging. Spectrochim. Acta Part B At. Spectrom. 2023, 206, 1067340. [Google Scholar] [CrossRef]
- Andrews, H.B.; Quarles, C.D., Jr.; Bradley, V.C.; Spano, T.L.; Petrus, J.A.; Paul, B.; Zirakparvar, N.A.; Dunlap, D.R.; Hexel, C.R.; Manard, B.T. Advancing elemental and isotopic analysis of uranium mineral inclusions: Rapid screening via laser-induced breakdown spectroscopy and high-resolution laser ablation-ICP-MS mapping. Microchem. J. 2024, 196, 109605. [Google Scholar] [CrossRef]
- Gibaga, C.R.L.; Montano, M.O.; Samaniego, J.O.; Tanciongco, A.M.; Quierrez, R.N.M.; Gervasio, J.H.C.; Reyes, R.C.G.; Peralta, M.J.V.; Catague, G.V., Jr. Comparative study on determination of critical minerals in Ni laterites using handheld LIBS, handheld XRF, and ICP-MS. Philipp J. Sci. 2023, 151, 1595–1600. [Google Scholar] [CrossRef]
- Bi, Y.; Zhang, Y.; Yan, J.; Wu, Z.; Li, Y. Classification and discrimination of minerals using laser induced breakdown spectroscopy and Raman spectroscopy. Plasma Sci. Technol. 2015, 17, 923. [Google Scholar] [CrossRef]
- Wang, Q.; Xiao, J.; Li, Y.; Lu, Y.; Guo, J.; Tian, Y.; Ren, L. Mid-level data fusion of Raman spectroscopy and laser-induced breakdown spectroscopy: Improving ores identification accuracy. Anal. Chim. Acta 2023, 1240, 340772. [Google Scholar] [CrossRef] [PubMed]
- Wang, Q.; Li, F.; Jiang, X.; Wu, S.; Xu, M. On-stream mineral identification of tailing slurries of tungsten via NIR and XRF data fusion measurement techniques. Anal. Methods 2020, 12, 3296–3307. [Google Scholar] [CrossRef]
- Bol’shakov, A.A.; Mao, X.; González, J.J.; Russo, R.E. Laser ablation molecular isotopic spectrometry (LAMIS): Current state of the art. J. Anal. At. Spectrom. 2016, 31, 119–134. [Google Scholar] [CrossRef]
Figure 1.
Example broadband LIBS spectrum between 200 and 800 nm for the Limica lepidolite [KLi2Al(Si,Al)4O10(F,OH)2] from the Grosmont Pegmatite District (Australia). Sample chemical composition can be determined from such LIBS spectra because the position of the emission lines is specific to each element present in a sample and its intensity is related to its concentration. Ar lines are present in the spectrum since this is the purge gas used by the handheld LIBS analyzer.
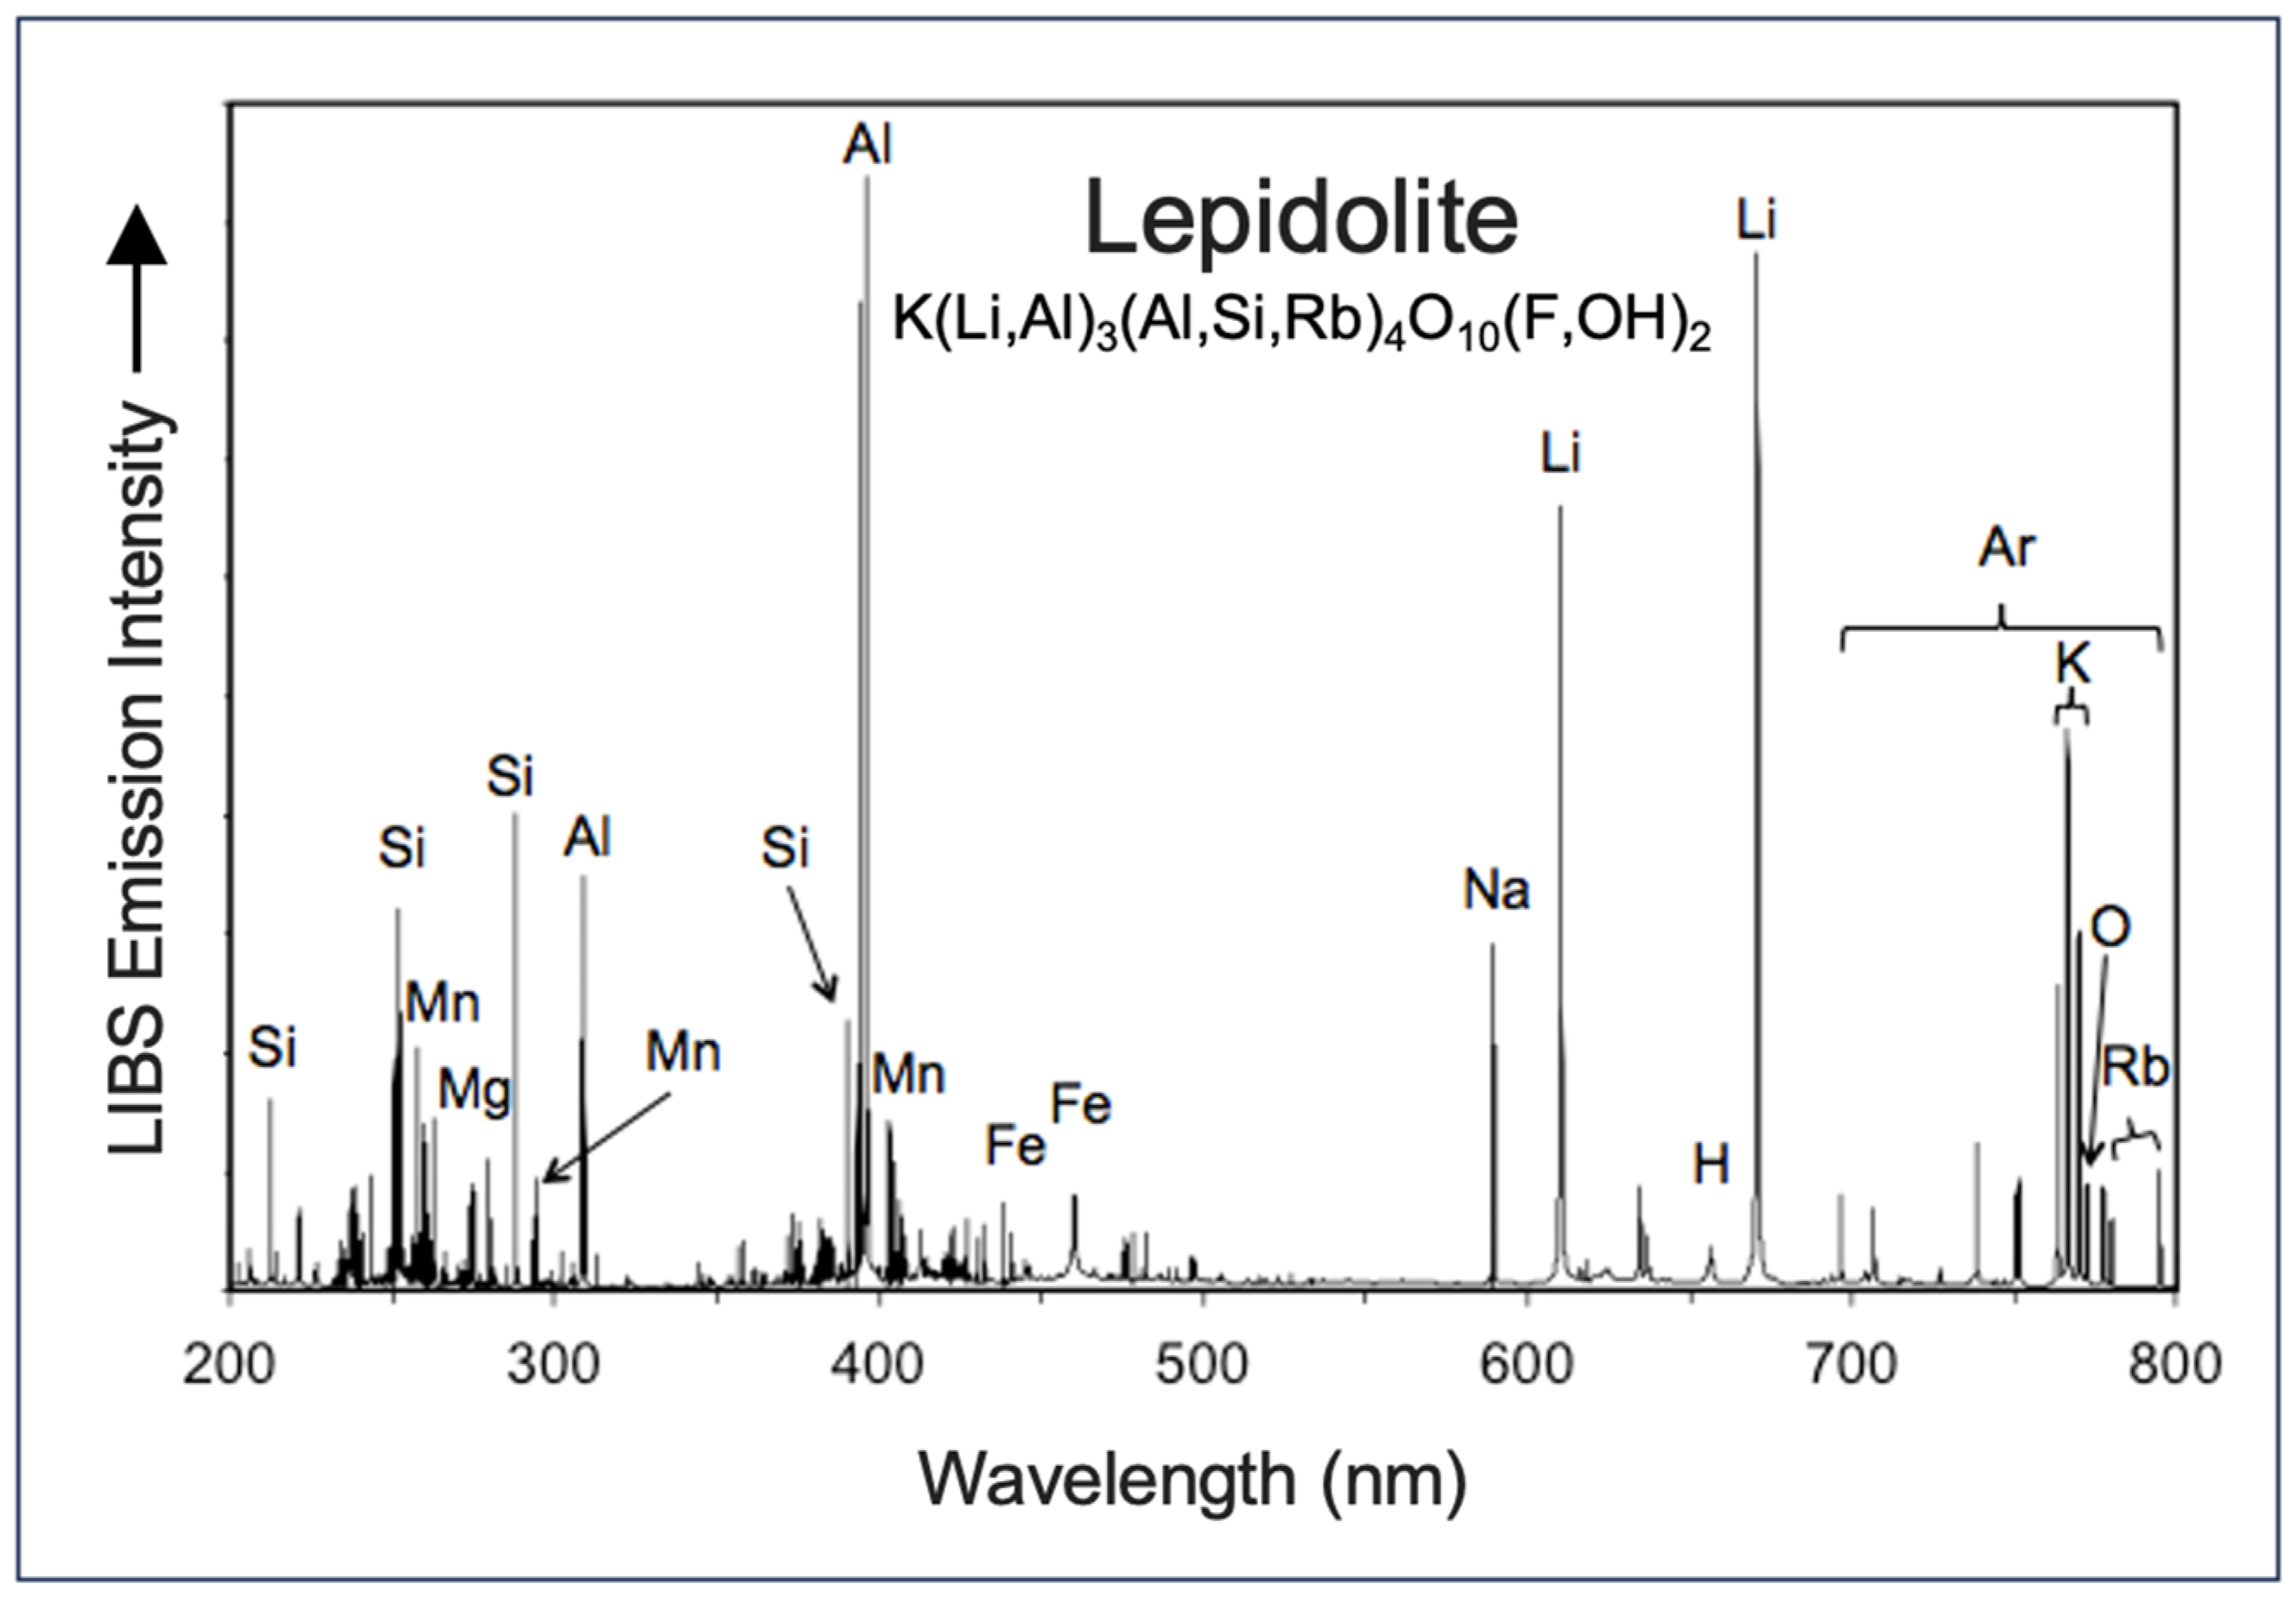
Figure 2.
Successive screen shots for handheld LIBS analysis of a spodumene [LiAl(SiO3)2] crystal from the Carolina Tin-Spodumene Belt (CTSB), North Carolina (USA) showing the elements identified in the real-time analysis. Values in green text are arbitrary relative abundances determined by the instrument software and the black text indicates the percentage of emission lines for each element contained in the on-board spectral library that are present in the acquired LIBS spectrum.
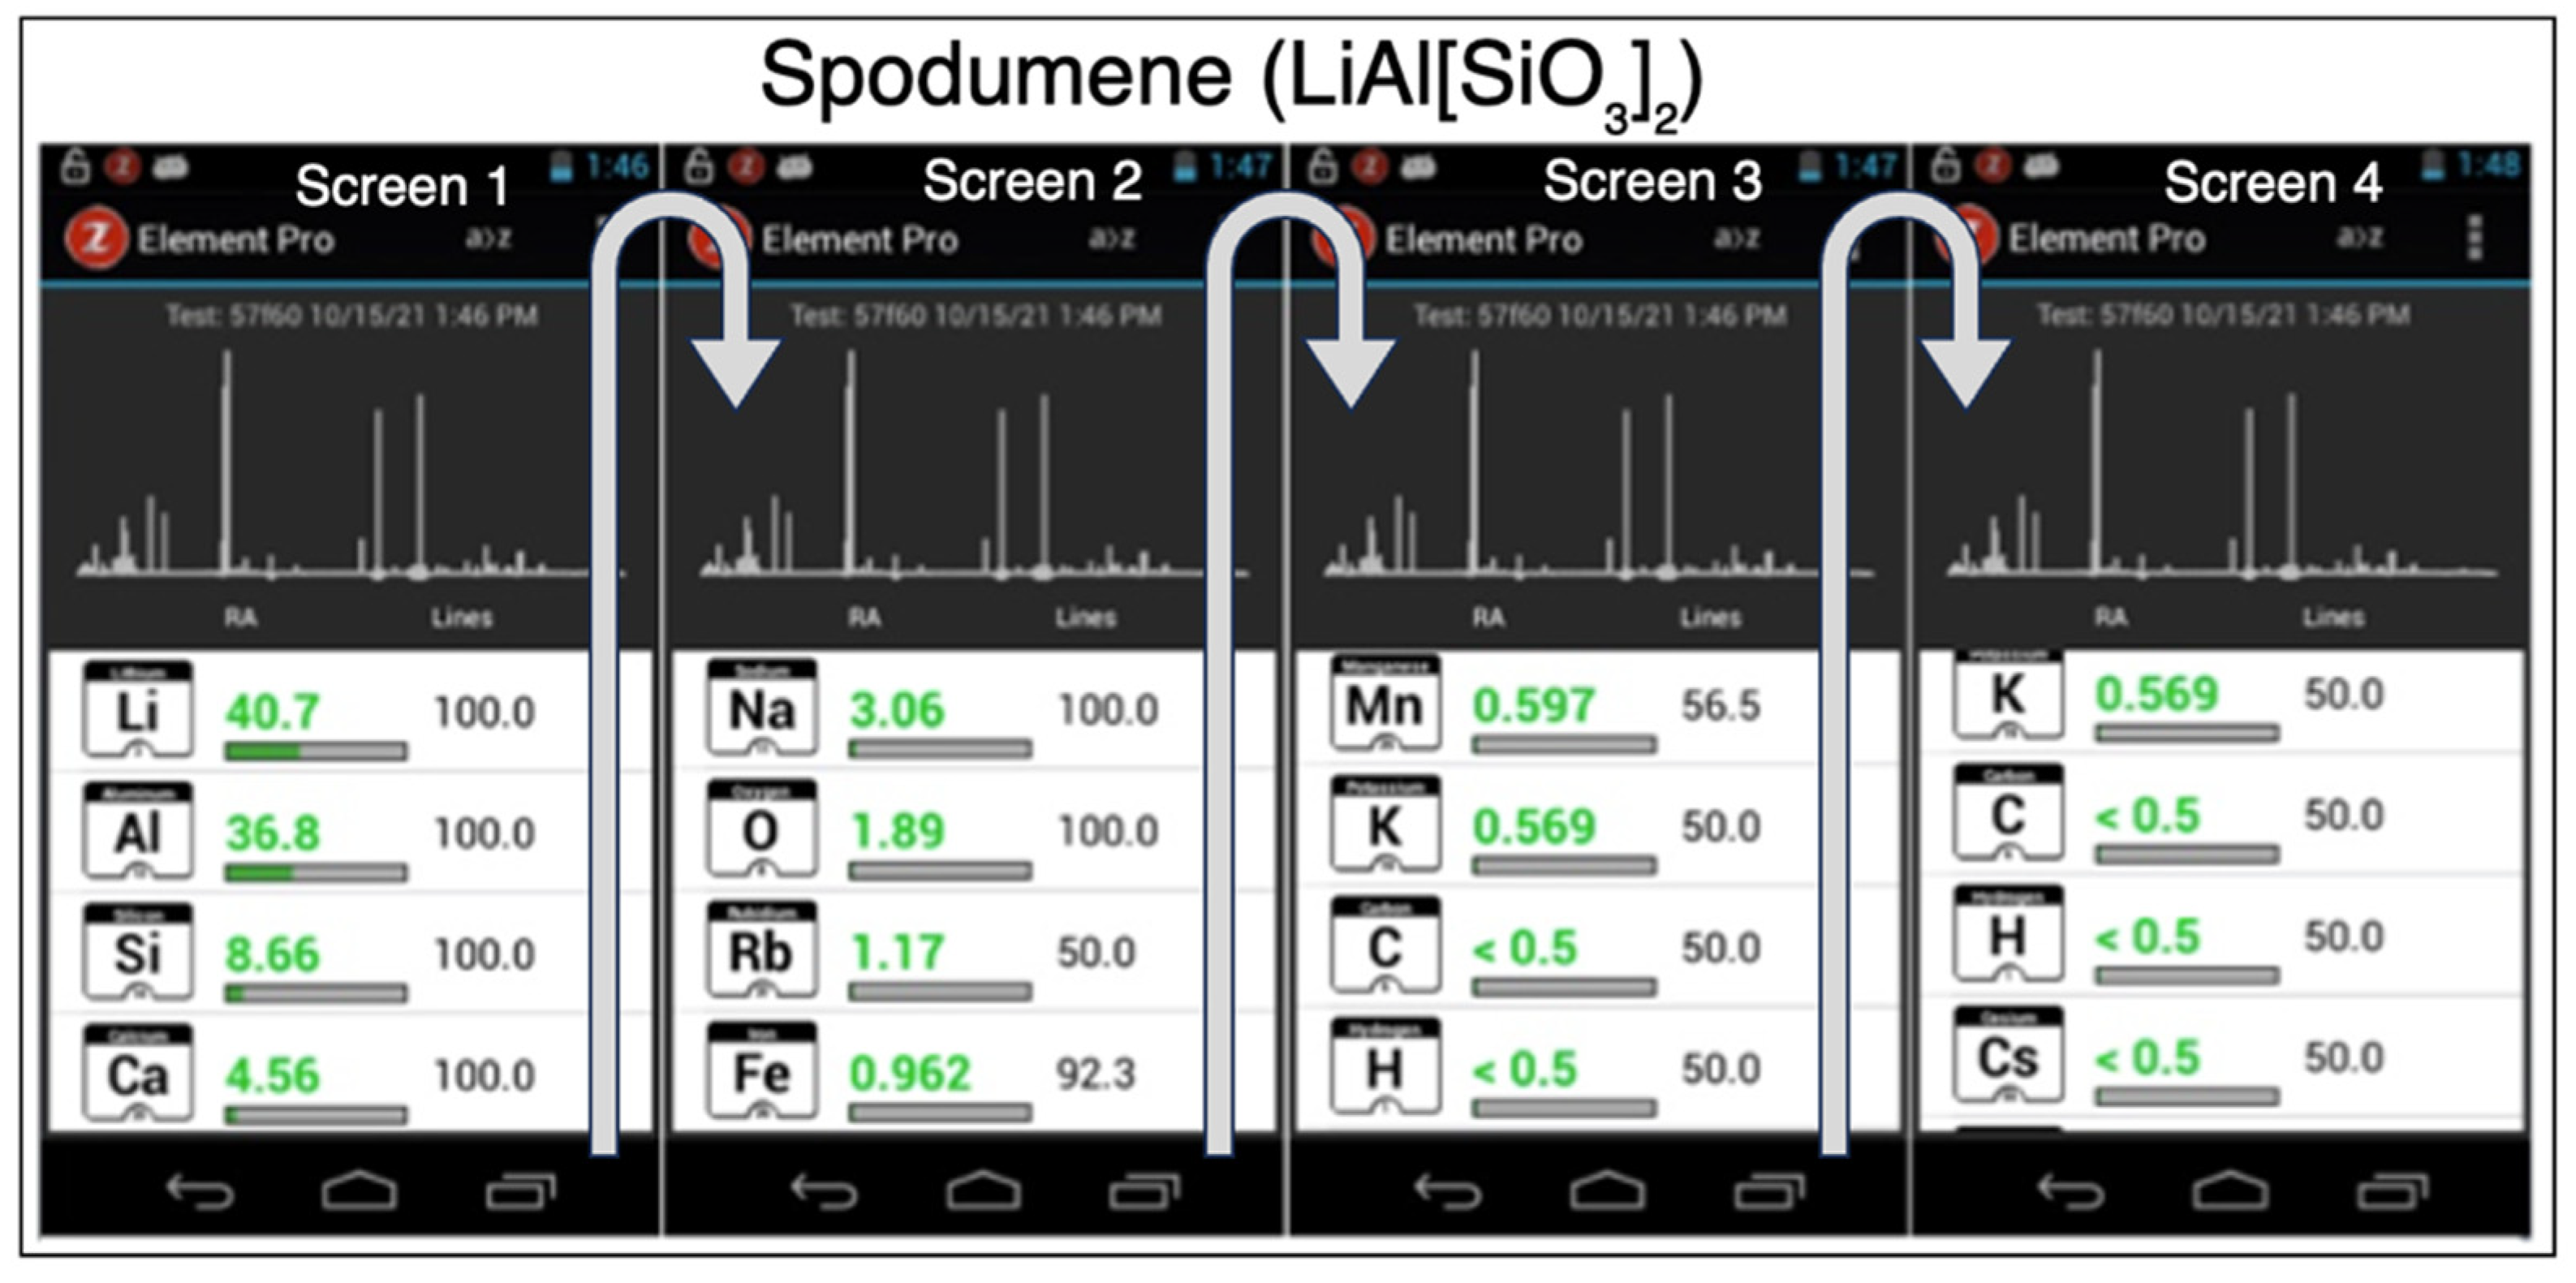
Figure 3.
Handheld LIBS analysis of vivianite [Fe3(PO4)2·8H2O] from the CTSB, North Carolina (USA), modified from [19]. (a) Photograph of secondary vivianite on a drill core fracture surface. (b) Broadband LIBS spectrum acquired using a handheld analyzer showing the prominent P peaks at 213.6, 214.9, and 255.3 nm and the suites of Fe lines between 240 and 280 nm and between 438 and 441 nm. The unlabeled peaks in the infrared portion of the of the LIBS spectrum between 700 and 870 nm result from the Ar purge gas used for the LIBS analysis. The very strong H peak at 653.6 nm indicates that this is a hydrated mineral, further supporting its identification as vivianite.

Figure 4.
Approximate LIBS detection limits (LODs) for solid materials, modified from [47]. These LODs are conservative estimates that depend on the material analyzed, the LIBS instrument used, and the specific conditions of the analysis.
Figure 4.
Approximate LIBS detection limits (LODs) for solid materials, modified from [47]. These LODs are conservative estimates that depend on the material analyzed, the LIBS instrument used, and the specific conditions of the analysis.
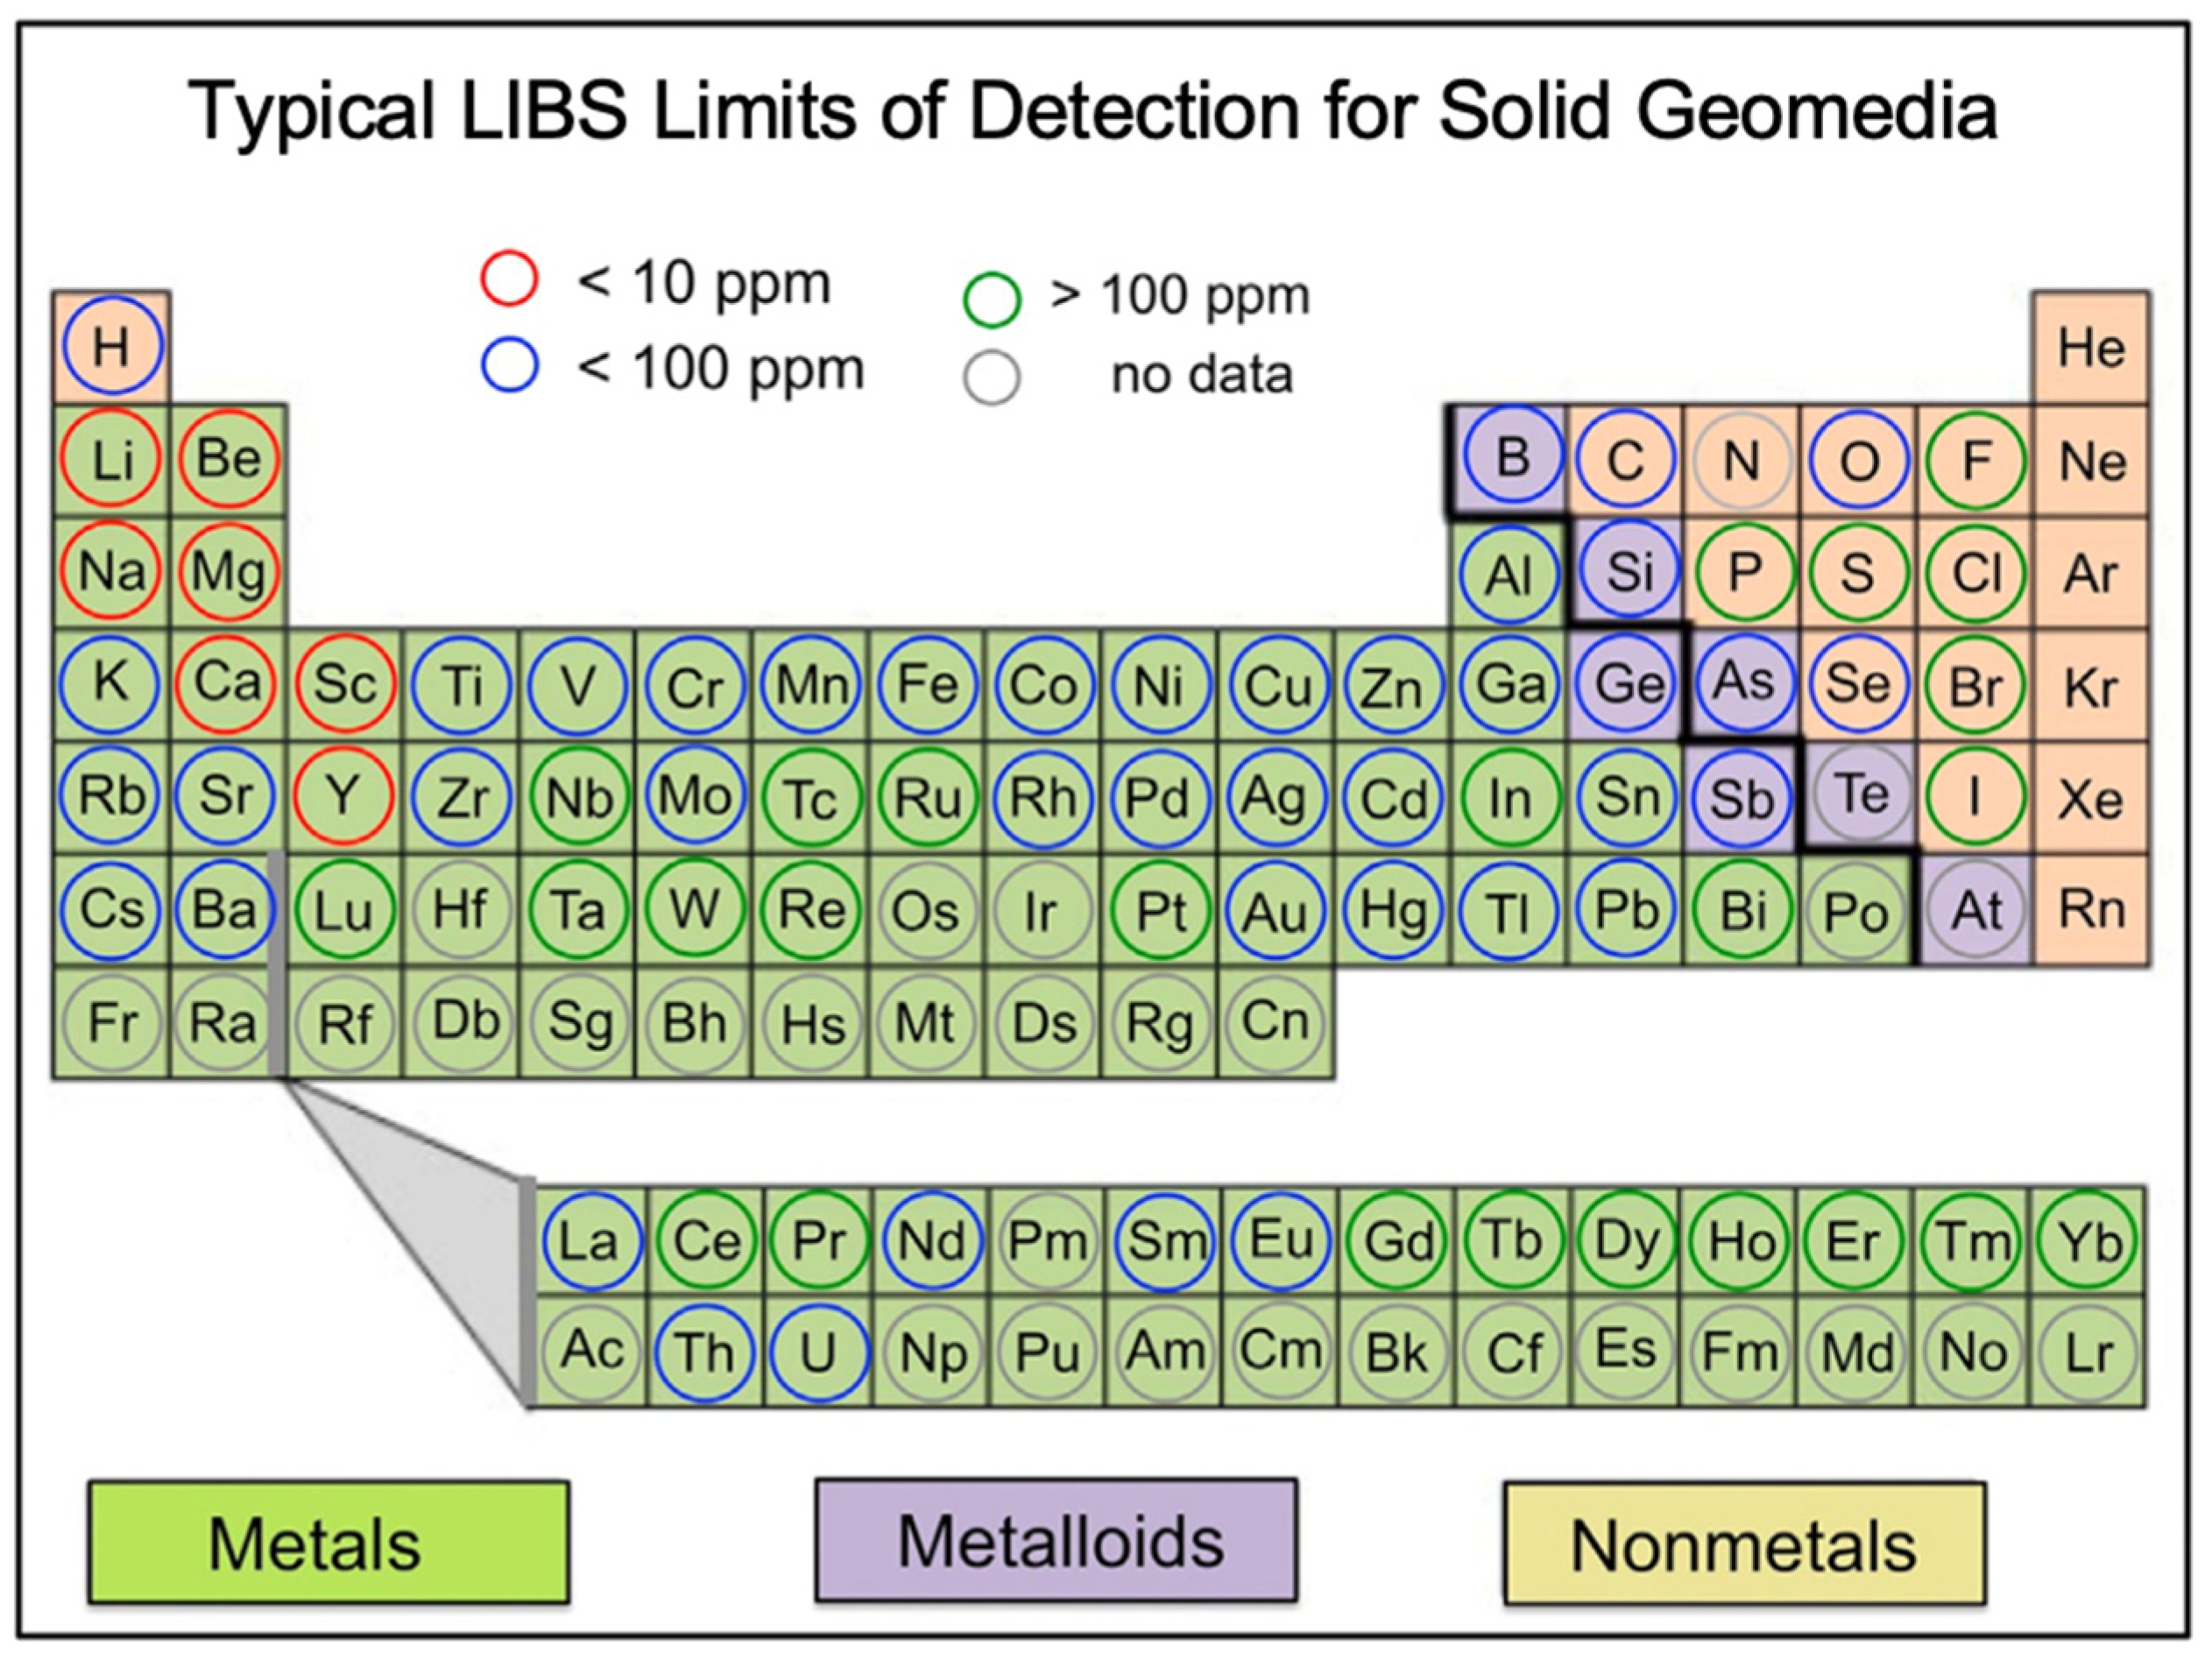
Figure 5.
LIBS spectral pre-processing, modified from [63]. (a) Flowchart for the five pre-processing steps of LIBS spectra. (b) An example of smoothing, normalization, and baseline correction of a broadband LIBS spectrum.
Figure 5.
LIBS spectral pre-processing, modified from [63]. (a) Flowchart for the five pre-processing steps of LIBS spectra. (b) An example of smoothing, normalization, and baseline correction of a broadband LIBS spectrum.
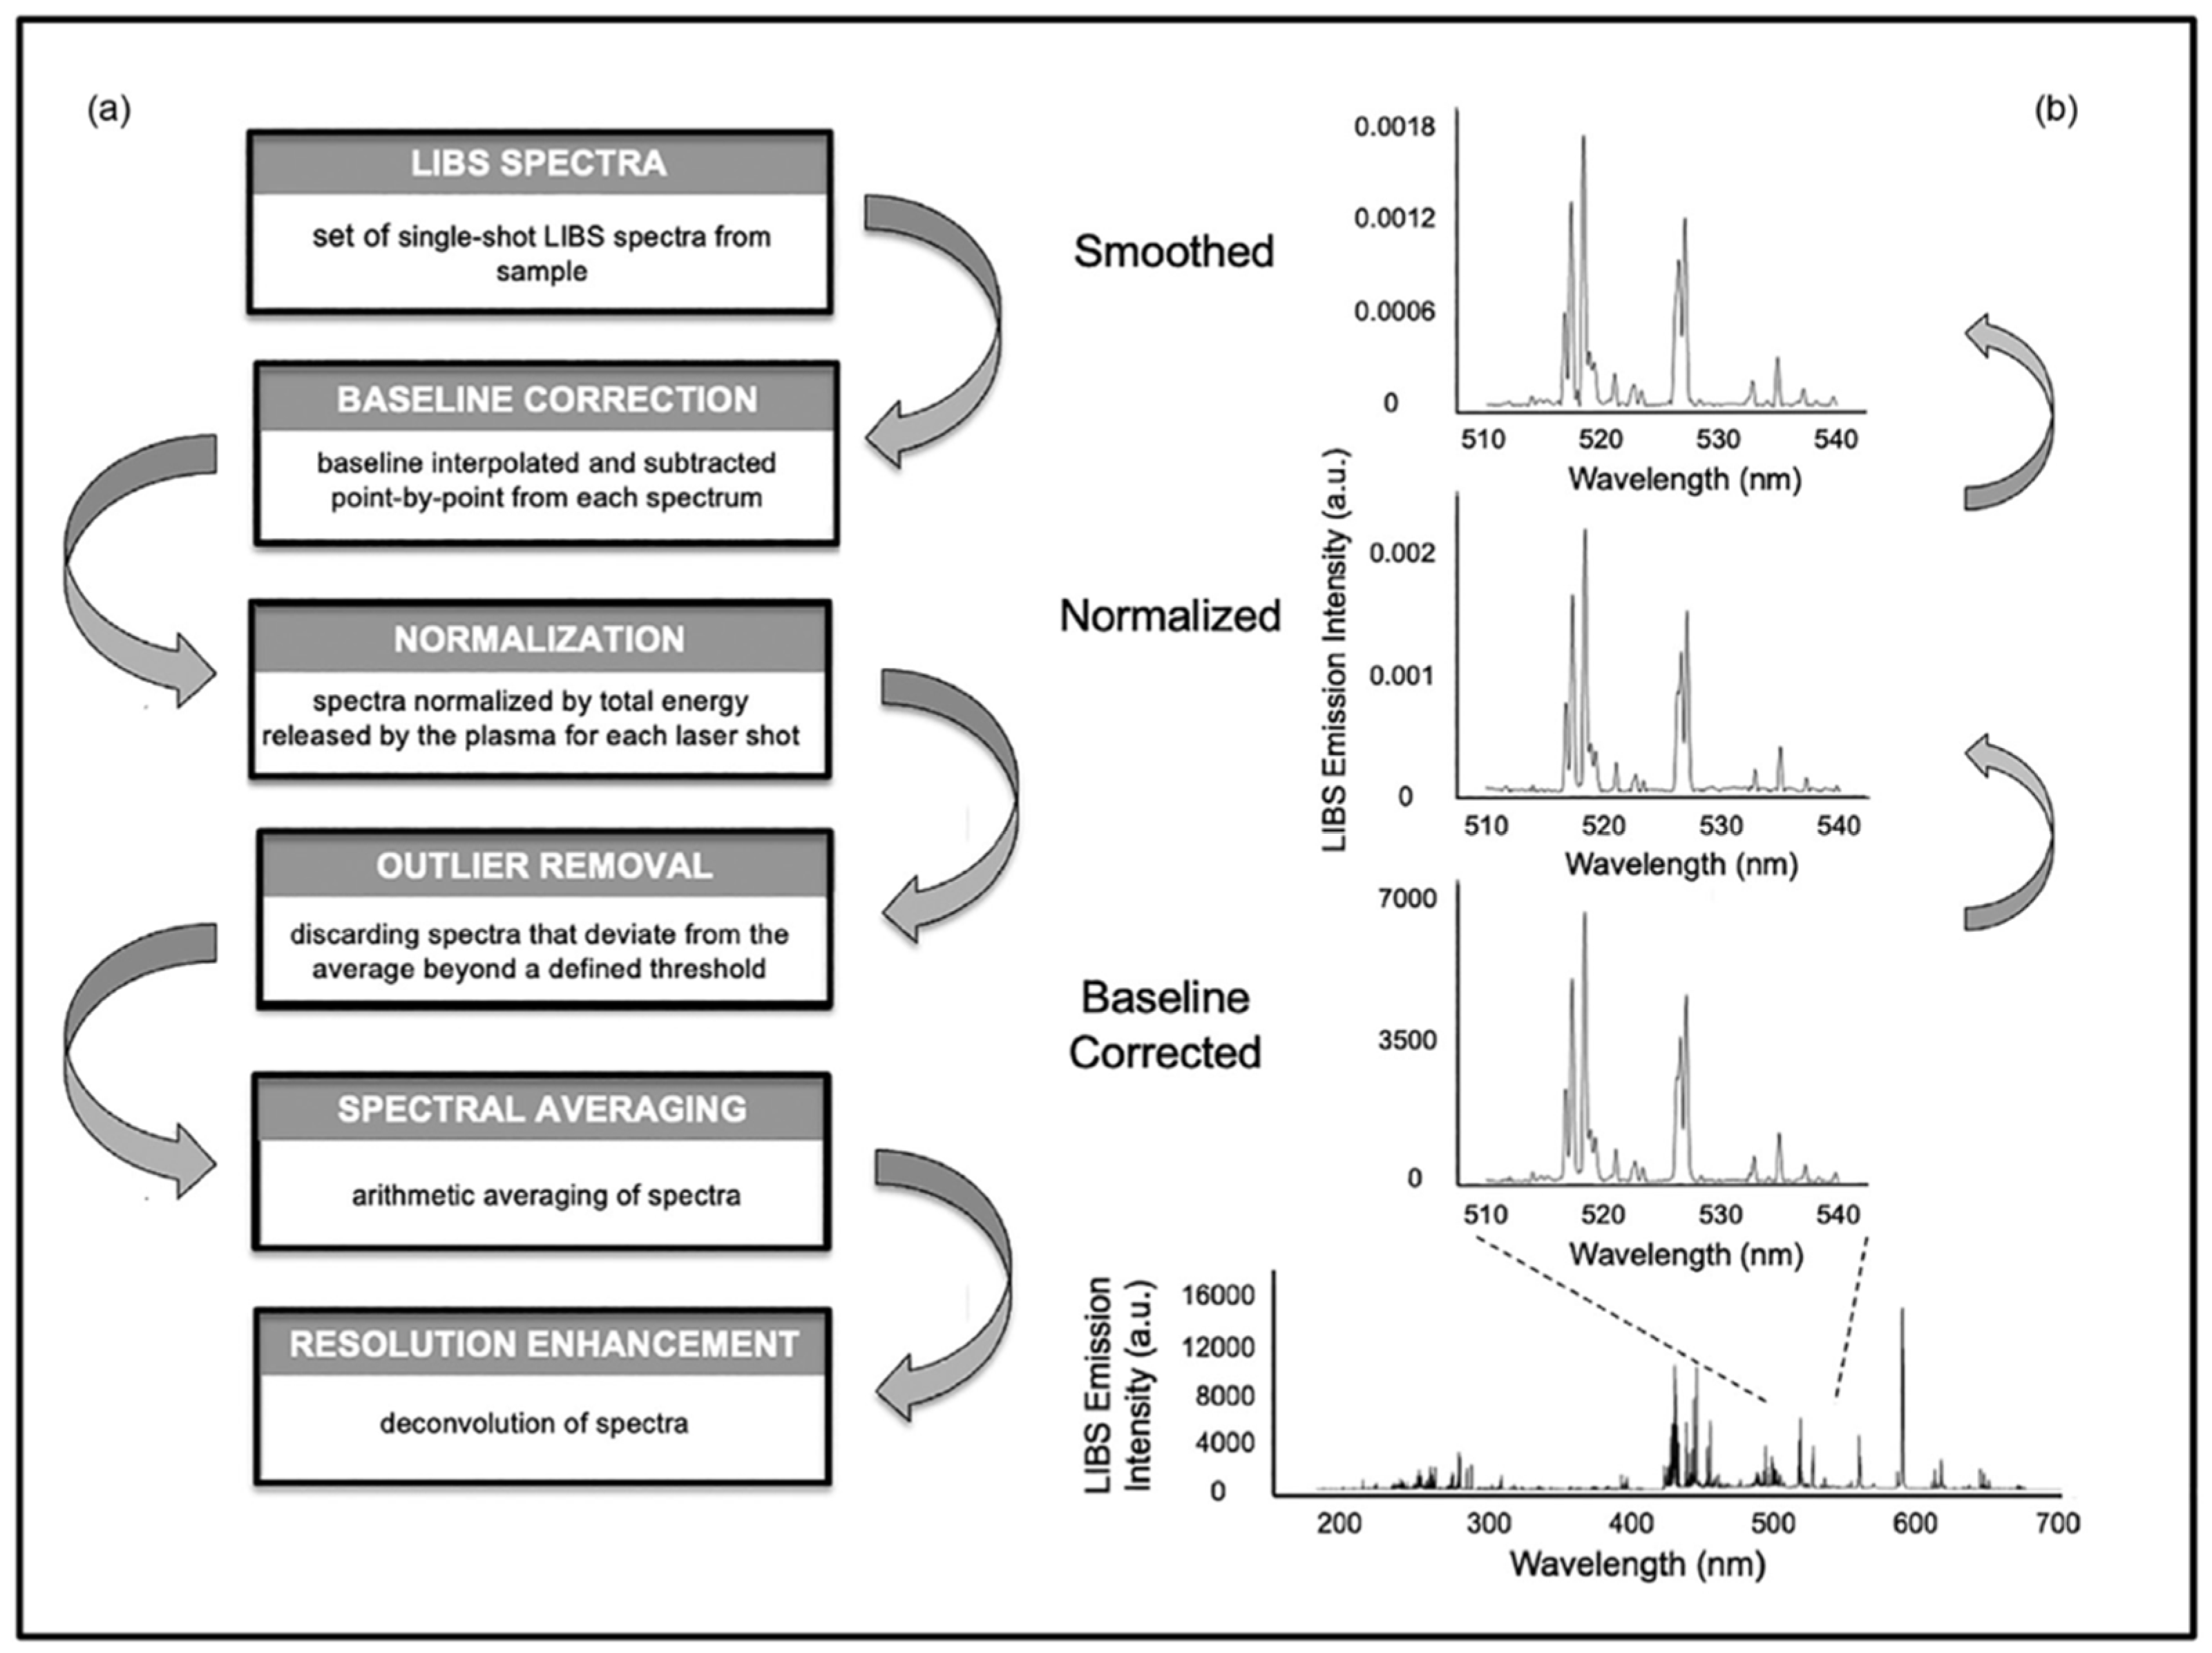
Figure 6.
Examples of LIBS compositional imaging, modified from [76,77]. (a) LIBS spectrum between 285 and 335 nm (left), surface spatial distributions of Ca and Si over a 0.785 × 0.785 mm2 area (center), and Si distributions on the surface and at 3 μm depth intervals in a sample acquired by LIBS analysis of the REE-rich mineral bastnäsite [(Ce, La)CO3F] by Chirinos et al. [76] as determined from the emission lines for Ca at 315.9 nm and Si at 288.2 nm. In this and subsequent figures, unless otherwise stated, warm colors (e.g., yellow and red) in the concentration distribution maps denote elevated elemental abundances whereas cool colors (e.g., blue and purple) indicate diminished elemental abundances. (b) Composite image of Fe distribution across the polished surface of a specimen obtained by Moncayo et al. [77] from merging individual concentration maps for its three constituent minerals—turquoise [CuAl6(PO4)4(OH)8·4H2O], pyrite [FeS2], and silica (mainly quartz). The intensity of the LIBS Fe emission line at 259.9 nm was recorded across the 468 mm2 surface area of the sample at a step resolution of 15 μm. The image comprises more than 2 × 106 pixels (i.e., 1300 by 1600 pixels along the x- and y-axes, respectively).
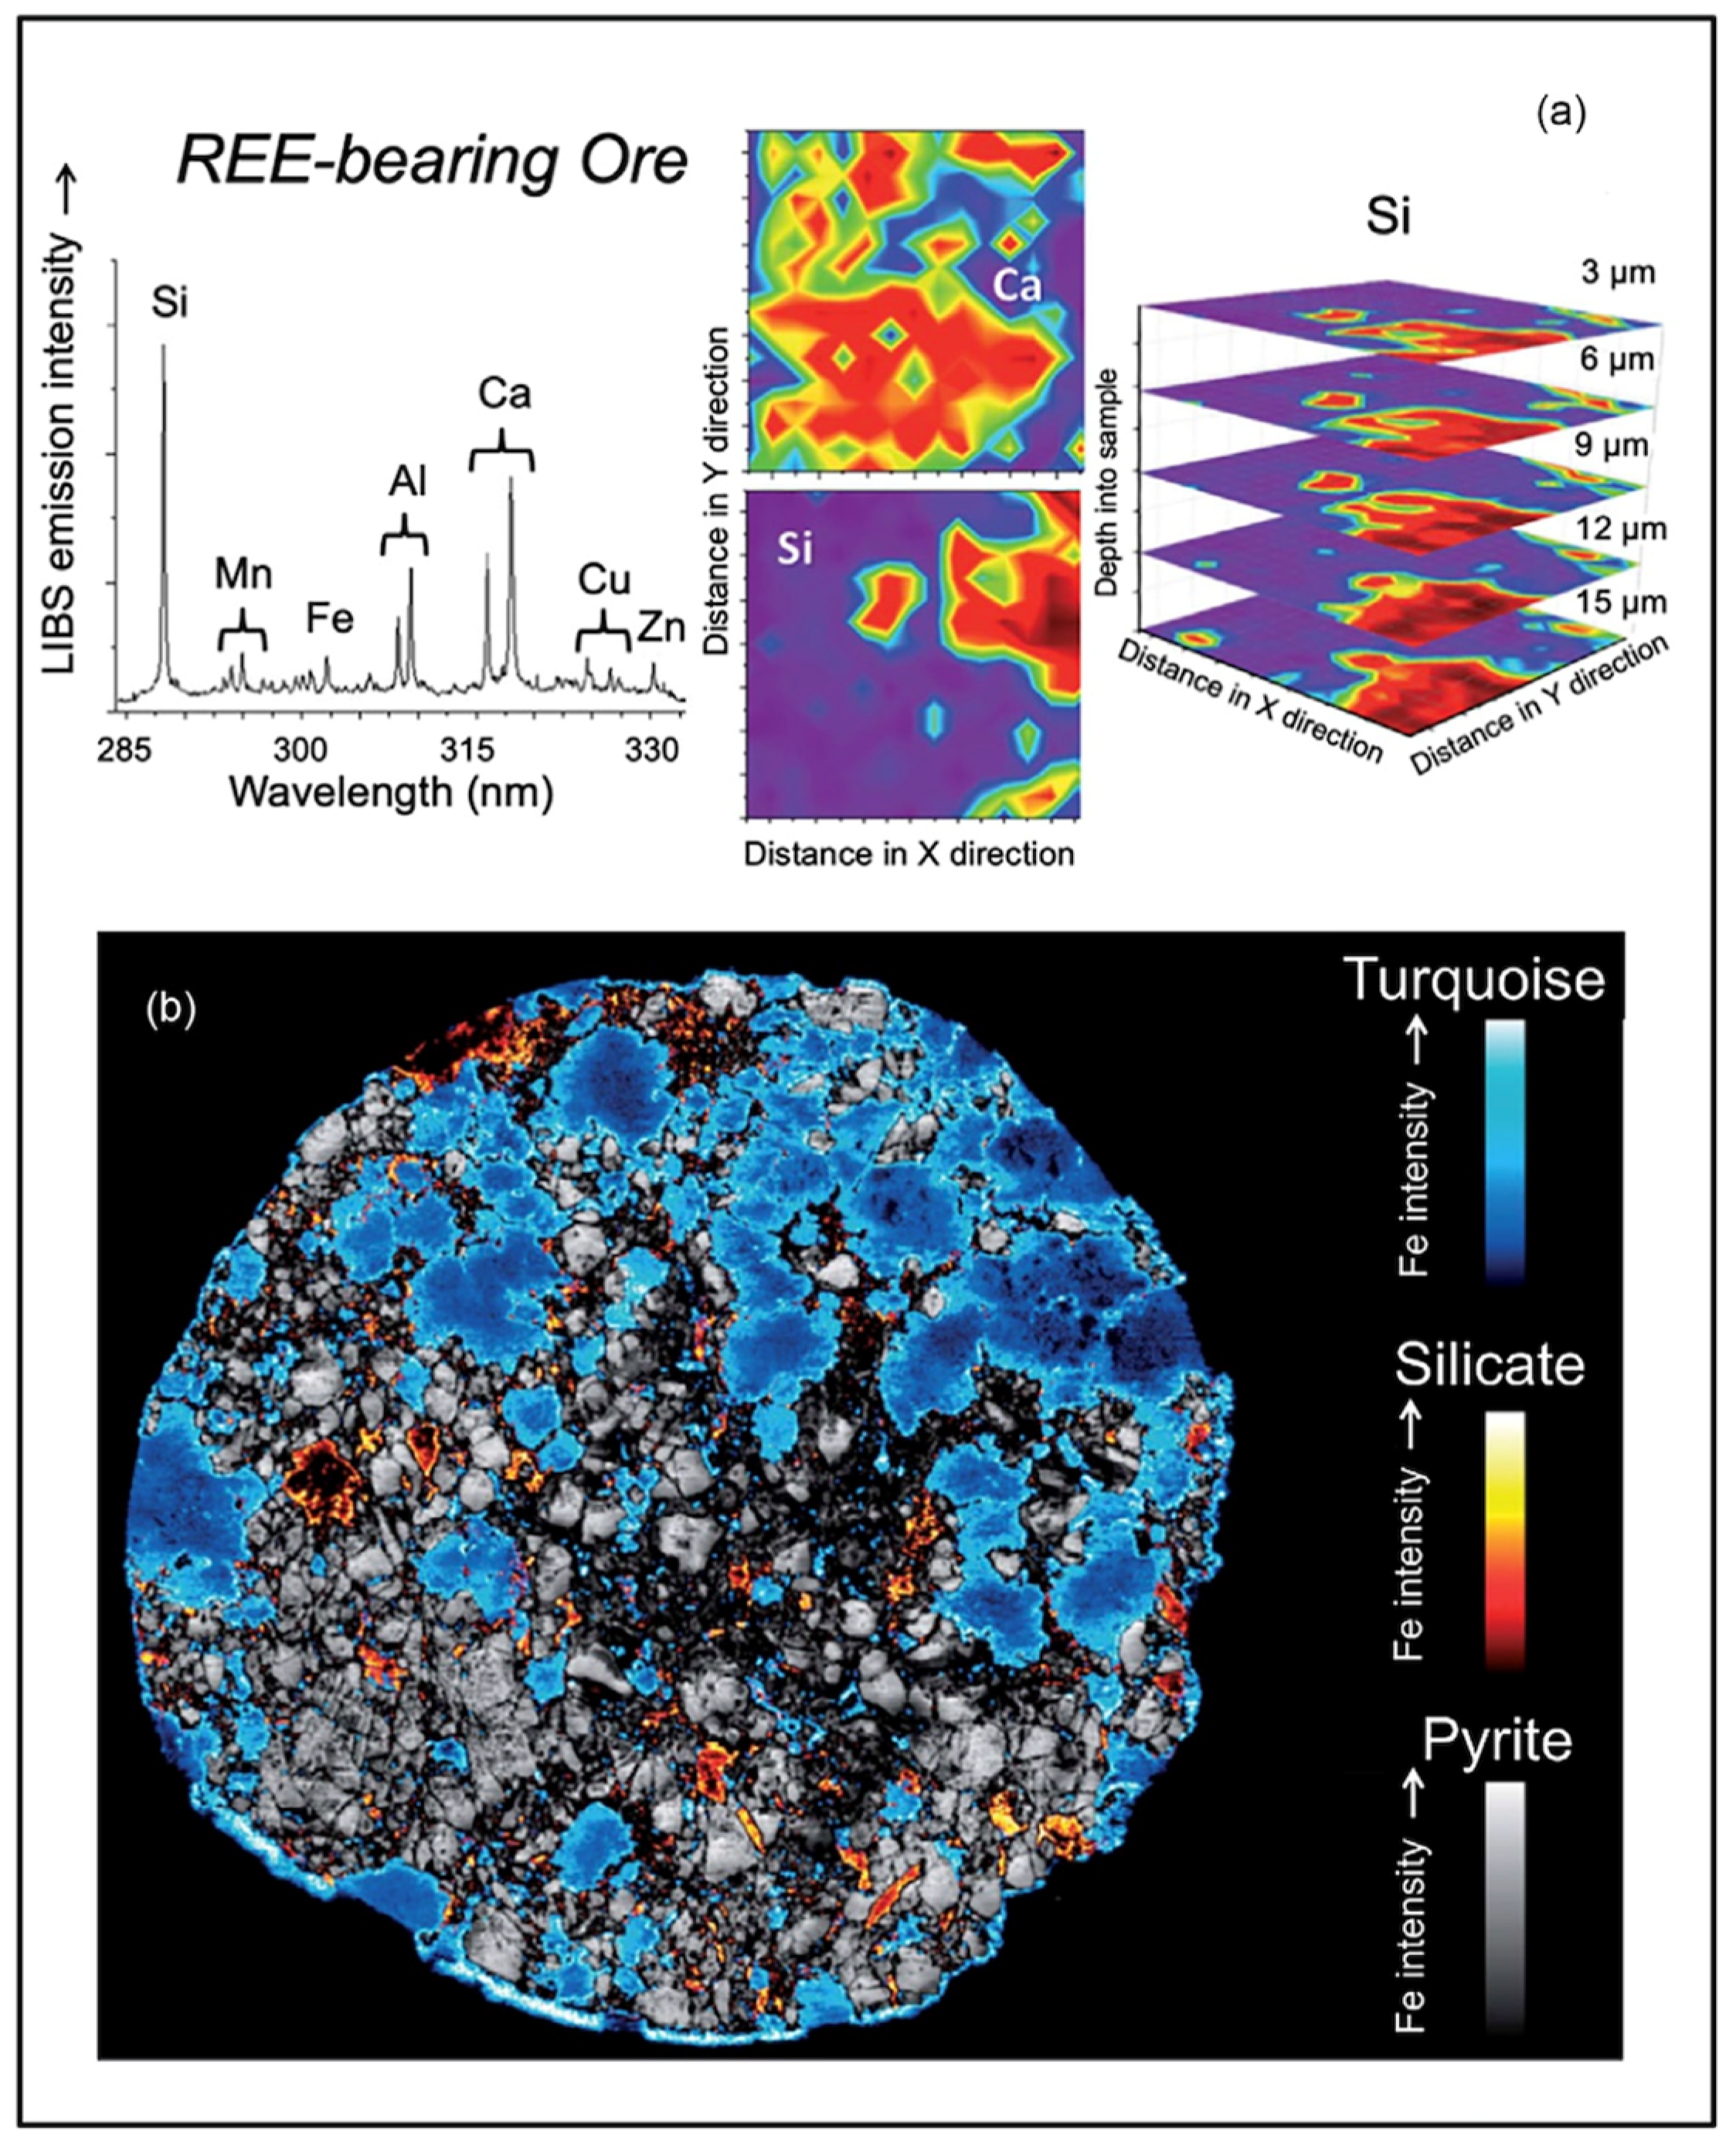
Figure 7.
Optical image of the cut and polished surface a hydrothermal ore sample from the Tighza mine (Morocco), modified from [78]. (a) Optical image of the sample. (b) Typical single-pulse LIBS emission spectra covering the spectral range between 270 and 340 nm recorded for the five different minerals indicated in (d). (c) Multi-elemental LIBS image for the major elements of the sample, Pb (red), Cu (yellow), Zn (magenta), Ca (blue), and Si (gray), with the same scale as (a). (d) A 10× magnification of the region shown by the white rectangle in (c) showing the five different minerals analyzed (1 = sphalerite, 2 = chalcopyrite, 3 = galena, 4 = calcite, and 5 = silica).

Figure 8.
False-color image of mineralogy in a pegmatite from the Fregeneda–Almendra pegmatite field between Spain and Portugal in the Central Iberian Zone of western Europe acquired from kHz-µLIBS scanning, modified from [73]. Lpd = lepidolite mica, Qtz = quartz, Ab = albite [NaAlSi3O8], Kfs + Ms = K-feldspar [KAlSi3O8] plus muscovite mica [KAl2(Si3Al)O10(OH)2], Brl = beryl [Be3Al2Si6O18], AGM = amblygonite-group minerals, Cst = cassiterite [SnO2], CGM = Nb–Ta oxides/columbite-group minerals, Phos = phosphates, and Zrn = zircon [ZrSiO4].
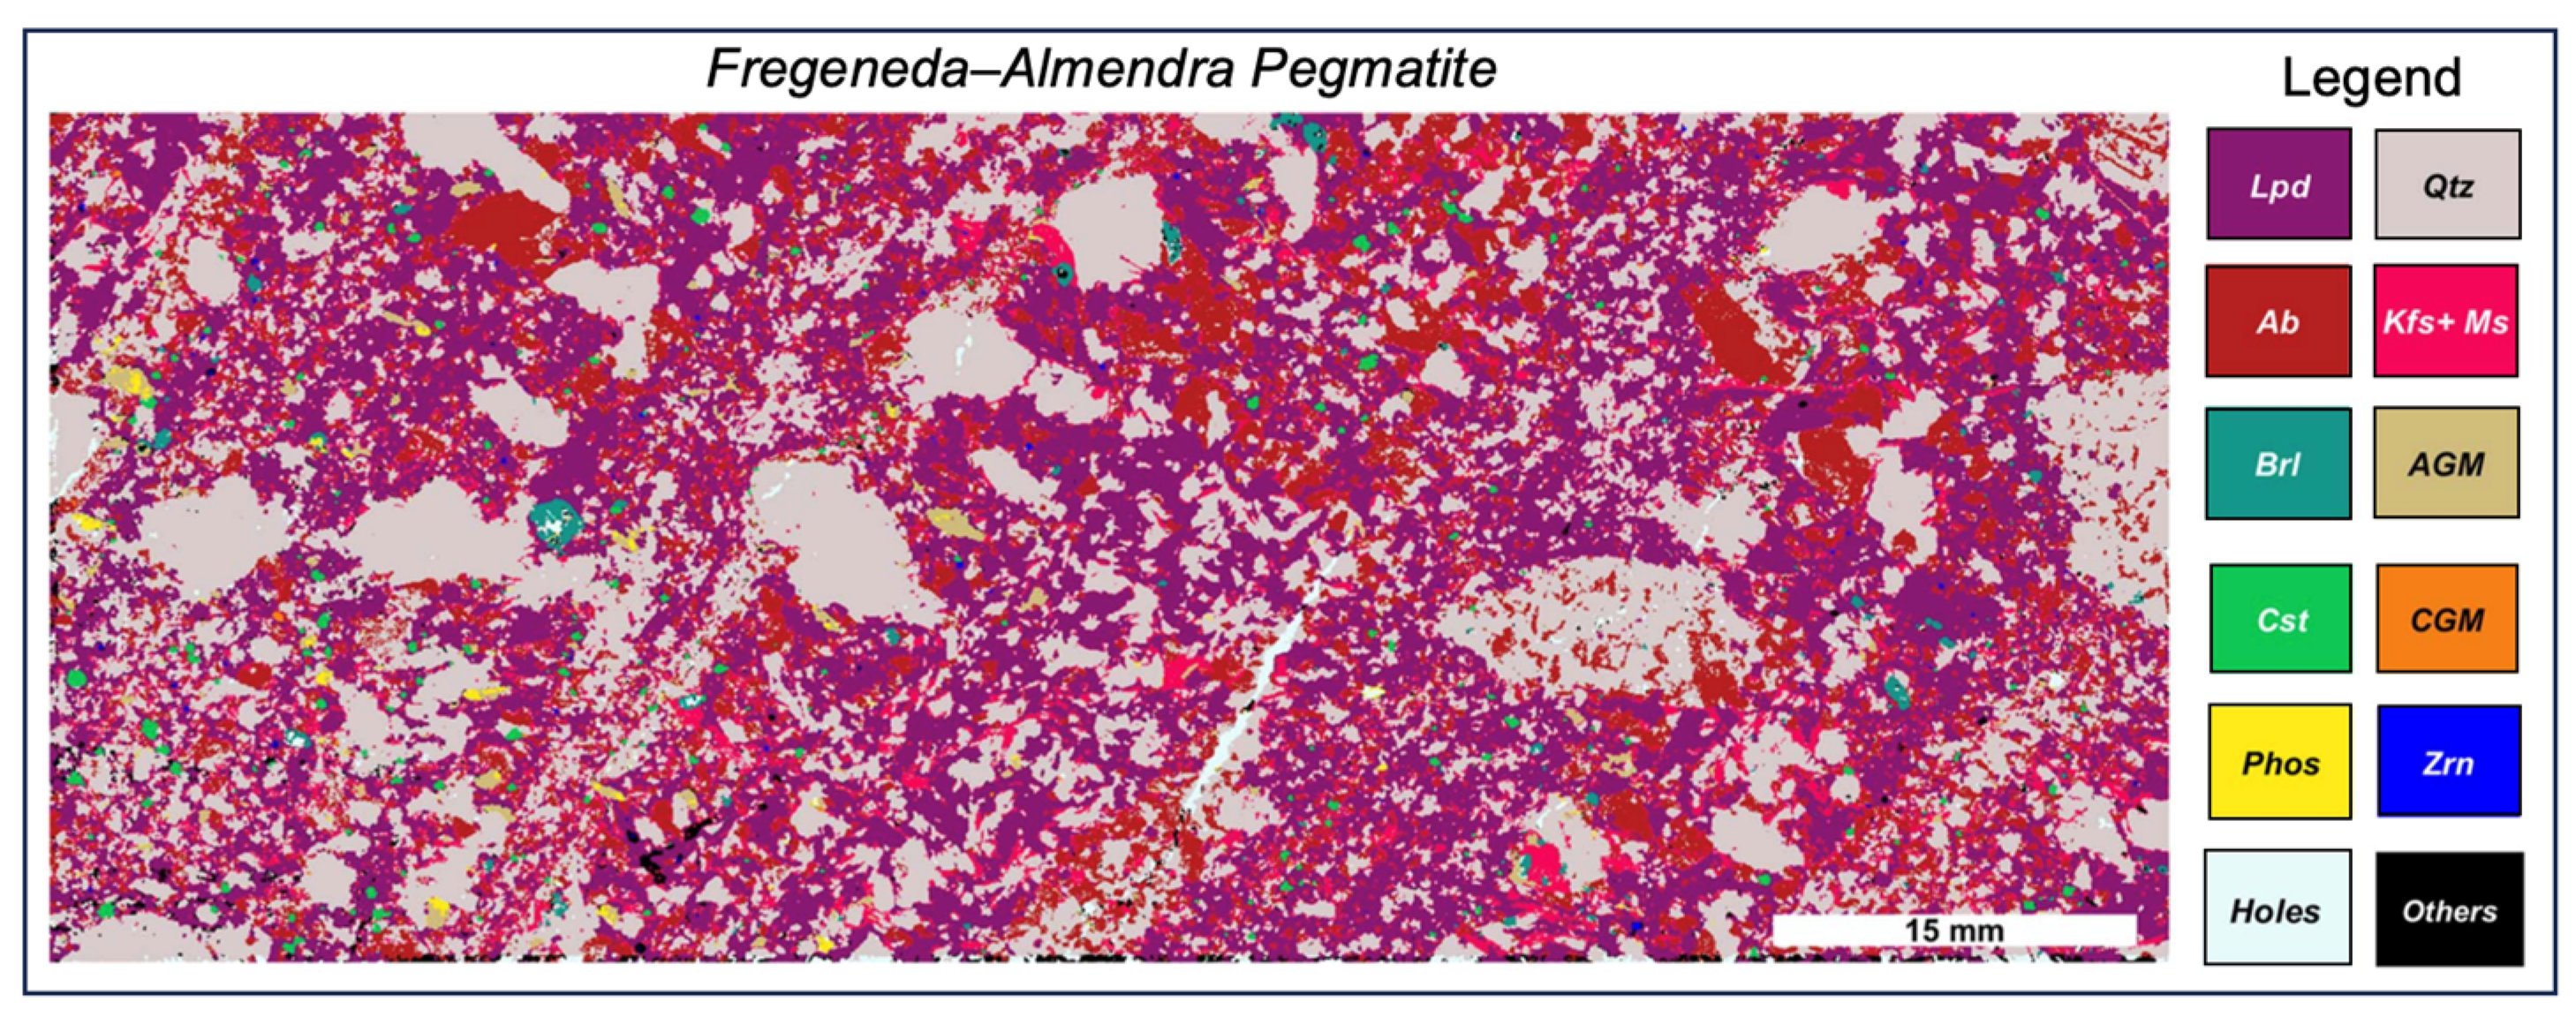
Figure 9.
Handheld LIBS imaging of a mantle xenolith in a drill core from the Muskox kimberlite pipe near Nunavut (Canada), modified from [71]. (a) Core photograph with the black rectangle indicating the area of handheld LIBS analysis. (b–d) LIBS imaging results undertaken directly on the sawed core surface for the major element Ca using the 527.0 nm emission line, the minor element Na using the 589.0 nm emission line, and the trace element Li using the 670.8 nm emission line. The heat maps to the right of each set of elemental distribution maps indicate relative elemental concentrations as percent values for sum-normalized emission intensities. The elemental distribution maps for Ca, Na, and Li stitch together 20 (10 × 2) individual 16 × 16 shot grids (i.e., 5120 total laser shots). Qualitative LIBS concentrations suggest that Ca and, to a lesser extent, Li are concentrated along veinlets that are only a few pixels wide (i.e., ~100 s of μm) that comprise a mixture of calcite and clinopyroxene [Ca(Mg,Fe)Si2O6]. It would not have been possible to document the location and distribution of the trace element Li without such geochemical micro-imaging. The feature-of-interest maps, which highlight the distribution of veinlets, effectively separate clinopyroxene (Cpx), garnet (Gt), and olivine (Olv) based mostly on Ca emissions.
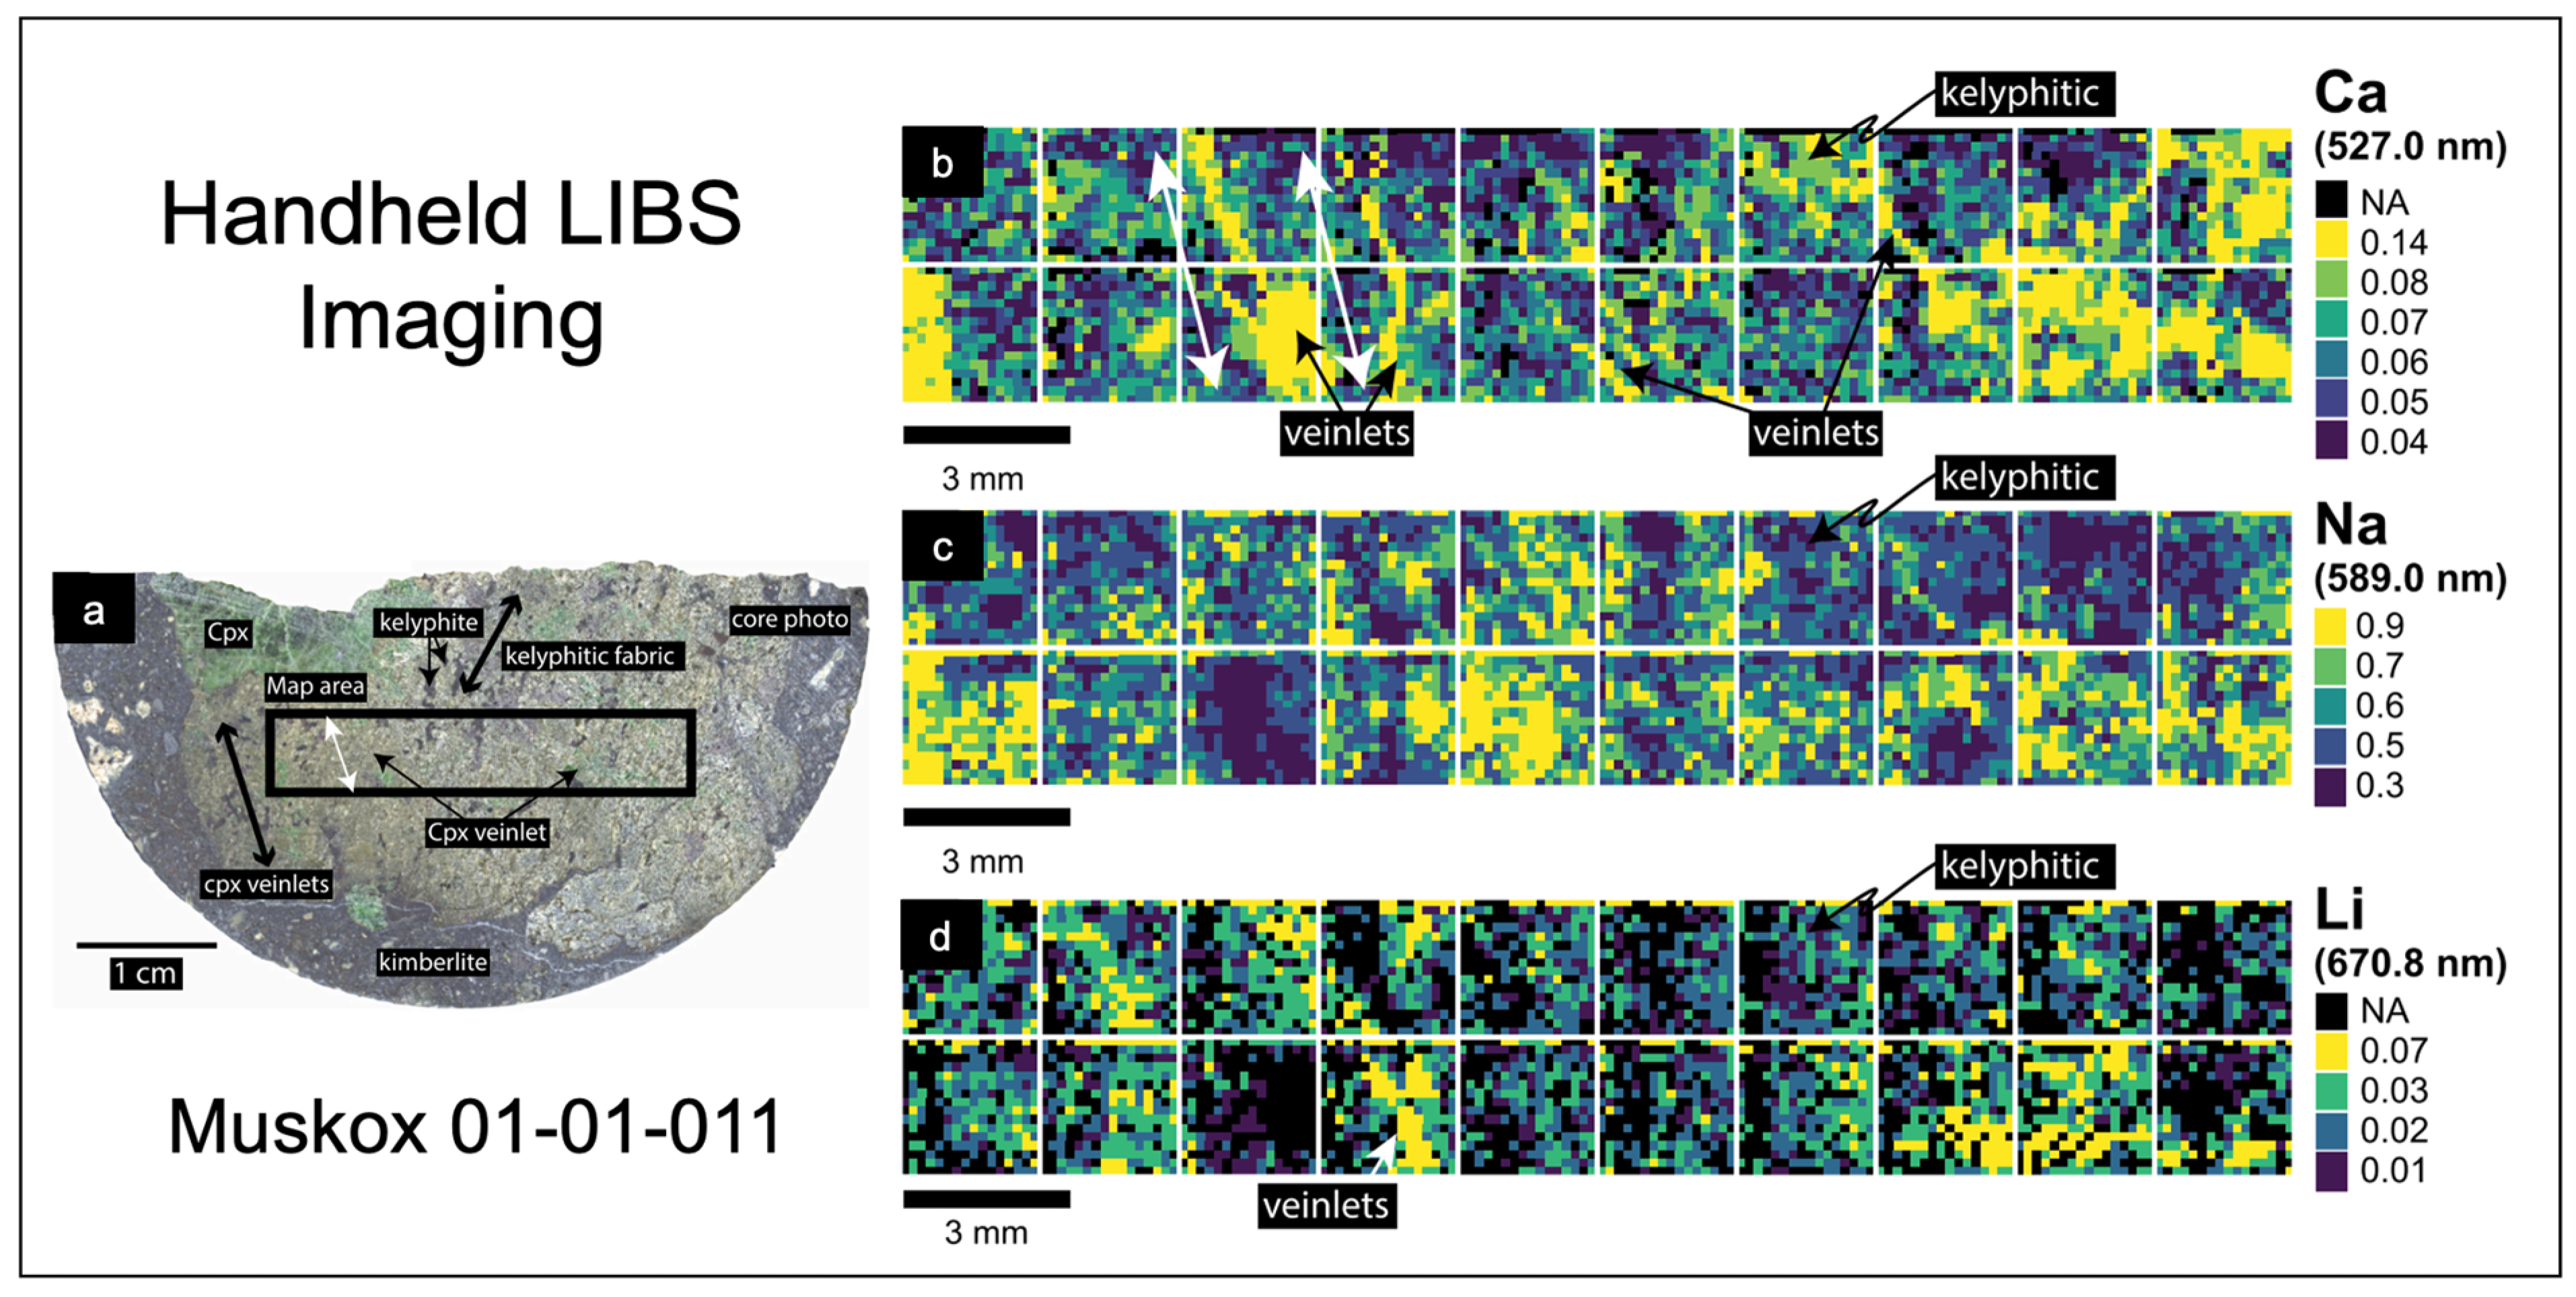
Figure 10.
Schema illustrating a post-processing approach to LIBS quantitative analysis using the calibration curve approach, modified from [88]. (a) LIBS spectrum, (b) magnitudes of the Ag emission line at 546.6 nm for different silver contents in the standards, and (c) regression calibration model based on principal components regression (PCR) and partial least squares regression (PLSR) model developed for quantitative silver analysis. Analytical figures of merit for assessing the performance of a calibration include the coefficient of determination (R2), the root mean square error (RSME), mean absolute error (MAE), and limit of quantification (LOQ).
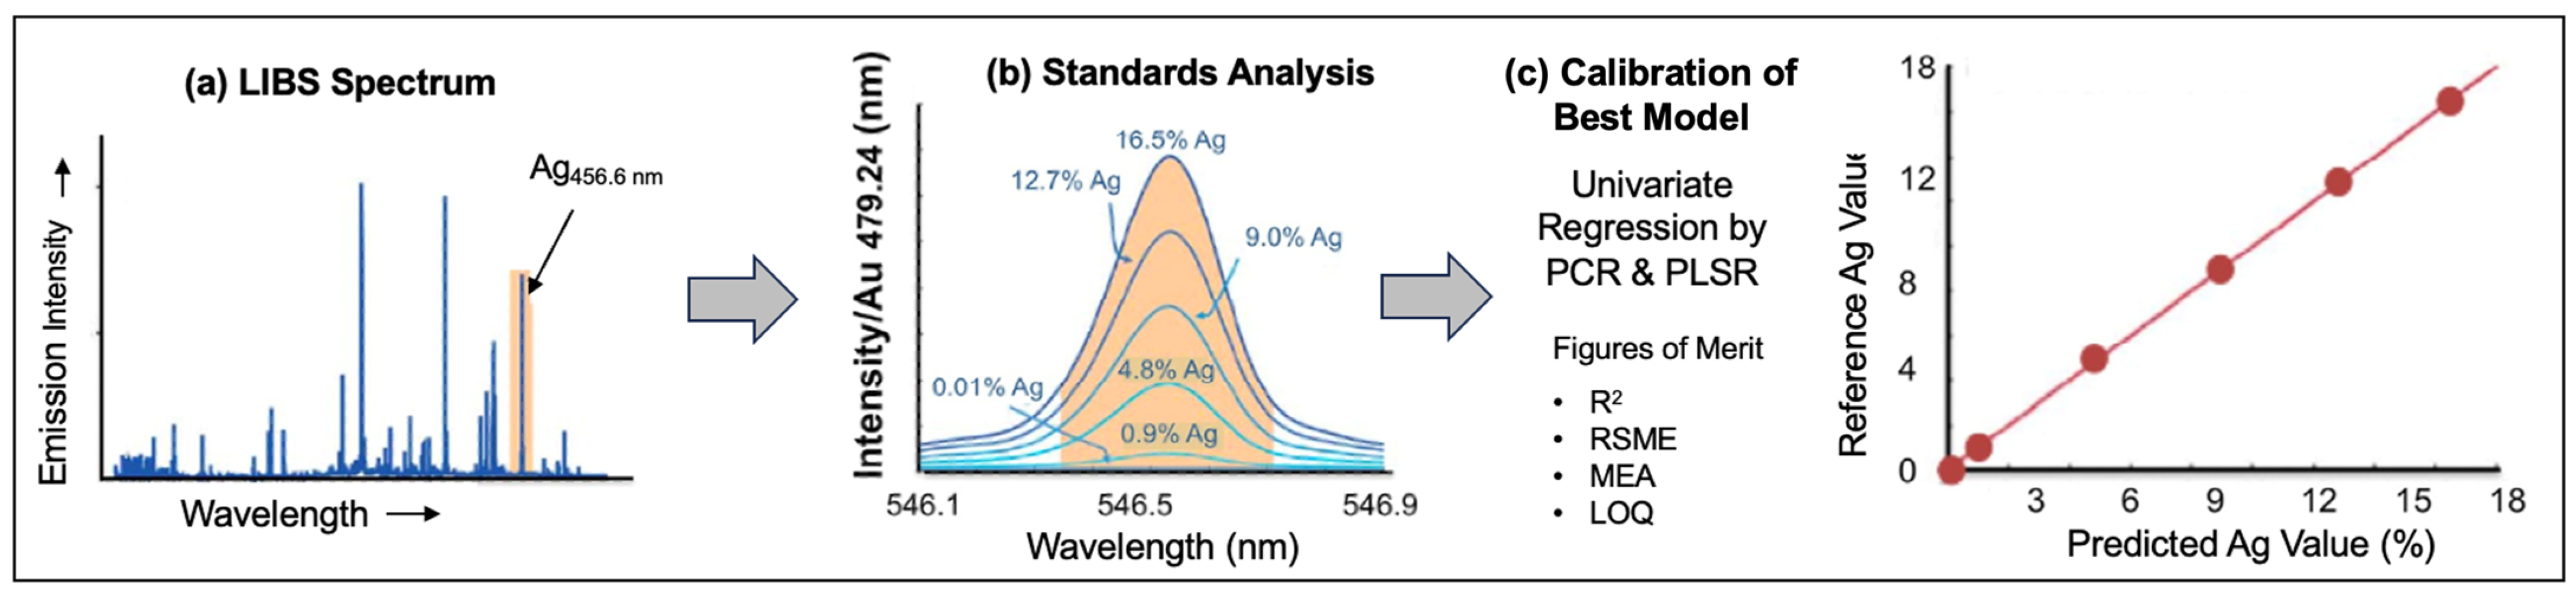
Figure 11.
In-line measurement of drill dust in an active quarry by LIBS in real time, as modified from [100]. Unlike the downhole deployable LIBS instrument for geochemical analysis described in [99], this approach continuously analyzes the dust that is generated from rock drilling using the dust extraction hose connected to the LIBS analyzer. (a) LIBS system mounted on mobile drill rig in quarry. (b) Measured spatial variation of Al concentration (wt. %) as a function of drill depth and horizontal location of the drill rig. A depth resolution of a few centimeters is possible because the measurements are directly related to the depth in the deposit using the position monitor of the drill rig.
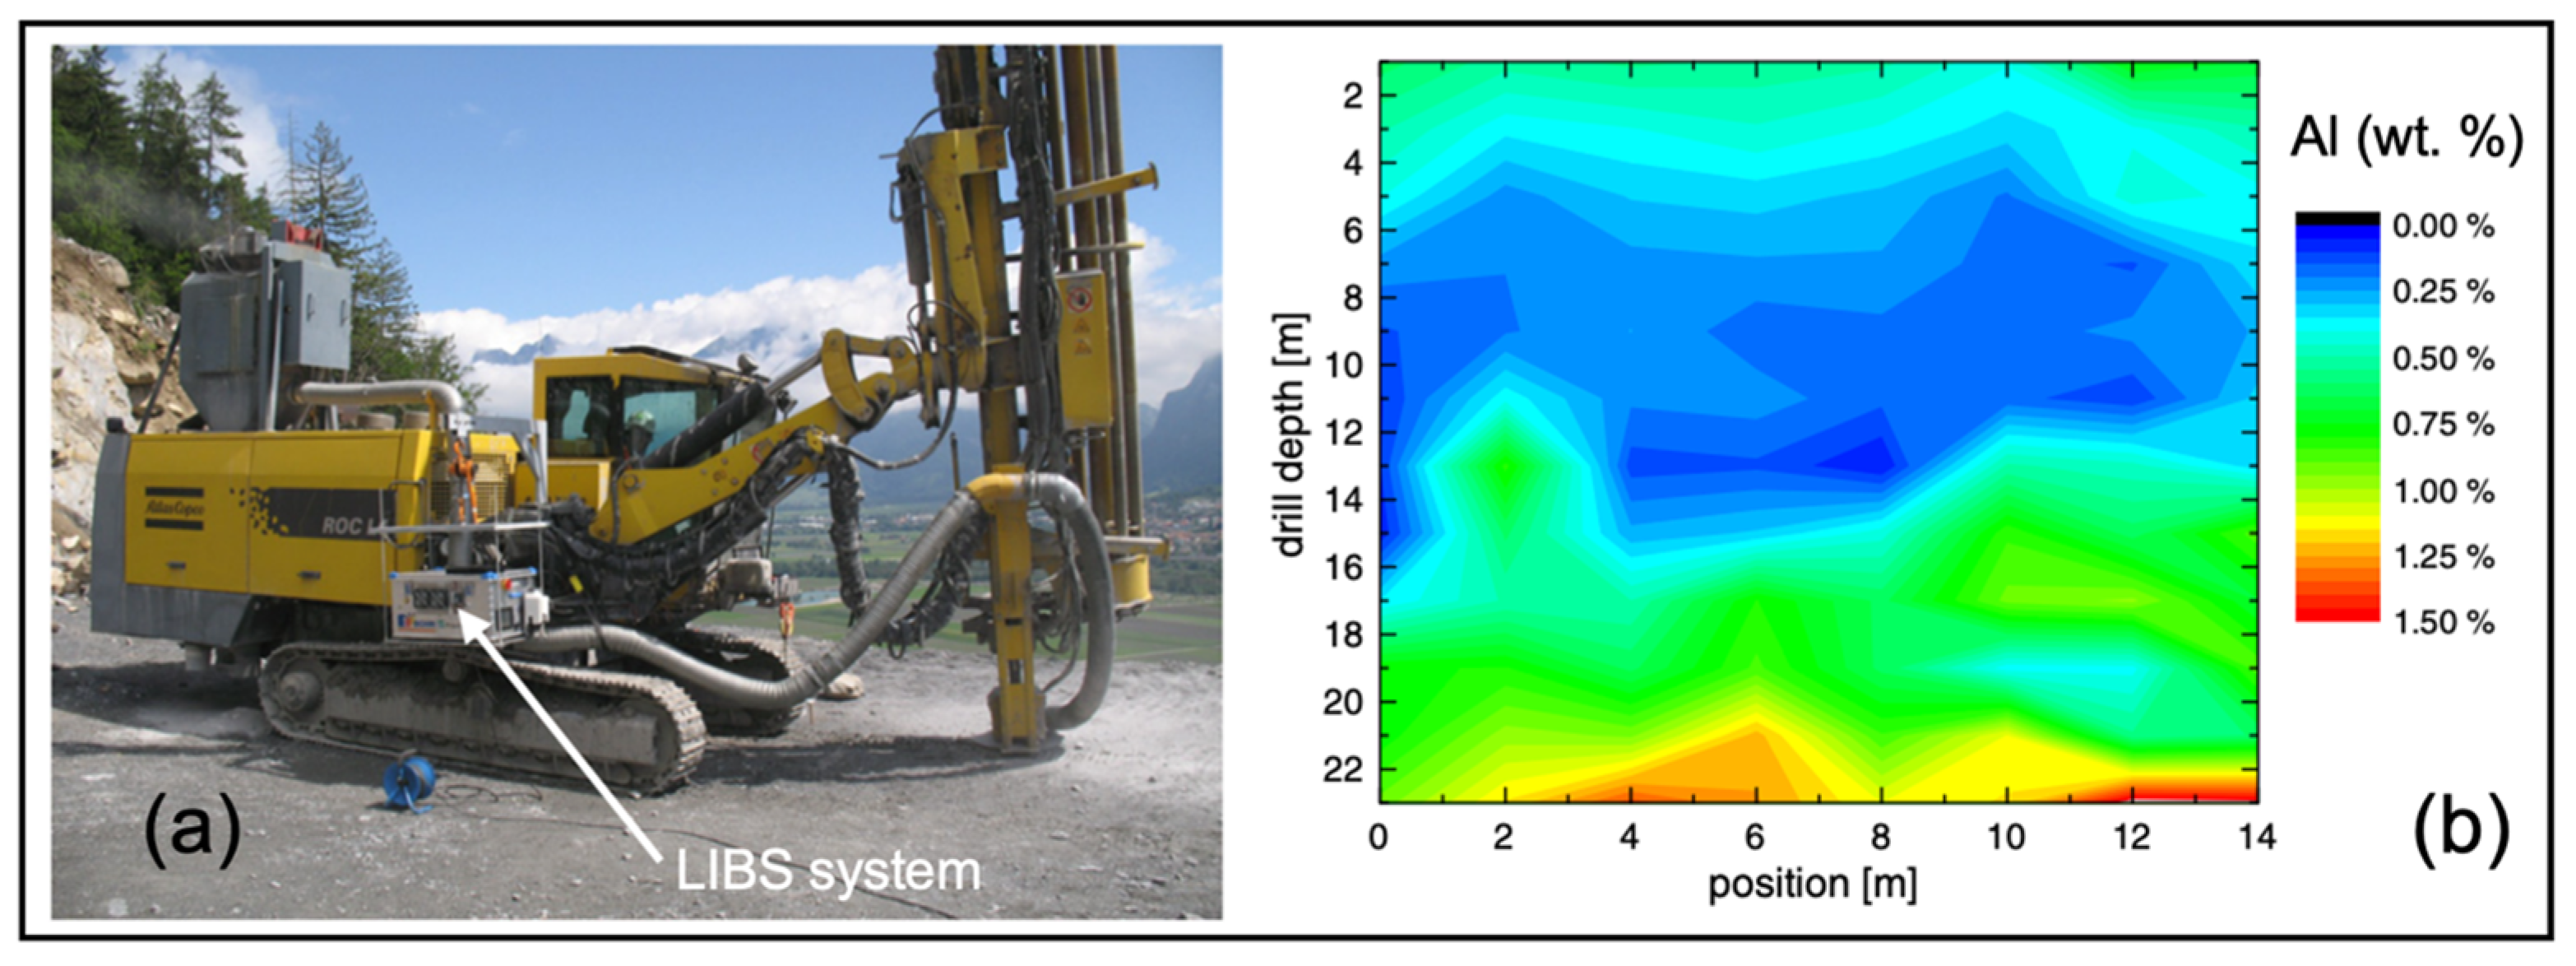
Figure 12.
LIBS publications related to mineral exploration and ore processing from 1990–2023.
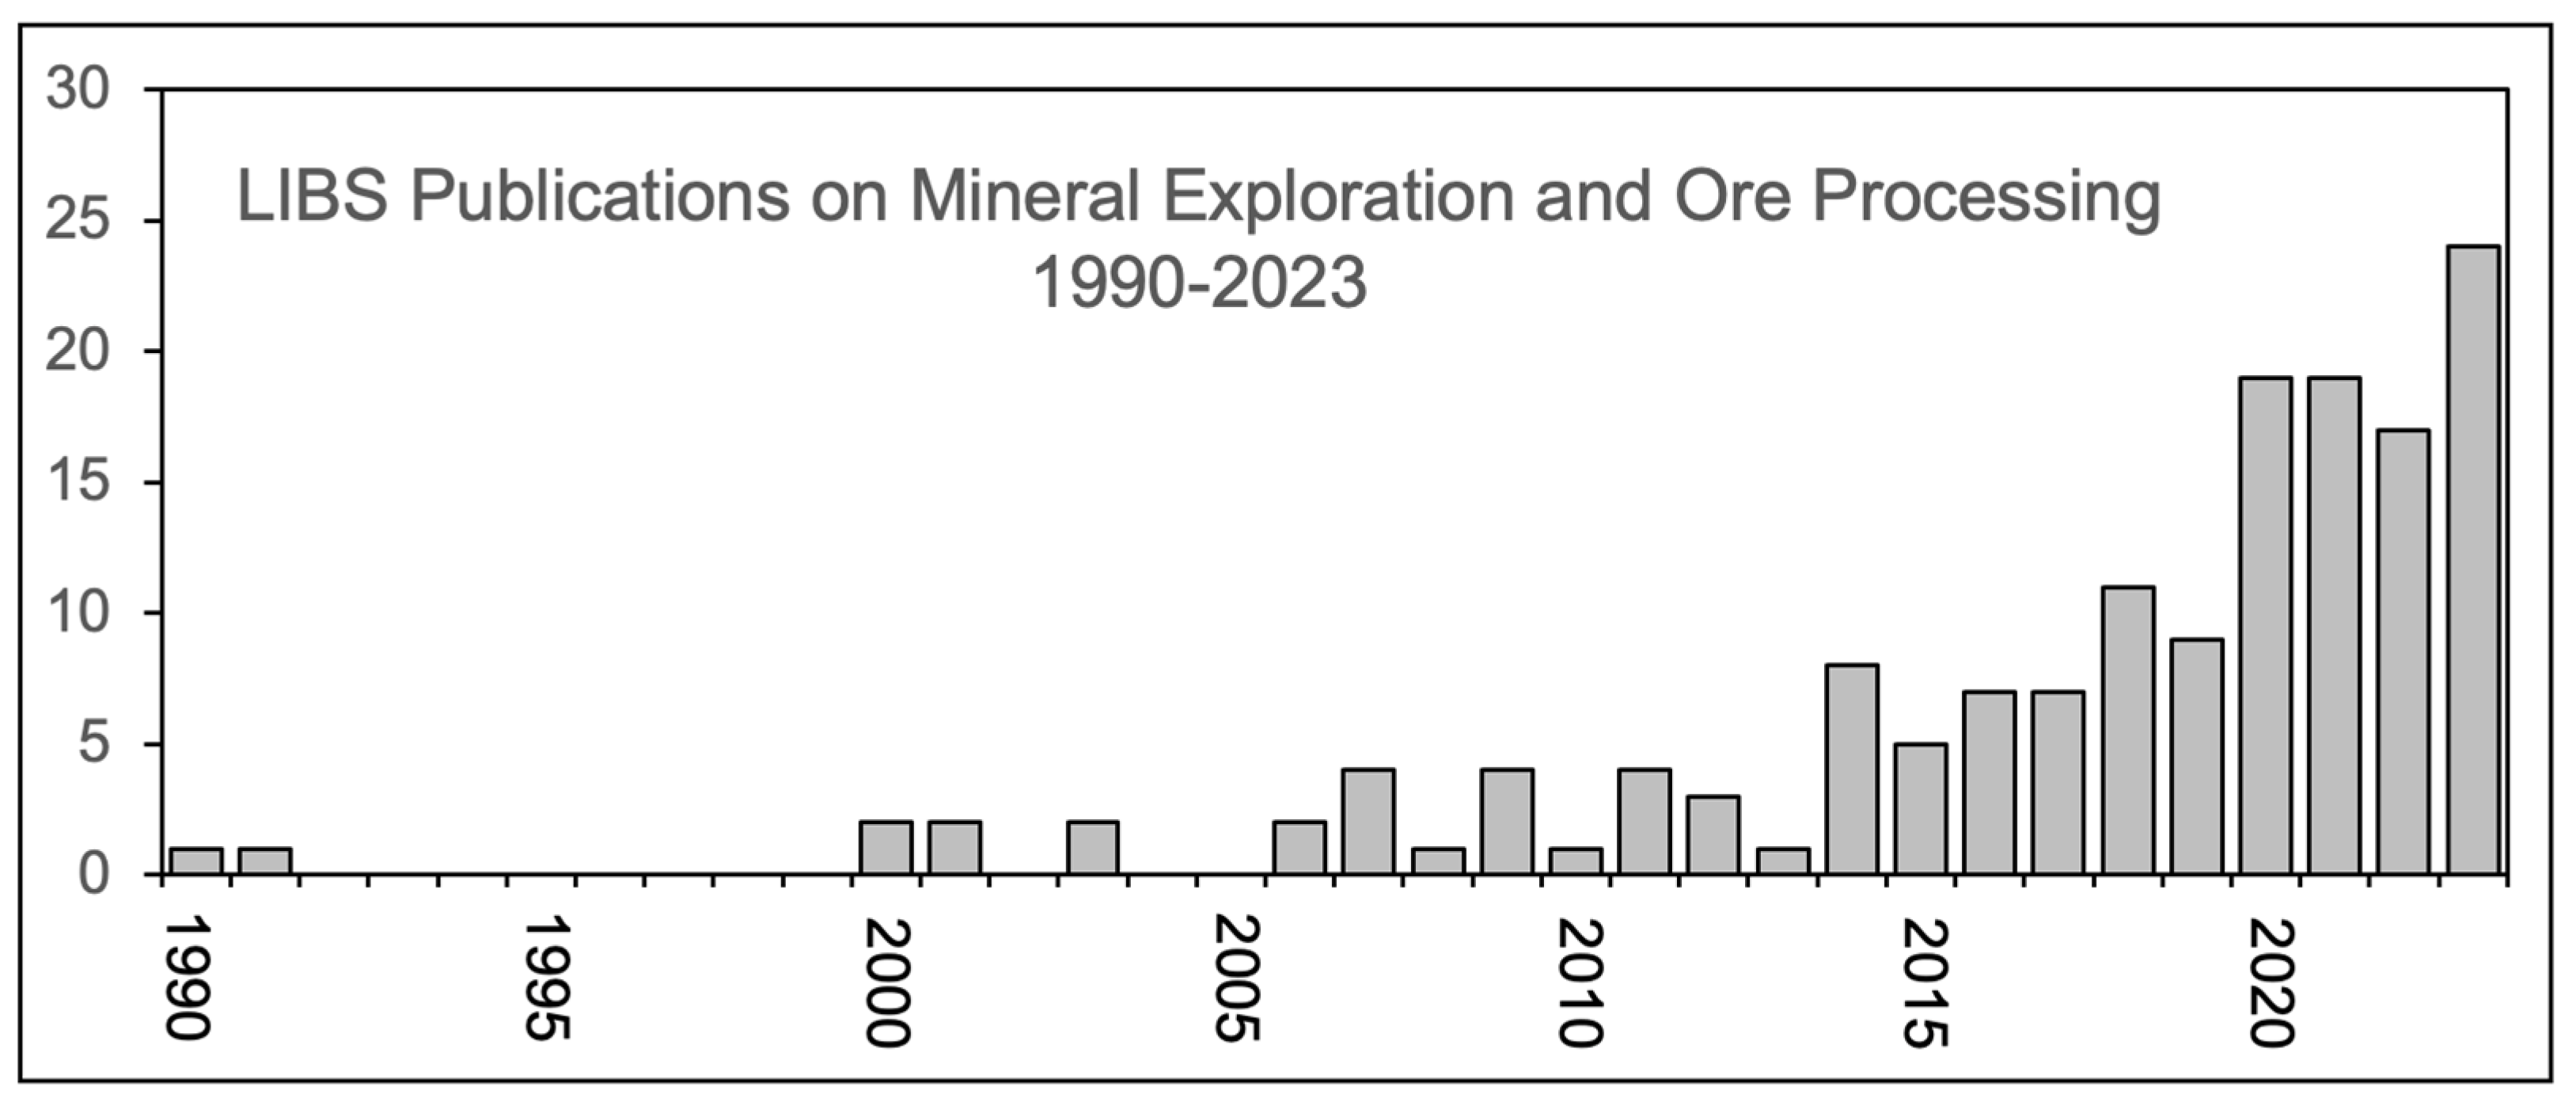
Figure 13.
LIBS muscovite analysis in Li-pegmatites from southwestern North Carolina (USA) by handheld LIBS, modified from [129]. K/Rb versus Li plots for (a) the Carolina Tin-Spodumene Belt (CTSB), (b) the Carolina Lithium Prospect (CLP) within the CTSB, and (c) four CLP drill cores. Symbols containing an ‘x’ indicate spodumene-bearing pegmatites. According to Wise et al. [131], common pegmatites characterized by low degrees of fractionation typically exhibit K/Rb ratios > 40, moderately fractionated pegmatites have K/Rb ratios between 40 and 10, and highly fractionated pegmatites have K/Rb ratios < 10. The spodumene-bearing granite pegmatites of the CTSB and CLP are Li-poor but moderately to highly fractionated in this schema.

Figure 14.
LIBS analysis of a Li-bearing pegmatite in drill core through the metagreywacke of the Rapasaari complex (Finland), modified from figures in [61]. (top) Example LIBS spectra for the accessory minerals beryl, apatite [Ca5(PO4)3(OH,F,Cl)] and a Zn-bearing phase with specific element lines indicated. (middle) Optical image of muscovite pegmatite drill core BK204 with the area of analysis indicated by the red rectangle. (bottom) False-color LIBS-derived images for element distributions (left) and mineral classification results (right).
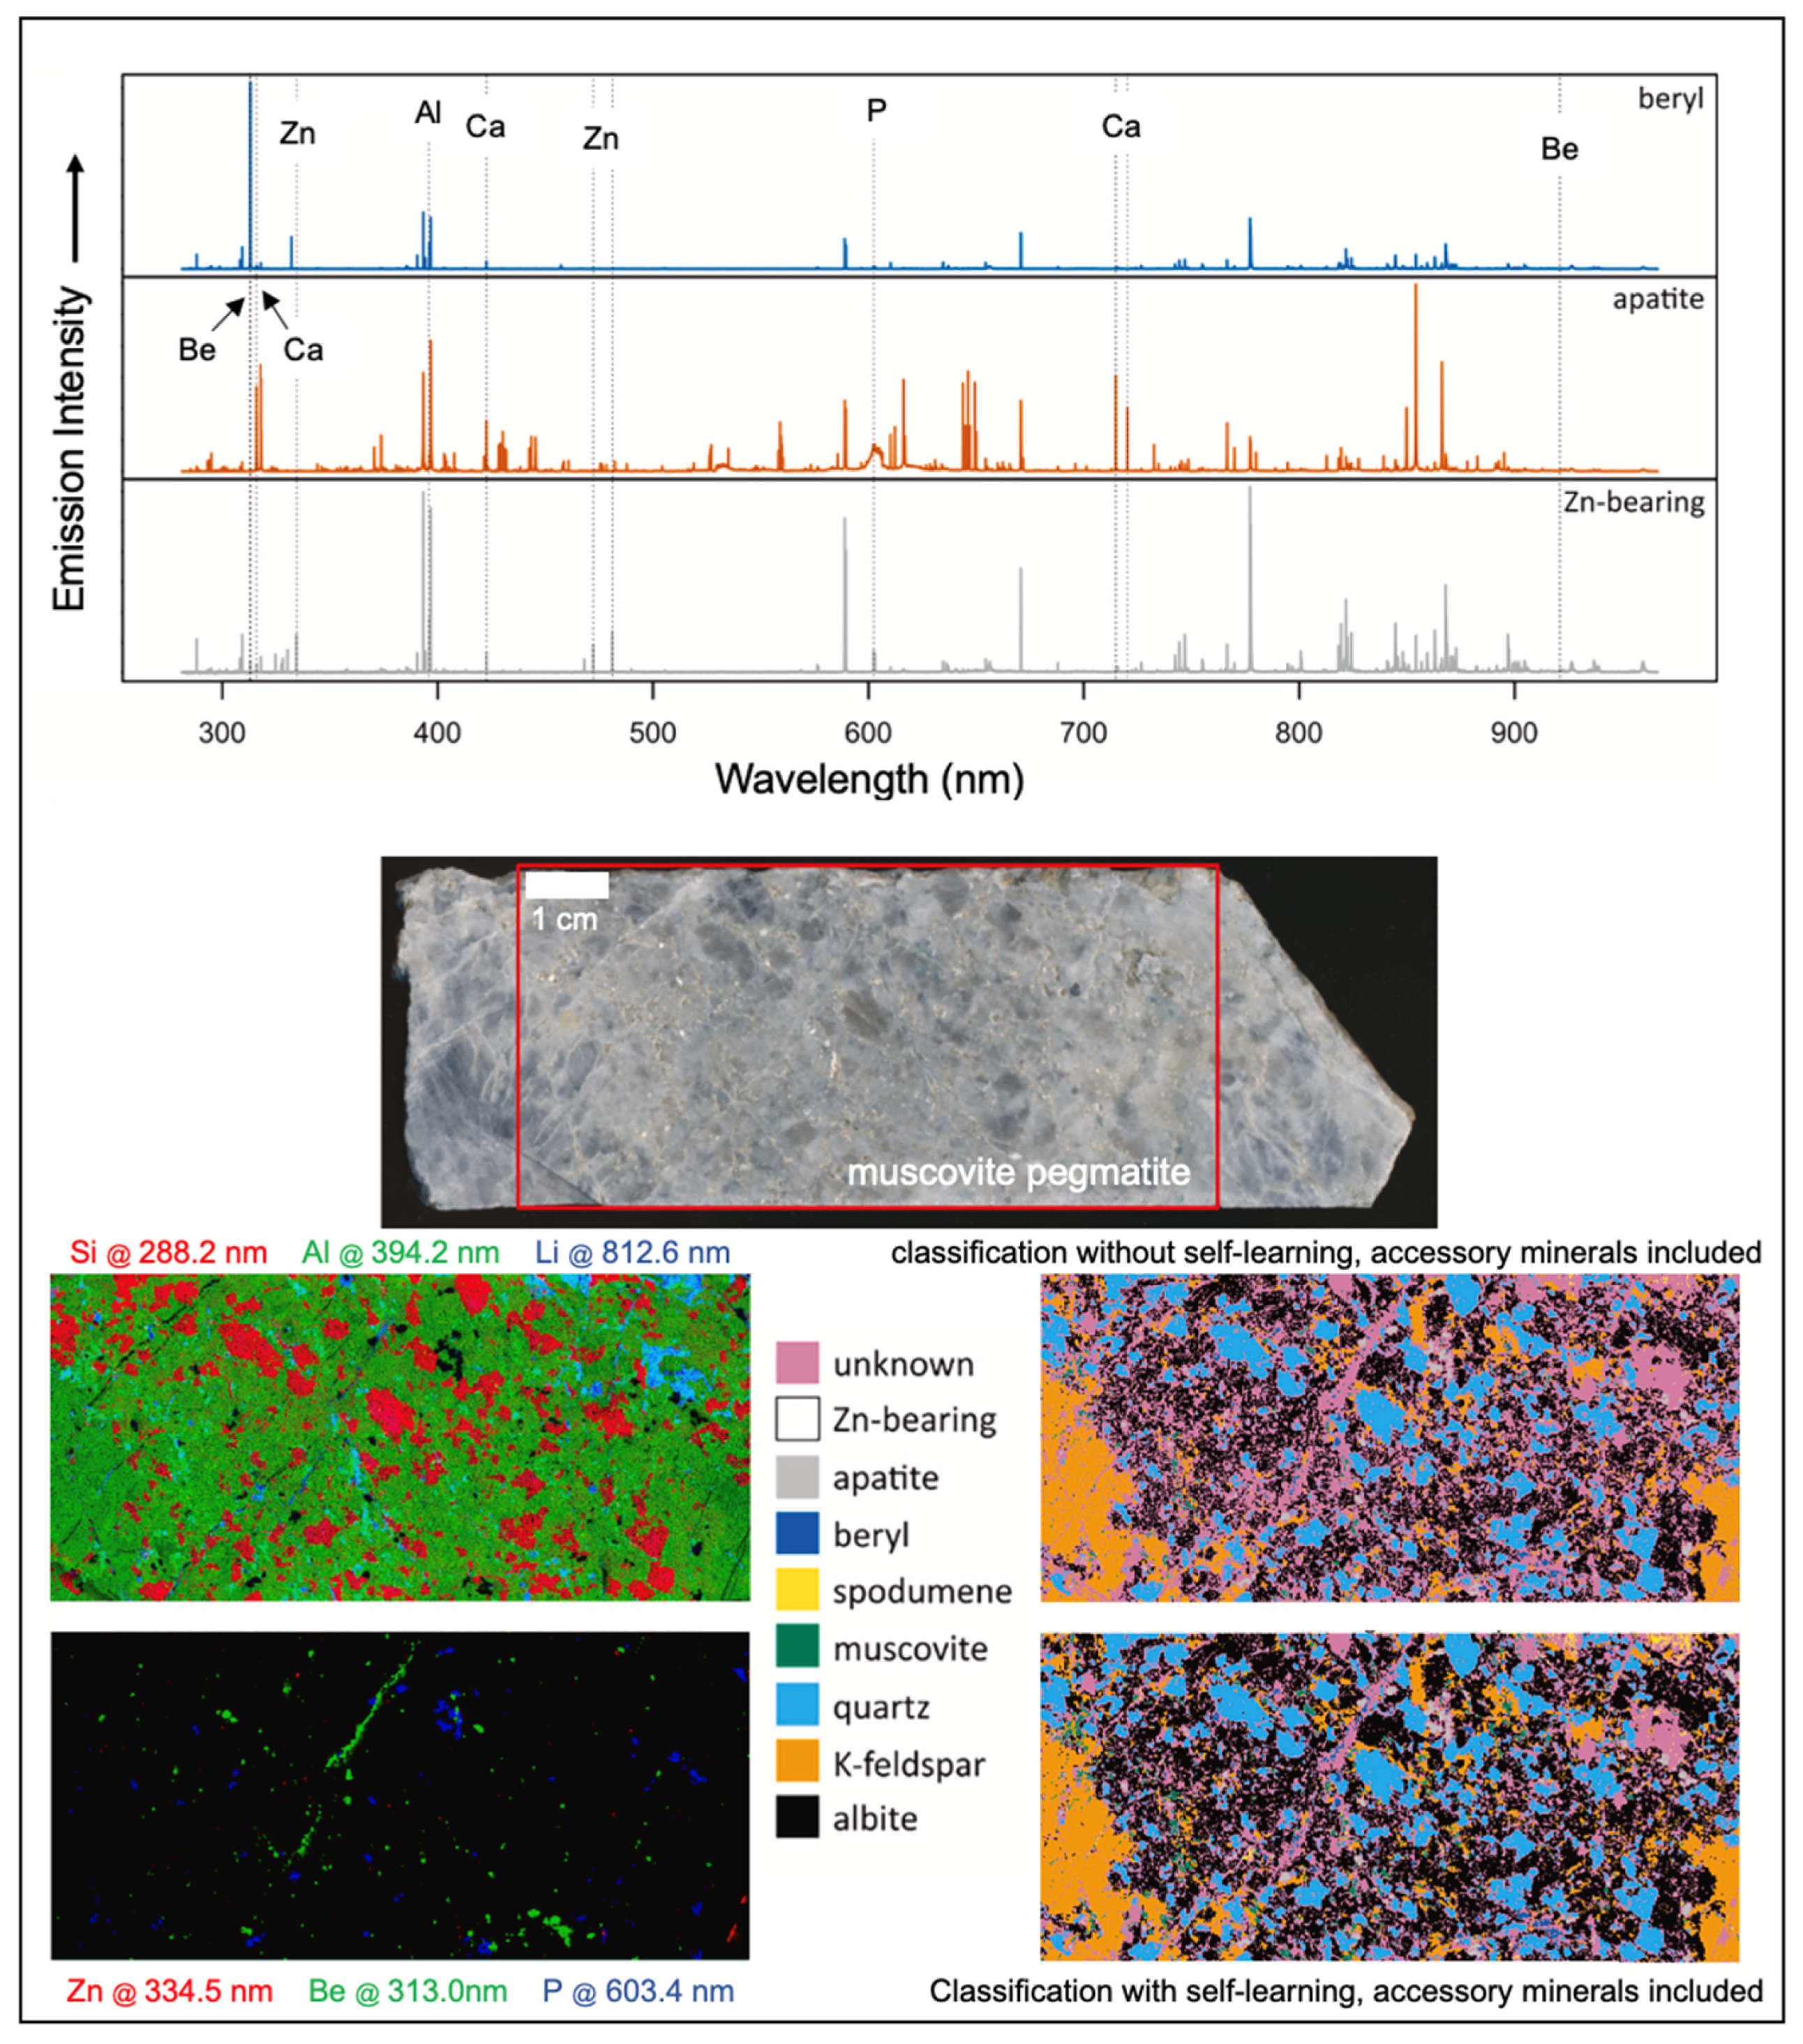
Figure 15.
Garnet analysis by handheld LIBS, modified from [81]. (a) PCA score plot for igneous garnets from granitic pegmatites and rhyolites, chromite pods and kimberlites by handheld LIBS. (b) PLSDA classification matrix for pyrope-type garnets from five South African kimberlite locations: KZNP = KwaZulu-Natal Province; NCP-BW = Barkly West, in Northern Cape Province; NCP-K = Kimberley in Northern Cape Province; NK = North of Kimberley in Northern Cape Province; and OFS = Orange Free State. This bivariate plot portrays the PLSDA reclassification of the LIBS observations, where each entry in the matrix indicates the percentage of samples that were identified as belonging to the column class when they are actually members of the row class.

Figure 17.
Sulfide and gangue mineral distribution in three drill core segments from LIBS analysis, modified from [91].
Figure 17.
Sulfide and gangue mineral distribution in three drill core segments from LIBS analysis, modified from [91].
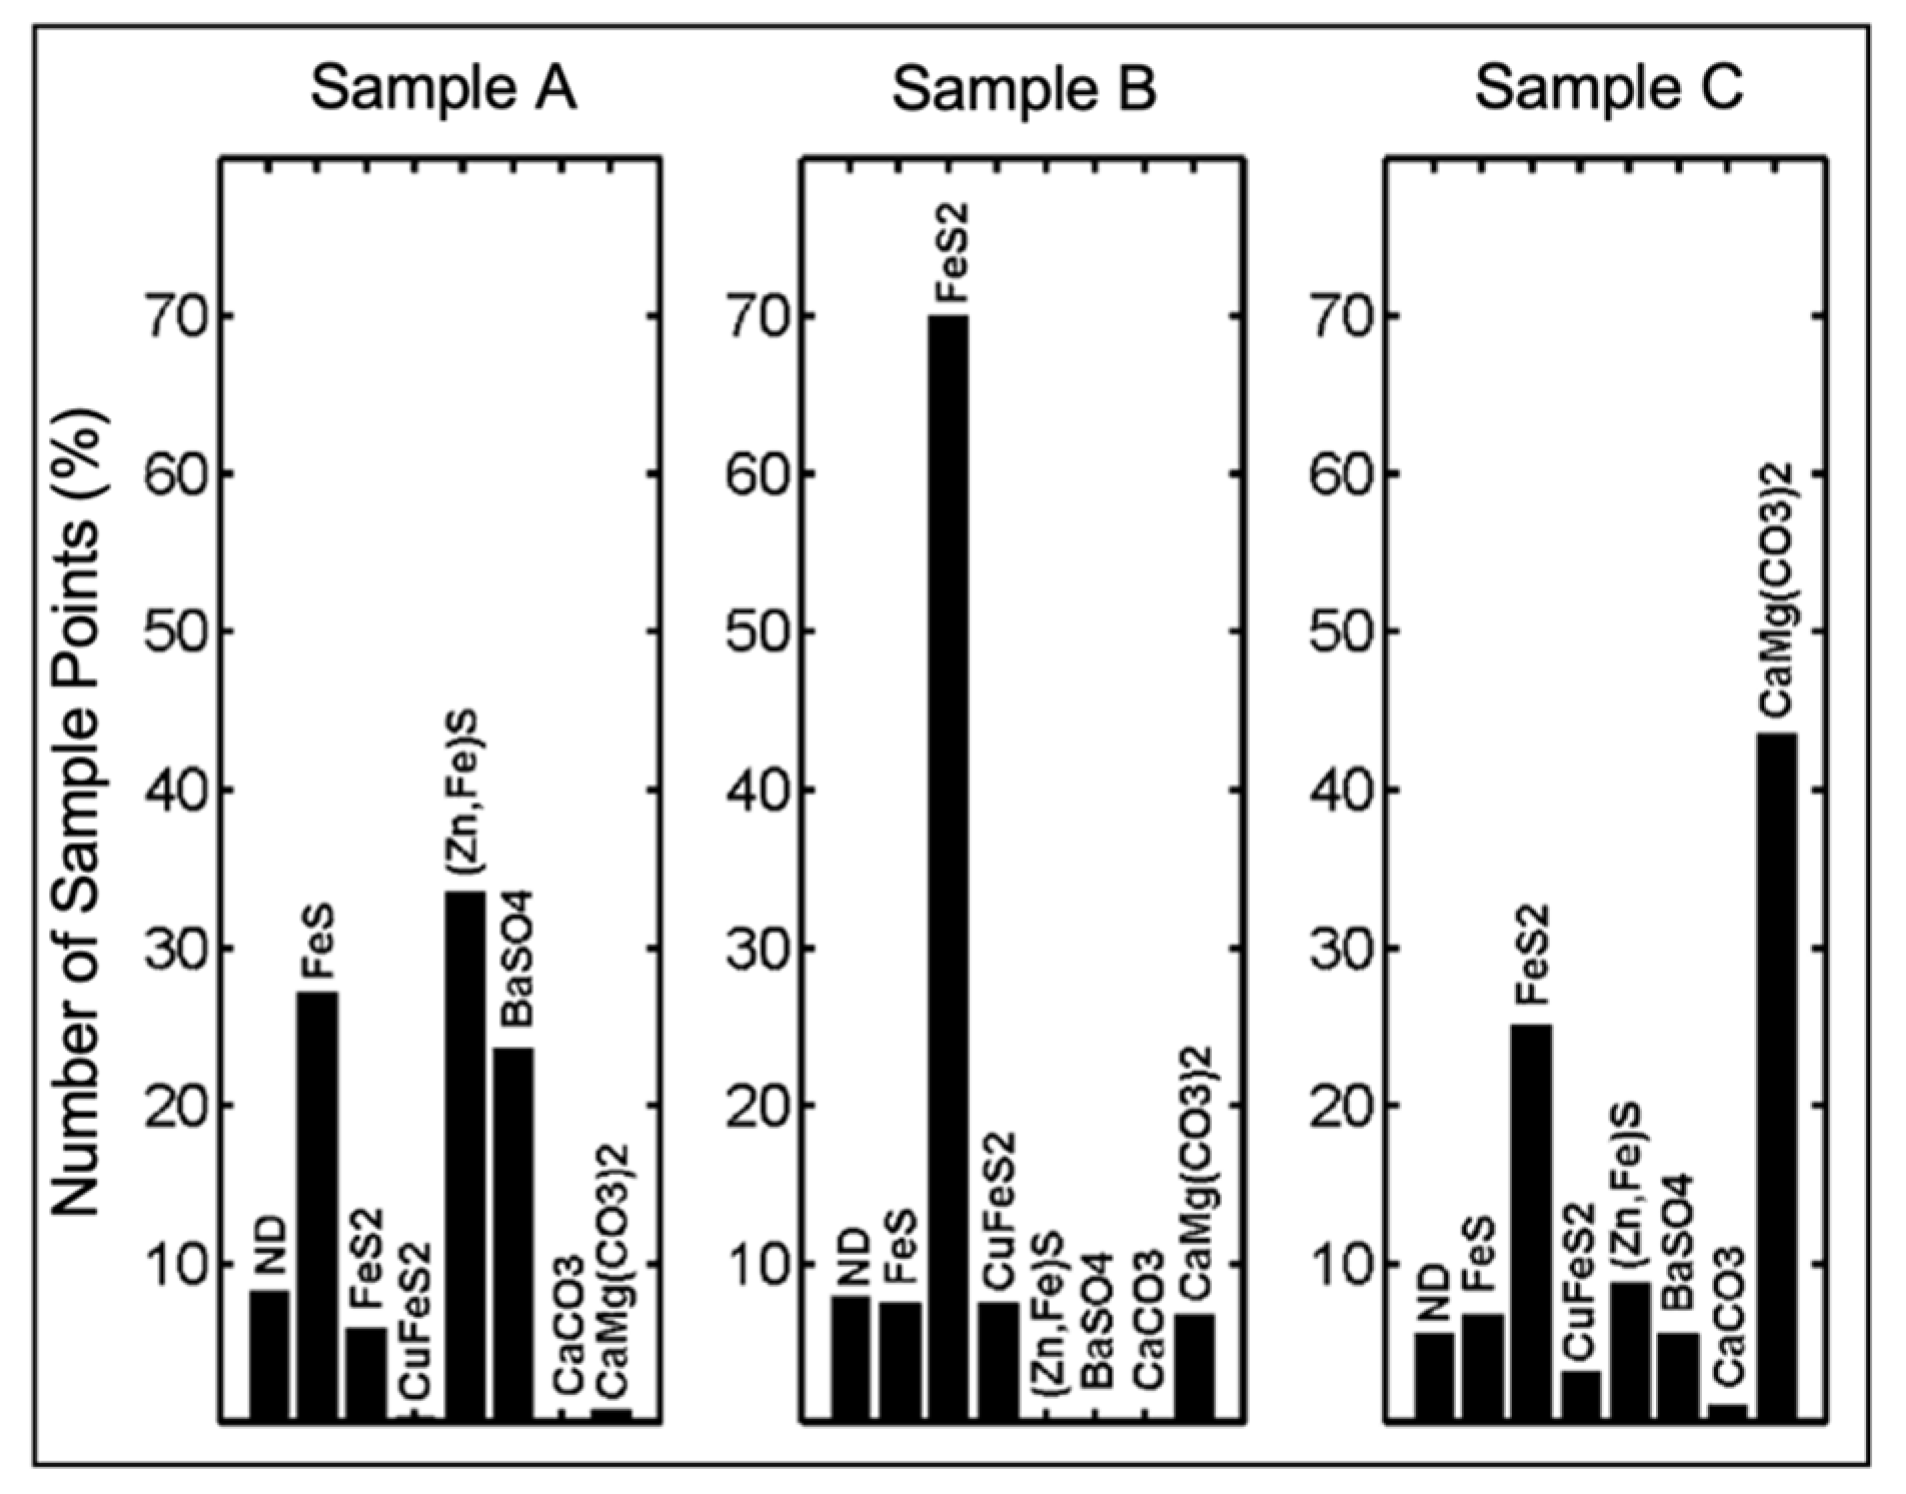
Figure 18.
Example LIBS spectra for the Cu-bearing mineral species pyrite, chalcopyrite, bornite, molybdenite, enargite, covellite, and chalcocite (modified from [59]).
Figure 18.
Example LIBS spectra for the Cu-bearing mineral species pyrite, chalcopyrite, bornite, molybdenite, enargite, covellite, and chalcocite (modified from [59]).
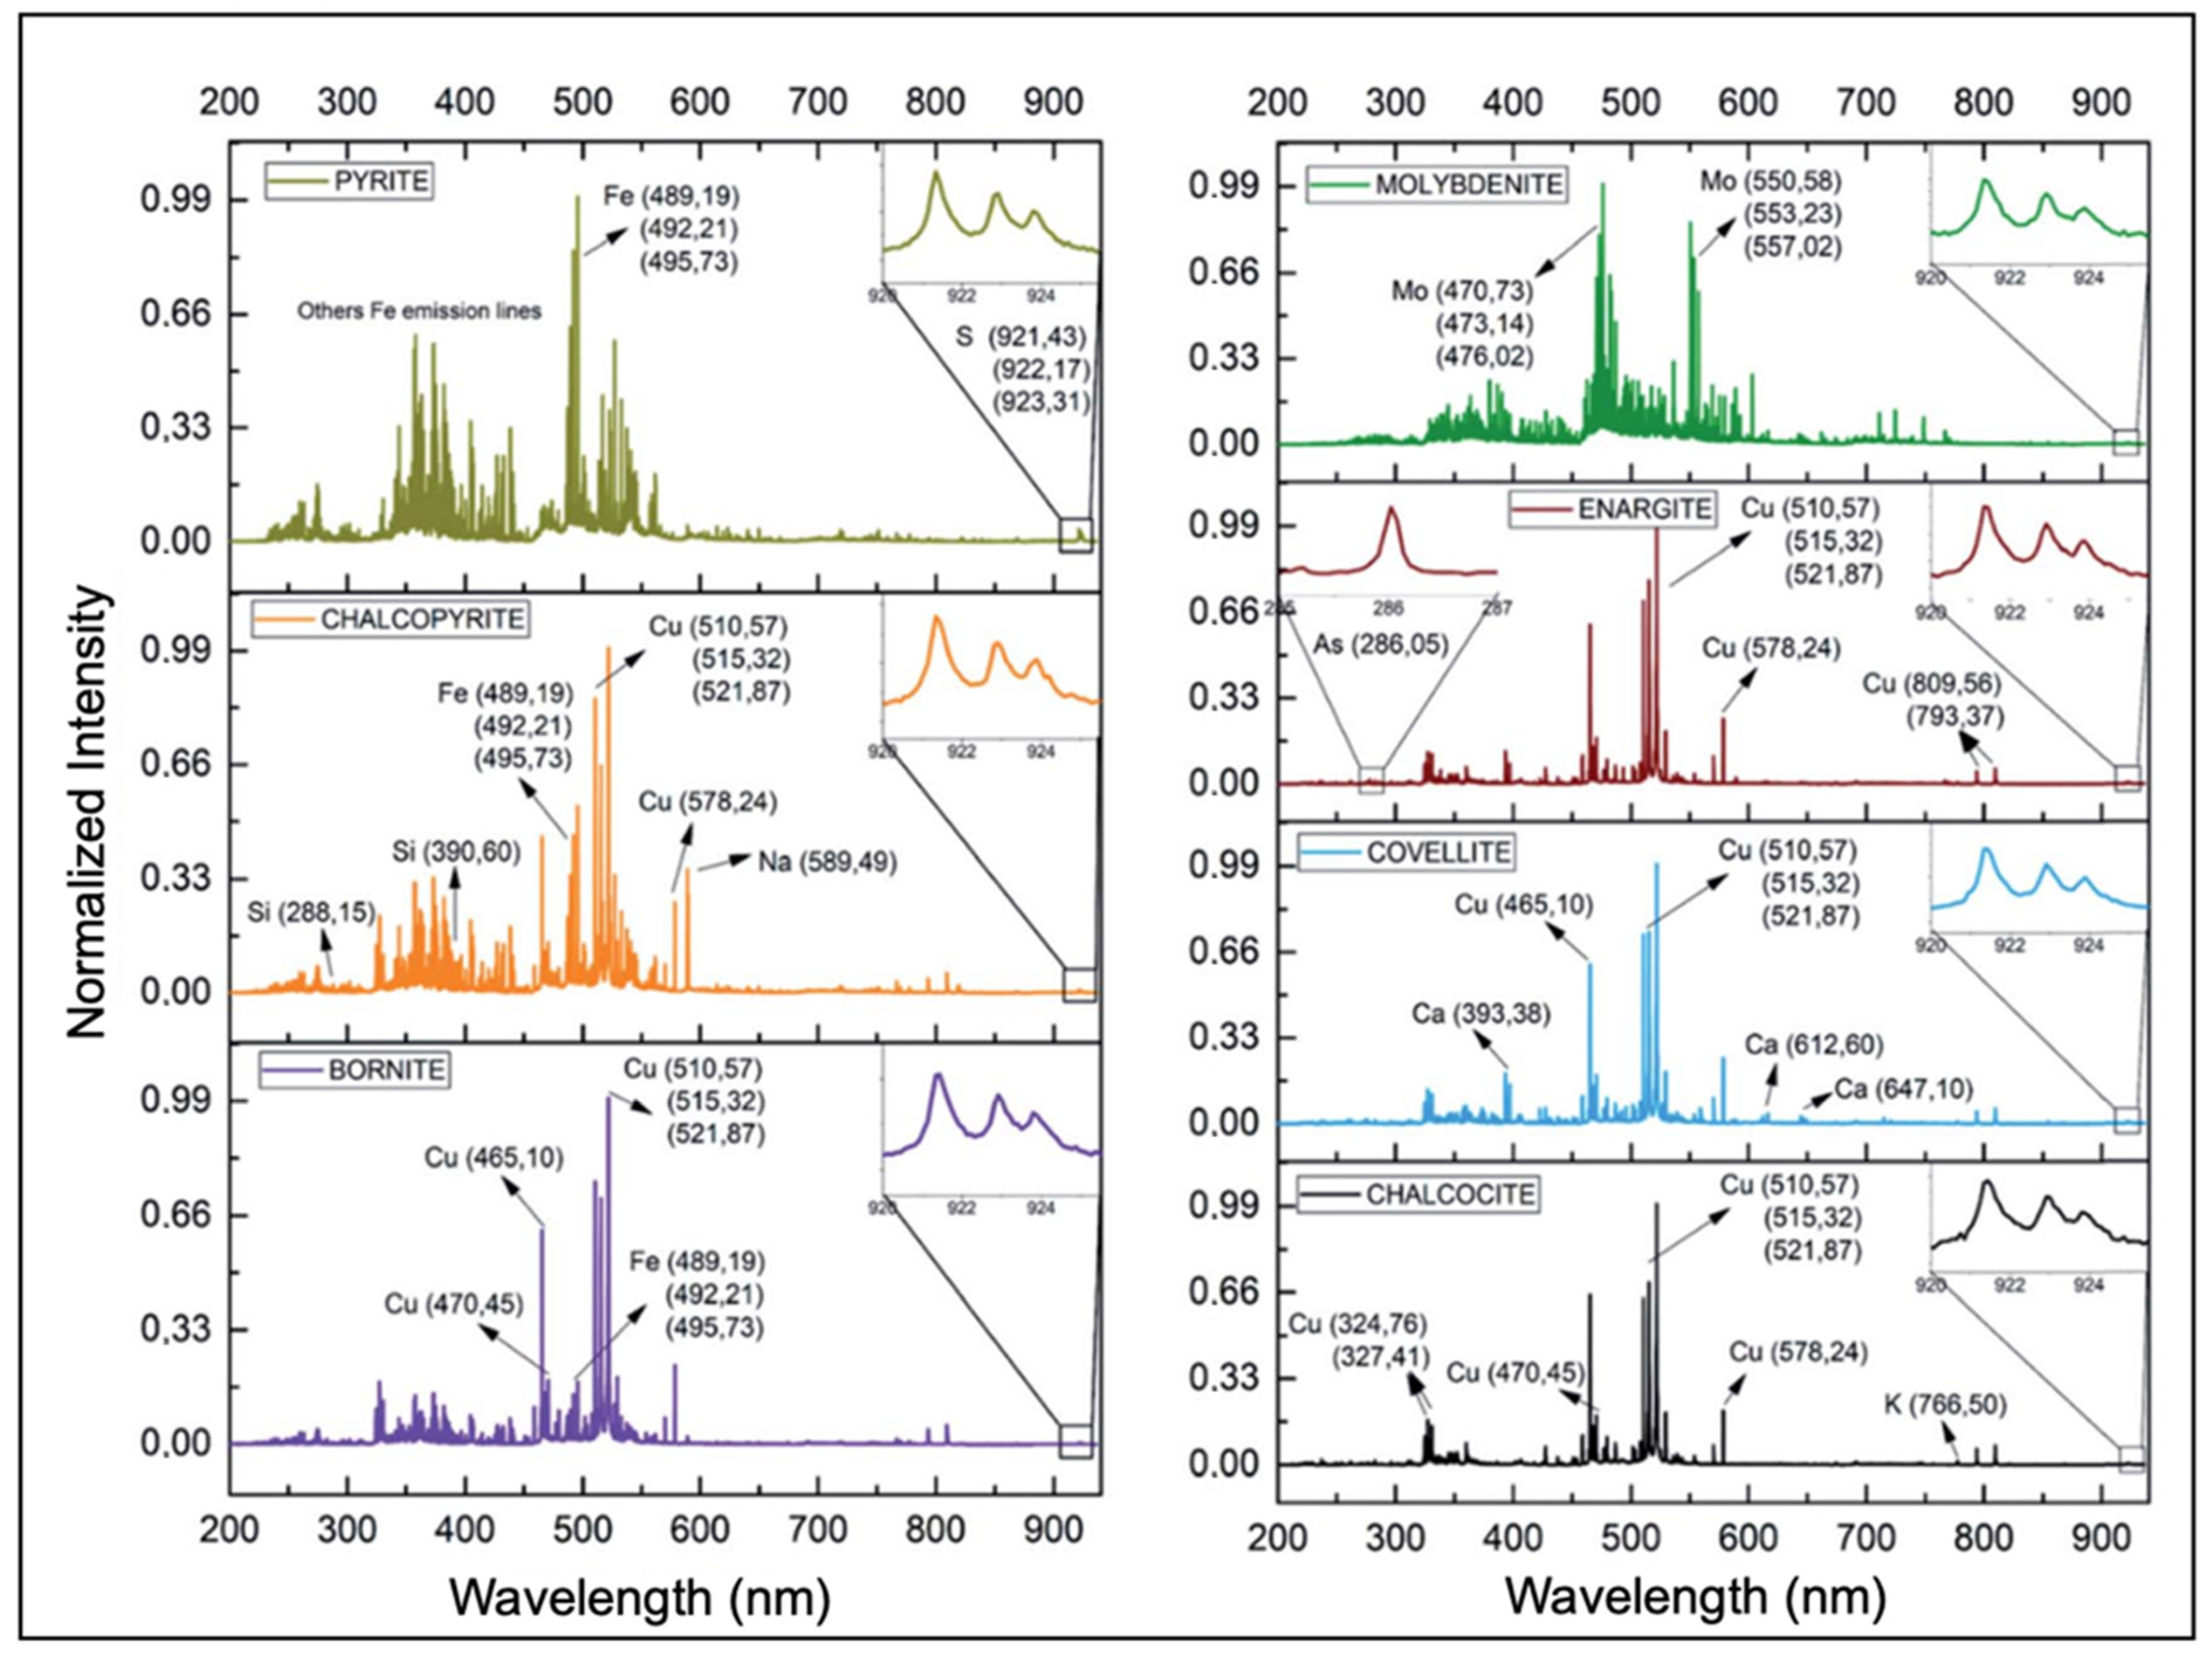
Figure 19.
LIBS processing schema for primary (top row) and secondary (bottom row) Cu-sulfide ores from northern Chile, modified from [96]. (left top and bottom) Single-element images for Cu, S, Fe, Si, O, and Ca. (center top and bottom) Merged images for element combinations. (right top and bottom) Mineral images generated from element image combinations and sample optical images. anh = anhydrite, bn = bornite, cc = calcite, ccp = chalcopyrite, cv = covelite, mag = magnetite, qtz = quartz, pl = plagioclase feldspar.
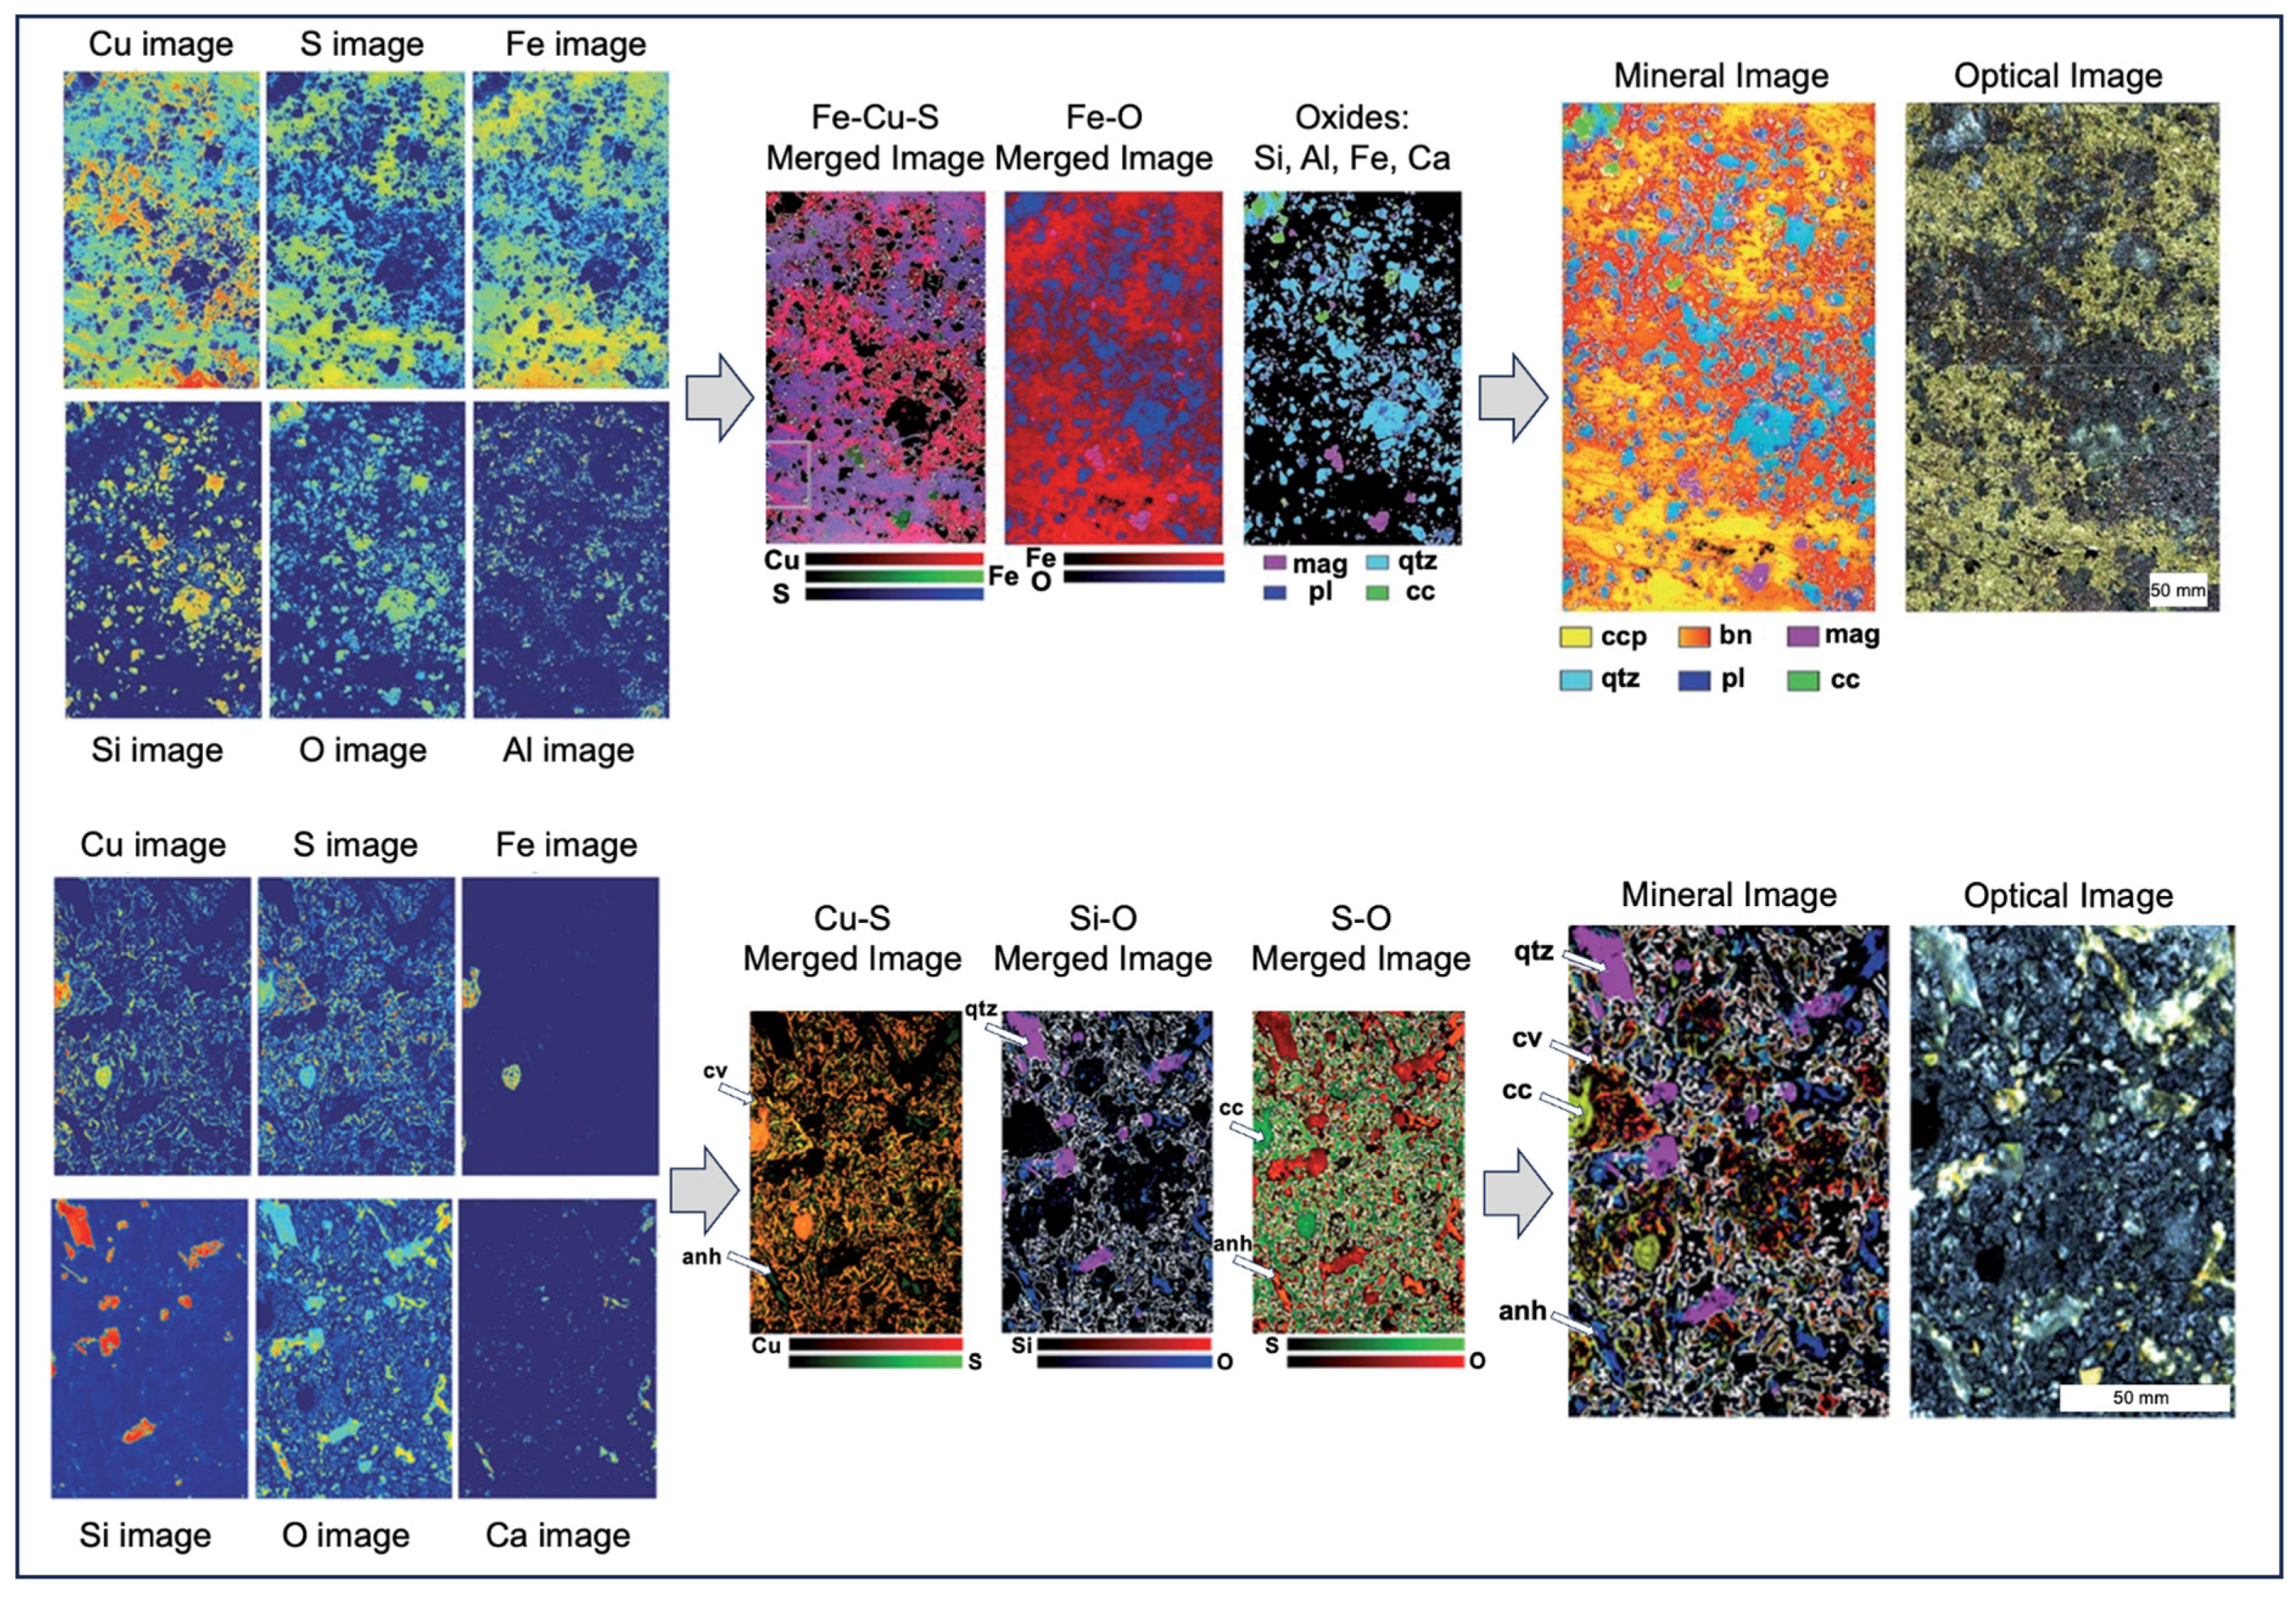
Figure 20.
Principal component score plot for coltan samples from mines in California (USA)—El Molino, Ingram, Katerina and Olla, and from pegmatites in Connecticut (USA)—Branchville, Glastonbury, Haddam, Middletown, Portland and Strickland Quarry, modified from [87].
Figure 20.
Principal component score plot for coltan samples from mines in California (USA)—El Molino, Ingram, Katerina and Olla, and from pegmatites in Connecticut (USA)—Branchville, Glastonbury, Haddam, Middletown, Portland and Strickland Quarry, modified from [87].

Figure 21.
Elemental and mineral mapping for a segment of drill core from Stillwater, Montana (USA), modified from [200]. (a) Spatial distribution of Si (gray), Mg (blue), Cu (orange), Fe (green), Ni (cyan), Pd (magenta), and Pt (yellow) with the minerals olivine, calcic plagioclase feldspar, chalcopyrite, pentlandite [(Fe,Ni)9S8], pyrrhotite, and braggite [(Pt, Pd, Ni)S] identified. (b) Spatial distribution of K (cyan), Ca (magenta), and Na (yellow) with the minerals olivine, bytownite plagioclase feldspar, and actinolite [Ca2(MgFe)Si8O22(OH)2] identified.

Figure 22.
Au distributions in cores from gold mines in Québec (Canada), modified from [58,200]. (a) Concentration versus area mapping over of 5 × 20 cm2 domain of a drill core from the Lapa Mine [58]. The averaged Au concentration over the entire drill core is 46 ppm, although its actual distribution is highly spatially heterogeneous on a millimeter scale, with concentrations overall quite low but very high at a few discrete locations. (b) Volume segmentation of a Au-bearing sample from the Cadillac Mine reconstructed by LIBS tomography [200] showing the 3D spatial distribution of gold (yellow), chalcopyrite (red), and Al-rich mineral aggregates of biotite–chlorite [K(Mg,Fe)3AlSi3O10(F,OH)2 -(Mg,Fe)3(Si,Al)4O10(OH)2·(Mg,Fe)3(OH)6] (blue). The volume without color mostly comprises tremolite [Ca2Mg5Si8O22(OH)2].
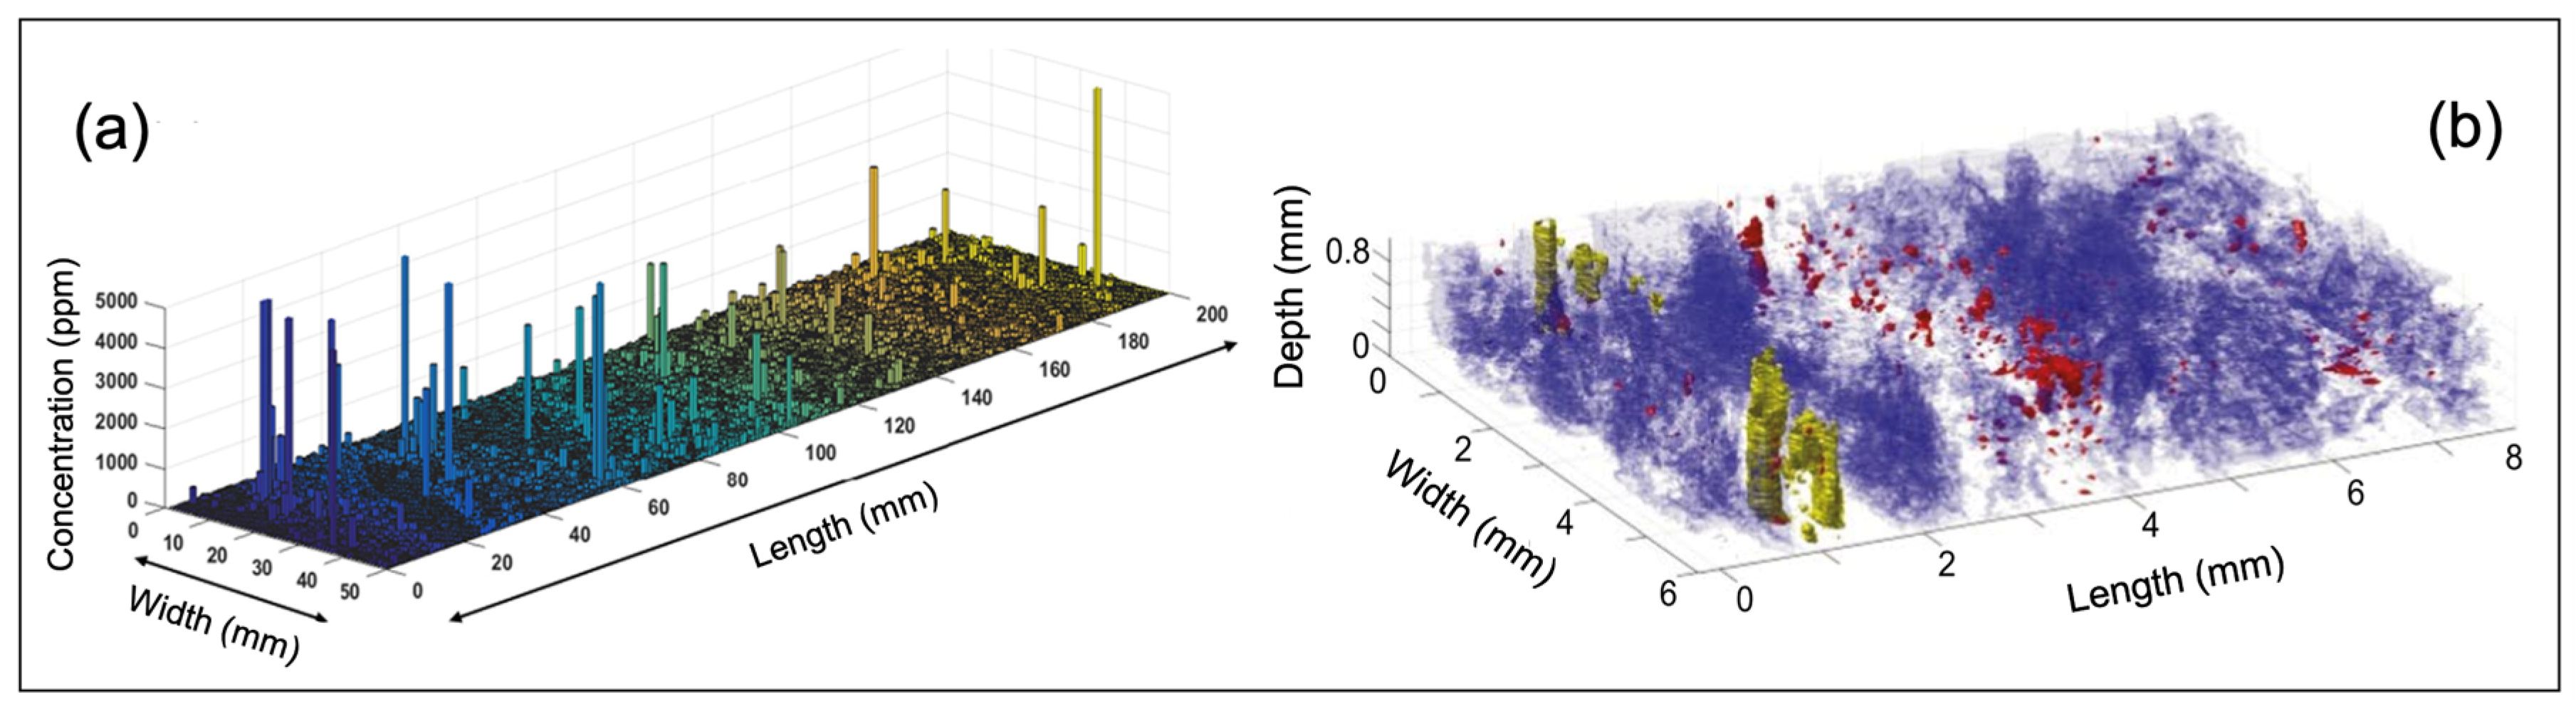
Figure 23.
LIBS provenance discrimination of cassiterite, modified from [80]. The PLSDA classification matrix was generated using 80 components and 10-fold cross-validation for 38 cassiterite samples from six different geographic regions. Numbers in parentheses indicate the numbers of samples analyzed from each cassiterite source and shaded boxes denote a classification success of >90%.
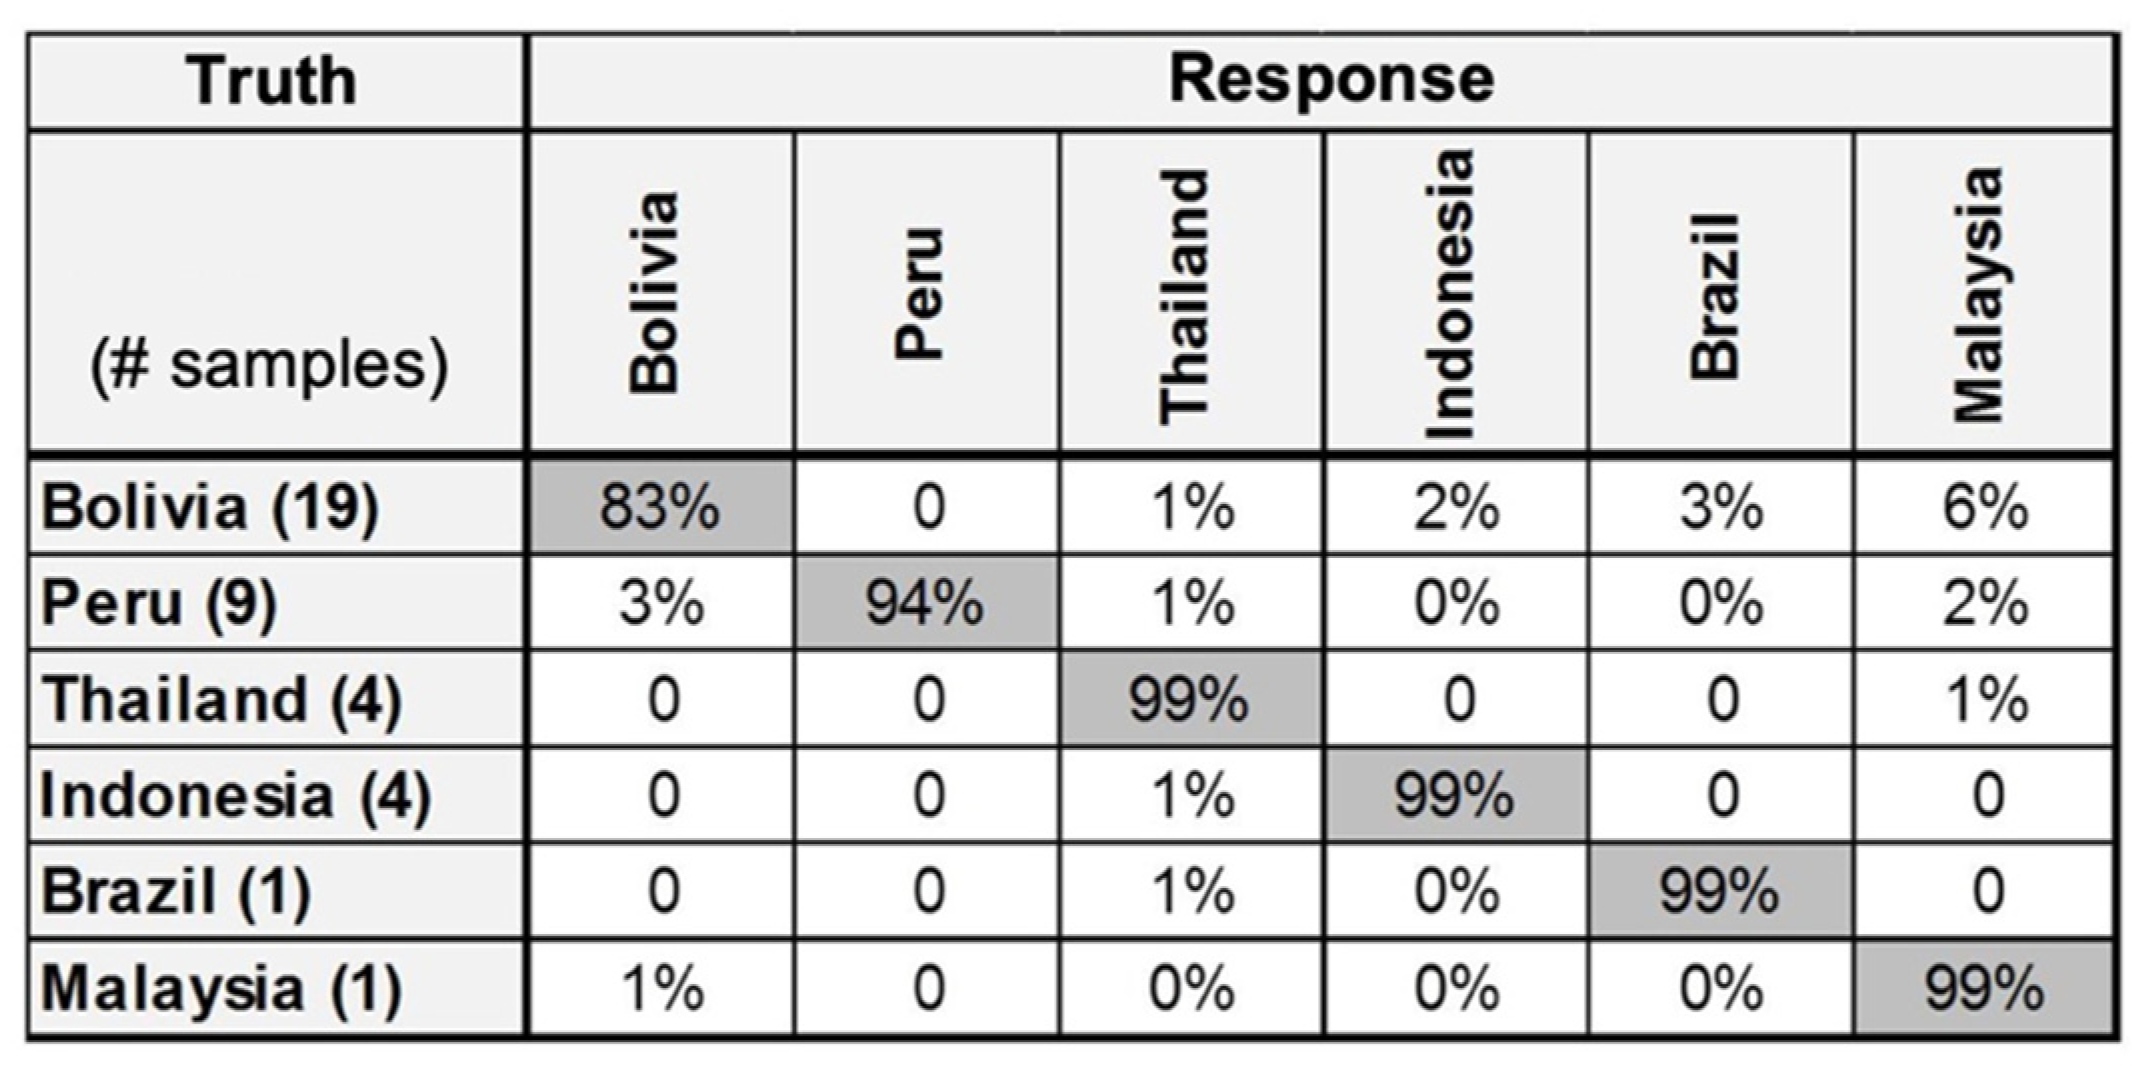
Figure 24.
Elemental and molecular LIBS imaging of a cerite sample, modified from [219]. (a) Example single-shot elemental emission spectrum between 280 and 340 nm. (b) Example single-shot molecular emission spectrum between 460 and 650 nm; (c) Optical, elemental (Ca, Fe, Si, Cu, La and Y), molecular (LiO and YO), and combined false-color images.

Figure 25.
Optical image of a partially oxidized and hydrothermally altered ore sample from the Zálesí uranium deposit in the Rychlebské hory Mountains (Czech Republic) modified from [240]. The optical image (upper left) shows the surface texture of the sample and the areas examined by EDX imaging (red rectangle) to distinguish uraninite and LIBS imaging (green rectangle) used for elemental analysis, and the boundary (black line) between aggregates of primary uraninite—(Urn) and secondary uranophane—Urp [Ca(UO2)2(SiO3OH)2·5H2O]. The distributions of U, O, H, Si, and Ca in the sample are displayed in the five LIBS scans. Areas of secondary fluid alteration are indicated by elevated O, H, Si, and Ca abundances that generated secondary uranophane across the majority of the ore sample.

Figure 26.
LIBS-derived concentrations for Li, Si, and K of minerals in a drill core from the Rapasaari lithium deposit (Finland), modified from [105]. Calibration models were developed on a pixel-by-pixel basis for the core segments scanned by both LIBS and LA-ICP-MS.
Figure 26.
LIBS-derived concentrations for Li, Si, and K of minerals in a drill core from the Rapasaari lithium deposit (Finland), modified from [105]. Calibration models were developed on a pixel-by-pixel basis for the core segments scanned by both LIBS and LA-ICP-MS.
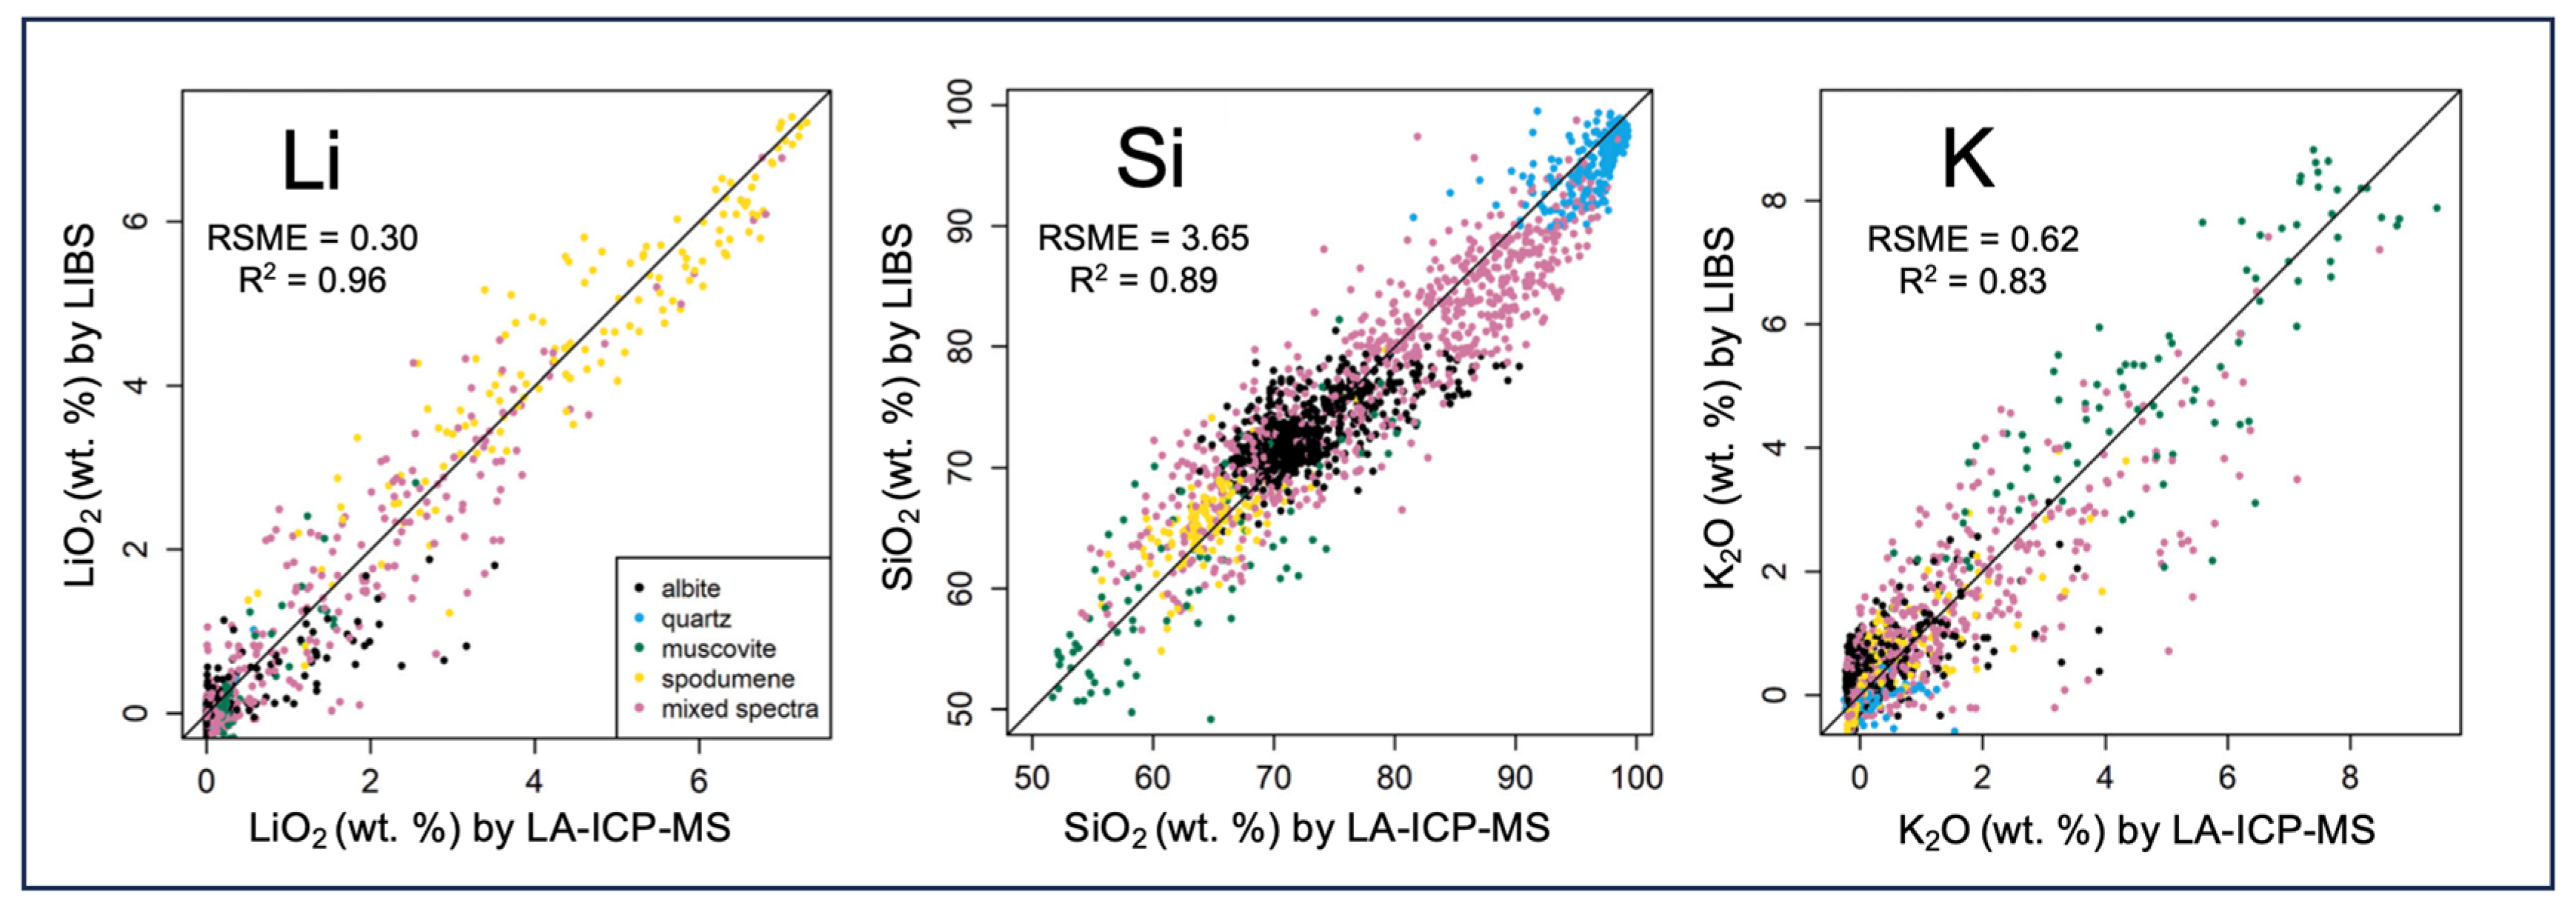
Figure 27.
Selected elemental, molecular, and radiogenic isotope distributions in a uraninite sample from the Rožná-Olší ore field (Czech Republic), modified from [239]. (top left) Photographic images showing bands of uraninite (1), hydrothermal calcite (2), and metasomatite (3) along with the areas of the sample imaged by LIBS (gray rectangle) and LA-ICP-MS (white rectangles) analysis. (lower left) Distribution maps for Ca, Fe, Pb, U, and molecular UO in the three lithologies obtained by LIBS. (top right) Photographic image of spherulitic uraninite aggregates overgrown and/or crosscut by hydrothermal calcite (top left) and distributions of selected isotopes (43Ca, 51V, 235U, 204Pb, 206Pb, 207Pb, 208Pb) obtained by LA-ICP-MS. (lower right) Distribution of U in the sample domain shown in top left: (a) U by LIBS and (b–d) 235U by LA-ICP-MS.


Table 1.
LIBS capabilities and attributes.
| System architecture | Simple, requiring only a laser, optics, detector/spectrograph, and computer, so is less expensive than many other analytical technologies |
| Analytical capability | Full periodic table, but particularly sensitive to the light elements H, Li, Be, B, and C and with isotopic analysis demonstrated for certain elements |
| Application | Solids, liquids, or gases in the laboratory or outside in the ambient environment for in situ field analysis |
| Analytical time | Rapid multi-element analysis (<1 s) |
| Surface analysis | In situ analysis of ultra-thin alteration layers, coatings, and contamination on a sample surface |
| Preparation | Little to no sample preparation needed. The LIBS plasma shock wave can be used to remove allochthonous surface materials and contamination by ‘cleaning’ shots prior to analysis |
| Depth analysis | Stratigraphic profiling to >100 mm depth and in situ analysis of individual particles and mineral grains as well as both liquid and solid inclusions |
| Imaging | Megapixel compositional imaging of rock and mineral surfaces at tens of μm spatial resolution |
| Deployment | As laboratory instrumentation, field-portable and handheld analyzers, and as bespoke systems for use in harsh industrial settings and geologically extreme environments |
| Integration | Easily combined with other analytical techniques such as LIF, RS, IR, µXRF, or LA-ICP-MS |
Disclaimer/Publisher’s Note: The statements, opinions and data contained in all publications are solely those of the individual author(s) and contributor(s) and not of MDPI and/or the editor(s). MDPI and/or the editor(s) disclaim responsibility for any injury to people or property resulting from any ideas, methods, instructions or products referred to in the content. |
© 2024 by the author. Licensee MDPI, Basel, Switzerland. This article is an open access article distributed under the terms and conditions of the Creative Commons Attribution (CC BY) license (https://creativecommons.org/licenses/by/4.0/).
Share and Cite
MDPI and ACS Style
Harmon, R.S. Laser-Induced Breakdown Spectroscopy in Mineral Exploration and Ore Processing. Minerals 2024, 14, 731. https://doi.org/10.3390/min14070731
AMA Style
Harmon RS. Laser-Induced Breakdown Spectroscopy in Mineral Exploration and Ore Processing. Minerals. 2024; 14(7):731. https://doi.org/10.3390/min14070731
Chicago/Turabian StyleHarmon, Russell S. 2024. "Laser-Induced Breakdown Spectroscopy in Mineral Exploration and Ore Processing" Minerals 14, no. 7: 731. https://doi.org/10.3390/min14070731
Note that from the first issue of 2016, this journal uses article numbers instead of page numbers. See further details here.