Article

Source Rock Assessment of the Permian to Jurassic Strata in the Northern Highlands, Northwestern Jordan: Insights from Organic Geochemistry and 1D Basin Modeling

1
Department of Geology, Faculty of Science, Assiut University, Assiut 71516, Egypt
2
Exploration Department, Egyptian Petroleum Research Institute, Nasr City 11727, Egypt
3
Chemical Engineering Department, Al-Huson University College, Al-Balqa’ Applied University, Al-Huson-Irbid 21510, Jordan
4
Prince El-Hassan Bin Talal Faculty of Natural Resources and Environment, Department of Earth and Environmental Sciences, The Hashemite University, Zarqa 13115, Jordan
5
Geology and Geophysics Department, College of Science, King Saud University, Riyadh 11451, Saudi Arabia
6
Core Laboratories, 6316 Windfern Road, Houston, TX 77040, USA
7
Instituto Oceanográfico da Universidade de São Paulo, Praça do Oceanográfico, 191, São Paulo 05508-120, Brazil
8
Geology Department, Faculty of Science, Menoufia University, Shebin El-Kom 32511, Egypt
*
Authors to whom correspondence should be addressed.
Minerals 2024, 14(9), 863; https://doi.org/10.3390/min14090863
Submission received: 22 July 2024 / Revised: 19 August 2024 / Accepted: 20 August 2024 / Published: 25 August 2024

Abstract

:
The present study focused on the Permian to Jurassic sequence in the Northern Highlands area, NW Jordan. The Permian to Jurassic sequence in this area is thick and deeply buried, consisting mainly of carbonate intercalated with clastic shale. This study integrated various datasets, including total organic carbon (TOC, wt%), Rock-Eval pyrolysis, visual kerogen examination, gross composition, lipid biomarkers, vitrinite reflectance (VRo%), and bottom-hole temperature measurements. The main aim was to investigate the source rock characteristics of these strata regarding organic richness, kerogen type, depositional setting, thermal maturity, and hydrocarbon generation timing. The Permian strata are poor to fair source rocks, primarily containing kerogen type (KT) III. They are immature in the AJ-1 well and over-mature in the NH-2 well. The Upper Triassic strata are poor source rocks in the NH-1 well and fair to marginally good source rocks in the NH-2 well, containing highly mature terrestrial KT III. These strata are immature to early mature in the AJ-1 well and at the peak oil window stage in the NH-2 well. The Jurassic strata are poor source rocks, dominated by KT III and KT II-III. They are immature to early mature in the AJ-1 well and have reached the oil window in the NH-2 well. Biomarker-related ratios indicate that the Upper Triassic oils and Jurassic samples are source rocks that received mainly terrestrial organic input accumulated in shallow marine environments under highly reducing conditions. These strata are composed mostly of clay-rich lithologies with evidence of deposition in hypersaline and/or stratified water columns. 1D basin models revealed that the Upper Triassic strata reached the peak oil window from the Early Cretaceous (~80 Ma) to the present day in the NH-1 well and from ~130 Ma (Early Cretaceous) to ~90 Ma (Late Cretaceous) in the NH-2 well, with the late stage of hydrocarbon generation continuing from ~90 Ma to the present time. The present-day transformation ratio equals 77% in the Upper Triassic source rocks, suggesting that these rocks have expelled substantial volumes of hydrocarbons in the NH-2 well. To achieve future successful hydrocarbon discoveries in NW Jordan, accurate seismic studies and further geochemical analyses are recommended to precisely define the migration pathways.

1. Introduction

Jordan occupies the northwestern part of the Arabian plate, neighboring many economically proven and successful petroleum systems in adjacent countries (e.g., Saudi Arabia and Iraq). However, only a few petroleum discoveries have been made in Jordan, such as Hamza oilfield (in the north-central part) and the Risha gas field (in the northeastern part) [1,2,3].
The petroleum potential of Jordanian basins has been investigated by several authors, such as [1,2,3,4,5,6,7]. However, only a limited number of studies have been published on the petroleum potential of NW Jordan. The present study aimed to scope the petroleum potential of the Northern Highlands area of NW Jordan (Figure 1). According to [8], the Upper Triassic argillaceous carbonate and shale intervals possibly acted as effective source rocks in NW Jordan. These argillaceous carbonates contained various interbeds of dolostones that were commonly deposited not only in Jordan but also elsewhere under anoxic marine depositional conditions (e.g., [9]). These Triassic dolostone strata widely acted as potential reservoir rocks for gas explorations (e.g., [10]).
Beydoun [1] defined the argillaceous Upper Triassic strata as having a small to moderate amount of organic matter characterized by oil-prone type II kerogen and gas-prone type III kerogen. Sadooni et al. [11] indicated that the Upper Triassic source rocks have fair to good organic matter content and reached the oil window in the Northern Highlands area (VRo = 0.65–0.90%). Sadooni et al. [11] demonstrated the reservoir potential of the dolomite and oolitic limestone intervals within the Upper Triassic section in the Northern Highlands area (NH-2 well) as having fair to good porosity and permeability (8%–20% and 0.01–80 md, respectively), especially in the upper part. The sealing characteristics of the anhydrite, argillaceous limestone and shale were also shown [11]. Furthermore, trap formation was acted upon by regional troughs and swelling structures intersected by normal and strike–slip faults [12]. Sadooni et al. [11] supposed an effective trapping style in the Upper Triassic section found up-dip and adjacent to lateral facies change and/or unconformity surfaces.
Although the Northern Highlands area in NW Jordan contains thick, deeply buried Jurassic, Triassic, and Permian strata, no commercially recoverable hydrocarbons have been identified. The present study preliminarily investigated the source rock characteristics in these strata by predicting the organic richness, organic matter quality, depositional environmental conditions, thermal maturity, and hydrocarbon generation time. To achieve this goal, several analytical and visual methods were integrated, including total organic carbon (TOC, wt%), Rock-Eval pyrolysis, visual kerogen analysis, vitrinite reflectance measurements, available biomarker data, and liquid chromatography. In addition, a 1D numerical basin modeling technique was applied to understand the burial history of the study area.
Hence, by integrating the available data and applying the 1D basin modeling technique, the present study characterized the Permian–Jurassic source intervals in the Northern Highlands area, NW Jordan, in terms of the following:
  • Detecting the source potential by means of determining organic matter quantity and generating potential;
  • Identifying the kerogen types and hence predicting types of hydrocarbon products;
  • Suggesting the paleo-depositional environment and redox conditions;
  • Bracketing the thermal maturity level;
  • Predicting the time at which hydrocarbons were generated from the deeply buried source rocks and assessing the likelihood of hydrocarbon generation.
Furthermore, the organically rich intervals were compared with similar effective source rocks in neighboring fields to gain a deeper understanding of the source rock potential. This study is significant, as it increases the scientific knowledge on the source rock systems in NW Jordan, which may encourage further hydrocarbon exploration in NW Jordan and other promising areas with geological similarities.

2. Geologic Setting

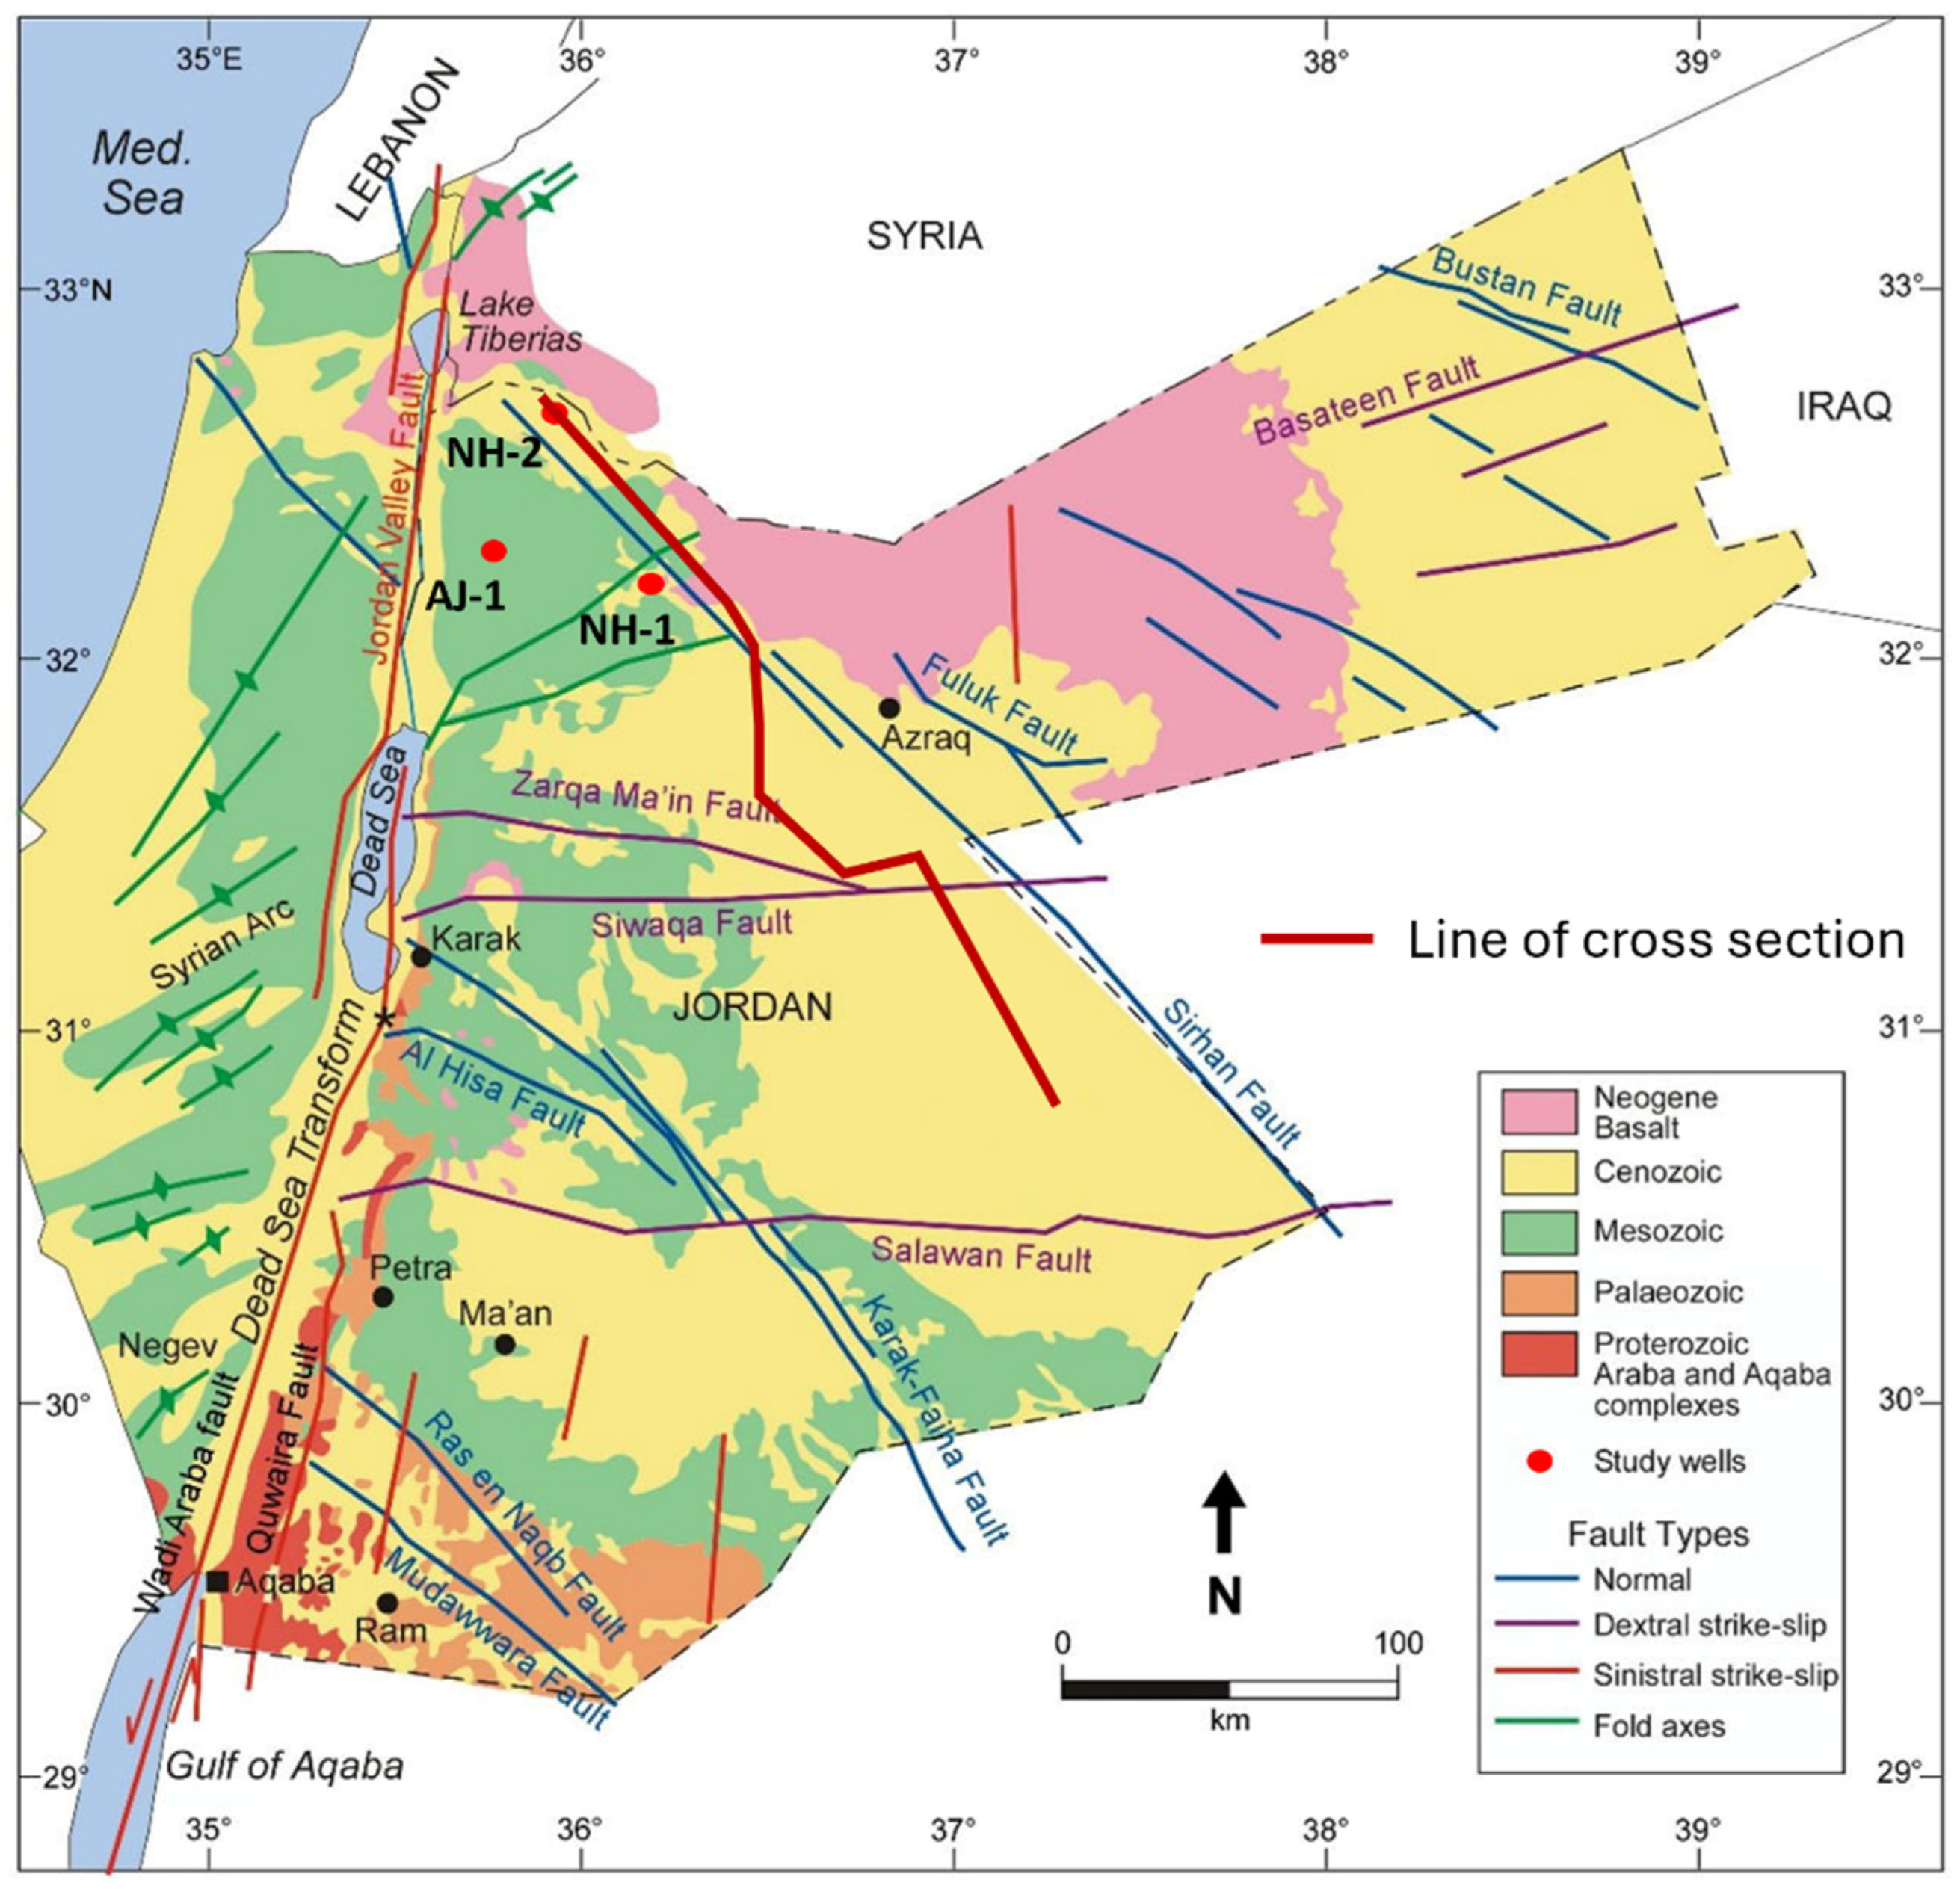
Jordan is located eastward of the Dead Sea Transform (DST), where the African and Arabian plates pull apart (Figure 1). The sedimentary sequence in Jordan has been influenced by major tectonic events since the Precambrian [13]. The Northern Highlands in NW Jordan cover an area of about 5645 Km2, situated between 35°45′–36°45′ E and 32°00′–32°45′ N (Figure 1). The area was investigated by drilling several wells where insignificant oil shows were obtained from only two deep wells, namely, NH-2 and SW-1, which contained Jurassic oil shows (20° API) and minor Triassic shows, respectively (Figure 1). In neighboring regions, such as NE and central Syria and NW Iraq, commercial quantities of hydrocarbons have been extracted from Triassic petroleum systems similar to those in NW Jordan [8,14,15]. The scarcity of hydrocarbon discoveries in Jordan has been attributed to the absence of sufficient structural traps [16]. During the Paleozoic, Jordan lay on the passive margin, with a gradual rifting event increased toward the northern parts, forming an open sea [17].
Figure 1. Geological map of Jordan highlighting the major controlling structural components and studided wells in the Northern Highlands area throughout NW Jordan (modified after [6,7,18]). Thick red line indicates the line of the cross section in Figure 2.
Minerals 14 00863 g001
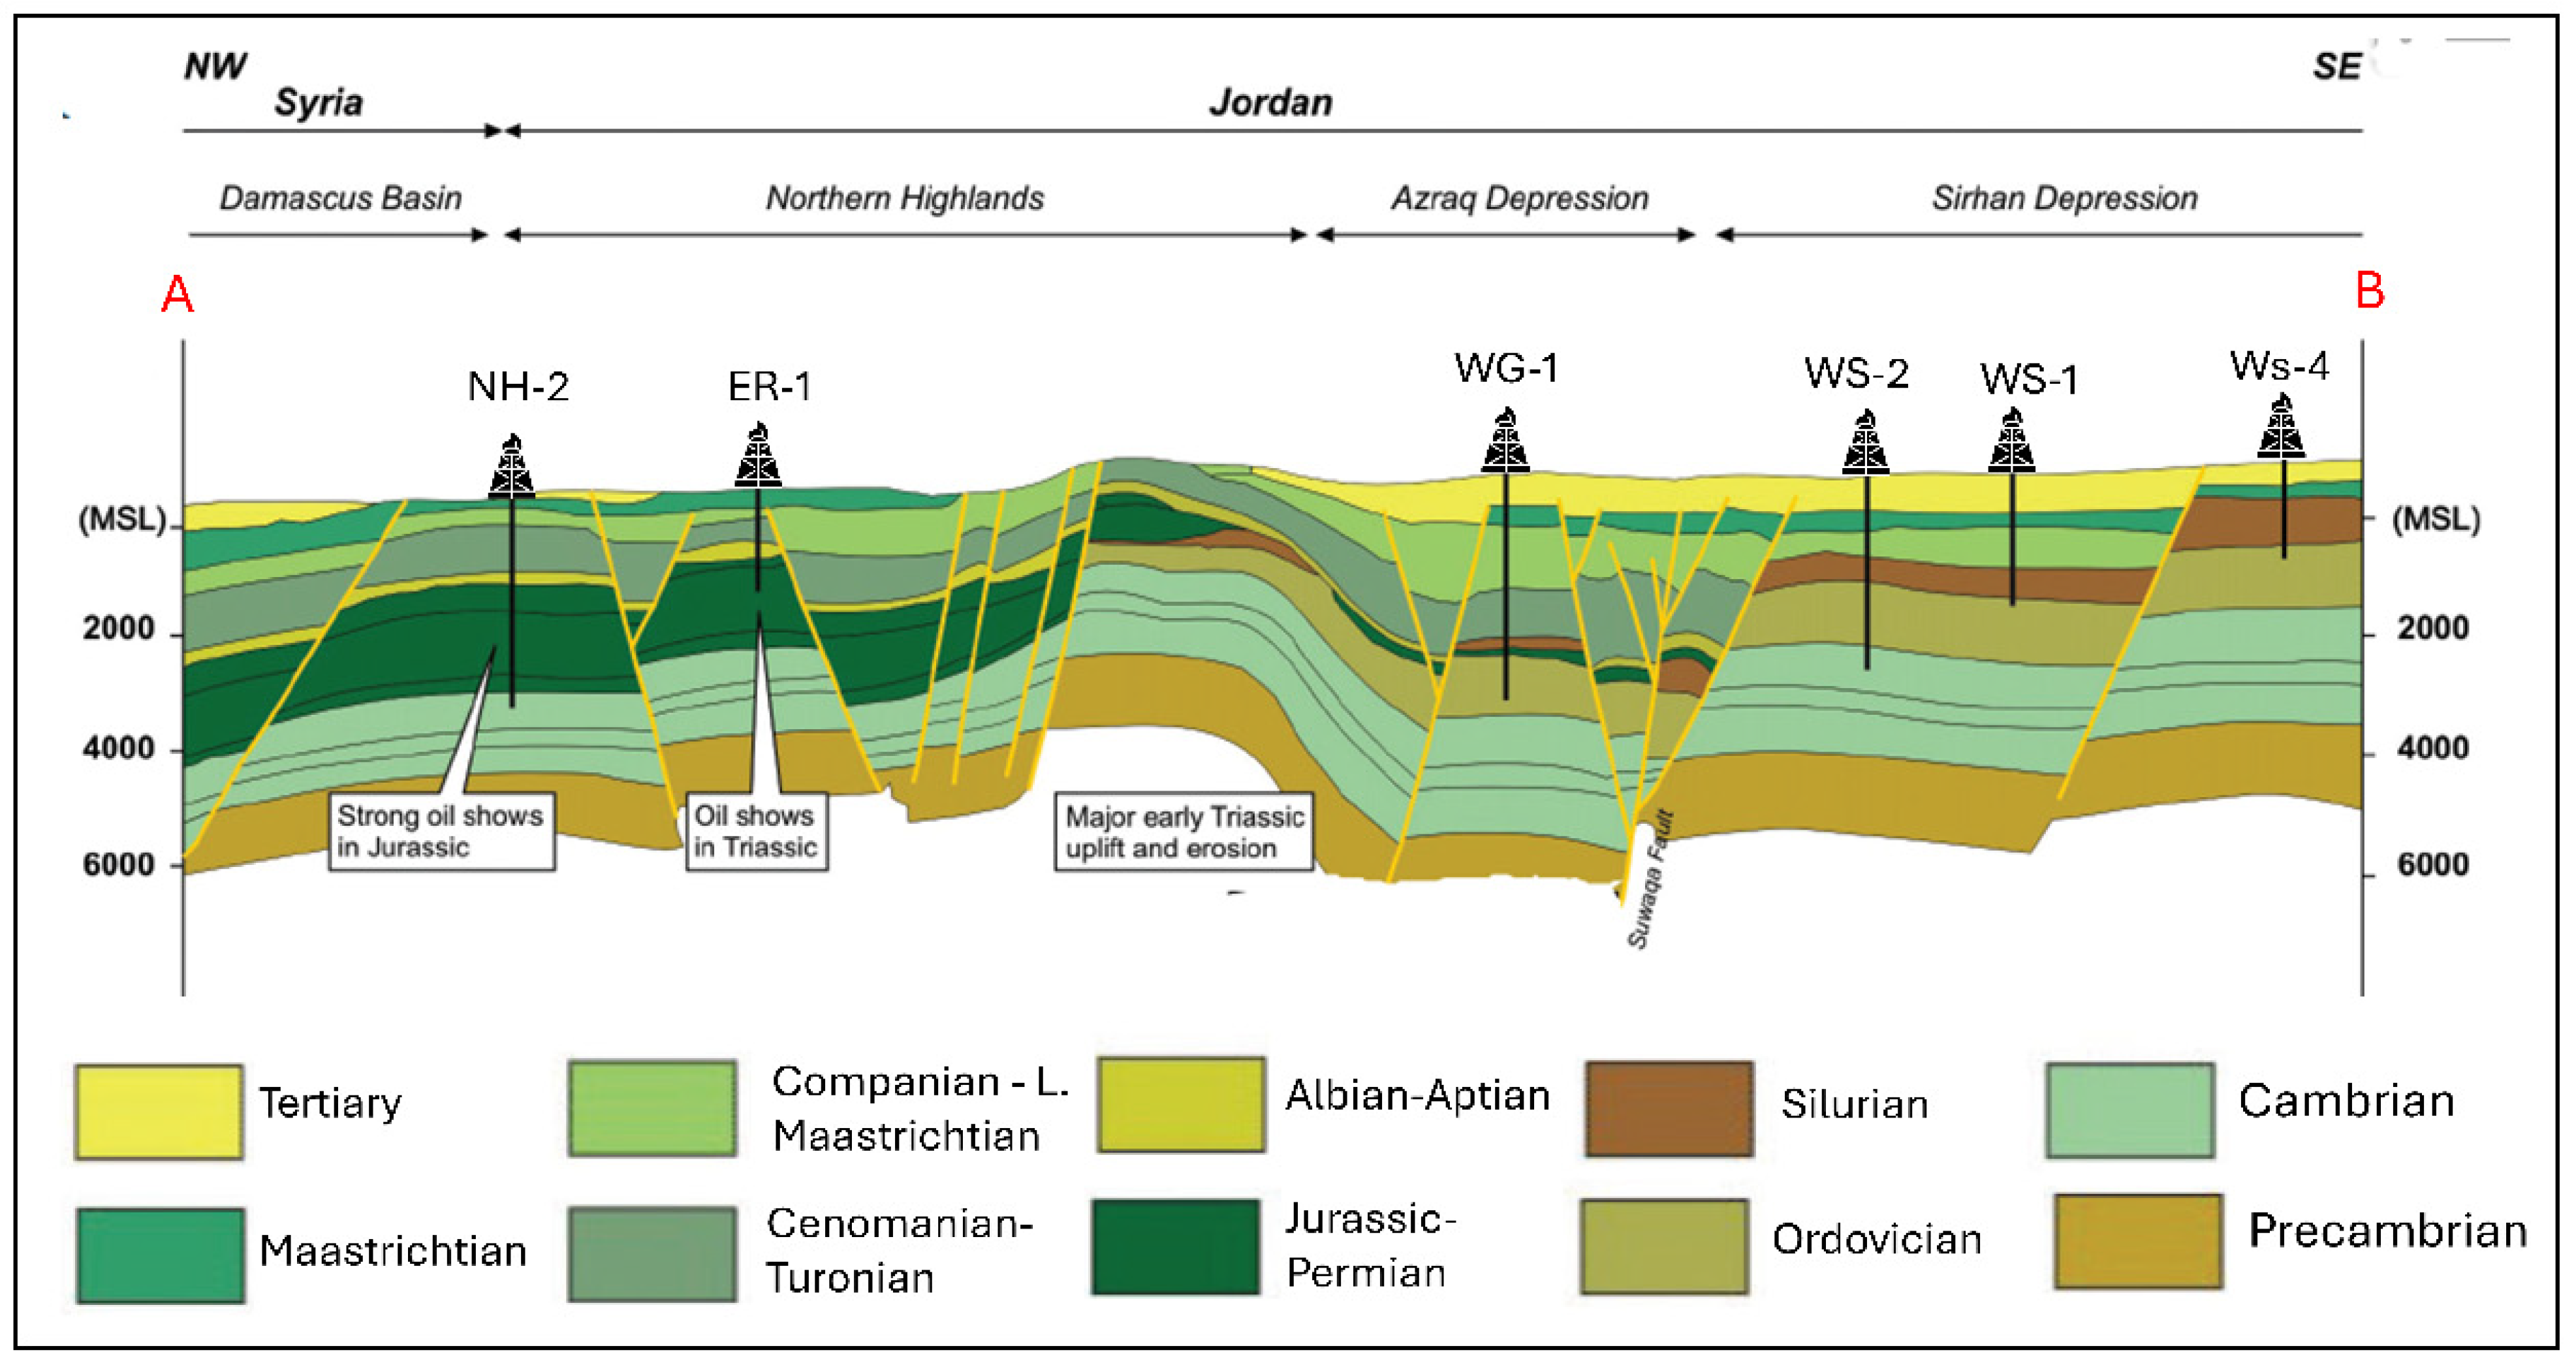
During the Middle Silurian–Early Cretaceous period, the southern parts of Jordan suffered intensive uplift coincident with the Hercynian orogeny, leading to extensive erosion and/or non-deposition [19,20,21]. The uplifting effect diminished northward, resulting in a relatively complete Permian to Jurassic section in northern Jordan [22] (Figure 2).
Powell and Mohamed [12] attributed that increase in thickness to the steplike extensional downfaults in northern parts of Jordan, possibly during the Late Jurassic (Figure 2). By the Mesozoic Era, the Gondwana break-up led to more basin development episodes in northern Jordan [8], where the main rifting phase occurred during the Late Triassic–Early Jurassic time [11]. Since the Late Cretaceous to Late Eocene period, folds of the widely named Syrian Arc system were formed because of a collision between the Eurasian and Afro-Arabian plates (Figure 1) [23,24,25]. In the Northern Highlands area, these fold belts are cut by major faults trending NW-SE and NE-SW, forming various structural series of horsts, grabens, and domes [26] (Figure 2).
Figure 2. Cross section (after [3]) showing the main structural elements that influenced the strata and controlled the trapping in the Northern Highlands area.
Minerals 14 00863 g002
The Permian, Triassic, and Jurassic sections are absent in southern and eastern Jordan, while they reached their maximum thickness in the Northern Highlands area of NW Jordan (2044 m in the NH-2 well; Figure 2). In the studied wells, the Permian strata, namely, the Hudayeib group (Um Irna Fm.), are composed of mixed clastic and carbonate lithologies deposited during the Kungarian–Kazanian time in depositional environments that ranged from marine shelf to continental depositional environment (Figure 3).
The greatest thickness of Permian strata is seen in the NH-2 well with some volcanics (317 m), while they are completely absent from the NH-1 well due to erosional effect. The Triassic subsurface section was named by Andrew [27] as the Ramtha group and was subdivided into five sequences [8]. The Upper Triassic Abu Ruweis Fm. is composed of intercalations of evaporites, limestone, shale, and dolomite deposited during the Carnian time (327 m thickness in the NH-2 well) under supratidal conditions (Figure 3). The cyclic alterations between the dominant carbonate and evaporites are widely known in the Late Triassic [28]. The evaporitic deposition is a part of the Upper Triassic basin shrinkage in the northern Arabian plate [11,29], which is also comparable in adjacent countries (e.g., the Kurra Chine Formation in Syria and Iraq [15]). The Middle Jurassic section, known as the Huni Formation, was deposited during the Bathonian-Early Callovian time as interbeds of limestone, dolomite, and anhydrite in marine, inner shelf and marginal environments (Figure 3). The Middle Jurassic sediments are completely absent from the NH-1 well, possibly due to tectonics, while they reach their highest thickness in the AJ-1 well (550 m). The Permian to Jurassic section is 1127 m, 3600 m, and 2580 m in wells NH-1, NH-2, and AJ-1, respectively.

3. Materials and Methods

Subsurface sampling of the Permian, Upper Triassic, and Jurassic strata from three wells in the Northern Highlands area (AJ-1, NH-1, and NH-2; Figure 1) was performed through a number of geochemical investigations. First, organic carbon was measured as TOC wt%, along with Rock-Eval pyrolysis assessment. Subsequently, optical observations were gathered for selective samples by performing visual kerogen and vitrinite reflectance (VRo%) measurements. Additionally, liquid chromatography, gas chromatography (GC), and gas chromatography–mass spectrometry (GC-MS) were applied. All these geochemical investigations were carried out by Paleoservices Ltd., Watford, UK.

3.1. TOC and Rock-Eval Pyrolysis

For the TOC% and Rock-Eval pyrolysis estimations, a total of 49 samples (47 cuttings and 2 cores) were collected from the AJ-1, NH-1, and NH-2 wells (Table 1). The samples were finely ground, sieved, digested with hydrochloric acid to remove mineral carbonate, and combusted in a Leco CR 12 carbon analyzer to determine the TOC content relative to calibrated standards. Some samples were selected for Rock-Eval pyrolysis screening using the Basic/Bulk-Rock method (Rock-Eval II). Briefly, about 60 mg of pulverized material was first thermally decomposed in a pyrolysis oven to obtain the weight % of pyrolyzable carbon (PC) and pyrolyzable mineral carbon. Hydrocarbons, CO2, and carbon monoxide (CO) were simultaneously detected via a flame ionization detector (FID, for hydrocarbons) and infrared cells (IR cells, for CO2 and CO). The temperature program for pyrolysis was 300 °C isothermal for three minutes, followed by a 25 °C/min ramping from 300 °C to 650 °C. Two significant parameters representing free (S1) and potential hydrocarbons (S2), respectively, were measured. Additionally, the temperature corresponding to the S2 peak maximum (Tmax) was recorded. Further assessed parameters were the hydrogen index (HI) and the production index (PI). All the obtained parameters (Table 1) were used for source rock evaluation following the guidelines of [30,31].

3.2. Visual Kerogen and Vitrinite Reflectance Assessment

A visual kerogen examination was applied to recognize the source and quality of organic matter in the studied sections. Thirty-seven (37) samples were treated with HF mineral acid, and the remaining kerogen particles were observed using transmitted light microscopy. Any spurious material that was detected (e.g., reworked and contaminated particles) was avoided (Table 2). Furthermore, the thermal alteration index (TAI) and vitrinite reflectance (VRo%) were defined to predict the thermal maturity of the source rocks. TAI values were determined after checking the coloring of selected reliable spore particles using a microscope.
The values were expressed on the TAI scale (Table 2). The VRo% was measured for 23 selective rock samples by embedding them in a block of epoxy resin and hardener (2:1 by volume) and polishing them using cloths and a combination of alumina powder (0.3 micron and 0.05 micron) and water. Vitrinite Ro analysis was conducted using a Zeiss reflected light microscope equipped with a UV light source for observing the fluorescence color of the oil-prone (liptinite) macerals.
The reflectance standard used for the measurements was a YAG (yttrium aluminum garnet) with an Ro of 0.90%, and the oil-immersion objective had a magnification of 50×. For additional information on sample preparation, the reader is referred to [32], and for information on the reflectance procedure and dispersed organic matter analysis, to [32,33].

3.3. Gross Composition, Gas Chromatography (GC), and Gas Chromatography–Mass Spectrometry (GC-MS)

The soluble extracts were obtained from six selected rock samples after treatment with dichloromethane (CH2Cl) and methanol (CH3OH) solvents in a Soxhlet extractor. The total soluble extracts and three Upper Triassic oil samples were fractioned by gradational elution, utilizing solvents like n-hexane, toluene, and toluene/methanol. Finally, the hydrocarbon fractions and NSO compounds were separated into activated silica. The gross composition of the studied samples is listed in Table 3.
Afterwards, these nine samples were subjected to gas chromatography (GC) analysis, while only three Upper Triassic oils underwent gas chromatography–mass spectrometry (GC-MS) analysis. Quartz capillary GC was applied using a Carlo Erba 2150 GC in conjunction with a Grob-type splitless injector system. Also, a Hewlett Packard 5890 capillary gas chromatograph was utilized to separate the C15+ extracts. After emerging from the capillary column, the mass spectrometer, namely, a V. G. TS250 double-focusing spectrometer, with the V. G. 11250 data system, was utilized for screening of the molecularly related biomarkers.
Consequently, quantitative identification of the biomarkers was reached easily. Table 3 exhibits the GC result data of the nine samples, including n-alkanes and isoprenoids relative ratios. In addition, the GC-MS result ratios (steranes and triterpanes) and their peak identifications in the three Upper Triassic oils are displayed in Table 4 and Table 5, respectively.

3.4. Basin Modeling Technique

Basin modeling was applied on two selected wells: NH-1 and NH-2 in the Northern Highlands area. The main goal in constructing the 1D basin models was to delineate specific periods of uplift and subsidence activities that controlled the basin configuration. Thermal modeling was applied using numerical coding based on the “Easy Ro” model proposed by Sweeney and Burnham [34]. Simulating the burial and thermal histories of the studied wells guided the anticipated thermal maturation of the Upper Triassic source rocks and predicted the time at which hydrocarbons were generated.
To construct the models, the Genesis PC software (version 5.7) from ZetaWare Inc. was used. More precise thermal models were achieved after calibration with the measured VRo% and bottom-hole temperature (BHT) data (Table 6) to achieve the best adjustment and validation. The required data encompassed the various rock units defined by their lithologies, thicknesses, and ages, in addition to the timing of erosion and non-deposition. The input data to the Genesis software are shown in Table 7.
The model used in this study to extrapolate from laboratory to geological conditions and to calibrate basin and petroleum systems was the Easy %Ro one [34]. The model is based on the relationship between vitrinite optical properties and temperature and time. The Easy %Ro model uses first-order Arrhenius-type kinetics with a distribution of activation energies and a single frequency factor.
The heat flow model was simply conceptualized using maximums for temperature, depth, and time, particularly 69.3 mW/m2 and 71.6 mW/m2 in the NH-1 and NH-2 wells, respectively. A high concordance was observed between the measured thermal parameters and the computed ones. To simulate hydrocarbon generation throughout geological history, additional geochemical data were incorporated, including organic carbon content, hydrogen index, and kerogen type. In this study, 3.0 wt% total organic carbon (TOC), 200 mg hydrocarbons per gram of TOC (HI), and kerogen type III were utilized as average values for the Upper Triassic source rock. Moreover, estimation of transformation ratios (TRs) was conducted to quantify the hydrocarbon generation. The hydrocarbon generation modeling incorporated the algorithms proposed by [34] and the organofacies types D/E from the kerogen kinetics classes defined by [35].

4. Results

4.1. TOC and Rock-Eval Pyrolysis

Table 1 summarizes the TOC and Rock-Eval pyrolysis results of the Permian to Jurassic rock samples taken from the Northern Highlands wells (AJ-1, NH-1, and NH-2). All the obtained parameters in Table 1 were used for source rock evaluation following the guidelines of [30,31]. The Permian samples had TOC content in the range of 0.03–1.2 wt%; specifically, four samples exhibited <0.5 wt% TOC, while five samples had a TOC range of 0.5–1.2 wt% (Table 1). In addition, low hydrocarbon potential (S2) values were observed (0.1–0.55 mg HC/g rock; Table 1). The Upper Triassic samples had a TOC range of 0.08–1.1 wt%, including nine samples with a TOC of <0.5 wt%, and twelve samples had a TOC of 0.55–1.1 wt% (Table 1). Samples from the Upper Triassic had S2 values that ranged from 0.1 to 1.8 mg HC/g rock. Most Upper Triassic samples (7) had S2 values greater than 1, while only three samples had values < 1 (0.1, 0.4, and 0.9 mg HC/g rock) (Table 1). The Jurassic samples had low TOC and S2 values, with averages of 0.37 wt% and 1.2 mg HC/g rock, respectively (Table 1). Nevertheless, in most of the studied samples, it was noticed that the mudstone and shale lithofacies possessed higher TOC% values than the carbonate samples (Table 1). In this study, S1 values were low (up to 1.9 mg HC/g TOC; Table 1). The production index (PI) values were variable (Table 1). In the Permian samples, the PI values were 0.17 (AJ-1 well) and 0.33 (NH-2 well), whereas the Upper Triassic samples had PI values in the range of 0.33–0.53 in the NH-2 well (Table 1). On the other hand, lower PI values were observed in the Jurassic samples. In the AJ-1 well, PI values ranged from 0.07 to 0.17 (Table 1). In the NH-2 well, higher PI values were obtained, namely, 0.17–0.26, and only one sample had a PI of 0.03 (Table 1).
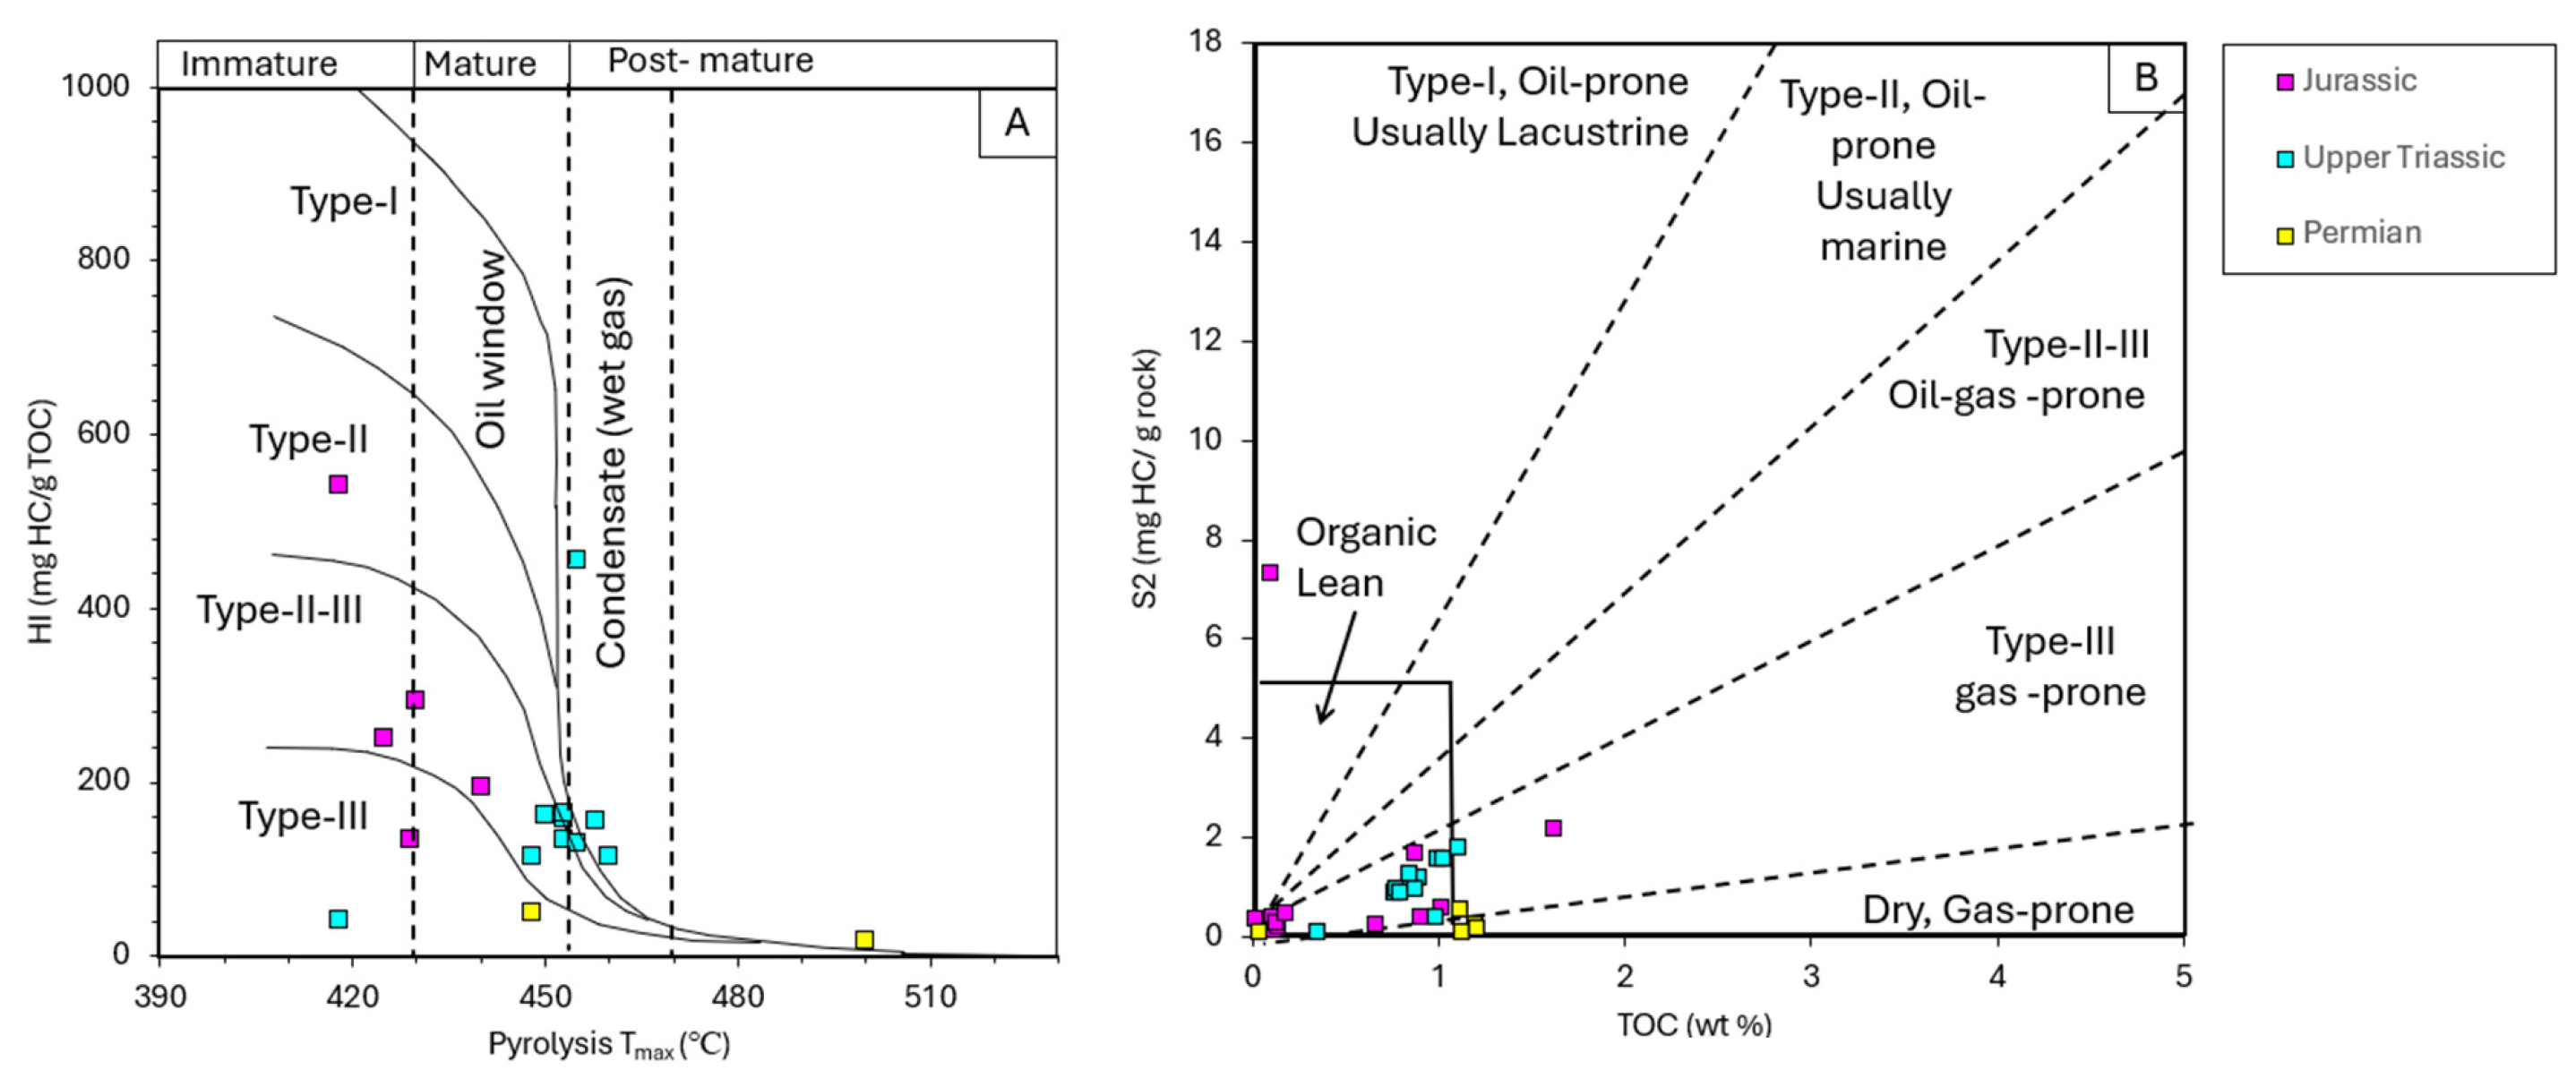
The hydrogen index (HI) of the source rock can be used with other parameters to define the type of organic matter (e.g., [36,37,38]). The HI concentrations in three Permian samples were 17, 21, and 50 mg HC/g TOC (Table 1). On the other hand, relatively higher HI values were obtained for the majority of the Upper Triassic samples (n = 8, HI: 114–164 mg HC/gTOC; Table 1). Additionally, three Upper Triassic samples had either a high HI value (455 mg HC/g TOC) or very low HI values (29 and 41 mg HC/g TOC) (Table 1). The Jurassic samples had a HI concentration of 135–294 mg HC/g TOC, with the exception of a sample collected from NH-2 (1638.15 m), which had a HI content of 543 mg HC/g TOC (Table 1).
The pyrolysis Tmax measurements varied in the studied intervals (Table 1). In the Permian samples, the Tmax values were 378 °C and 500 °C in the AJ-1 and NH-2 wells, respectively (Table 1), but the 378 °C value is unreliable. The Upper Triassic samples had Tmax values in the range of 448 °C–460 °C in the NH-2 well (except for a low Tmax value of 418 °C; Table 1). Lower Tmax values were measured in the Jurassic samples. In the AJ-1 well, most samples (8) had Tmax values ranging from 412 °C to 421 °C, and only two samples had lower values (Tmax: 304 °C and 309 °C), which were unreliable. In the NH-2 well, higher Tmax and PI values were obtained, namely, 418 °C–440 °C (Table 1).

4.2. Maceral Types

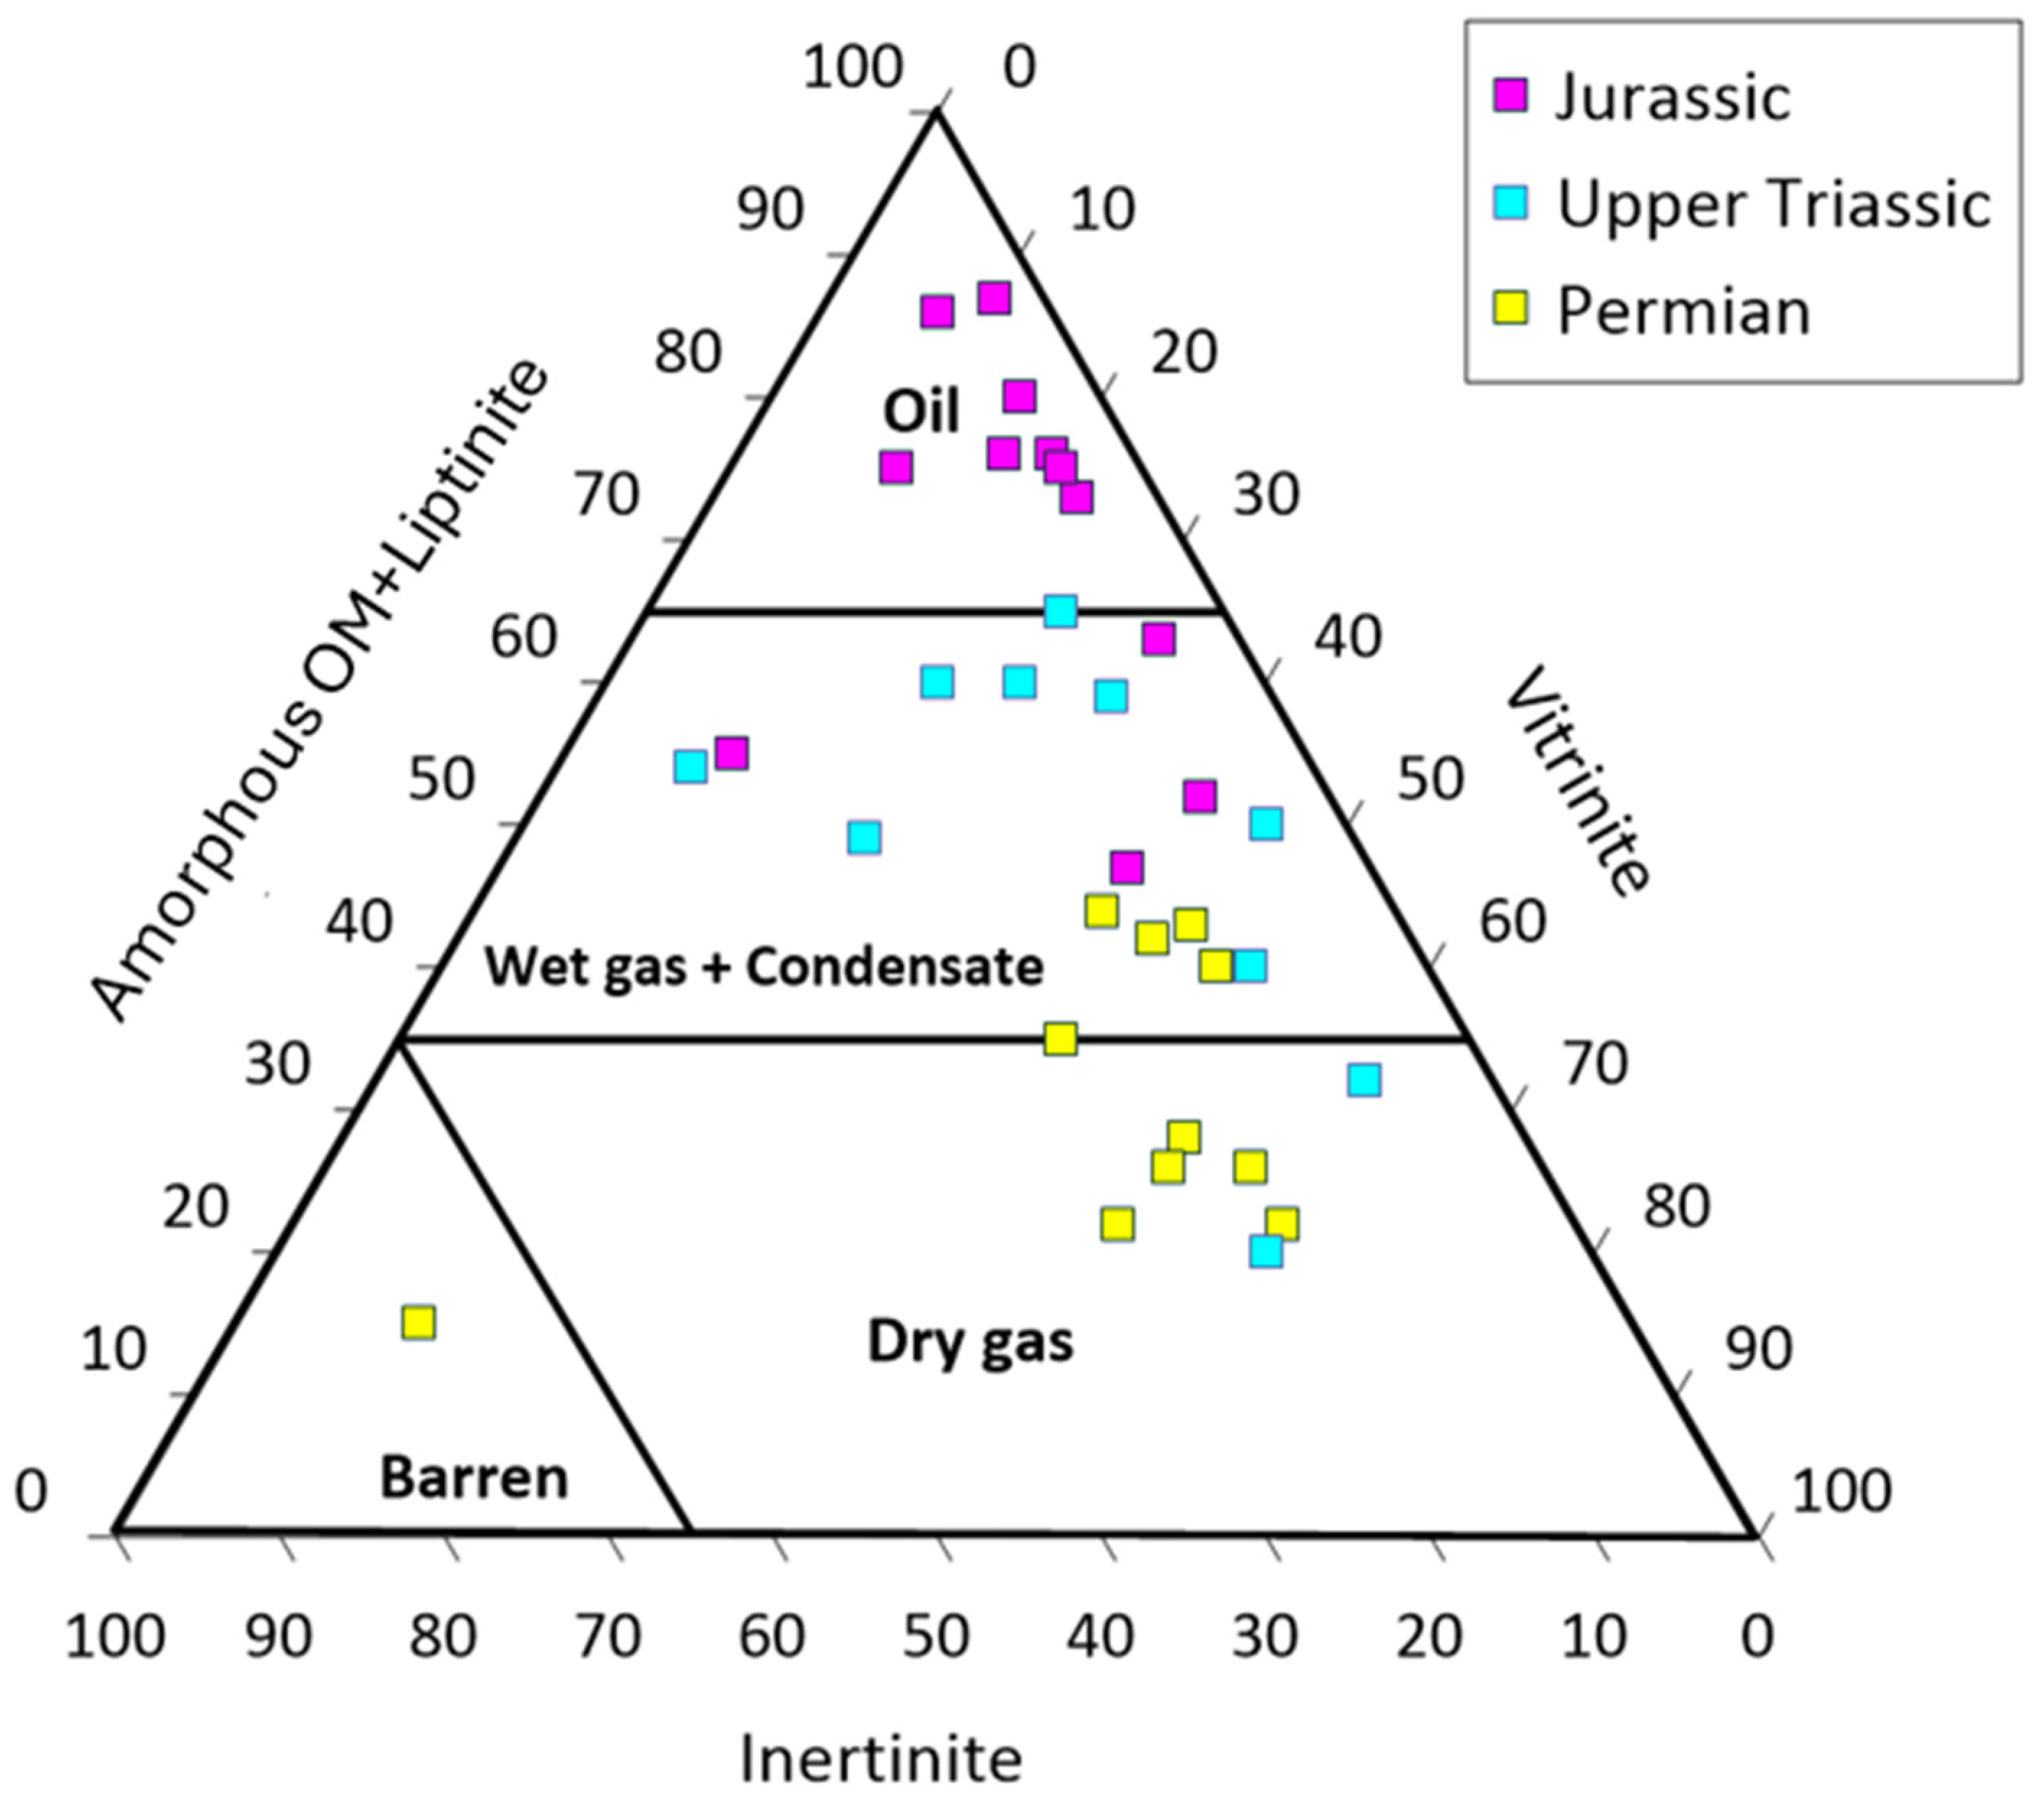
The correct identification of kerogen particles was used to define the organic matter type and to determine the generated hydrocarbon types [39,40,41,42]. Table 2 displays the results of the visual kerogen analysis for the samples from three wells in the Northern Highlands area: AJ-1, NH-1, and NH-2. Based on the maceral assemblages, the Permian samples from the AJ-1 well contained a major amount of vitrinite particles (38%–60%) and a lesser amount of liptinite (12%–30%), inertinite (13%–28%), and amorphous organic matter (AOM, 5%–22%) (Table 2). In contrast, a single Permian sample from the NH-2 well had an inertinite content (74%) higher than those of the other kerogen components (liptinite: 15% and vitrinite: 11%) (Table 2). Furthermore, the dominance of vitrinite was also observed in most Upper Triassic samples (47% being the average value), reaching its highest concentration of 94% in the NH-2 well. The other ratios were 22% for AOM and exinite particles and 17% for inertinite particles (Table 2). Inertinite particles had the lowest value in the NH-2 well (5%) and the highest value in the AJ-1 well (38%) (Table 2). In the Jurassic samples, AOM was predominant (17%–65%), followed by lower amounts of liptinite, vitrinite, and inertinite, in the ranges of 20%–45%, 7%–40%, and 3%–35%, respectively (Table 2).
The thermal alteration index (TAI), defined by spore coloration, is a common thermal maturity technique based on optical observations [43,44]. The TAI values varied considerably in the studied wells. In the Permian samples, TAI in the AJ-1 well varied from 2+ to 3, while in the NH-2 well, higher TAI values were obtained, ranging between 5 and 6 (Table 2). The same was true for the Upper Triassic samples, where TAI values ranged from 3− to 2+ in the AJ-1 well to 4 in the NH-1 well and from 4 to 5 in the NH-2 well (Table 2). The variation in TAI values in the Jurassic samples ranged from 2− in the AJ-1 well to 4 in the NH-2 well (Table 2).

4.3. Gross Chemical Composition

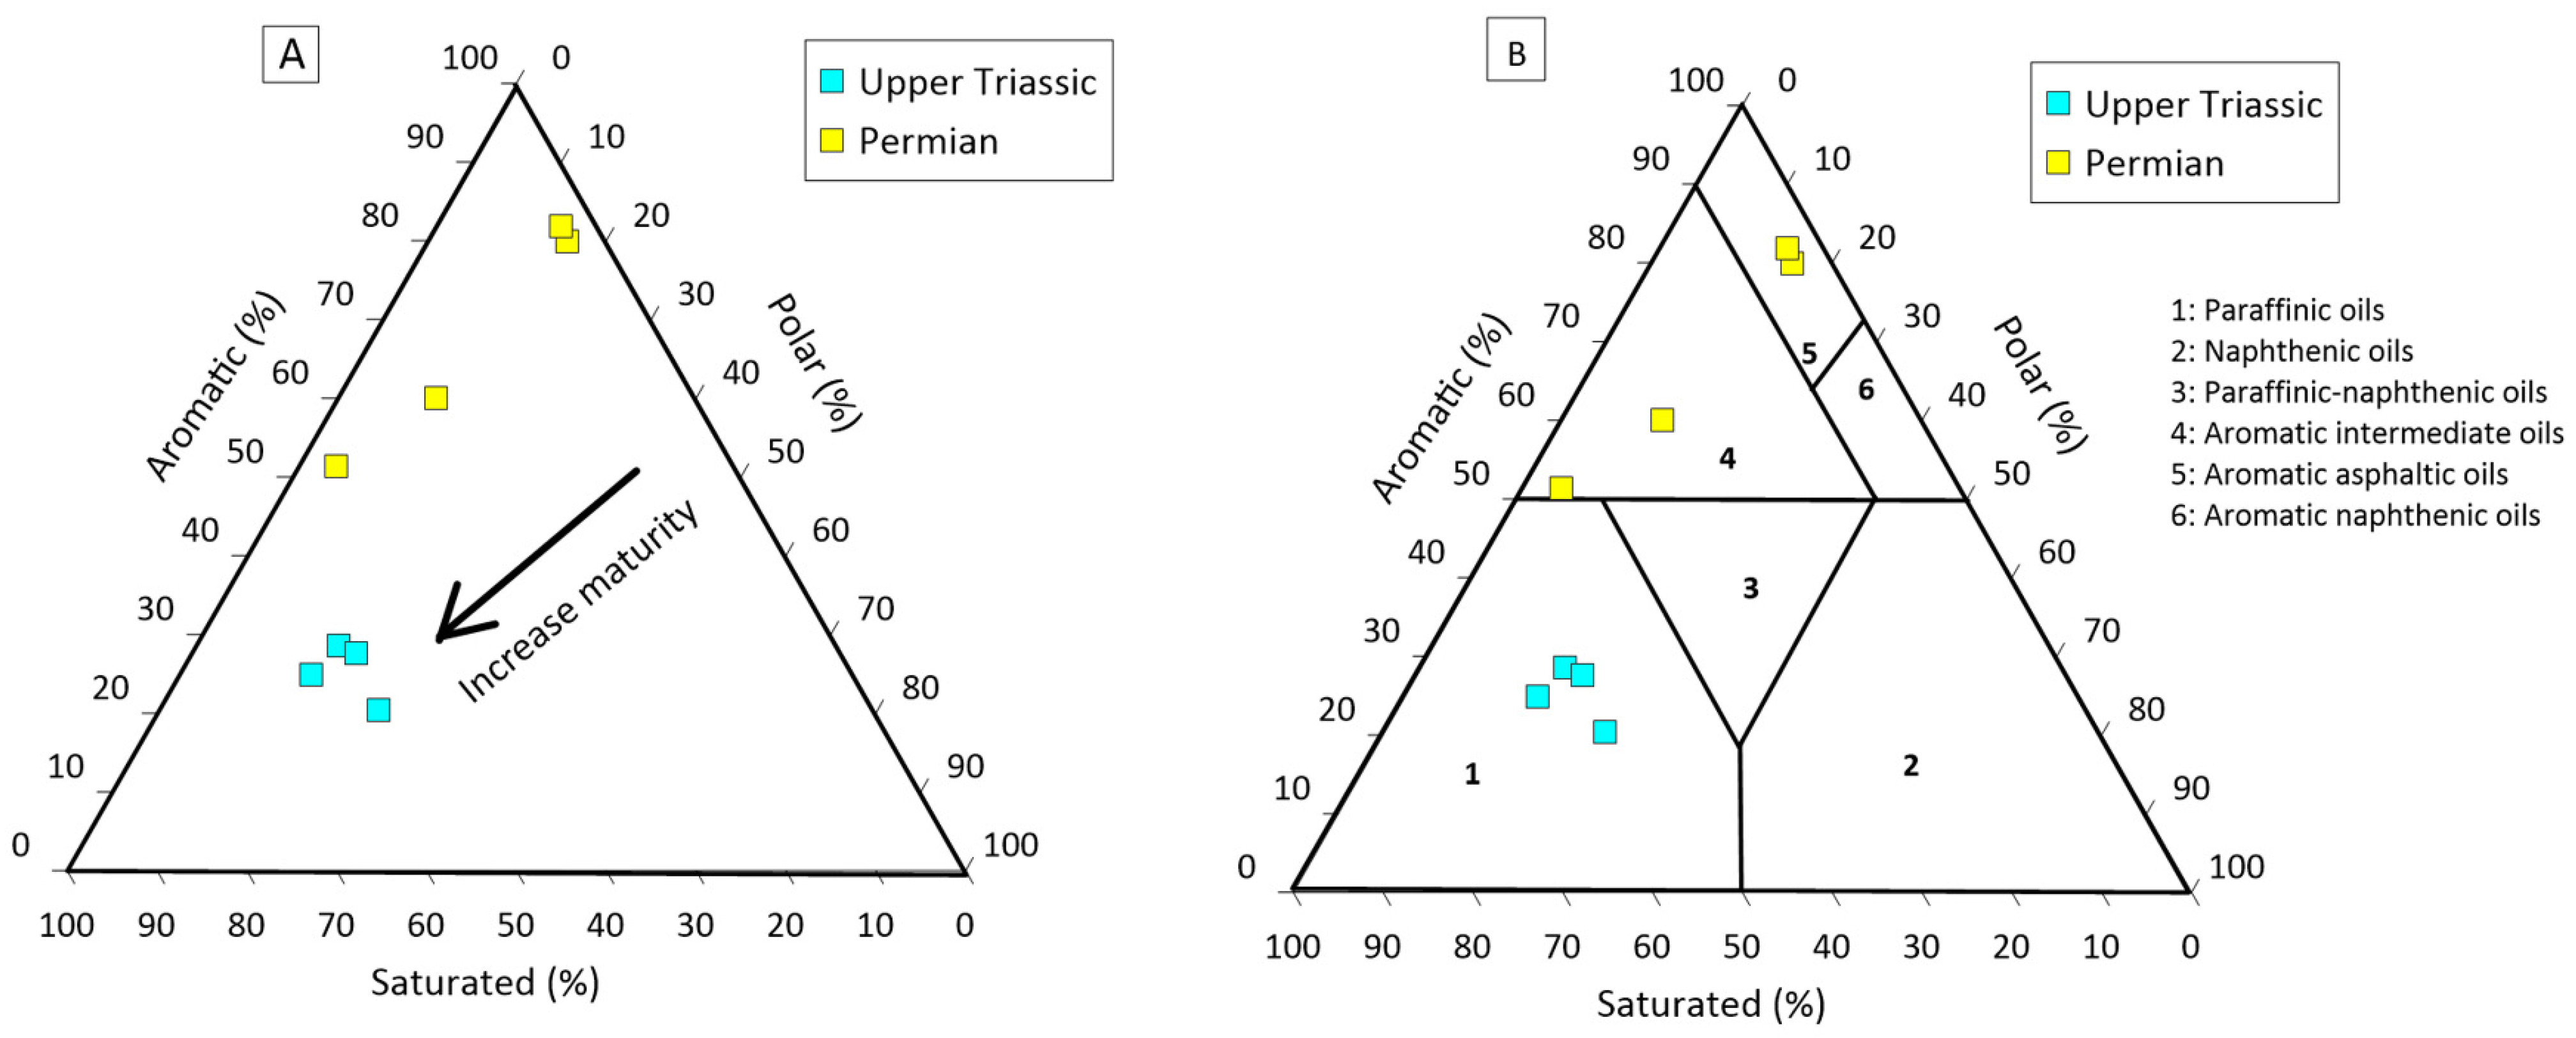
The gross composition of the Permian and Triassic samples was defined by examining the relative ratios of saturates, aromatics, and polar compounds (resins and asphaltenes). These relative proportions are outlined in Table 3. The Permian data (Table 3) reveal the predominance of aromatics, which constituted 51.4%–81.88%, followed by saturates (4.12%–44.39%) and polar fractions (4.21%–15.69%). On the other hand, the Upper Triassic samples showed major amounts of saturated hydrocarbons (46.5%–60%), while the other hydrocarbon components, such as aromatics and polar, were minorly represented, with values of 20.4%–34.9% and 15.10%–24.50%, respectively (Table 3).

4.4. Molecular and Biomarkers Characteristics

The extracted oil characteristics were defined using the distribution of n-alkanes and isoprenoids, combined with triterpanes and steranes biomarker components, in the m/z 191, m/z 217, and m/z 218 fragmentograms obtained via GC-MS and their derived ratios (Table 3 and Table 4). The GC of the studied oil and extract samples showed a unimodal distribution of n-alkanes (Figure 4A), where the moderately chained compounds of n-alkanes were prevalent alongside a significant quantity of waxy alkanes (>n-C22).
Using the distributions of n-alkanes, carbon preference indices (CPIs) were calculated using Bray and Evans equation [45] to determine the source rocks’ thermal maturity. A single Permian sample from a depth of 2422.5 m had a low CPI value (0.65), while three others had higher CPI values in the range of 1.18–1.56 (Table 3). The Upper Triassic samples had CPI values around 1 (0.99–1.11; Table 3).
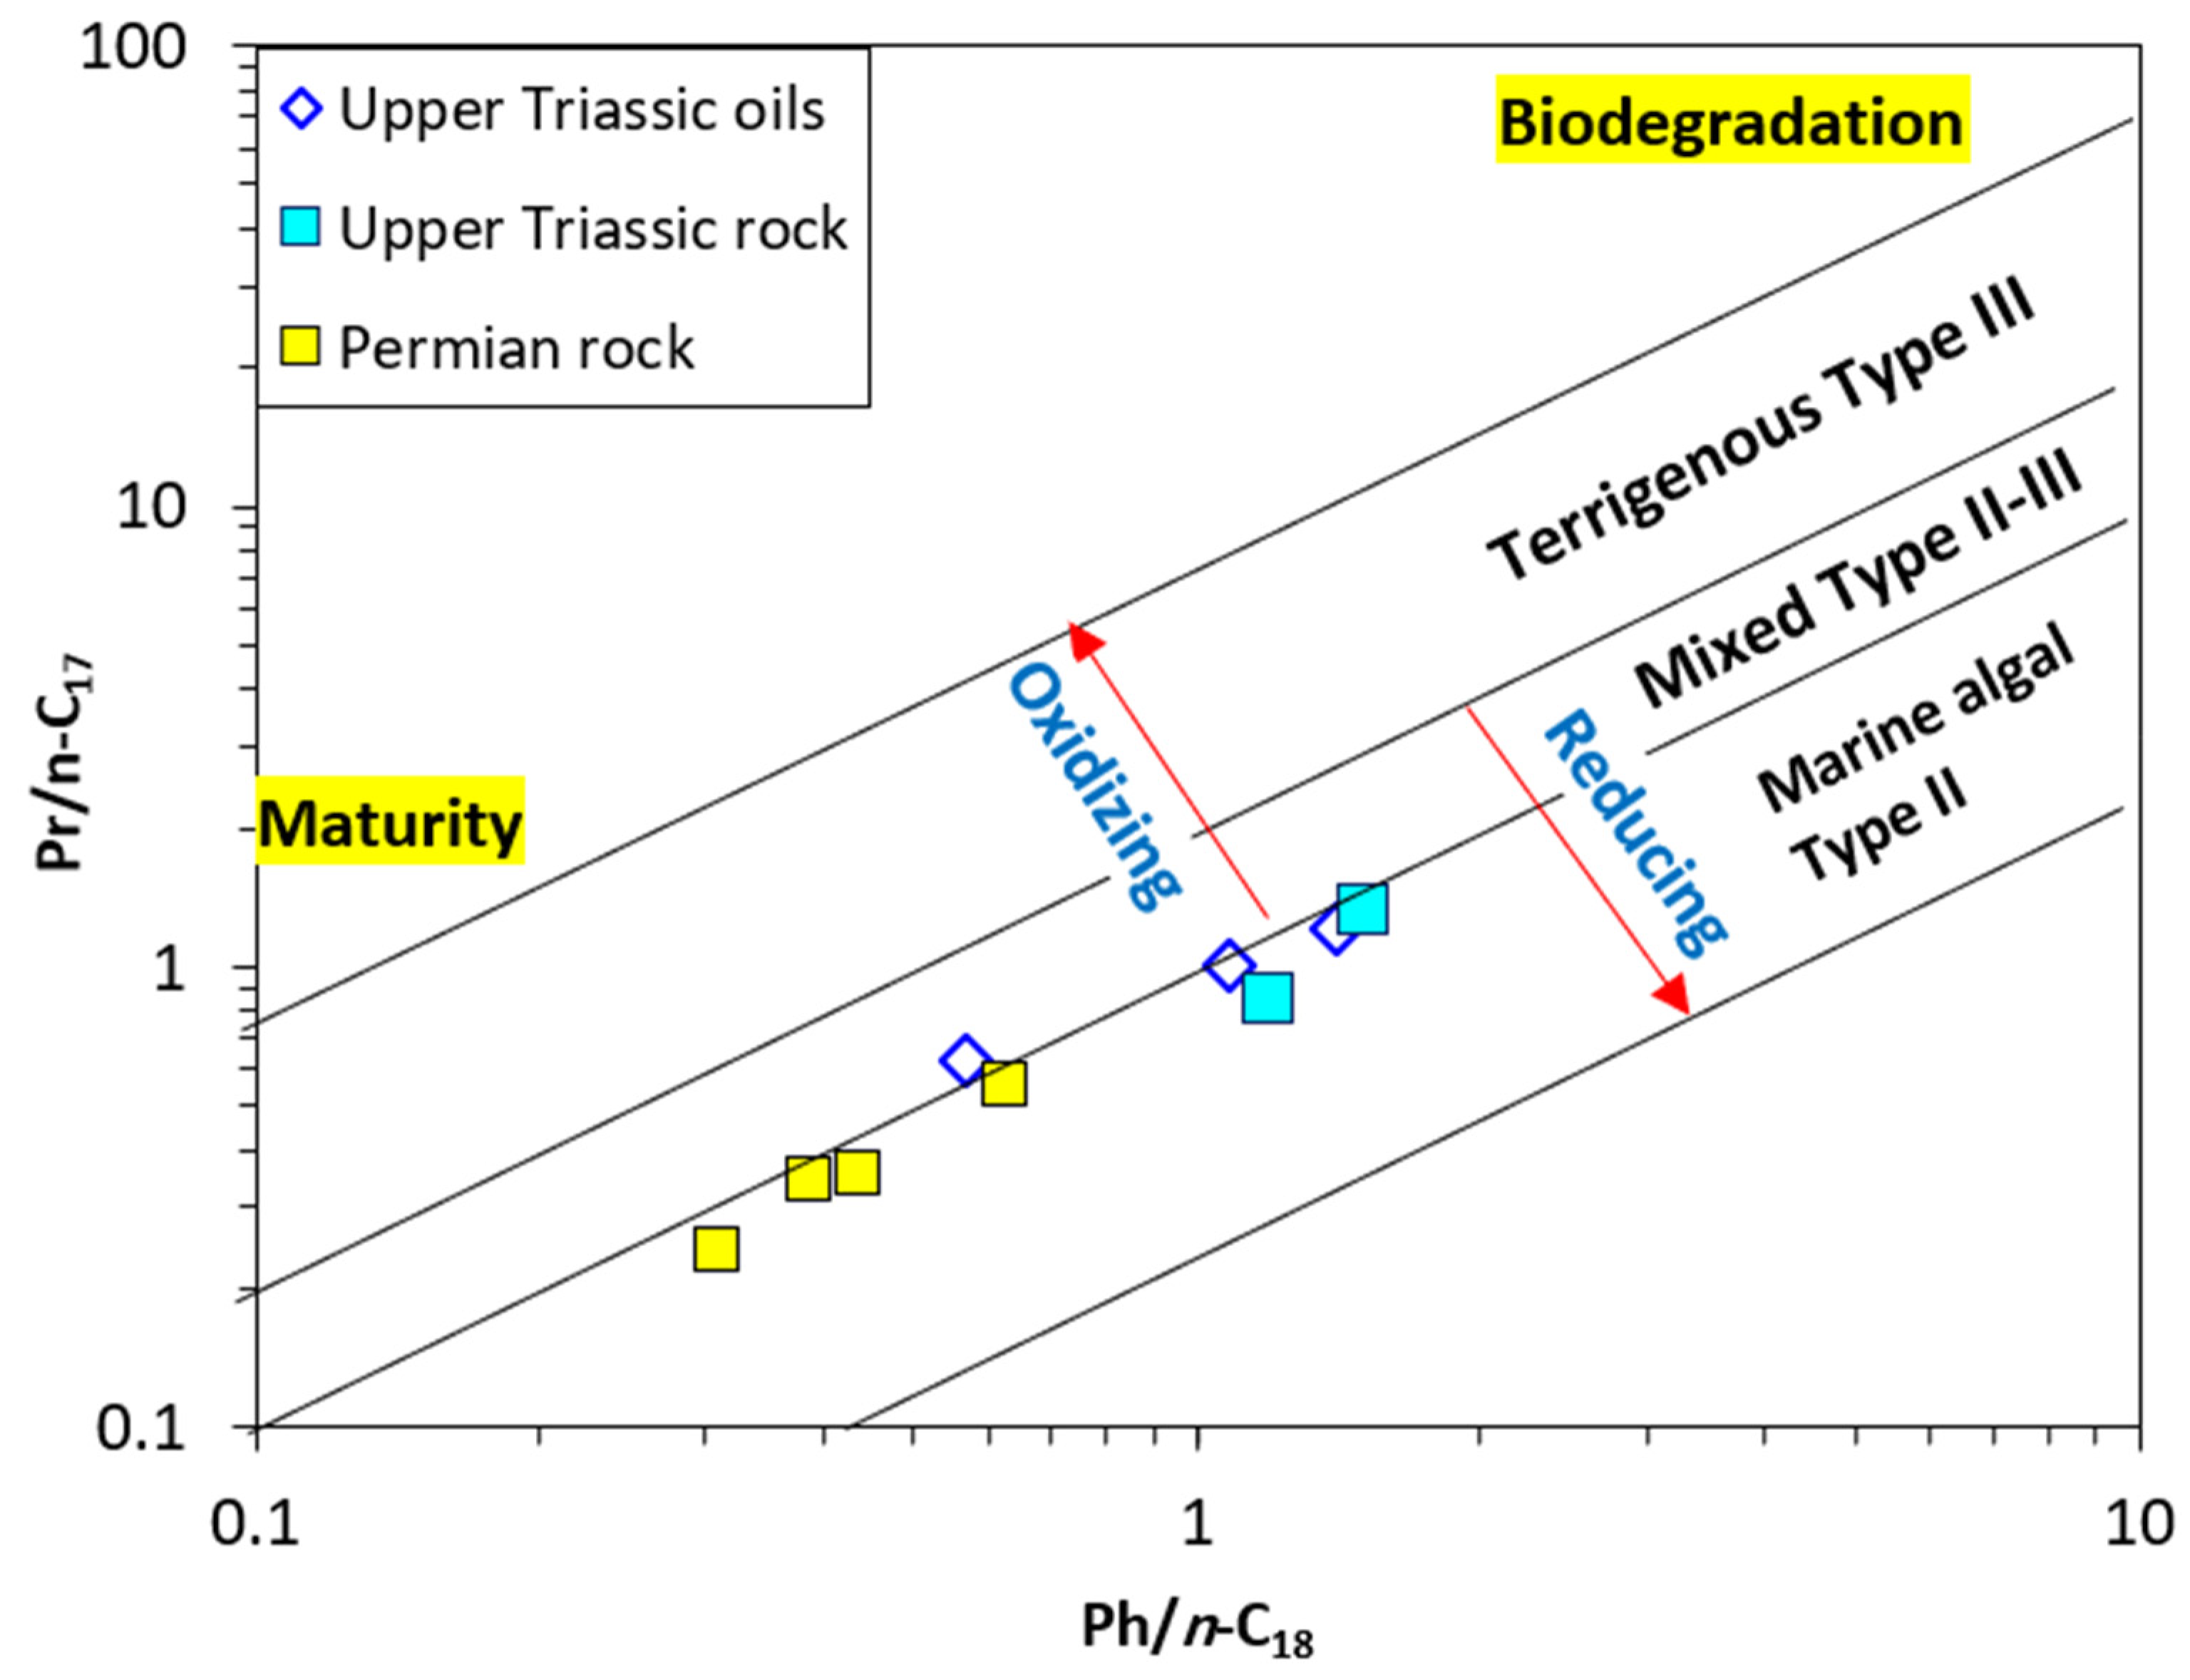
The acyclic isoprenoids pristane (Pr) and phytane (Ph) are significant (Figure 4A). In most of the analyzed samples, Ph was more common than Pr, represented by low Pr/Ph ratios of 0.58–0.8 and 0.91–1.20 for the studied Permian and Upper Triassic sections, respectively (Table 3). The only exception was the high Pr/Ph ratio of 3 obtained for an Upper Triassic cutting sample at 2161.5 m (Table 3). Moreover, isoprenoid concentrations relative to n-alkanes, such as Pr/n-C17 and Ph/n-C18, were also diagnostic. In the Permian samples, Pr/n-C17 and Ph/n-C18 values were in the range of 0.24–0.55 and 0.31–0.63, respectively, while higher ratios were obtained for the Upper Triassic samples (0.63–1.32 for Pr/n-C17 and 0.57–1.51 for Ph/n-C18) (Table 3).
Sterane- and hopane-related biomarkers in the Upper Triassic samples are displayed in m/z 191, 217, and 218 fragmentograms (Figure 4B–D), in addition to their relative ratios (Table 4) and peak identifications (Table 5). The m/z 191 fragmentogram in Figure 4B shows several hopanes with a major quantity of C30-hopanes. Additionally, the other defined hopanes comprised 17 α(H)-trisnorhopane (Tm) and 18 α(H)-trisnorneohopane (Ts), C29-norhopane, gammacerane, and (C31 to C34) homohopanes. It is noteworthy that C30 hopane (H) was dominant over C29 norhopane (NH), resulting in low NH/H ratios ranging between 0.32 and 0.52 (Table 4). Furthermore, the maturity parameters of 22S/(22S + 22R) homohopane and Ts/Tm ratios were computed. The 22S/(22S + 22R) homohopane ratios were calculated to be 0.57–0.59, and the Ts/Tm ratios were high, in the range of 2.4 to 4.5 (Table 4).
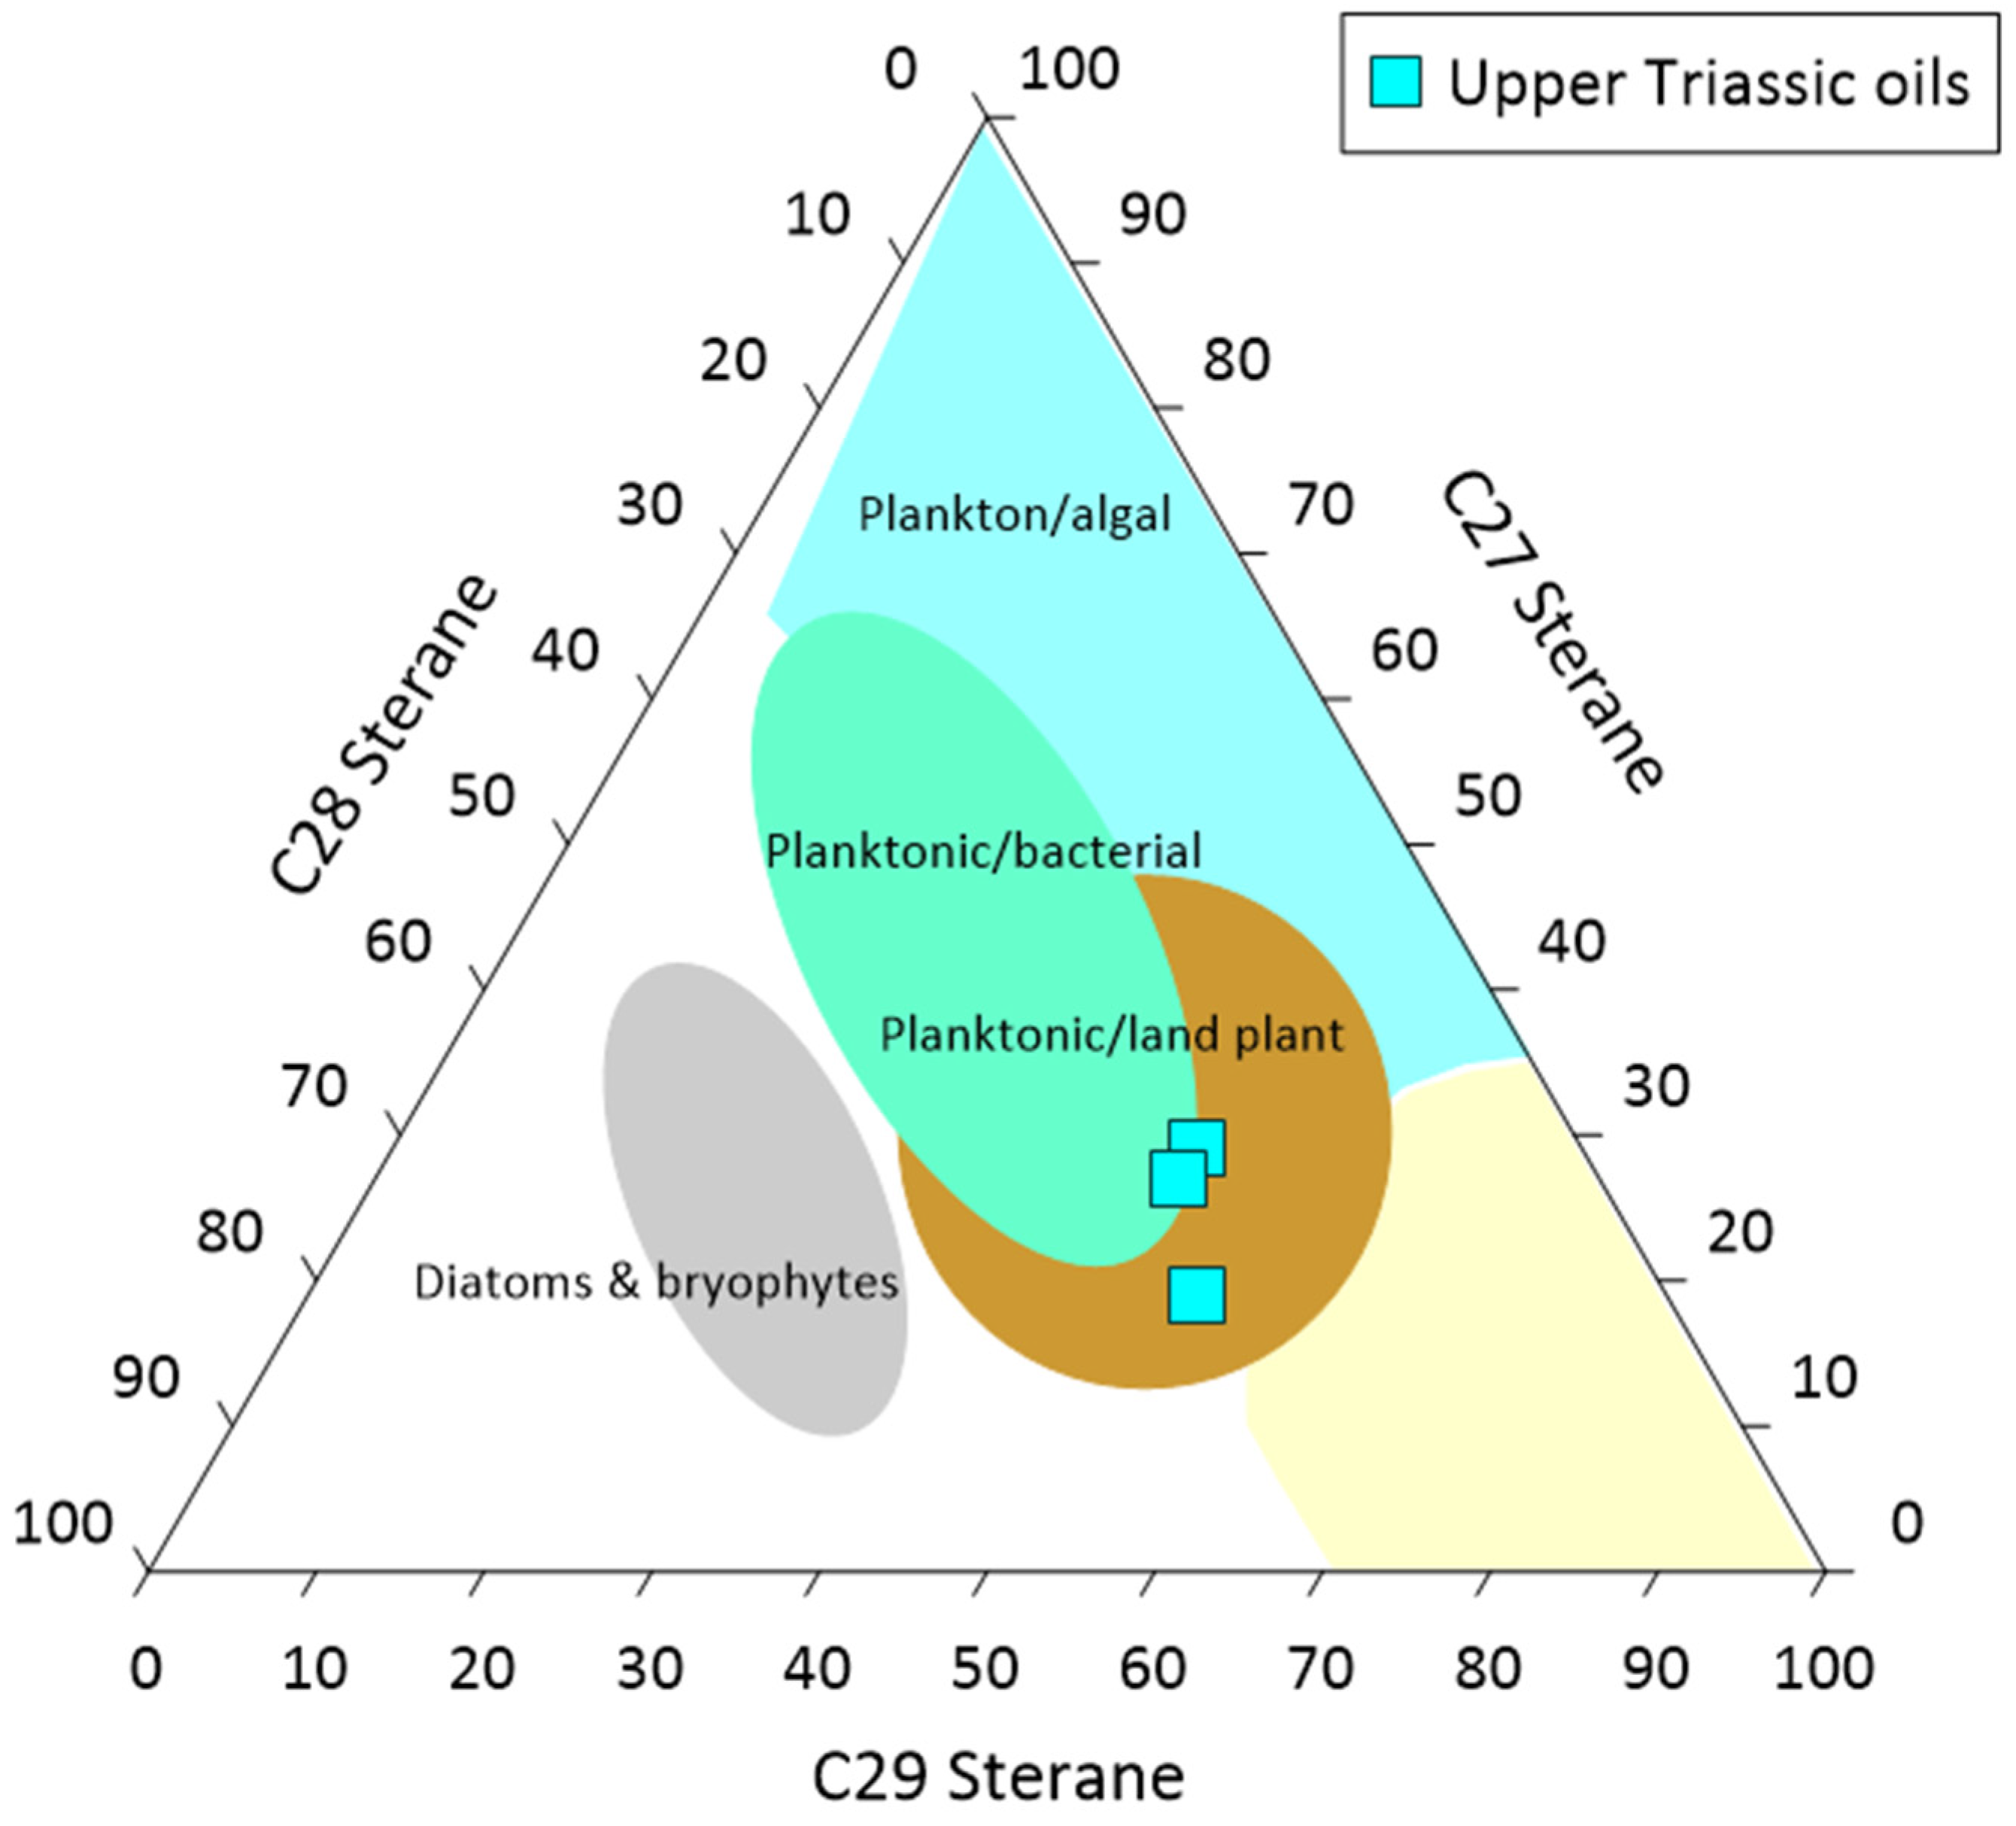
Sterane biomarkers were highly identified in the ion fragmentograms of m/z 217 and 218 (Figure 4C,D). The Upper Triassic oils were characterized by a prevalence of C29 over C27 and C28 (5α, 14β, 17β steranes) (m/z 218; Figure 4D), resulting in the following ranges for C27, C28, and C29 regular steranes: 19%–29%, 23%–28%, and 48%–53%, respectively (Table 4). The C20 S/(S+R) sterane ratio is widely used as a maturity indicator, and the values ranged from 0.44 to 0.52 in the Upper Triassic oils (Table 4).
Further ion chromatograms, such as m/z 231, m/z 178, and m/z 192 (Figure 4E–G), showing the distribution of polycyclic aromatics, are also presented. Such distributions were used to estimate the relative ratios of aromatic compounds, including methyl phenanthrene indices (MPIs) and triaromatic steranes (TASs). The Upper Triassic oils had MPI ratios ranging from 0.37 to 0.47 (Table 1). These MPI values were used to calculate the equivalent vitrinite reflectance (% Rc MPI) [46], which ranged between 0.62% and 0.68% (Table 4). The C28/(C26 + C27) TAS ratios of the Upper Triassic oils exceeded 1 (1.4–1.8) (Table 4).

4.5. Basinal Thermal Evolution History

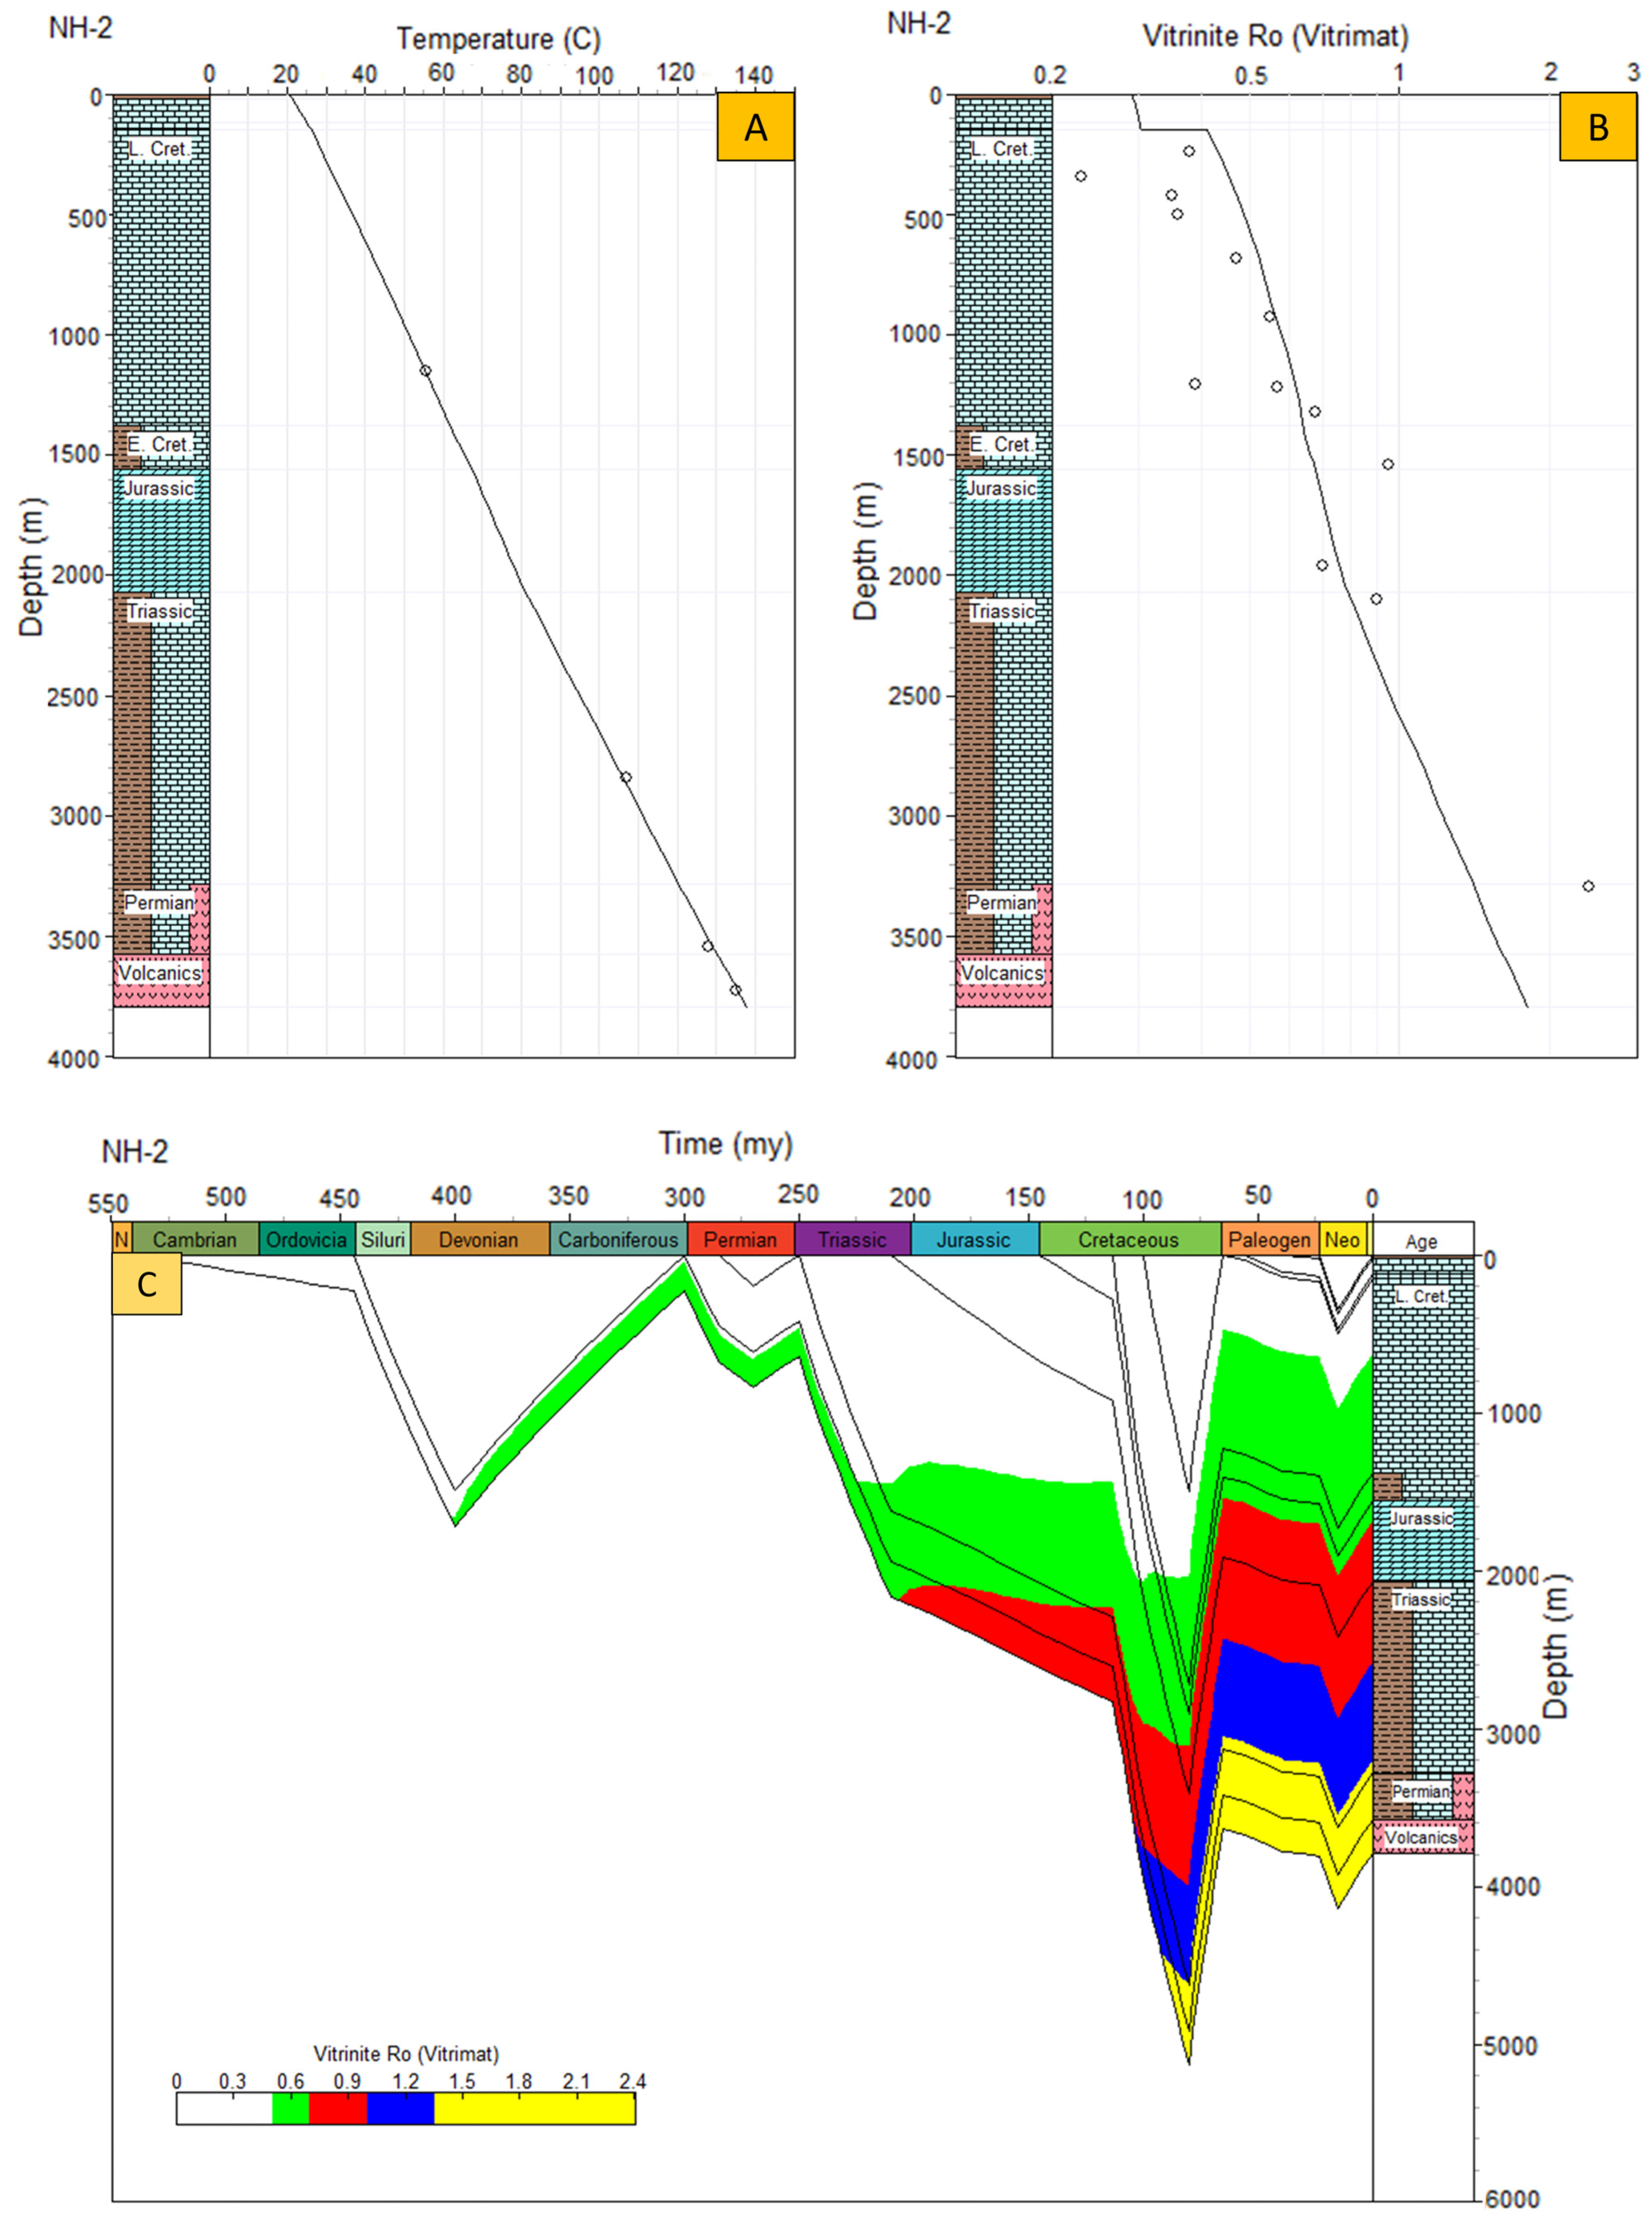
Studying the thermal evolution of sedimentary basins is crucial for delineating the thermal maturity phase of the source rock and hence controlling the time and depth of hydrocarbon generation [47,48,49]. For this purpose, 1D basin models were constructed for the two selected wells: NH-1 and NH-2 (Figure 5 and Figure 6). The heat flow is highly expressive of the thermal history of a basin, which is a mirror of the cycles of subsidence and uplift during basin development [50,51,52]. Estimating the heat flow of the modeled wells was performed after calibrating the thermal maturity parameters: VRo% and bottom-hole temperature (BHT) measurements (Table 6).
By best fitting of the measured and calibrated thermal profiles (Figure 5 and Figure 6), estimated heat flow values of 69.3 mW/m2 and 71.6 mW/m2 were obtained for the NH-1 and NH-2 wells, respectively. Furthermore, Table 7 shows other important elements that were also considered, mainly the erosional periods, thicknesses, and time.
The burial history models (Figure 5C and Figure 6C) showed that the main differences in the deposition of each formation and in the subsidence and uplift cycles resulted from the tectonic movements that controlled the basin development in NW Jordan. According to the burial model of the NH-1 well (Figure 5C), during the Early Paleozoic era (~540–~444 Ma), massive thicknesses of sediments (2923 m) accumulated, reflecting the rifting phase of the northern parts of Jordan [17]. The complete absence of the Upper Paleozoic section is possibly related to uplift and erosion due to the Hercynian orogeny [53], which is marked in the studied wells by an extensive unconformity surface (Figure 5C and Figure 6C). That uplifting effect diminished toward NW Jordan during the Permian time [22], leading to massive sediment accumulation (1126 m and 3283 m in the NH-1 and NH-2 wells, respectively). This was accompanied by a high sedimentation rate in the studided wells, which varied from 563 m/Ma in the NH-1 well to 219 m/Ma in the NH-2 well (Figure 5C and Figure 6C). By the Mesozoic era, additional basin development was observed in NW Jordan due to the Gondwana rifting [8]. This led to an increase in the sedimentation rate during the Triassic, ranging from 16 m/Ma in the NH-1 well to 52 m/Ma in the NH-2 well (Figure 5C and Figure 6C). Following this, the sedimentation rate, possibly reflecting less rifting during the Jurassic, reached 8 m/Ma and 24 m/Ma in the NH-1 and NH-2 wells, respectively (Figure 5C and Figure 6C). It is worth noting that the variable sedimentation rate between the studided wells may point to the differential rifting influence (occupying various settings inside the sedimentary basin) that increased northwards from the NH-1 well to the NH-2 well. The rifting phase was followed by uplifting since the Late Cretaceous, which was affected by the Syrian Arc fold effect [24,25,26], as expressed by the burial models (Figure 5C and Figure 6C).
Hence, a thermal heat flow model was applied, and the thermal maturity history of the Upper Triassic source rock was defined (Figure 5 and Figure 6), pinpointing the time and depth of hydrocarbon generation. Accordingly, the thermal models of the studided wells (Figure 5 and Figure 6) expressed the current thermal maturity phase of the Upper Triassic source rock as being in the early to middle maturity phase in the NH-1 well, while being peak-to-late mature in the NH-2 well. Moreover, these constructed models showed that the bottom surface of the Upper Triassic source rock was buried at a depth of more than 4500 m during the Late Cretaceous (Figure 5 and Figure 6), which accelerated the thermal maturity process. The Upper Triassic formations was early mature (0.55−0.70 Easy % Ro) during the Late Cretaceous (since ~95 Ma to ~80 Ma) in the NH-1 well and since the Late Triassic (~215 Ma) to the Early Cretaceous (~130 Ma) in the NH-2 well, as expressed in Figure 5 and Figure 6. On the other hand, the top of the peak oil generation window (0.70–1.08 Easy % Ro) was near the base of the Upper Triassic strata in the NH-1 well since the Early Cretaceous (~80 Ma) until the present and since ~130 Ma (Early Cretaceous) to ~90 Ma (Late Cretaceous) in the NH-2 well (Figure 5 and Figure 6). Also, the late stage of hydrocarbon generation (1.08 to 1.35 Easy % Ro) was defined in the NH-2 well only during the time span from 90 Ma to the present (Figure 6).

5. Discussion

The Permian to Jurassic section in the Northern Highlands area of NW Jordan was investigated, and its source rock system and organic matter characteristics were identified using organic petrography and multi-geochemical proxies, based on the previously demonstrated results (Table 1, Table 2, Table 3, Table 4, Table 5, Table 6 and Table 7) from three well localities (AJ-1, NH-1, and NH-2), as will be discussed in the following sections.

5.1. Source Rock Characteristics and Hydrocarbon Potential

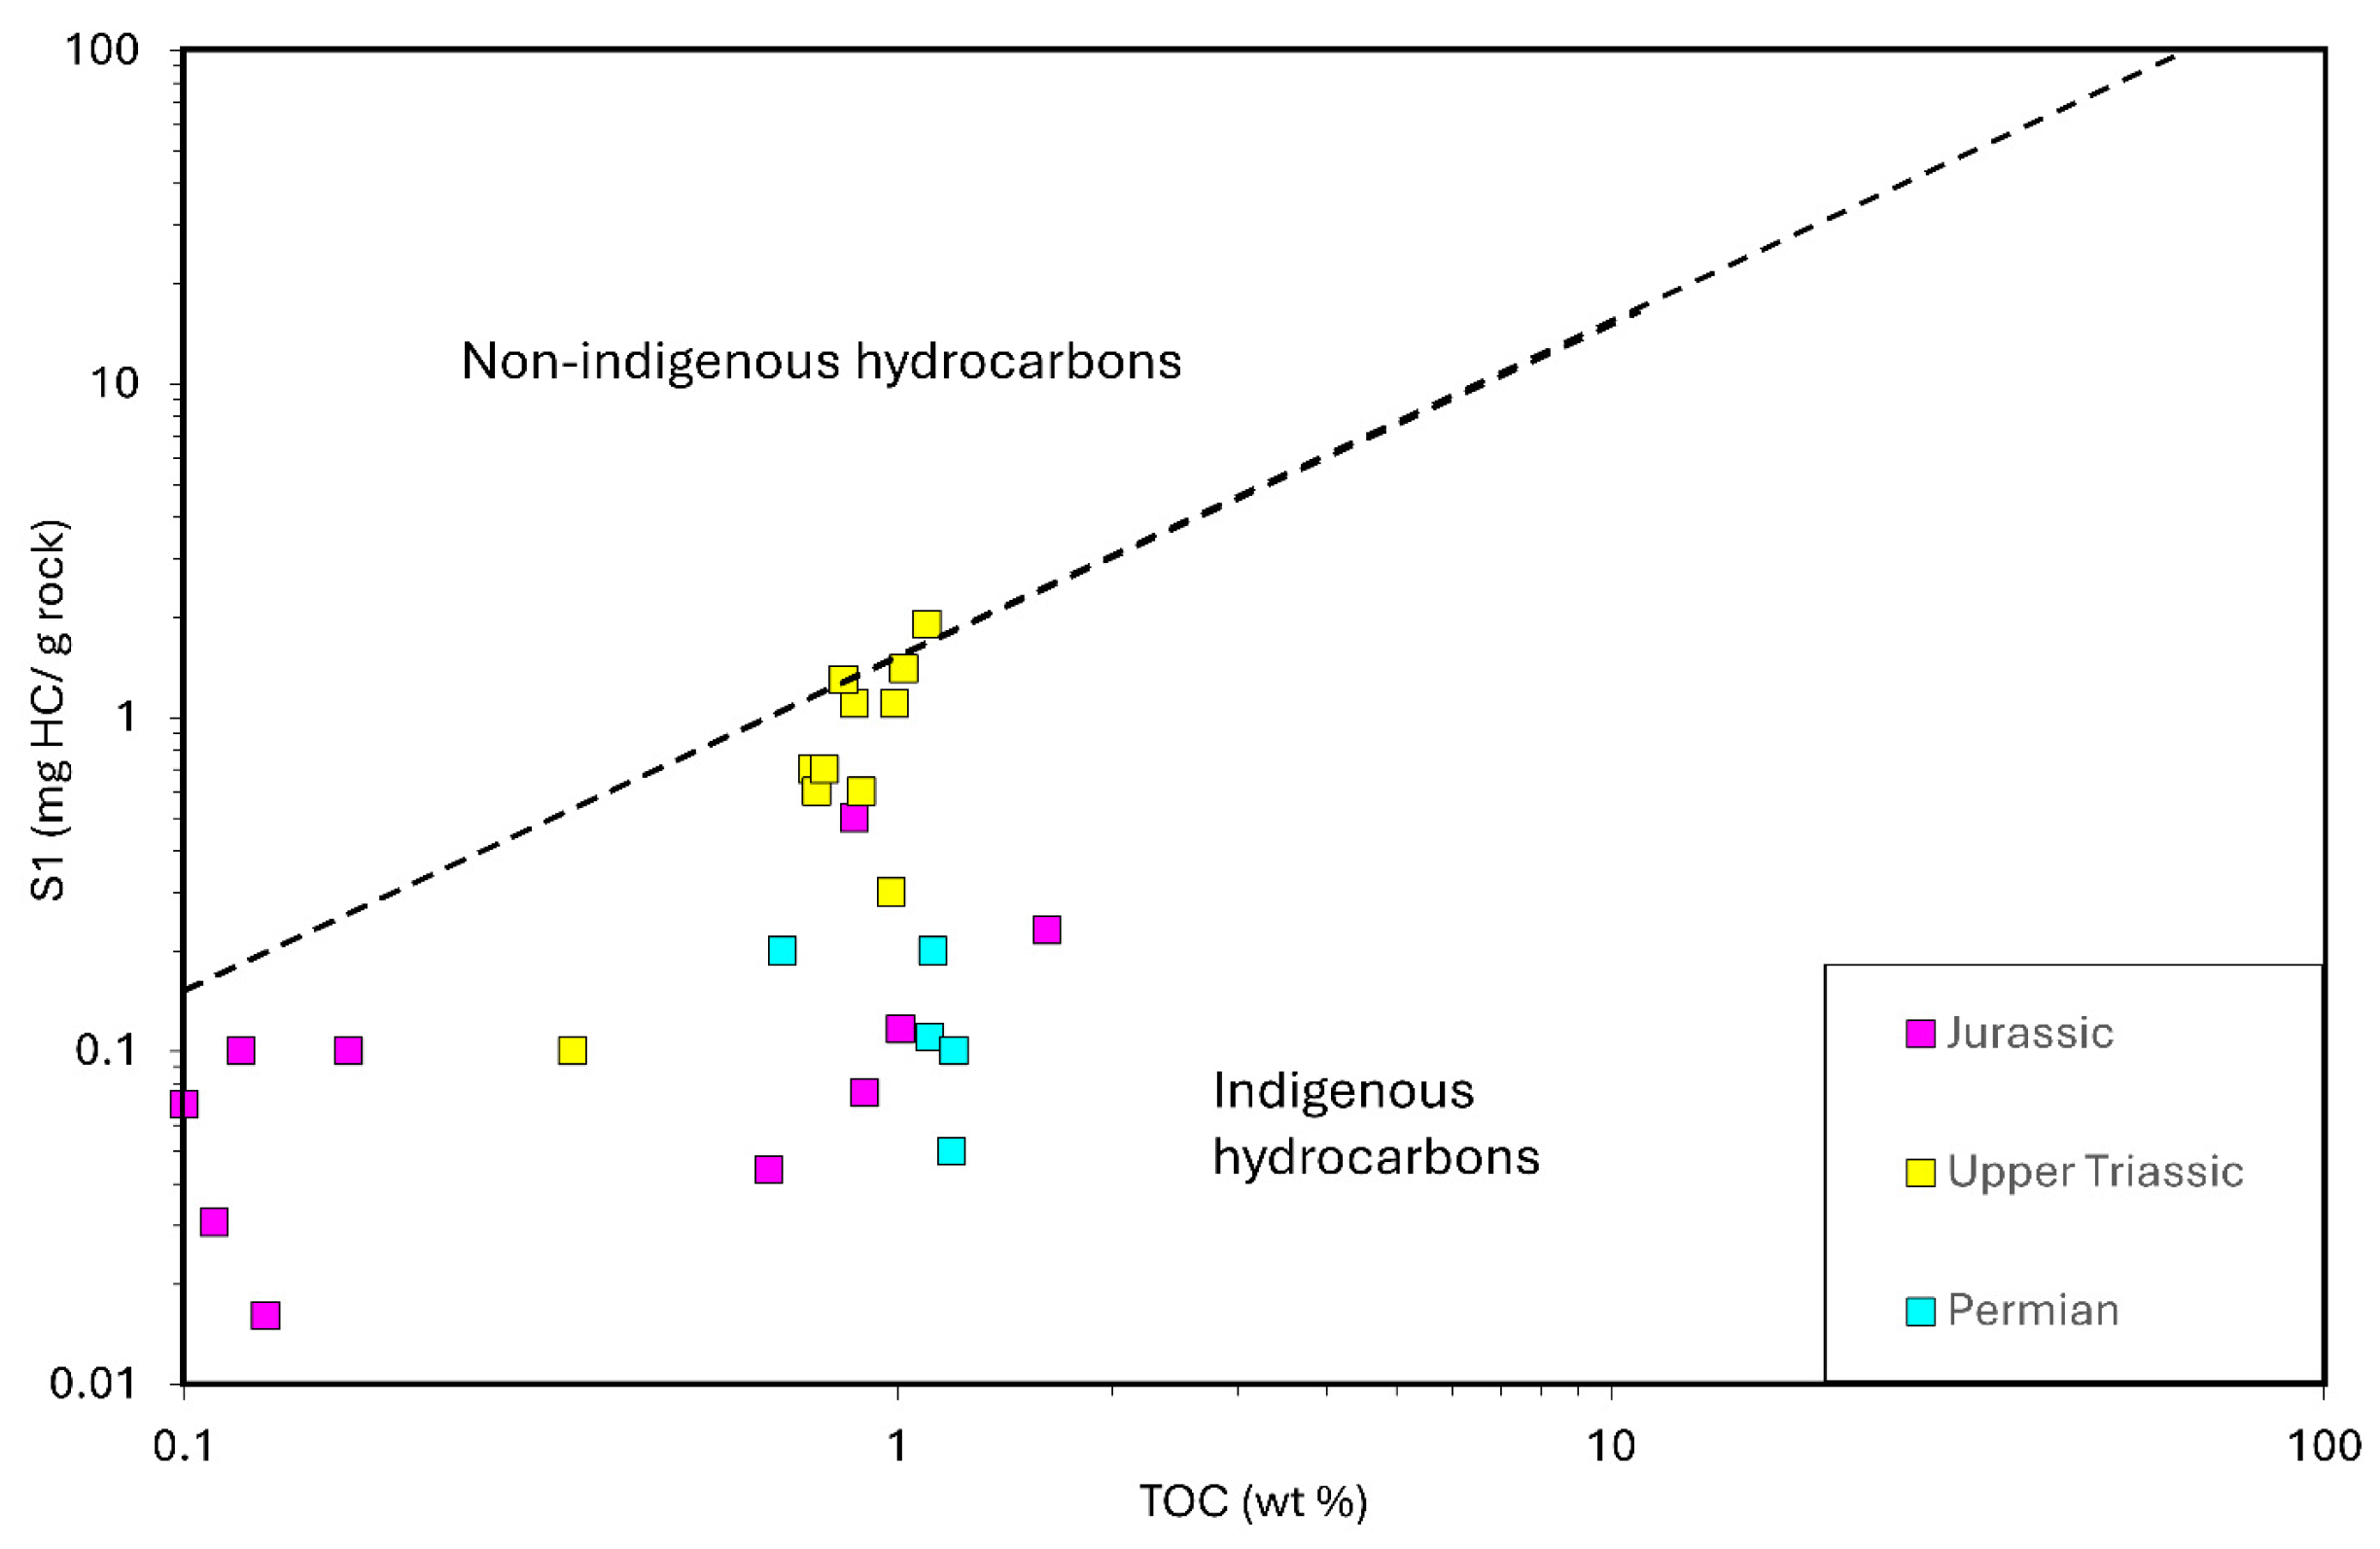
Basins with successful petroleum discoveries usually include proven organically rich source rocks that were buried at deep basinal locations. Meanwhile, identifying the source rock system is usually initiated by defining its organic matter abundance and generating potential (e.g., [54,55,56]). Other important characteristics, such as kerogen typing and thermal maturity levels, must be considered [57,58,59]. Concerning organic richness, many researchers assume a minimum of 0.5 wt% TOC in the source rock. The Permian samples had low to medium TOC content (up to 1.2% in the AJ-1 well; Table 1), indicating poor to fair organic richness and poor generating potential (Figure 7). The overstanding Upper Triassic samples had better source rock characteristics northwards in the NH-2 well, where most samples (12) had fair to marginally good source rock (TOC: 0.55–1.1 wt%; Table 1). However, such TOC and S2 values probably allow the classification of the Upper Triassic strata in the northern part of the study area as effective source rock within the high thermal maturity phase, leading to a decrease in TOC and S2. High maturity was evident from several maturity parameters, as discussed in the thermal maturity section. Such high maturity indicators in source rocks with low organic contents and source potential are widely proven (e.g., [60,61]). According to [61], a poor source rock (TOC < 0.5 wt%) may be a good source rock at a low phase of maturity in geological time. Meanwhile, the increase in organic matter content toward the northern study area (the NH-2 well) may indicate that the sedimentary basin received a greater influx of organic matter. This is contrary to the other southern wells (the AJ-1 and NH-1 wells) that possess TOC values < 0.5%, which suggests that the Upper Triassic strata in the above two wells are non-source rock. Also, the low S2 value (0.4–1.8 mg HC/g rock; Table 1) is another indication of poor source rock potential (Figure 7). The low values for TOC and S2 in most Jurassic samples indicate Jurassic source rock limitation in the study area (Figure 7). Furthermore, the low S1 values point to the indigenous nature of generated hydrocarbons, as implied in Figure 8.

5.2. Organic Matter Type

The kerogen types of the studied Permian–Jurassic strata were primarily determined using HI values. Kerogen type (KT) can be classified as KT I, II, II–III, III, and IV depending on whether HI values are >600 mg HC/g TOC, 300−600 mg HC/g TOC, 200−300 mg HC/g TOC, 50−200 mg HC/g TOC, and <50 mg HC/g TOC, respectively [62]. Further kerogen types of the studied sections were screened by plotting HI along with Tmax and TOC values against S2 values (Figure 9). This data combination improves the likelihood of predicting the generation of hydrocarbon products (oil and/or gas) (e.g., [63,64,65,66]). For instance, the low HI values of three Permian samples (18, 22, and 50; Table 1) reflect KT IV. The primary content is vitrinite rather than other maceral types (liptinite, inertinite, and AOM), which suggests gas generation at high thermal maturity (Figure 10). The Upper Triassic sample plot along the terrestrial highly mature KT III path (mainly vitrinite) and indicated a tendency to generate gas at a high maturity level (Figure 9). Comparing the AJ-1 and NH-2 wells, the inertinite content in the Upper Triassic section (Table 2) was higher in the AJ-1 well (8%–60%) than in the NH-2 well (up to 5%), which indicates that the southern part of the study area received more reworked (oxidized) organic matter than the northern part. The Upper Jurassic samples were dominated by KT III and KT II–III (Figure 9). However, Figure 10 implies that kerogen assemblages consisted mainly of AOM and liptinite, followed by vitrinite. Such maceral-type distributions are likely to generate oil rather than gas (Figure 10). The low HI values possibly indicate that the AOM and liptinite macerals were oxidized (e.g., [67]).

5.3. Organic Matter Origin and Depositional Setting

The organic matter input, origin, and depositional conditions of the Permian and Upper Triassic sections in the Northern Highlands area were assessed through interpreting the available data on saturated biomarkers and aromatic hydrocarbons [71,72]. The dominance of moderately chained n-alkanes in the studied samples with high contents of high-molecular weight n-alkanes (Figure 4A) possibly suggests mixed organic matter with abundant terrestrial organic input. The relatively low CPI values of the studied samples (Permian: 0.65–1.56, Upper Triassic: 0.99–1.11, and Jurassic: 1.17) indicate that the odd-carbon preference is lacking [73,74], as revealed in Table 3.
Isoprenoids were used to give an indication of the organic matter input and the redox depositional conditions [75]. In general, the low Pr/Ph ratios are indicative of the deposition of the source rock in a highly reducing environment (e.g., [76,77]). Further prediction of the organic matter type and redox conditions can be reached by the isoprenoids/n-alkanes cross plot (Figure 11). Consequently, the low Pr/Ph ratios of the studied samples support the deposition of the source rock under strongly reducing conditions, which is also indicated by the Pr/n-C17 and Ph/ n-C18 cross plots (Figure 11). However, these plots indicate marine algal type kerogen, which is not concordant with the visual kerogen data, which imply a major contribution from terrestrial organic matter and only a minor contribution from marine organic matter, as discussed in the previous section. Instead, the low isoprenoids/n-alkanes ratios in the studied oil and extract samples reveal carbonate-rich source rocks. The distributions of hopanoids and steroids in the m/z 191, m/z 217, and m/z 218, fragmentograms (Figure 4B–D, respectively) and their relative ratios (Table 4) indicate the organic matter type and the depositional environment [78,79,80,81]. C30 hopane prevailed over C29 norhopane (Figure 4B), which resulted in low C29/C30 ratios in the Upper Triassic samples (less than 1; Table 4). This suggests clay-rich lithofacies (e.g., [82,83,84]).
Also, in the fragmentogram (Figure 4B), it can be seen that a noticeable concentration of gammacerane existed in the Upper Triassic samples, which is characteristically deposited in hypersaline and/or stratified water [86,87,88]. The restricted and hypersaline depositional environment during the Upper Triassic agrees with the geological information about NW Jordan (e.g., the Northern Highlands area), which points to the presence of a restricted basin during that time, leading to the deposition of evaporites along with shale (Figure 3). The restricted Upper Triassic basin was scoped by many workers not only in NW Jordan, but also in other neighboring countries, such as Syria and Iraq (e.g., [76,89]).
The plot of relative sterane ratios (C27, C28, and C29) on the Huang and Meinschein ternary diagram [78] allowed us to define the organic matter type in the studied samples (Figure 12). It supports the predominance of land-plant origination for the Upper Triassic samples (Figure 12, Table 4). The main contribution of terrestrial organic input was also confirmed by the microscopic examination of kerogen particles, which revealed the dominance of vitrinite in relation to other kerogen types, e.g., liptinite, inertinite, and AOM (Table 2), as discussed in the kerogen type section. Moreover, the occurrence of these kerogen assemblages suggested deposition of the Upper Triassic source rock in a near shore to shallow marine environmental setting (e.g., [90,91]). The depositional setting is characterized by the settling of sediments under reducing conditions, which is in concordance with the low Pr/Ph ratios (Table 3).

5.4. Implications for Thermal Maturity and Hydrocarbon Generation

Determining the thermal maturity level in source rocks involves the visual identification of kerogen assemblages (e.g., [92,93,94]). Several optical and geochemical parameters were corroborated to assess the thermal maturity in the Permian to Jurassic section, mainly PI, Tmax, VRo%, TAI, and thermally related biomarkers parameters. In the present study, TAI values were determined based on spore colorations and scaled from 1 to 7, following the maturation thresholds set by [95,96,97]. VRo% is considered one of the most dependable indicators of maturation [98].
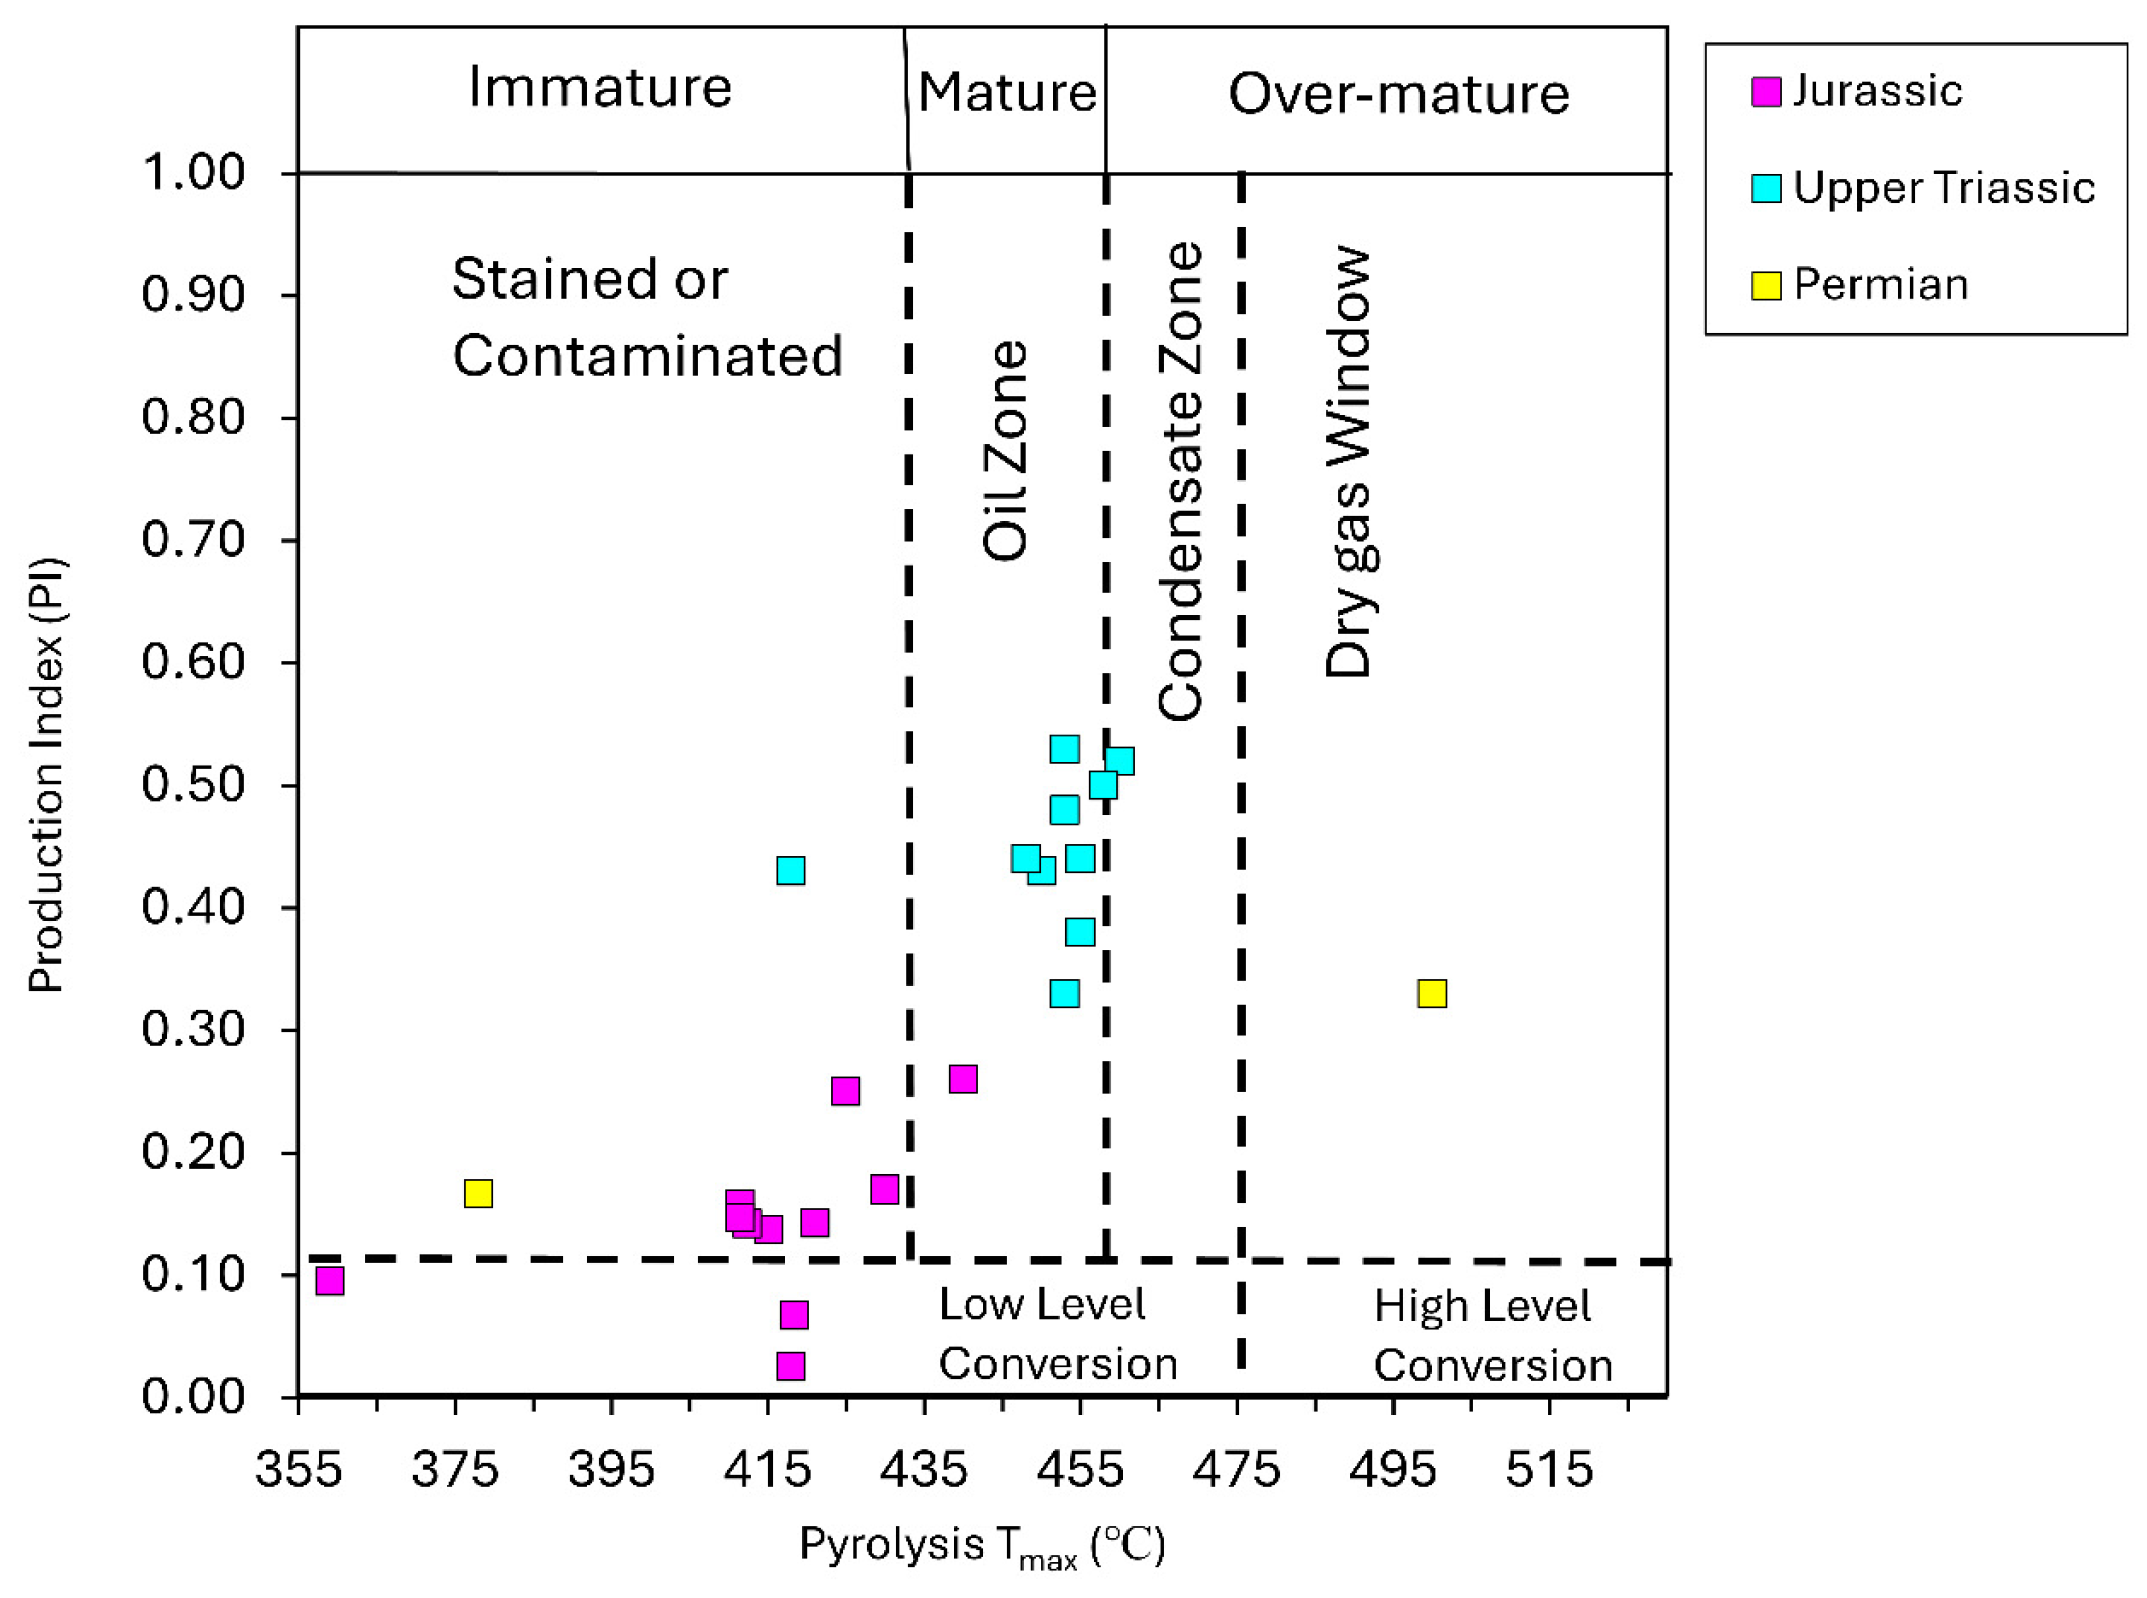
The thermal maturity of the Permian section is variable between the studied wells. For instance, two available samples from the Permian strata have PI and Tmax values were plotted as immature source rock in the AJ-1 well and as over-mature source rock in the NH-2 well (Figure 13, Table 1). In the AJ-1 well, the low maturity of the Permian section was deduced from the high contents of aromatic hydrocarbons and low contents of saturated hydrocarbons (Figure 14A, Table 3). Also, the low TAI values were from 2+ to 3, which are equivalent to <0.2–0.4 VRo% (Table 2). The over-maturity of the Permian sediments in the NH-2 well was supported by the high VRo% value (2.4 at a depth of 3291.5 m; Table 6) and the high TAI values that ranged between 5 and 6. The over-maturity is a result of volcanic activity that influenced these Permian sediments in the NH-2 well by accelerating the thermal evolution there. The volcanic activity was recognized by the deposition of volcanics beside the shale and limestone, as mentioned in the geological report on the NH-2 well.
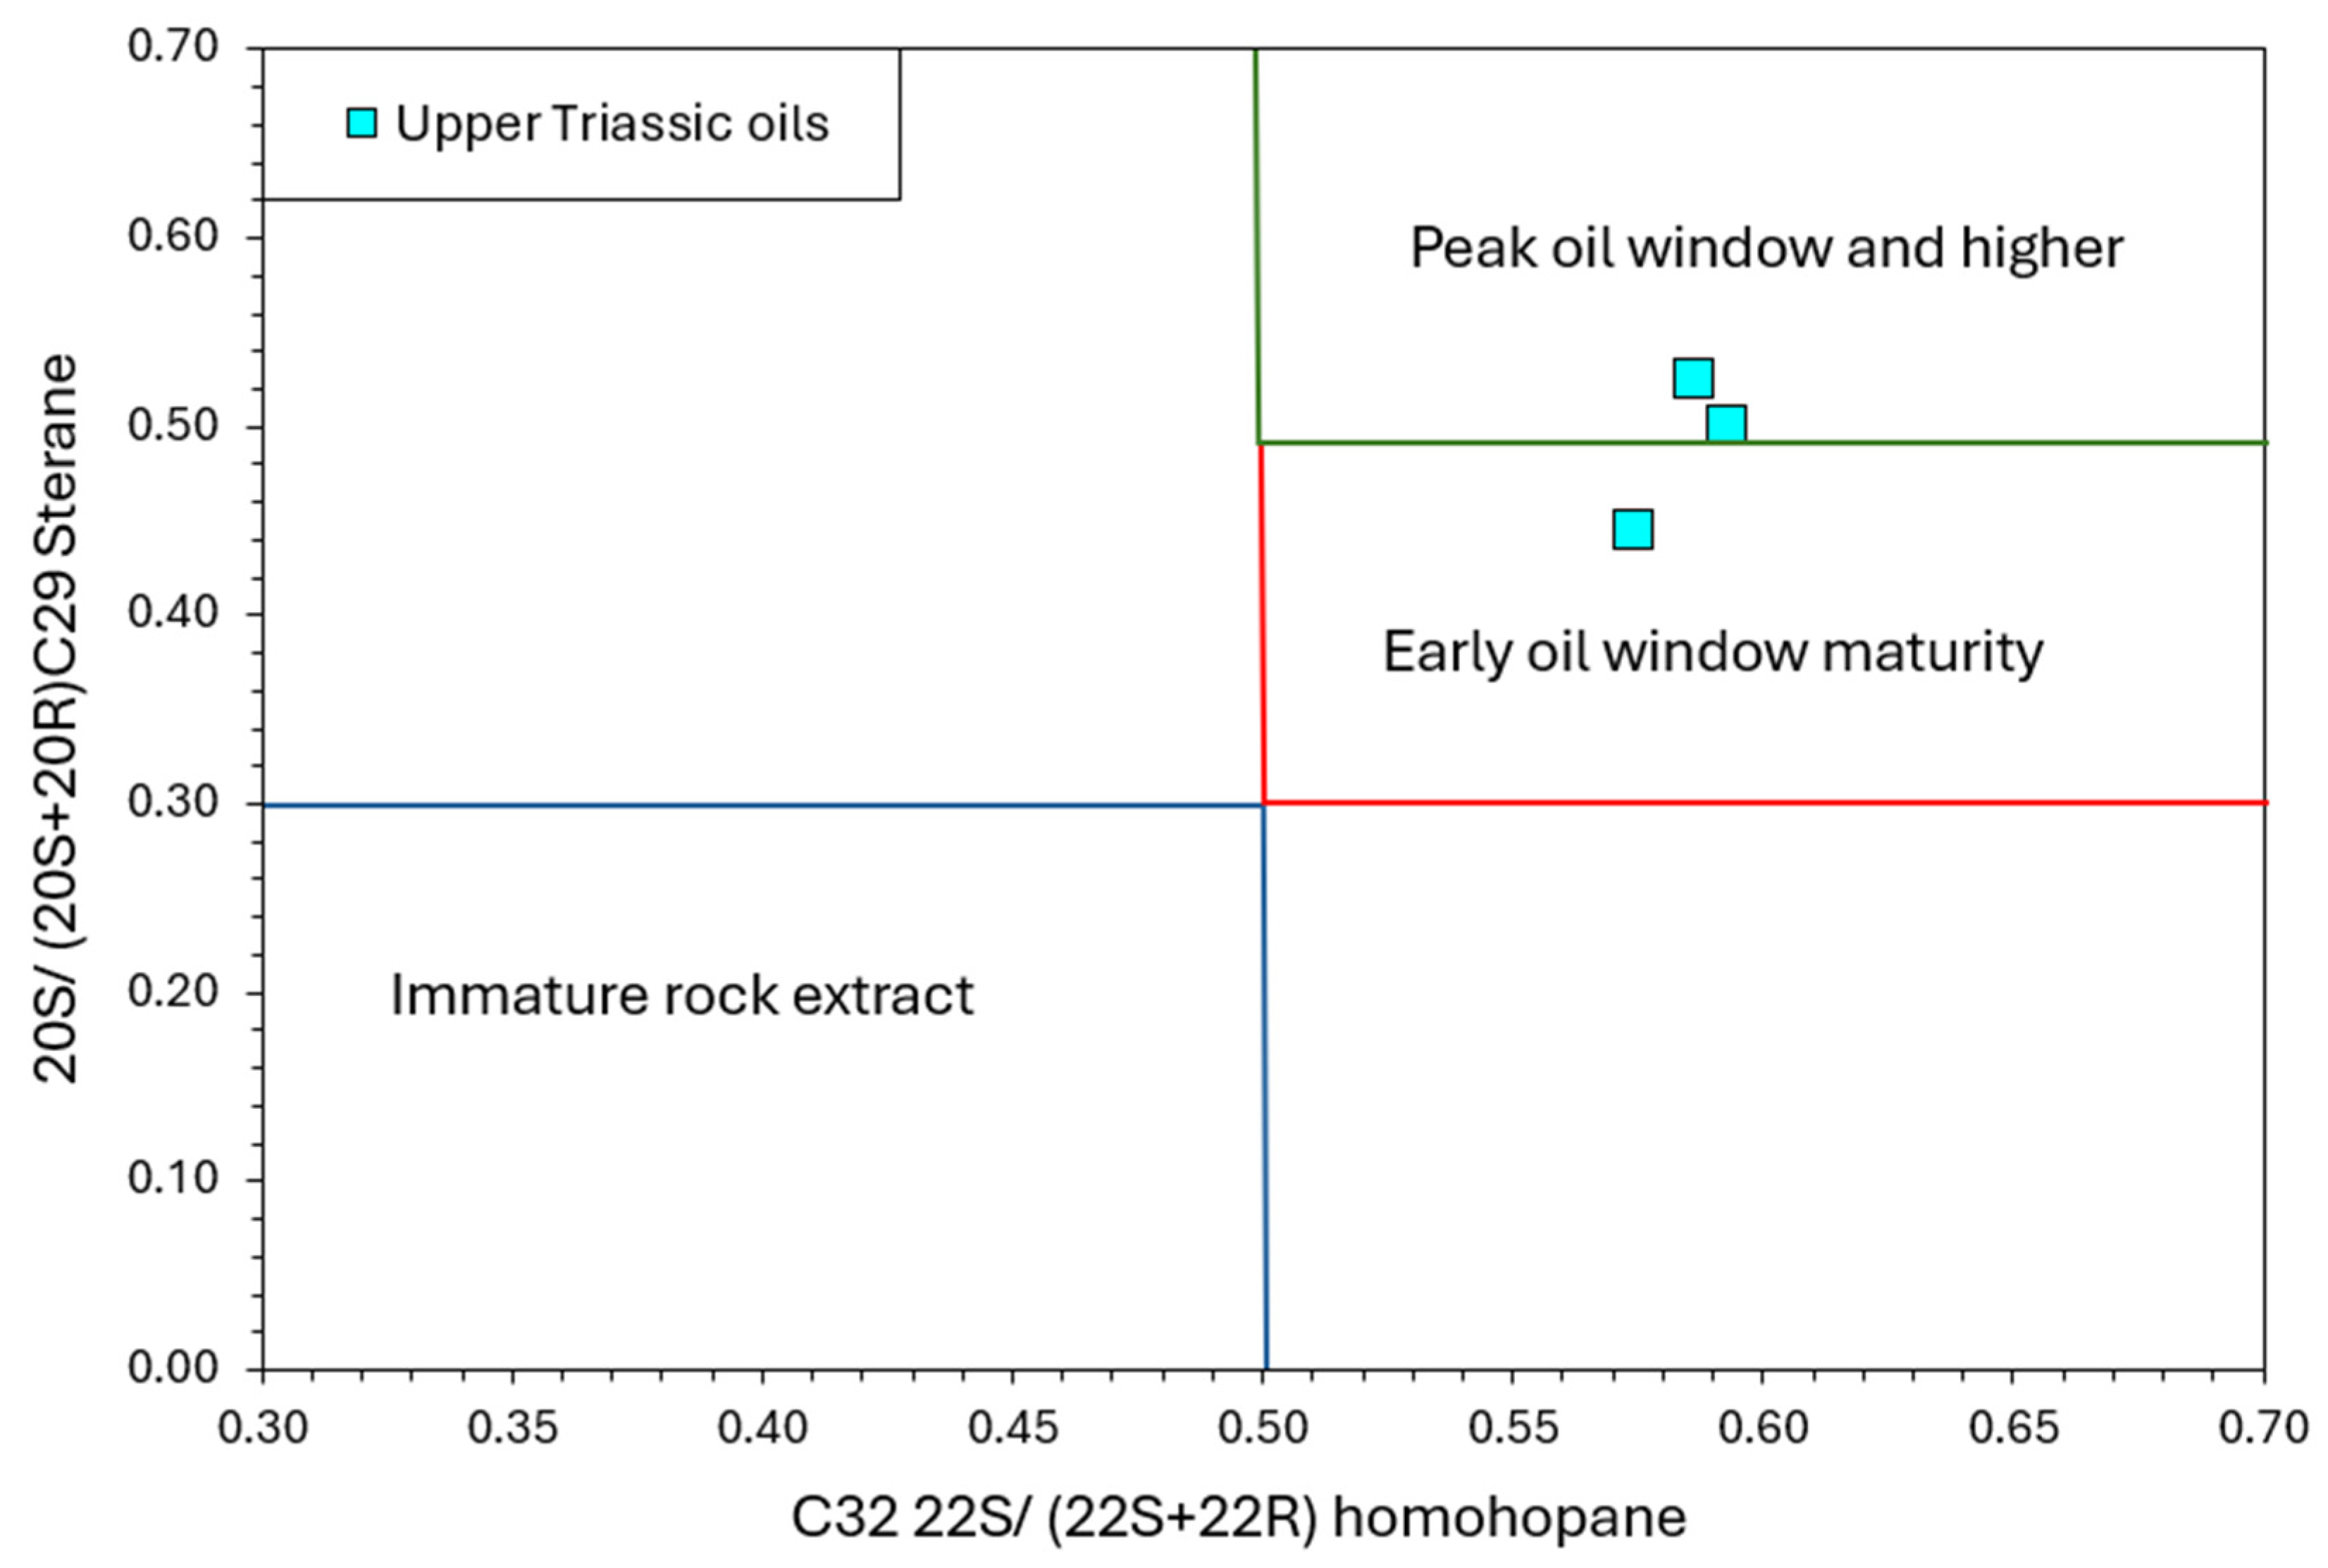
The PI and Tmax values of the Upper Triassic section showed that the thermal maturity corresponds to the oil window zone (Figure 13). The VRo% measured at a depth of 2101.5 m was 0.9 in the NH-2 well (Table 6). The gross composition of extracts enhanced the saturated hydrocarbons as the main contributors (Table 3), as can be seen in the ternary plot (Figure 14B). TAI values varied from 2−, 2+, and 3− in the AJ-1 well; 4 in the NH-1 well; and 4 to 6 in the NH-2 well (Table 2). The CPI values were mostly around 1 in the NH-2 well (Table 3). The Upper Triassic oils from the NH-2 well had high Ts/Tm ratios (2.4–4.5). The C29 sterane C20 S/(S+R) and C32 homohopane C22 S/(S+R) ratios were cross-plotted in Figure 15. Moreover, the Rc% values were calculated for these oils using the MPI values. All these thermal maturity indicators are in good agreement, supporting the conclusion that the Upper Triassic source rocks are highly mature and have reached the peak oil window stage in the NH-2 well, but are still immature to the early mature phase in the AJ-1 well, as defined by the TAI values (Table 2).
The Jurassic strata were found to have PI and Tmax values in the immature–early mature stage. In Table 1, the PI and Tmax values indicate a lower maturity level in the AJ-1 well than in the NH-2 well. One available VRo% measurement at a depth of 1961.5 m reached 0.7 in the NH-2 well, indicating that the strata reached the oil window level of maturity (Table 3). A similar conclusion was reached by using the Jurassic TAI values, which had low values in the AJ-1 well (TAI = 2−) and increased in the NH-2 well (TAI = 4) (Table 2).
Based on the thermal indicators, the lowest thermal maturity was seen in the AJ-1 well. This well was drilled in the Ajlun Dome area, so the sedimentary section was exposed to paleotemperatures that were insufficient to accelerate the maturation process. In contrast, the recognized higher thermal maturity northward in the NH-2 well reflects more deeply buried strata, as discussed in the burial history section.
Moreover, the gross composition of the studied samples was evident from a ternary SARA diagram [100] by cross plotting the relative ratios of saturates, aromatics, and polar compounds. This suggests the aromatic-intermediate and aromatic asphaltene nature of the Permian samples and paraffinic oil for the Upper Triassic samples (Figure 14B).
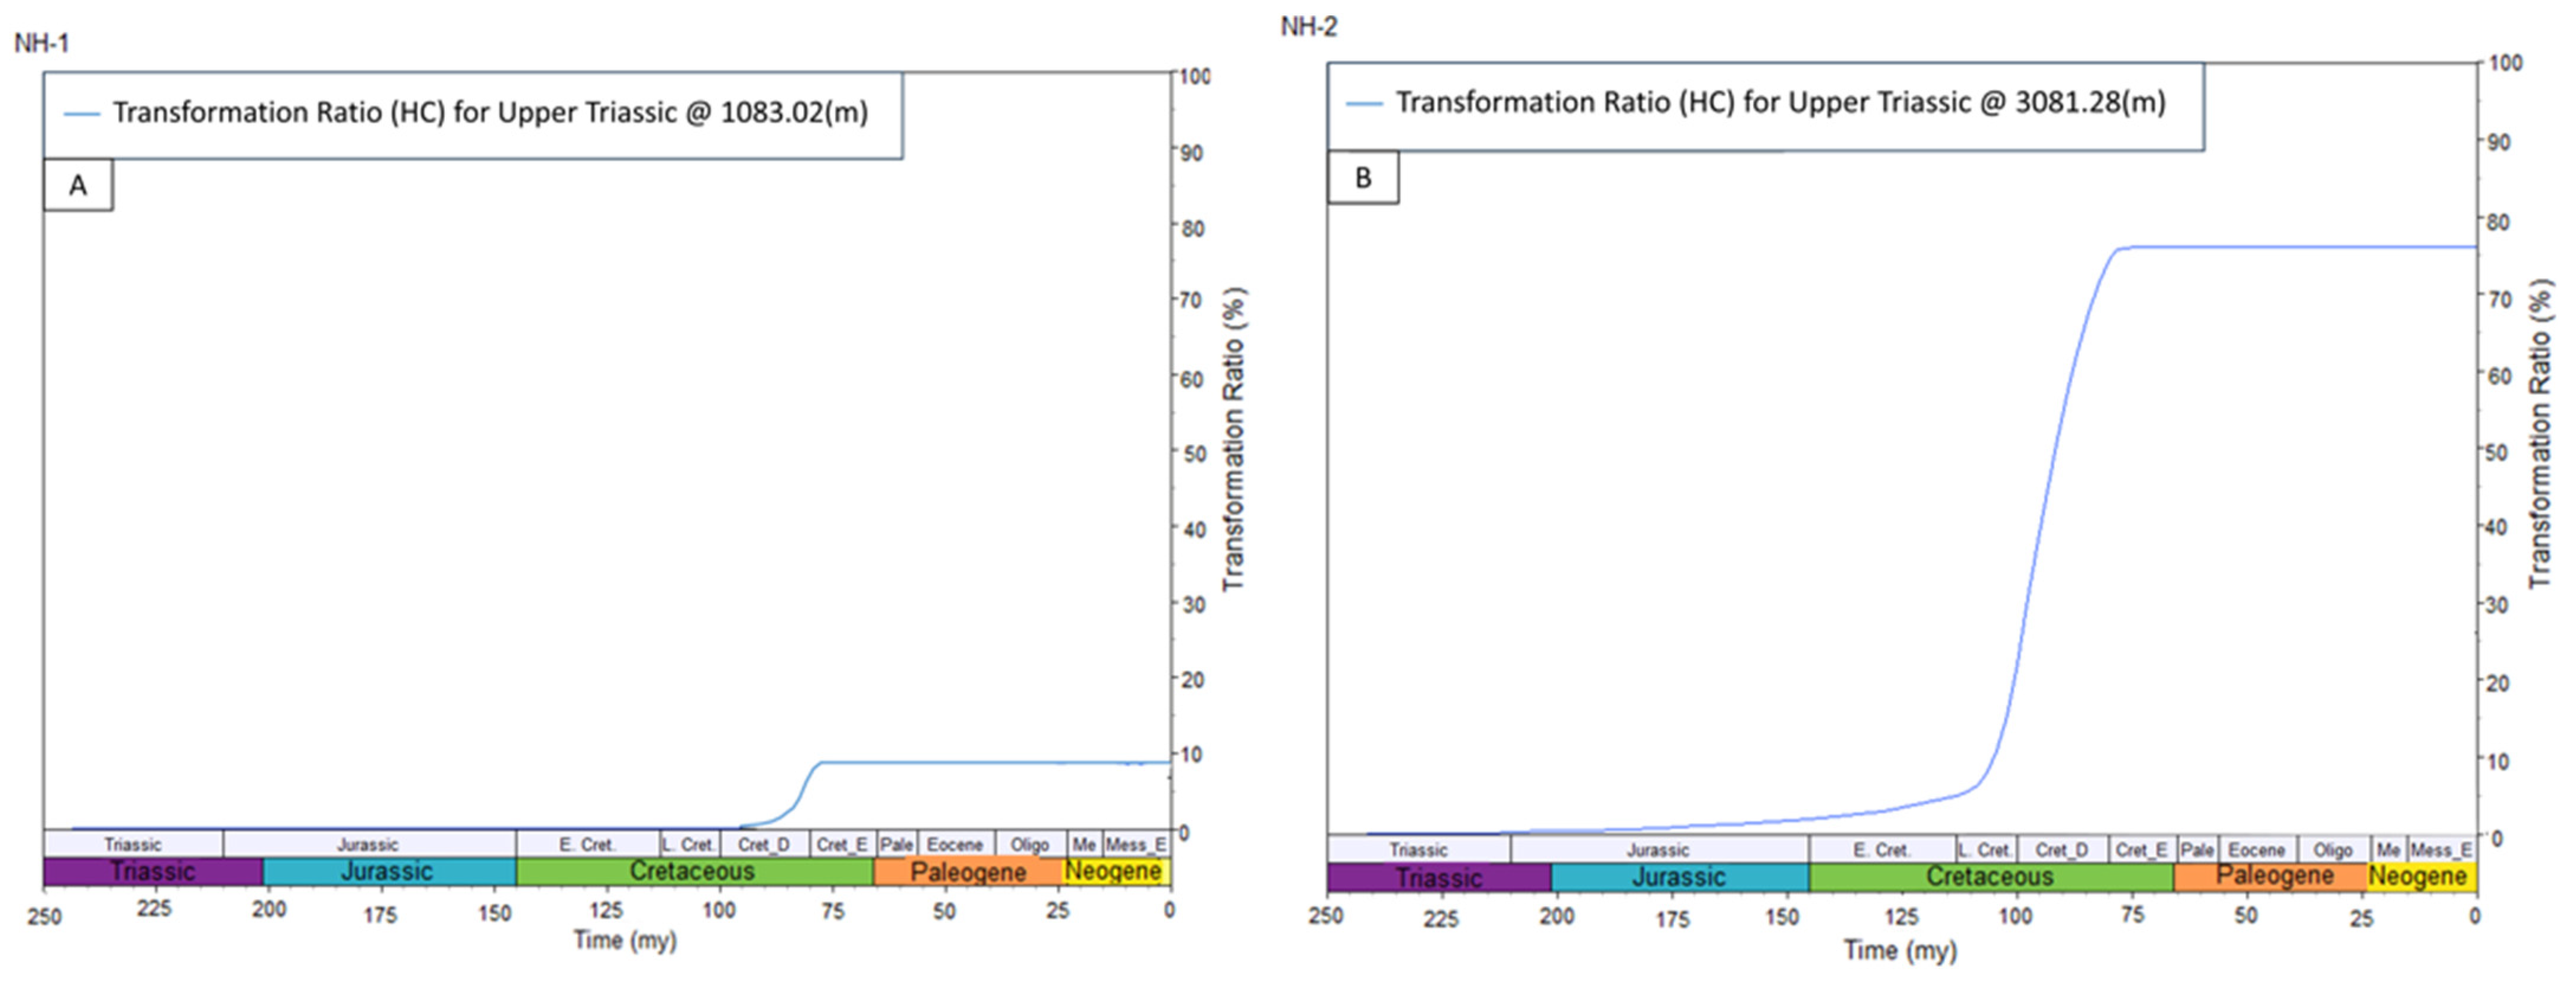
Modeling the cracked organic matter of Upper Triassic source rocks helps determine the timing and the evolution of cumulative hydrocarbon production [101]. The hydrocarbon evolutionary sequence generation for the Upper Triassic source rocks was followed by observing the transformation ratio (TR) curve across time (Figure 16). TR estimates of 10%–25%, 25%–50%, and >50% usually represent the different phases of thermal maturity: early, middle, and late [102]. By applying the TR technique to the NH-1 well, the Upper Triassic source rocks were found to be nearing the early maturity stage in the Late Cretaceous (~80 Ma) (Figure 16A). Meanwhile, during the Late Cretaceous period, the Upper Triassic source rocks in the NH-2 well were early mature (10%–25%TR) at ~110–~100 Ma and mid-mature (25%–50%TR) at ~100–~95 Ma (Figure 16B). The late phase of hydrocarbon generation (>50% TR) was reached at ~82 Ma (Figure 16B). Additionally, the present-day TR is 77% in the NH-2 well (Figure 16B), which implies that the Upper Triassic source rocks expelled substantial volumes of hydrocarbons. The occurrence of thermally mature source rocks may encourage future unconventional hydrocarbon exploration.

5.5. Exploration Challenges in NW Jordan (Upper Triassic Source Rock) in Comparison to Other Northern Levant Areas

Studies in several East Mediterranean countries (the Levant region) have shown the formation of a Triassic carbonate petroleum system [16,103,104], including Lebanon, Syria, and Jordan. There, the Triassic rocks were formed as a part of the Neo-Tethys passive margin [15,105]. This permitted basin development to occur during the Triassic and the formation of shallow marine depositional conditions with a high contribution of carbonate rocks adjacent to clastic–evaporitic deposits, as defined in the present study and other studies (e.g., [106,107]). The above sequence of events explains the high similarity between the Triassic sections in northern Jordan and other neighboring countries (e.g., Syria). In Syria, Triassic carbonate deposits formed oil and gas reservoirs in many fields [16]. The present study shows that the Upper Triassic section in NW Jordan (Abu Ruweis Fm.) is better developed and contains thick intercalated layers of carbonate, shale, and evaporites. However, no giant hydrocarbon fields have been encountered there, in contrast to the giant petroleum production from the equivalent formations in Syria (Kurrachine Fm) [15]. The nomenclature and lithology of the Triassic formations in Jordan and their equivalent strata in the Arabian Gulf were discussed in detail by [8,11,15,108]. The study tries to interpret the absence of large hydrocarbon fields and to present keys ideas for future successful hydrocarbon exploration in NW Jordan.
The present study confirms the efficiency of Upper Triassic source rock systems in NW Jordan. Several Upper Triassic intervals possess adequate TOC (Table 1). The study also showed a major contribution from KT III (gas-prone source rock) that was deposited in a shallow marine environment under reducing conditions. The Upper Triassic strata were deeply buried, as reflected by the high thermal maturity. Based on an integrated geochemical assessment, the Upper Triassic (Kurrachina Fm.) has a similar lithology characterized by alternate intervals of carbonate, shale, and anhydrite [109,110]. The shaly zones possibly acted as local source rocks not only in Jordan but also in other parts of the northern Levant region. It was stated in [106] that the Triassic oils from Syria and Iraq may be sourced from older (Lower–Middle Triassic and Permian) strata and from Jurassic source rocks. In [1,14], the contributions from Upper Triassic shaly source intervals were indicated, which were also defined in the present study by the TOC and S1 cross plot (predominant indigenous hydrocarbons; Figure 8).
The Upper Triassic source rocks in NW Jordan are effective and can generate hydrocarbons. The absence of hydrocarbon accumulations may be due to improper trapping that permitted the escape of hydrocarbons. The authors of [108] related the absence of hydrocarbons to possible lateral changes in lithofacies conjugated with depositional setting. In general, the migration pathways are mostly controlled by fault and fracture networks in sedimentary basins. Therefore, it is important to integrate geophysical studies to properly detect these significant structures [111]. Thus, prior to initiating future exploration in NW Jordan, it is advisable to engage in more representative and accurate seismic studies to properly delineate the structural styles and the possible migration pathways. In addition, it is recommended to perform further geochemical analyses to achieve good oil–source correlations.

6. Conclusions

The present study explores the hydrocarbon potential of Permian to Jurassic strata in the Northern Highlands area, NW Jordan. The Permian sediments can be classified as poor to fair source rocks, consisting primarily of vitrinite, which may be accompanied by main gas generation at high thermal maturity. The Upper Triassic strata showed variable organic richness, from poor source rock in the NH-1 well to fair–marginally good source rock in the NH-2 well, containing organic matter consisting of terrestrial KT III particles (mainly vitrinite) that can generate gas at a high thermal maturity level. Most Jurassic samples had a low organic content (poor source rock), while a limited number of samples showed fair to good source rocks. These samples were dominated by KT III (gas-prone) and KT II-III (oil–gas-prone). However, the maceral analysis showed the predominance of AOM and liptinite, followed by vitrinite. The organic matter input and depositional setting-related biomarkers indicated that the Upper Triassic oils reflect source rocks that received mainly terrestrial organic input accumulated in shallow marine environments under highly reducing conditions. These strata are composed of clay-rich lithologies. In addition, there is evidence that the Upper Triassic oils were deposited in hypersaline and/or stratified water column. Furthermore, corroborating the geochemical and optical thermal maturity parameters determined the thermal maturity of the study strata. The Permian strata exhibited variable thermal maturity, from immature strata in the AJ-1 well to over-mature strata in the NH-2 well. Also, the Upper Triassic source rocks are immature to early mature in the AJ-1 well and reached the oil window in the NH-2 well. The Jurassic strata are immature to early mature in the AJ-1 well and reached the oil window zone in the NH-2 well. The implied basin modeling showed that the Upper Triassic strata are effective source rocks and that they reached the peak oil window (0.7 to 1.08 Easy% Ro) since the Early Cretaceous (~80 Ma) until to present in the NH-1 well and since ~130 Ma (Early Cretaceous) to ~90 Ma (Late Cretaceous) in the NH-2 well. Also, the late stage of hydrocarbon generation (1.08 to 1.35 Easy % Ro) was defined in the NH-2 well only during the time from 90 Ma and continued to the present. The evolution of the transformation ratio implies that the Upper Triassic source rocks expelled substantial volumes of hydrocarbons to reach the present-day TR of 77% in the NH-2 well, which may encourage future unconventional hydrocarbon exploration.

Author Contributions

Conceptualization, D.H., S.F., A.Q., F.A., K.A.-K., T.G., L.J. and A.S.Z.; Data curation, D.H., S.F., A.Q., F.A., K.A.-K., T.G., L.J. and A.S.Z.; Formal analysis, D.H., S.F., A.Q., F.A. and T.G.; Funding acquisition, K.A.-K., L.J. and A.S.Z.; Investigation, D.H., S.F., A.Q., F.A. and T.G.; Methodology, D.H., S.F., A.Q., F.A., K.A.-K., T.G., L.J. and A.S.Z.; Project administration, S.F., A.Q., F.A. and T.G.; Resources, D.H., S.F., A.Q., F.A., K.A.-K., T.G., L.J. and A.S.Z.; Software, D.H., S.F., A.Q., F.A., K.A.-K., T.G., L.J. and A.S.Z.; Supervision, S.F., A.Q., F.A. and T.G.; Validation, D.H., S.F., A.Q., F.A., K.A.-K., T.G., L.J. and A.S.Z.; Visualization, D.H., S.F., A.Q., F.A., K.A.-K., T.G., L.J. and A.S.Z.; Writing—original draft, D.H., S.F., A.Q., F.A., K.A.-K., T.G., L.J. and A.S.Z.; Writing—review and editing, D.H., S.F., A.Q., F.A., K.A.-K., T.G., L.J. and A.S.Z. All authors have read and agreed to the published version of the manuscript.

Funding

L.J. and the CORE lab are supported by the Fundação de Amparo à Pesquisa do Estado de São Paulo (FAPESP) project 2016/24946-9. A.S.Z. is also supported by FAPESP (grant number 2022/08285-3).

Data Availability Statement

The data supporting this paper are available on request.

Acknowledgments

Eng. Hossam Ali of StratoChem© Services is gratefully appreciated for his 1D basin modeling help and general comments that improved the manuscript. Khaled Al-Kahtany thanks the King Saud University, Riyadh, Saudi Arabia, for research support (project number RSP-2024R139). The editor, Suitita Changsing, and the three anonymous reviewers are thanked for their assistance which improved the quality of the manuscript.

Conflicts of Interest

The authors declare no conflicts of interest.

References

  1. Beydoun, Z.R.; Futyan, A.R.I.; Jawzi, A.H. Jordan Revisited: Hydrocarbons Habitat and Potential. J. Pet. Geol. 1994, 17, 177–194. [Google Scholar] [CrossRef]
  2. Naylor, D.; Al-Rawi, M.; Clayton, G.; Fitzpatrick, M.J.; Green, P.F. Hydrocarbon Potential in Jordan. J. Pet. Geol. 2013, 36, 205–236. [Google Scholar] [CrossRef]
  3. Lüning, S.; Kuss, J. Petroleum Geology of Jordan. In Petroleum Systems of the Tethyan Region; American Association of Petroleum Geologists: Tulsa, OK, USA, 2014; pp. 217–239. [Google Scholar]
  4. Amireh, B.S.; Schneider, W.; Abed, A.M. Diagenesis and Burial History of the Cambrian-Cretaceous Sandstone Series in Jordan. Neues Jahrb. Fur Geol. Und Palaontol.-Abh. 1994, 192, 151–182. [Google Scholar] [CrossRef]
  5. Qteishat, A.; AL-Mahasneh, M.A. Hydrocarbons Potential in the Azraq Area. Open J. Geol. 2018, 8, 753–763. [Google Scholar] [CrossRef]
  6. Farouk, S.; Lofty, N.M.; Qteishat, A.; Ahmad, F.; Shehata, A.M.; Al-Kahtany, K.; Hsu, C.S. Source and Thermal Maturity Assessment of the Paleozoic-Mesozoic Organic Matter in the Risha Gas Field, Jordan. Fuel 2023, 335, 126998. [Google Scholar] [CrossRef]
  7. Farouk, S.; Qteishat, A.; Sen, S.; Ahmad, F.; El-Kahtany, K.; Collier, R.; Sarhan, M.A. Characterization of the Gas-Bearing Tight Paleozoic Sandstone Reservoirs of the Risha Field, Jordan: Inferences on Reservoir Quality and Productivity. Arab. J. Sci. Eng. 2024, 1–21. [Google Scholar] [CrossRef]
  8. Shinaq, R. Subsurface Triassic Sediments in Jordan: Stratigraphic and Depositional Characteristics, and Hydrocarbon Potential. J. Pet. Geol. 1996, 19, 57–76. [Google Scholar] [CrossRef]
  9. Zhang, F.; Shen, S.; Cui, Y.; Lenton, T.M.; Dahl, T.W.; Zhang, H.; Zheng, Q.; Wang, W.; Krainer, K.; Anbar, A.D. Two Distinct Episodes of Marine Anoxia during the Permian-Triassic Crisis Evidenced by Uranium Isotopes in Marine Dolostones. Geochim. Cosmochim. Acta 2020, 287, 165–179. [Google Scholar] [CrossRef]
  10. Zhao, W.; Luo, P.; Chen, G.; Cao, H.; Zhang, B. Origin and Reservoir Rock Characteristics of Dolostones in the Early Triassic Feixianguan Formation, Ne Sichuan Basin, China: Significance for Future Gas Exploration. J. Pet. Geol. 2005, 28, 83–100. [Google Scholar] [CrossRef]
  11. Sadooni, F.N.; Dalqamouni, A. Geology and Petroleum Prospects of Upper Triassic Sediments, Jordan. Mar. Pet. Geol. 1998, 15, 783–801. [Google Scholar] [CrossRef]
  12. Powell, J.H.; Mohamed, B.K. Structure and Sedimentation of Permo-Triassic and Triassic Rocks Exposed in Small-Scale Horsts and Grabens of Pre-Cretaceous Age: Dead Sea Margin, Jordan. J. Afr. Earth Sci. (Middle East) 1993, 17, 131–143. [Google Scholar] [CrossRef]
  13. Al Hseinat, M.; AlZidaneen, M.; Jaradat, R.; Al-Rawabdeh, A.; Hübscher, C. Tectono-Stratigraphic Framework and Evolution of the Northwestern Arabian Plate, Central Jordan. Tectonophysics 2023, 863, 229993. [Google Scholar] [CrossRef]
  14. Beydoun, Z.R. Petroleum Habitat, Northern Middle East: A Review. Houst. Geol. Soc. Bull. 1988, 30, 11. [Google Scholar]
  15. Sadooni, F.N.; Alsharhan, A.S. Stratigraphy, Lithofacies Distribution, and Petroleum Potential of the Triassic Strata of the Northern Arabian Plate. AAPG Bull. 2004, 88, 515–538. [Google Scholar] [CrossRef]
  16. Al-Rawi, M.M. Petroleum Systems in Jordan. GeoExpro 2014, 11. [Google Scholar]
  17. Bandel, K.; Salameh, E. Geologic Development of Jordan-Evolution of Its Rocks and Life; Elias Mechael Salameh: Amman, Jordan, 2013. [Google Scholar]
  18. Powell, J.H.; Abed, A.; Jarrar, G.H. Ediacaran Arabia Complex of Jordan. GeoArabia-Middle East Pet. Geosci. 2015, 20, 99–156. [Google Scholar]
  19. Abed, A.M. The Geology of Jordan and Its Environment and Water; Publication of the Jordanian Geologists Association: Amman, Jordan, 2000. (In Arabic) [Google Scholar]
  20. Sharland, P.R.; Casey, D.M.; Davies, R.B.; Simmons, M.D.; Sutcliffe, O.E. Arabian Plate Sequence Stratigraphy–Revisions to SP2. GeoArabia 2004, 9, 199–214. [Google Scholar] [CrossRef]
  21. Ruban, D.A.; Al-Husseini, M.I.; Iwasaki, Y. Review of Middle East Paleozoic Plate Tectonics. GeoArabia 2007, 12, 35–56. [Google Scholar] [CrossRef]
  22. Powell, J.H.; Stephenson, M.H.; Nicora, A.; Rettori, R.; Borlenghi, L.; Perri, M.C. The Permian-Triassic Boundary, Dead Sea, Jordan: Transitional Alluvial to Marine Depositional Sequences and Biostratigraphy. Riv. Ital. Paleontol. Stratigr. 2016, 122, 23–39. [Google Scholar]
  23. Stampfli, G.M.; Hochard, C. Plate Tectonics of the Alpine Realm. Geol. Soc. Lond. Spec. Publ. 2009, 327, 89–111. [Google Scholar] [CrossRef]
  24. Hardy, C.; Homberg, C.; Eyal, Y.; Barrier, É.; Müller, C. Tectonic Evolution of the Southern Levant Margin since Mesozoic. Tectonophysics 2010, 494, 211–225. [Google Scholar] [CrossRef]
  25. Frizon De Lamotte, D.; Fourdan, B.; Leleu, S.; Leparmentier, F.; De Clarens, P. Style of Rifting and the Stages of Pangea Breakup. Tectonics 2015, 34, 1009–1029. [Google Scholar] [CrossRef]
  26. Tarawneh, A.; Atallah, M. Structural Setting of the Jordan Northern Highlands: An Integrated Study Using Surface and Sub-Surface Geological Data by Utilizing GIS Technology. Ph.D. Thesis, University of Cape Town, Cape Town, South Africa, 2011. [Google Scholar]
  27. Andrews, I.J. Cretaceous and Paleogene Lithostratigraphy in the Subsurface of Jordan; Ministry of Energy and Mineral Resources: Amman, Jordan, 1992. [Google Scholar]
  28. Haq, B.U.; Hardenbol, J.; Vail, P.R.; Stover, L.E.; Colin, J.P.; Ioannides, N.S.; Wright, R.C.; Baum, G.R.; Gombos, A.M.; Pflum, C.E. Mesozoic and Cenozoic Chronostratigraphy and Cycles of Sea-Level Change. In Sea Level Changes: An Integrated Approach; SEPM Special Publication: Houston, TX, USA, 1988; pp. 71–108. [Google Scholar]
  29. Makhlouf, I.M.; El-Haddad, A.A. Depositional Environments and Facies of the Late Triassic Abu Ruweis Formation, Jordan. J. Asian Earth Sci. 2006, 28, 372–384. [Google Scholar] [CrossRef]
  30. Peters, K.E. Guidelines for Evaluating Petroleum Source Rock Using Programmed Pyrolysis. AAPG Bull. 1986, 70, 318–329. [Google Scholar]
  31. Peters, K.E.; Cassa, M.R. Applied Source Rock Geochemistry: Chapter 5: Part II. Essential Elements. In The Petroleum System—From Source to Trap; American Association of Petroleum Geologists: Tulsa, OK, USA, 1994; pp. 93–120. [Google Scholar]
  32. ISO 7404-5; Methods for the Petrographic Analysis of Coals—Part 5: Method of Determining Microscopically the Reflectance of Vitrinite. International Organization for Standardization: Geneva, Switzerland, 2009.
  33. ASTM D7708-14; Standard Test Method for Microscopical Determination of the Reflectance of Vitrinite Dispersed in Sedimentary Rocks. ASTM International: West Conshohocken, PA, USA, 2014.
  34. Sweeney, J.J.; Burnham, A.K. Evaluation of a Simple Model of Vitrinite Reflectance Based on Chemical Kinetics. AAPG Bull. 1990, 74, 1559–1570. [Google Scholar]
  35. Pepper, A.S.; Corvi, P.J. Simple Kinetic Models of Petroleum Formation. Part III: Modelling an Open System. Mar. Pet. Geol. 1995, 12, 417–452. [Google Scholar] [CrossRef]
  36. El Atfy, H.; Ghassal, B.I.; Littke, R. Petroleum Source Rocks of Egypt: An Integrated Spatio-Temporal Palynological and Organic Geochemical Studies Within the Phanerozoic. In The Phanerozoic Geology and Natural Resources of Egypt; Hamimi, Z., Khozyem, H., Adatte, T., Nader, F.H., Oboh-Ikuenobe, F., Zobaa, M.K., El Atfy, H., Eds.; Advances in Science, Technology & Innovation; Springer International Publishing: Cham, Switzerland, 2023; pp. 649–674. ISBN 978-3-030-95636-3. [Google Scholar]
  37. Chen, J.-Q.; Jiang, F.-J.; Pang, X.-Q.; Yang, H.-J.; Shi, K.-Y.; Pang, B.; Pang, H.; Chen, J.-F.; Chen, Z.-H.; Zhang, X.-G. Characteristics and Origin of Low-Organic-Matter Carbonate Source Rocks in the Middle–Upper Ordovician, Tarim Basin, Northwestern China. J. Palaeogeogr. 2024, 13, 594–619. [Google Scholar] [CrossRef]
  38. Manga, W.G.O.; Hatcherian, J.J.; Hackley, P.C.; Bessong, M.; Bapowa, C.L.; Pougue, H.E.; Meying, A. Novel Insights about Petroleum Systems from Source and Reservoir Rock Characterization, Cretaceous Deposits, Babouri-Figuil Basin, Northern Cameroon. Int. J. Coal Geol. 2024, 285, 104491. [Google Scholar] [CrossRef]
  39. Arsairai, B.; Feng, Q.; Chonglakmani, C.; Glumglomjit, S. Source Rock Potential Assessment of the Huai Hin Lat Formation, Sap Phlu Basin, Nakhon Ratchasima Province, Northeastern Thailand. Acta Geochim. 2023, 42, 38–49. [Google Scholar] [CrossRef]
  40. Sih, K.O.; Eric, B.E.; Kwankam, F.N.; Eble, C.F.; Alex, Y.J.; Nkongo, A.E.; Esue, M.F.; Christopher, A. Organic Petrography and Trace Element Geochemistry of Organic Black Shales in the Kribi Campo Sub-Basin, West Africa: Implication for Petroleum Source Rock Evaluation and Depositional Environment. Sci. Afr. 2023, 20, e01611. [Google Scholar] [CrossRef]
  41. Hui, S.-S.; Pang, X.-Q.; Jiang, F.-J.; Wang, C.-X.; Mei, S.-X.; Hu, T.; Pang, H.; Li, M.; Zhou, X.-L.; Shi, K.-Y. Quantitative Effect of Kerogen Type on the Hydrocarbon Generation Potential of Paleogene Lacustrine Source Rocks, Liaohe Western Depression, China. Pet. Sci. 2024, 21, 14–30. [Google Scholar] [CrossRef]
  42. Zhang, G.; Yang, Y.; Liu, T.; Xu, Y.; Chang, X.; Qu, Y.; Shi, B.; Yang, B.; Song, T. Hydrocarbon Source Rock Evaluation of the Lucaogou Shale in the Periphery of Bogeda Mountain (SE Junggar Basin, China) and Its Implications for Shale Oil Exploration: Insights from Organic Geochemistry, Petrology, and Kinetics Pyrolysis. Processes 2024, 12, 356. [Google Scholar] [CrossRef]
  43. Marshall, J.E.A. Quantitative Spore Colour. J. Geol. Soc. 1991, 148, 223–233. [Google Scholar] [CrossRef]
  44. Hakimi, M.H.; Al-Matary, A.M.; Hersi, O.S. Late Jurassic Bituminous Shales from Marib Oilfields in the Sabatayn Basin (NW Yemen): Geochemical and Petrological Analyses Reveal Oil-Shale Resource. Fuel 2018, 232, 530–542. [Google Scholar] [CrossRef]
  45. Bray, E.E.; Evans, E.D. Distribution of N-Paraffins as a Clue to Recognition of Source Beds. Geochim. Cosmochim. Acta 1961, 22, 2–15. [Google Scholar] [CrossRef]
  46. Radke, M.; Welte, D.H.; Willsch, H. Maturity Parameters Based on Aromatic Hydrocarbons: Influence of the Organic Matter Type. Org. Geochem. 1986, 10, 51–63. [Google Scholar] [CrossRef]
  47. He, S.; Middleton, M. Heat Flow and Thermal Maturity Modelling in the Northern Carnarvon Basin, North West Shelf, Australia. Mar. Pet. Geol. 2002, 19, 1073–1088. [Google Scholar] [CrossRef]
  48. Hakimi, M.H.; Alaug, A.S.; Kahal, A.Y.; Rahim, A.; Radwan, A.E.; Qadri, S.M.T.; Khan, W. Organic Matter Characteristics and Gas Generation Prospect of the Late Cretaceous Fluvial Deltaic Organic-rich Shale in the Offshore Jiza-Qamar Basin, Yemen Based on Organic Geochemical, Macerals Composition, and Biomarker Results Combined with 1-D Basin Modelling. Geol. J. 2023, 58, 4035–4056. [Google Scholar] [CrossRef]
  49. Cheng, M.; Li, C.; Yin, J.; Wang, P.; Hu, C.; Yu, Y.; Lei, Y.; Zhang, L. Modeling of Burial History, Source Rock Maturity, and Hydrocarbon Generation of Marine-Continental Transitional Shale of the Permian Shanxi Formation, Southeastern Ordos Basin. ACS Omega 2024, 9, 20532–20546. [Google Scholar] [CrossRef]
  50. Pang, Y.; Guo, X.; Shi, B.; Zhang, X.; Cai, L.; Han, Z.; Chang, X.; Xiao, G. Hydrocarbon Generation Evaluation, Burial History, and Thermal Maturity of the Lower Triassic–Silurian Organic-Rich Sedimentary Rocks in the Central Uplift of the South Yellow Sea Basin, East Asia. Energy Fuels 2020, 34, 4565–4578. [Google Scholar] [CrossRef]
  51. Ren, Z.; Cui, J.; Qi, K.; Yang, G.; Chen, Z.; Yang, P.; Wang, K. Control Effects of Temperature and Thermal Evolution History of Deep and Ultra-Deep Layers on Hydrocarbon Phase State and Hydrocarbon Generation History. Nat. Gas Ind. B 2020, 7, 453–461. [Google Scholar] [CrossRef]
  52. Peshkov, G.A.; Chekhonin, E.M.; Rüpke, L.H.; Musikhin, K.A.; Bogdanov, O.A.; Myasnikov, A.V. Impact of Differing Heat Flow Solutions on Hydrocarbon Generation Predictions: A Case Study from West Siberian Basin. Mar. Pet. Geol. 2021, 124, 104807. [Google Scholar] [CrossRef]
  53. Craig, J.; Rizzi, C.; Said, F.; Thusu, B.; Luning, S.; Asbali, A.I.; Keeley, M.L.; Bell, J.F.; Durham, M.J.; Eales, M.H. Structural Styles and Prospectivity in the Precambrian and Palaeozoic Hydrocarbon Systems of North Africa. Geol. East Libya 2008, 4, 51–122. [Google Scholar]
  54. Adeoye, J.A.; Akande, S.O.; Adekeye, O.A.; Sonibare, W.A.; Ondrak, R.; Dominik, W.; Erdtmann, B.D.; Neeka, J. Source Rock Maturity and Petroleum Generation in the Dahomey Basin SW Nigeria: Insights from Geologic and Geochemical Modelling. J. Pet. Sci. Eng. 2020, 195, 107844. [Google Scholar] [CrossRef]
  55. Elhossainy, M.M.; El-Shafeiy, M.; Al-Areeq, N.M.; Hamdy, D. Petroleum Generation Modelling of the Middle-Late Cretaceous Sediments in the Abu Gharadig Field, Northwestern Desert, Egypt. Geol. J. 2022, 57, 3851–3880. [Google Scholar] [CrossRef]
  56. Reda, M.; Abdel-Fattah, M.I.; Fathy, M.; Bakr, A. Integrated Analysis of Source Rock Evaluation and Basin Modelling in the Abu Gharadig Basin, Western Desert, Egypt: Insights from Pyrolysis Data, Burial History, and Trap Characteristics. Geol. J. 2024, 59, 1416–1443. [Google Scholar] [CrossRef]
  57. Jarvie, D.M. Shale Resource Systems for Oil and Gas: Part 2—Shale-Oil Resource Systems. In Shale Reservoirs—Giant Resources for the 21st Century; American Association of Petroleum Geologists: Tulsa, OK, USA, 2012; pp. 89–119. [Google Scholar]
  58. Hackley, P.C.; Ryder, R.T. Organic Geochemistry and Petrology of Devonian Shale in Eastern Ohio: Implications for Petroleum Systems Assessment. AAPG Bull. 2021, 105, 543–573. [Google Scholar] [CrossRef]
  59. El-Said, M.M.; Abd-Allah, A.M.A.; Abdel-Aal, M.H.; Hakimi, M.H.; Lashin, A.A.; Abd-El-Naby, A. Geochemistry of Liquid Hydrocarbons and Natural Gases Combined with 1D Basin Modeling of the Oligocene Shale Source Rock System in the Offshore Nile Delta, Egypt. ACS Omega 2024, 9, 11780–11805. [Google Scholar] [CrossRef] [PubMed]
  60. Dahl, B.; Bojesen-Koefoed, J.; Holm, A.; Justwan, H.; Rasmussen, E.; Thomsen, E. A New Approach to Interpreting Rock-Eval S2 and TOC Data for Kerogen Quality Assessment. Org. Geochem. 2004, 35, 1461–1477. [Google Scholar] [CrossRef]
  61. Huo, Z.; Pang, X.; Chen, J.; Zhang, J.; Song, M.; Guo, K.; Li, P.; Li, W.; Liang, Y. Carbonate Source Rock with Low Total Organic Carbon Content and High Maturity as Effective Source Rock in China: A Review. J. Asian Earth Sci. 2019, 176, 8–26. [Google Scholar] [CrossRef]
  62. Hunt, J.M. Petroleum Geochemistry and Geology (Textbook), 2nd ed.; WH Freeman Company: New York, NY, USA, 1995. [Google Scholar]
  63. Makeen, Y.M.; Hakimi, M.H.; Abdullah, W.H.; Mustapha, K.A.; Hassan, M.H.A.; Shushan, I.E.; Garba, T.E.; Abujaish, Y.A.; Lashin, A.A. Basin Modelling and Bulk Kinetics of Heterogeneous Organic-Rich Nyalau Formation Sediments of the Sarawak Basin, Malaysia. J. Pet. Sci. Eng. 2020, 195, 107595. [Google Scholar] [CrossRef]
  64. Al-Hajeri, M.; Sauerer, B.; Furmann, A.; Amer, A.; Al-Khamiss, A.; Abdallah, W. Organic Petrography and Geochemistry of the Prolific Source Rocks from the Jurassic Najmah and Cretaceous Makhul Formations in Kuwait—Validation and Expansion of Raman Spectroscopic Thermal Maturity Applications. Int. J. Coal Geol. 2021, 236, 103654. [Google Scholar] [CrossRef]
  65. Sayid, M.A.; Yao, Z.-G.; Li, R.; Saif, M.M.A. Hydrocarbon Generation and Retention Potential of Chang 7 Organic-Rich Shale in the Ordos Basin, China. Pet. Geosci. 2023, 29, petgeo2022-008. [Google Scholar] [CrossRef]
  66. Ahmad, S.; Ahmad, F.; Raza, S.; Khan, S.; Wadood, B.; Mohibullah, M. Litho- and Biostratigraphy and Hydrocarbon Source-Rock Potential of the Jurassic–Paleogene Strata in the Kala Chitta Range, Northwestern Himalayas, Pakistan. Pet. Geosci. 2024, 30, petgeo2022-075. [Google Scholar] [CrossRef]
  67. Hakimi, M.H.; Abdullah, W.H.; Mohialdeen, I.M.J.; Makeen, Y.M.; Mustapha, K.A. Petroleum Generation Characteristics of Heterogeneous Source Rock from Chia Gara Formation in the Kurdistan Region, Northern Iraq as Inferred by Bulk and Quantitative Pyrolysis Techniques. Mar. Pet. Geol. 2016, 71, 260–270. [Google Scholar] [CrossRef]
  68. Langford, F.F.; Blanc-Valleron, M.-M. Interpreting Rock-Eval Pyrolysis Data Using Graphs of Pyrolizable Hydrocarbons vs. Total Organic Carbon (1). AAPG Bull. 1990, 74, 799–804. [Google Scholar]
  69. Dow, D.D. Literature Review of Organic Matter Transport from Marshes; NASA: Washington, DC, USA, 1982. [Google Scholar]
  70. Tyson, R.V. Abundance of Organic Matter in Sediments: TOC, Hydrodynamic Equivalence, Dilution and Flux Effects. In Sedimentary Organic Matter; Springer: Dordrecht, The Netherlands, 1995; pp. 81–118. ISBN 978-94-010-4318-2. [Google Scholar]
  71. Waples, D.W.; Machihara, T. Biomarkers as Organic-Facies Indicators: Chapter 5. In Biomarkers for Geologists—A Practical Guide to the Application of Steranes and Triterpanes in Petroleum Geology; AAPG Special Volumes; American Association of Petroleum Geologists: Tulsa, OK, USA, 1991; Volume 36, pp. 41–61. [Google Scholar]
  72. Hadad, Y.T.; Hakimi, M.H.; Abdullah, W.H.; Kinawy, M.; El Mahdy, O.; Lashin, A. Organic Geochemical Characteristics of Zeit Source Rock from Red Sea Basin and Their Contribution to Organic Matter Enrichment and Hydrocarbon Generation Potential. J. Afr. Earth Sci. 2021, 177, 104151. [Google Scholar] [CrossRef]
  73. Tissot, B.; Deroo, G.; Hood, A. Geochemical Study of the Uinta Basin: Formation of Petroleum from the Green River Formation. Geochim. et Cosmochim. Acta 1978, 42, 1469–1485. [Google Scholar] [CrossRef]
  74. Murray, A.P.; Boreham, C.J. Organic Geochemistry in Petroleum Exploration; Australian Geological Survey Organization: Canberra, Australia, 1992; Volume 230. [Google Scholar]
  75. Didyk, B.M.; Simoneit, B.R.T.; Brassell, S.C.; Eglinton, G. Organic Geochemical Indicators of Palaeoenvironmental Conditions of Sedimentation. Nature 1978, 272, 216–222. [Google Scholar] [CrossRef]
  76. Al-Khafaji, A.J.; Hakimi, M.H.; Mohialdeen, I.M.J.; Idan, R.M.; Afify, W.E.; Lashin, A.A. Geochemical Characteristics of Crude Oils and Basin Modelling of the Probable Source Rocks in the Southern Mesopotamian Basin, South Iraq. J. Pet. Sci. Eng. 2021, 196, 107641. [Google Scholar] [CrossRef]
  77. Erdenetsogt, B.-O.; Hong, S.K.; Choi, J.; Lee, I. Depositional Environment and Petroleum Source Rock Potential of Mesozoic Lacustrine Sedimentary Rocks in Central Mongolia. Mar. Pet. Geol. 2022, 140, 105646. [Google Scholar] [CrossRef]
  78. Huang, W.-Y.; Meinschein, W.G. Sterols as Ecological Indicators. Geochim. Cosmochim. Acta 1979, 43, 739–745. [Google Scholar] [CrossRef]
  79. Marynowski, L.; Narkiewicz, M.; Grelowski, C. Biomarkers as Environmental Indicators in a Carbonate Complex, Example from the Middle to Upper Devonian, Holy Cross Mountains, Poland. Sediment. Geol. 2000, 137, 187–212. [Google Scholar] [CrossRef]
  80. Hakimi, M.H.; Abas, A.N.; Hadad, Y.T.; Al Faifi, H.J.; Kinawy, M.; Lashin, A. Bulk Pyrolysis and Biomarker Fingerprints of Late Cretaceous Galhak Shale Formation in the Northern Melut Basin, Sudan: Implications on Lacustrine Oil-Source Rock. Arab. J. Geosci. 2021, 14, 520. [Google Scholar] [CrossRef]
  81. Khairy, A.; El Diasty, W.S.; Uguna, C.N.; Peters, K.E.; Vane, C.H.; Snape, C.E.; Meredith, W. Geochemical Assessment and Hydrocarbon Potential of Oligocene–Pliocene Source Rocks from Northeast Onshore Nile Delta, Egypt. Int. J. Coal Geol. 2023, 274, 104283. [Google Scholar] [CrossRef]
  82. Gürgey, K. Geochemical Characteristics and Thermal Maturity of Oils from the Thrace Basin (Western Turkey) and Western Turkmenistan. J. Pet. Geol. 1999, 22, 167–189. [Google Scholar] [CrossRef]
  83. Barham, A.; Ismail, M.S.; Hermana, M.; Abidin, N.Z. Biomarker Characteristics of Montney Source Rock, British Columbia, Canada. Heliyon 2021, 7, e08395. [Google Scholar] [CrossRef]
  84. Lashin, A.; Hakimi, M.H.; AlGhamdi, F.; Amao, A.M.; AlQuraishi, A.; Fattah, K.A.; Laboun, A.B. Elemental Geochemistry and Biomarker Measurements of the Silurian Shale of Qusaiba Formation, Tayma Area, Northwestern Saudi Arabia: Implication for Organic Matter Input and Paleoenvironmental Conditions. Minerals 2023, 13, 468. [Google Scholar] [CrossRef]
  85. Shanmugam, G. Significance of Coniferous Rain Forests and Related Organic Matter in Generating Commercial Quantities of Oil, Gippsland Basin, Australia. AAPG Bull. 1985, 69, 1241–1254. [Google Scholar] [CrossRef]
  86. Moldowan, J.M.; Seifert, W.K.; Gallegos, E.J. Relationship between Petroleum Composition and Depositional Environment of Petroleum Source Rocks. AAPG Bull. 1985, 69, 1255–1268. [Google Scholar]
  87. Ten Haven, H.L.; Rullkötter, J.; Welte, D.H. Steroid Biological Marker Hydrocarbons as Indicators of Organic Matter Diagenesis in Deep Sea Sediments: Geochemical Reactions and Influence of Different Heat Flow Regimes. Geol. Rundsch. 1989, 78, 841–850. [Google Scholar] [CrossRef]
  88. Mansurbeg, H.; Mohialdeen, I.; Al-Juboury, A.; Salih, N.; Alsuwaidi, M.; Shahrokhi, S.; Al-Aasm, I.; Mahmmud, R.; Permanyer, A. Meteoric Water Incursion, Crude Oil Degradation and Calcite Cementation of an Upper Cretaceous Reservoir in the Zagros Foreland Basin (Kurdistan Region of Iraq). Water 2023, 15, 1953. [Google Scholar] [CrossRef]
  89. Mohammad, N.; Khamada, N.; Abdullah, A.; Al-Tarboush, A.R. Lithostratigraphy and Geological Evolution of Triassic Rocks in the Palmyride Basin in Syria. News Ural State Min. Univ. 2023, 2, 7–17. [Google Scholar] [CrossRef]
  90. Leila, M.; Radwan, A.A.; Abdel-Fattah, M.I. Lithofacies Controls on Hydrocarbon Generation Potentiality of the Syn-Rift Late Cretaceous Rakopi Deltaic Facies in the North-Eastern Offshore Part of Taranaki Basin, New Zealand. Minerals 2023, 13, 1169. [Google Scholar] [CrossRef]
  91. Wang, X.; Liu, G.; Song, Z.; Sun, M.; Wang, X.; Wang, F.; Chen, R.; Geng, M.; Li, Y. Paleoenvironmental Characteristics of Paleogene Lacustrine Source Rocks in the Western Bozhong Sag, Bohai Bay Basin, China: Evidence from Biomarkers, Major and Trace Elements. Acta Geol. Sin. 2023, 98, 220–240. [Google Scholar] [CrossRef]
  92. Abubakar, R.; Adomako-Ansah, K.; Marfo, S.A.; Fenyi, C.; Owusu, J.A. Integrated Geochemical and Statistical Evaluation of the Source Rock Potential in the Deep-Water, Western Basin of Ghana. J. Pet. Sci. Eng. 2023, 220, 111164. [Google Scholar] [CrossRef]
  93. Malki, M.L.; Rasouli, V.; Mehana, M.; Mellal, I.; Saberi, M.R.; Sennaoui, B.; Chellal, H.A. The Impact of Thermal Maturity on the Organic-Rich Shales Properties: A Case Study in Bakken. In Proceedings of the SPE/AAPG/SEG Unconventional Resources Technology Conference (URTEC), Denver, CO, USA, 13–15 June 2023; p. D031S054R003. [Google Scholar]
  94. Lotfy, N.M.; Farouk, S.; Hakimi, M.H.; Ahmad, F.; El Shennawy, T.; El Nady, M.M.; Salama, A.; Shehata, A.M. Biomarker and Isotopic Characteristics of Miocene Condensates and Natural Gases, West Delta Deep Marine Concession, Eastern Mediterranean, Egypt. Sci. Rep. 2024, 14, 235. [Google Scholar] [CrossRef]
  95. Dow, W.G. Kerogen Studies and Geological Interpretations. J. Geochem. Explor. 1977, 7, 79–99. [Google Scholar] [CrossRef]
  96. Batten, D.J. Palynofacies, Organic Maturation and Source Potential for Petroleum. In Organic Maturation Studies and Fossil Fuel Exploration; Academic Press: London, UK, 1981. [Google Scholar]
  97. Batten, D.J. Palynofacies, Palaeoenvironments and Petroleum. J. Micropalaeontol. 1982, 1, 107–114. [Google Scholar] [CrossRef]
  98. Welte, D.H.; Horsfield, B.; Baker, D.R. Petroleum and Basin Evolution: Insights from Petroleum Geochemistry, Geology and Basin Modeling; Springer Science & Business Media: Berlin/Heidelberg, Germany, 2012. [Google Scholar]
  99. Peters, K.E.; Moldowan, J.M. The Biomarker Guide: Interpreting Molecular Fossils in Petroleum and Ancient Sediments; Prentice Hall: Englewood Cliffs, NJ, USA, 1993. [Google Scholar]
  100. Tissot, B.P.; Welte, D.H. Petroleum Formation and Occurrence; Springer Science & Business Media: Berlin/Heidelberg, Germany, 2013. [Google Scholar]
  101. Saeed, S.A.; Hakimi, M.H.; Al-Muntaser, A.A.; Khamieva, A.N.; Varfolomeev, M.A.; Morozov, V.P.; Lashin, A.; Abdelaal, M.A.; Suwaid, M.A.; Mustapha, K.A. Geochemical, Mineralogical and Petrographical Characteristics of the Domanik Formation from North Samara Region in the Volga-Ural Basin, Russia: Implication for Unconventional Tight Oil Reservoir Potential. J. Pet. Sci. Eng. 2023, 220, 111240. [Google Scholar] [CrossRef]
  102. Elmaadawy, K.G.; Bayan, M.F.; Gad, M.; Sz\Hucs, P.; Eid, M.H.; Abukhadra, M.R.; El-Sherbeeny, A.M.; Bellucci, S.; Abdelmaksoud, A.S. The Impact of Oligo-Miocene Basaltic Intrusions on the Petroleum System in Gulf of Suez Rift Basin, Egypt: New Insights into Thermal Maturity and Reservoir Quality. Front. Earth Sci. 2024, 11, 1295271. [Google Scholar] [CrossRef]
  103. Alsharhan, A.S.; Kendall, C.G.S.C. Precambrian to Jurassic Rocks of Arabian Gulf and Adjacent Areas: Their Facies, Depositional Setting, and Hydrocarbon Habitat1. AAPG Bull. 1986, 70, 977–1002. [Google Scholar] [CrossRef]
  104. Barrier, E.; Machhour, L.; Blaizot, M. Petroleum Systems of Syria. In Petroleum Systems of the Tethyan Region; American Association of Petroleum Geologists: Tulsa, OK, USA, 2014; pp. 335–378. [Google Scholar]
  105. Mouty, M.; Gout, C. Overview of the Triassic System in Syria: Lithostratigraphic and Biostratigraphic Correlations with Neighboring Areas. GeoArabia 2010, 15, 95–114. [Google Scholar] [CrossRef]
  106. May, P.R. The Eastern Mediterranean Mesozoic Basin: Evolution and Oil Habitat. AAPG Bull. 1991, 75, 1215–1232. [Google Scholar]
  107. Sagy, Y.; Gvirtzman, Z. Interplay between Early Rifting, Later Folding, and Sedimentary Filling of a Long-Lived Tethys Remnant: The Levant Basin. Earth-Sci. Rev. 2024, 252, 104768. [Google Scholar] [CrossRef]
  108. Alsharhan, A.S. Petroleum Systems in the Middle East. Geol. Soc. Lond. Spec. Publ. 2014, 392, 361–408. [Google Scholar] [CrossRef]
  109. Jamal, M.; Bizra, Y.; Caron, C. Palaeogeography and Hydrocarbon Habitat of the Triassic Series in Syria. Comptes Rendus L’académie Sci.-Ser. IIA-Earth Planet. Sci. 2000, 331, 133–139. [Google Scholar] [CrossRef]
  110. Vulama, I. Source Rock Potential and Petroleum Systems of the Triassic and Paleozoic Successions of the Hayan Block, Central Syrian Palmyrides. AAPG Bull. 2011, 10, p10000. [Google Scholar]
  111. Medici, G.; Ling, F.; Shang, J. Review of Discrete Fracture Network Characterization for Geothermal Energy Extraction. Front. Earth Sci. 2023, 11, 1328397. [Google Scholar] [CrossRef]
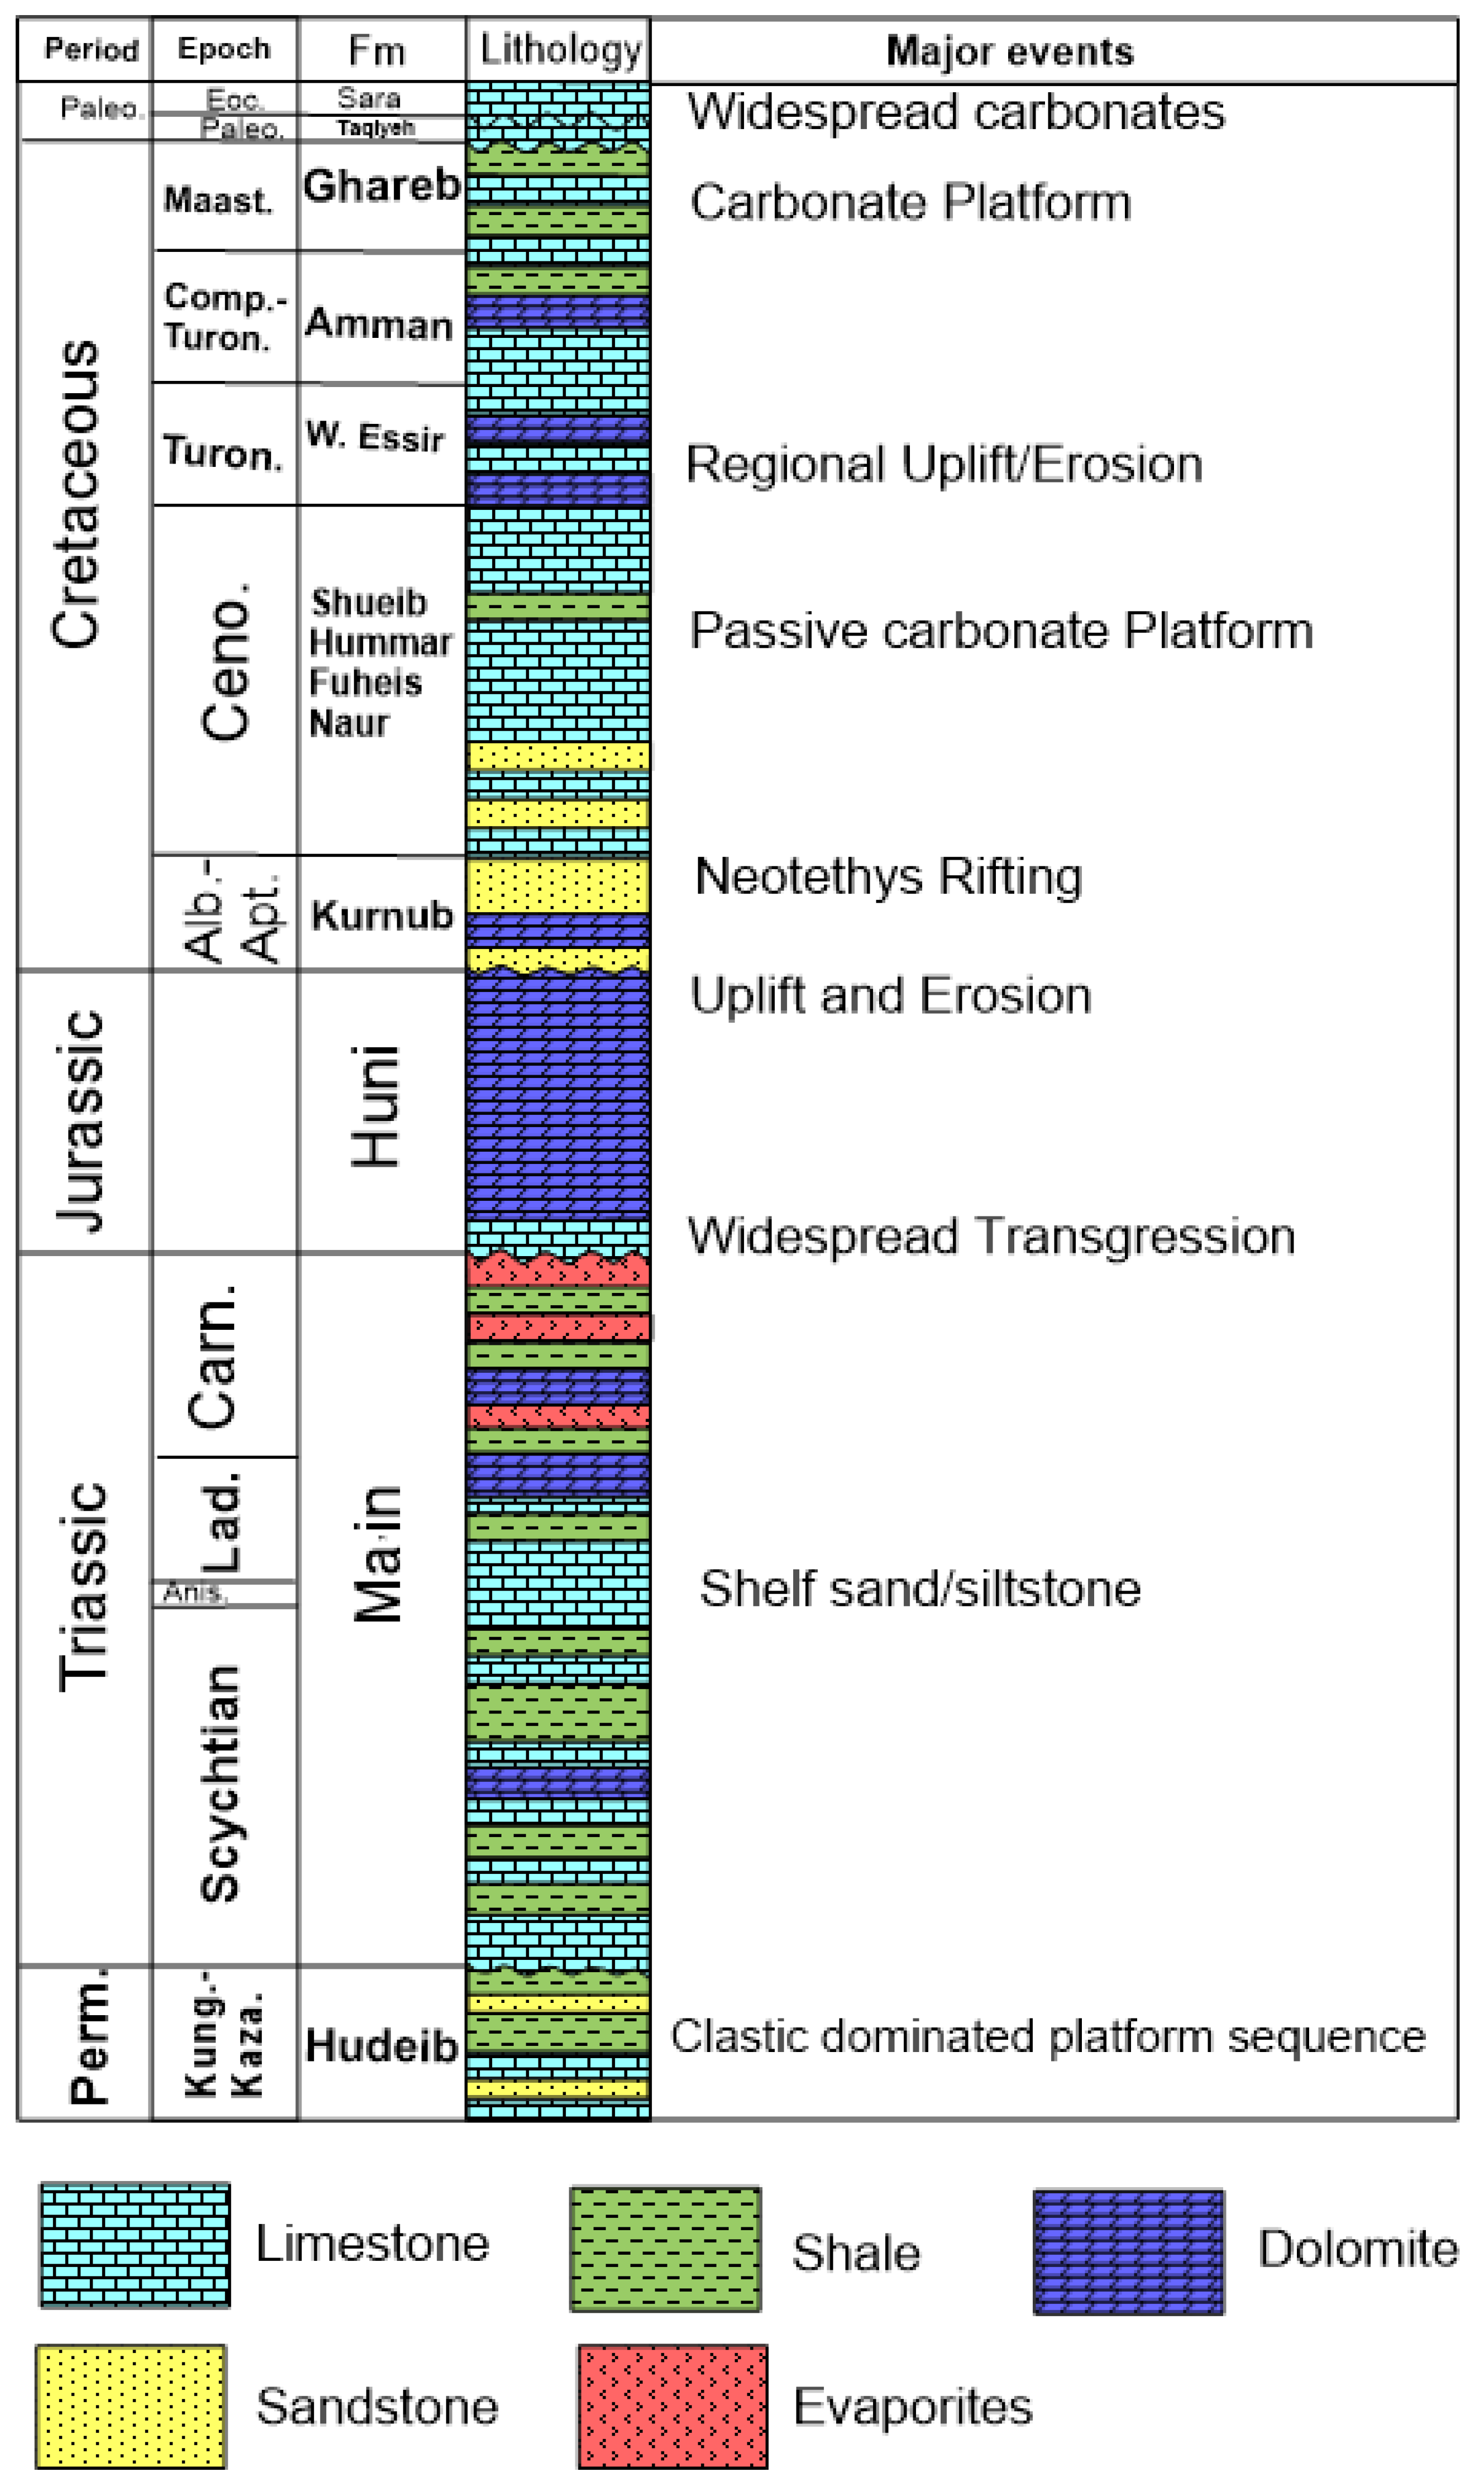
Figure 3. Stratigraphic section of the Northern Highlands area (based on geological reports on the studied wells).
Minerals 14 00863 g003
Figure 4. A representative biomarker sample distribution (NH-2 well, 2423 m) for the chromatograms: m/z = 99, n-alkanes (A); m/z = 191, triterpanes (B); m/z = 217, αα steranes (C); m/z = 218, ββ steranes (D); m/z = 231, triaromatic steranes (E); m/z = 178, phenanthtrene (F); and m/z = 192, methylphenanthrene (G).
Minerals 14 00863 g004
Figure 5. Thermal model based on calibrating BHT (A) and Ro% (B) measurements and a burial model (C) of the NH-1 well, Northern Highlands area, NW Jordan.
Minerals 14 00863 g005
Figure 6. Thermal model based on calibrating BHT (A) and Ro% (B) measurements and a burial model (C) of the NH-2 well, Northern Highlands area, NW Jordan.
Minerals 14 00863 g006
Figure 7. TOC versus depth (A) and TOC versus S2 (B) cross plots show the generative potential of the Permian to Jurassic strata in the studided wells.
Minerals 14 00863 g007
Figure 8. TOC and S1 cross plot distinguishing indigenous and non-indigenous hydrocarbons.
Minerals 14 00863 g008
Figure 9. Cross plots of HI against Tmax and S2 against TOC% ((A,B), respectively) delineating the kerogen type in the studied strata [68].
Minerals 14 00863 g009
Figure 10. Ternary diagram showing the identified relative kerogen assemblages and potential types of generated hydrocarbons in the studied Permian to Jurassic samples in the Northern Highlands area (after [69,70]).
Minerals 14 00863 g010
Figure 11. Cross plotting of Ph/n-C18 and Pr/n-C17 to predict the organic matter input and depositional conditions [85].
Minerals 14 00863 g011
Figure 12. Sterane ternary diagram showing the organic matter source by cross plotting relative percentages of C27, C28, and C29 αββ steranes (modified after [78]).
Minerals 14 00863 g012
Figure 13. PI versus Tmax cross plot shows the thermal maturity level of the Permian to Jurassic strata.
Minerals 14 00863 g013
Figure 14. Ternary plot showing the thermal maturity (A) and gross composition of oils (B) by cross plotting saturates, aromatics, and polar compounds.
Minerals 14 00863 g014
Figure 15. Cross plot of C29 20S/(20S + 20R) sterane versus C32 22S/(22S + 22R) homohopane showing the thermal maturity level of the Upper Triassic oils and Jurassic core sample (modified after [99]).
Minerals 14 00863 g015
Figure 16. Evoluted transformation ratio of kerogen of the Upper Triassic strata in the NH-1 well (A) and the NH-2 well (B), Northern Highlands area, NW Jordan.
Minerals 14 00863 g016
Table 1. Datasets of the TOC and Rock-Eval pyrolysis results of the studied samples from the Permian to Jurassic strata, Northern Highlands area. * indicates unreliable Tmax values.
Well AgeSample TypeLithologyDepth (m)TOC (wt%)S1 (mg HC/g Rock)S2 (mg HC/g Rock)HI (mg HC/g TOC)PITmax (°C)
AJ-1JurassicCuttingsArgillaceous limestone10600.010.070.40 0.14421
CuttingsArgillaceous limestone10800.660.040.28 0.14415
CuttingsArgillaceous limestone11100.10.070.42 0.14412
CuttingsArgillaceous limestone11600.110.030.16 0.16412
CuttingsArgillaceous limestone11800.90.070.43 0.15412
CuttingsArgillaceous limestone11900.130.020.22 0.07418
CuttingsArgillaceous limestone12001.010.120.59 0.17304 *
CuttingsShale12201.620.232.191350.10359 *
Upper Triassic (Carnian)CuttingsArgillaceous limestone15460.28
CuttingsArgillaceous limestone15500.33
Permian (Kazanian– Kungarian)CuttingsShale24221.190.050.25210.17
CuttingsSilty shale24701.110.110.55500.17378 *
NH-1Upper Triassic (Carnian)CuttingsDolomitic limestone6830.35
CuttingsDolomitic limestone660.50.1
NH-2JurassicCuttingsDolomite1562.50.27
CuttingsDolomite1582.50.870.51.71950.26440
CuttingsDolomite1596.80.120.10.32500.25425
CuttingsDolomite1606.50.18
CuttingsDolomite1629.50.170.10.52940.17430
CuttingsDolomite1638.150.090.197.335430.03418
CuttingsDolomite1682.50.31
CuttingsDolomite1921.50.1
CuttingsDolomite1941.50.12
CuttingsLimestone1961.50.08
CuttingsLimestone1981.50.06
Upper Triassic (Carnian)CuttingsLimestone2061.50.19
CuttingsMudstone20710.55
CuttingsCalcareous mudstone2081.50.890.61.21350.33453
CuttingsMudstone2101.50.56
CuttingsSilty mudstone2121.50.991.11.61620.43450
CuttingsSilty mudstone2141.50.760.70.94550.44455
CuttingsSilty mudstone2161.50.871.111150.52460
CuttingsMudstone2181.50.770.611300.38455
CuttingsMudstone2201.50.841.31.31550.5458
CuttingsDolomitic mudstone22431.021.41.61570.48453
CuttingsDolomite2261.50.15
CuttingsArgillaceous limestone2281.50.08
CuttingsDolomite22940.08
CuttingsArgillaceous limestone2301.50.790.70.91140.44448
CoreLimestone2313.70.29
CuttingsDolomitic mudstone2321.50.980.30.4410.43418
CuttingsMudstone23601.11.91.81640.53453
Permian (Kazanian– Kungarian)CoreArgillaceous limestone3291.50.030.10.1
CuttingsMudstone33000.05
CuttingsSilty mudstone33200.05
CuttingsSilty mudstone33401.120.20.1
CuttingsMudstone33580.690.2
CuttingsMudstone34001.20.10.2170.33500
CuttingsSilty mudstone36400.12
Table 2. Maceral composition and thermal alteration indices of the studied Permian to Jurassic samples from the Northern Highlands area.
Well NameFm. NameDepth (m) AOM (%)Liptinite (%)Vitrinite (%)Inertinite (%)TAI Scale (1–7)
AJ-1Jurassic994173038152−
106038253252−
108045311952−
11006521772−
114160271032−
116050261682−
120053202252−
122022304082−
125050252052−
128035451552−
1300453010152−
1320352010352−
Upper Triassic1340402025152−
1380331621302−
140039158382
1420402020203−
1540124731103−
156053549112+
15907256083−
1610273825102
Permian2422.5101851212+
2430181740252+
2440101250282+
245071951232+
247051760183
249052156183
2500222238183
2530192342163
2550133044133
2570142647133
NH-1Upper Triassic620 2060204
NH-2Jurassic1582.5402931 4
Upper Triassic20711594 4
2121.551580 4
224391081 4 to 5
2313.750 455
Permian3340 1511745 to 6
Table 3. Gross oil composition and biomarker indicators (n-alkanes and isoprenoids) of the studied samples showing the depositional environment and thermal maturity level of the studied strata in the Northern Highlands area. Pr: pristane, Ph: phytane, CPI: carbon preference index, CPI = [(n-C19 + n-C21… + n-C31)/(n-C18 + n-C20… + n-C30) + (n-C19 + n-C21… + n-C31/n-C20 + n-C22… + n-C32)]/2.
Well NameAgeSample TypeDepth (m)Saturates (%)Aromatics (%)Polar Compounds (%)Pr/PhPr/n-C17Ph/n-C18CPIPh/n-C17
NH-2Upper TriassicOil 2121.5055.1020.4024.500.9911.081.021.01
Upper TriassicCutting2161.5055.4028.601631.321.511.110.44
Upper TriassicOil2201.505427.6018.4011.211.401.031.21
Upper TriassicCutting22436024.9015.101.20.630.571.020.53
Upper TriassicOil2441.5046.5034.9018.600.910.841.200.990.92
AJ-1PermianCutting2422.54.4379.8815.690.80.340.390.650.43
PermianCutting24304.1281.88140.580.240.311.180.41
PermianCutting244044.3951.404.210.680.350.441.560.51
PermianCutting245028.9459.9611.100.610.550.631.450.90
Table 4. Biomarkers ratios of the studied samples showing the organic matter input, depositional setting, and thermal maturity in the studied samples. Ts: C27 18α(H)-22,29,30-trisnorneohopane, Tm: C27 17α(H)-22,29,30-trisnorhopane, MPI-1 = 1.5(2MP + 3MP)/(PHEN + 1MP + 9MP), RC = 0.6(MPI-1) + 0.4.
Well NameFm. AgeSample TypeDepth (m)αββ SteraneC29 20S/(20S + 20R) SteraneC32 22S/(22S + 22R) HomohopaneTriterpane RatiosMPI-1Rc%Triaromatic Steranes
%C27%C28%C29Ts/TmNorhopane/HopaneC28/(C26 + C27)
NH-2Upper TriassicOil2121.52923480.500.593.600.430.420.651.50
Upper TriassicOil2201.51928530.440.574.500.320.470.681.80
Upper TriassicOil24232725480.520.592.400.520.370.621.40
Table 5. Peak identifications of hopane (m/z = 191; 10B) and sterane (m/z = 217 and m/z = 218; 10C-D) biomarkers in the studied samples.
Peak Identifications for Triterpanes (m/z 191)
Ts18α(H), 21β(H)-22,29,30-trisnorhopane
Tm17α(H), 21β(H)-22,29,30-trisnorhopane
NH17α(H), 21β(H)-30-norhopane
H17α, 21β-hopane
Me17α(H), 21β(H)-homohopane (22S and 22R)
GGammacerane
Et17α(H), 21β(H)-bishomohopane (22S and 22R)
Pr17α(H), 21β(H)-trishomohopane (22S and 22R)
Bu17α(H), 21β(H)-tetrakishhomohopane (22S and 22R)
Peak Identifications for Steranes (m/z 217)
A13β, 17α-diacholestane (20S)
B13β, 17α-diacholestane (20R)
C13β, 17α-24-methyl diacholestane (20S)
D13β, 17α-24-methyl diacholestane (20R)
E13β, 17α-24-ethyl diacholestane (20R)
F5α, 14α, 17α cholestane (20S)
G5α, 14α, 17α cholestane (20R)
H5α, 14α, 17α methyl cholestane (20S)
I5α, 14α, 17α-24- methyl cholestane (20R)
J5α, 14α, 17α -24-ethyl cholestane (20S)
K5α, 14α, 17α -24-ethyl cholestane (20R)
Peak Identifications for Steranes (m/z 218)
A5α, 14β, 17β cholestane (20R)
B5α, 14β, 17β cholestane (20S)
C5α, 14β, 17β-24-methyl cholestane (20R)
D5α, 14β, 17β-24-methyl cholestane (20S)
E5α, 14β, 17β -24-ethyl cholestane (20R)
F5α, 14β, 17β -24-ethyl cholestane (20S)
Table 6. Ro% and BHT measurements used for evaluating the thermal maturity phase of the studied strata and calibrating the constructed maturity models.
WellDepth (m)Sample TypeRo%Number of ReadingsStandard DeviationDepth (m)BHT (°C)
NH-1108Cuttings0.3250.1180045
123.5Cuttings0.360.09124258
167.5Cuttings0.4620.07242490
233Cuttings0.6780.06
380Cuttings0.4140.16
425.5Cuttings0.4250.05
482.5Cuttings0.41240.05
505.5Cuttings0.44210.07
555.5Cuttings0.49270.09
583Cuttings0.5940.16
603Cuttings0.6830.23
NH-2241.5Cuttings0.3830.03115057
341.5Cuttings0.2310.002800107
421.5Cuttings0.3570.073500129
500.5Cuttings0.3630.023750135
683Cuttings0.4740.08
924.5Core0.5520.04
1206.35Core0.3920.00
1221.5Cuttings0.5730.02
1322.5Cuttings0.6890.08
1542.5Cuttings0.95200.00
1961.5Cuttings0.710.22
2101.5Cuttings0.9090.30
Table 7. Input data needed for construction of 1D basin modeling of two representative wells: NH-1 and NH-2 wells. sh: shale, ss: sandstone, co: coal, ls: limestone, ig: igneous rock.
NH-1 Well
Fm.Top (m)Bottom (m)Thickness (m)LithologyAgeErosionEroded Thickness (m)
FromToFromTo
Oligocene01010sh1003923150350
Eocene10111ls1005639
Paleocene116049ls100655680652000
Late Cretaceous60347287ls100113100
Early Cretaceous347523176ss71, sh24, co5145113
Jurassic52362097ss100210145
Triassic6201126506sh40, do60250210284250500
Permian112611271sh40, ls40, ig20300298400300500
Cambro-Ordovician112740502923ss71, sh24, ls5540444
NH-2 well
Fm.Top (m)Bottom (m)Thickness (m)LithologyAgeErosionEroded Thickness (m)
FromToFromTo
Oligocene02020sh1003923150350
Eocene20120100ls1005639
Paleocene12015030ls100655680651500
Late Cretaceous15013801230ls100113100
Early Cretaceous13801560180sh30, ls70145113
Jurassic15602071511do100210145
Triassic207132831212sh40, ls60250210270250200
Permian32833575292sh40, ls40, ig203002854003001500
Volcanics35753790215ig100540
Disclaimer/Publisher’s Note: The statements, opinions and data contained in all publications are solely those of the individual author(s) and contributor(s) and not of MDPI and/or the editor(s). MDPI and/or the editor(s) disclaim responsibility for any injury to people or property resulting from any ideas, methods, instructions or products referred to in the content.