Article

Investigating the Influence of Medium Size and Ratio on Grinding Characteristics

1
Jiangxi Provincial Key Laboratory of Low-Carbon Processing and Utilization of Strategic Metal Mineral Resources, Ganzhou 341000, China
2
School of Resources and Environmental Engineering, Jiangxi University of Science and Technology, Ganzhou 341000, China
3
Jiangxi Copper Corporation Limited Dexing Copper Mine, Dexing 334200, China
*
Author to whom correspondence should be addressed.
Minerals 2024, 14(9), 875; https://doi.org/10.3390/min14090875
Submission received: 4 August 2024 / Revised: 24 August 2024 / Accepted: 25 August 2024 / Published: 27 August 2024

Abstract

:
This study explores the effect of steel ball size and proportion on mineral grinding characteristics using Discrete Element Method (DEM) simulations. Based on batch grinding kinetics, this paper analyzes the contact behavior during grinding, discussing particle breakage conditions and critical breakage energy. The results indicate that while increasing the size of the steel balls leads to higher collision energy, the collision probability decreases significantly; the opposite is true for smaller steel balls. Simulation results with different ball size combinations show that increasing the proportion of smaller balls does not significantly change the collision energy but greatly increases the collision probability, providing a basis for optimizing ball size distribution to improve grinding performance. Furthermore, appropriately increasing the proportion of smaller balls can reduce fluctuations in grinding energy consumption, thereby enhancing collision energy and collision probability while reducing energy costs. Liner wear results demonstrate that larger ball sizes increase liner wear, but different ball size combinations can effectively distribute the forces on the liner, reducing wear.

1. Introduction

In the mineral processing process, grinding is an operation performed in mechanical equipment, where the ore is further reduced in size by the impact and abrasion of media as well as the ore itself until it is ground into qualified particles [1].
Grinding media plays a crucial role in the energy transfer during the mineral particle size reduction process [2]. The energy carried by these media, along with its distribution and conversion, significantly impacts the mill’s production capacity, grinding efficiency, and final particle size of the product [3]. The size, shape, ratio, and filling rate of the grinding media are key factors that directly affect this energy transfer process and can be easily adjusted to optimize performance [4,5,6,7]. Yin et al. found that the breakage probability of particles is sensitive to both impact energy and particle size in their drop-ball experimental setup for single and multi-layer particle impact experiments [8]. Qian et al. conducted experiments, and their results demonstrated that the grinding characteristics of cement clinker conform to a first-order grinding kinetic model when using either balls or cylinders [9]. However, it was observed that the specific breakage rate of cylinders is higher than that of balls [10]. Li et al. conducted experiments on grinding mills of various sizes, operating under different media loads and rotational speeds [11]. During their research, they identified the breaking energy that is characterized by the damping energy on the grinding particles. Additionally, they put forward two scale-up models to predict power consumption and grinding rate. Therefore, in the grinding process, fine-tuning the grinding media system stands as an essential approach to achieving highly efficient grinding operations [12,13,14].
Despite the substantial influence exerted by the grinding media system on the grinding process, effective monitoring of its internal particle system is impeded by its enclosed nature. However, the gradual adoption of the Discrete Element Method (DEM) is addressing this constraint [15]. Initially proposed by Cundall and Strack, this method employs Newton’s motion equations to forecast individual particle trajectories via numerical integration and Euler’s laws, enabling critical data acquisition regarding particle velocity and position. Especially, EDEM has found successful application as commercial software in grinding processes [16], providing adaptability for adjusting individual particle properties such as density, particle size, Poisson’s ratio, Young’s modulus, and elastic coefficients. This allows for simulating and calculating mill operations under diverse conditions. As a result, numerous comprehensive simulations have been carried out, and endeavors are being made to investigate various mechanisms within the grinding process.
Through DEM simulations of tumbling ball mills, Iwasaki et al. observed that collision energy distributions remained consistent across different mill sizes and rotation speeds, provided the Froude number was kept constant, highlighting the influence of this dimensionless parameter on grinding dynamics [17]. In contrast, Capece et al. identified damping energy as a more appropriate parameter for characterizing particle breakage, suggesting that energy dissipation mechanisms play a crucial role in determining breakage efficiency [18]. Stoimenov et al., also using DEM simulations, offered detailed insights into the particle and ball dynamics within the mill. They found a strong correlation between particle radius and interaction frequency, with larger particles experiencing more frequent contact with the grinding media [19]. Additionally, Kim et al. optimized both the simulation accuracy and computational time by fine-tuning the ratio of ball-to-powder diameter and altering the shape of powder particles, leading to enhanced grinding efficiency in their simulations [20].
However, previous studies have several key limitations. Firstly, they commonly neglect the impact of media size distribution on grinding efficiency, a vital parameter in real-world applications. Secondly, while previous studies have analyzed the distribution and behavior of media and minerals in different regions, they typically use a single media size without considering variations in media size distribution. Thirdly, grinding energy consumption accounts for a substantial proportion of production costs, with media directly impacting the mill load. Thus, it is critical to investigate whether differences in media size distribution affect grinding energy consumption. Therefore, this paper investigates the grinding effects of steel balls of different sizes on minerals of varying particle sizes to study the impact of ball size distribution on both single-grade and multi-grade minerals. Based on the results obtained from DEM simulations, the interaction between steel balls and minerals is analyzed. Furthermore, the study explores the impact of optimizing the size and distribution strategy of the steel balls.

2. Discrete Element Method

2.1. Particle Motion Equations

The Discrete Element Method (DEM) utilizes models for normal and tangential vibrations as well as rolling and sliding to assess complex behaviors in micro-scale systems. The model’s characteristic parameters are derived from the physical parameters of individual particles. Using the relative displacement between particles i and j during the calculation time step, the contact force is decomposed into normal and tangential components, which are solved independently to compute the contact force between particles [21].
According to Newton’s second law and the relationship between force and displacement, the equations of particle force and motion can be derived as follows:
m i d v i d t = m i g + j = 1 n i F c , n , i j + F c , t , i j
I i d w i d t = i = 1 n i T c , i j + T r , n , i j + T r , t , i j
where m i and I i represent the mass and rotational inertia of particle i , v i and w i represent the translational velocity and angular velocity of particle i , F c , n , i j and F c , t , i j represent the normal and tangential contact forces between particle i and particle ( j or wall j ), T c , i j , T r , n , i j , and T r , t , i j represent the contact torque, normal rolling torque, and tangential rolling torque between particle i and particle j (or wall j ), n i is the total number of particles or walls in contact with particle i , and g is the acceleration due to gravity.

2.2. Contact Model

This study employs the Hertz–Mindlin (no-slip) model, which is based on Mindlin’s research and represents the fundamental contact model between particles. The Hertz–Mindlin (no-slip) model is applicable in conventional granular materials and provides a suitable framework for addressing contact problems. In this model, particles are considered spherical in three dimensions, and vibration motion equations are commonly used to simulate contact interactions between particles and boundaries or between particles themselves [22].
The ball mill liner wear is addressed via the Hertz–Mindlin with Archard Wear model, which considers the contact model between particles and geometric bodies. Determination of the wear constants in this model is based on physical experiments that correspond to the material properties. The calculation model formula is expressed as follows:
Q = K H F n d t
where Q denotes the volume of material wear; dt denotes the frictional displacement; Fn is the normal load applied to the geometric body; H is the material hardness; and K is the wear coefficient. By considering the contact area between particles and geometric bodies, the wear depth can be calculated, allowing for the tracking of wear on both the particles and the geometric bodies. The calculation formula is expressed as follows:
D e p t h = Q A

2.3. Time Step

The time step refers to the fixed time interval between consecutive iterations during the calculation process. It is maintained constant throughout the entire calculation. A time step that is excessively small can lead to a substantial increase in computational workload, thereby reducing computational efficiency. On the other hand, if the time step is too large, it may result in calculation errors.
At time t, two particles are in relative motion and have not yet come into contact. They are approaching each other at a constant velocity. However, if the time step is too large, the calculation may show that the particles overlap at time t with a significant distance. As a result, an excessively large contact force is calculated, leading to erroneous velocities for the particles at the next time step, t. Once these particles separate, they will collide with other particles based on this wrong velocity, leading to an increasing number of calculation errors. To determine an appropriate time step size, the Rayleigh wave method is commonly used [23].
The Rayleigh time step is the time required for shear waves to propagate through solid particles without being transmitted to other particles. Its calculation expression is as follows:
T R = π R ρ G 1 / 2 0.1631 σ + 0.8766 1
In this study, the simulation time step is set to be 20% of the Rayleigh time step. The necessity to track particle collisions results in substantial memory consumption. Consequently, the simulation time for this study is established as 4.73 × 10⁻⁶ s. In the equation, R denotes the radius of the smaller particle among the two particles in contact, while p, G, and σ, respectively, represent the particle density, shear modulus, and Poisson’s ratio.

3. Research Process and Methodology

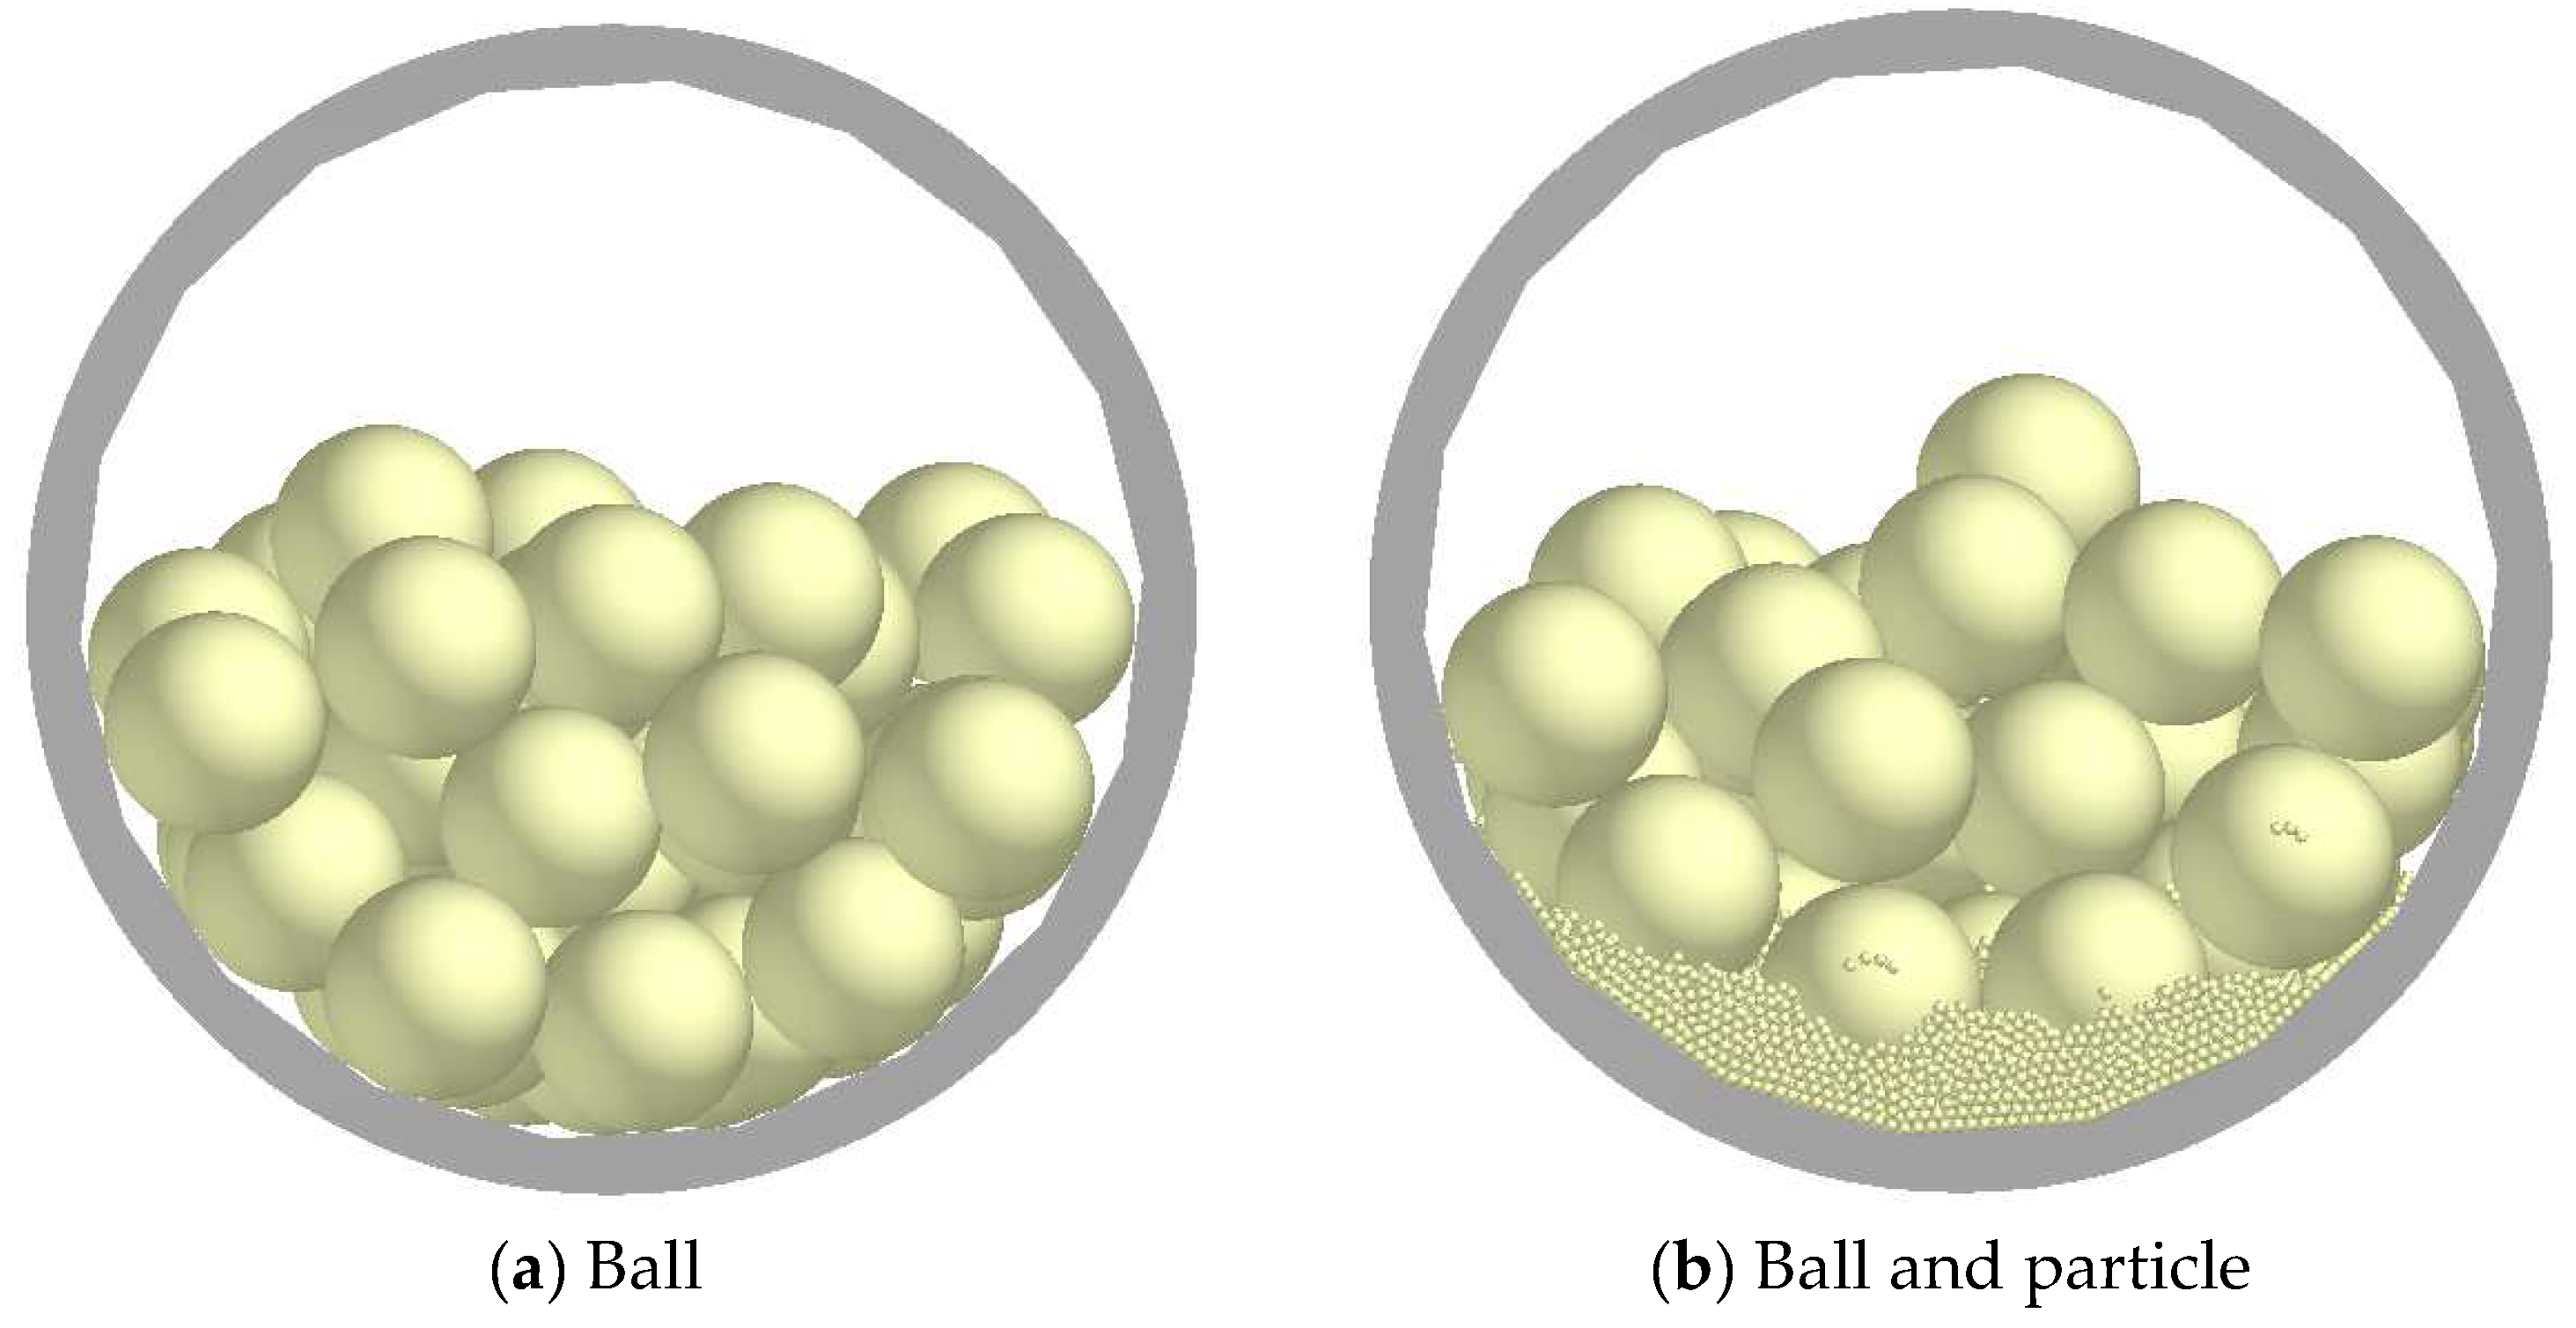
The batch grinding experiment data used in this study are sourced from Ma et al. [24]. The selected mineral is bauxite, with particle sizes of −10 + 5 mm and −5 + 2.5 mm. The grinding media used are steel balls with diameters of 42 mm, 31 mm, 26 mm, and 19 mm. The ball mill model used for the batch experiments is XMB200 × 240, with an internal diameter of 200 cm and an internal length of 240 cm, providing an effective volume of 7.5 L, as shown in Figure 1. Other experimental conditions include a mill speed at 72% of the critical speed, a motor power of 0.55 kW, and a shell thickness of 20 cm. Each grinding batch used 500 g of material, with a media filling rate of 40%.
It is known that the breakage rates for narrow size fractions under different ball diameters are as follows: for the −10 + 5 mm fraction, the breakage rates are 0.10 s−1, 0.08 s−1, 0.03 s−1, and 0.04 s−1 as the ball diameter decreases; for the −5 + 2.5 mm fraction, the breakage rates are 0.10 s−1, 0.10 s−1, 0.06 s−1, and 0.07 s−1, respectively.
Additionally, the two size fractions were mixed in a 40:60 ratio of 5 mm to 2.5 mm and subjected to two combinations of ball diameters: 42 mm and 19 mm and 31 mm and 19 mm. The specific mixing ratios are shown in Table 1.
Here, d1 and d2 represent the media sizes, α and β represent particle sizes, and N1 and N2 represent the proportions of d1 and d2, respectively. In addition to the five calculated media ratios, a fixed ratio of 20:80 is provided as an additional supplement.
As depicted in Figure 2, the first step is to synchronize the simulation models with the batch grinding experimental results under identical conditions, ensuring that the simulations accurately replicate real-world grinding behavior. Following this synchronization, the critical breakage energy for various particle sizes is calculated, establishing a baseline for further analysis. Subsequently, simulation experiments are conducted for two scenarios: one involving mixed ball diameters with narrow particle size fractions and another with mixed ball diameters across a broader range of particle sizes. These experiments allow for an in-depth analysis of the collision behavior between different particles and the grinding media. By evaluating the magnitude and frequency of the energy generated during these collisions, the underlying grinding impact mechanisms can be identified, offering insights into how variations in particle size distribution and ball size influence grinding efficiency. Lastly, an assessment of liner wear is performed, focusing on both tangential and normal wear under various conditions. This provides a thorough understanding of how different grinding configurations impact liner durability and overall maintenance requirements.
This study utilizes EDEM commercial software (EDEM 2022, Altair, Troy, MI, USA). First, the ball mill model is imported, and the simulation time step is set. In the particle factory, various experimental conditions are input, including particle size, generation rate, and position distribution. Based on the batch grinding experiment, the required mass of steel balls is calculated using the following formula:
M = V m × ψ × ρ m
Here, V m represents the mill volume, ψ represents the media filling rate, and ρ m represents the media density. The filling rate of the medium selected for all tests below is 40%.
For steel ball sizes, different ball diameters are selected based on fixed particle sizes; for narrow particle size fractions, a fixed size range is chosen, generating minerals of −10 + 5 mm and −5 + 2.5 mm particle sizes. Additionally, the operational conditions of the mill are added to simulate the actual motion process. The generation time for both media and mineral particles is set to 1 s to ensure stable particle generation, as shown in Figure 3. The grinding simulation lasts for 10 s, with a total simulation duration of 12 s to ensure particles have enough time to achieve stable operation within the mill.
Furthermore, the physical properties of steel are chosen as the basis for the cylinder and grinding media. Magnetite is selected as the mineral, and the contact parameters between different particles and between particles and the cylinder, such as the friction coefficient and restitution coefficient, are determined, as shown in Table 2.

4. Results and Analysis

4.1. Verification of Simulation Test

Initially, grinding simulations were performed on narrow-sized minerals using single-sized media of 19 mm, 26 mm, 31 mm, and 42 mm, as illustrated in Figure 4. Subsequently, Figure 4a–d represent the grinding motion of 5 mm narrow-sized mineral particles under different media sizes, while Figure 4e–h depict the grinding motion of 2.5 mm narrow-sized mineral particles.
The particle velocity distribution reveals that, typically, particles at the toe exhibit the highest velocity, while those near the cylinder wall display the lowest. In the intermediate area, particle velocities fall within an intermediate range. This phenomenon arises from the continuous conversion of potential and kinetic energy as particles are lifted from the bottom to the highest point and thrown outward. In varied grinding conditions, the critical factor impacting the ultimate grinding effect is the collision between particles, leading to the conversion of kinetic energy into the energy necessary for mineral crushing. Specifically, mineral crushing primarily takes place during the collision between the medium and the mineral.
As shown in Figure 5, the distribution of collision energy between the medium and the mineral under different grinding conditions is illustrated. It is noticeable that particle size has a considerable impact on collisions, particularly for mineral particles. In comparison to 5 mm mineral particles, the collision probability between 2.5 mm mineral particles and the medium is significantly higher, with a broader range of collision energy distribution, primarily in the lower energy range. Once the collision energy exceeds 10−6 J, the difference between the two becomes minimal. Additionally, under the same grinding conditions, the medium size also exerts a certain influence on collision energy distribution. The size of the grinding media is the primary factor affecting the overall efficiency of a ball mill [25]. By optimizing the loading composition of grinding media within the ball mill, the specific surface area per unit of energy can be maximized, thereby enhancing grinding efficiency [26]. From Figure 5, it can be observed that as the size of the medium increases, the maximum collision frequency between the medium and the mineral gradually rises, and the collision energy here also increases with larger medium sizes, maintaining the same pattern for both narrow-sized minerals.
Currently, using the DEM to determine the critical breakage energy of minerals has become an important method in research and a key means of integrating and validating simulations with experiments. Ciantia et al. simulated the cone penetration test of double-porosity crushable particles, determining critical breakage energy through particle breakage modeling [27]. Zhang et al. studied the energy distribution and breakage efficiency of different-sized grinding media in tumbling mills, establishing a mathematical relationship between energy and breakage efficiency [28]. This study analyzes the contact behavior during the grinding process and discusses particle breakage conditions and critical energy through simulations based on batch grinding kinetics [29,30] with the following formula [27]:
S = 0   W m W m i n 1 e x p f m a t d W m W m i n     W m > W m i n
Here, S represents the particle breakage rate, fmat represents the material property, d represents the particle size, and Wmin represents the minimum specific energy for particle breakage. Meanwhile, Wm represents the specific energy acting on the particle, which is represented as energy dissipation in this study.
As depicted in Figure 6, the comparison presented here showcases the grinding rates obtained through two methods: the experimental test by Ma and the grinding simulation. It is evident that for 2.5 mm and 5 mm minerals [24], the application of different size media for linear fitting of the grinding rates results in fitting formulas of Y = 0.98X and Y = 0.97X, respectively, with a remarkably high fitting degree of 0.98. This observation indicates that the data derived from the simulations are closely aligned with the experimental test. Furthermore, the determined Wmin for the 2.5 mm and 5 mm minerals both amount to 1.54 × 10⁻³ J/kg, while the fmat stand at 5.33 and 5.01 kg/Jm. Given that these parameters are intricately linked to mineral properties and possess less association with grinding conditions.

4.2. Influence of Particle Size and Composition on Grinding Effect

The grinding process encompasses not only the collision between minerals and media (B-P) [31] but also the interaction between media and media (B-B), as well as the contact between minerals themselves (P-P). We conducted simulation tests on a combination of mineral particles (5 mm:2.5 mm = 40:60) using single-sized media.
As shown in Figure 7, the frequency distribution of collision energy under different grinding conditions is depicted. It can be observed that the collision energy distribution follows the sequence of P-P, B-P, and B-B, with decreasing collision frequencies. This indicates that, compared to mineral particles, the collision energy between different particles and the medium is greater, while the collision frequency is lower. Furthermore, comparing Figure 7a,d, it is evident that the collision frequency of B-B increases significantly. This can be attributed to the reduced size of the medium, which results in a higher number of particles at the same medium filling ratio, leading to a substantial increase in collision frequency. Consequently, the collision energy at the maximum collision frequency is reduced to 1.71 × 10⁻³ J and 8.37 × 10⁻⁵ J, respectively. Simultaneously, the collision characteristics of B-P and P-P also undergo noticeable changes. The collision frequency of B-P slightly increases, with a negligible change in the collision energy at the maximum collision frequency (4.18 × 10⁻⁷ J and 3.27 × 10⁻⁷ J, respectively). On the other hand, the collision probability of P-P significantly decreases.
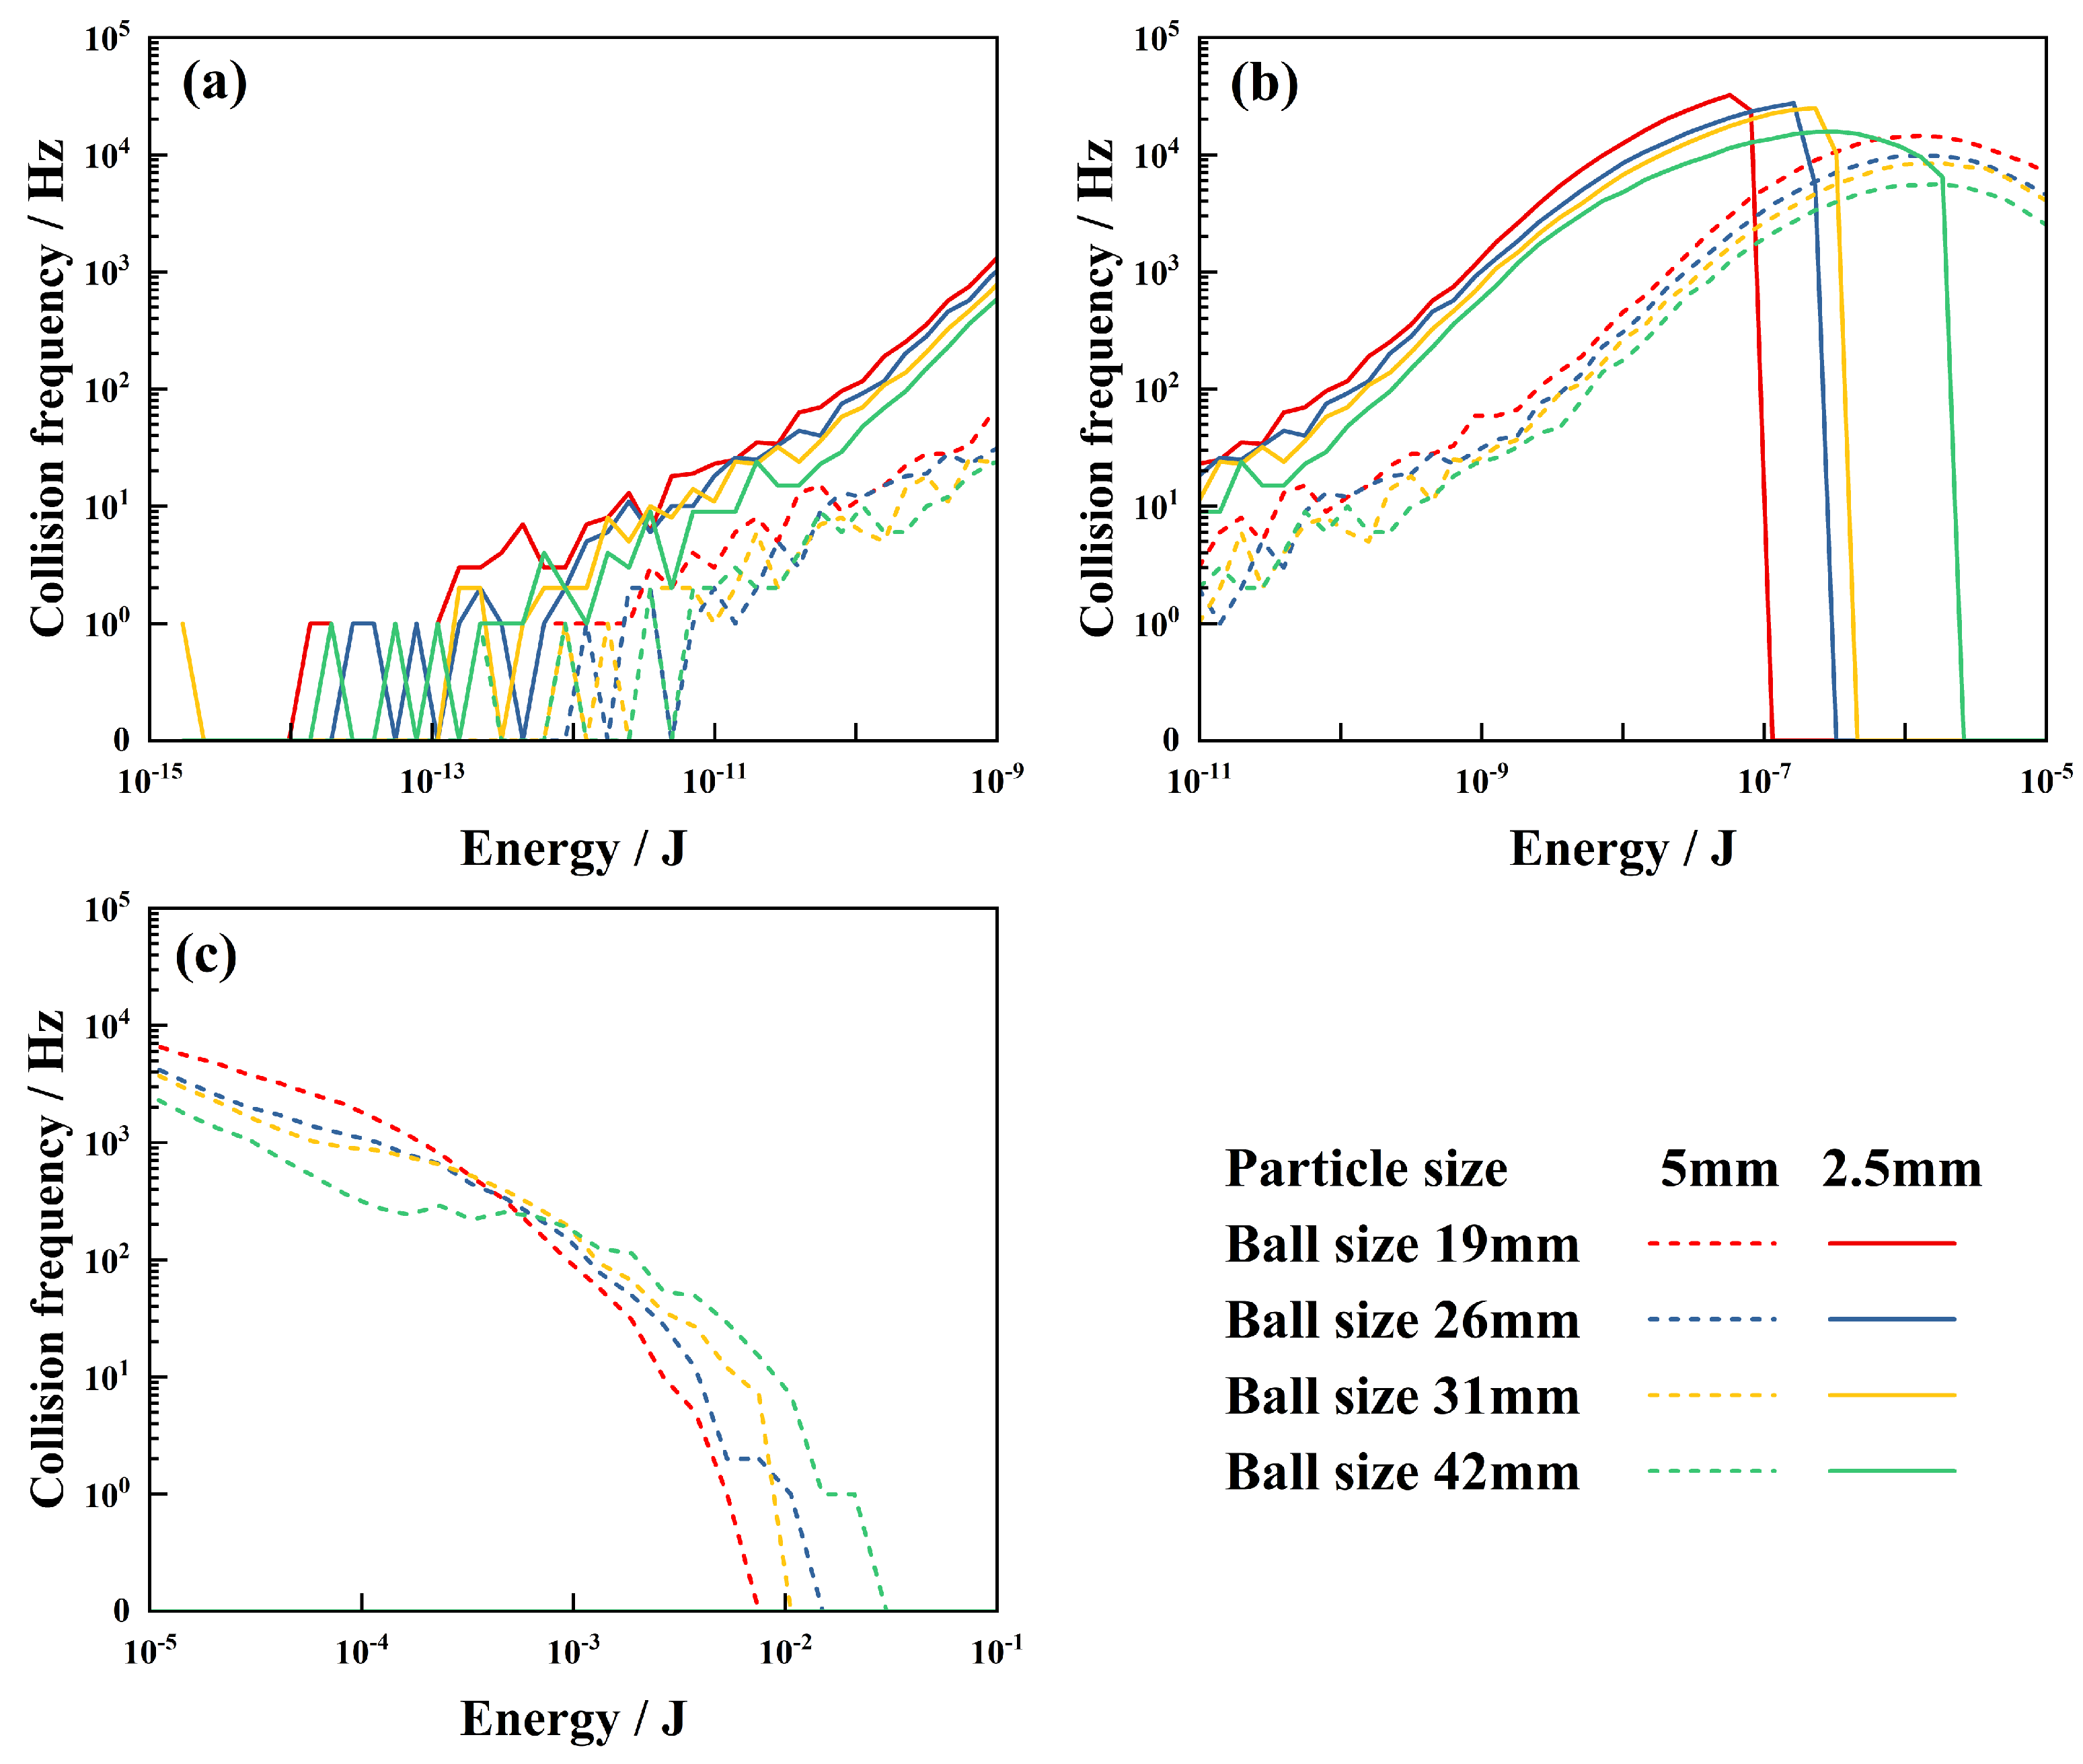
Considering that B-P is the primary source of mineral breakage in the grinding process, the mineral particle size is divided into two categories: 5 mm and 2.5 mm, with a composition ratio of 40% to 60%, as shown in Figure 8. It is evident that there are significant differences in the collision behavior between the two mineral particles and the medium. Specifically, the collision energy of the 2.5 mm mineral particles gradually increases within the range of 10−15 to 10−7 J, and the collision frequency at the same collision energy is higher than that of the 5 mm mineral particles. Moreover, with the increase in medium size, the collision frequency of B-P shows an increasing trend. Therefore, it can be concluded that the collision between the 2.5 mm mineral particles and the medium mainly occurs at a low collision energy below 10−7 J. On the other hand, the collision energy range between the 5 mm mineral particles and the medium is broader, extending from 10−2 to 10−1 J, and the collision energy at the highest collision frequency is higher than that of the 2.5 mm mineral particles at the highest collision frequency. Similarly, as the medium size increases, the collision frequency between the 5 mm mineral particles and media also shows an increasing trend. Furthermore, for the 2.5 mm mineral particles, not only is the collision frequency influenced by the medium size, but the collision energy at the maximum collision frequency also increases with the increase in medium size. However, this phenomenon is not observed in the case of 5 mm mineral particles.
According to Figure 6, it can be observed that the optimal grinding effect for mineral particles (2.5 mm and 5 mm) is achieved when the medium sizes are 31 mm and 42 mm. Considering the constraints of experimental tests, it is common to use combinations of multiple medium sizes. Through extensive validation, it has been found that adding smaller-sized media has a positive impact on grinding efficiency. Therefore, this study selects two medium combinations, namely 31 mm and 19 mm and 42 mm and 19 mm. The distribution of medium sizes is determined based on the methods listed in Table 1, which provide the proportions for different ball diameters.
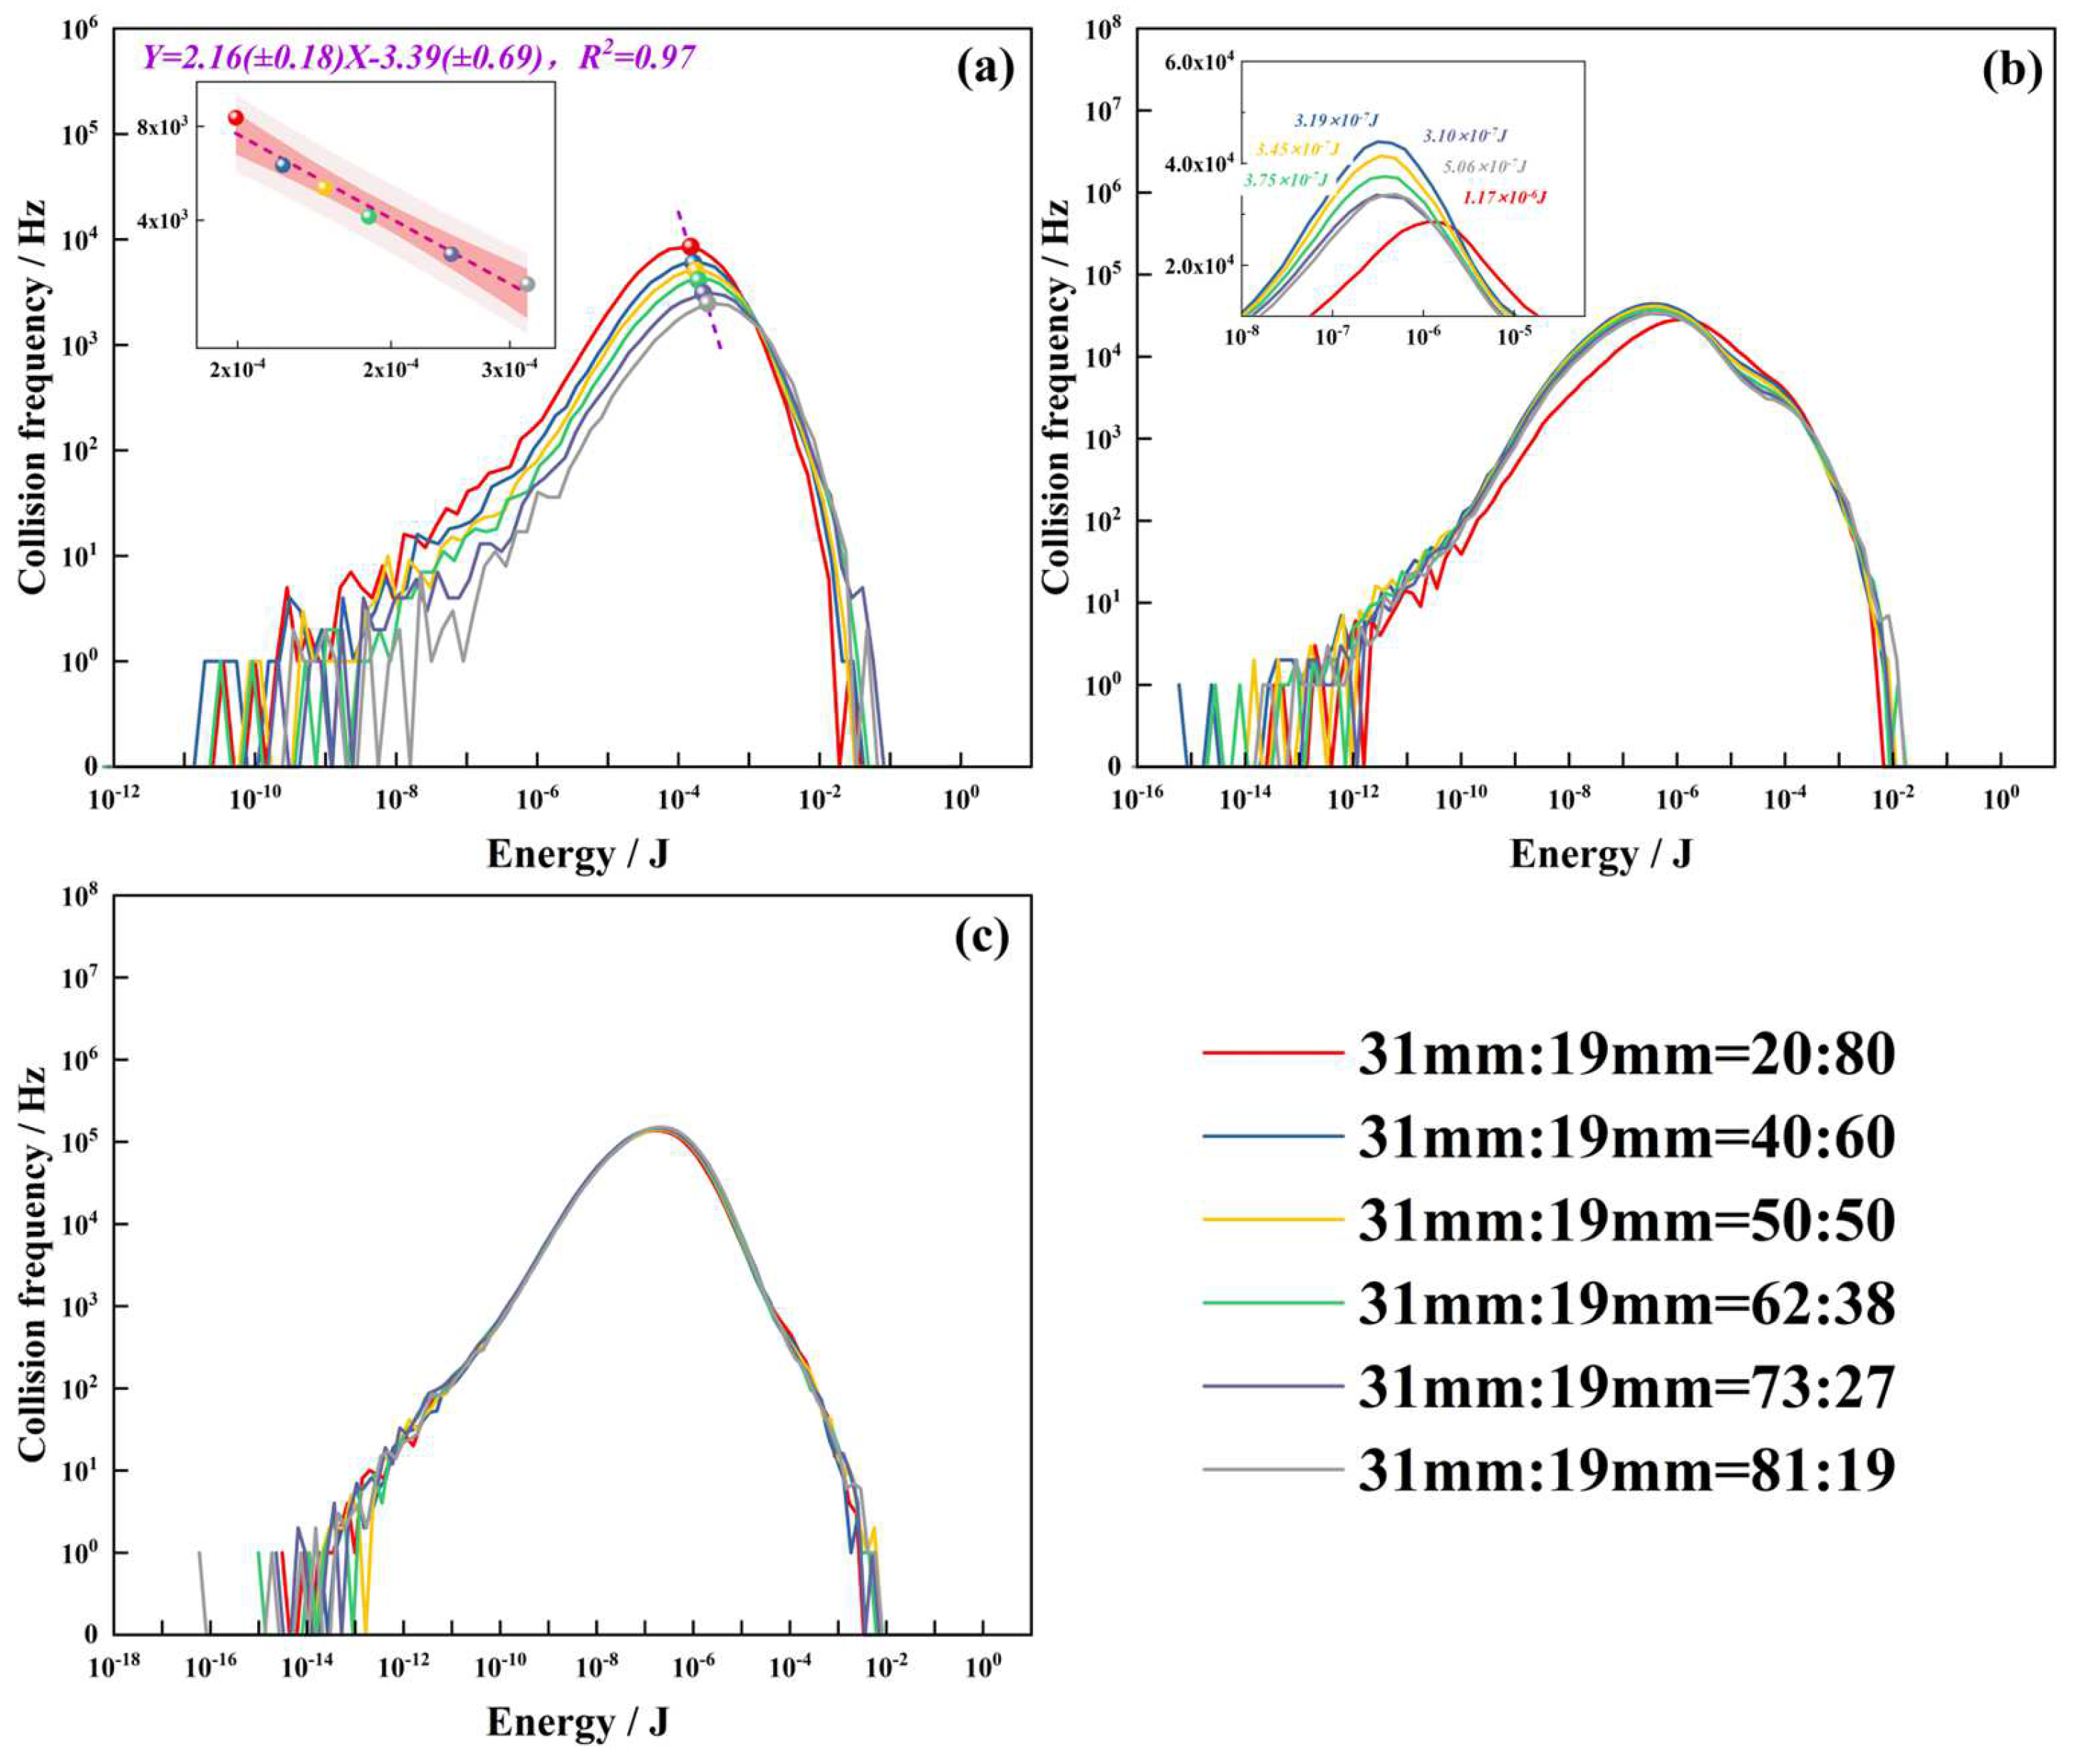
As shown in Figure 9, the simulation results depict the collision energy distribution for the medium sizes of 31 mm and 19 mm under different ratios. Figure 9a, Figure 9b, Figure 9c represent the collision energy distributions for B-B, B-P, and P-P, respectively. Firstly, it can be observed that there are significant differences in collision energy distribution between media under different grinding conditions. As the proportion of smaller ball diameters increases, the collision frequency gradually increases. This can be explained by the fact that reducing the medium size significantly increases the number of media particles at the same filling ratio, directly affecting the collision frequency.
For Figure 9a, a linear fit of the vertex points from the six collision distribution curves yields a fitting degree of R2 = 0.97. This indicates that as the proportion of smaller media increases, the collision frequency between media particles gradually increases, resulting in a decrease in collision energy. This is because smaller media have lower mass, leading to a decrease in collision energy. For Figure 9b, it can be observed that as the proportion of smaller media decreases, the collision frequency gradually decreases, with little difference in collision energy. However, there is an anomalous phenomenon where the collision frequency between media and mineral particles decreases significantly when the proportion of smaller media is at its maximum. This indicates that adding a certain amount of smaller media within a certain range can improve the grinding efficiency, but an excessive proportion of smaller media can have a negative impact on the grinding effect.
Furthermore, in Figure 9c, it can be observed that the collision between mineral particles is minimally affected by the medium ratio. Regardless of the grinding conditions, the P-P collision distributions overlap significantly.
As shown in Figure 10, the collision behavior of medium sizes 41 mm and 19 mm under different ratios are presented. It can be observed that the collision characteristics of B-B in Figure 10a are similar to those in Figure 9a. As the proportion of small medium increases, the collision frequency between the mediums gradually increases while the collision energy decreases. Additionally, compared to the collisions between medium and mineral shown in Figure 9b, we did not observe a sharp decrease in collision frequency caused by an excessive proportion of small medium in Figure 9b. Instead, as the proportion of small medium increases, the collision frequency gradually increases with little difference in collision energy. Moreover, we can see that the collision differences between mineral particles are minimal and are not significantly affected by the medium ratio.

4.3. Comparison of Grinding Energy Consumption

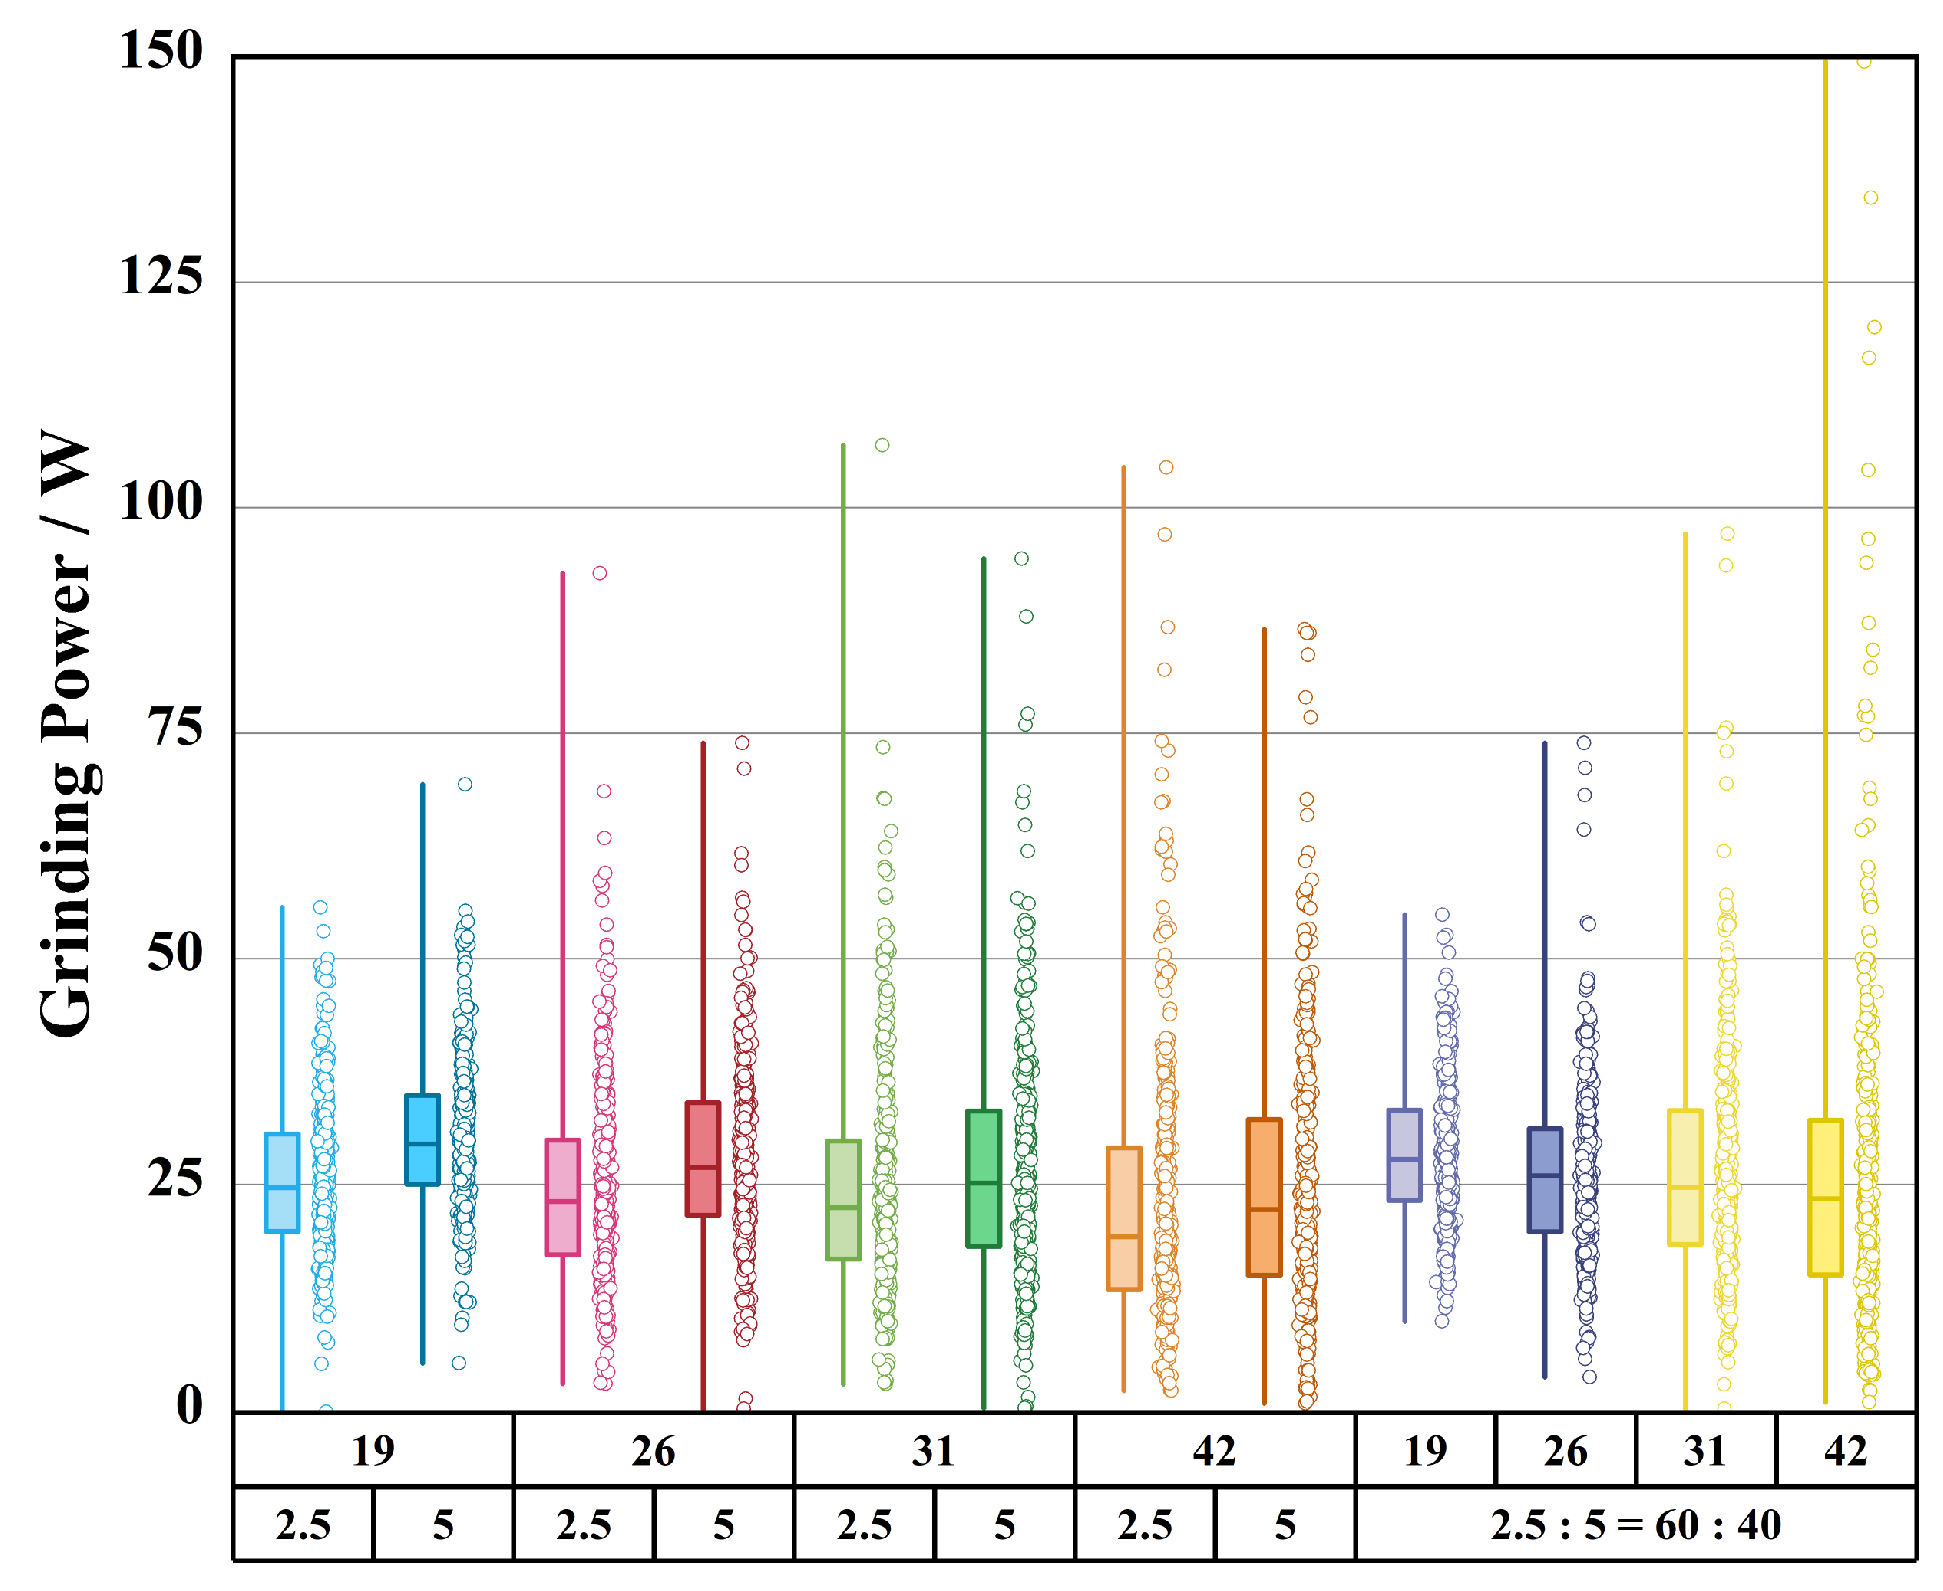
Comparing the energy consumption of grinding with different single medium sizes (19 mm, 26 mm, 31 mm, and 42 mm) under various mineral particle sizes is shown in Figure 11.
For the single feed particle size, at the same ball diameter, the grinding energy consumption of 5 mm mineral particles is higher than that of 2.5 mm mineral particles. This is because the mineral particles can act as lubricants between the medium gaps, and as the mineral particle size decreases, the height to which the grinding medium can be lifted decreases, resulting in lower energy consumption. Additionally, compared to smaller media, larger media exhibit greater fluctuations in grinding energy consumption. For the mixed particle feed, as the ball diameter increases, the required grinding energy consumption decreases, but the energy consumption fluctuations increase.
Analyzing the distribution of energy losses during the grinding process is crucial. The grinding power consumption in this study is measured in watts (W), and the energy loss is measured in Jm, representing the energy lost per second.
As shown in Table 3, the energy loss is divided into three parts: B-B, B-P, and P-P. It can be observed that the collision energy loss mainly occurs between the grinding media, while the contribution of mineral particles is relatively low. Combining this with Figure 11, it can be seen that the collision energy between the media accounts for 46%–66% of the total energy consumption, the collision energy between the media and minerals accounts for 10%–14%, and the collision energy between minerals accounts for 4%–6%. Comparing the proportions of these three collision forms, the impact of media size on collision energy consumption is more significant compared to mineral particle size. Specifically, for media sizes of 19 mm, 26 mm, 31 mm, and 42 mm, the average proportion of collision energy between media is 65%, 59%, 55%, and 52%, respectively, with an increasing trend as the media size increases. However, the proportion of collision energy between media and minerals, as well as between minerals, remains relatively unaffected by media size and mineral particle size, with minimal differences. Additionally, when summing up the collision energy losses of these three forms, it can be observed that they account for 65%–77% of the total energy consumption, with the main difference coming from collisions between the media, while the remaining energy may result from the rotation of the mill and collisions between the mill and particles.
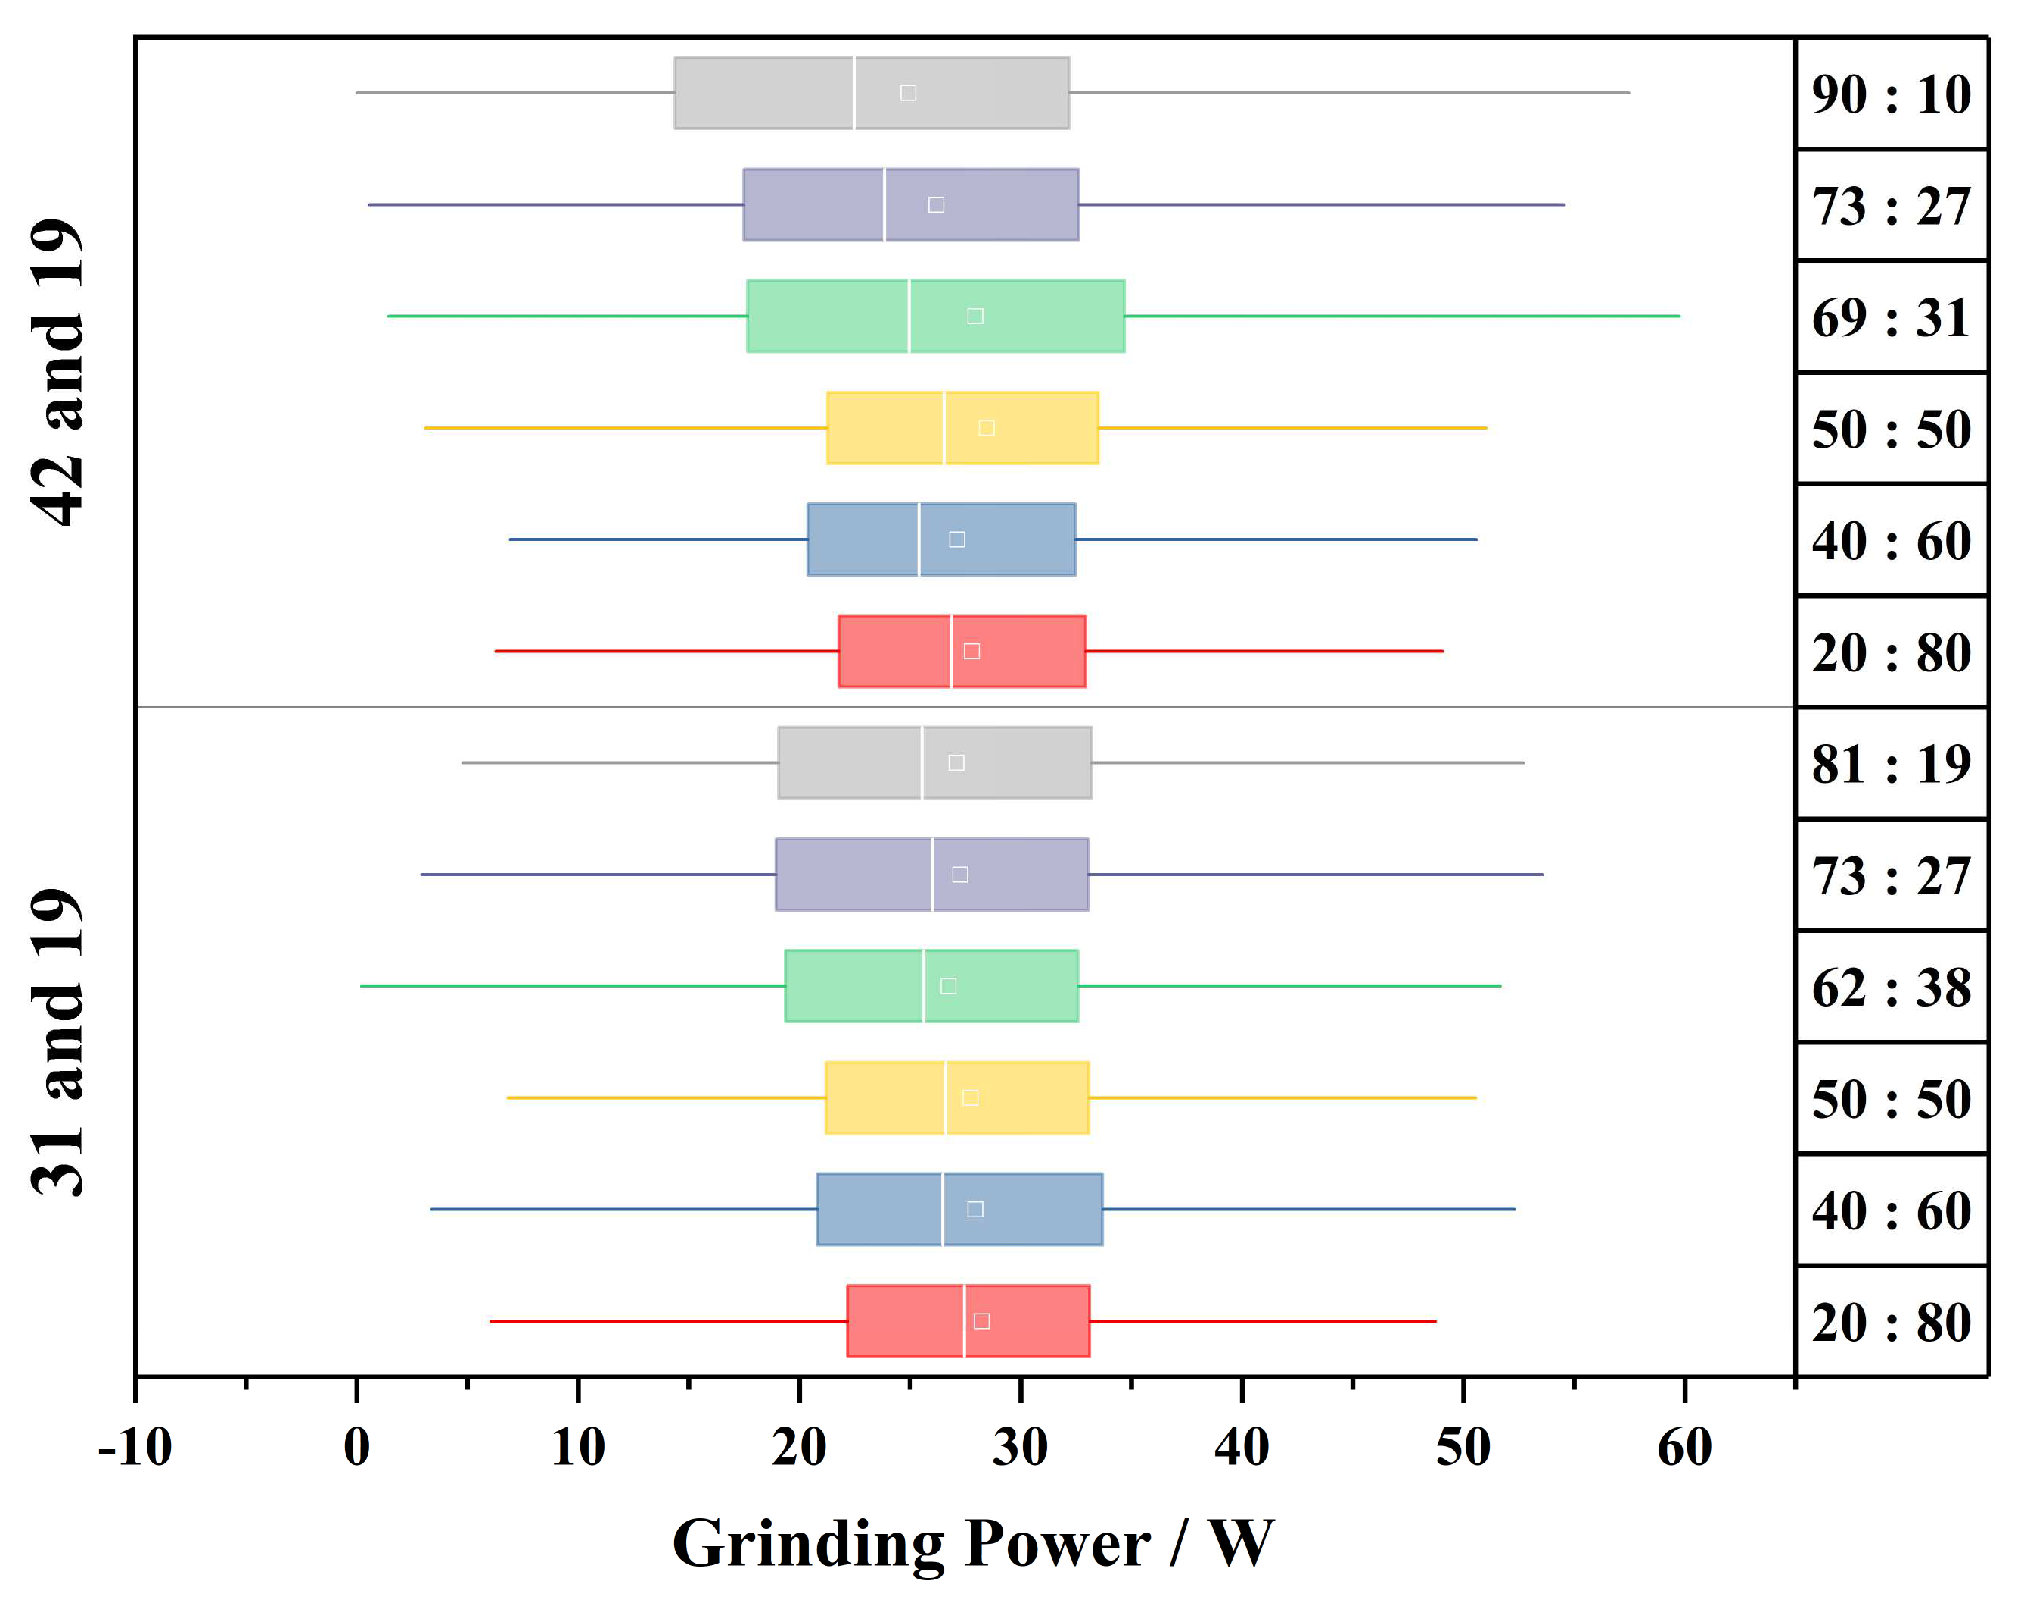
Furthermore, we compared the grinding energy consumption under different medium ratios. As shown in Figure 12, we observed that as the proportion of small media increased, the grinding energy consumption also increased, regardless of whether it was 42 mm and 19 mm or 31 mm and 19 mm. However, in contrast to Figure 11, we did not observe significant fluctuations in grinding energy consumption due to an increase in average medium size. Instead, the variation in grinding energy consumption was not substantial, regardless of the medium ratio.
Additionally, we analyzed the different collision energy losses in mixed media, as shown in Table 4. Combining this with Figure 12, we found that for a medium size of 31 mm and 19 mm, the proportion of B-B energy loss ranged from 59% to 62% for different ratios, B-P energy loss accounted for 13% to 14%, and P-P energy loss accounted for 5% to 6%. For a medium size of 42 mm and 19 mm, the proportion of B-B energy loss ranged from 53% to 66% for different ratios; B-P energy loss accounted for 13% to 15%, and P-P energy loss accounted for 5% to 8%. It can be observed that the impact of the medium ratio on the proportion of various collision energy losses is relatively small compared to the medium size. Furthermore, compared to medium size combinations such as 42 mm and 19 mm, combinations with smaller medium sizes like 32 mm and 19 mm exhibited less fluctuation in the proportions of different collision energy losses.

4.4. Comparison of Mill Liner Wear

The wear of the mill liner in the grinding process is also an important aspect to consider. As mentioned earlier, the variation in the composition of media and minerals has a significant impact on the collision, which would also ultimately affect the liner wear.
As shown in Figure 13, we compared the effects of media size on the liner under conditions with and without minerals. It can be observed that as the media size increases, the total force exerted on the liner increases significantly, reaching its maximum at 42 mm. In the case of 19 mm media, the average total forces with and without minerals are 153 N and 149 N, respectively. For 42 mm media, the average total forces with and without minerals are 170 N and 154 N, respectively. This indicates that increasing the media size increases the total force exerted on the liner, and the presence of minerals significantly amplifies this effect. Furthermore, it can be observed that as the media size increases, the total force exhibits greater fluctuations over time. Therefore, it can be concluded that the forces acting on the liner are closely related to the media size.
Figure 14 compares the liner wear under different media ratios for 42 mm and 19 mm media. In the case of a 20:80 media size ratio, the average total forces exerted on the liner with and without minerals are 154 N and 149 N, respectively. For other ratios, the values are as follows: 153 N and 149 N, 160 N and 152 N, 165 N and 158 N, 158 N and 151 N, and 155 N and 154 N. Similar to Figure 13, it can be observed that the force is always greater in the presence of minerals compared to the absence of minerals. However, as the proportion of large media (42 mm) increases, the forces acting on the liner do not continuously increase but reach a maximum at a 50:50 ratio. Furthermore, compared to the forces acting on the liner when the media size is 42 mm in Figure 13, it can be observed that the influence of mineral presence on the changes in liner forces diminishes when smaller-sized media is added to the media mixture.
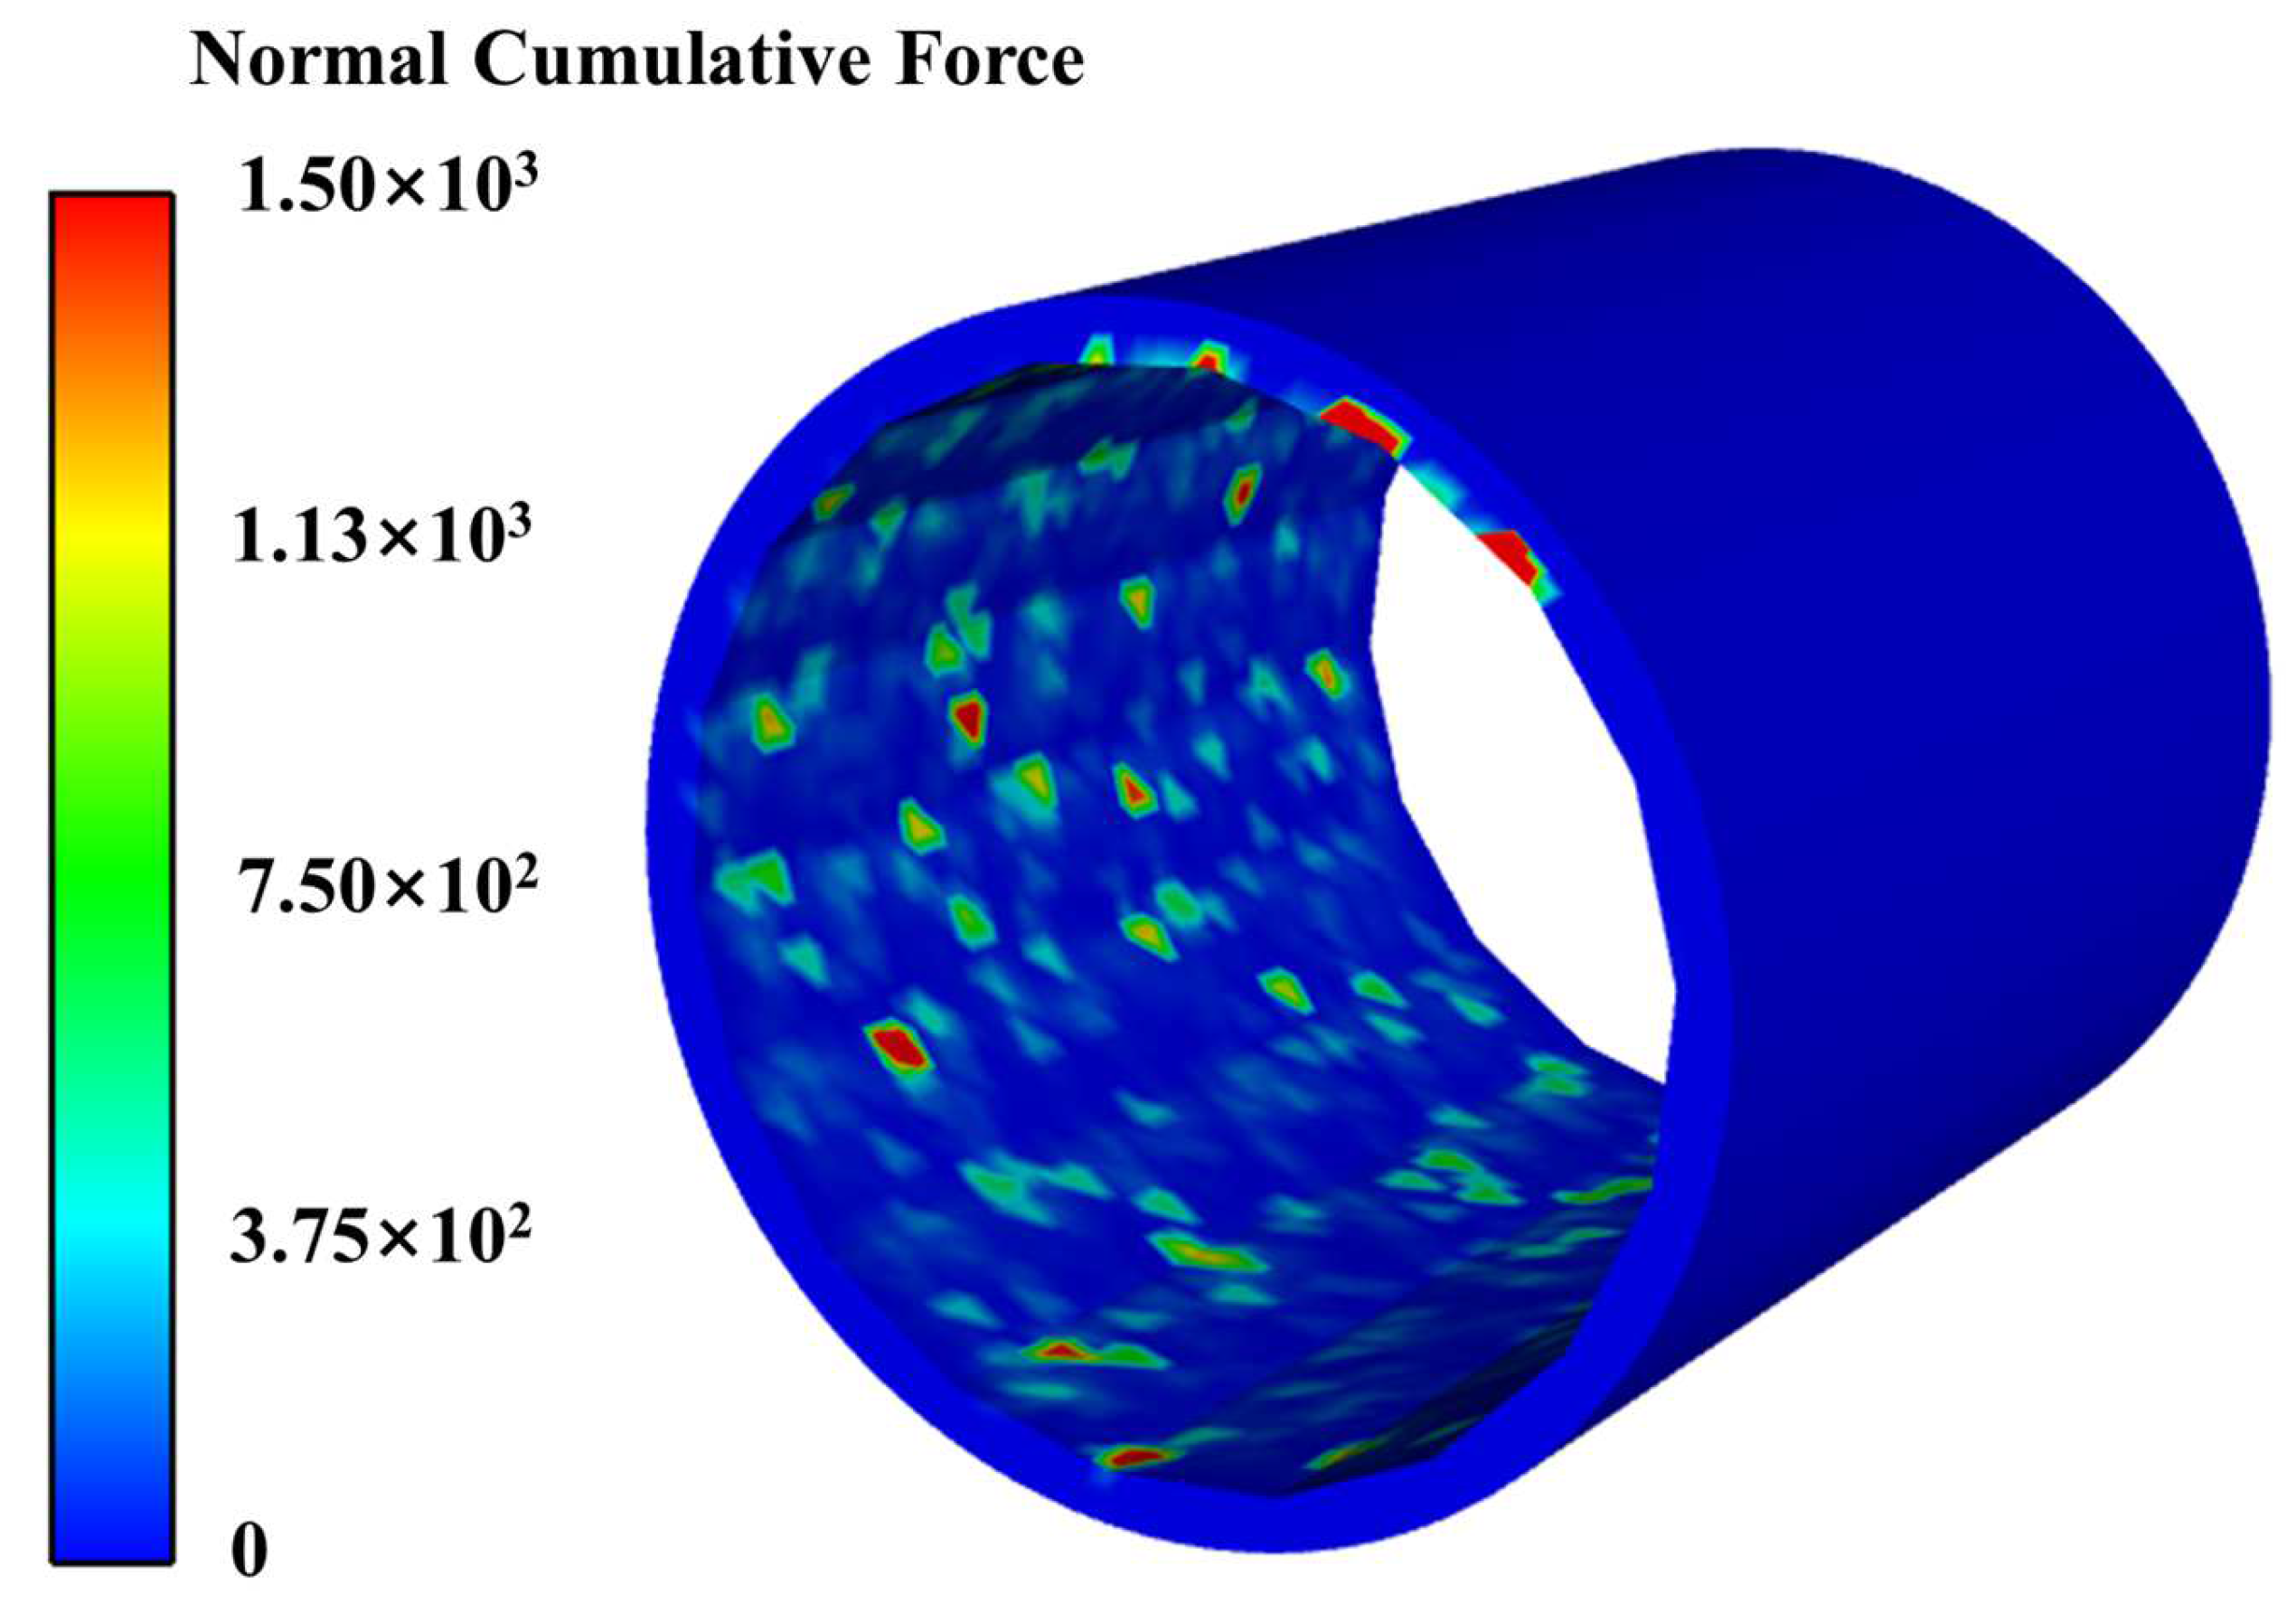
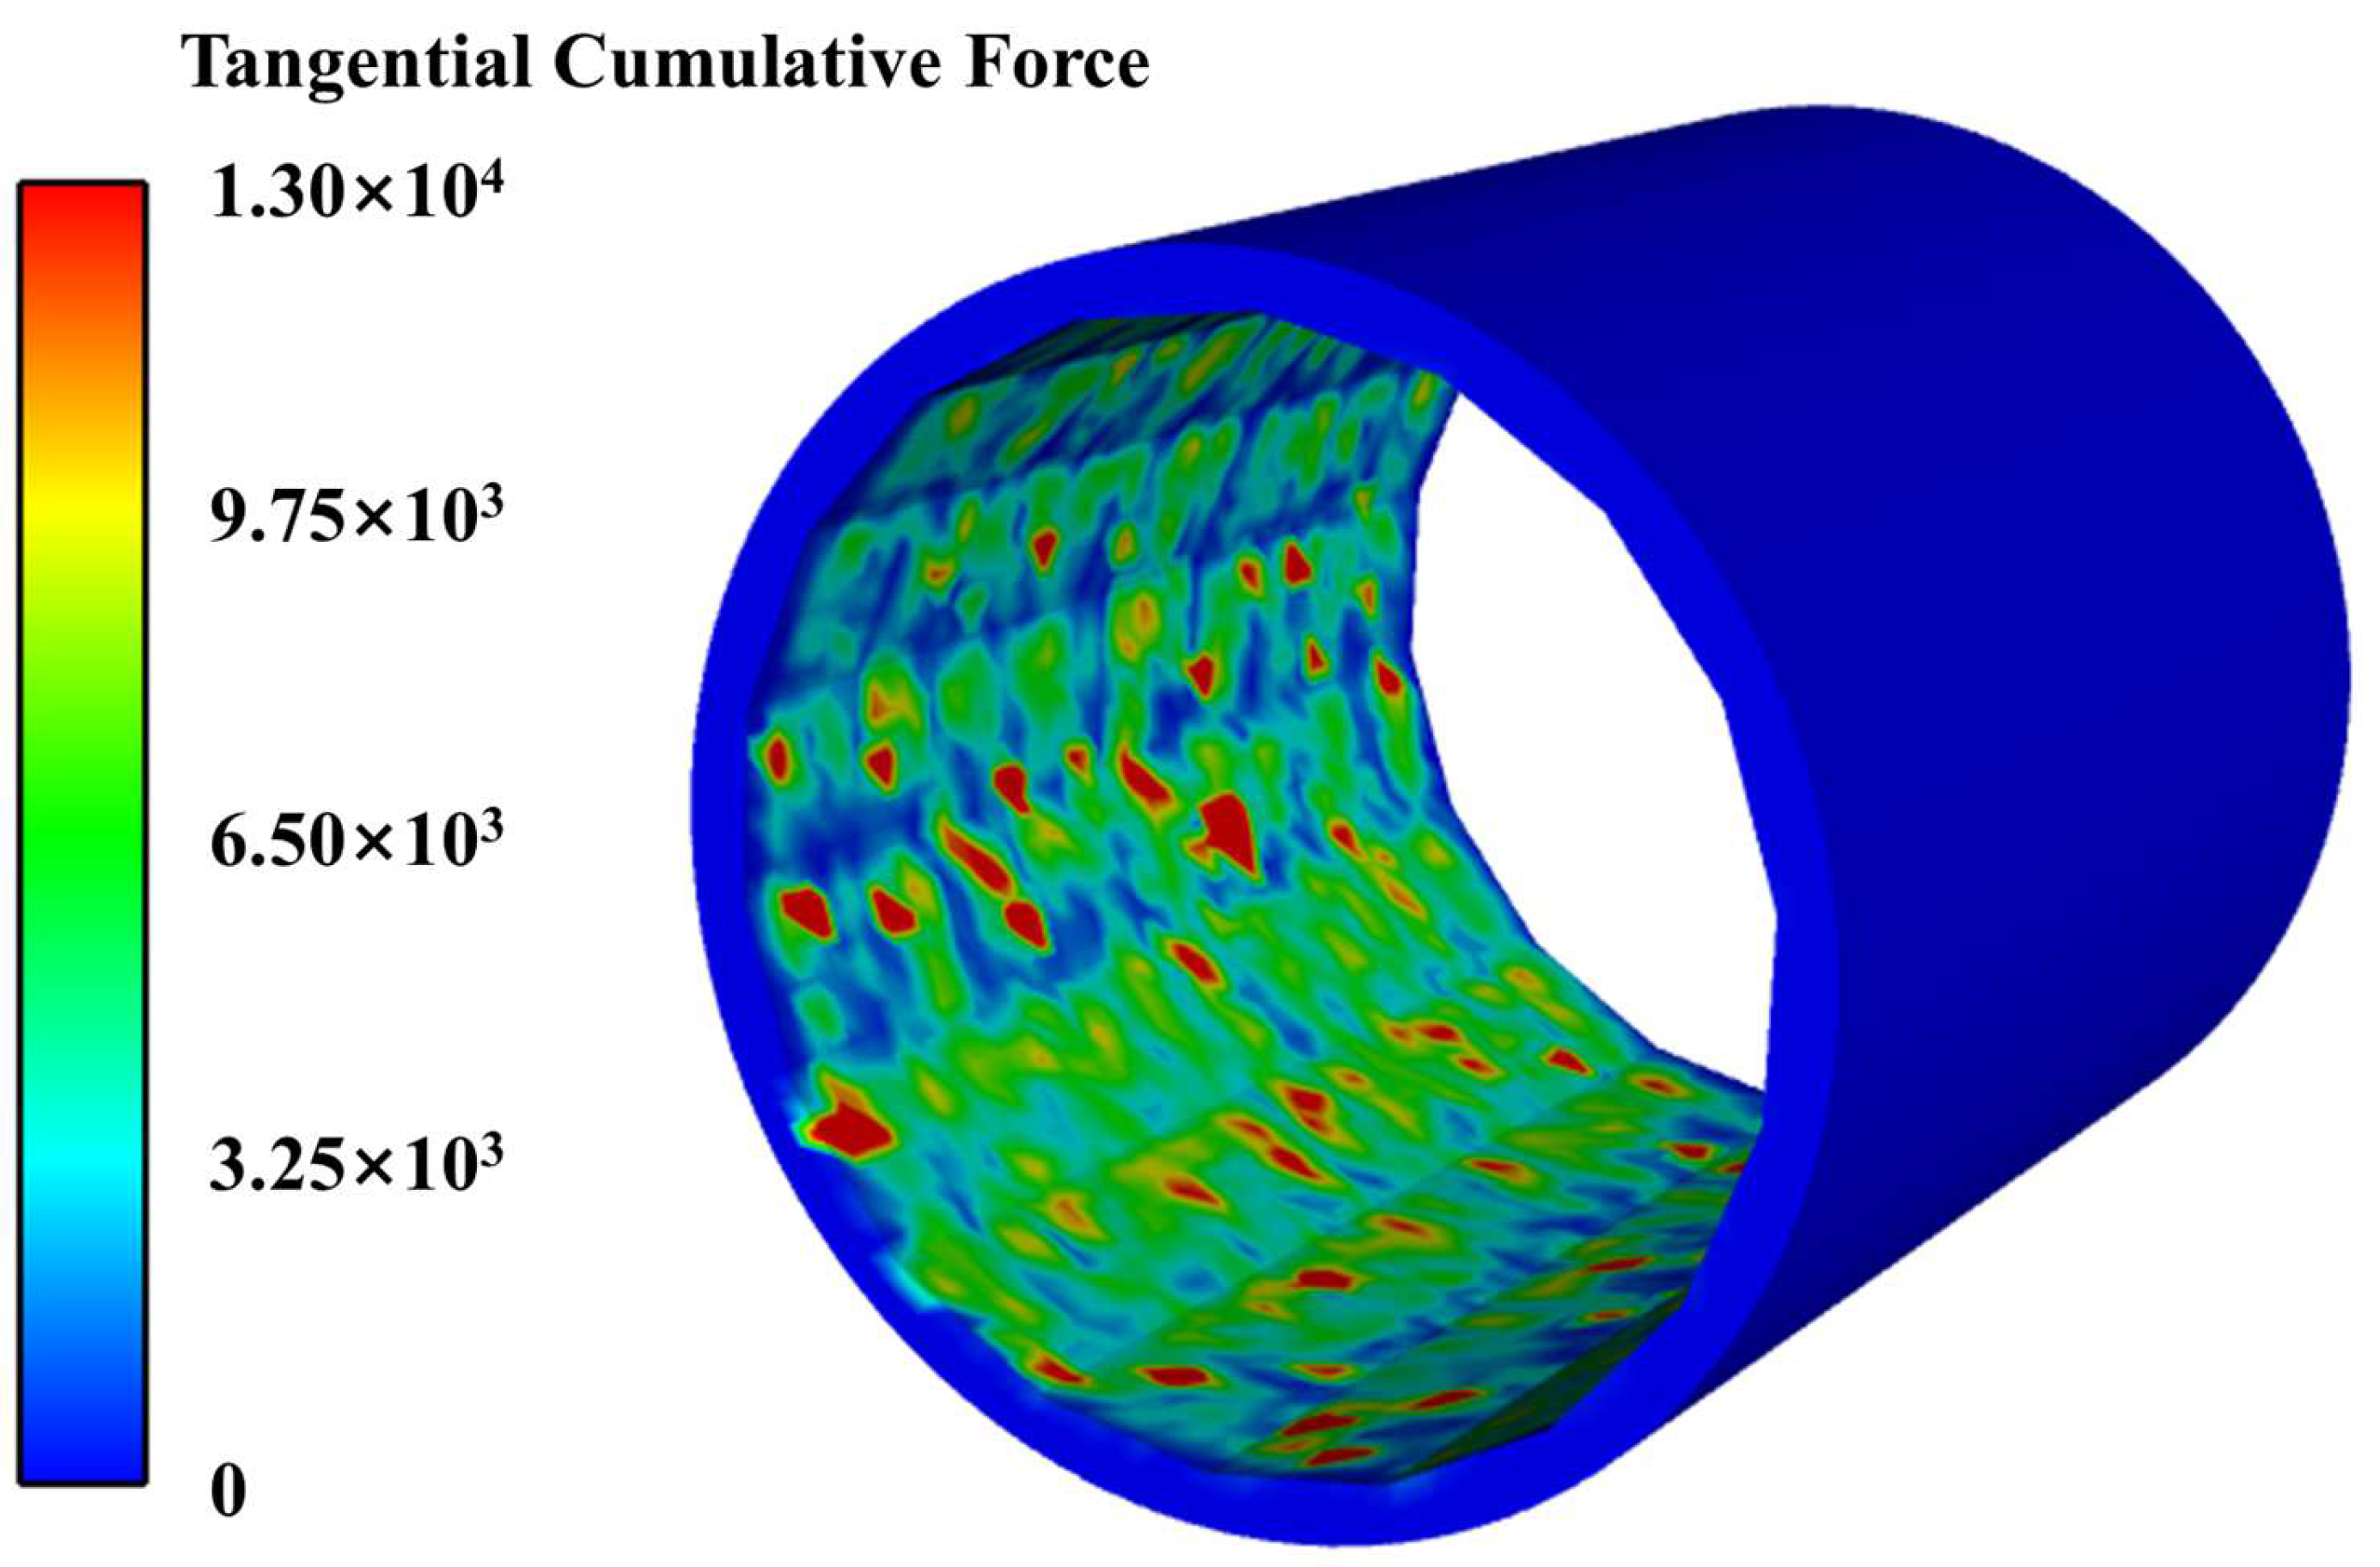
Considering that the grinding process occurs in a three-dimensional space, the forces acting on the liner include normal forces and tangential forces. Figure 15 and Figure 16 show the cumulative normal and tangential forces acting on the liner under the condition of a 42 mm:19 mm = 50%:50% media ratio with minerals. By comparing both, it can be clearly observed that the cumulative normal forces exerted on the liner are dispersed, while the cumulative tangential forces cover the entire liner. This is directly related to the motion of the various particles during the grinding process. Normal forces are mainly generated when the media impacts the liner like raindrops, while tangential forces are mainly caused by the friction between the particles and the liner during the lifting process. Additionally, it can be observed that the cumulative tangential forces are significantly greater than the cumulative normal forces, indicating that the lifting process of the particles causes considerable wear on the mill liner.

5. Conclusions

This study investigates the impact of ball size and proportion on the grinding process. Through experiments and simulations, conclusions were drawn on optimizing ball configuration to enhance grinding efficiency and reduce energy consumption. The specific findings are as follows:
(a) For narrow particle size minerals, larger ball sizes result in higher impact energy but significantly lower collision probability. Conversely, smaller ball sizes result in lower impact energy but higher collision probability. This indicates that larger balls can provide higher energy for mineral comminution, but their efficiency is limited by the lower frequency of collisions. On the other hand, smaller balls, despite their lower individual collision energy, have higher collision frequencies, thus improving overall grinding efficiency;
(b) Simulation results with different ball size combinations show that increasing the proportion of smaller balls does not significantly change the collision energy, but it substantially increases the collision probability. This indicates that a rational distribution of ball sizes can significantly optimize grinding performance. Specifically, combinations of 31 mm and 19 mm, as well as 42 mm and 19 mm balls, exhibited the best grinding performance. These combinations not only enhanced the comminution efficiency but also optimized energy utilization;
(c) Comparing the energy consumption for different ball sizes and ratios reveals that increasing the proportion of larger balls results in greater energy consumption fluctuations while increasing the proportion of smaller balls results in smaller fluctuations. Overall, a rational configuration of smaller balls can achieve low energy consumption while improving collision energy and collision probability;
(d) The wear of the mill liner is significantly affected by ball size and mineral particle size. The results show that larger balls increase the total force exerted on the liner, accelerating wear. In contrast, a combination of mixed ball sizes can effectively distribute the force on the liner, reducing the wear rate. Comparing tangential and normal wear reveals that tangential wear is more significant during the grinding process. This suggests that in selecting grinding media, considerations should include not only grinding efficiency and energy consumption but also liner wear to extend equipment life and reduce maintenance costs.

6. Outlook

This study effectively validated the use of DEM simulations to guide the selection of grinding media ball diameters during the laboratory phase, as evidenced by batch grinding experiments. However, to apply these findings to industrial settings, it will be essential to develop scaling models that can reliably translate laboratory-scale results to full-scale industrial operations. Future research should prioritize the creation of these scaling models, accounting for the complexities of industrial grinding systems, such as varying mill sizes, operating conditions, and material interactions. This will facilitate the practical application of DEM simulation insights to real-world grinding processes, improving efficiency and optimizing energy consumption on an industrial scale.

Author Contributions

Methodology, X.F. and C.W.; software, N.L. and J.Z.; validation, X.D. and S.Z.; formal analysis, A.L. and K.X. All authors have read and agreed to the published version of the manuscript.

Funding

This research was funded by the National Natural Science Foundation of China (grant No. 52474292).

Data Availability Statement

Data are contained within the article.

Conflicts of Interest

The authors declare no conflict of interest. Shenglin Zhu, Aijun Liu and Ke Xiao are employees of Jiangxi Copper Corporation Limited Dexing Copper Mine. The paper reflects the views of the scientists and not the company.

References

  1. Shi, F. A Review of the Applications of the JK Size-Dependent Breakage Model: Part 1: Ore and Coal Breakage Characterisation. Int. J. Miner. Process. 2016, 155, 118–129. [Google Scholar] [CrossRef]
  2. Akkaya, B.; Toroğlu, İ.; Bilen, M. Studying the Effect of Different Operation Parameters on the Grinding Energy Efficiency in Laboratory Stirred Mill. Adv. Powder Technol. 2020, 31, 4517–4525. [Google Scholar] [CrossRef]
  3. Celis, C.; Antoniou, A.; Cuisano, J.; Pillihuaman, A.; Maza, D. Experimental Characterization of Chalcopyrite Ball Mill Grinding Processes in Batch and Continuous Flow Processing Modes to Reduce Energy Consumption. J. Mater. Res. Technol. 2021, 15, 5428–5444. [Google Scholar] [CrossRef]
  4. Bian, X.; Wang, G.; Wang, H.; Wang, S.; Lv, W. Effect of Lifters and Mill Speed on Particle Behaviour, Torque, and Power Consumption of a Tumbling Ball Mill: Experimental Study and DEM Simulation. Miner. Eng. 2017, 105, 22–35. [Google Scholar] [CrossRef]
  5. Cleary, P.W. A Multiscale Method for Including Fine Particle Effects in DEM Models of Grinding Mills. Miner. Eng. 2015, 84, 88–99. [Google Scholar] [CrossRef]
  6. Cleary, P.W.; Morrison, R.D. Understanding Fine Ore Breakage in a Laboratory Scale Ball Mill Using DEM. Miner. Eng. 2011, 24, 352–366. [Google Scholar] [CrossRef]
  7. Cleary, P.W.; Owen, P. Effect of Operating Condition Changes on the Collisional Environment in a SAG Mill. Miner. Eng. 2019, 132, 297–315. [Google Scholar] [CrossRef]
  8. Yin, Z.; Wang, N.; Li, T.; Peng, Y. Experimental Investigation of the Impact Breakage Characteristics between Grinding Media and Iron Ore Particle in Ball Mills. Adv. Powder Technol. 2023, 34, 103982. [Google Scholar] [CrossRef]
  9. Qian, H.Y.; Kong, Q.G.; Zhang, B.L. The Effects of Grinding Media Shapes on the Grinding Kinetics of Cement Clinker in Ball Mill. Powder Technol. 2013, 235, 422–425. [Google Scholar] [CrossRef]
  10. Shi, F. Comparison of Grinding Media—Cylpebs versus Balls. Miner. Eng. 2004, 17, 1259–1268. [Google Scholar] [CrossRef]
  11. Li, Y.; You, Y.; Gou, D.; Yu, A.; Yang, R. A DEM Based Scale-up Model for Tumbling Ball Mills. Powder Technol. 2022, 409, 117854. [Google Scholar] [CrossRef]
  12. Rodríguez, B.Á.; García, G.G.; Coello-Velázquez, A.L.; Menéndez-Aguado, J.M. Product Size Distribution Function Influence on Interpolation Calculations in the Bond Ball Mill Grindability Test. Int. J. Miner. Process. 2016, 157, 16–20. [Google Scholar] [CrossRef]
  13. Rumpf, H. Physical Aspects of Comminution and New Formulation of a Law of Comminution. Powder Technol. 1973, 7, 145–159. [Google Scholar] [CrossRef]
  14. Sabah, E.; Özdemir, O.; Koltka, S. Effect of Ball Mill Grinding Parameters of Hydrated Lime Fine Grinding on Consumed Energy. Adv. Powder Technol. 2013, 24, 647–652. [Google Scholar] [CrossRef]
  15. Xie, C.; Ma, H.; Song, T.; Zhao, Y. DEM Investigation of SAG Mill with Spherical Grinding Media and Non-Spherical Ore Based on Polyhedron-Sphere Contact Model. Powder Technol. 2021, 386, 154–165. [Google Scholar] [CrossRef]
  16. Kim, K.-C.; Jiang, T.; Kim, N.-I.; Kwon, C. Effects of Ball-to-Powder Diameter Ratio and Powder Particle Shape on EDEM Simulation in a Planetary Ball Mill. J. Indian Chem. Soc. 2022, 99, 100300. [Google Scholar] [CrossRef]
  17. Iwasaki, T.; Yabuuchi, T.; Nakagawa, H.; Watano, S. Scale-up Methodology for Tumbling Ball Mill Based on Impact Energy of Grinding Balls Using Discrete Element Analysis. Adv. Powder Technol. 2010, 21, 623–629. [Google Scholar] [CrossRef]
  18. Capece, M.; Bilgili, E.; Davé, R. Insight into First-Order Breakage Kinetics Using a Particle-Scale Breakage Rate Constant. Chem. Eng. Sci. 2014, 117, 318–330. [Google Scholar] [CrossRef]
  19. Stoimenov, N.; Ruzic, J. Analysis of the Particle Motion during Mechanical Alloying Using EDEM Software. IFAC-PapersOnLine 2019, 52, 462–466. [Google Scholar]
  20. Salili, S.M.; Ataie, A.; Sadighi, Z. Effect of ball size and ball to powder ratio variation on crystallite size and formation of nanocrystalline materials in planetary ball mill. AIP Conf. Proc. 2011, 1400, 127–130. [Google Scholar]
  21. Engl, W.; Tachibana, M.; Colin, A.; Panizza, P. A Droplet-Based High-Throughput Tubular Platform to Extract Rate Constants of Slow Chemical Reactions. Chem. Eng. Sci. 2008, 63, 1692–1695. [Google Scholar] [CrossRef]
  22. Zhao, T. Introduction to Discrete Element Method. In Coupled DEM-CFD Analyses of Landslide-Induced Debris Flows; Zhao, T., Ed.; Springer: Singapore, 2017; pp. 25–45. [Google Scholar]
  23. Pérez Morales, I.; Roselló Valera, R.; Recarey Morfa, C.; Muniz de Farias, M. Dense Packing of General-Shaped Particles Using a Minimization Technique. Comp. Part. Mech. 2017, 4, 165–179. [Google Scholar] [CrossRef]
  24. Ma, S.; Chen, J. Experimental Investigation of Size Match of Grinding Media for Ball Mills. China’s Manganese Ind. 2000, 11, 27–30. [Google Scholar]
  25. Möller, M.F.; Peppersack, C.; Kwade, A. Milling Efficiency and Wear Behavior of Silicon Grinding Media in Autogenous Stirred Media Milling. Miner. Eng. 2024, 214, 108785. [Google Scholar] [CrossRef]
  26. Petrakis, E.; Komnitsas, K. Effect of Grinding Media Size on Ferronickel Slag Ball Milling Efficiency and Energy Requirements Using Kinetics and Attainable Region Approaches. Minerals 2022, 12, 184. [Google Scholar] [CrossRef]
  27. Javid, A.H.; Fahimifar, A.; Imani, M. Numerical Investigation on the Bearing Capacity of Two Interfering Strip Footings Resting on a Rock Mass. Comput. Geotech. 2015, 69, 514–528. [Google Scholar] [CrossRef]
  28. Zhang, X.R.; Zhu, Y.G.; Zheng, G.B.; Han, L.; McFadzean, B.; Qian, Z.B.; Piao, Y.C.; O’Connor, C. An Investigation into the Selective Separation and Adsorption Mechanism of a Macromolecular Depressant in the Galena-Chalcopyrite System. Miner. Eng. 2019, 134, 291–299. [Google Scholar] [CrossRef]
  29. Barbian, N.; Hadler, K.; Cilliers, J.J. The Froth Stability Column: Measuring Froth Stability at an Industrial Scale. Miner. Eng. 2006, 19, 713–718. [Google Scholar] [CrossRef]
  30. Mishra, B.K. A Review of Computer Simulation of Tumbling Mills by the Discrete Element Method: Part I—Contact Mechanics. Int. J. Miner. Process. 2003, 71, 73–93. [Google Scholar] [CrossRef]
  31. Rabieh, A.; Albijanic, B.; Eksteen, J.J. A Review of the Effects of Grinding Media and Chemical Conditions on the Flotation of Pyrite in Refractory Gold Operations. Miner. Eng. 2016, 94, 21–28. [Google Scholar] [CrossRef]
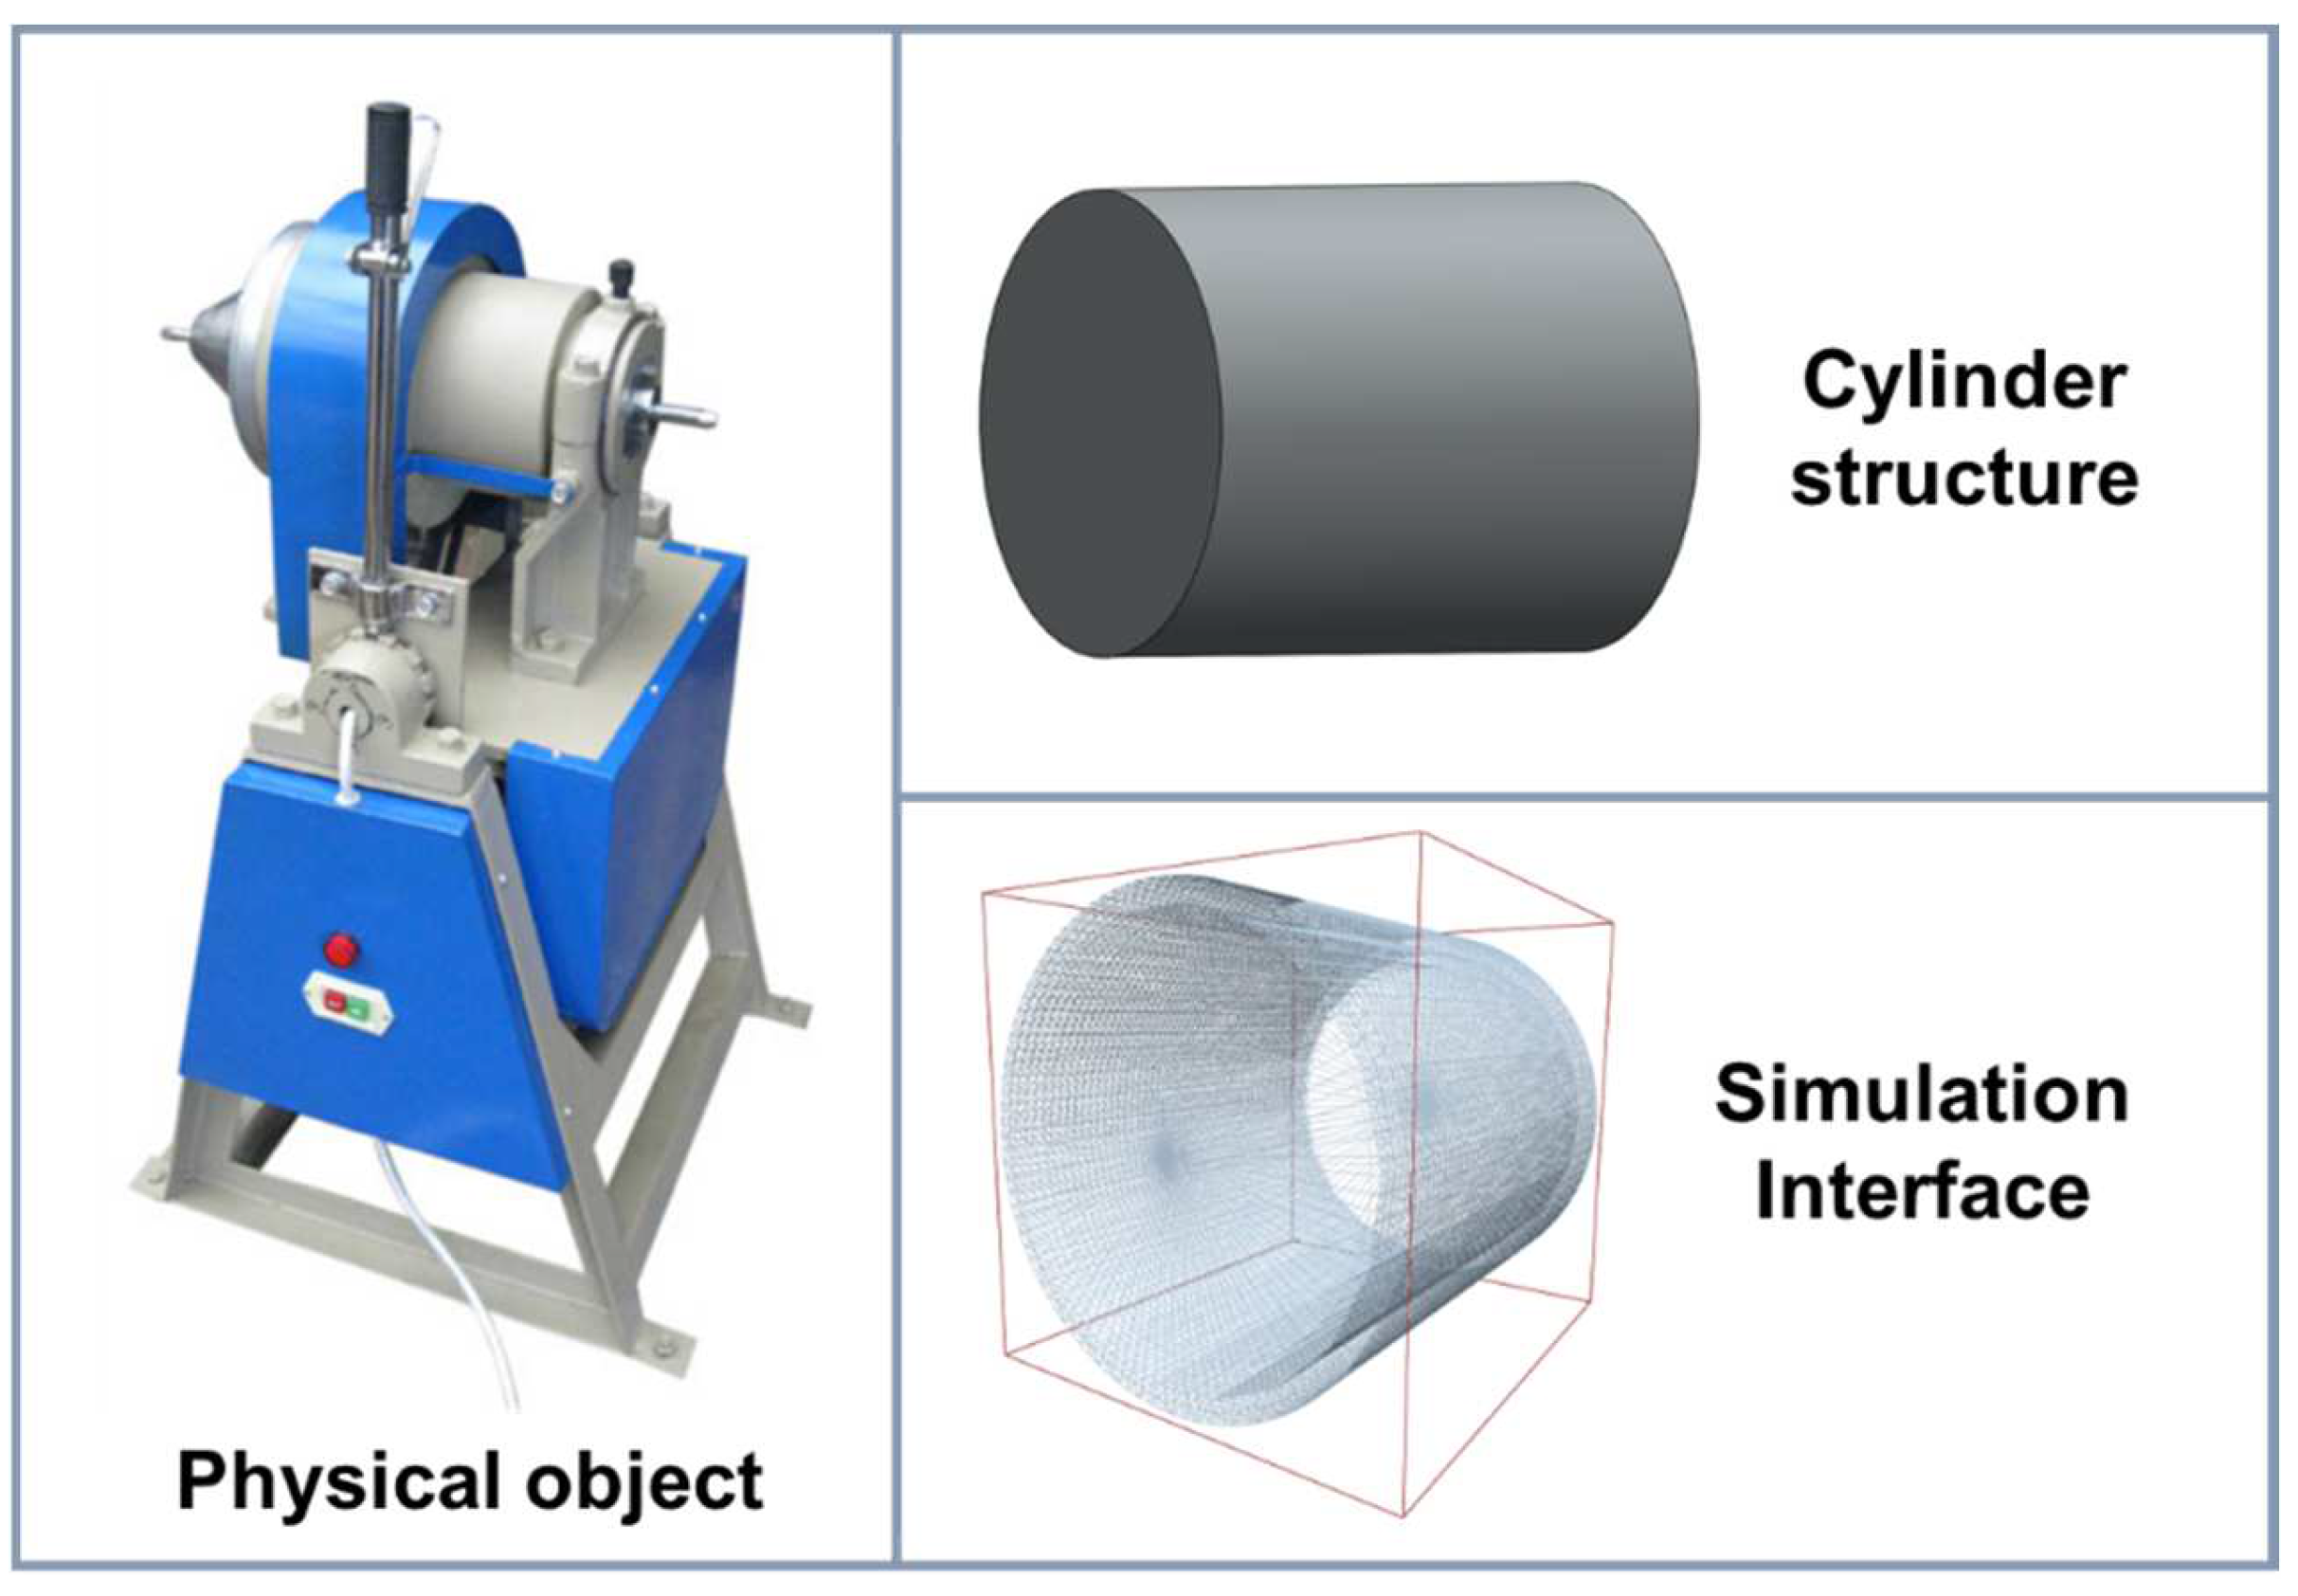
Figure 1. Schematic diagram of the tumbling mill.
Minerals 14 00875 g001
Figure 2. Simulation flow chart.
Minerals 14 00875 g002
Figure 3. Simulation process of particle behavior in the mill.
Minerals 14 00875 g003
Figure 4. The influence of particle size on flow dynamics. (a) 5 mm–19 mm, (b) 5 mm–26 mm, (c) 5 mm–31 mm, (d) 5 mm–42 mm, (e) 2.5 mm–19 mm, (f) 2.5 mm–26 mm, (g) 2.5 mm–31 mm, (h) 2.5 mm–42 mm.
Minerals 14 00875 g004
Figure 5. Particle collision energy distribution under different grinding conditions.
Minerals 14 00875 g005
Figure 6. Comparisons of simulated and measured grinding rate (s−1).
Minerals 14 00875 g006
Figure 7. Probability of collision energy distribution: (a) 42 mm, (b) 31 mm, (c) 26 mm, (d) 19 mm.
Minerals 14 00875 g007
Figure 8. Collision frequency between ball and particle in different energy ranges (a) 10−15–10−9 J, (b) 10−11–10−5 J, (c) 10−5–10−1 J.
Minerals 14 00875 g008
Figure 9. The collision of media with minerals under different ratios by 31 mm and 19 mm (a) B-B, (b) B-P, (c) P-P.
Minerals 14 00875 g009
Figure 10. The collision of media with minerals under different ratios by 42 mm and 19 mm (a) B-B, (b) B-P, (c) P-P.
Minerals 14 00875 g010
Figure 11. Change in grinding power under single-sized media.
Minerals 14 00875 g011
Figure 12. Change in grinding power under mixed−sized media.
Minerals 14 00875 g012
Figure 13. The total force of mill linear in single-sized media grinding. The mineral particle size composition is 5 mm:2.5 mm = 40%:60%.
Minerals 14 00875 g013
Figure 14. The total force of mill linear in mixed-sized media grinding. The medium size is 42 mm and 19 mm, and the mineral particle size composition is 5 mm:2.5 mm = 40%:60%.
Minerals 14 00875 g014
Figure 15. Normal cumulative force of mill linear.
Minerals 14 00875 g015
Figure 16. Tangential cumulative force of mill linear.
Minerals 14 00875 g016
Table 1. Medium size distribution formula.
EquationN1/N231 and 19 mm42 and 19 mm
Particle size-related method d 1 / d 2 3 α / β 40:6040:60
Equal quality method d 1 / d 2 2 50:5050:50
Equal surface area method d 1 / d 2 3 62:3869:31
Mass–surface area method d 1 / d 2 1 73:2773:27
Equal number method 1 81:1990:10
Fixed ratio-20:8020:80
Table 2. Physical and contact parameters of minerals and balls.
Parameters Values
Mineral density (kg/m3) 2300
Steel density (kg/m3) 7850
Mineral Poisson’s ratio 0.25
Steel Poisson’s ratio 0.3
Mineral shear modulus 7.55 × 10⁷
Steel shear modulus 7.80 × 10⁸
Coefficient of RestitutionMedia–Media0.5
Media–Minerals0.4
Minerals–Minerals0.25
Coefficient of Static FrictionMedia–Media0.5
Media–Minerals0.6
Minerals–Minerals0.8
Coefficient of Rolling FrictionMedia–Media0.01
Media–Minerals0.02
Minerals–Minerals0.05
Table 3. Energy loss between media and mineral under single-sized media.
Particle/mmBall192631421926314219263142
Mineral2.552.5:5 = 60:40
Collision Energy loss/JmB-B17.013.813.211.519.617.515.713.017.915.313.912.2
B-P3.23.23.12.93.73.02.83.23.73.43.33.1
P-P1.21.51.71.90.81.01.01.21.11.51.71.5
Table 4. Energy loss between media and mineral under mixed-sized media.
Particle/mmBall31 and 1942 and 19
Ratio20
80
40
60
50
50
62
38
73
27
81
19
20
80
40
60
50
50
69
31
73
27
90
10
Mineral2.5:5 = 60:40
Collision Energy loss/JmB-B17.016.215.915.715.014.117.215.915.613.813.613.5
B-P3.53.53.53.63.73.33.83.83.73.83.93.6
P-P1.31.41.61.51.61.51.41.51.51.91.91.7
Breakage Rates/s−1−2.5 mm0.2560.2660.2710.2720.2740.2760.2560.2690.2700.2760.2770.277
Disclaimer/Publisher’s Note: The statements, opinions and data contained in all publications are solely those of the individual author(s) and contributor(s) and not of MDPI and/or the editor(s). MDPI and/or the editor(s) disclaim responsibility for any injury to people or property resulting from any ideas, methods, instructions or products referred to in the content.