Article

Investigation of the Flotation of an Ore Containing Bastnaesite and Monazite: Kinetic Study and Process Flowsheet Simulation

by
Claude Bazin
1,* and
Jean-François Boulanger
2
1
Department of Mining, Metallurgy and Material Engineering, Laval University, Québec, QC G1A 1A1, Canada
2
Research Institute on Mines and the Environment, Université du Québec en Abitibi-Témiscamingue, Rouyn-Noranda, QC J9X 5E4, Canada
*
Author to whom correspondence should be addressed.
Minerals 2024, 14(9), 906; https://doi.org/10.3390/min14090906
Submission received: 8 July 2024 / Revised: 22 August 2024 / Accepted: 31 August 2024 / Published: 4 September 2024

Abstract

:
Laboratory flotation tests carried out using an ore sample containing Rare Earth Elements (REEs) present as monazite and bastnaesite show that the flotation of monazite is slower and yielded lower recovery than that of bastnaesite. Results show that when studying the performances of a concentration process for an REE ore, it is essential to not look only at the behavior of the individual REEs but to convert elemental assays into mineral assays to obtain the mineral’s actual response to the concentration process. The results of the laboratory flotation tests are used to calibrate a flotation simulator applied to study different circuit configurations for the concentration of the REE minerals. Indeed, it is shown that for the studied ore, two cleaning stages of a rougher concentrate are sufficient to produce a concentrate with a Total Rare Earth Oxide (TREO) grade above 40%, which is acceptable for the subsequent hydrometallurgical process. The simulation also shows that it may be feasible, if required for the hydrometallurgy step, to separate bastnaesite and monazite by taking advantage of the different flotation kinetics of the two minerals.

1. Introduction

Rare Earth Elements (REEs) stand for the family of lanthanides (Ln) encompassing La to Lu and Y and Sc [1]. Currently, most of the REEs come from primary sources, with an increasing effort to add REE recycling of e-waste [2] to primary sources. Although REEs are found in more than 15 different minerals [1], bastnaesite (LnF(CO3)) and monazite (Ln(PO4)) are the main industrially exploited minerals for REE production. Currently mined REE orebodies typically contain 5%–10% bastnaesite or monazite or both, with lower amounts of other REE-bearing minerals [1,3,4]. The next step following the production of a bastnaesite or monazite concentrate is the extraction (also called cracking) of the REE minerals [3], which aims at freeing the REEs from the mineral molecules that eventually end up in an aqueous solution. While the cracking of bastnaesite is commonly carried out by acid baking [3], monazite cracking is also done by caustic leaching followed by a hydrochloric acid leach [3,5]. Potential Canadian REE ores [6,7,8,9] contain fine-grained bastnaesite and monazite, for which concentration by flotation is commonly proposed and tested [9,10]. Details on the reagents used for the flotation of these minerals can be found in [1,8,9]. Few references are found dealing with the flotation kinetics of these minerals [10,11]. Despite an analysis of the flotation kinetics providing the necessary information to simulate the flotation process, it was not possible to find references dealing with the use of simulation for the design of flotation circuits for REE ores processing, a subject considered in this study.
Since the original bastnaesite flotation scheme is also applicable to monazite [12], the beneficiation of a REE ore containing the two minerals usually leads to the flotation of a bulk bastnaesite–monazite concentrate. Because of the different cracking routes for bastnaesite and monazite, as well as the differences in the management of higher amounts of certain impurities (fluorine for bastnaesite and thorium for monazite), the need to separate these two minerals from the bulk concentrate should be considered. Tabling is one process proposed [13], while another reference [14] proposes the use of potassium alum to selectively depress monazite. The idea of separating monazite from bastnaesite saw fairly little interest and novelty for a number of years, possibly because caustic cracking and acid baking can both be effective in extracting REEs from these minerals [3,5,6]. One recent study highlights the potential of dextrin hydrate to depress monazite [14]. This study also points to citric acid as a potential bastnaesite depressant [14].
The production of a bulk bastnaesite–monazite flotation concentrate is studied in this paper. Rather than studying micro-mechanisms of collector adsorption and depressant action on pure synthetic minerals [12,13], the objective of the paper is to examine the flotation of bastnaesite and monazite at a macroscopic scale using standard batch flotation tests applied to a potential REE Canadian ore. The paper also aims to show the potential of mathematical simulation for the design of REE flotation circuits. This investigation approach is seldom applied to oxide ores compared to sulfide ores [15] although it offers an inexpensive and rapid way to investigate various REE flotation circuit configurations, including a possible separation of bastnaesite from monazite.
The paper consists of four sections. Section 2 describes the ore sample used for the tests. Section 3 presents the experimental methodology, while experimental results are discussed in Section 4. Finally, Section 5 describes the simulation methodology and results.

2. Ore Sample

The ore studied in this paper was identified as a potential source of REE by Iamgold, Toronto, ON, Canada [7] following the 2010 REE price surge. The orebody, currently owned by Niobec Inc., a Magris Resources company, is located 20 km north of the town of Saguenay, Quebec, QC, Canada and has an indicated and measured resource of 531 million tons assaying 1.6% Total Rare Earth Oxide (TREO). The main REE-bearing minerals are bastnaesite and monazite, which make up approximately 1.8% of the total mass. The gangue minerals are mainly dolomite (56.1%), calcite (16.8%), ankerite (16.3%), iron oxides (6.1%) and silicates (3.0%). The bastnaesite and monazite average mineral grain size is less than 25 µm, as measured by MLA and SEM-EDS (JKTech, Brisbane, Australia), which implies that a significant size reduction is required to liberate the valuable minerals.
The Iamgold ore sample was received as 100 kg of core samples from exploration. The core samples were jaw and roll crushed to −1.7 mm (10 mesh). The crushed ore was thoroughly mixed and separated using a rotary splitter into 1.0 kg batch samples for the metallurgical test work. Three batches were then randomly picked out of the 100 prepared batches. One batch was used to measure the Bond Work index of the ore following the standard procedure documented in [16]. The other batches were used to get the ground product D80 vs. grinding time curve for the 20 cm dia × 30 cm long laboratory rod mill used to grind the ore for the flotation tests. The rod mill charge consists of 19.8 kg of stainless steel rods with a diameter of 2.1 cm (9% w/w), 1.9 cm (19% w/w), 1.6 cm (28% w/w), 1.3 cm (21% w/w), 0.95 cm (21% w/w) and 0.64 cm (2% w/w). Following the grinding tests, the ground material of two samples having a D80 below 50 µm was sampled to obtain two sub-samples submitted to chemical analysis by ICP-MS (Agilent Technologies, Santa Clara, USA) following digestion by borate fusion of the ore samples [17]. The results of the analysis are given in Table 1. The assays of the two samples are fairly reproducible, and the average TREE of 1.5% is consistent with the estimated 1.6% TREO composition of the orebody [7]. The ore sample is thus similar to the ore body, and the sample preparation yields reproducible samples.

3. Experimental Methodology
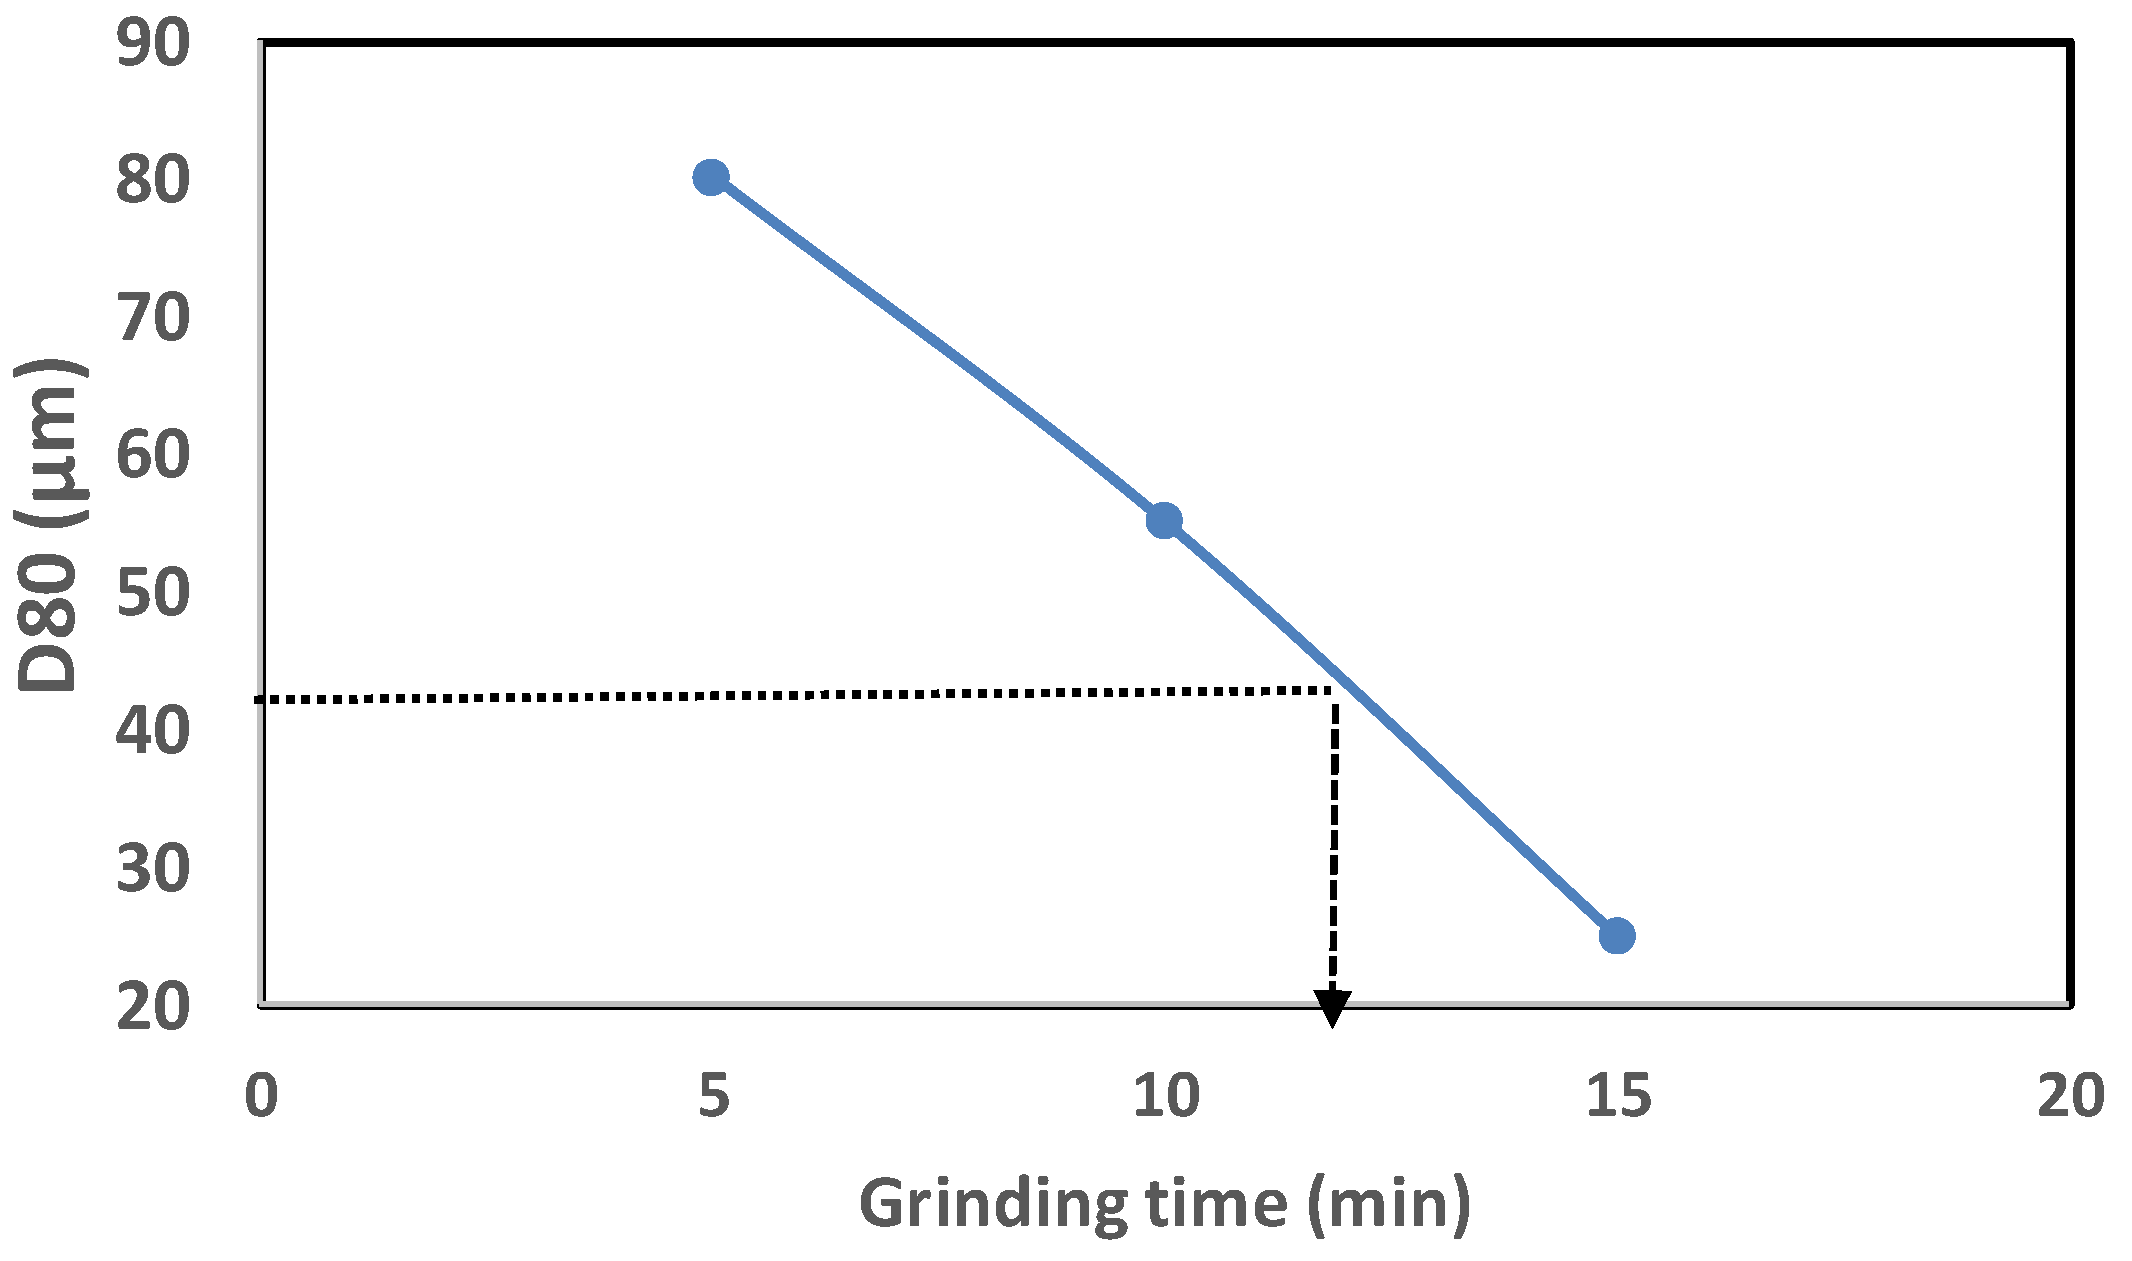
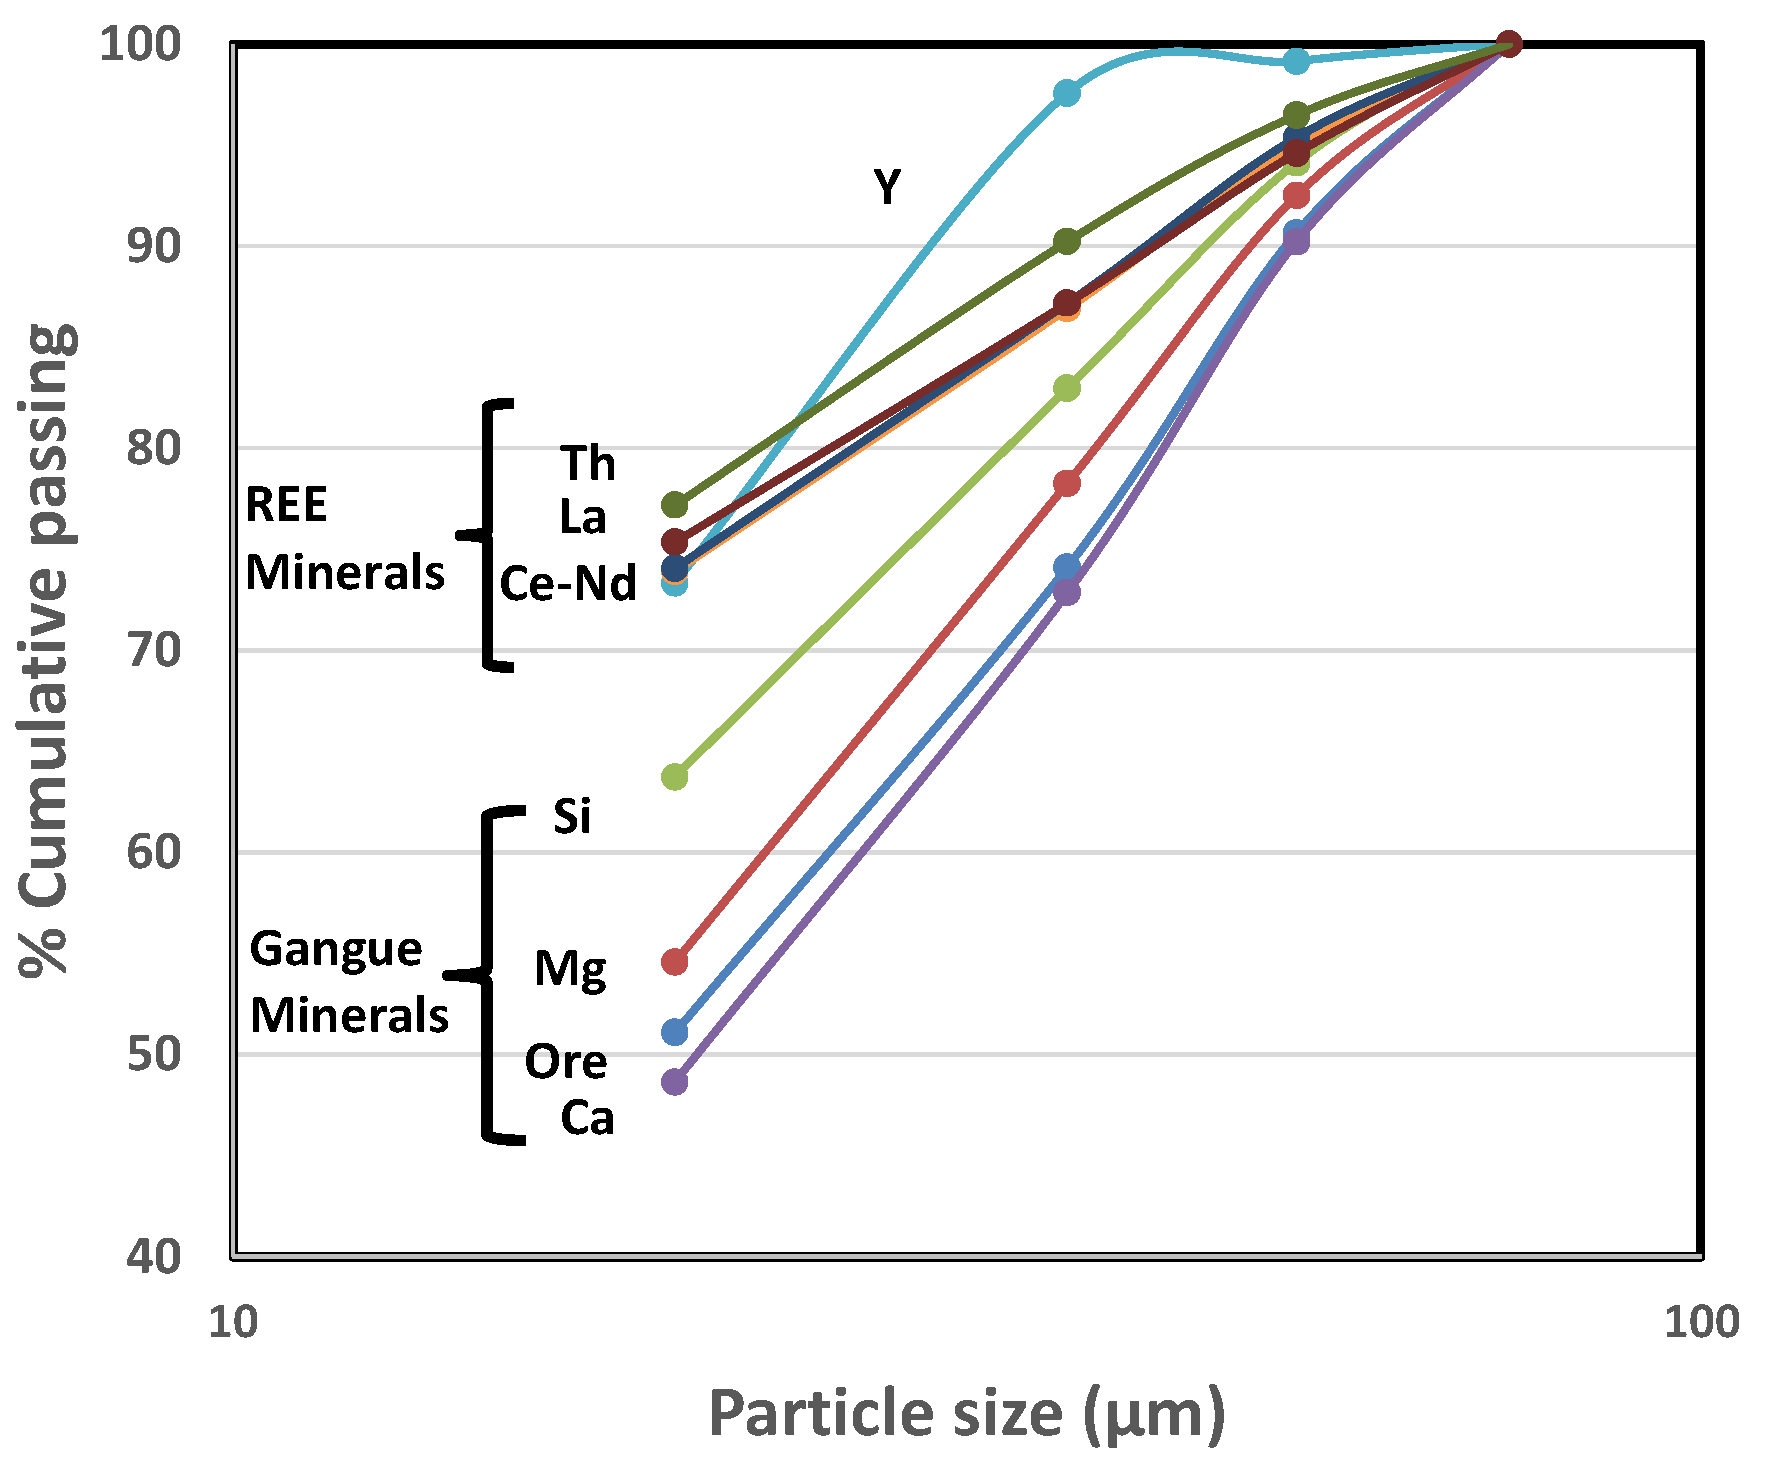
3.1. Size Reduction

The fine mineral grain size of 25 µm, as measured by MLA and SME-EDS, implies a target of a D80 of at least 45 µm for the ground product. This is achieved by 12 min of grinding of a 1.0 kg ore batch in the above-described rod mill and interpolated on the D80 vs. time graph shown in Figure 1.
The ore is relatively soft with a Bond Work Index of 10 kWh/t, which is anticipated for a carbonate ore. The D80 of the 12 min ground ore is 45 µm as measured with a Malvern Mastersizer 3000 (Malvern Panalytical, Malvern, England). The ground ore was sieved on size intervals 74/53 µm, 53/38 µm, 38/20 µm, and −20 µm to obtain the size fractions to be assayed for their REE contents. The distributions of mass (ore) and various elements in the different size fractions are shown in Figure 2. The finer size distributions of La, Nd, and Ce compared to gangue elements are an indication that these elements may belong to minerals that are more friable than the gangue minerals. Yttrium shows a different distribution compared to other REEs, indicating that yttrium is found in different minerals as well. It is also possible that some fine REE mineral grains could be encapsulated into coarser particles of gangue minerals, a hypothesis that can be assessed by MLA measurements if an in-depth analysis becomes necessary.

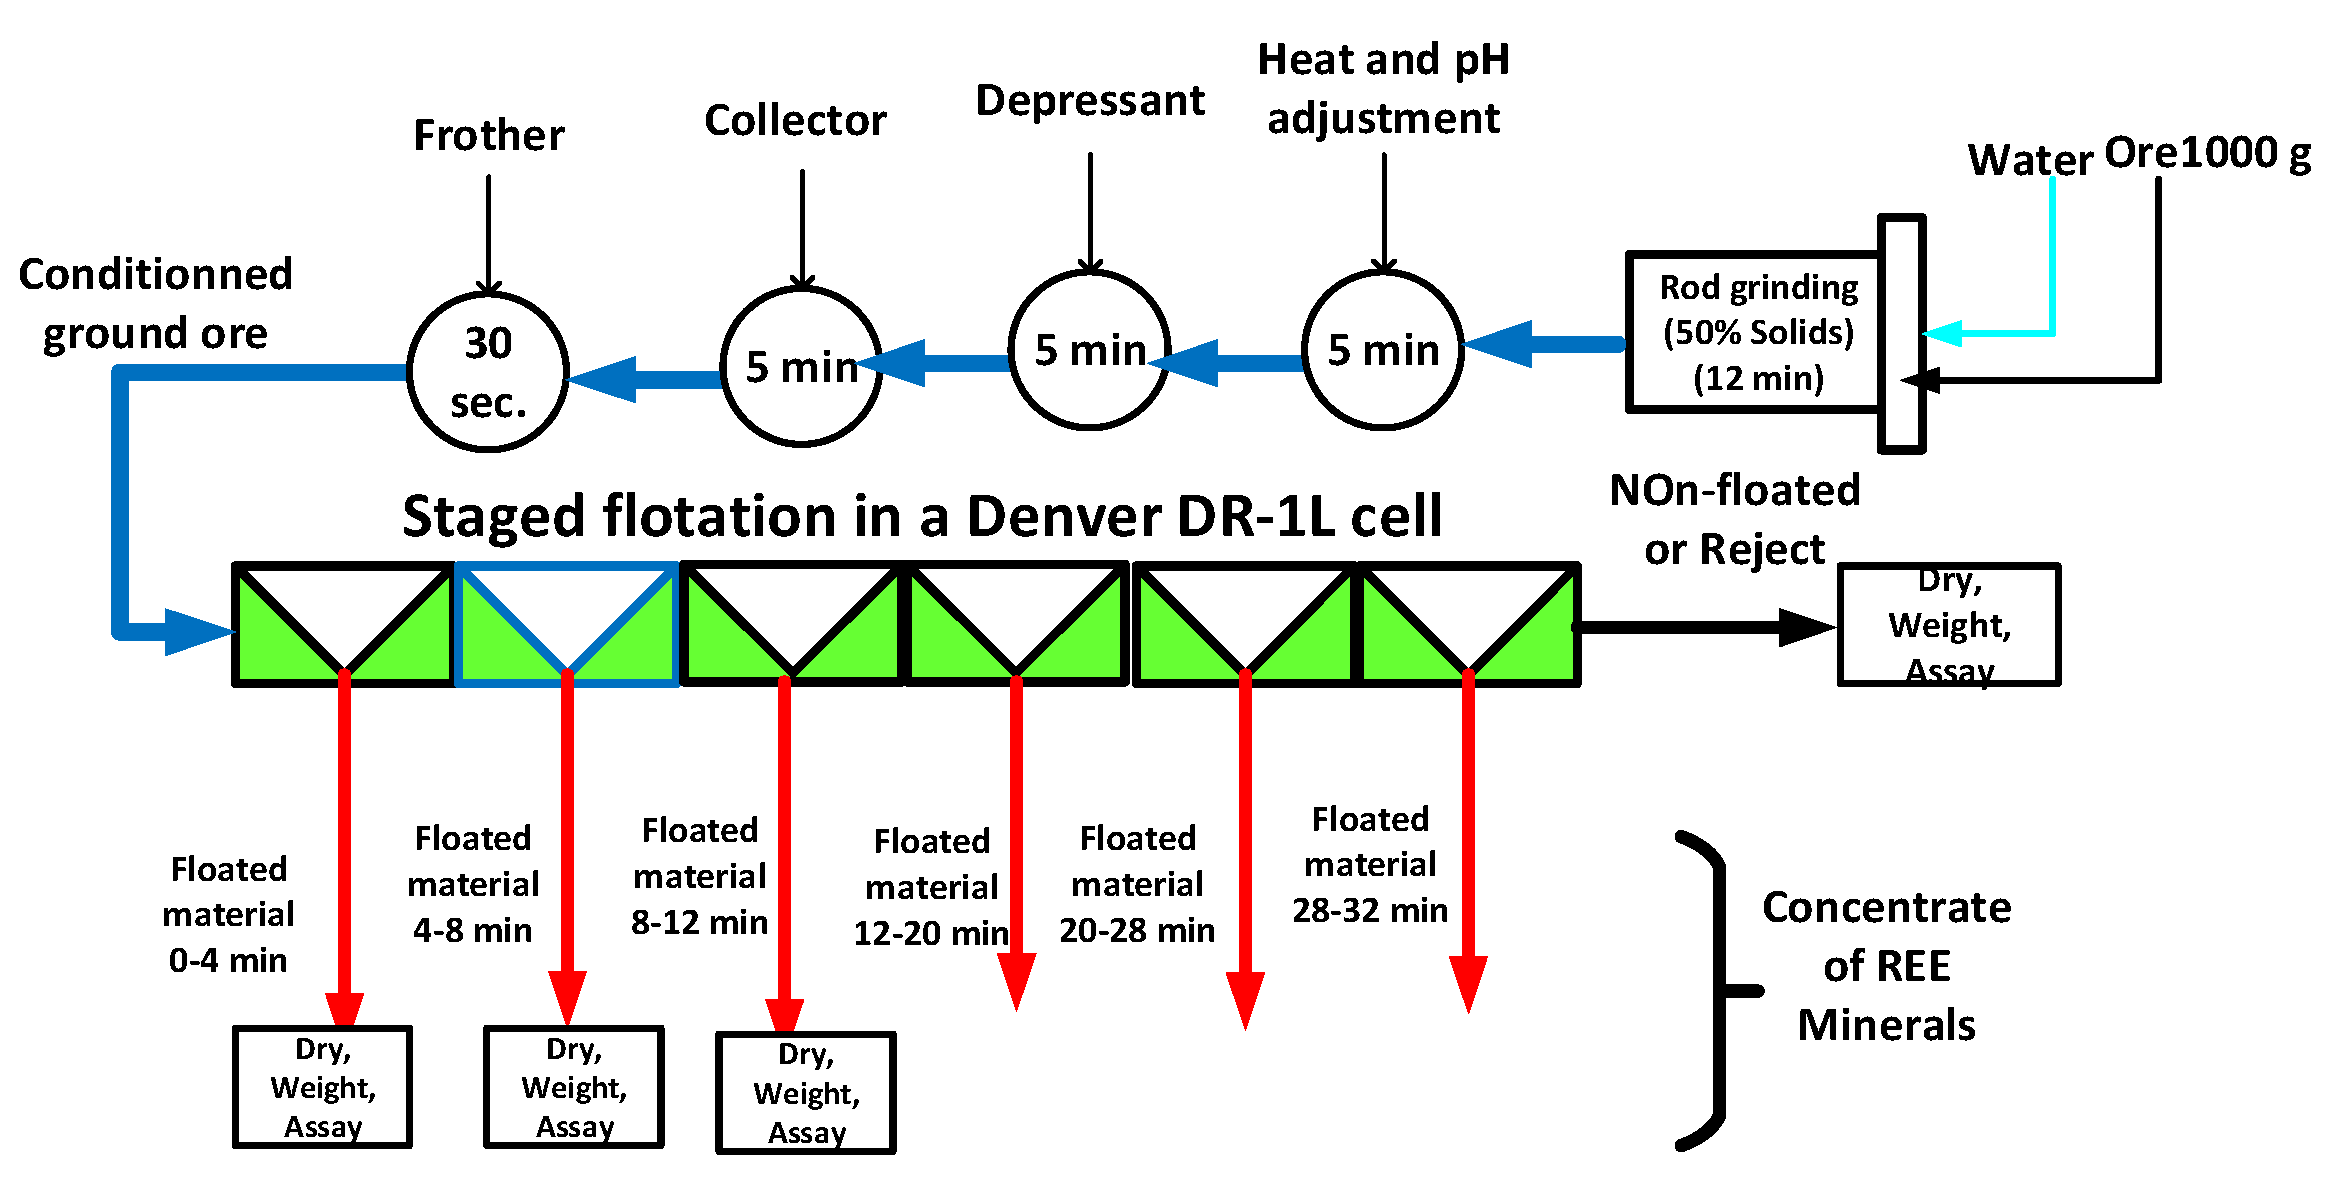
3.2. Flotation Tests

The approach retained to valorize the ore is flotation, commonly used to concentrate fine bastnaesite and monazite [1,9]. Thirty-three (33) batch rougher flotation tests [18] were conducted on the studied REE ore to identify the slurry temperature [10,18], the type of collector and depressant to be used for the Iamgold ore and the dosages of these reagents. The objective of the tests was more exploratory than part of an optimization venture. Figure 3 shows the tested flotation procedure. One (1) kg of ore is grounded in the previously described rod mill with water at 50% w/w solids. The ground slurry is transferred into a 1 L bowl of a Denver DR 2.5 L cell for conditioning and flotation. The slurry is first heated to the desired temperature using an electric heating coil, and the pH is adjusted to 8.6 with soda ash (Na2CO3). Keeping a constant pH during flotation was found difficult as the addition of a collector and depressant affected the pH. Sodium silicate (Na2SiO3 from National Silicates, Toronto, ON, Canada), cornstarch (from Casco, now Ingredion, Westchester, IL, USA) and guar gum (from Alfa Aesar, Haverhill, MA, USA) were tested as calcite and dolomite depressants but it was quickly observed that sodium silicate was the most efficient depressant for the studied ore and the testing using cornstarch and guar gum was stopped [19]. Several types of collectors reported in the literature [1,9,11,20,21,22,23] were tested, including fatty acid FA-1: tall oil (from Kraton, Houston, TX, USA), AERO_6493, AERO-704, AERo-6494 and S-9849 (from Solvay now Syensqo, Brussels, Belgium), DGA (from Alfa Aesar), salicylhydroxamic and benzohydroxamic acid (from Alfa Aesar), hydroxamic acid mixtures FLORREA 8920 and FLORREA 7150 (from FLORREA, Shenyang, China) [18]. The frother F-150 (from Flottec, Houston, TX, USA) is added with a syringe until a stable froth is obtained, which for most of the tests corresponds to a dosage of 5 g/t. After the slurry conditioning, a rougher concentrate is floated in 4 or 8 min stages for a total flotation time of 32 min (Figure 3).
Table 2 gives the test conditions and strategic metallurgical performance indices for 32 min flotation as the rougher concentrate grade and REE recovery, with the enrichment ratio (Table 2) being the ratio of TREE content of the concentrate to the TREE content of the flotation feed. Results show that the conditions of the flotation test 33 (highlighted in Table 2) gave the best grade (4.36%) and recovery (92%) combination. The results of this test are thus used in the following analysis. Obviously, more optimum conditions could be efficiently found using a factorial experimentation design centered on these test conditions, as applied to another Canadian ore [10].
The rougher concentrate products and the non-floated ore (reject) are dried, weighted and assayed for their REE, Th, Fe, Ca, Mg, and Si contents using a Panalytical Epsilon 1 EDXRF after sample preparation as borate fusion beads using a X-300 electric fusion apparatus (Katanax, Quebec City, QC, Canada). The measured weights and assays are used to back-calculate the feed mass and composition using:
W F = t = 1 N t W C ( t ) + W R
x F ; i = t = 1 N t W C ( t ) x C t ; i + W R ; i W F
where WK stands for the measured or calculated mass of product K (F → Feed; R → Reject or non-floated; C(t) → Floated material in the staged product t as in Figure 3) and xK;i refers to the measured or calculated concentration of element i in product K. The number of individual concentrates is noted as Nt.

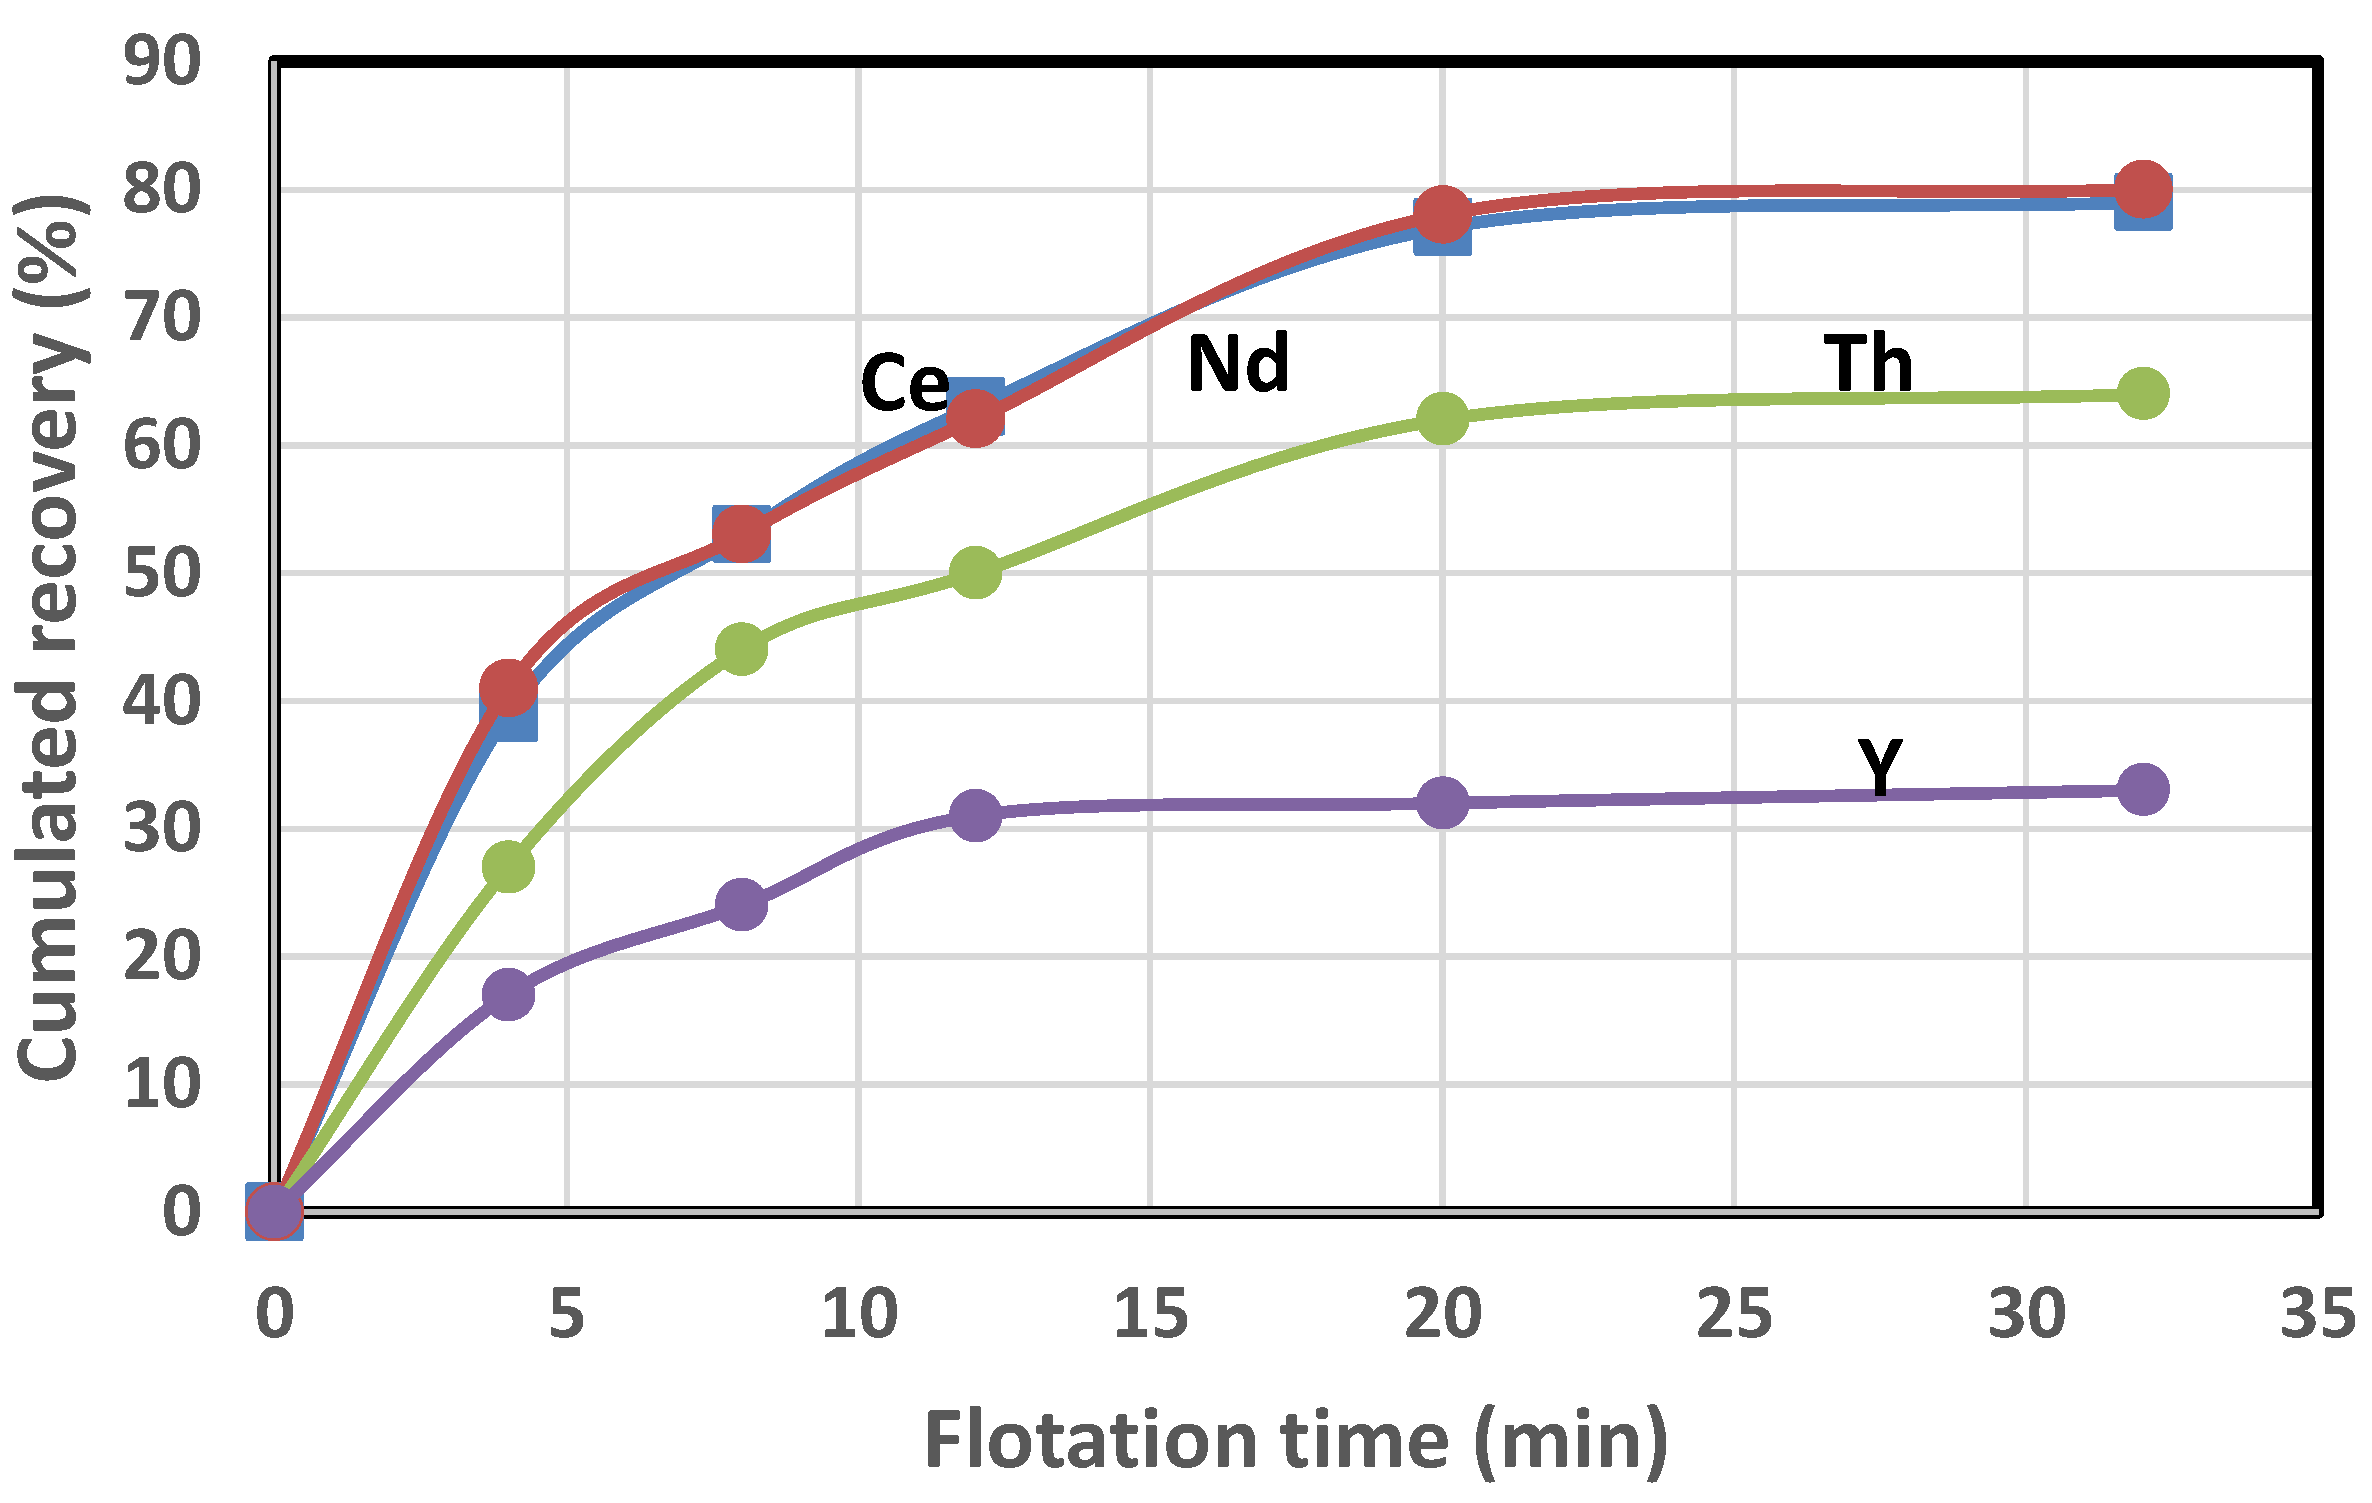
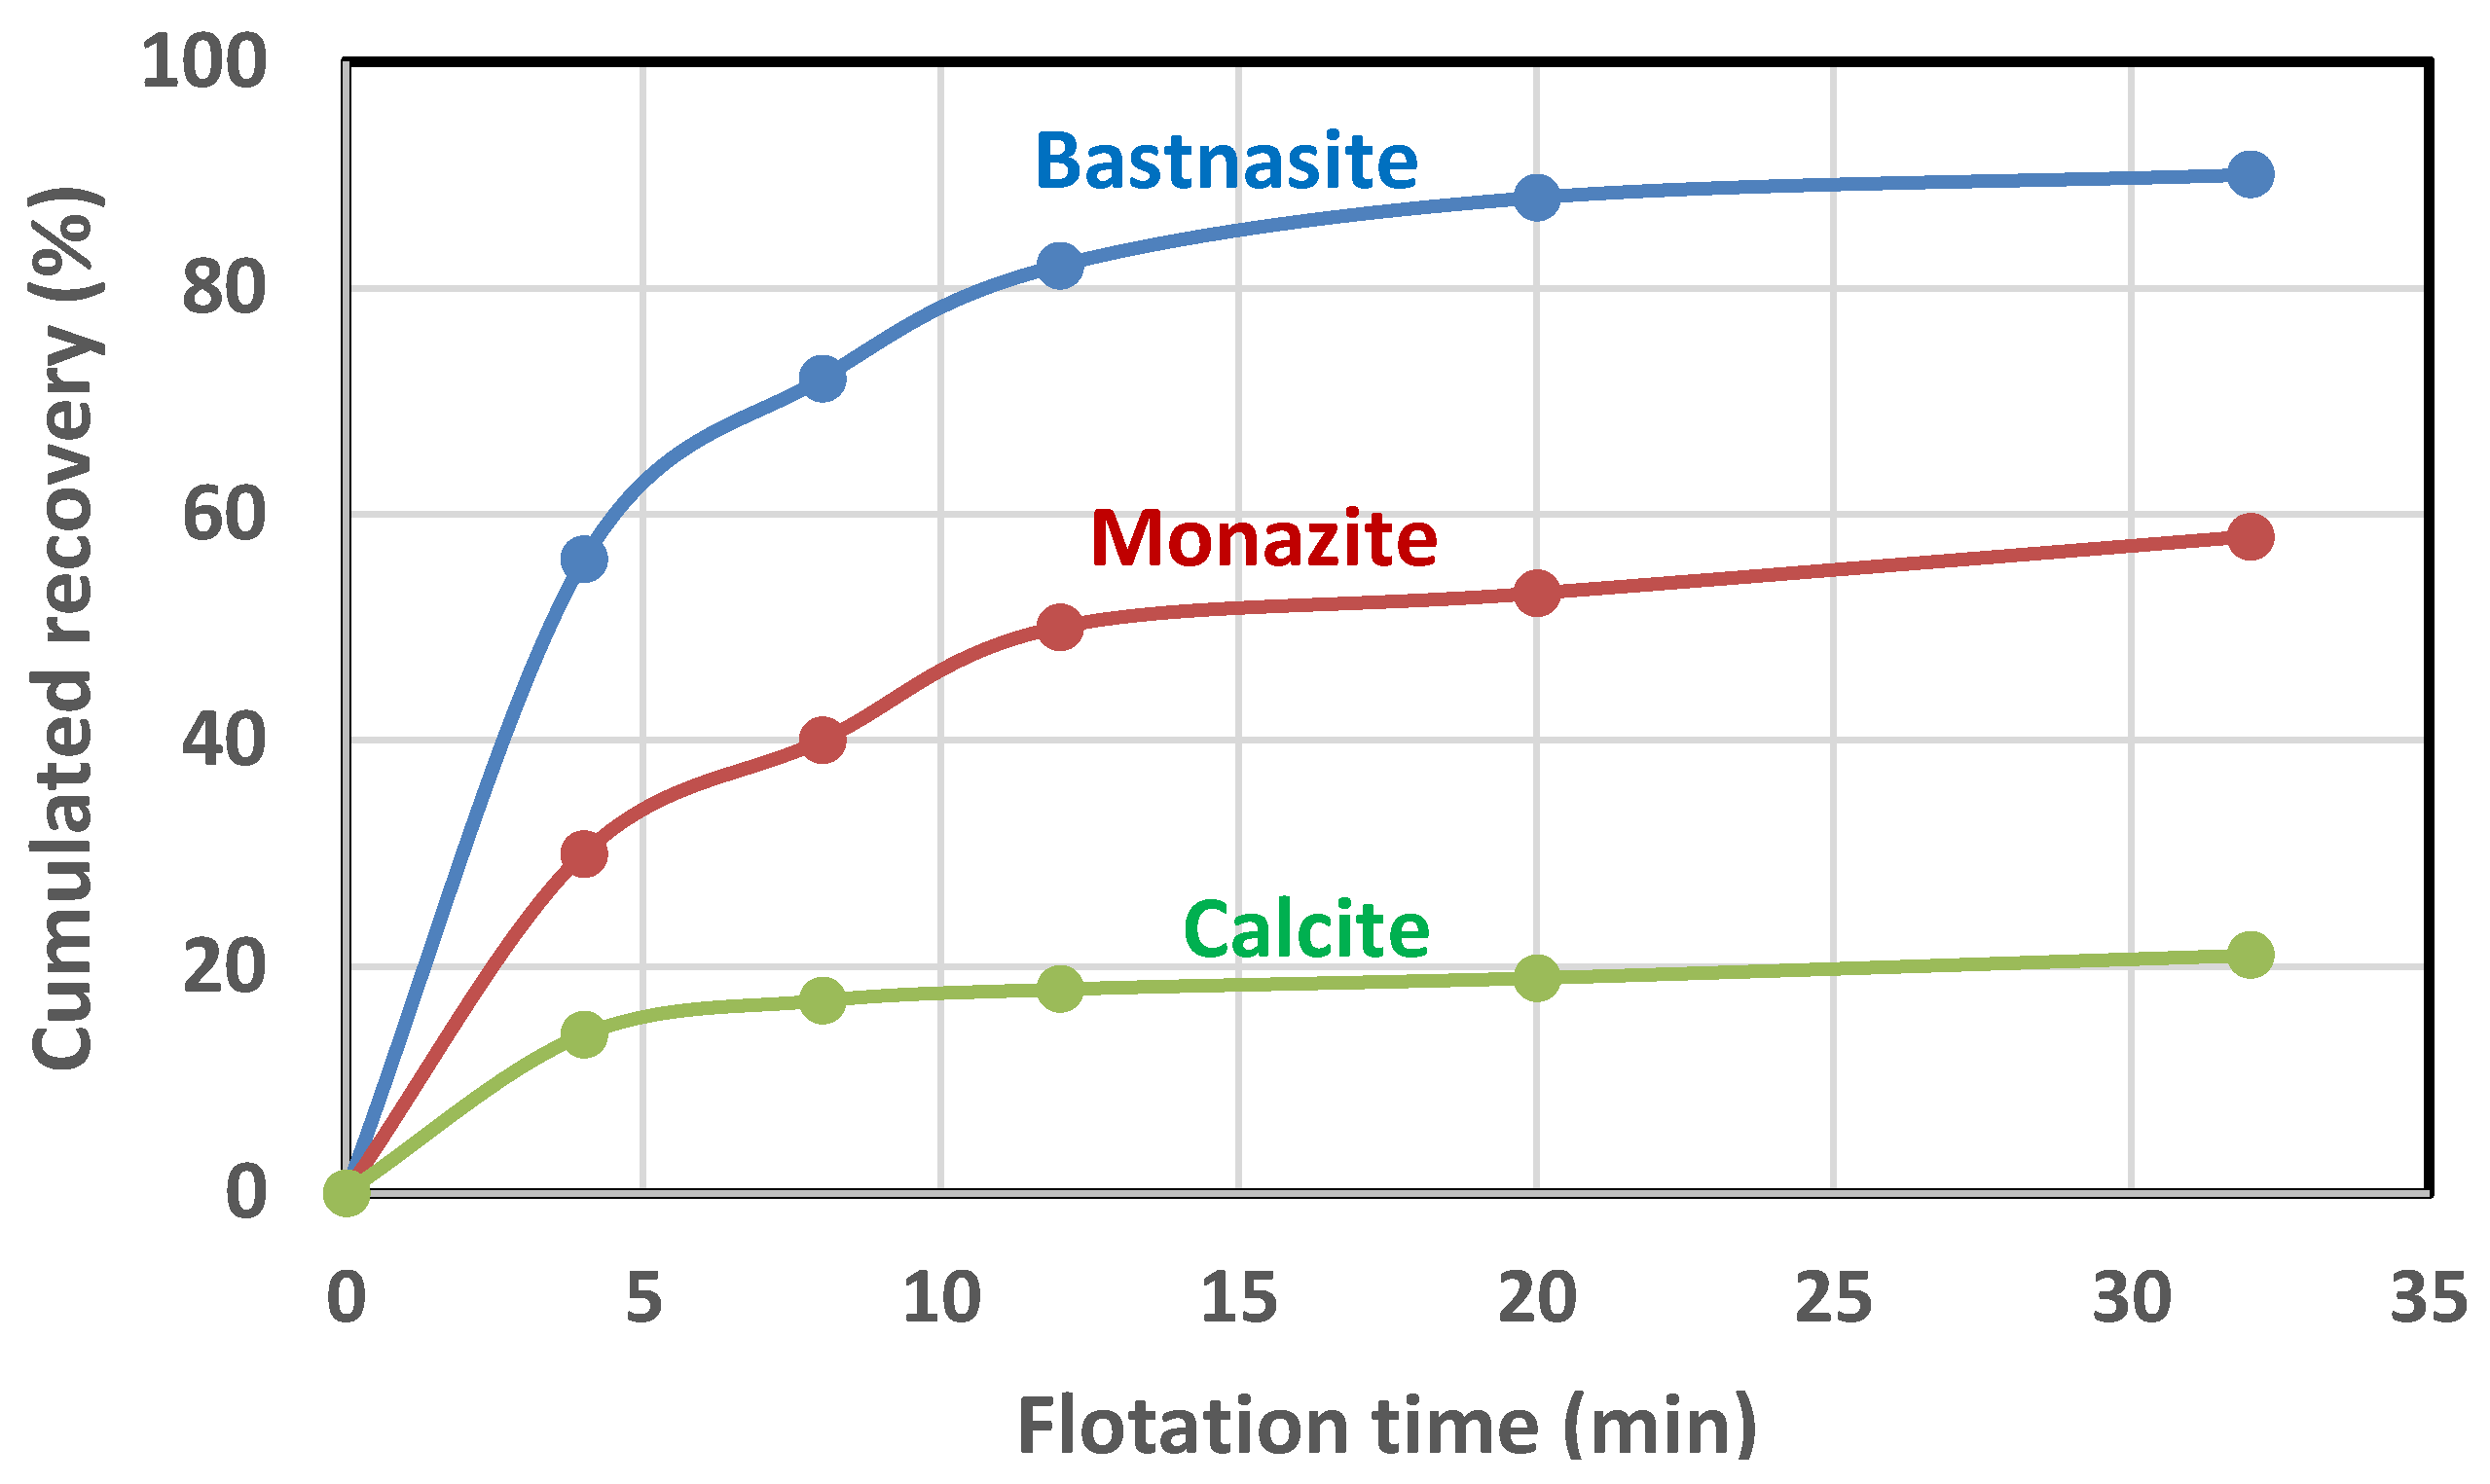
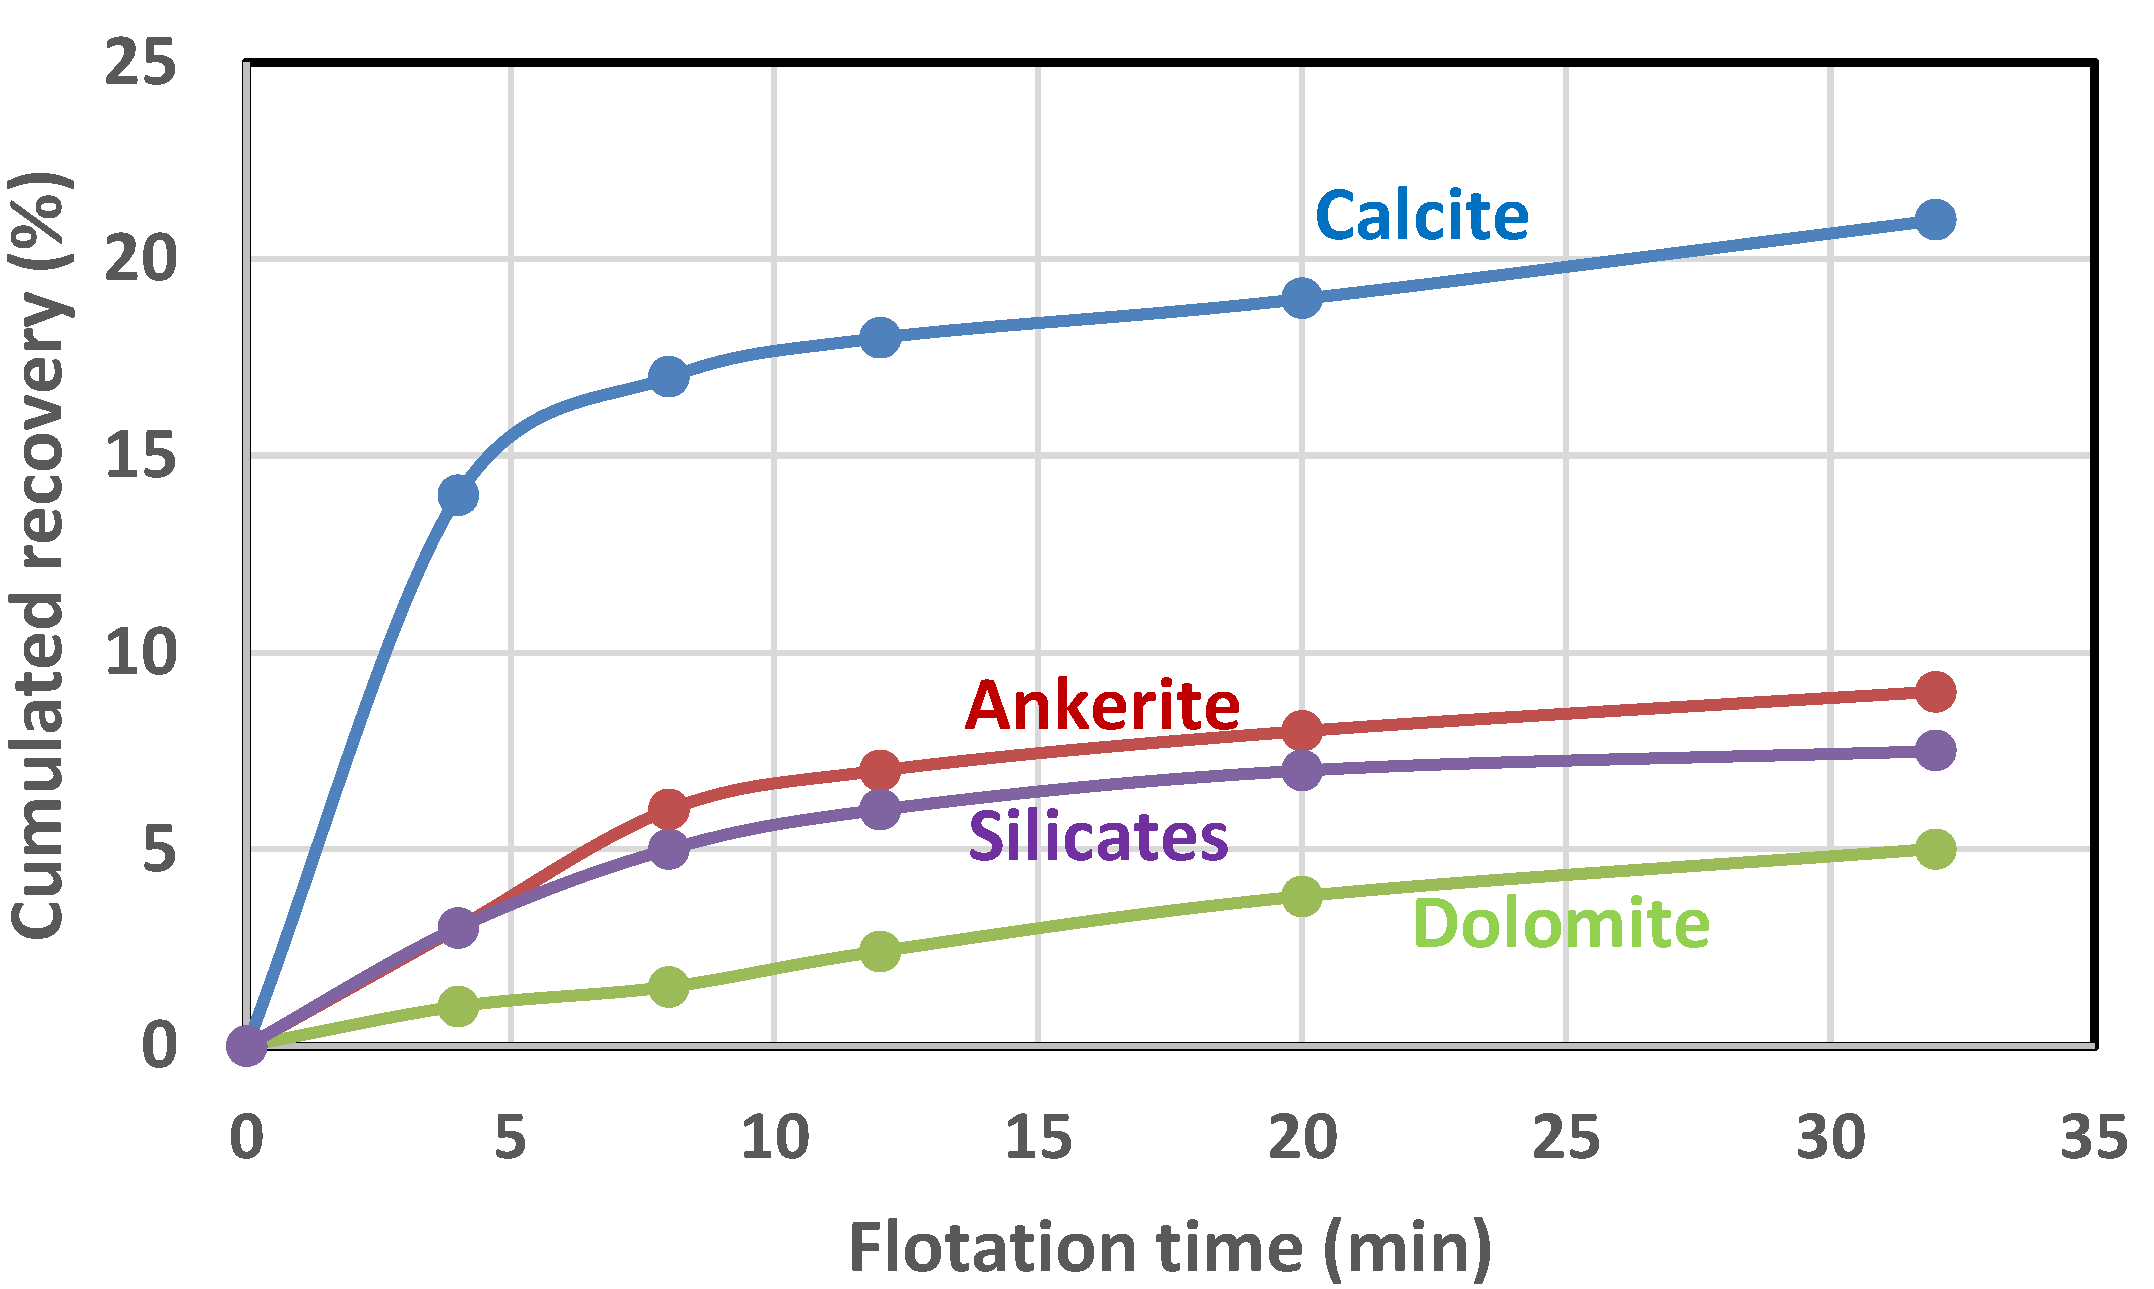
4. Analysis of the Flotation Test Results

The cumulative recovery of element i in the rougher concentrate for a cumulated flotation time of T minutes is given by:
R T ; i = t = 1 T W C ( t ) x C t ; i W F x F ; i
Figure 4 shows the test 33 (Table 2) cumulative recoveries of Ce, Nd, Y and Th vs. time, as calculated using Equation (3). Only Ce, Nd and Y are shown to avoid overcrowding the graph, and also because the heavier REE contents (Sm to Lu) are low, making the XRF assays weakly reproducible, which leads to noisier recovery/time curves than those for Ce, Nd, and Y. Ce and Nd fall exactly on the same curve which indicates that the two elements are equally distributed between the same REE minerals of the ore. This is not the case for yttrium, which is likely present in REE minerals that do not respond to flotation, as well as the minerals that carry Ce and Nd. The same comment applies to thorium, which is usually more concentrated in monazite than bastnaesite [1], suggesting that monazite could float slower than bastnaesite, as will be verified below.
The previous results show that when studying the response of an REE ore to a concentration process, one should not only look at the response of a single element, as this element could be distributed within several REE minerals that respond differently to the concentration process. Ideally, one should consider the responses of the REE minerals rather than those of the REE. Indeed, instead of elemental assaying, one can measure the mineral contents of the flotation samples using a quantitative scanning electron microscope (SEM) with energy-dispersive spectroscopy (EDS), for instance, MLA (Mineral Liberation Analysis) or QEMSCAN [8]. It is also possible to estimate the mineral composition from elemental assays [23], an approach less expensive and time-consuming than MLA and which can yield comparable results to quantitative SEM-EDS [24]. The estimation of the mineral contents from the elemental assays for the considered flotation test results allowed for the calculation of the mineral recovery-time curves shown in Figure 5, where the faster and better flotation response of bastnaesite compared to monazite is confirmed and is consistent with results of other researchers [8].
Figure 5 also shows that calcite (CaCO3), the second most abundant gangue mineral, is depressed, as are the other gangue minerals, as shown in Figure 6. The linear gangue mineral increase with respect to time (Figure 6) suggests that the recoveries of the gangue minerals into the floated products are probably a combination of true flotation (due to insufficient liberation or depression) and hydraulic entrainment [14]. The quantification of the two mechanisms would require assaying the size fractions of each flotation product to obtain the mineral recovery as a function of particle size or using an entrainment tracer, both of which are not available here. Obtaining the mineral recoveries as a function of particle size would have required isolating the ore within size classes below 20 µm (635 mesh), which accounts for more than 50% of the ore (Figure 1). Such partitioning requires the use of a cyclosizer or ultrafine screens that are not available at the time of the test work. Also, the mass of floated material is small (less than 30 g for 32 min of flotation), which poses the problem of not having sufficient ore for assaying, especially if the material is to be separated into size fractions. To carry out such an investigation, the flotation tests should be repeated with the floated products combined to provide sufficient material for the analysis of the size fractions, or the size of the ore batches has to be increased. Such an adjustment of the test procedure is planned for subsequent testing.
Results of Figure 5 also indicate a superior recovery of bastnaesite (90%) compared to that of cerium and neodymium (80%), as in Figure 4. This is likely due to Ce and Nd also being present in the slow-floating monazite. Again, this result reinforces the statement that the response of an REE ore to a concentration process should not be based solely on REE elemental analysis but by considering the REE mineral responses as the REEs may be distributed between several REE minerals that respond differently to the concentration process. A similar observation was made for iron ore [23].

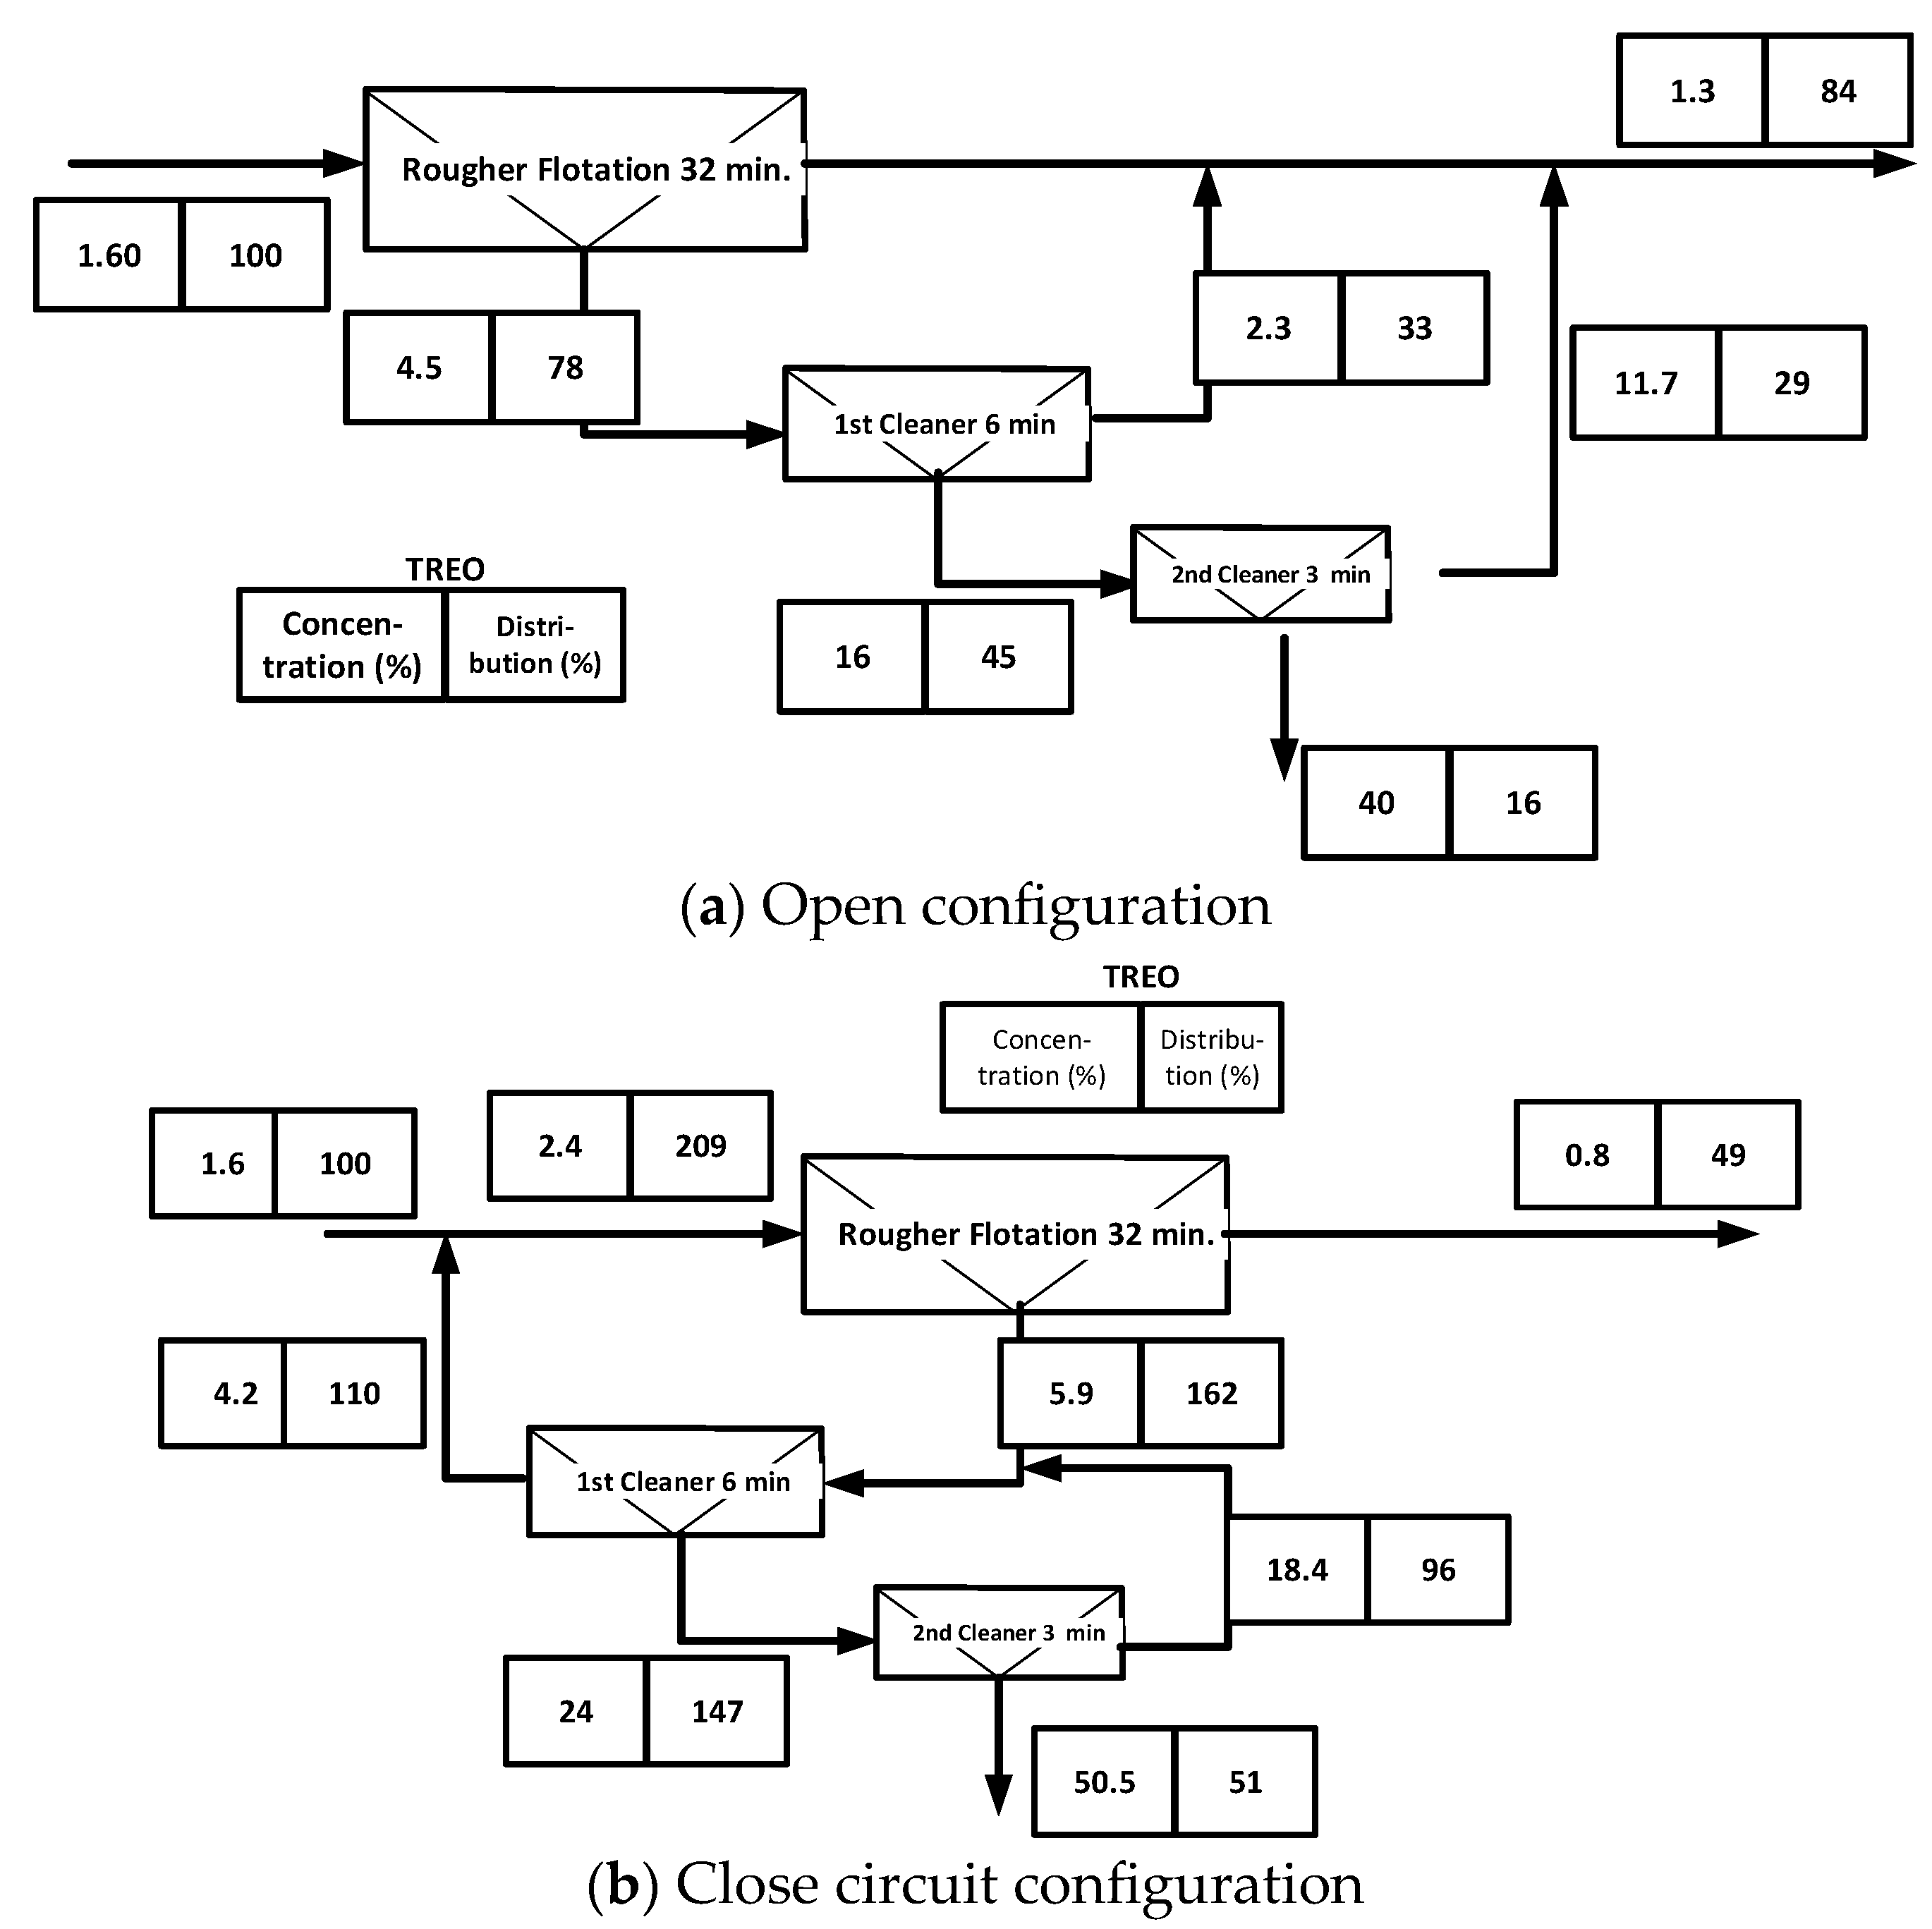
5. Process Simulation

5.1. Model for the Flotation Process

The evaluation of any ore using timed flotation tests, as conducted here, provides the necessary information to calibrate a kinetic model for the flotation process. The model can subsequently be used to study various flotation circuit configurations to process the ore [16]. Flotation is commonly represented as a first-order process for which the recovery of the floated mineral as a function of time is modeled using [8,16,25]:
R m t = R m ( ) 1 exp ( k m t )
where Rm (t) is the recovery of mineral m after a flotation time of t minutes. The model parameters that need to be estimated from experimental results are:
Rm (∞): The maximum (infinite) recovery (%) of mineral m that can be achieved with the prevailing flotation conditions (reagent dosage, fineness of grind…) and;
km: The flotation rate constant (typically expressed in min−1) of mineral m.
The calibration of the model parameters for each mineral is readily carried out using a non-linear optimization tool such as the Microsoft Excel SolverTM (version 2407). The calibrated parameter values for the considered minerals are given in Table 3. The assumption that the gangue minerals are floated is obviously a rough approximation, as the recovery response of these minerals is a combination of flotation and hydraulic entrainment, which cannot be distinguished here using the available data.
The estimated mineral infinite recoveries and flotation rate constants of Table 3 and the mineral composition (summing to 100%) of the ore correspond to the average reconstructed mineral composition of samples #1 and #2 (Table 1). The data in Table 3 provide the necessary information to simulate various configurations of flotation circuits that can yield a bulk bastnaesite–monazite concentrate assaying a target TREO content for the subsequent hydrometallurgy processing (e.g., 40% TREO [3,5]). For example, the rougher concentrate assaying 4.5% TREO that was obtained for the considered flotation test (test 33) of Table 2 should be cleaned to reach the target of 40% TREO. Laboratory batch flotation tests, including roughing and cleaning, could be conducted to assess if the target TREO concentration is achievable and the loss of REE recovery associated with cleaning. On the other hand, simulation provides an inexpensive and rapid way to carry out a first screening of the cleaning requirement, which can subsequently be validated by experimentation. An example of such an application is provided below.

5.2. Simulation of the Production of a Bulk Bastnaesite–Monazite Concentrate of Hydrometallurgical Grade

The infinite mineral recoveries and rate constants estimated from the flotation test 33 results are used for the following simulation. It is assumed that the estimated parameters from the rougher tests apply to a cleaner operation. This last assumption is pessimistic as, in practice, the cleaner operation is usually adjusted to increase the depression of gangue minerals [15]. The direct use of the rougher estimated parameters thus implies that the flotation conditions of the rougher stage are maintained for the cleaners; only the flotation time (cell volumes) is reduced to promote the recovery of the fast-floating species.
Open cleaning circuit simulations show that a minimum of two cleaning stages are necessary to produce a concentrate assaying 40% TREO. The simulation results for the open circuit configuration are summarized in Figure 7. The process can be optimized by adjusting the flotation time in the rougher and cleaning stages. The low REO recovery of 16% in the final concentrate is unacceptable due to the open circuit configuration for which the cleaner rejects are directed to the tailings, while their TREO contents are above that of the circuit feed. In practice, the cleaner should be circulated back to the upstream flotation stage, as shown for the closed circuit of Figure 7b. The study of such a closed circuit configuration in the laboratory implies carrying out locked cycle flotation tests [26] or continuous mini-piloting, both of which are costly, time-consuming, and seldom documented for REE ores. On the other hand, the simulation of a locked cycle test can readily be programmed in Microsoft ExcelTM (version 2407) and used to anticipate the results of a laboratory locked cycle test, as shown in Figure 6b. Results indicate an increase in TREO recovery from 16% for the open configuration to 51% for the closed one. The closed configuration could also increase the concentrate grade from 40% TREO to 50% TREO because the recirculation of the cleaner rejects to the upstream flotation banks increases the TREO content of their feed. The predicted requirement of two cleaning stages to produce a 40% TREO concentrate appears credible, as Mountain Pass reported using three to four cleaning stages to reach 60% TREO [1].
Simulation can be useful in studying the economic impact of the concentrate grade on the revenue as well as the capital and operating expenditures (Capex and Opex) of the hydrometallurgical plant that will process the concentrate. Indeed, simulation can rapidly provide the number of cleaning stages required to achieve any %TREO concentrate grade with the associated REE recovery and revenue losses due to the concentration process. Although increasing the concentrate grade has obvious advantages for the reduction of the capital and operating costs of the hydrometallurgical plant, it comes with an increase in the thorium content of the concentrate, as can be readily estimated by simulation. Simulation shows that the thorium content increases from 410 ppm in a 40% TREO concentrate to 520 ppm in a 50% TREO concentrate, an increase which may warrant special measures for concentrate transportation and/or handling [1].

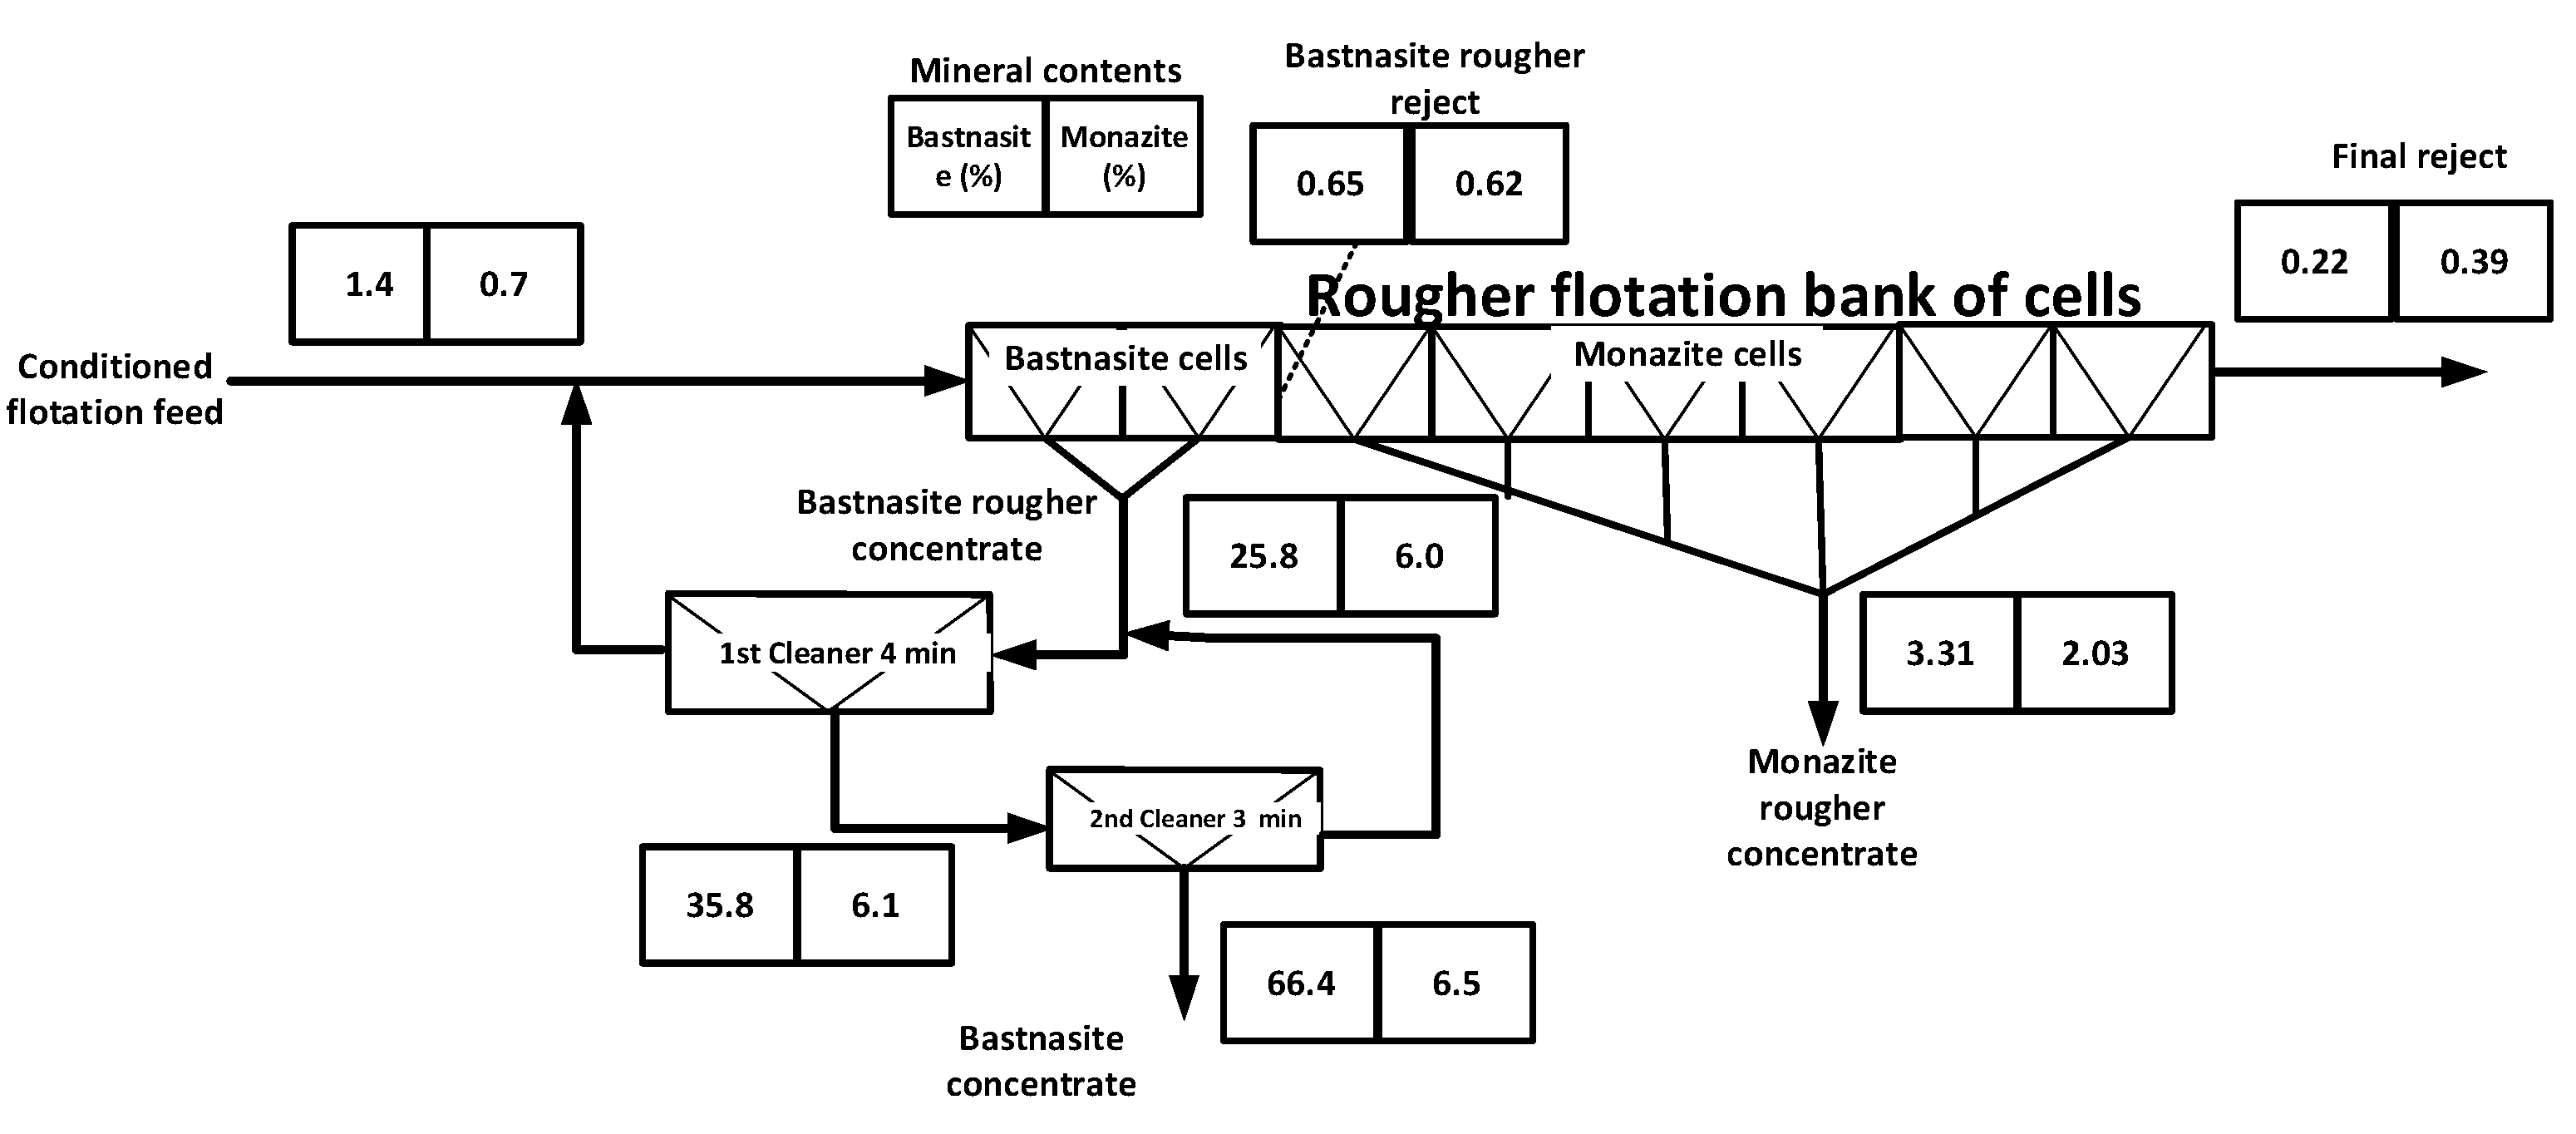
5.3. Separation of Bastnaesite and Monazite

As indicated earlier, because of the different hydrometallurgical routes and impurity management, it may be appropriate to consider separating bastnaesite from monazite. The batch flotation tests clearly show that, for the studied ore, the flotation of bastnaesite using hydroxamic acid is faster than that of monazite (Figure 5). Simulation is used here to assess if an acceptable bastnaesite/monazite separation is possible by designing a flotation circuit giving short residence times in the rougher and cleaner banks to take advantage of the faster flotation rate of bastnaesite. The concept is illustrated in Figure 8. In practice, taking advantage of some particular mineral kinetics does not require special equipment if flotation is carried out in a bank of mechanical flotation cells. Taking advantage of the differences in mineral flotation rates is not an academic fantasy as it is already practiced in sulfide ore flotation for nickel–copper separation, for instance [27]. Typically, the first rougher flotation cell concentrates are directed toward a separate circuit from the one that receives the concentrates of the downstream cells of the bank. It is also akin to the principle used by flash flotation, which is also industrially accepted [28].
The results of the simulated application of this concept are shown in Figure 8, starting from the same feed material discussed above. The concentrates of the first two rougher flotation cells (equivalent to 10 min of residence time) are directed to two cleaner stages consisting of flotation cells whose volumes are chosen to yield 4 and 3 min of residence time, respectively. The second cleaner concentrate assays 66% bastnaesite and 6.6% monazite for a TREO of 55.8%. The mineral recoveries in the bastnaesite circuit of Figure 8 are low at 55% for bastnaesite and 11% for monazite because of the short residence time in the flotation banks. Additional cleaning banks (3rd and 4th) would improve the mineral separation by lowering monazite recovery at the expense of bastnaesite recovery. Since a large portion of bastnaesite has already been recovered, the reject of the bastnaesite rougher flotation could be conditioned to depress the carbonate gangue [29] to maximize monazite recovery by flotation. Lastly, the use of a monazite depressant, such as potassium alum [13,14], would allow further improvements in separation efficiency by allowing longer flotation times to be used for bastnaesite without recovering excess monazite. The recovery of bastnaesite in the bastnaesite concentrate is 66%, while the recovery of monazite in the monazite rougher concentrate is 33%. The overall TREO recovery in the bastnaesite concentrate and monazite rougher concentrate is 74% compared to 51% for a bulk concentrate (Figure 6). A TREO recovery of lower than 74% should be expected in practice since the monazite rougher concentrate will have to be cleaned to have a concentration for hydrometallurgy.

6. Conclusions

Flotation tests conducted on an REE ore containing bastnaesite and monazite show the importance and advantages of characterizing the mineral behavior rather than assessing the flotation response using only elemental assays. The use of simulation provides a rapid and inexpensive approach to estimating the number of cleaning stages required to produce an REE concentrate suitable for hydrometallurgy. Simulation studies also show it is possible to separate bastnaesite and monazite by using the difference in the flotation rates of the two minerals.

Author Contributions

Conceptualization, C.B.; methodology, C.B. and J.-F.B.; software, C.B.; validation, C.B. and J.-F.B.; formal analysis, C.B.; investigation, J.-F.B.; resources, C.B. and J.-F.B.; data curation, C.B. and J.-F.B.; writing—original draft preparation, C.B. and J.-F.B.; writing—review and editing, C.B. and J.-F.B.; visualization, C.B.; supervision, C.B.; project administration, C.B.; funding acquisition, C.B. All authors have read and agreed to the published version of the manuscript.

Funding

This research was funded by Quebec FRQNT and the Canada NSERC/CRD program and Canmet of Natural Resources Canada with a grant from Iamgold-Niobec.

Acknowledgments

The authors acknowledge the support of Niobec for providing the ore sample and acknowledge J. Chaouki from Montreal Polytechnique for the administration of the CRD grant.

Conflicts of Interest

The authors declare no conflict of interest. The funders had no role in the design of the study; in the collection, analyses, or interpretation of data; in the writing of the manuscript; or in the decision to publish the results.

References

  1. Gupta, C.K.; Krishnamurthy, N. Extractive Metallurgy of Rare Earth; CRC Press: Boca Raton, FL, USA, 2005; 484p. [Google Scholar]
  2. Sasai, R.; Shimamura, N.; Fujimura, T. Eco-Friendly Rare-Earth-Metal Recovering Process with High Versatility from Nd- 725 Fe-B Magnets. Acs Sustain. Chem. Eng. 2020, 8, 1507–1512. [Google Scholar] [CrossRef]
  3. Qi, D. Hydrometallurgy of Rare Earths: Extraction and Separation; Elseviser: Amsterdam, The Netherlands, 2018; 796p. [Google Scholar]
  4. Dickerson, T. California minerals. Ind. Miner. 1985, 2, 21–33. [Google Scholar]
  5. Zhang, J.; Edwards, C. Mineral decomposition and leaching processes for treating rare earth ore concentrate. Can. Metall. Q. 2013, 52, 243–248. [Google Scholar] [CrossRef]
  6. Boulanger, J.-F.; Bazin, C.; Turgeon, K.; Verret, F.-O.; Downey, D. Production of partially separated rare Earth elements from a Quebec deposit. In Proceedings of the Extraction 2018 Metsoc Conference, Ottawa, ON, Canada, 19–23 August 2018; Boyd, D.R., Moats, M.S., Wang, S., Eds.; [Google Scholar]
  7. Grenier, L.; Tremblay, J.F.; Sirois, R. Ni 43-101 Technical Report, Updated Mineral Resource Estimate for Rare Earth Elements; 2012 Niobec Mine Property: Saint-Honore, QC, Canada, 2013; 166p. [Google Scholar]
  8. Jordens, A.; Marion, C.; Grammatikopoulos, T.; Hart, B.; Waters, K.E. Benefication of the Nechalacho rare earth deposit: Flotation response using benzohydroxamic acid. Miner. Eng. 2016, 99, 158–169. [Google Scholar] [CrossRef]
  9. Zhang, J.; Edwards, C. A Review of Rare Earth Mineral Processing Technology. In Proceedings of the 44th Annual Canadian Mineral Processors Operators Conference, Ottawa, ON, Canada, 17–19 January 2012. [Google Scholar]
  10. Boulanger, J.-F.; Bazin, C.; Turgeon, K. Effect of depressant on bastnaesite and monazite flotation from a Canadian rare earth elements (REE) Ore. Minerals 2019, 9, 225–236. [Google Scholar] [CrossRef]
  11. LaDouceur, R.; Young, C.A.; Amelunxen, P.A. A Modeling and Optimization of Rare Earth Mineral Flotation using Salicylhydroxamic Acid. In International Mineral Processing Congress (IMPC) 2016; Canadian Institute of Mining, Metallurgy and Petroleum: Quebec City, QC, Canada, 2016. [Google Scholar]
  12. Zhang, W.; Honaker, R.Q.; Groppo, J.G. Flotation of monazite in the presence of calcite part 1: Calcium ion effects on the adsorption of hydroxamic acid. Miner. Eng. 2017, 100, 40–48. [Google Scholar] [CrossRef]
  13. Ren, J.; Song, S.; Lopez-Valdivieso, A.; Lu, S. Selective flotation of bastnaesite from monazite in rare earth concentrates using potassium alum as depressant. Int. J. Miner. Process. 2000, 59, 237–245. [Google Scholar] [CrossRef]
  14. Wang, W.; Li, E.; Peng, Z.; Guo, C.; Hou, S.; Li, Q. Flotation separation of bastnaesite from monazite using depressant dextrin hydrate and its depression mechanism. Miner. Eng. 2023, 200, 108151. [Google Scholar] [CrossRef]
  15. Lynch, A.J. Mineral and Coal Flotation Circuits: Their Simulation and Control; Elsevier: Amsterdam, The Netherlands, 1981; 291p. [Google Scholar]
  16. Magdalinović, N. A procedure for rapid determination of the Bond Work Index. Int. J. Miner. Process. 1989, 27, 125–132. [Google Scholar] [CrossRef]
  17. Whitty-Leveille, L.; Turgeon, K.; Bazin, C.; Larivière, D. A Comparative Study of Sample Dissolution Techniques and Plasma-Based Instruments for the Precise and Accurate Quantification of REEs in Mineral Matrices. Anal. Chim. Acta 2017, 961, 33–41. [Google Scholar] [CrossRef]
  18. Boulanger, J.-F. Valorisation Des Terres Rares—Traitement de Minerais, Mise en Solution et Purification. Master’s Thesis, Université Laval, Québec, QC, Canada, 2017; 141p. [Google Scholar]
  19. Jordens, A.; Cheng, Y.P.; Waters, K.E. A review of the beneficiation methods for rare earth elements bearing minerals. Miner. Eng. 2013, 41, 97–114. [Google Scholar] [CrossRef]
  20. Yang, X.S.; Heino, N.; Pakkanen, L. Beneficiation Studies of a Rare Earth Ore from the Olserum Deposit. Nat. Resour. 2019, 10, 346–357. [Google Scholar] [CrossRef]
  21. Li, M.; Gao, K.; Zhang, D. The influence of temperature on rare earth flotation with Naphthyl Hydroxamic acid. J. Rare Earths 2018, 36, 99–107. [Google Scholar] [CrossRef]
  22. Pradip; Fuerstenau, D.W. Adsorption of Hydroxamate Collectors on Semisoluble Minerals Part II: Effect of Temperature on Adsorption. Colloids Surf. 1985, 15, 137–146. [Google Scholar] [CrossRef]
  23. Boisvert, L.; Bazin, C.; Caron, J.; Lavoie, F. Development and Testing of a Method to Estimate the Mineral Composition of Ore from Chemical Assays with a View toward Geometallurgy: Application to an Iron Ore Concentrator. Geomaterials 2022, 12, 70–92. [Google Scholar] [CrossRef]
  24. Lévesque, S.; Couet, F.; Pérez-Barnuevo, L.; Hennessey, C. Mineralogical tools for ore characterization-Key data at all steps of iron ore concentration. In Proceedings of the XXVIII International Mineral Processing Congress (IMPC), Quebec, QC, Canada, 11–15 September 2016; pp. 831–843. [Google Scholar]
  25. Dowling, E.C.; Klimpel, R.R.; Aplan, F.F. Model discrimination in the flotation of a porphyry copper ore. Miner. Metall. Process. 1985, 2, 87–101. [Google Scholar] [CrossRef]
  26. Agar, G.E. Calculation of locked cycle flotation test results. Miner. Eng. 2000, 13, 1533–1542. [Google Scholar] [CrossRef]
  27. Michaud, S.; Roberge, M.; Dumais, A. Canadian Royalties Inc.—Nunavik Nickel. In Canadian Milling Practice 2020; Bobicki, E., Gibson, C., Boulanger, J.-F., Eds.; Canadian Institute of Mining, Metallurgy and Petroleum (CIM): Ottawa, ON, Canada, 2020. [Google Scholar]
  28. Mackinnnon, S.; Yan, D.; Dunne, R. The interaction of flash flotation with closed circuit grinding. Miner. Eng. 2003, 16, 1149–1160. [Google Scholar] [CrossRef]
  29. Li, L.Z.; Yang, X. China’s Rare Earth Ore Deposits and Beneficiation Techniques. In Proceedings of the ERES2014: 1st European Rare Earth Resources Conference, Milos Island, Greece, 4–7 September 2014. [Google Scholar]
Figure 1. Variation of the ground ore D80 as a function of grinding time in the laboratory rod mill (dashed line shows the 12 min grinding time established).
Minerals 14 00906 g001
Figure 2. Ore and element size distributions in the ground product.
Minerals 14 00906 g002
Figure 3. Flotation test procedure.
Minerals 14 00906 g003
Figure 4. Elements cumulated recovery as a function of time.
Minerals 14 00906 g004
Figure 5. Mineral cumulated recoveries as a function of time.
Minerals 14 00906 g005
Figure 6. Recovery of gangue minerals as a function of time.
Minerals 14 00906 g006
Figure 7. Simulation results of open and closed flotation circuit configurations for processing the studied REE ore.
Minerals 14 00906 g007
Figure 8. Simulated intermediate products in a bastnaesite/monazite separation circuit.
Minerals 14 00906 g008
Table 1. Measured REE concentrations (g/t) of two samples of the studied ore.
LaCePrNdSmEuGdTbDyHoErTmYbYLuTotal
Sample #1 3208619672224792786019614.929.9412.51.23.982.50.9913,289
Sample #245978726106615204118126317.639.14.915.31.24.293.90.916,841
Average 39037461894200034570.523016.334.54.513.91.24.188.20.915,065
Table 2. Flotation tests conditions and metallurgical results (collectors: FA-1—FA-1 Tall Oil; A6493—AERO-6493; A704—AERO-704; A6494—AERO_6494; SA—Salicylhydroxamic acid; BA—Benzohydroxamic acid; F8920—FLOREA 8920; F8920+—FLOREA 8920 + FLOREA 7510; depressants: CS—Cornstarch; SS—Na2SiO3; SS + GG—Na2SiO3 + Guar Gum).
Test ConditionsMetallurgical Results
No.Temp.DepressantCollectorREE recov.Conc. GradeEnrichment
°CNameg/tNameg/t%%TREETREE Con/TREE Feed
180 FA-120077%1.25%0.9
280 FA-110079%1.25%0.9
380 FA-12537%1.25%0.9
450 FA-12515%0.87%0.7
525 FA-12514%1.22%0.9
680 FA-12546%1.51%1.1
780 A64932511%1.69%1.3
880 A649315036%2.45%1.8
925 A649310025%2.00%1.5
1080 FA-12547%1.25%0.9
1125 FA-12529%1.58%1.2
1225 A649310040%1.64%1.2
1325 S-98492531%2.14%1.6
1425 A7042519%2.23%1.7
1580 A7042544%1.60%1.2
1680 FA-12535%1.62%1.2
1725 A649420078%1.73%1.2
1825 A649320071%1.81%1.3
1925CS200A649320085%1.48%1.1
2025CS200FA-110064%1.64%1.1
2125SS1000A649320043%1.31%1.1
2225SS1000A649320047%2.13%1.7
2325SS1000FA-115054%1.09%1.0
2480SS1000FA-12537%1.81%1.4
2525SS1000DGA50045%2.23%1.3
2625SS1000SA20070%1.91%1.6
2725SS500BA50062%1.90%1.4
2825SS500BA25059%2.03%1.6
2925SS + GG500 + 500BA50074%2.00%1.3
3025SS + GG500 + 200F8920100077%1.71%1.1
3125SS500F8920+100078%1.79%1.2
3225SS500F8920+150077%1.89%0.0
3350SS500F8920210092%4.36%2.7
Table 3. Calibrated values for the flotation model parameters for the mineral responses of Figure 5 and Figure 6 and ore composition used for the simulation.
ParameterBastnaesiteMonaziteCalcite *Ankerite *Dolomite *Silicates *Total
R m ( ) (%)85.665.629.69.118.77.6
k m (min−1)0.260.170.290.120.070.1
Head (%) +0.61.717.441.928.610.3100
*: approximated values for R m ( ) and k m due to the inclusion of hydraulic entrainment. +: Ore composition used for the simulation.
Disclaimer/Publisher’s Note: The statements, opinions and data contained in all publications are solely those of the individual author(s) and contributor(s) and not of MDPI and/or the editor(s). MDPI and/or the editor(s) disclaim responsibility for any injury to people or property resulting from any ideas, methods, instructions or products referred to in the content.

