Article

Innovative Seismic Imaging of the Platinum Deposits, Maseve Mine: Surface and In-Mine

by
Moyagabo Rapetsoa
1,*,
Musa Manzi
1,
Ian James
1,
Mpofana Sihoyiya
1,
Raymond Durrheim
1 and
Michelle Pienaar
2
1
School of Geosciences, University of the Witwatersrand, Johannesburg 2050, South Africa
2
Mandela Mining Precinct, Johannesburg 2109, South Africa
*
Author to whom correspondence should be addressed.
Minerals 2024, 14(9), 913; https://doi.org/10.3390/min14090913
Submission received: 17 July 2024 / Revised: 26 August 2024 / Accepted: 27 August 2024 / Published: 6 September 2024
(This article belongs to the Section Mineral Exploration Methods and Applications)

Abstract

:
Maseve Mine is located in the western limb of the Bushveld Complex, recognized as the largest layered igneous intrusion in the world. The study shows results from surface (SP1, SP2, and SP3) and tunnel (T3a, T3b, and TP4b) reflection seismic profiles, totaling 4150 m. Tunnel seismic data were acquired using a seismic landstreamer and spiked geophones with 5 m receiver and shot spacing, as well as a sledgehammer for shots due to space constraints and safety. The profiles, 10–50 m above mineral deposits, crossed major geological structures. Surface seismic profiles used cabled systems and wireless sensors with 5 m and 10 m receiver spacing, respectively, and a 500 kg drop hammer as a source with 10 m shot spacing. Despite high noise levels from mine infrastructure and power cables, a careful processing workflow enhanced target reflections. Interpretation was constrained using borehole data, geological models, and 2D/3D seismic modeling. The processed data exhibit gently dipping reflections associated with faults and dykes, imaging the target mineralization (Merensky Reef and Upper Group 2) and a possible extension. Tunnel seismic experiments demonstrated the application of seismic methods using in-mine infrastructure, while surface experiments proved efficient, illustrating small-scale seismic surveys’ capability to image the subsurface, adding value in active mining environments for exploration with cost-effective seismic equipment.

1. Introduction

The South African mineral and mining industry is challenged to provide a high-quality and high-resolution deep targeting solution in a cost-effective and environmentally effective manner. However, in comparison with sectors like oil and gas, the hard rock mineral exploration industry has historically been slower to adopt new technologies due to uncertainty in exploration success, various environmental and regulatory requirements, and sticking to well-established practices that have a clear return on investment [1,2]. It should be noted that the mining sector, as well as hard rock exploration, has become more and more aware of the possible benefits of technological advances. A number of mineral discoveries have been made due to the combination of field geology, geochemistry, drilling, and different geophysical methods. However, there is still a great need for innovation and improvement in current exploration methods. Therefore, this has led to an increase in demand for providing the mining industry in South Africa with accurate geological information and knowledge that will contribute to optimal ore extraction and mine safety (i.e., achieving ‘zero harm objectives’). Innovative solutions are essential to extend the operational life of mines, identify new exploration targets, secure additional resources, generate employment opportunities, and ensure sustainable and reliable access to minerals.
Geophysical methods such as seismic reflection are the most direct and effective way of imaging mineral deposits at depth. Furthermore, seismic reflection can provide information about geological structures that host mineral deposits [3,4,5,6,7]. Surface seismic methods maintain satisfactory vertical resolution with depth and, therefore, have been used more routinely for localizing mineral deposits and mine planning in the last decades. However, seismic methods, like most exploration technologies, have their own challenges [8]. For example, seismic data acquired in brownfield areas can suffer from anthropogenic noise. In some instances, mines are unable to acquire seismic data from the surface due to restricted access to the mining site, which is caused by the mine infrastructure and environmental challenges. In such cases, in-mine seismic surveys are considered a solution [9]. However, further complications and restrictions are introduced if underground spaces (e.g., developmental tunnels, mining stopes, exploration holes, etc.) are used for seismic or other exploration purposes. The nature of these spaces imposes numerous limitations, resulting in conventional active-source seismic imaging being challenging and size-limited (small scale). Logistical challenges related to active mining operations, strong vibrational noise, combined with the GPS-denied nature of underground spaces preventing accurate time synchronization, are just some of the factors that have restricted in-mine exploration primarily to drilling and downhole electromagnetics.
In response to the challenges of deep South African mining, the Advanced Ore-body Knowledge Program project, ‘Developing technologies that will be used to obtain information ahead of the mine face, such as tunnel seismic prediction’, was launched. As part of the project, multiple high-resolution in-mine and surface seismic surveys were conducted in 2020 and 2022 at Maseve Mine, which hosts two of the most economic platinum group element deposits in the country. The main objectives of this study are to (1) substantiate the use of small-scale seismic surveys in highly noisy and logistically challenging mine environments; (2) image the extension of the deep mineralization and associated geological structures; and (3) understand the challenges in acquiring seismic data and the innovative approaches needed to overcome them. Apart from the innovative survey design and processing, our experiments utilized 3D reflection modeling to assist with the interpretation of the seismic sections. The study links the deep reflections imaged on surface seismics with the observed near-surface (below tunnel) in-mine seismic reflections. We show how in-mine seismic data can provide key information on mineralization and its associated geological structures.

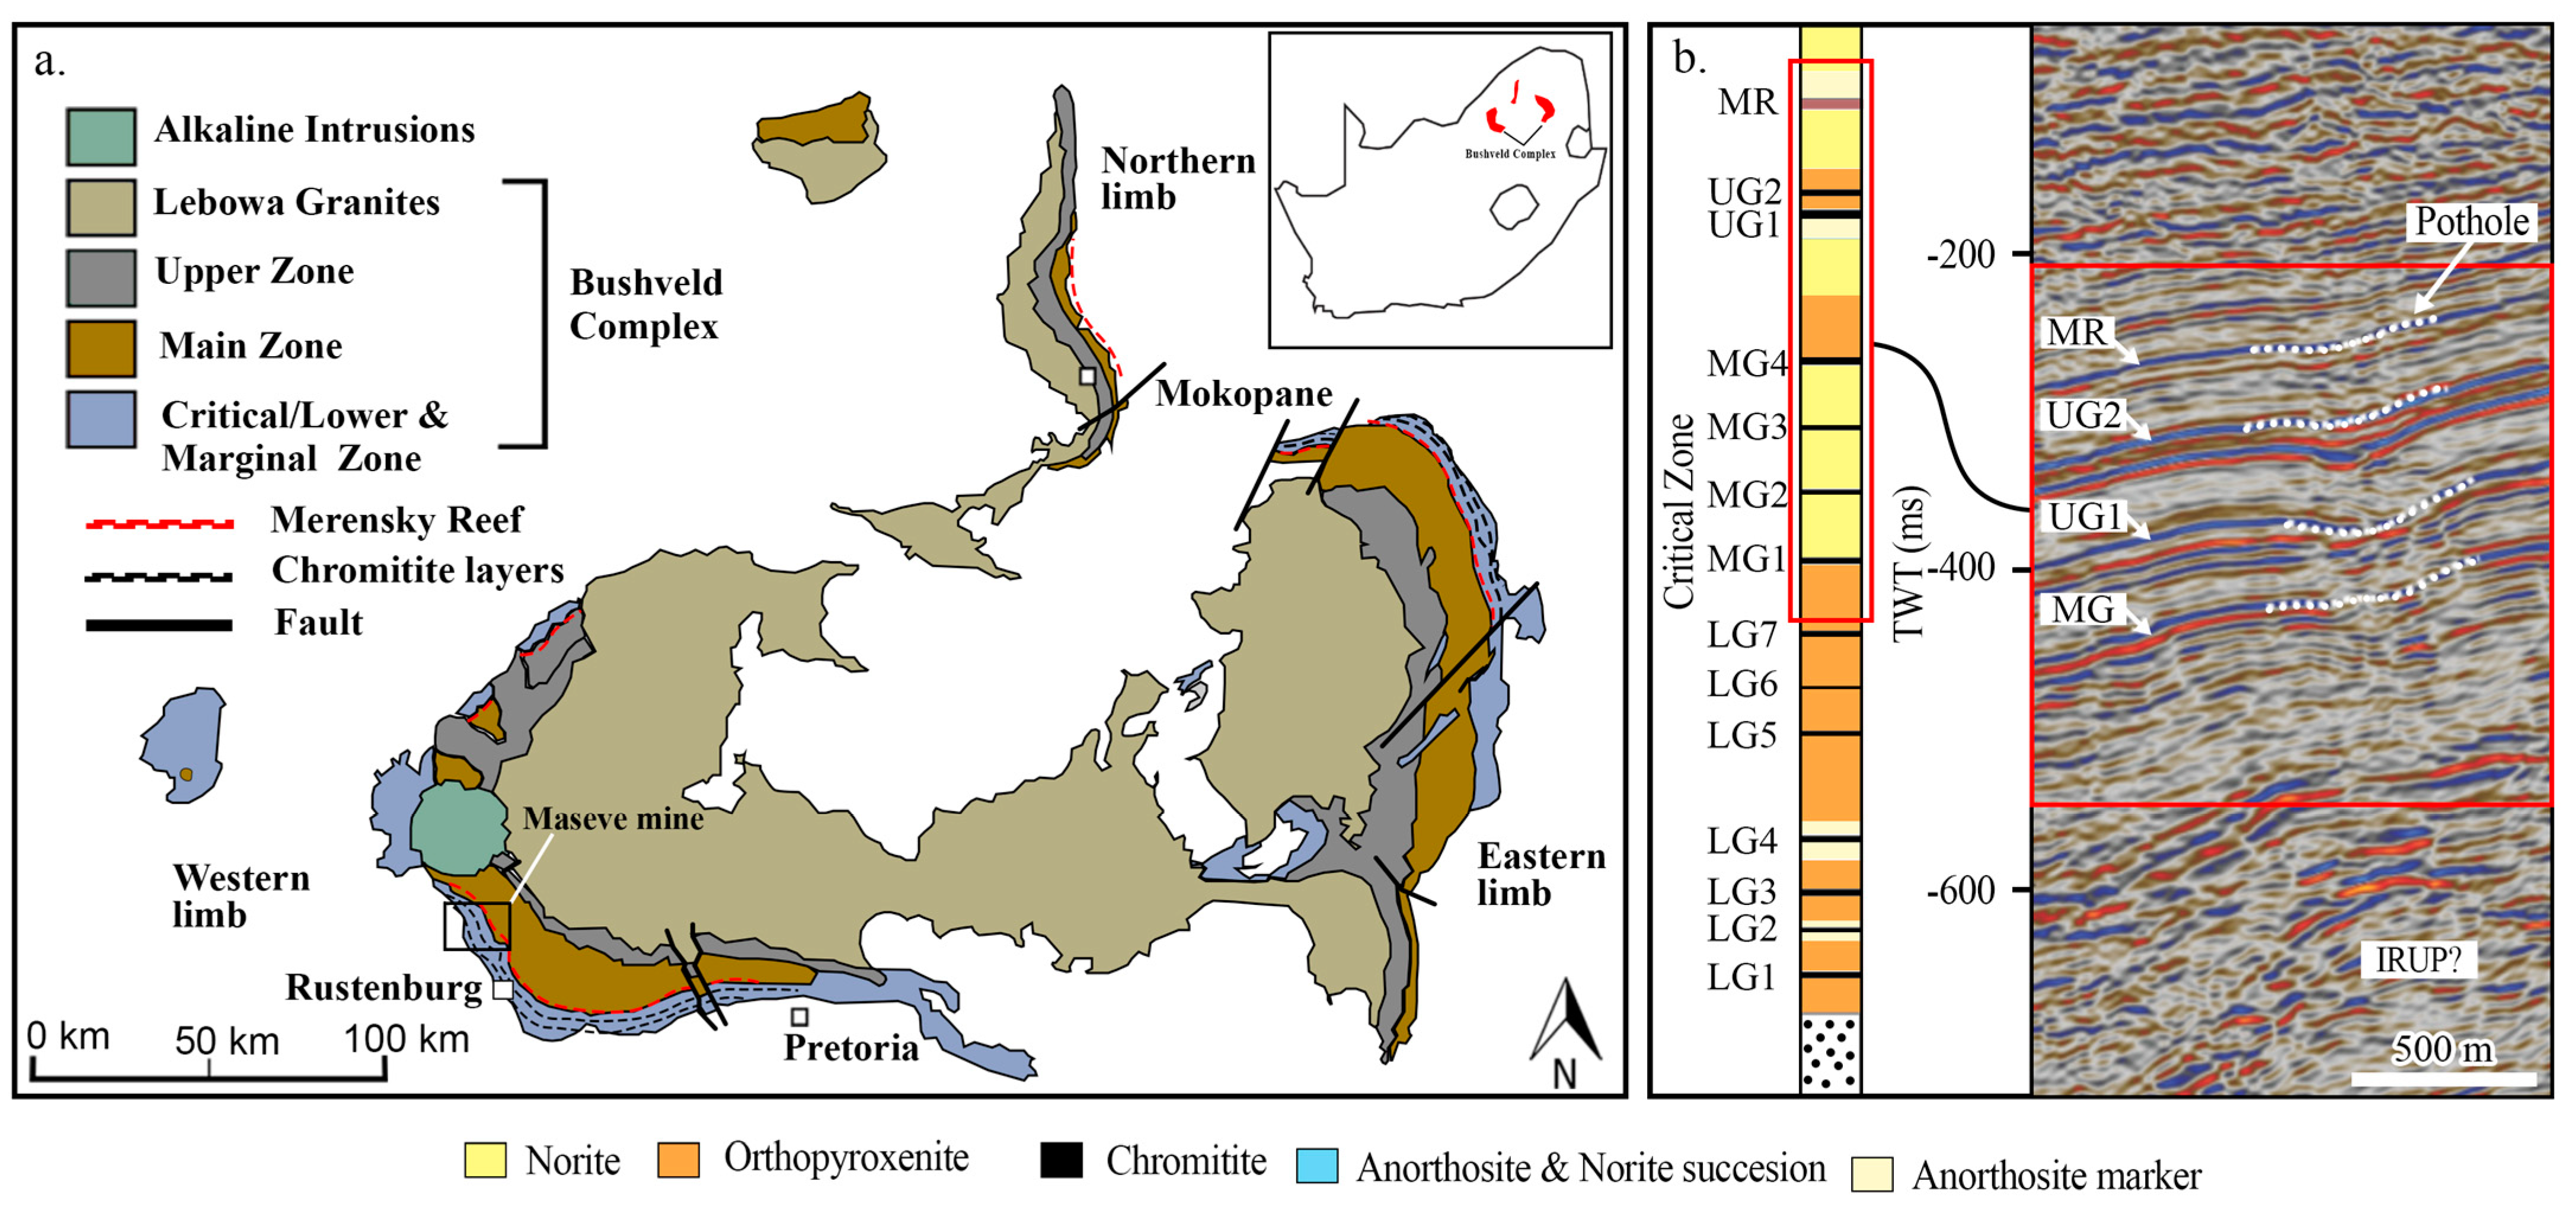
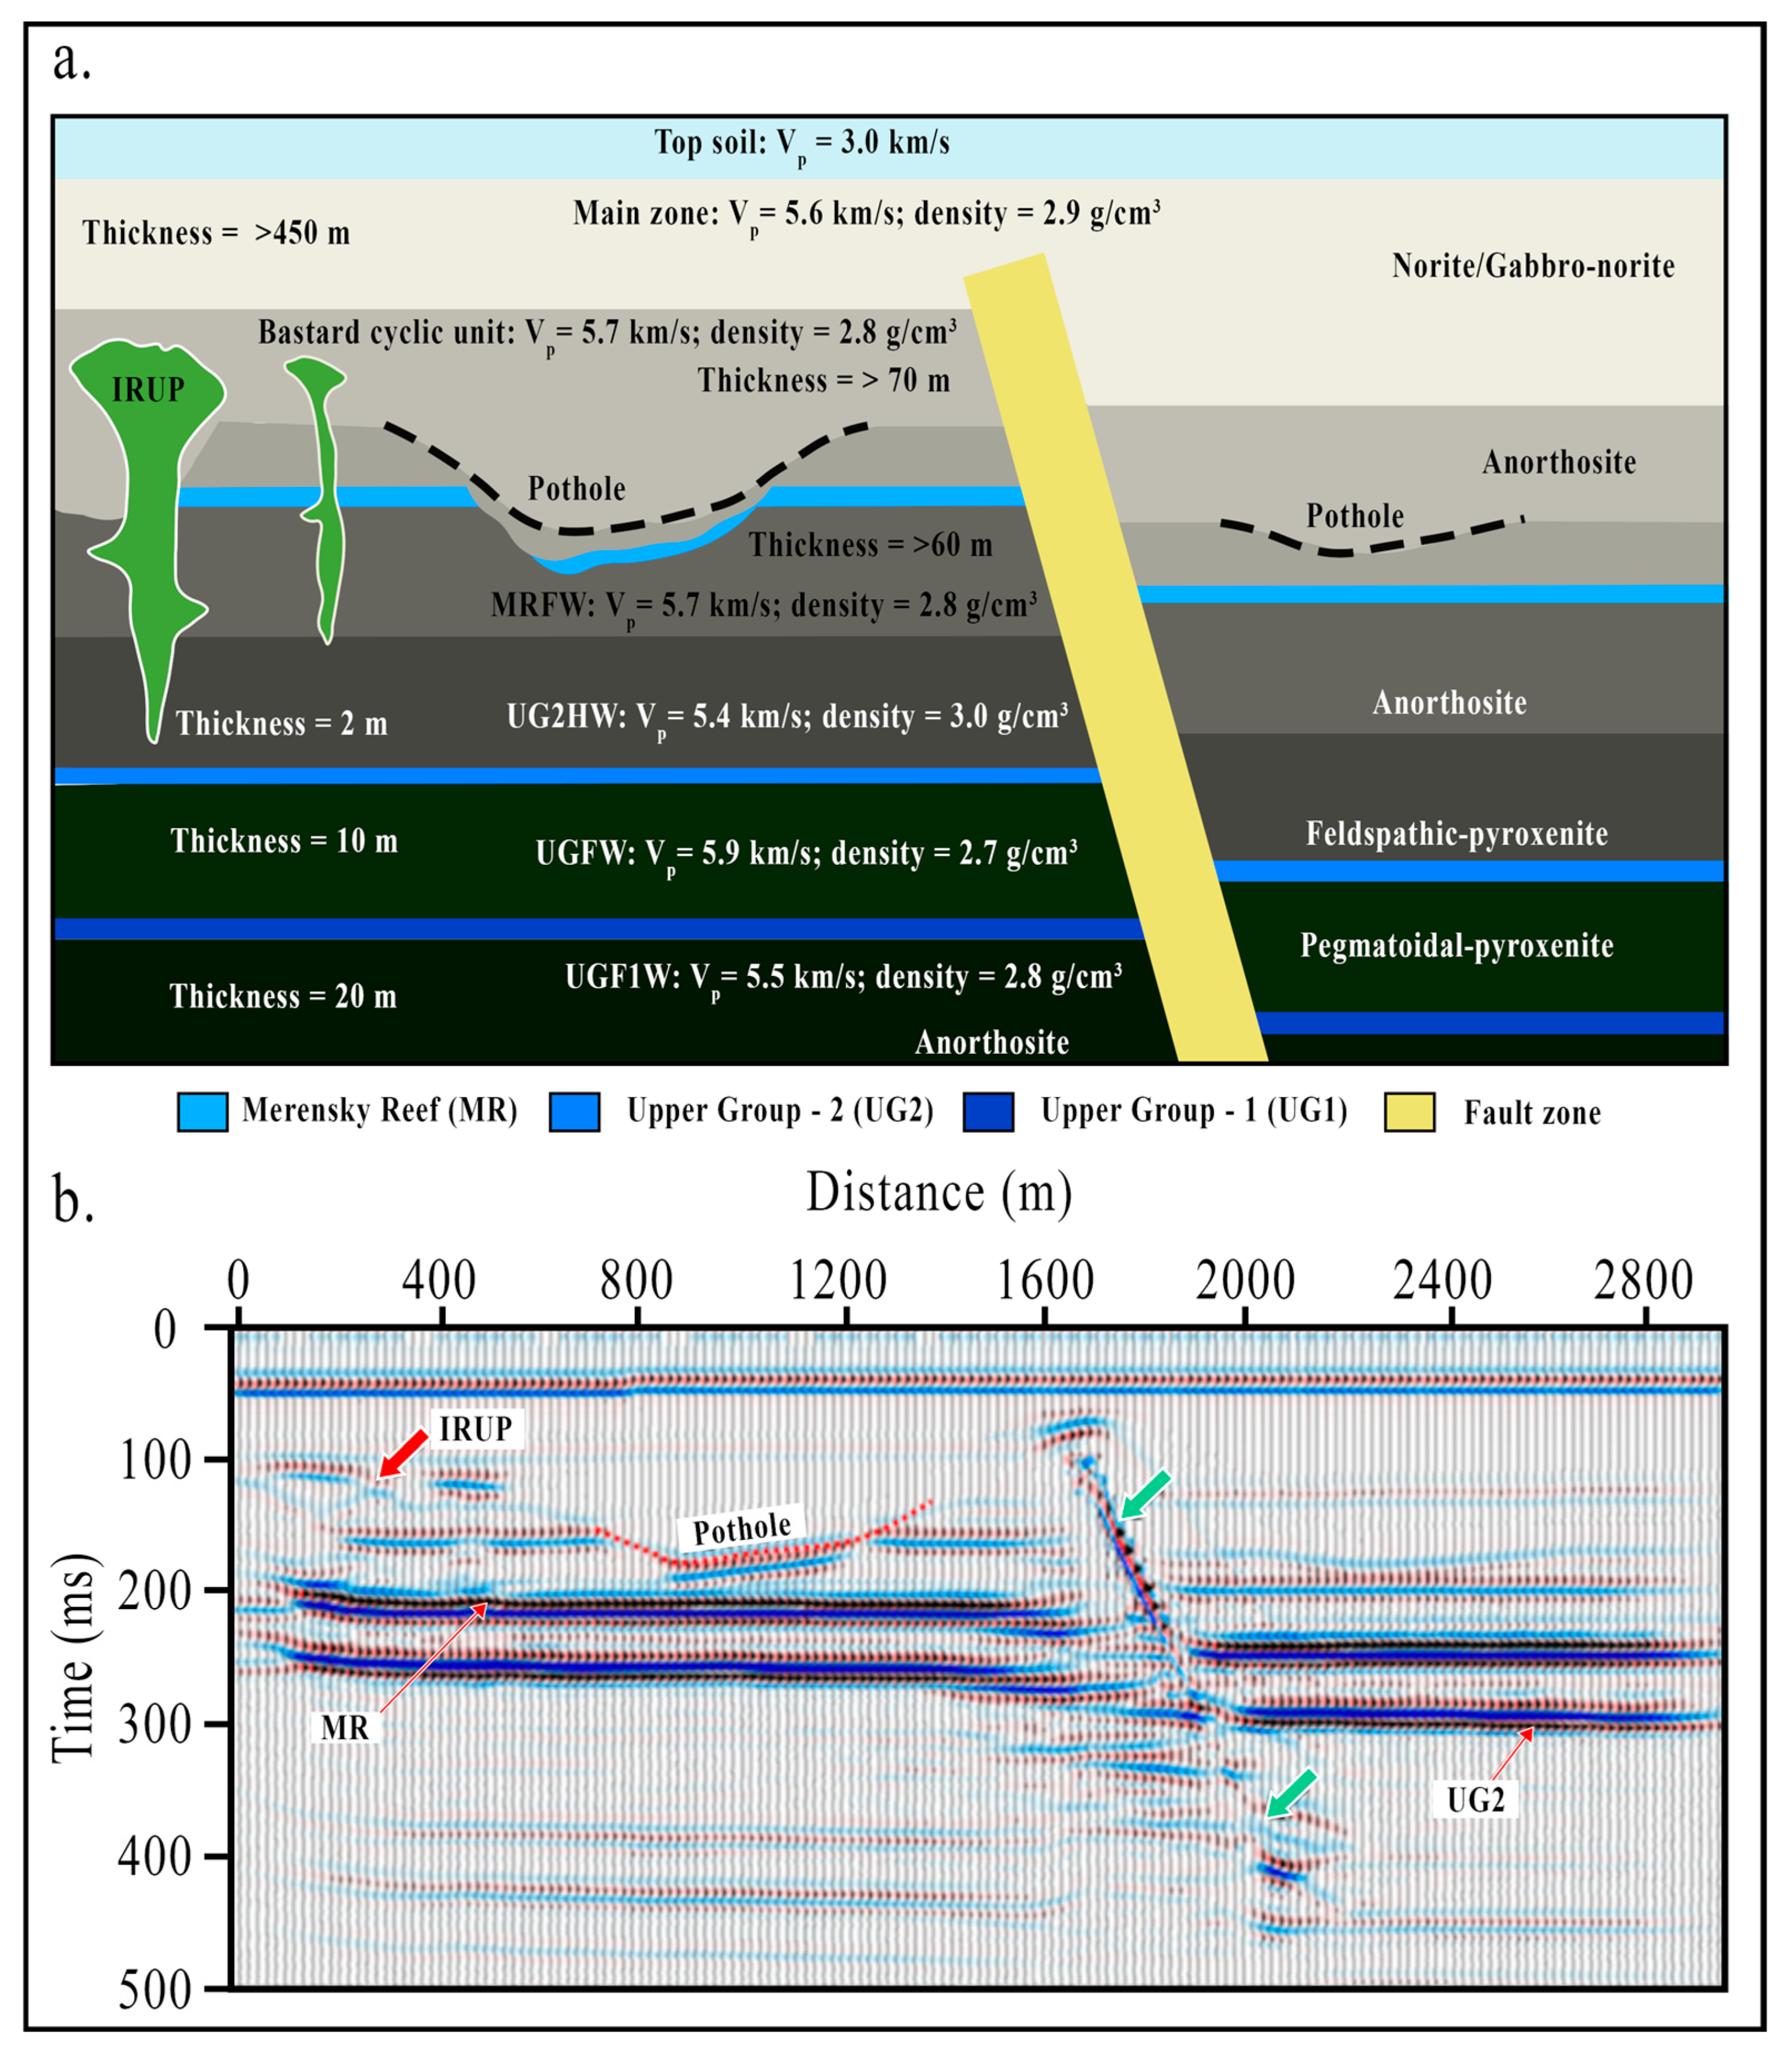
2. Geological Background

Maseve Mine is located 38 km NW of Rustenburg town in the largest layered igneous intrusion in the world, the Bushveld Complex (Figure 1a). The region is well known for hosting the richest platinum group elements (PGEs) [10]. A detailed geology of the mine is described in the first phase of this project [11], and it is not repeated here. In summary, Maseve Mine exploits two major economic horizons (locally termed reefs) for PGE deposits, namely the Merensky Reef (MR) and Upper Group-2 (UG2) chromitite. The two reefs are mined at depths greater than 500 m below the surface, with the UG2 occurring between 15 and 400 m below the MR in the Bushveld Complex [7,12].
Several stages of dyke intrusions of different ages and compositions have affected the rocks of the region, with diabase and dolerite dykes being dominant in the area. Underground mapping and drilling are used to confirm the geological structures (faults and dykes) in the area. The dykes in the region are often associated with fault zones [10,13]. Other structures that are encountered in the Bushveld Complex include slump structures (Figure 1b: locally termed potholes) and Iron Rich Ultramafic Pegmatites (IRUPs) that can halt mining activities. The regional fault interpretation of the region is described by Basson [14] and suggests that the dominant structure in the region is the east–northeast to west–southwest Chaneng fault zone.

3. Data Acquisition

The data acquisition for this study involves both in-mine and surface seismic surveys conducted in 2022, following up on the initial surveys from 2020. The surveys were designed based on insights gained from phase one, with the goal of extending coverage and improving data quality.

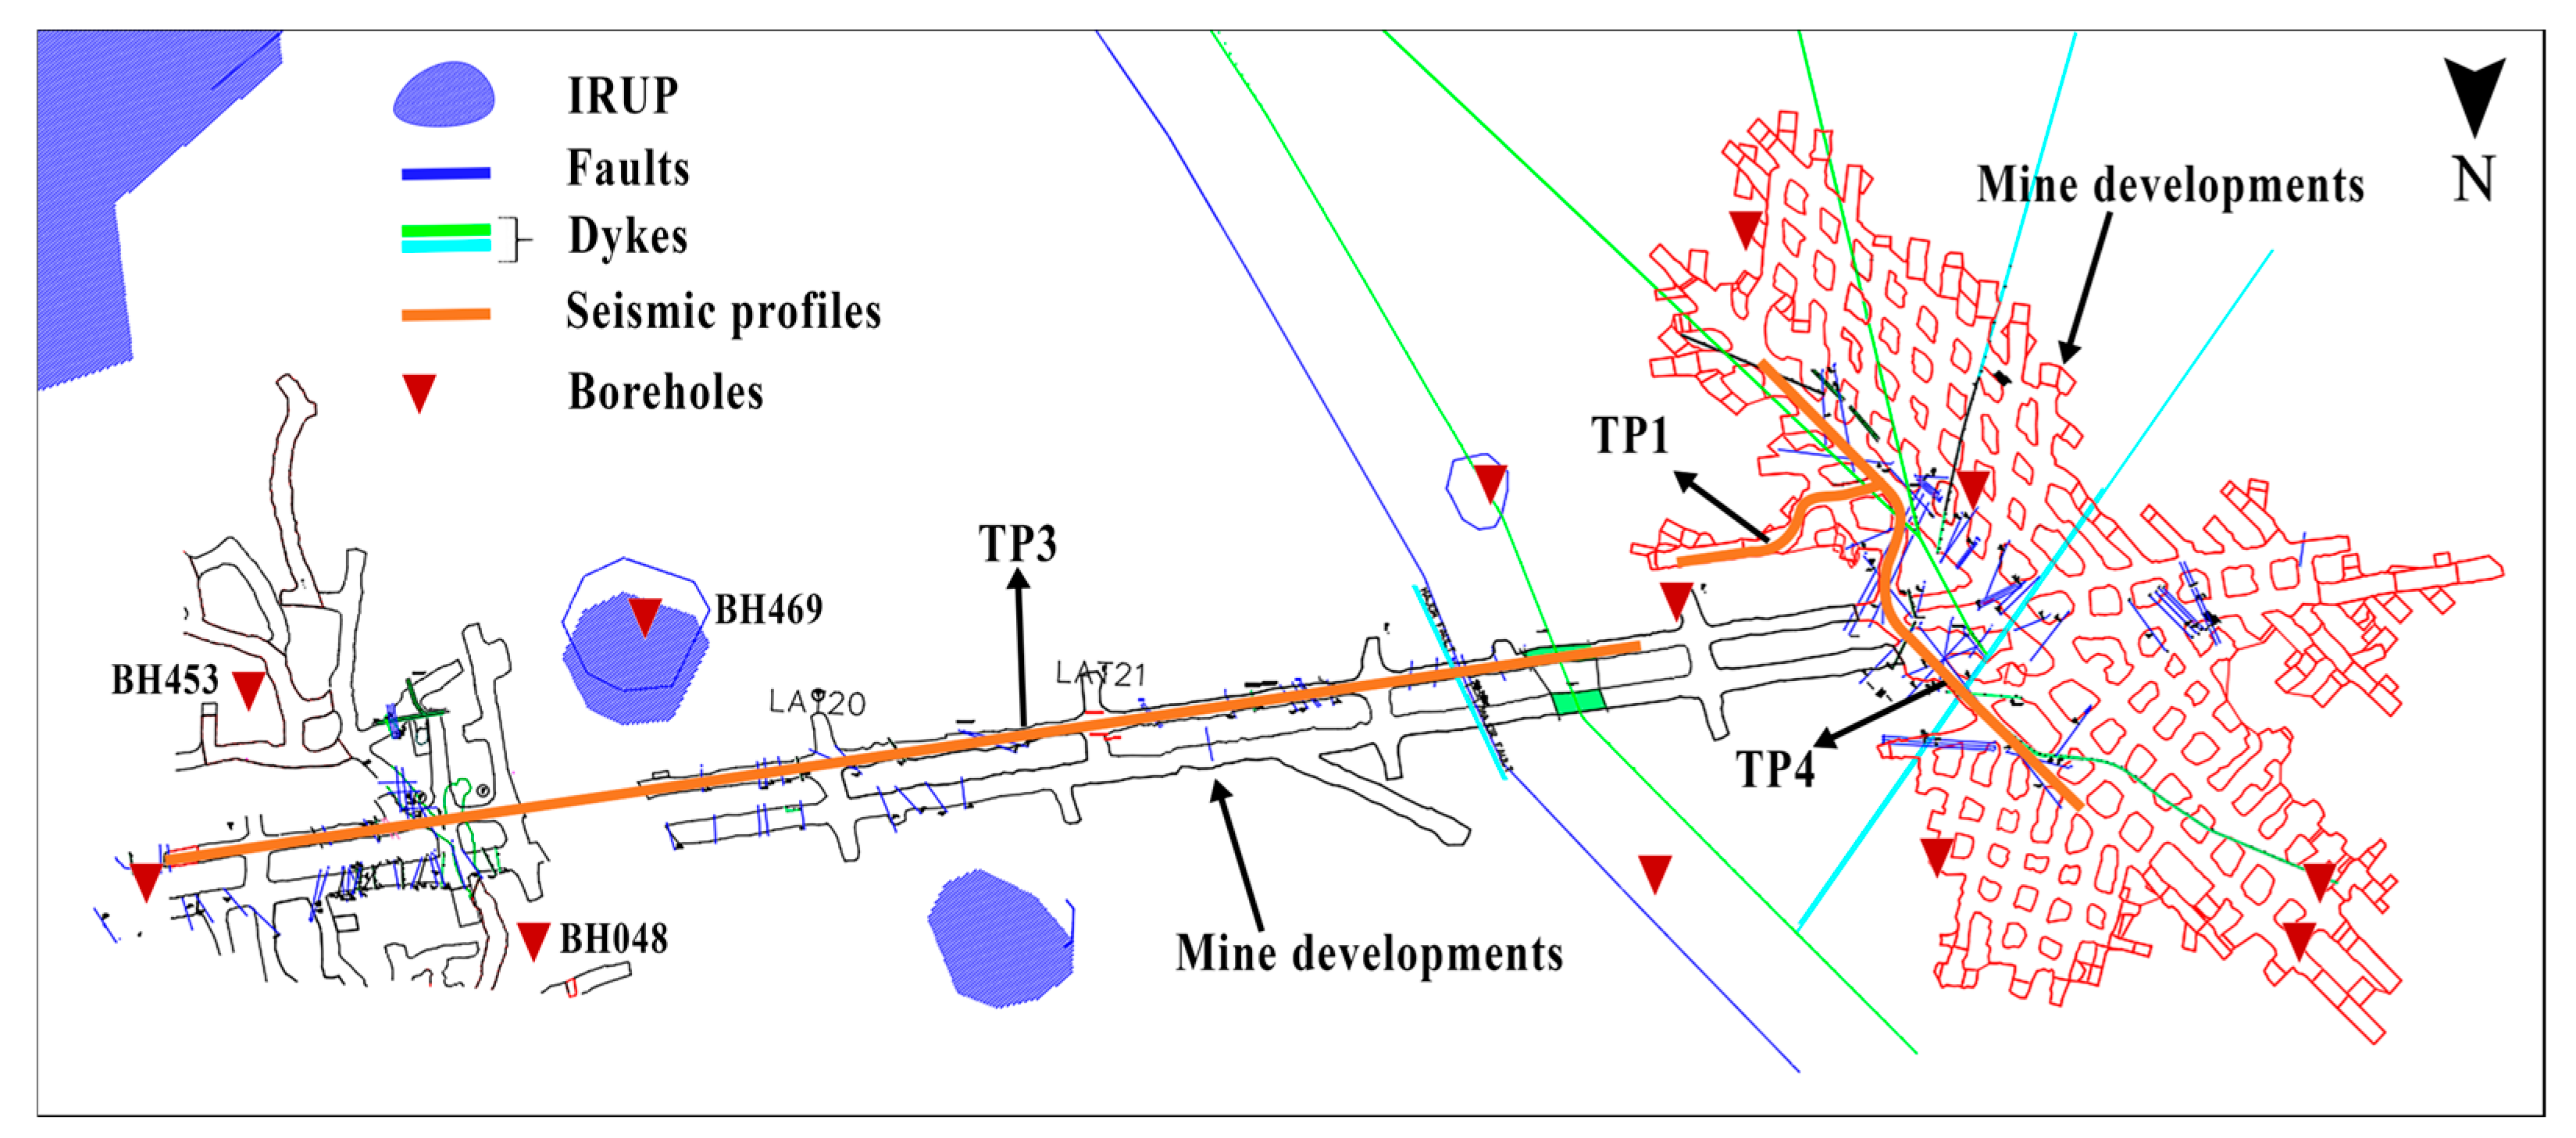
3.1. In-Mine Seismics

Information from phase one (seismics), GPR, and ERT surveys conducted in 2020 assisted us in designing our seismic surveys for phase two [11]. The locations of phase two (2022) seismic profiles extended and overlapped with the ones from phase one. Six seismic profiles, consisting of 4.5 Hz (landstreamer) and 14 Hz (planted) geophones, were set up in the mine tunnels with a combined total length of 1.36 km over known geological structures and orebodies (Figure 2). The 2D seismic profiles were acquired using a 6.3 kg sledgehammer, and the signal penetration was satisfactory for near-surface (~<100 m) imaging in the noisy mining environment.
To assess the impact of mine noise on the data, we compared the data from the planted geophones and the landstreamer (Figure 3). This comparison helped determine the most suitable sensing technology for acquiring data in a noisy environment. We checked the quality of the data, cost-effectiveness, effect of the tilt, and mine infrastructure noise. It was found that the landstreamer (Figure 3a) recorded less noise than the planted geophones (Figure 3b). The sources of noise investigated included ventilation, water pumps, and the flow of water. The landstreamer provided much better results and was used in all the surveys in phase two.
The primary goal of the phase two surveys was to cover areas that were not covered in phase one due to a limited number of receivers and time constraints. For all seismic profiles, a 5 m receiver spacing was used, except for profile TP1, which had a 2 m receiver spacing. The survey parameters are summarized in Table 1.
A detailed description of the phase one seismic profiles can be found in Rapetsoa [11]. The current work differs from phase one by including a comparison between data from planted geophones and landstreamers, measuring P-wave velocities (Figure 4a,b) in the footwall and sidewall (including weak zones and dykes), and acquiring knowledge about the locations of geological structures and ore bodies. The seismic profiles were shot every 2 m, except for TP1, which had a shot spacing of 1 m. Analysis and testing of different sampling rates in phase one led to the selection of a 1 ms sampling rate as the source imparted energy from 50 Hz to 120 Hz. While six seismic profiles were collected (namely TP1, TP3a, TP3b, TP3c, TP4a, and TP4b), this study focuses on the data collected from TP3a, TP3b, and TP4b due to their coverage over the geological structures of interest and the comparison of the landstreamer and planted geophone datasets. TP3a and TP3b (west–southwest to east–northeast) were collected adjacent to each other with a total spread of 235 m, using a landstreamer and planted geophones (Figure 4c and Figure 4d), respectively.
The aim of these two seismic profiles was to image the dipping orebodies and geological structures (faulting and folding) below the mine tunnel, extend the P5–P7 seismic profiles acquired in phase one [11], and lastly, compare the planted geophones and landstreamers in mine tunnels. TP4b trended southeast–northwest, with a spread of 235 m. A fixed crooked spread with 48 (4.5 Hz) landstreamer channels formed this seismic profile with a 5 m receiver spacing. The aim of this profile was to extend P1 from phase one seismic surveys, improve the quality of the data, and image UG2 below the mine tunnels. GPS signals are not available in underground mine tunnels; therefore, the receiver positions were marked relative to the mine pegs. The elevations of the receivers relative to the tunnel roof were obtained from the LiDAR survey that was conducted concurrently with the seismic surveys.

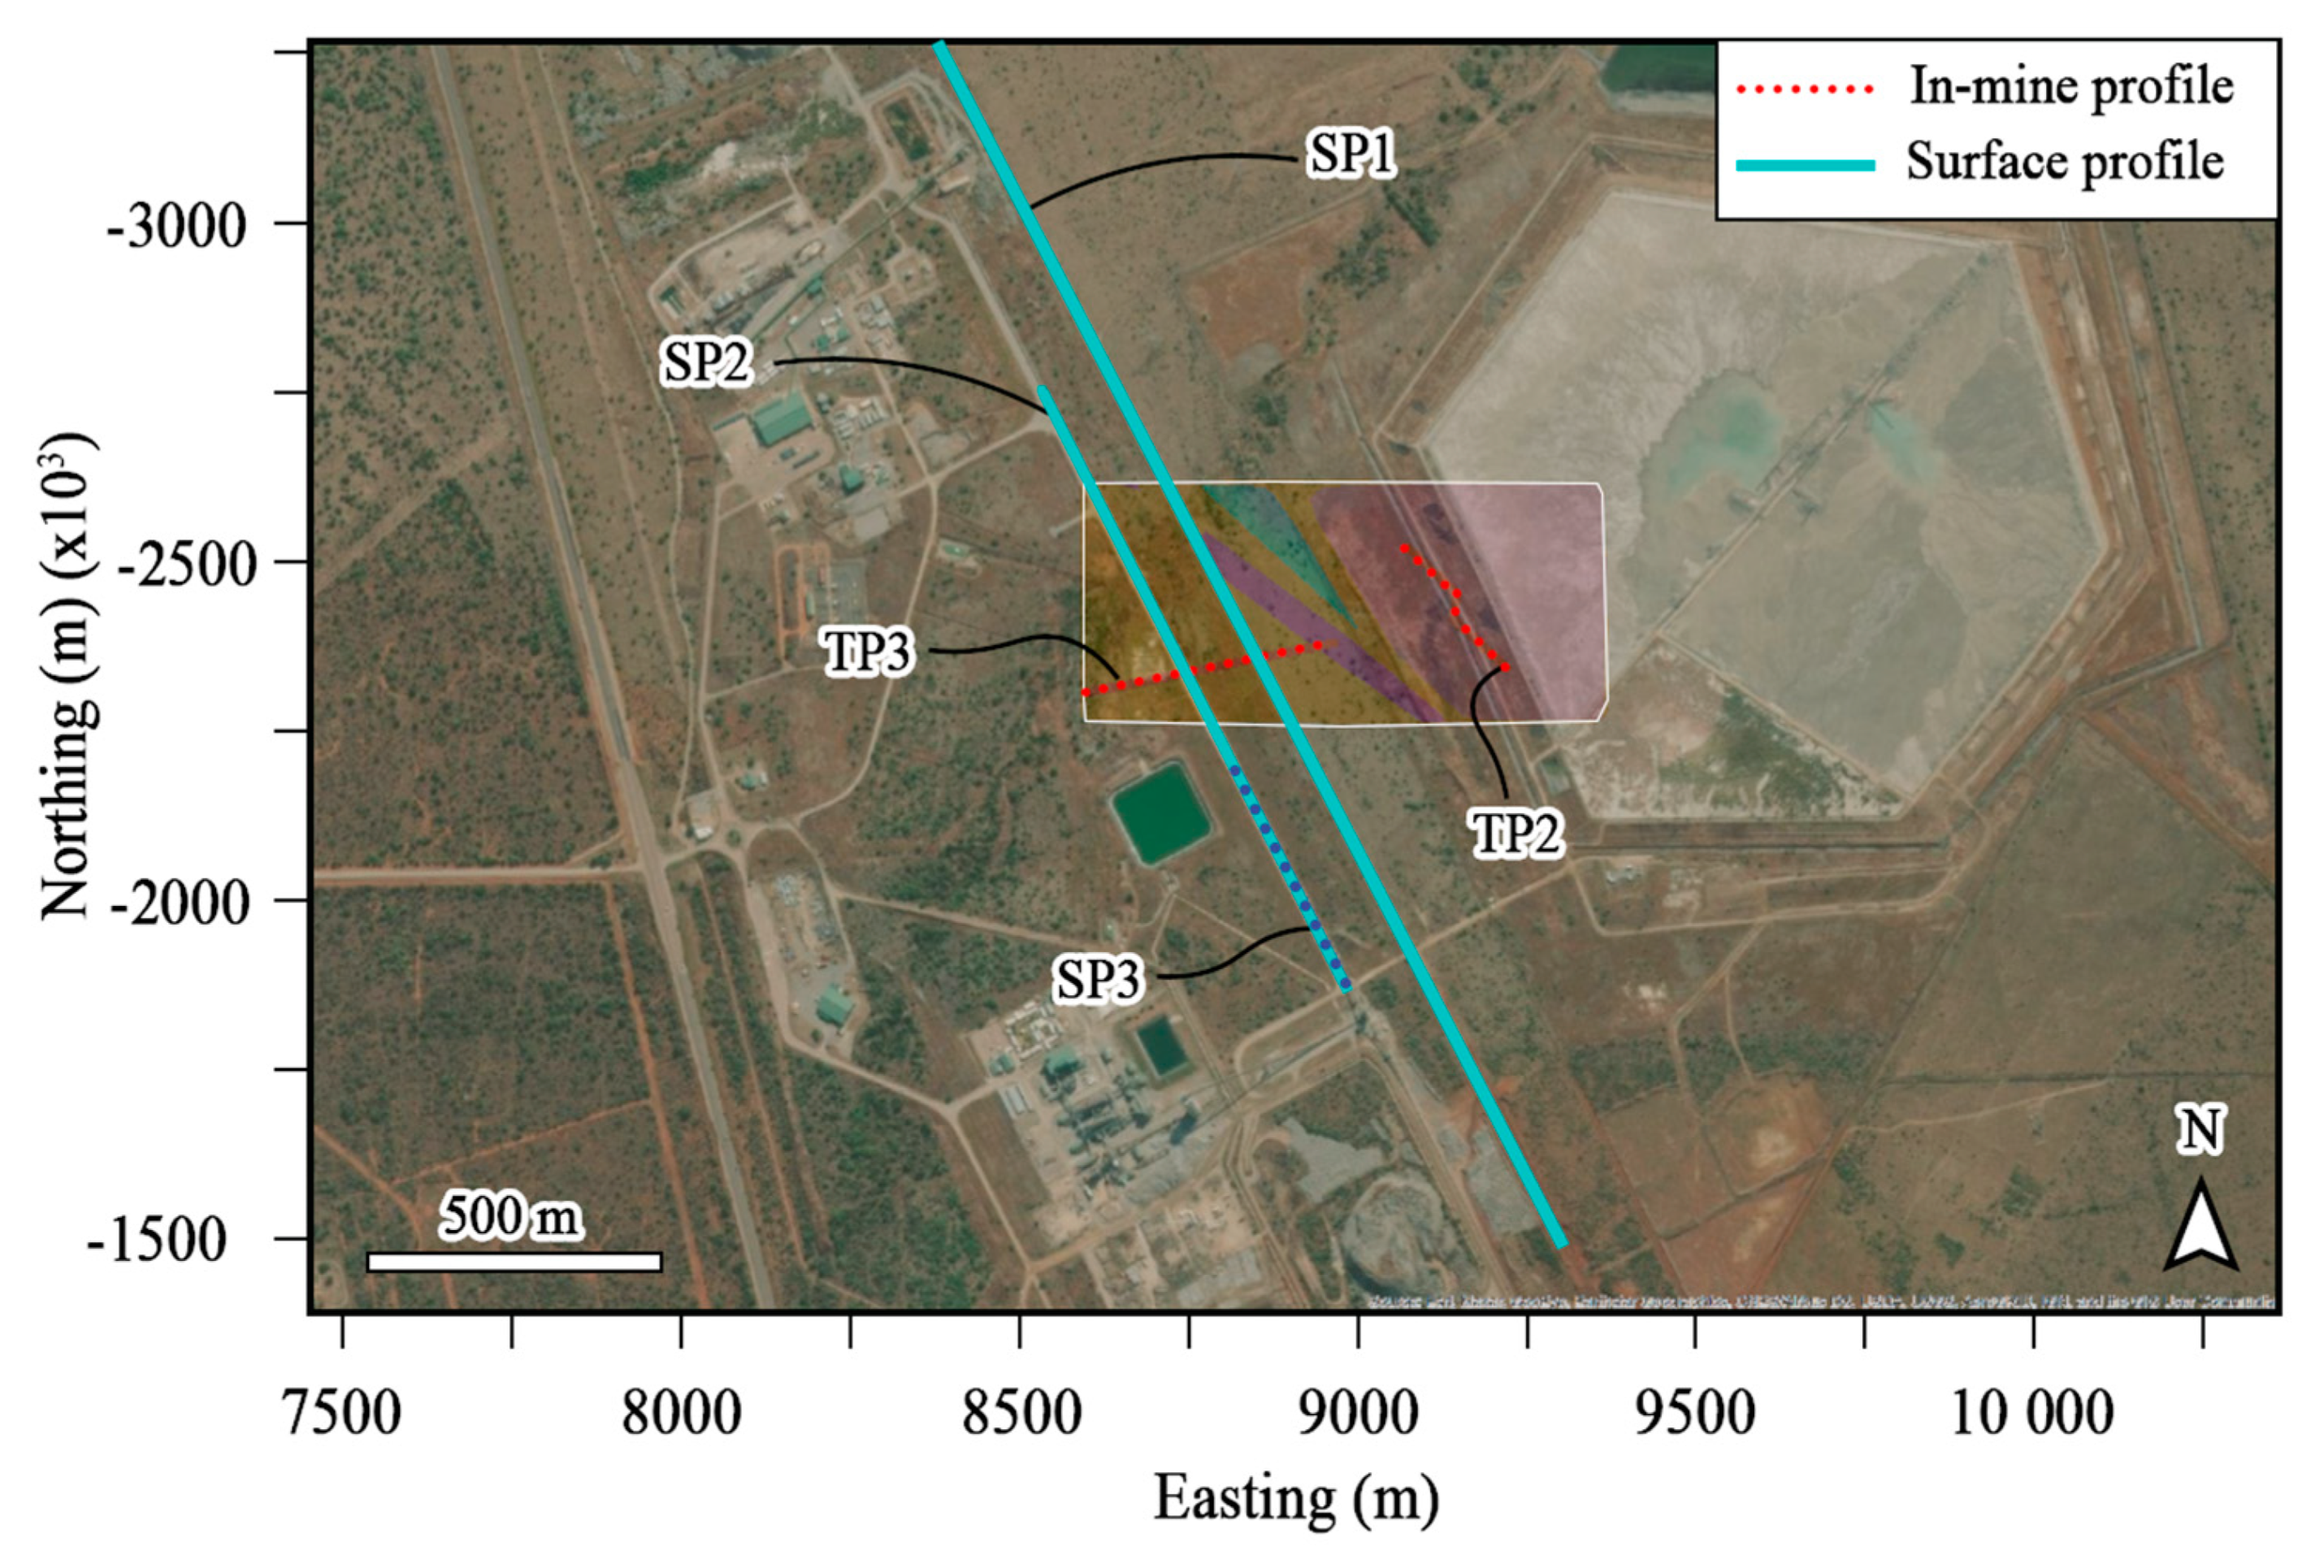
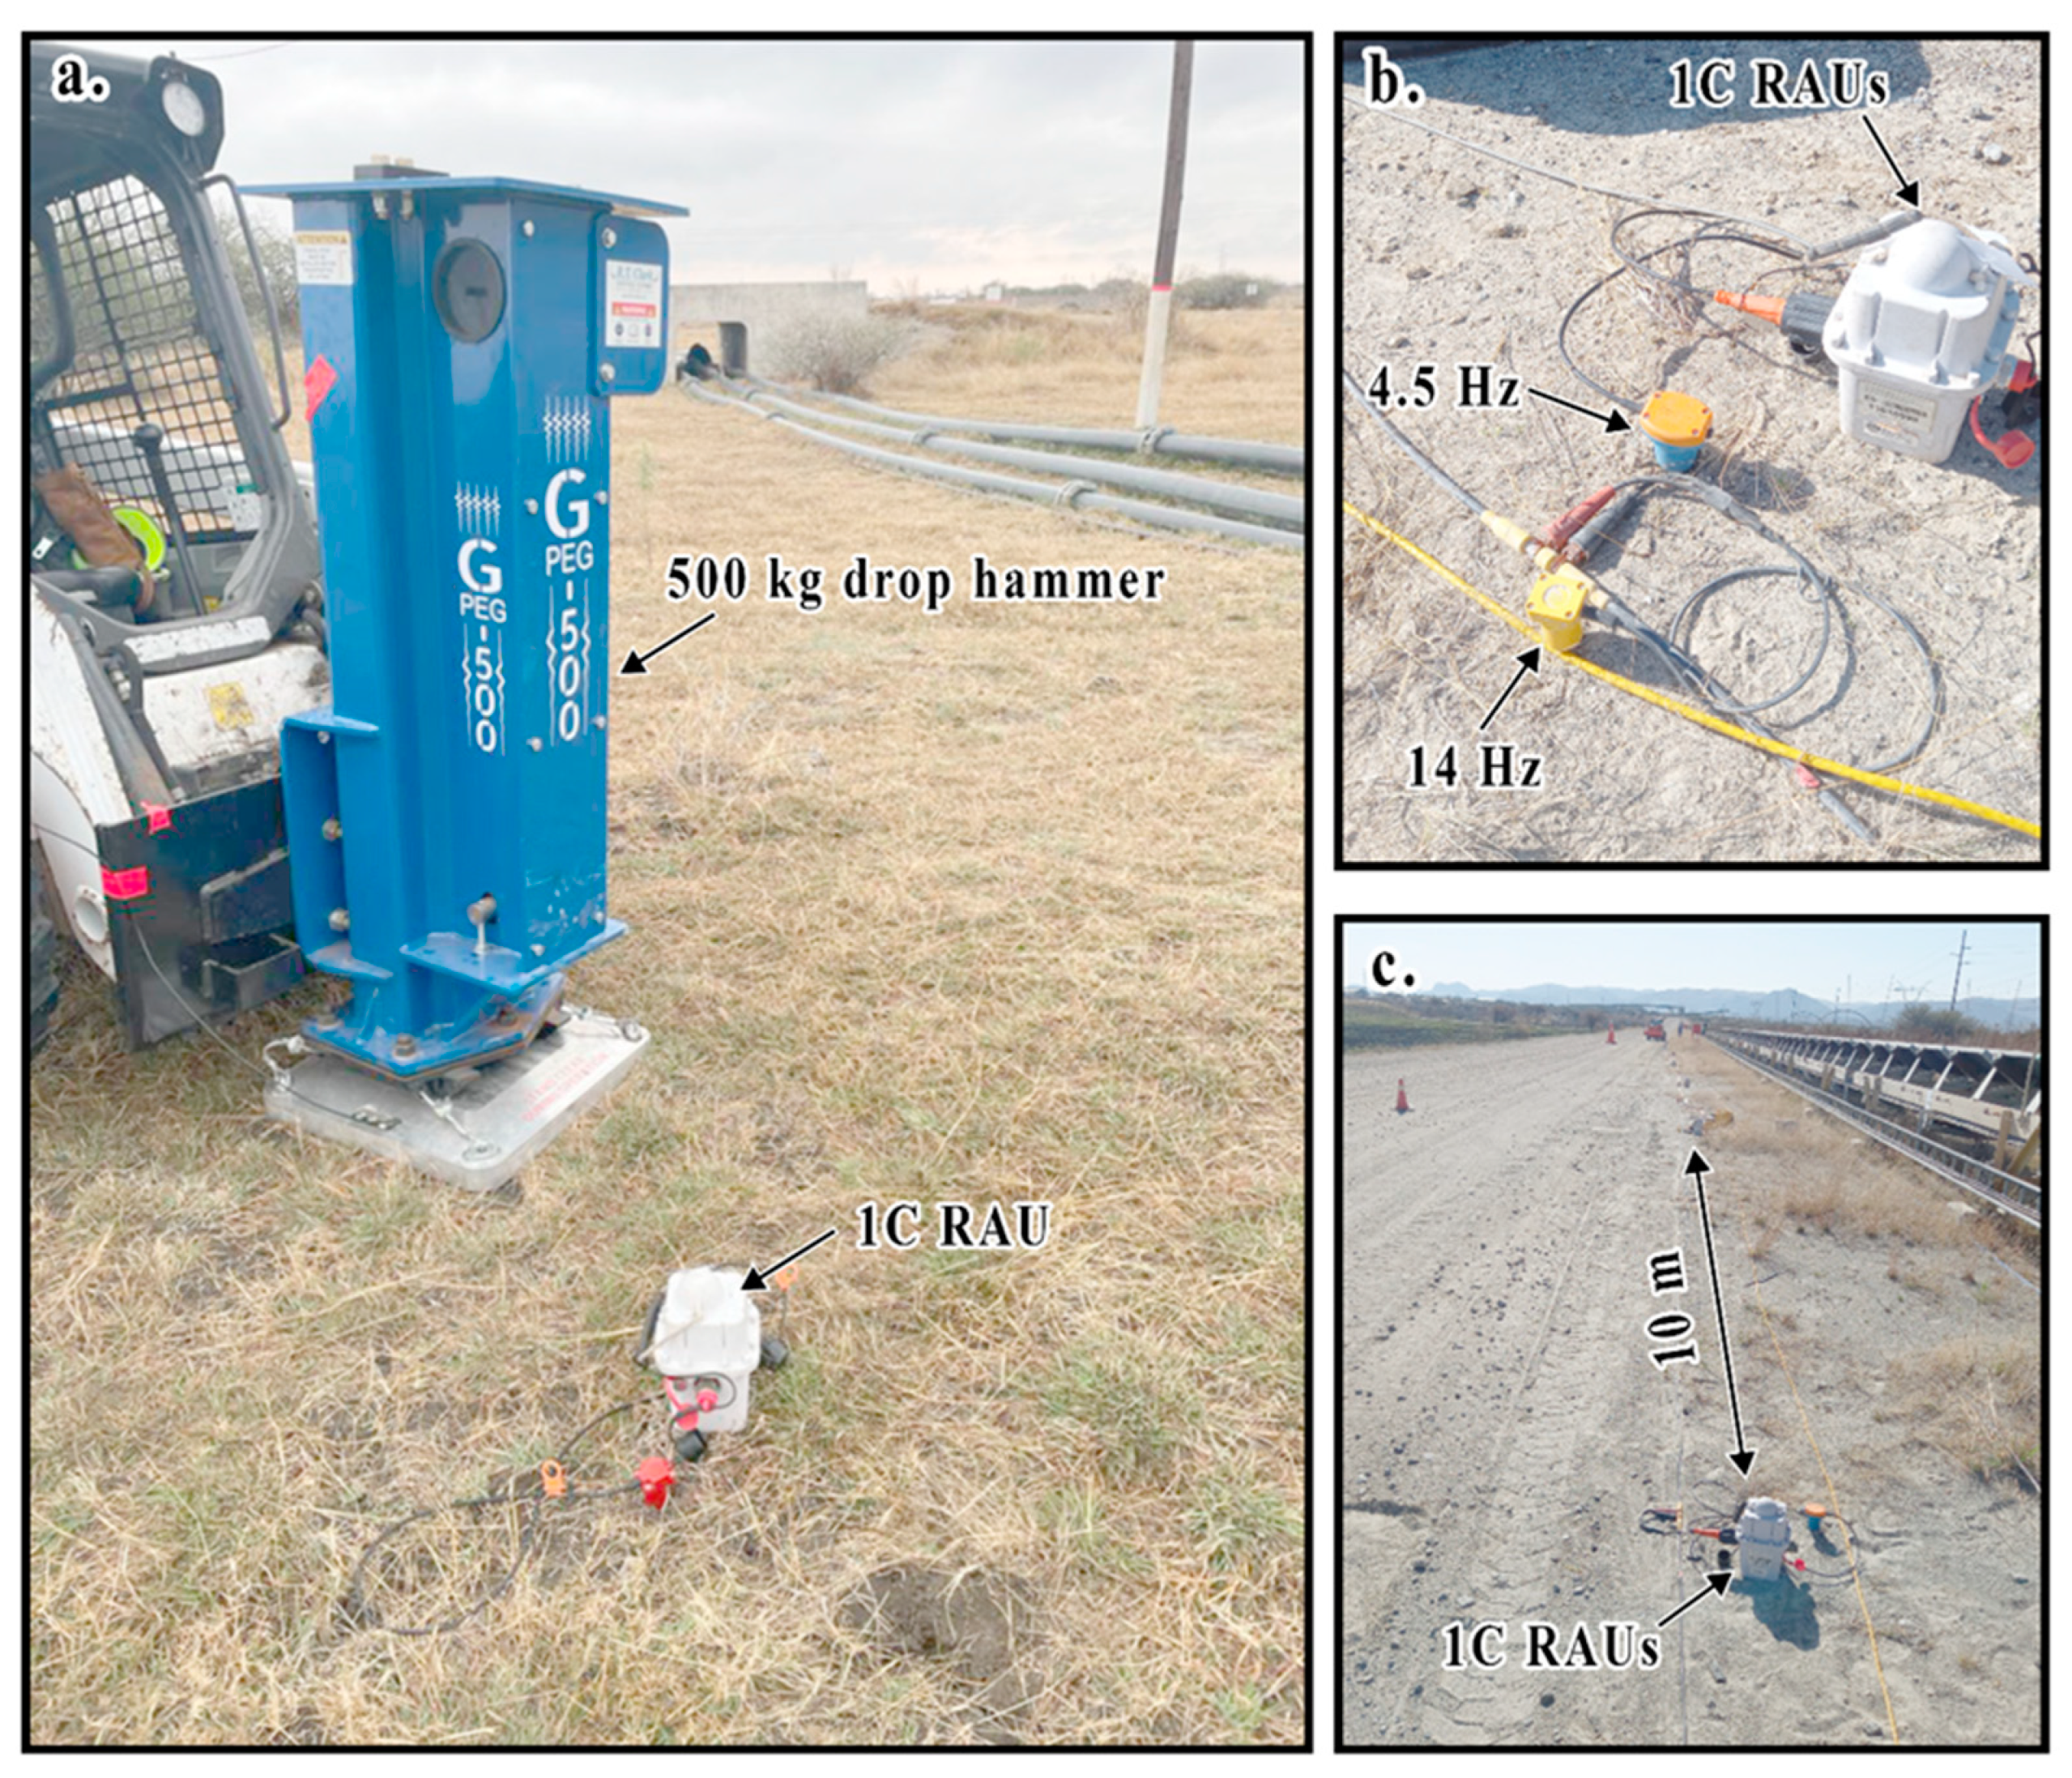
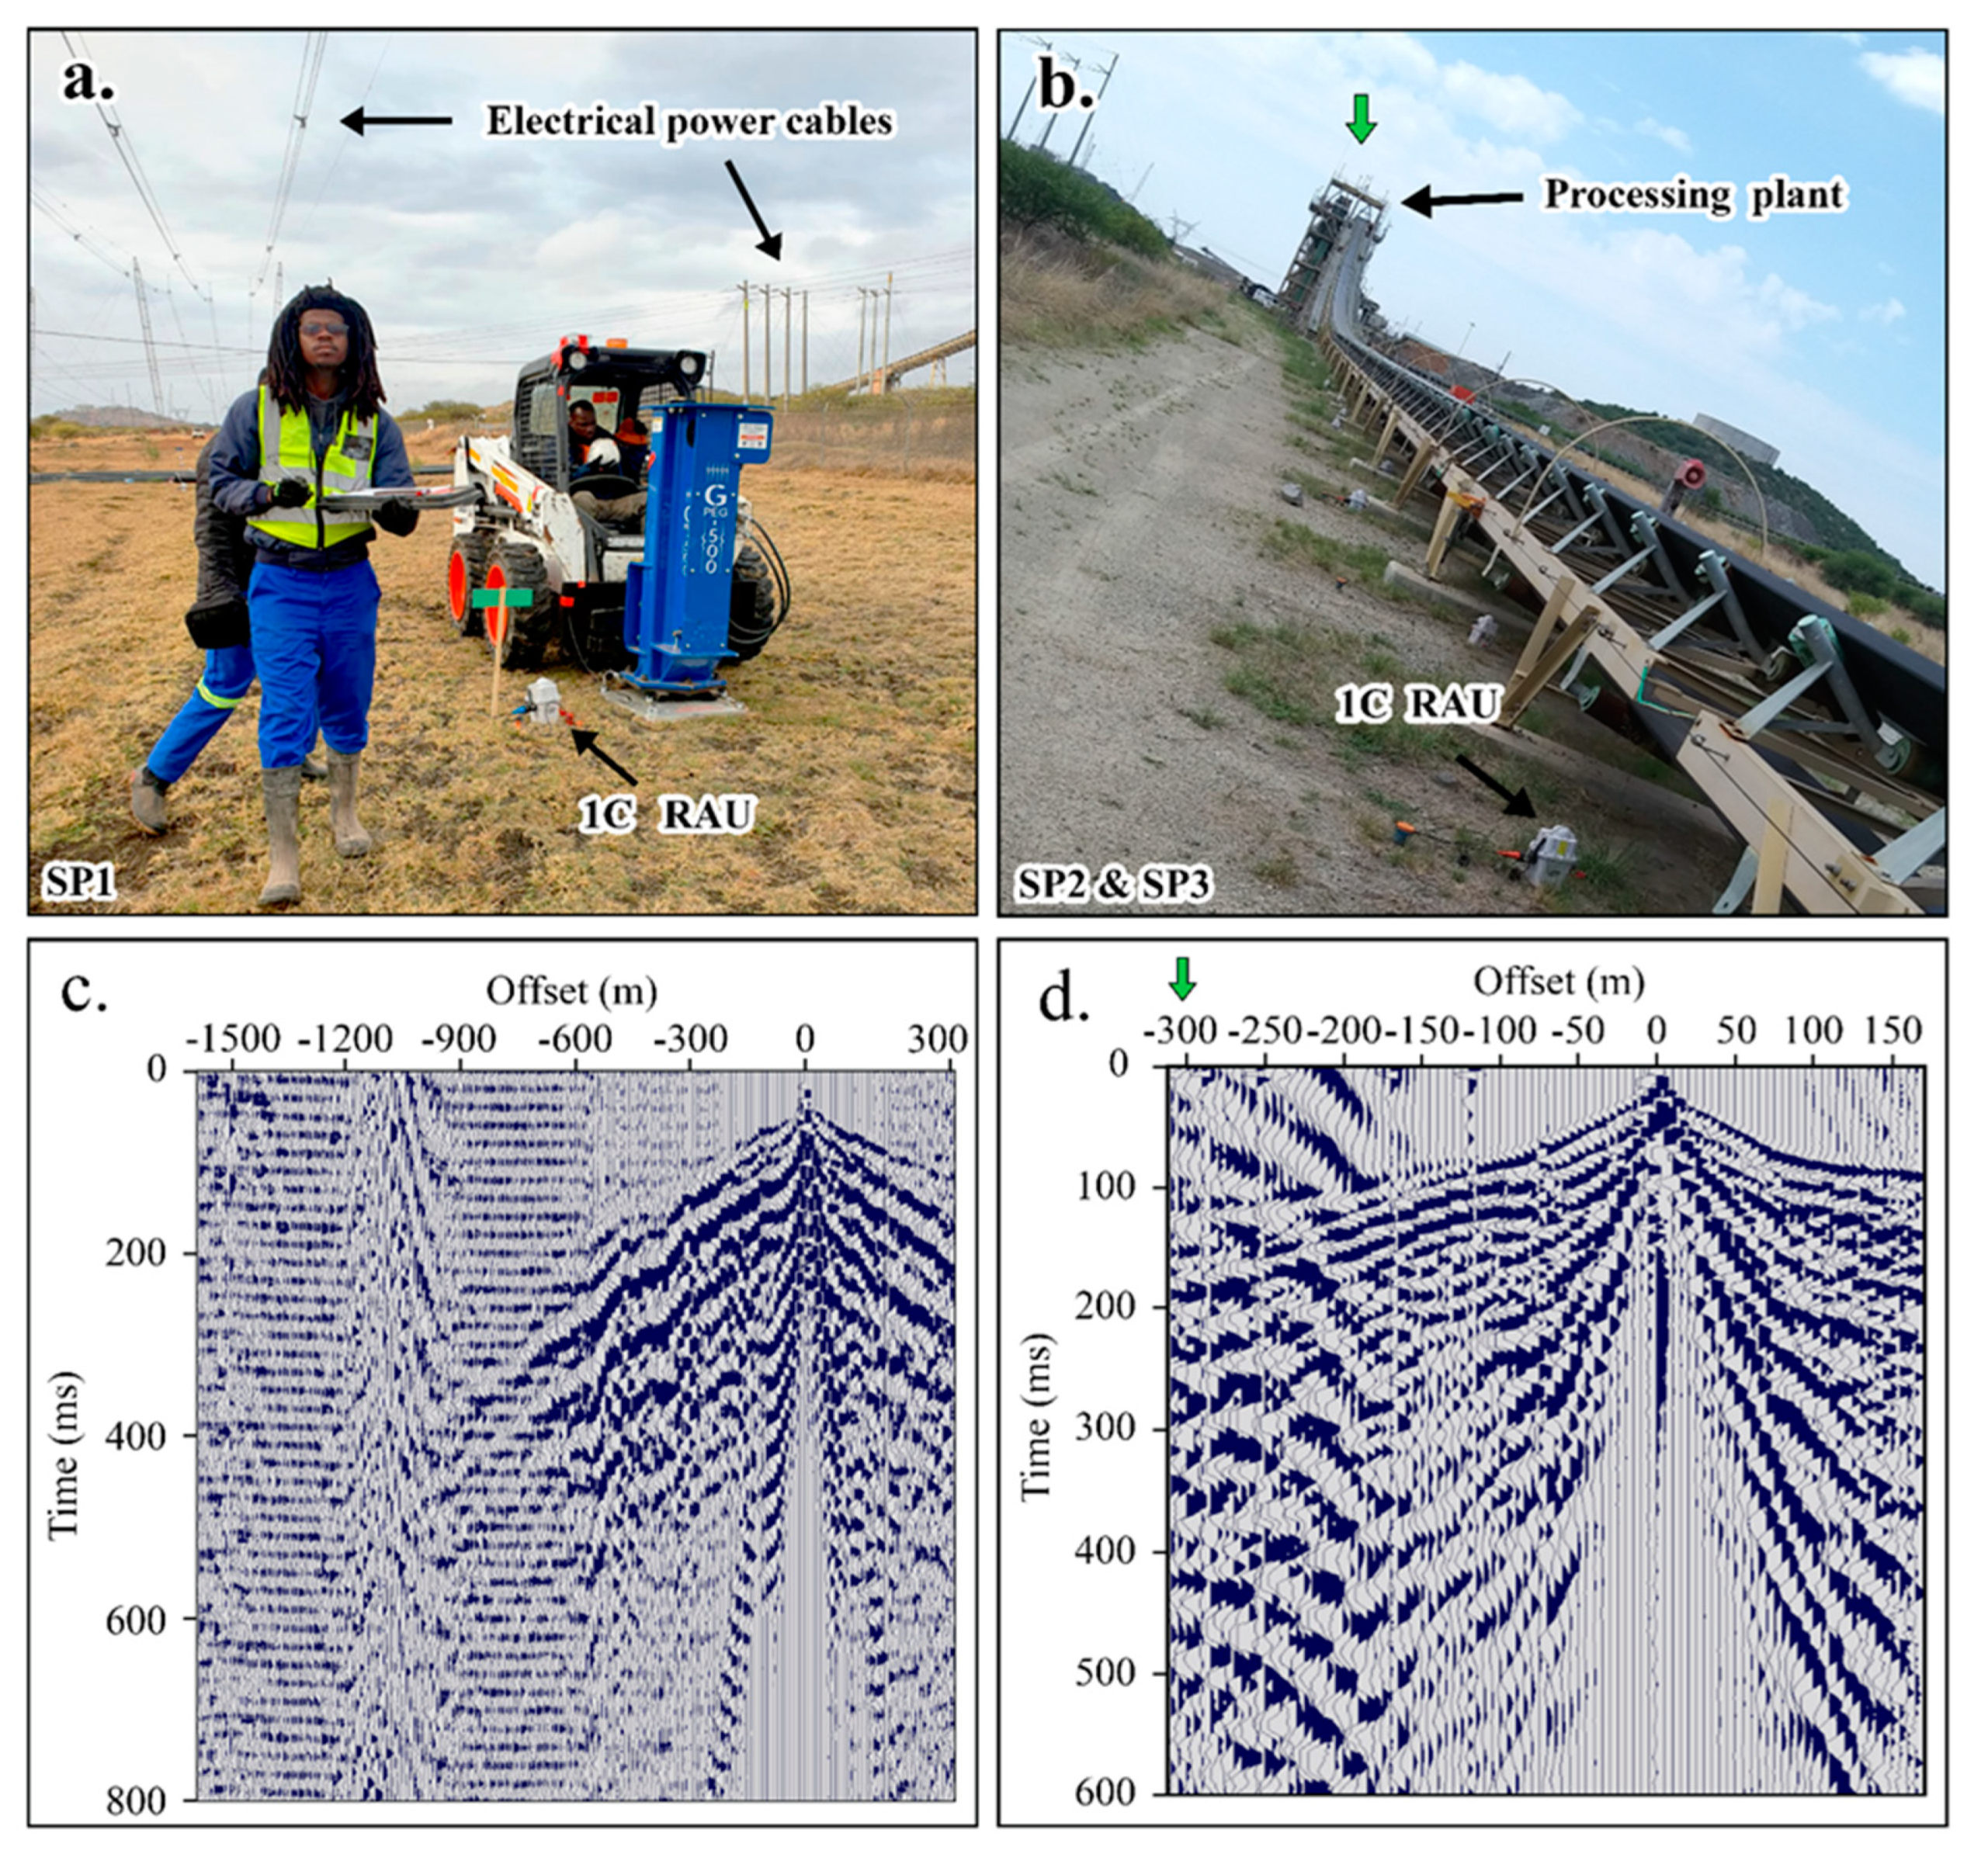
3.2. Surface Seismics

In August 2022, 2D high-resolution surface seismic data were acquired over the Merensky and UG2 deposits. The area is surrounded by mine infrastructure (e.g., tailings, offices, and processing plants); therefore, the profiles followed accessible tracks in the area, resulting in a fixed straight line geometry (Figure 5). The entrance to the mine is located on the west side of the profile, while the tailings storage facility (TSF) is on the eastern side of the profile. The roads on the mine site had frequent heavy traffic, generating high levels of background noise during the acquisition.
The data were acquired using a 500 kg drop hammer (Figure 6a). Approximately 400 receiver positions (5–10 m apart) and 330 source positions were deployed and surveyed using different geophones (Figure 6b–c) with similar recording parameters. As the main objective of the study was to image to a depth of 600 m below the surface, a 10 m receiver spacing was used for all the seismic profiles except seismic profile SP3, which had a 5 m spacing due to the limitation of the cabled system. For SP3, one-component 14 Hz geophones were deployed, while for SP1 and SP2 profiles, a lower natural frequency (4.5 Hz) geophone was used. At each source position, four shots were recorded and later stacked to improve S/N.
Table 2 lists the main acquisition parameters for the surface seismic survey. The Geode cabled system has no way of acquiring GPS locations; therefore, accurate GPS receiver coordinates were collected using a differential GPS for all the seismic profiles. An event recorder was mounted on the drop hammer to record a GPS time stamp that would later be used to harvest the raw shots gathers from the wireless nodes.

4. Data Processing

Although the four seismic profiles were collected separately, a similar processing workflow was applied. The processing steps are summarized in Table 3. The data were of satisfactory quality, with clear P-wave first breaks and reflections in raw shot gathers. The noise generated by mine pumps, ventilation, and water flow proved challenging, overwhelming the signal and obfuscating reflectivity.
Figure 7a–c show the raw shot gathers, while Figure 7d,e show shot gathers after pre-stack processing (trace editing, refraction statics, band-pass) for signal enhancement. TP1 (Figure 7a) shows potential in imaging the near-surface reflections, with multiple reflections identifiable within the first 25 ms. TP3a (Figure 7b) has the potential to image the deeper reflections below the mine tunnel with the reflections observed at 50–75 ms. Profile TP3b exhibited few noisy traces (Figure 2) due to the flow of water against the geophone spikes; therefore, robust processing was required for TP3b due to low S/N on the first half of the profile.
The first processing step was to edit the bad traces, add the geometry that was created from the mine pegs, and add CDPs (common depth points) to the traces. The second step was to pick the first breaks to assist in refraction static corrections. A total of ~5760 first arrivals were picked manually on each profile to generate a two-layered P-wave velocity model. The corrections were estimated using stepwise iterations, and changes were made to the geometry and velocity of the first and second layers. Solutions with an RMS-misfit lower than 4 were more stable; therefore, they were used across the different seismic profiles. A surface noise attenuation in wavelet transform (SNAWT) filter was then applied to attenuate the evident surface waves in the data set.
The refraction static corrections improved the quality of the first arrivals and the coherency of the identified reflections. The seismic profiles TP1 and TP4b were collected at the bottom of the incline tunnel; therefore, the data were shifted to a reference datum of 537 m below mean surface level (msl), with a replacement velocity of 5000 m/s. While TP3a and b were collected along the incline tunnel, the data were shifted to a reference datum of 635 m below msl and a replacement velocity of 5200 m/s. We designed a broad-band filter (16–300 Hz) to preserve wave energy in that range. The filter reduced low-frequency coherent noise generated by mine infrastructure. The band-pass filter and deconvolution were applied, whitening the spectrum and reducing the low-frequency shear wave energy. The last pre-stack process was the removal (top mute) of the direct and refracted arrivals, such that they did not affect the final stack section. Due to the limited coverage of the profile (small offsets), interactive velocity picking was difficult to conduct. Therefore, a series of constant velocities were tested, ranging from 4500 to 8000 m/s with 250 m/s intervals. Through visual inspection, an estimated NMO velocity of 6000 m/s was used for TP1 and TP4b, while TP3a and b used an NMO velocity of 6500 m/s for stacking. Spectral weighting was applied to improve the images, together with a semblance-based coherency filter to improve the data. Due to the target reflections being within 50 m and the velocity models not being well constrained, the seismic data were not migrated to avoid any distortions that could be introduced by migration. The post-stack unmigrated section was depth converted with velocities of between 6000 m/s and 6500 m/s.
Surface seismic profiles were collected to cover and place the known mineral deposits at the center of the profile. The profiles were located on existing tracks, resulting in the seismic profiles being located close to mine infrastructure, including electrical power lines (Figure 8a) and mine processing plants (Figure 8b). Identifying reflections on the seismic raw shot gathers was difficult due to electromagnetic noise (Figure 8c) from the power lines. Figure 8d also shows an example of a raw shot gather contaminated by coherent noise from the processing plant along seismic profiles SP2 and SP3. However, in general, the data along SP2 and SP3 are of satisfactory quality, with a high signal-to-noise ratio (S/N), while SP1 is severely contaminated by electromagnetic noise at the far offsets, with 143 of 198 receiver positions having a low signal-to-noise ratio due to the proximity of the power lines. Data processing was difficult for profile SP1; therefore, reflection seismic processing focuses on SP2 and SP3.
The processing flow is summarized in Table 4. Processing started with building the geometry of the seismic profile and adding the shot, receiver, and CDP information to the traces. Due to the proximity to the power lines, the first step was to apply a notch filter to remove the 50 Hz harmonic noise. Approximately 23,000 first breaks were manually picked for input to refraction statics. These static corrections improved the continuity of the first breaks and enhanced reflections. Further improvements were made by applying a surface wave attenuation filter. A broad band-pass filter was applied to the dataset to preserve frequencies between 10 and 150 Hz. To enhance the resolution of the dataset and assist in its interpretation, a deconvolution filter was applied, with a gap length of 16 ms and a filter length of 160 ms. We then removed the first arrivals using the first break picks, such that they did not appear on the final stack section. Figure 9 shows the comparison of the raw shot gather and pre-stack processing steps (notch filter, refraction statics, and surface wave attenuation) applied.
Normal move-out corrections were conducted using velocities between 3000 and 6000 m/s for the three seismic profiles, with a stretch mute of 70%. Conventional velocity analysis was conducted using localized constant velocity stacks spanning about 10 CDPs, with velocity from previous studies [11], guided by reflection continuity. This resulted in a more detailed stack section that captures the intricate details of the subsurface structures. The continuity of the reflections was further improved through the application of FX deconvolution and semblance-based coherency filtering to attenuate random noise. This was followed by f–k filtering to remove steeply dipping events in the stack section due to remnant source-generated noise. Finally, multiple migration algorithms were tested, and the finite difference migration proved to provide a more accurate migrated stack section that best represents the subsurface in a computationally efficient manner. We then applied time-to-depth conversion using a refined velocity model obtained during velocity analysis that honors the subsurface geological structures and borehole data.

5. One-Dimensional (1D) and Two-Dimensional (2D) Modeling and Borehole Data

Physical properties and geological information from the mine were used to conduct 2D numerical simulations to investigate seismic reflectivity in the subsurface rocks and to design the seismic acquisition to best illuminate geological structures. Rapetsoa [11] reports numerical modeling for in-mine seismics.
To constrain the seismic interpretation, we used the densities and velocities measured in phase one to calculate the acoustic impedance contrast and calculate the reflection time series that we further convolved with a 60 Hz Ricker wavelet to generate synthetic traces (Figure 10).
Multiple boreholes were provided by the mine, with this study focusing on the boreholes situated proximal to profile TP3. The boreholes (BH048 and BH469) cross the two target deposits (Merensky Reef and UG-2) and the UG-1 reef. As stated by Rapetsoa [11], average velocities down to 500 m are around 5600 m/s, and average densities are 3100 kg/m3. The standout feature is the increase in velocity at 420 m due to interlayered pyroxenite (Merensky Reef) and norite (hanging wall and footwall). This increase causes a change in the acoustic impedance and, therefore, a point of reflectivity. A more prominent contrast is seen at depths of 480 m and 495 m due to the highly dense chromitite layers of the UG2 and UG1 generating acoustic impedance contrasts, hence noticeable reflections on the synthetic traces. BH453 (Figure 10c) shows evidence of other geological structures (e.g., IRUPs, dolerite dykes, and sills) that are expected in the study area.
Two-dimensional modeling was conducted using Tesseral Pro TM software. Figure 11a shows the geological models built from borehole data and mine information. A synthetic 2D seismic survey was designed to generate synthetic shot gathers using acoustic modeling technique. These shot gathers were processed to produce a pre-stack time migrated section, which was converted to depth using the velocity model. The main objective of numerical modeling was to simulate the seismic response of the targets (MR and UG2) and geological structures (faults, potholes, dykes, and IRUPs). Figure 11b shows an example of the synthetic seismic section produced from the synthetic model. The section shows that the seismic survey is able to detect UG2 and MR as strong reflections, as well as image IRUPs, faults, and potholes.

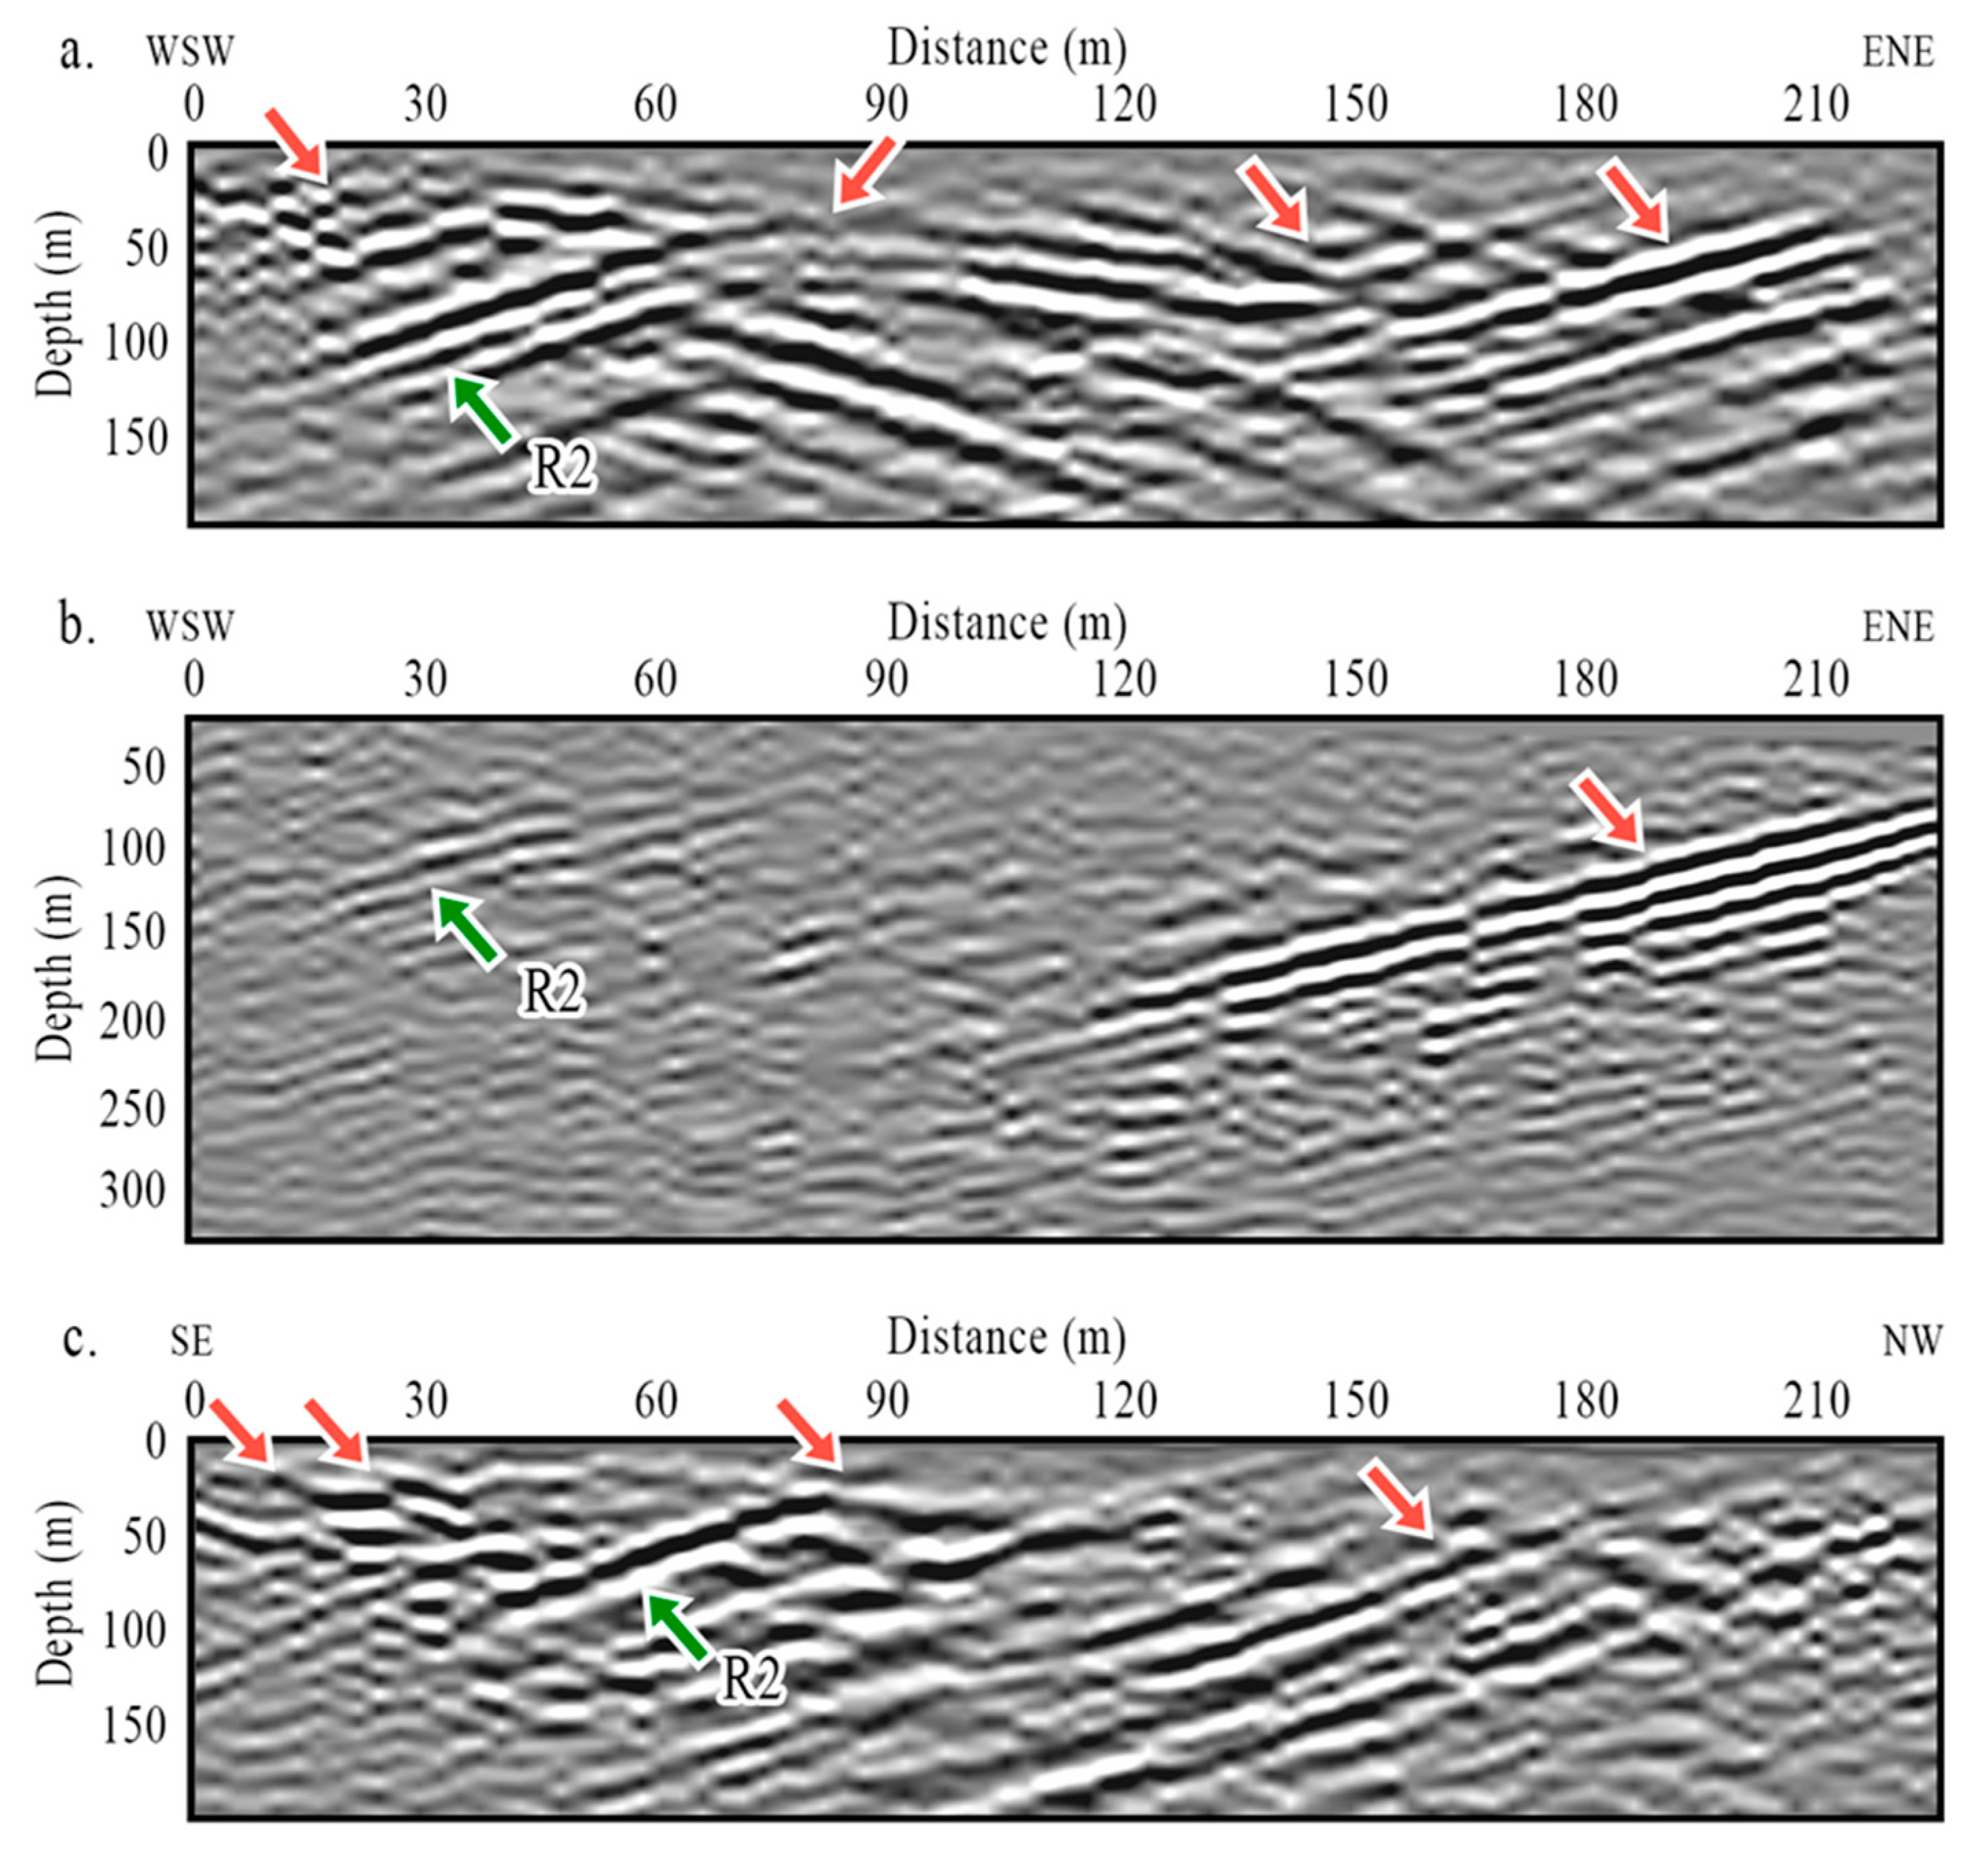
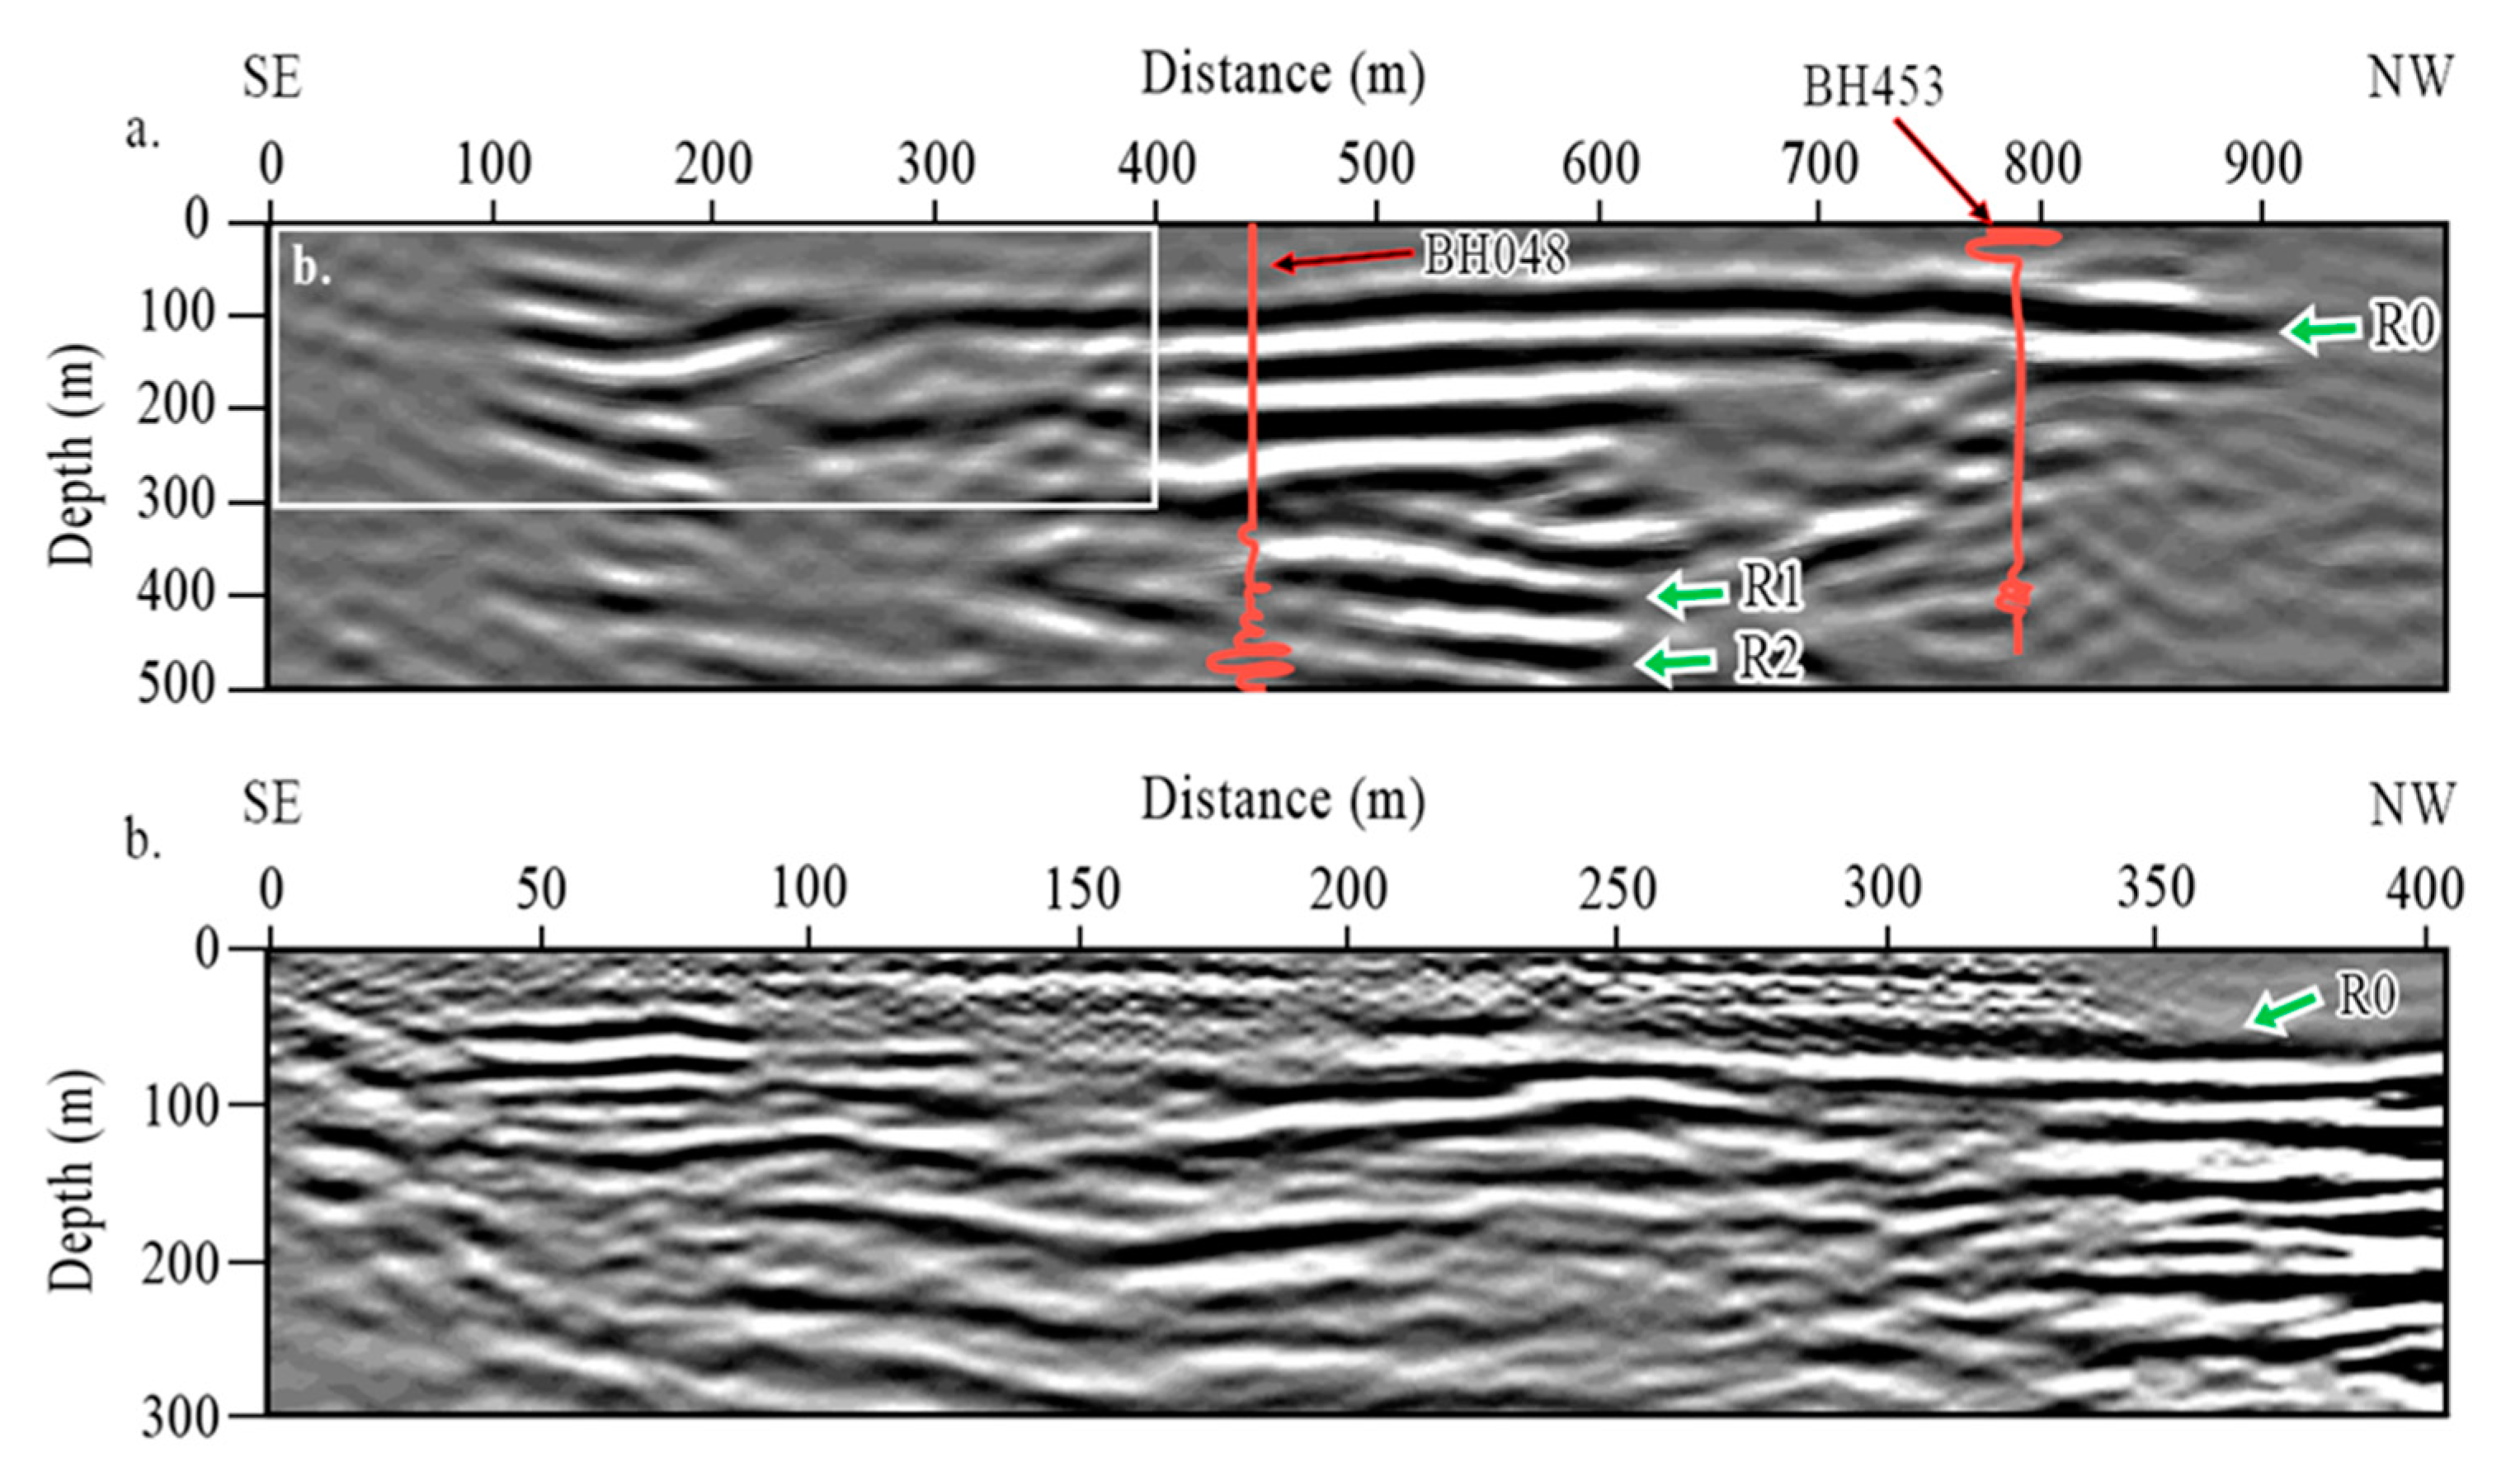
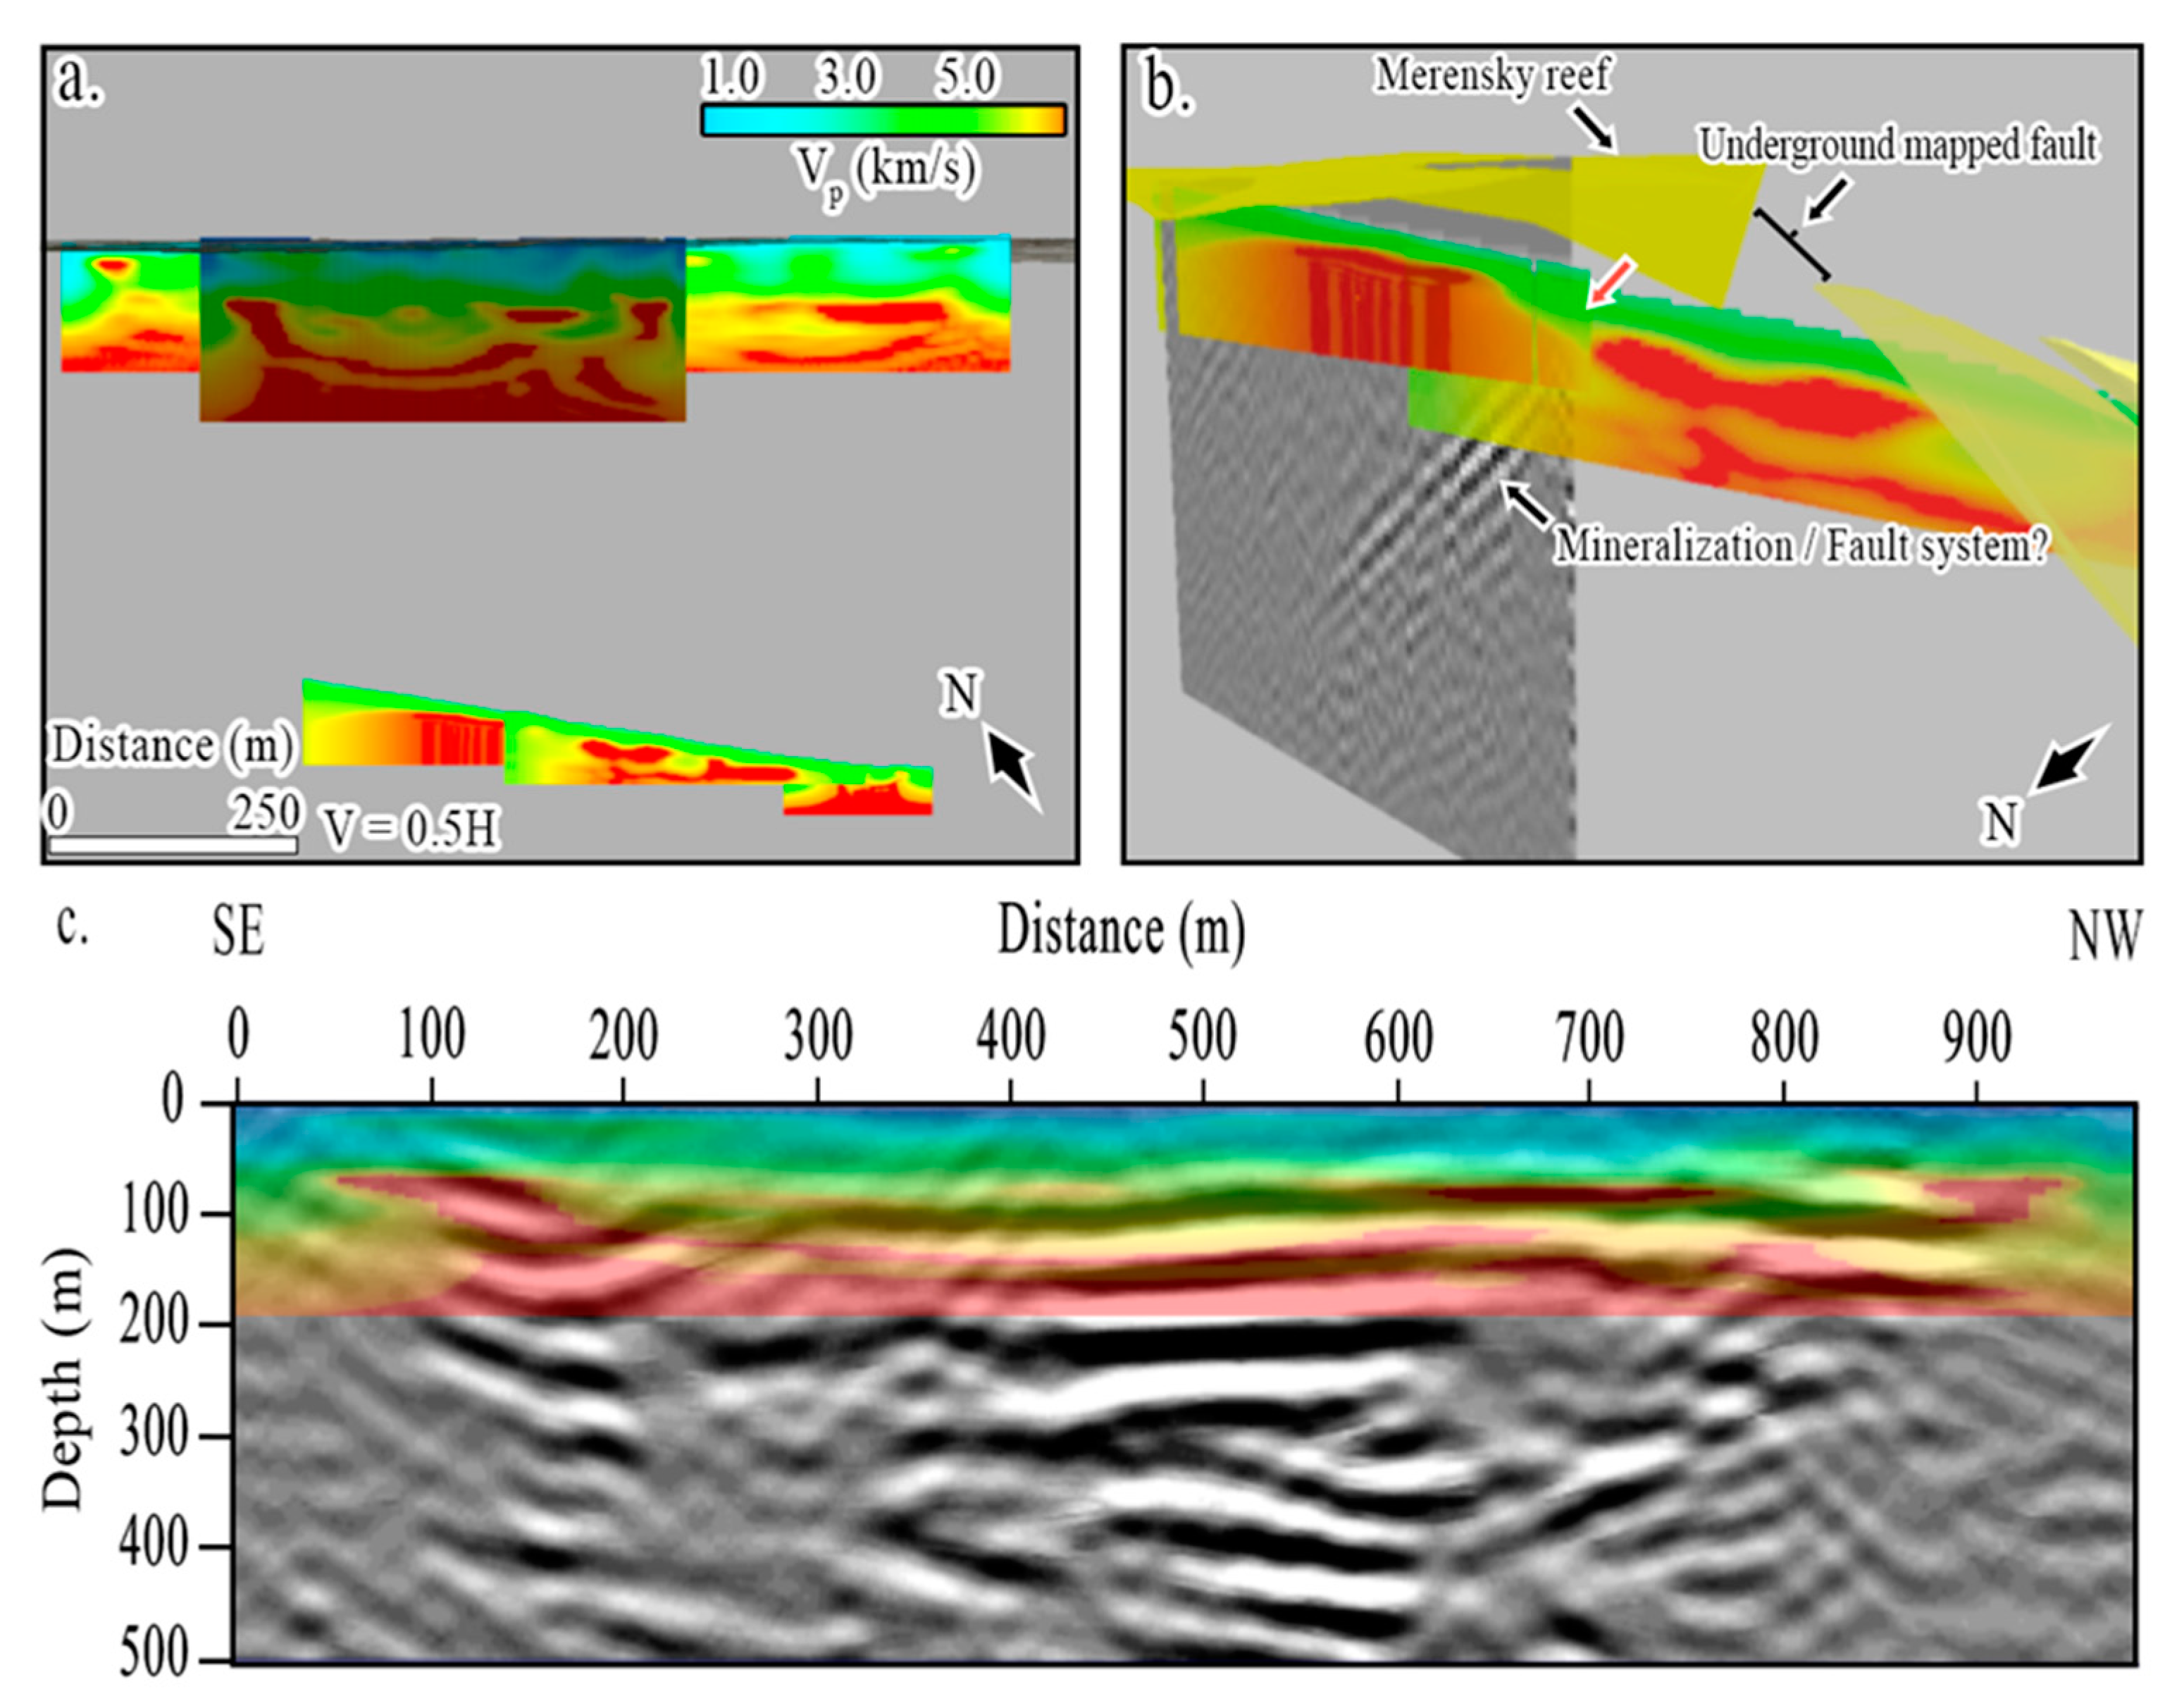
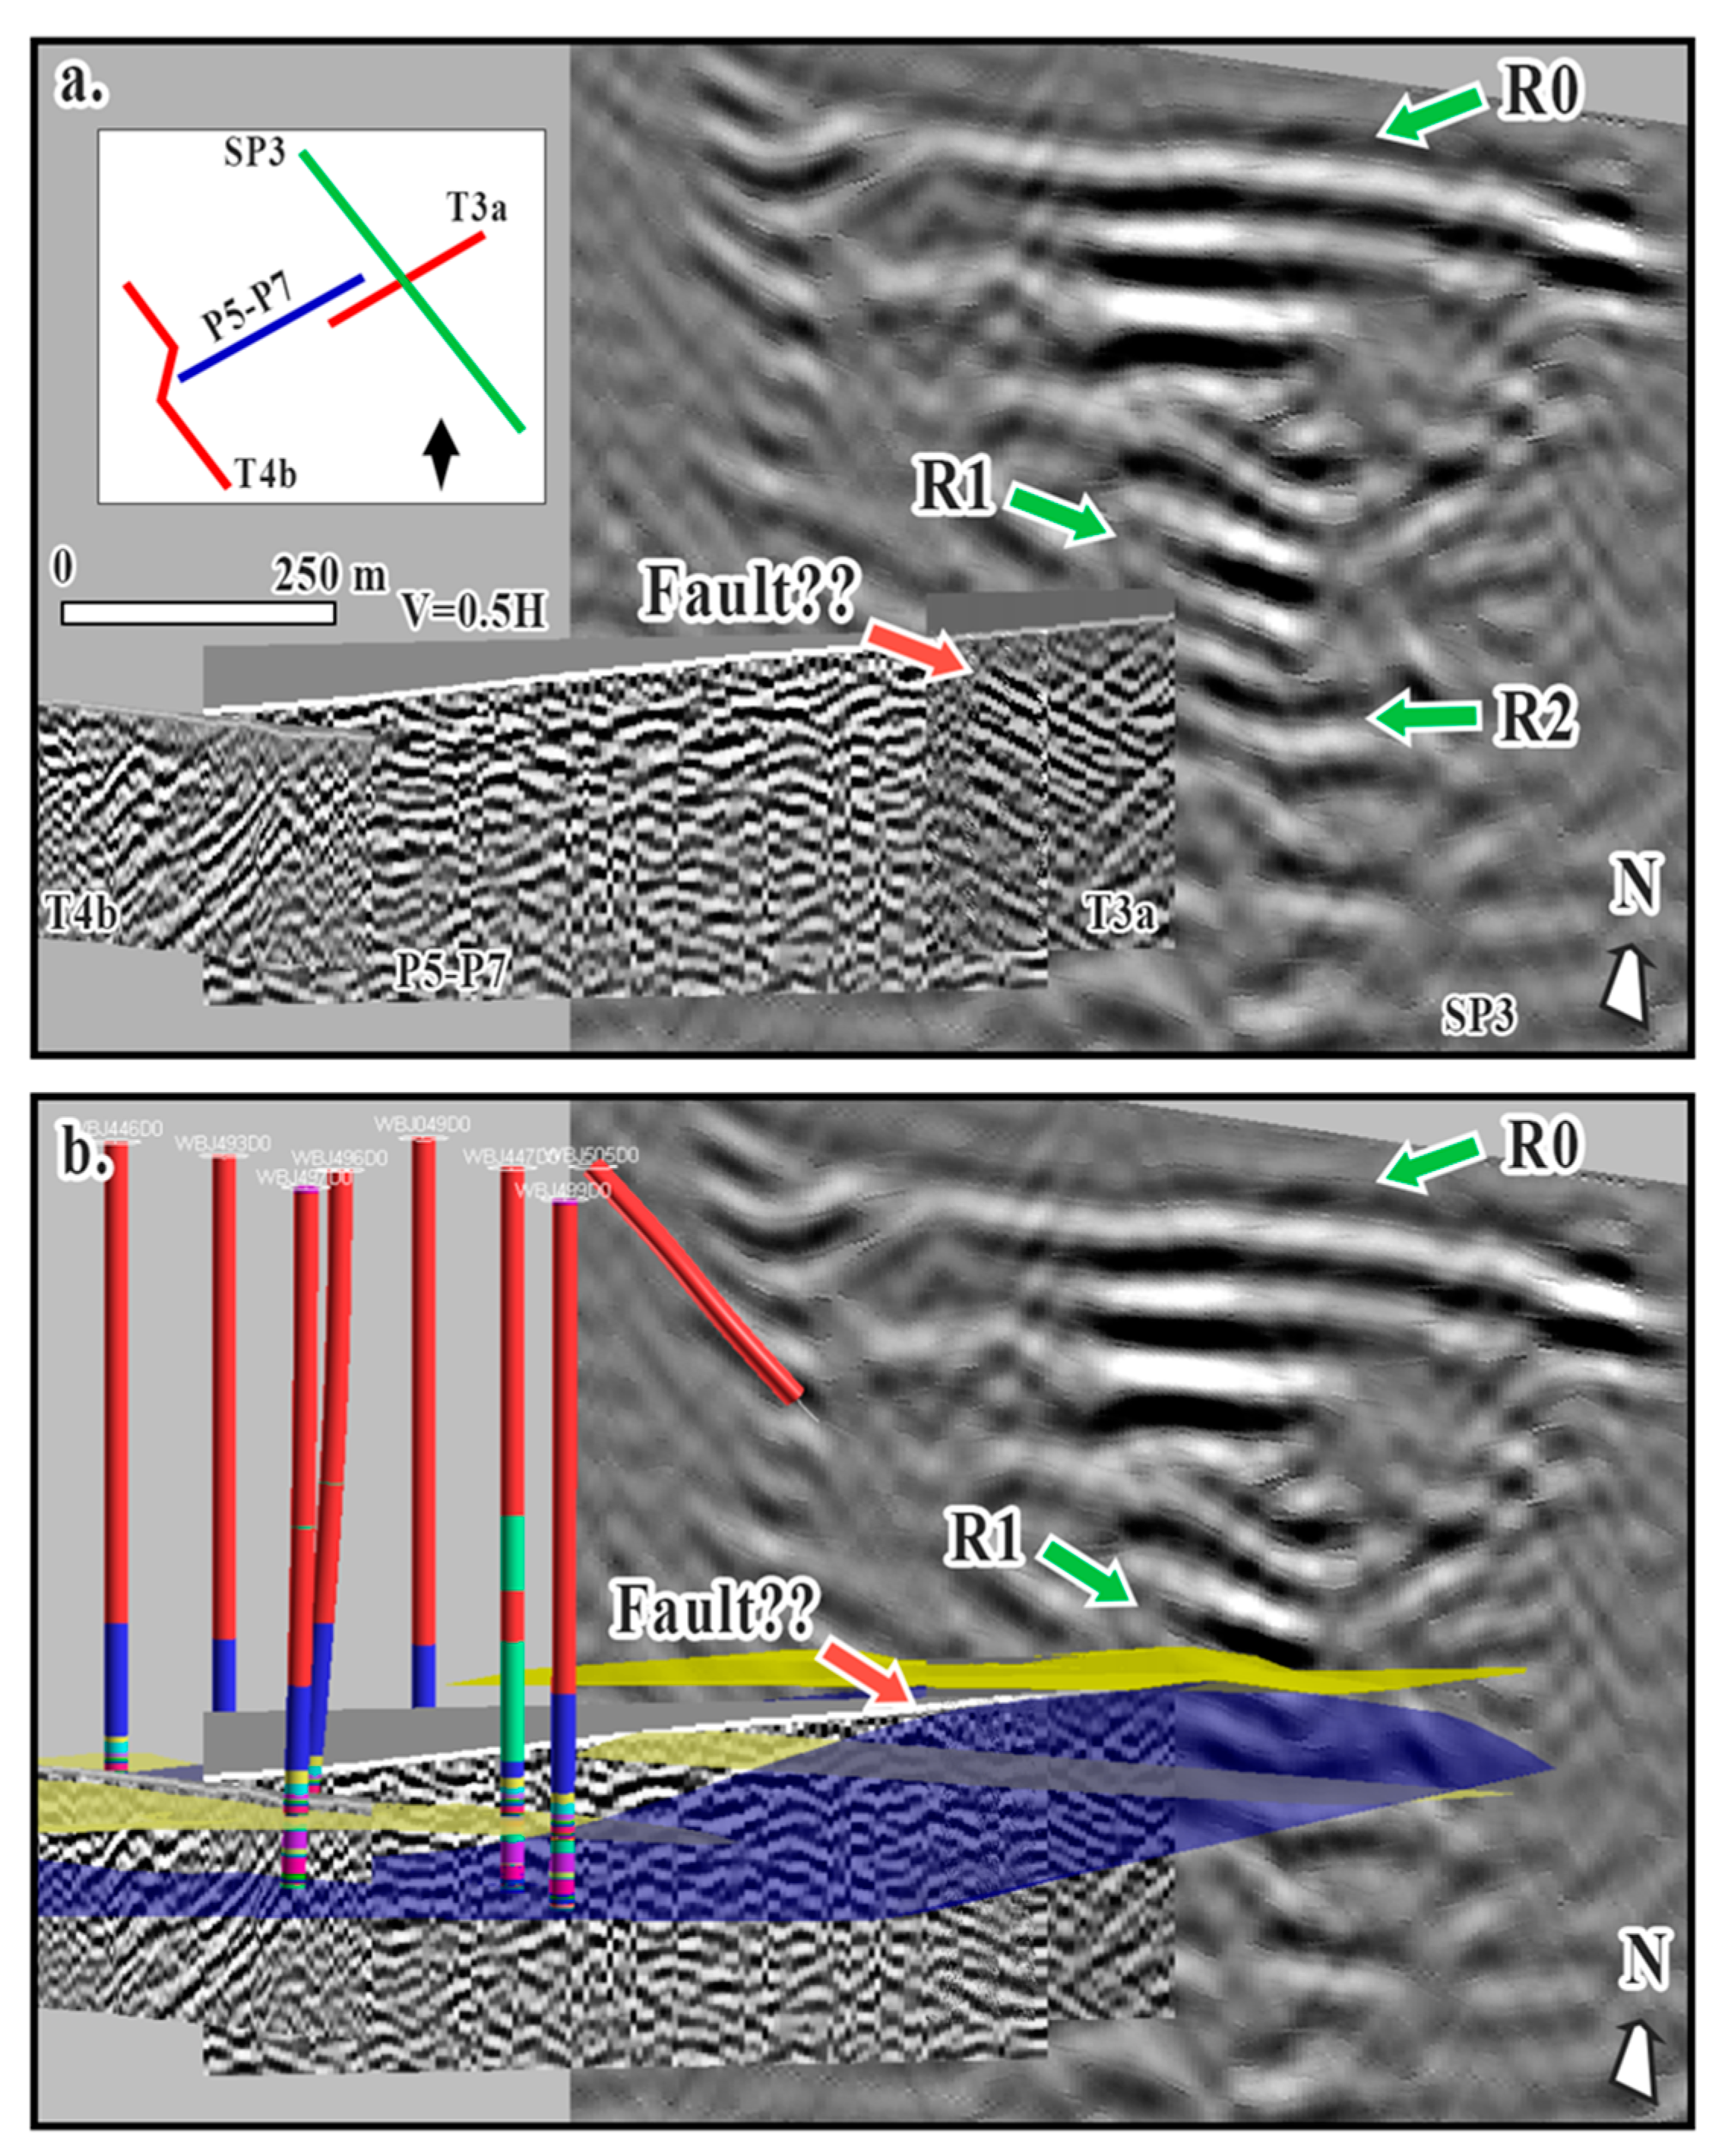
6. Results, Interpretation, and Discussion

Seismic data acquired in phase two generated improved results in terms of structural imaging when compared to phase one. The primary improvement was achieved by altering the seismic designs, with a better setup of the landstreamer, a small sampling rate (1 ms), and a better understanding of the geology of the area. In general, the seismic data quality is satisfactory, and the seismic sections exhibit well-defined reflectors (some associated with orebodies) and distinct fault compartmentalization. Numerous faults of many orientations affecting the orebody were clearly mapped below the tunnel floor.
The seismic section examples from phase two are shown in Figure 12a–c. Since there was no borehole control to constrain the interpretation, it was difficult to determine the geological origin of the reflections observed in seismic sections, particularly in the western part of the study area along the incline tunnel. The recorded seismic wave-field was influenced by the development of tunnels and side tunnels along the incline where the seismic receivers were situated. It is also possible that energy contributions from the sides and above the mining level where the tunnel profiles are located contributed to the observed geological complexity of the rocks.
The seismic section from profile TP3a is shown in Figure 12a. Normal and reverse faults with a variety of dips, throws, and orientations dominate the majority of the section. The most dominant feature in the section is the north–south-trending fold, which is overprinted by steeply dipping (>60°), north–northwest-, and north–northeast-trending faults. Folding and faulting are interpreted to affect UG2 (indicated by green arrows) and the underlying strata, which is critical for future mining in the area. The seismic section suggests that the throw has a displacement of less than 20 m, down to 2 m.
The seismic section from T3b, acquired by the planted geophones along the incline tunnel, is shown in Figure 12b. Although T3b shows less structural complexity compared to T3a, this reduced complexity can be attributed to potential under-sampling caused by the fixed positioning of the geophones and the associated variability in coupling quality. Nonetheless, a large structure with a north–northwest-trending throw of more than 150 m is clearly visible on the seismic section. The seismic section shows that the fault is normal and listric in form, cross-cutting and offsetting the UG2 (green arrows) and underlying horizons, thus constraining the relative age of the fault displacement to post-UG2 deposition.
Figure 12c shows the depth-converted seismic section of TP4b, which has been preconditioned with structure-oriented filtering and curvelet transform de-noising. The seismic section images steeply dipping major (>10 m throw) and minor (<10 m) faults cross-cutting and displacing the stratigraphy and orebodies (mainly UG2). The green arrows in Figure 12c indicate the imaging of the UG2 horizon. The red arrows indicate areas with faults and dykes. The dykes are interpreted in the data as diffractions or as highly attenuated seismic events that cross-cut the strata. Faults, on the other hand, are associated with discontinuities in the data. Dykes are also observed in the fault zones as attenuated high-amplitude events.
P-wave velocities obtained from the first break tomograms indicate a two-layer model: fractured top layer (~10 m thick) exhibiting velocities between 1000 m/s and 4000 m/s and the variable depth to bedrock (10–40 m) with velocities between 4000 m/s and 6500 m/s. The velocities from the tomograms show a satisfactory match with the known velocities (norite and pyroxenite; [7]) and borehole stratigraphy, consequently complementing P-wave reflectivity observed on the final stacked sections (Figure 12). In general, the data suggest that the top layer contains low velocities due to fracturing, which is imaged by reflection seismic surveys. Based on the refraction tomograms, existing boreholes (Figure 2), geological models (Figure 11a), and tunnel observations (i.e., outcropping MR and UG2), the stratigraphy generally dips at ~10° toward west–southwest and dips 60° east–northeast due to folding and faulting.
The surface seismic sections show a series of flat reflections (e.g., R0) and gently dipping reflections (e.g., R1 and R2). The reflections are interpreted based on the geological models, borehole data, and visualization of seismic sections in 3D (Figure 12, Figure 13, Figure 14 and Figure 15). Figure 13 shows the migrated stack sections of SP2 and SP3 correlated with the downhole logs. R0 correlates with the sharp changes in velocity and density due to contact between the overburden and the bedrock. According to BH048 log data, two distinct acoustic impedance contrast regions at 425 and 480 m depth (Figure 10) correlate with reflections R1 and R2 on the migrated section of SP2 (Figure 13a). The reflections on R1 and R2 show a gentle dip northwest on SP2 and are observed at depths of 400 and 450 m. The observed reflections are out-of-plane as a result of the ~50 m offset of boreholes and seismic profiles. The reflections seen on the synthetic traces and seismic sections are correlated to be of the same origin but are seen at different depths due to the variability of the reflector geometry across the survey area. The mineralization is visible as a high-amplitude reflector in the seismic data. The strong impedance contrasts are associated with the Merensky Reef and UG2, respectively.
Surface seismic tomography models were calculated in a similar software package and exhibit velocity ranges between 1000 m/s and 4000 m/s for the top weathered layer, followed by 4000 m/s to 6500 m/s for bedrock. Figure 14c shows a migrated stack section of profile SP2, with the P-wave velocity model superimposed. The depth of the bedrock reflection corresponds with the high-velocity region (4000–6500 m/s) on the P-wave model.
Figure 15 presents the 3D model of the migrated seismic data with the prominent features revealed. The data exhibit strong reflections and geological structures at depths down to 590 m from the surface. The borehole data intercept the Merensky Reef and UG-2 at depths of 515 m and 570 m, respectively. It is clear from Figure 15b that the reflections R1 and R2 are generated by the mineralization and show possible extensions to the east and west. This opens up possibilities for the mine to extend their mining operations to exploit the reefs.

7. Two-Dimensional High-Resolution Seismic in Noisy Mining Environment

In addressing the challenges of acquiring seismic data in noisy mining environments and the innovative approaches needed to overcome them, our study revealed several key issues and potential solutions. The primary challenge encountered was the pervasive presence of mine infrastructure-generated noise, which significantly affected data quality on some traces.

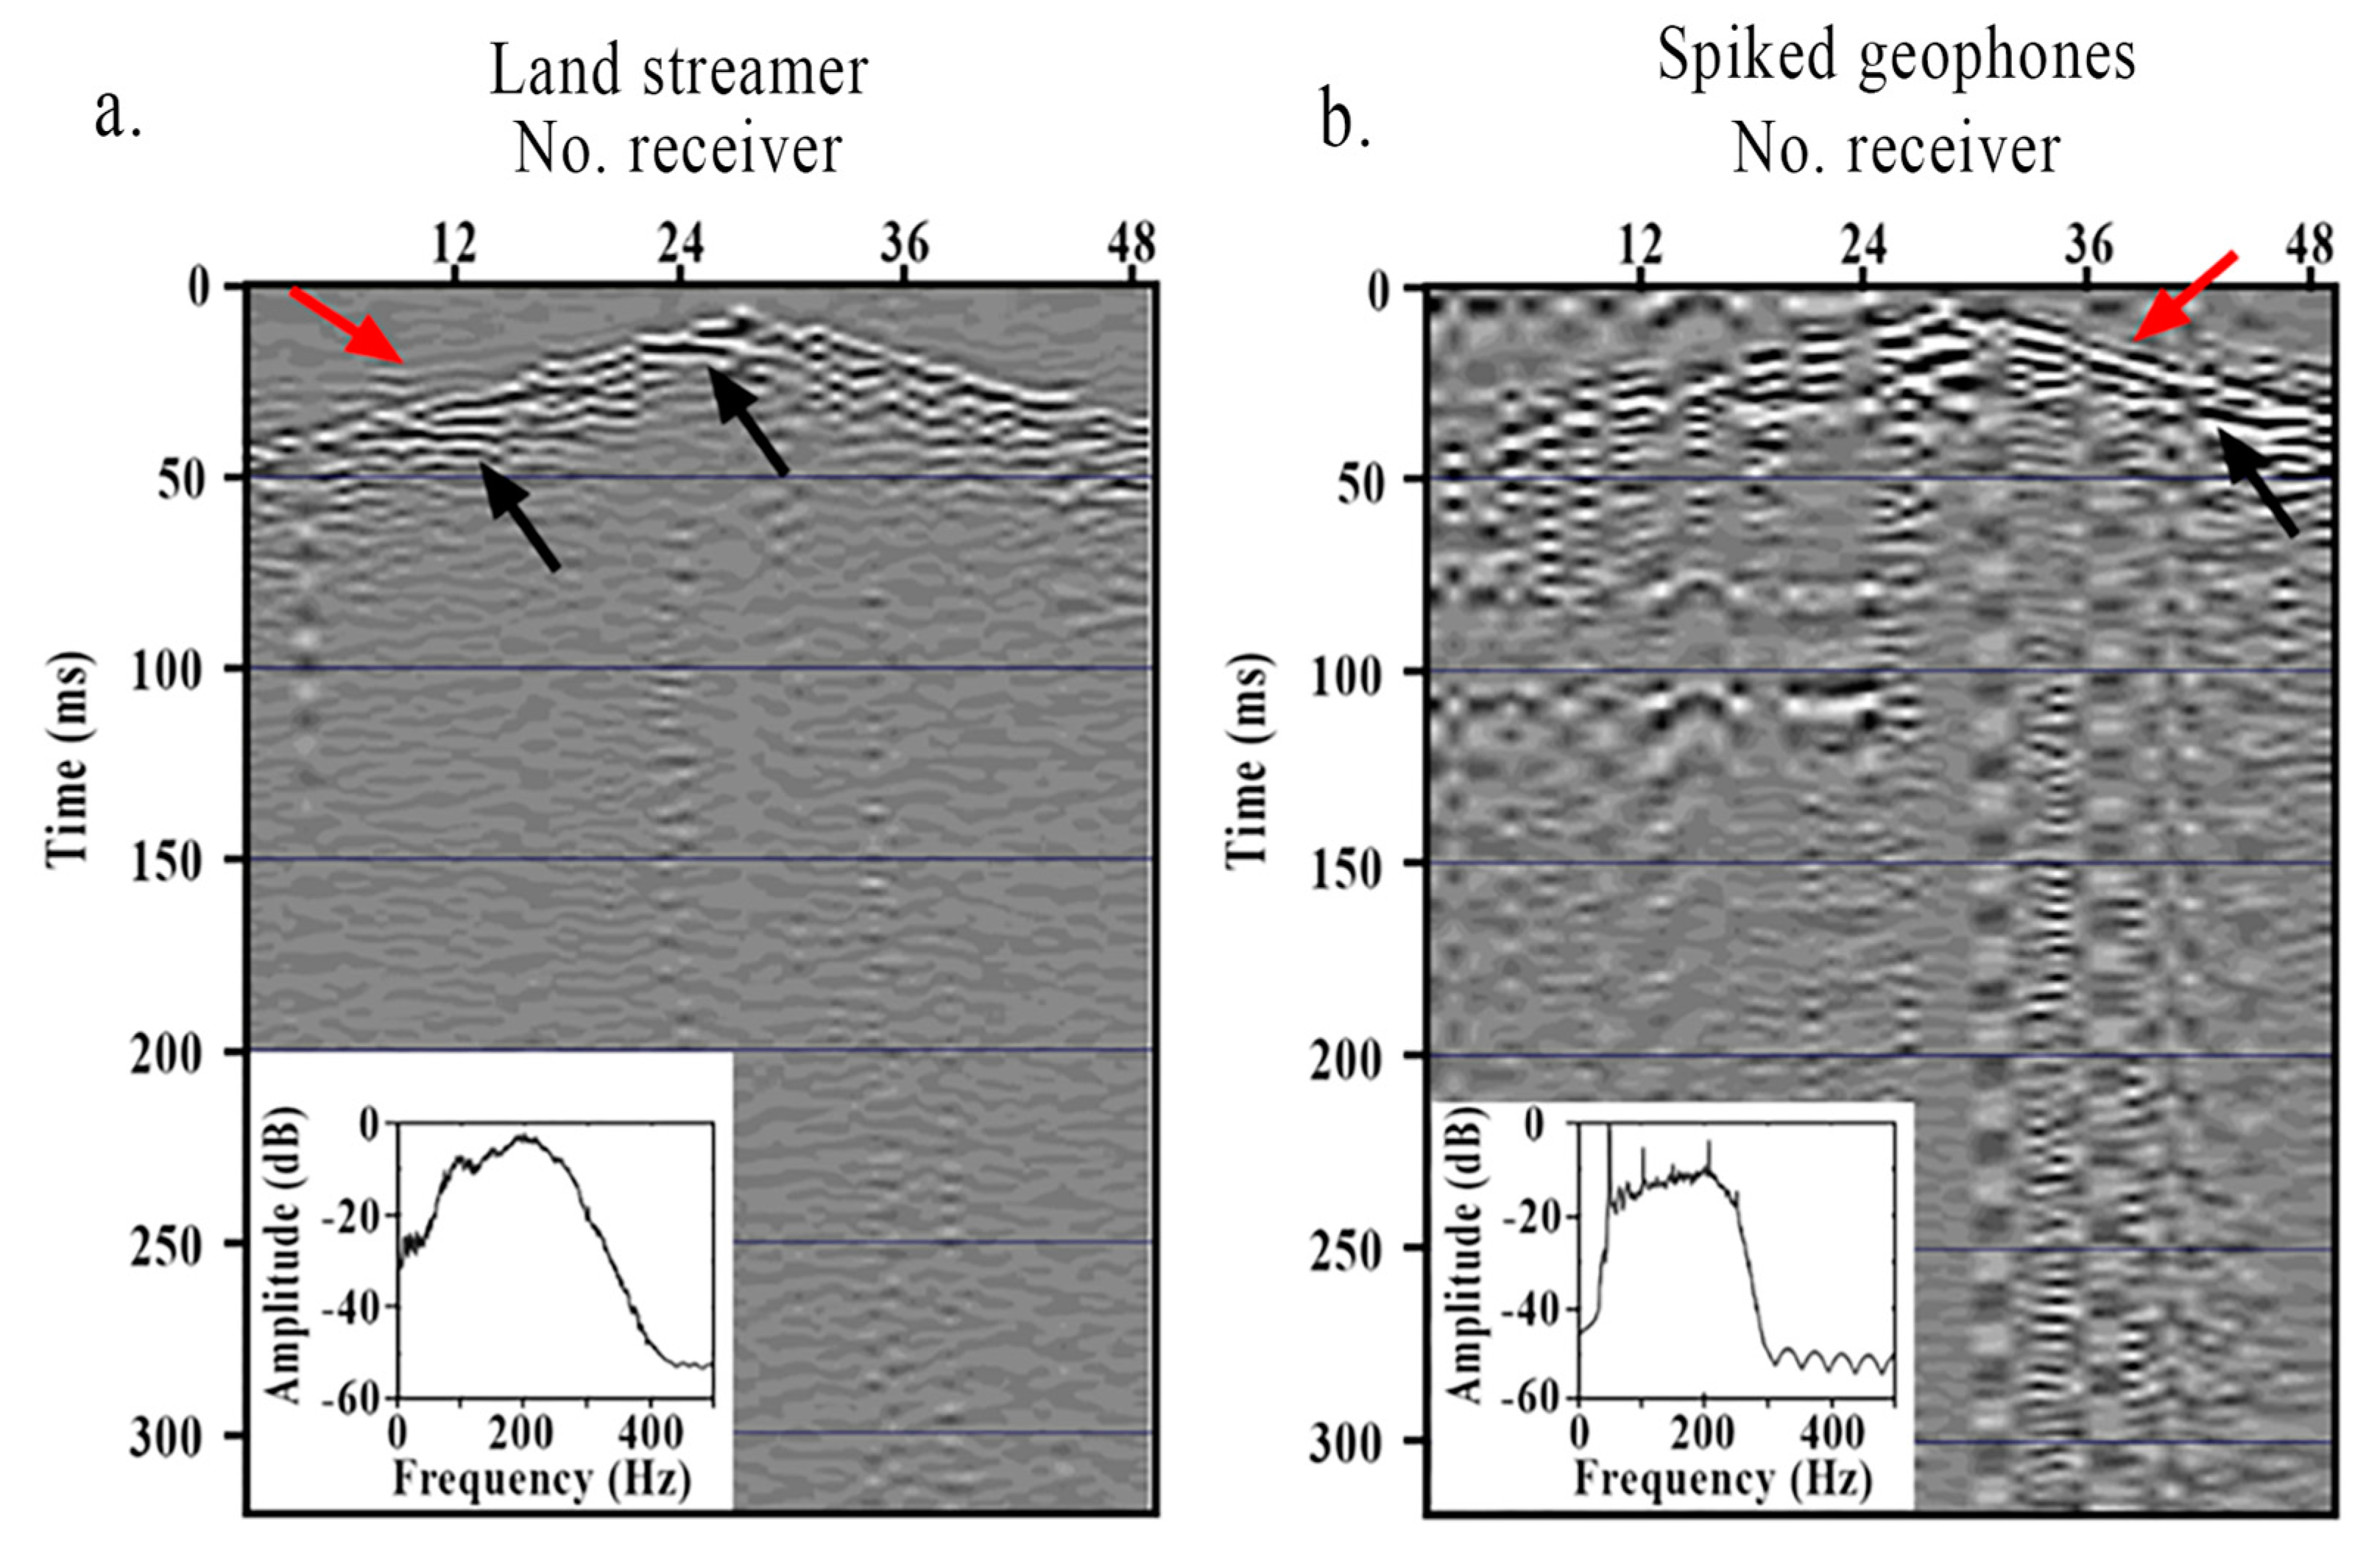
7.1. Sensors and Seismic Source

The use of a seismic landstreamer with 4.5 Hz 1C geophones generated clear results; however, some traces were still dominated by mine infrastructure-generated noise (Figure 3a). The next step is to use sensors on the landstreamer that are less sensitive to electrical noise. One option will be to use a three-component (3C) micro-electromechanical system (MEMS)-based seismic landstreamer [15]. This has three advantages over our landstreamer: (1) it records three-component data; (2) it provides improved coupling with the tunnel floor; (3) it is MEMS-based and less sensitive to electrical noise in a noisy environment [15]. The use of underground mine infrastructure for active-source seismic surveys implies working in restricted spaces, inevitably imposing limitations on the selection of the seismic source. From one perspective, the seismic source selected must be versatile, easy to transport, operate, and move in different mine tunnels and drifts at the desired depth [16,17]. This poses considerable restrictions on the sources that can be used inside the mine, given the need to comply with established mine safety protocols. For example, sources such as vibroseis and those that use gasoline engines, like some accelerated weight drop sources, cannot be used inside the mine. In this study, a sledgehammer hammer was used with success. However, while a sledgehammer can produce seismic waves with frequencies up to 300 Hz, its effectiveness in generating signals at higher frequencies might be limited compared to other seismic sources. It also has a limited depth of penetration. For example, the sledgehammer allowed for the imaging of structures at depths down to 200 m.
Furthermore, we implemented novel survey designs adapted to the underground environment, carefully optimizing source and receiver placements to maximize coverage within the confined spaces. Data processing innovations were also crucial, employing advanced noise reduction techniques specifically tailored to the unique noise characteristics of the mining environment. These included adaptive filtering methods and careful trace editing to enhance signal quality. While these approaches significantly improved our ability to image mineralization and associated geological structures in this challenging environment, we acknowledge that further innovations are needed. Future work may focus on developing custom equipment designed specifically for in-mine seismic surveys as well as exploring machine learning algorithms for improved noise suppression and signal enhancement in these complex settings.

7.2. Mineral Exploration

The study demonstrated the use of seismic methods to delineate mineralization and the associated geological structures. The study area is structurally complex, with geological features such as faults, dykes, sills, and IRUPs that cross-cut the mineralization. Figure 15 shows 3D views of the migrated sections of surface (SP3) and underground profiles (P5–P7), with all the seismic profiles imaging the mineralization. This study is encouraging and opens possibilities for seismic reflection to be used for mineral exploration in noisy mining environments.

8. Conclusions

This study demonstrates the effectiveness of seismic methods in delineating mineralization and associated geological structures within a noisy mining environment. Through the utilization of both in-mine and surface seismic surveys, valuable insights into the subsurface geology of the Maseve Mine were obtained. The in-mine surface seismic survey acquired at Maseve Mine was processed using conventional processing techniques. These techniques enhanced near-surface reflections and boosted the signal of the dataset. The complex tunnel seismic experiments proved the application of seismic methods using in-mine infrastructure to image platinum deposits and geological structures. Precise data processing techniques were important to enhance high-quality reflections and suppress coherent noise generated by infrastructure. The seismic data, acquired through a combination of landstreamer and planted geophone technologies, provided clear imaging of faults, dykes, and orebodies such as the Merensky Reef and Upper Group-2 (UG2) deposits. The simple surface experiments not only proved to be efficient but also illustrated the capability of small-scale seismic surveys to directly image the subsurface. The use of a small-scale seismic survey can add value in active mining environments for exploration purposes.
The seismic profiles revealed a structurally complex subsurface characterized by faulting, folding, and the presence of various geological features. The analysis of the seismic data, supported by borehole information and numerical modeling, enabled the identification and interpretation of key geological structures critical for future mining operations. Furthermore, the study highlights the potential of seismic reflection methods for mineral exploration in challenging environments. Despite the noise generated by mine infrastructure, the seismic data acquired yielded valuable insights into the distribution of mineralization and geological structures.
Moving forward, this study suggests potential enhancements to seismic acquisition methodologies, such as the utilization of three-component (3C) MEMS-based seismic landstreamers and alternative seismic sources for improved data quality and depth penetration. These advancements could further enhance the applicability of seismic methods in noisy mining environments, facilitating more accurate subsurface characterization and mineral exploration efforts. Overall, this research contributes to the growing body of knowledge on the application of seismic methods in mineral exploration and resource assessment, offering valuable insights for both academia and industry practitioners.

Author Contributions

Conceptualization, M.R. and M.M.; methodology, M.R. and M.S.; software, I.J.; validation, M.M., I.J. and M.S.; formal analysis, M.R., I.J. and M.S.; investigation, M.R., I.J. and M.S.; resources, M.M. and M.P.; data curation, M.R. and M.S.; writing—original draft preparation, M.R.; writing—review and editing, M.R., M.M., I.J., R.D., M.S. and M.P.; visualization, M.R.; supervision, M.M; project administration, M.M. and M.P.; funding acquisition, M.P. All authors have read and agreed to the published version of the manuscript.

Funding

This research was funded by National Research Foundation (NRF); Centre of Excellence for Integrated Mineral and Energy Resource Analysis (DSI-NRF Cimera), Grant/Award Number: 91487.

Data Availability Statement

The data presented in this study are available upon request from the corresponding authors. The data are not publicly available due to privacy restrictions.

Acknowledgments

This study was sponsored by the Mandela Mining Precinct. Mandela Mining Precinct has received funding from the Department of Science and Innovation together with the Minerals Council of South Africa. The support of the Department of Science and Innovation through its funding agency, the National Research Foundation, and the Centre of Excellence for Integrated Mineral and Energy Resource Analysis (DSI-NRF CIMERA) toward this research is hereby acknowledged. University of the Witwatersrand students are appreciated for their contribution during data acquisition. Tesseral Inc., Globe Claritas, and MATLAB were used for data processing, modeling, and visualization of the data.

Conflicts of Interest

Michelle Pienaar is an employee of Mandela Mining Precinct. Moyagabo Rapetsoa has received research grants (bursary) from Mandela Mining Precinct This paper reflects the views of the authors and not the company. The remaining authors declare that they have no known competing financial interests or personal relationships that could influence the work reported in this paper.

References

  1. Ediriweera, A.; Wiewiora, A. Barriers and Enablers of Technology Adoption in the Mining Industry. Resour. Policy 2021, 73, 102188. [Google Scholar] [CrossRef]
  2. Upstill, G.; Hall, P. Innovation in the Minerals Industry: Australia in a Global Context. Resour. Policy 2006, 31, 137–145. [Google Scholar] [CrossRef]
  3. Juhlin, C.; Lindgren, J.; Collini, B. Interpretation of Seismic Reflection and Borehole Data from Precambrian Rocks in the Dala Sandstone Area, Central Sweden. First Break 1991, 9, 24–36. [Google Scholar] [CrossRef]
  4. Eaton, D.W.; Milkereit, B.; Salisbury, M.H. Hardrock Seismic Exploration; Geophysical developments series; Society of Exploration Geophysicists: Tulsa, OK, USA, 2003; ISBN 978-1-56080-114-6. [Google Scholar]
  5. Ahmadi, O.; Juhlin, C.; Malehmir, A.; Munck, M. High-Resolution 2D Seismic Imaging and Forward Modeling of a Polymetallic Sulfide Deposit at Garpenberg, Central Sweden. Geophysics 2013, 78, B339–B350. [Google Scholar] [CrossRef]
  6. Malehmir, A.; Manzi, M.; Draganov, D.; Weckmann, U.; Auken, E. Introduction to the Special Issue on “Cost-Effective and Innovative Mineral Exploration Solutions”. Geophys. Prospect. 2020, 68, 3–6. [Google Scholar] [CrossRef]
  7. Manzi, M.S.D.; Cooper, G.R.J.; Malehmir, A.; Durrheim, R.J. Improved Structural Interpretation of Legacy 3D Seismic Data from Karee Platinum Mine (South Africa) through the Application of Novel Seismic Attributes. Geophys. Prospect. 2020, 68, 145–163. [Google Scholar] [CrossRef]
  8. Malehmir, A.; Bellefleur, G.; Juhlin, C.; Milkereit, B. Seismic Methods In Mineral Exploration And Mine Planning—Introduction. Geophysics 2012, 77, WC1–WC2. [Google Scholar] [CrossRef]
  9. Brodic, B.; Malehmir, A.; Pacheco, N.B.M.; Juhlin, C.; Carvalho, J.; Dynesius, L.; Van Den Berg, J.; de Kunder, R.; Donoso, G.; Sjölund, T.; et al. Innovative Seismic Imaging Of VMS Deposits, Neves-Corvo, Portugal: Part I—In-Mine Array. Geophysics 2021, 86, 1–76. [Google Scholar] [CrossRef]
  10. Scheiber-Enslin, S.E.; Manzi, M. Integration of 3D Reflection Seismics and Magnetic Data for Deep Platinum Mine Planning and Risk Mitigation: A Case Study from Bushveld Complex, South Africa. Explor. Geophys. 2018, 49, 928–939. [Google Scholar] [CrossRef]
  11. Rapetsoa, M.K.; Manzi, M.S.D.; Westgate, M.; Sihoyiya, M.; James, I.; Onyebueke, E.; Kubeka, P.; Durrheim, R.J.; Kgarume, T. Cost-effective In-mine Seismic Experiments to Image Platinum Deposits and Associated Geological Structures at Maseve Platinum Mine, South Africa. Near Surf. Geophys. 2022, 20, 572–589. [Google Scholar] [CrossRef]
  12. Sehoole, L.; Manzi, M.; Zhang, S. Application of 3D Seismic to Enhance Mapping of Potholes in the Western Bushveld Complex, South Africa; European Association of Geoscientists & Engineers: Utrecht, The Netherlands, 2018; Volume 2018, pp. 1–3. [Google Scholar] [CrossRef]
  13. Ledwaba, L.S.; Scheepers, J.; Durrheim, R.J. Rockburst damage mechanism at impala platinum mine. In Proceedings of the Second Southern Hemisphere International Rock Mechanics Symposium SHIRMS, Sun City, South Africa, 15–17 May 2012. [Google Scholar]
  14. Basson, I.J. Cumulative Deformation and Original Geometry of the Bushveld Complex. Tectonophysics 2019, 750, 177–202. [Google Scholar] [CrossRef]
  15. Brodic, B.; Malehmir, A.; Bastani, M.; Mehta, S.; Juhlin, C.; Lundberg, E.; Wang, S. Multi-Component Digital-Based Seismic Landstreamer and Boat-Towed Radio-Magnetotelluric Acquisition Systems for Improved Subsurface Characterization in the Urban Environment. First Break 2017, 35, 41–47. [Google Scholar] [CrossRef]
  16. Malehmir, A.; Maries, G.; Bäckström, E.; Schön, M.; Marsden, P. Developing Cost-Effective Seismic Mineral Exploration Methods Using A Landstreamer And A Drophammer. Sci. Rep. 2017, 7, 10325. [Google Scholar] [CrossRef] [PubMed]
  17. Markovic, M.; Maries, G.; Malehmir, A.; Von Ketelhodt, J.; Bäckström, E.; Schön, M.; Marsden, P. Deep Reflection Seismic Imaging Of Iron-Oxide Deposits In The Ludvika Mining Area Of Central Sweden. Geophys. Prospect. 2020, 68, 7–23. [Google Scholar] [CrossRef]
Figure 1. (a) Geological map of the Bushveld Complex, showing the location of Maseve Mine and major geological structures. Insert shows the location of the Bushveld Complex within South Africa. (b) Generalized seismic stratigraphy column of the critical zone, highlighting (red outline) the chromitite layers that are at Maseve and common geological structures (potholes and IRUPs) encountered. MR: Merensky Reef, UG: Upper Group, MG: Middle Group, IRUPs: Iron Rich Ultramafic Pegmatites, LG: Lower Group.
Minerals 14 00913 g001
Figure 2. Underground mine plan, showing the location of the seismic profiles (orange) and geological structures such as faults (blue) and dolerite dyke (green) for in-mine seismic experiments.
Minerals 14 00913 g002
Figure 3. Shot gather examples with frequency spectrum from planted and landstreamer receivers. Shot 45 and shot 73. (a) Shows landstreamer shot gathers; (b) shows planted geophone shot gathers. Red arrows show first breaks, black arrows show reflections.
Minerals 14 00913 g003
Figure 4. Measurements of the seismic velocities underground using an ultrasonic pulse meter over a (a) weak zone and (b) dyke. (c,d) Shows the setup inside the tunnel of the seismic survey using the seismic landstreamer (red arrows) and planted geophone (green arrows).
Minerals 14 00913 g004
Figure 5. Surface lines (SP1, SP2, and SP3: Dotted line) and the two long underground seismic profiles (TP2 and TP3) collected inside the tunnel, a few meters above the Merensky Reef (yellow), UG2 (purple) deposits, and dyke (blue) within the white outline.
Minerals 14 00913 g005
Figure 6. Seismic source and receivers used during the Maseve surface seismic acquisition (August 2022). (a) Photo of the G-PEG 500 drop hammer. (b) Sercel UNITE wireless 1C recorders, with a Geometrics Geode cabled system. (c) Wireless receivers and 14 Hz cabled system collocated and spaced at 5–10 m from each other along seismic profiles SP2 and SP3.
Minerals 14 00913 g006
Figure 7. Three shot gather examples from TP1, TP3a, and TP4b, with the corresponding frequency spectrum. (ac) Raw and (df) processed shot gathers, with reflections highlighted by the black arrows.
Minerals 14 00913 g007
Figure 8. (a) Field conditions showing electrical power cables above the survey area and (b) processing plant (green arrow) near the seismic profiles. (c) Raw shot gather affected by 50 Hz electrical noise and (d) strong coherent noise caused by the processing plant (green arrow).
Minerals 14 00913 g008
Figure 9. Shot gather identified reflections example from SP2, showing (a) raw shot gather (with noise contaminated reflections: red arrow) and (b) processed shot gather (improved reflections: red arrow) with their corresponding frequency spectrum normalized to one and shown for 0–250 Hz. Change in frequency content can be observed between channels 1–48 and 49–96 due to the different geophones used (4.5 Hz and 14 Hz).
Minerals 14 00913 g009
Figure 10. Borehole data from (see Figure 2) (a) BH048, (b) BH469, and (c) BH453 at Maseve Mine. Reflection depth series was calculated using the velocity and density. We then produced a synthetic trace by convolving the reflection time series with the Ricker wavelet of 60 Hz. As shown here, the Merensky Reef, UG-2, and UG-1 should be reflective by their hanging wall and footwall due to the sharp acoustic impedance contrast changes. MR: Merensky Reef; UG-2: Upper group-2; UG-1: Upper group-1. IRUP: iron-rich ultramafic pegmatite.
Minerals 14 00913 g010
Figure 11. (a) Finite difference model for the Maseve Mine. The model shows the two target mineralizations (MR and UG2) and geological structures (faults, potholes, and IRUPs). The velocity and density of the rocks are noted. (b) Post-stack time migrated section (depth converted) derived from synthetic data showing the imaging of the Merensky Reef, UG2, faults (green arrows), pothole (red dotted line) and IRUPs.
Minerals 14 00913 g011
Figure 12. Depth-converted section of seismic profile: (a) TP3a landstreamer, (b) TP3b-spiked geophone, and (c) TP4b landstreamer showing the imaging of the UG2 (green arrows) and geological structures such as faults and dykes (red arrows).
Minerals 14 00913 g012
Figure 13. Migrated depth stack section of (a) SP2, with projected synthetic traces from the BH048, a depth discrepancy of ~25 m is a result of the borehole being ~50 m away from the seismic profile, and (b) SP3 shows clear reflections in the first 200 m. Green arrows mark different reflections detailed in the text.
Minerals 14 00913 g013
Figure 14. (a) P-wave velocity model for surface and underground seismic experiments. (b) P-wave velocity model superimposed on a migrated seismic section and geological model of the Merensky Reef (yellow surface). Observed low velocity zone (red arrow) that corresponds with the high amplitude reflections (mineralization/fault system). (c) Overlay of P-wave velocity model on top of the migrated seismic section from SP2.
Minerals 14 00913 g014
Figure 15. (a) Three-dimensional views of the migrated stack section of underground seismic profiles (P5-P7, T3a, and TP4b) and surface profile SP2. Insert shows the perspective view of the 3D models. (b) Three-dimensional views with borehole data (sticks: colors representing different lithology) and Merensky Reef (yellow surface) and UG-2 (blue surface).
Minerals 14 00913 g015
Table 1. Maseve Mine data acquisition parameters for the four 2D seismic profiles (TP1, TP3a, TP3b, and TP4b) collected in 2022 and discussed in this study.
ProfilesTP1TP3aTP3bTP4b
Survey parameters
Acquisition typeFixed straight lineFixed straight lineFixed straight lineFixed crooked line
Acquisition systemGeometrics GeodeGeometrics GeodeGeometrics GeodeGeometrics Geode
Receiver frequency4.5 Hz4.5 Hz14 Hz4.5 Hz
No. of receivers24484848
Receiver spacing25 m5 m5 m
Source6.3 kg sledgehammer
No. of source positions26505050
Source spacing1 m2 m2 m2 m
Profile length48 m235 m235 m235 m
Recording length500 ms500 ms500 ms500 ms
Sampling interval1 ms1 ms1 ms1 ms
Table 2. Summary of the seismic data acquisition parameters of surface seismic profiles (August 2022).
ProfilesSP1SP2SP3
Survey parameters
Acquisition typeFixed straight lineFixed straight lineFixed crooked line
Acquisition systemSercel UNITESercel UNITEGeometrics Geode
Receiver frequency4.5 Hz4.5 Hz14 Hz
No. of receivers19810196
Receiver spacing10 m105 m
Source500 kg G-PEG drop hammer
No. of source position19810135
Source spacing10 m10 m10 m
Profile length1970 m1000 m 475
Recording length500 ms500 ms500 ms
Sampling interval2 ms2 ms2 ms
Table 3. Processing steps for the in-mine reflection seismic datasets (TP1, TP3a-b, and TP4b), Maseve Mine. msl: mean surface level.
2D Processing Flow
1.Read SEG-Y data
2.Edit traces, geometry setup
TP1: crooked CDP 1 m bin size
TP3a-b: crooked CDP 2.5 m bin size
TP4b: crooked CDP 2.5 m bin size
3.Pick first breaks
4.SNAWT: surface noise attenuation
5.Refraction and elevation corrections
TP1: datum 537 m below msl, replacement velocity 5000 m/s
TP3a-b: datum 635 m below msl, replacement velocity 5200 m/s
TP4b: datum: 537 m below msl, replacement velocity 5000 m/s
6.Band-pass filtering: 16–80–250–300 Hz
7.Deconvolution: 60 ms filter length, 1 ms gap
8.Remove first arrivals
9.NMO corrections: 70% stretch mute, 20 ms taper
10.f–k filter: surgical muting
11.Velocity analysis
12.Stack
TP1: constant velocity 6000 m/s
TP3a-b: constant velocity 6500 m/s
TP4b: constant velocity 6000 m/s
13.Post-stack coherency enhancement
Spectral weighting 50 100 150 200 250 Hz
Semblance-smoothing
14.Time-to-depth conversion using 6000 m/s and 6500 m/s
Table 4. Processing steps for the surface reflection data along SP1, SP2, and SP3 at Maseve. msl: mean surface level.
2D Processing Flow
1.Prepare SEG-Y
2.Geometry setup
SP1: crooked CDP 5 m bin size
SP2: crooked CDP 5 m bin size
SP3: crooked CDP 2.5 m bin size
Remove 50 Hz noise: adaptive notch filter at 50 Hz
3.Pick first breaks
4.Refraction and elevation corrections
SP1: datum 1091 m above msl, replacement velocity 4500 m/s
SP2: datum 1084 m above msl, replacement velocity 4500 m/s
SP3: datum: 1090 m above msl, replacement velocity 4500 m/s
5.SNAWT: surface noise attenuation
6.Band-pass filtering: 10–20–100–150 Hz
7.Surface wave attenuation
8.Deconvolution: spiking, 60 ms filter length
9.Remove first arrivals energy
10.NMO corrections: 70% stretch mute, 20 ms taper
11.f–k filter: surgical muting
12.Velocity analysis
13.Stack
SP1: constant velocity 6000 m/s
SP2: constant velocity 600 m/s
SP3: constant velocity 6000 m/s
14.Post-stack coherency enhancement
Fx deconvolution
Semblance-smoothing
FK filtering
15.Time-to-depth conversion
Disclaimer/Publisher’s Note: The statements, opinions and data contained in all publications are solely those of the individual author(s) and contributor(s) and not of MDPI and/or the editor(s). MDPI and/or the editor(s) disclaim responsibility for any injury to people or property resulting from any ideas, methods, instructions or products referred to in the content.

