Article

Numerical Simulation and Experimental Study of a Deep-Sea Polymetallic Nodule Collector Based on the Coanda Effect

1
College of Mechanical and Electrical Engineering, Central South University, Changsha 410083, China
2
National Key Laboratory of Deep-Sea Mineral Researches Development and Utilization Technology, Changsha 410083, China
*
Author to whom correspondence should be addressed.
Minerals 2024, 14(9), 915; https://doi.org/10.3390/min14090915
Submission received: 5 August 2024 / Revised: 2 September 2024 / Accepted: 4 September 2024 / Published: 6 September 2024

Abstract

:
Ore collection devices are important for the collection of deep-sea polymetallic nodules. Based on the CFD-DEM solid–liquid two-phase flow coupling calculation method, this paper simulated the rise and transport phases of polymetallic nodules using the Coanda effect ore collection device. The validity of the numerical simulation method was confirmed through experimental testing. On this basis, the effects of different working and structural parameters on the collection rate were studied. The results indicate that the flow rate of the collection jet and the bottom clearance were the primary factors affecting the collection rate of the polymetallic nodules. An increase in the collection jet flow rate leads to a substantial rise in the collection rate of polymetallic nodules. Conversely, an increase in bottom clearance results in a decrease in the collection rate. A collection rate exceeding 90% can be achieved in both scenarios: a 10 mm bottom clearance with an 8 m/s collection jet flow rate, and a 30 mm bottom clearance with a 10 m/s collection jet flow rate. The collection nozzle slant angle has no substantial impact on the collection rate, and the recommended collection nozzle slant angle is 35° to reduce energy loss.

1. Introduction

With increases in exploitation, the amount of metal mineral resources available on land is decreasing, making it difficult to meet the huge demand for social development [1,2]. The ocean, covering approximately 70% of the Earth’s surface area, contains valuable metal mineral resources that are commercially viable for exploitation. These resources include polymetallic nodules, cobalt-rich crusts, and seafloor massive sulfides [3,4,5]. Polymetallic nodules are formed through the slow deposition of metals in seawater and are found extensively in the surface sediments of abyssal plains at depths ranging from 3500 to 6500 m [6]. Compared to other minerals, polymetallic nodules are probably the most widely distributed and abundant metal resource [7]. In addition, the terrain in the polymetallic nodule mining area is relatively flat, which facilitates the movement of the mining vehicle. On the other hand, the mining process of deep-sea polymetallic nodules does not require crushing, which avoids the impact of crushing devices on the seabed environment. These advantages make its mining highly viable.
The primary components of the polymetallic nodule collection system include a mining vehicle, a flexible tube, a relay bin, a lifting pump, a lifting pipeline, and a surface support system [8]. In polymetallic nodule mining progress, the mining vehicle retrieves polymetallic nodules using a specially designed collector. The nodules are then transported to the relay bin through the flexible tube and ultimately conveyed to the mining vessel via the lifting pipeline system. During the whole mining process, the collection device, as a core component, has a significant impact on the final collection results.
At present, there are three main kinds of ore-collecting schemes for polymetallic nodules: mechanical, hydraulic, and hybrid [9] (Figure 1). Mechanical schemes typically use mechanical structures to extract seafloor surface nodules and convey them to a collection vehicle via a chain plate. Hydraulic schemes use water currents to alter the flow field near the bottom sediments. The nodules are collected by the impact force of the nozzle jets or the force generated by negative pressure. Hybrid collector schemes combine a hydraulic collection system and a mechanical conveyor system. Water jets are used in the mining process to remove the surface sediments of the seafloor, stripping and collecting the polymetallic nodules. These nodules are further transported using an inclined tooth chain mechanism.
Due to mining activities causing damage to microbial ecosystem services in nodule fields, the plumes generated will also have an impact on benthic organisms [6,13]. The international community has shown significant concern for the environmental impact of deep-sea mining [14,15]. The International Seabed Authority requires deep-sea mining operators to submit an environmental impact statement. Mining activities will only be permitted if they match the expected environmental standards. Hence, it is important to reduce environmental disturbances to guarantee the efficient operation of mining activities. From an environmental perspective, the hydraulic scheme is better than typical mechanical mining [16]. It offers robust continuous operational capacity, reduces disruption to the seafloor environment, and provides significant advantages in terms of efficiency, cost, reliability, and environmental impact. At present, the hydraulic ore collection methods mainly include the suction type, the double-row nozzle flushing mining type, and the attached wall jet type. The attached wall jet type utilizes the Coanda effect to raise nodules by generating a pressure difference between the collector and the seabed. This method can retrieve polymetallic nodules without directly flushing the underlying sediments. Due to it reducing substrate disruption and suspended particle production, resulting in minimal environmental disturbance. Therefore, it is considered to be the most advantageous choice for nodule mining [10].
Researchers have carried out many investigations on the attached wall jet hydraulic collection scheme. Zhao et al. [17] used the particle image velocimetry (PIV) technique to measure the flow field in two different ore collection schemes: suction and attached wall jet. They analyzed the similarities and differences between the two collection schemes by using the visual object tracking method to track the path of particles. Cho et al. [18] introduced a new constrained global optimization technique based on stochastic probability to study the collection efficiency of the Coanda effect collection device for the mining vehicle in both motion and stationary states. Kim et al. [12] developed a computational model to predict the Coanda effect collection device’s collection efficiency. Rodman et al. [19] investigated the influence of the curvature radius of the Coanda effect surface on the flow field. Trancossi et al. [20] established a mathematical model to study the Coanda effect, concentrating on the width of the jet exit, the curvature radius of the Coanda surface, and the exit velocity. Jia et al. [21] investigated how the ratio of the jet exit width to the curvature radius of the Coanda effect surface influences the internal flow field. Zhang et al. [22] investigated the optimization of geometrical parameters of a biconvex curved-wall attached wall jet collector. They discovered that two structural parameters, the thickness of the jet and the diameter of the simulated ore particles, significantly influenced the collection rate. Yang et al. [23] examined the internal flow pattern and movement of nodules in the collection device by varying the structural characteristics of the attached wall jet collection device. Most of these studies focused on the feasibility of the principle and only considered the process of collecting polymetallic nodules, ignoring the initial transport phase of the nodules transported to the collection vehicle.
Since deep-sea polymetallic nodules are mined from the ocean, which is far from land, ship transportation is necessary to provide the energy required for mining activities. The energy loss during the mining process will inevitably lead to a rise in the human and material resources needed for supply, which is highly detrimental to the continual development of mining activities. In addition, the economic benefit of deep-sea mining is critical for attracting investors, which in turn places demands on the collection rate of the collector. Therefore, the main targets of research into polymetallic nodule collection technology are to reduce environmental impact, increase collection rate, and reduce energy loss.
This study improves the structure of the single-row nozzle by comparing and analyzing the flow field in the existing attached wall jet collector. Considering the transport stage after particle start-up, a full hydraulic ore collector scheme based on the Coanda effect is proposed. Firstly, a comprehensive analysis is conducted on the structural composition and working principle of the attached wall jet collector. Subsequently, a numerical model of the attached wall jet collector is developed and verified by experiments. Based on the CFD-DEM coupling method, the influence of different structural and working parameters on the ore collecting characteristics of the collector is studied. This work aims to provide a theoretical basis and design reference for the development of high-collection-rate and low-disturbance polymetallic nodule ore collection devices.

2. Attached Wall Jet Collector

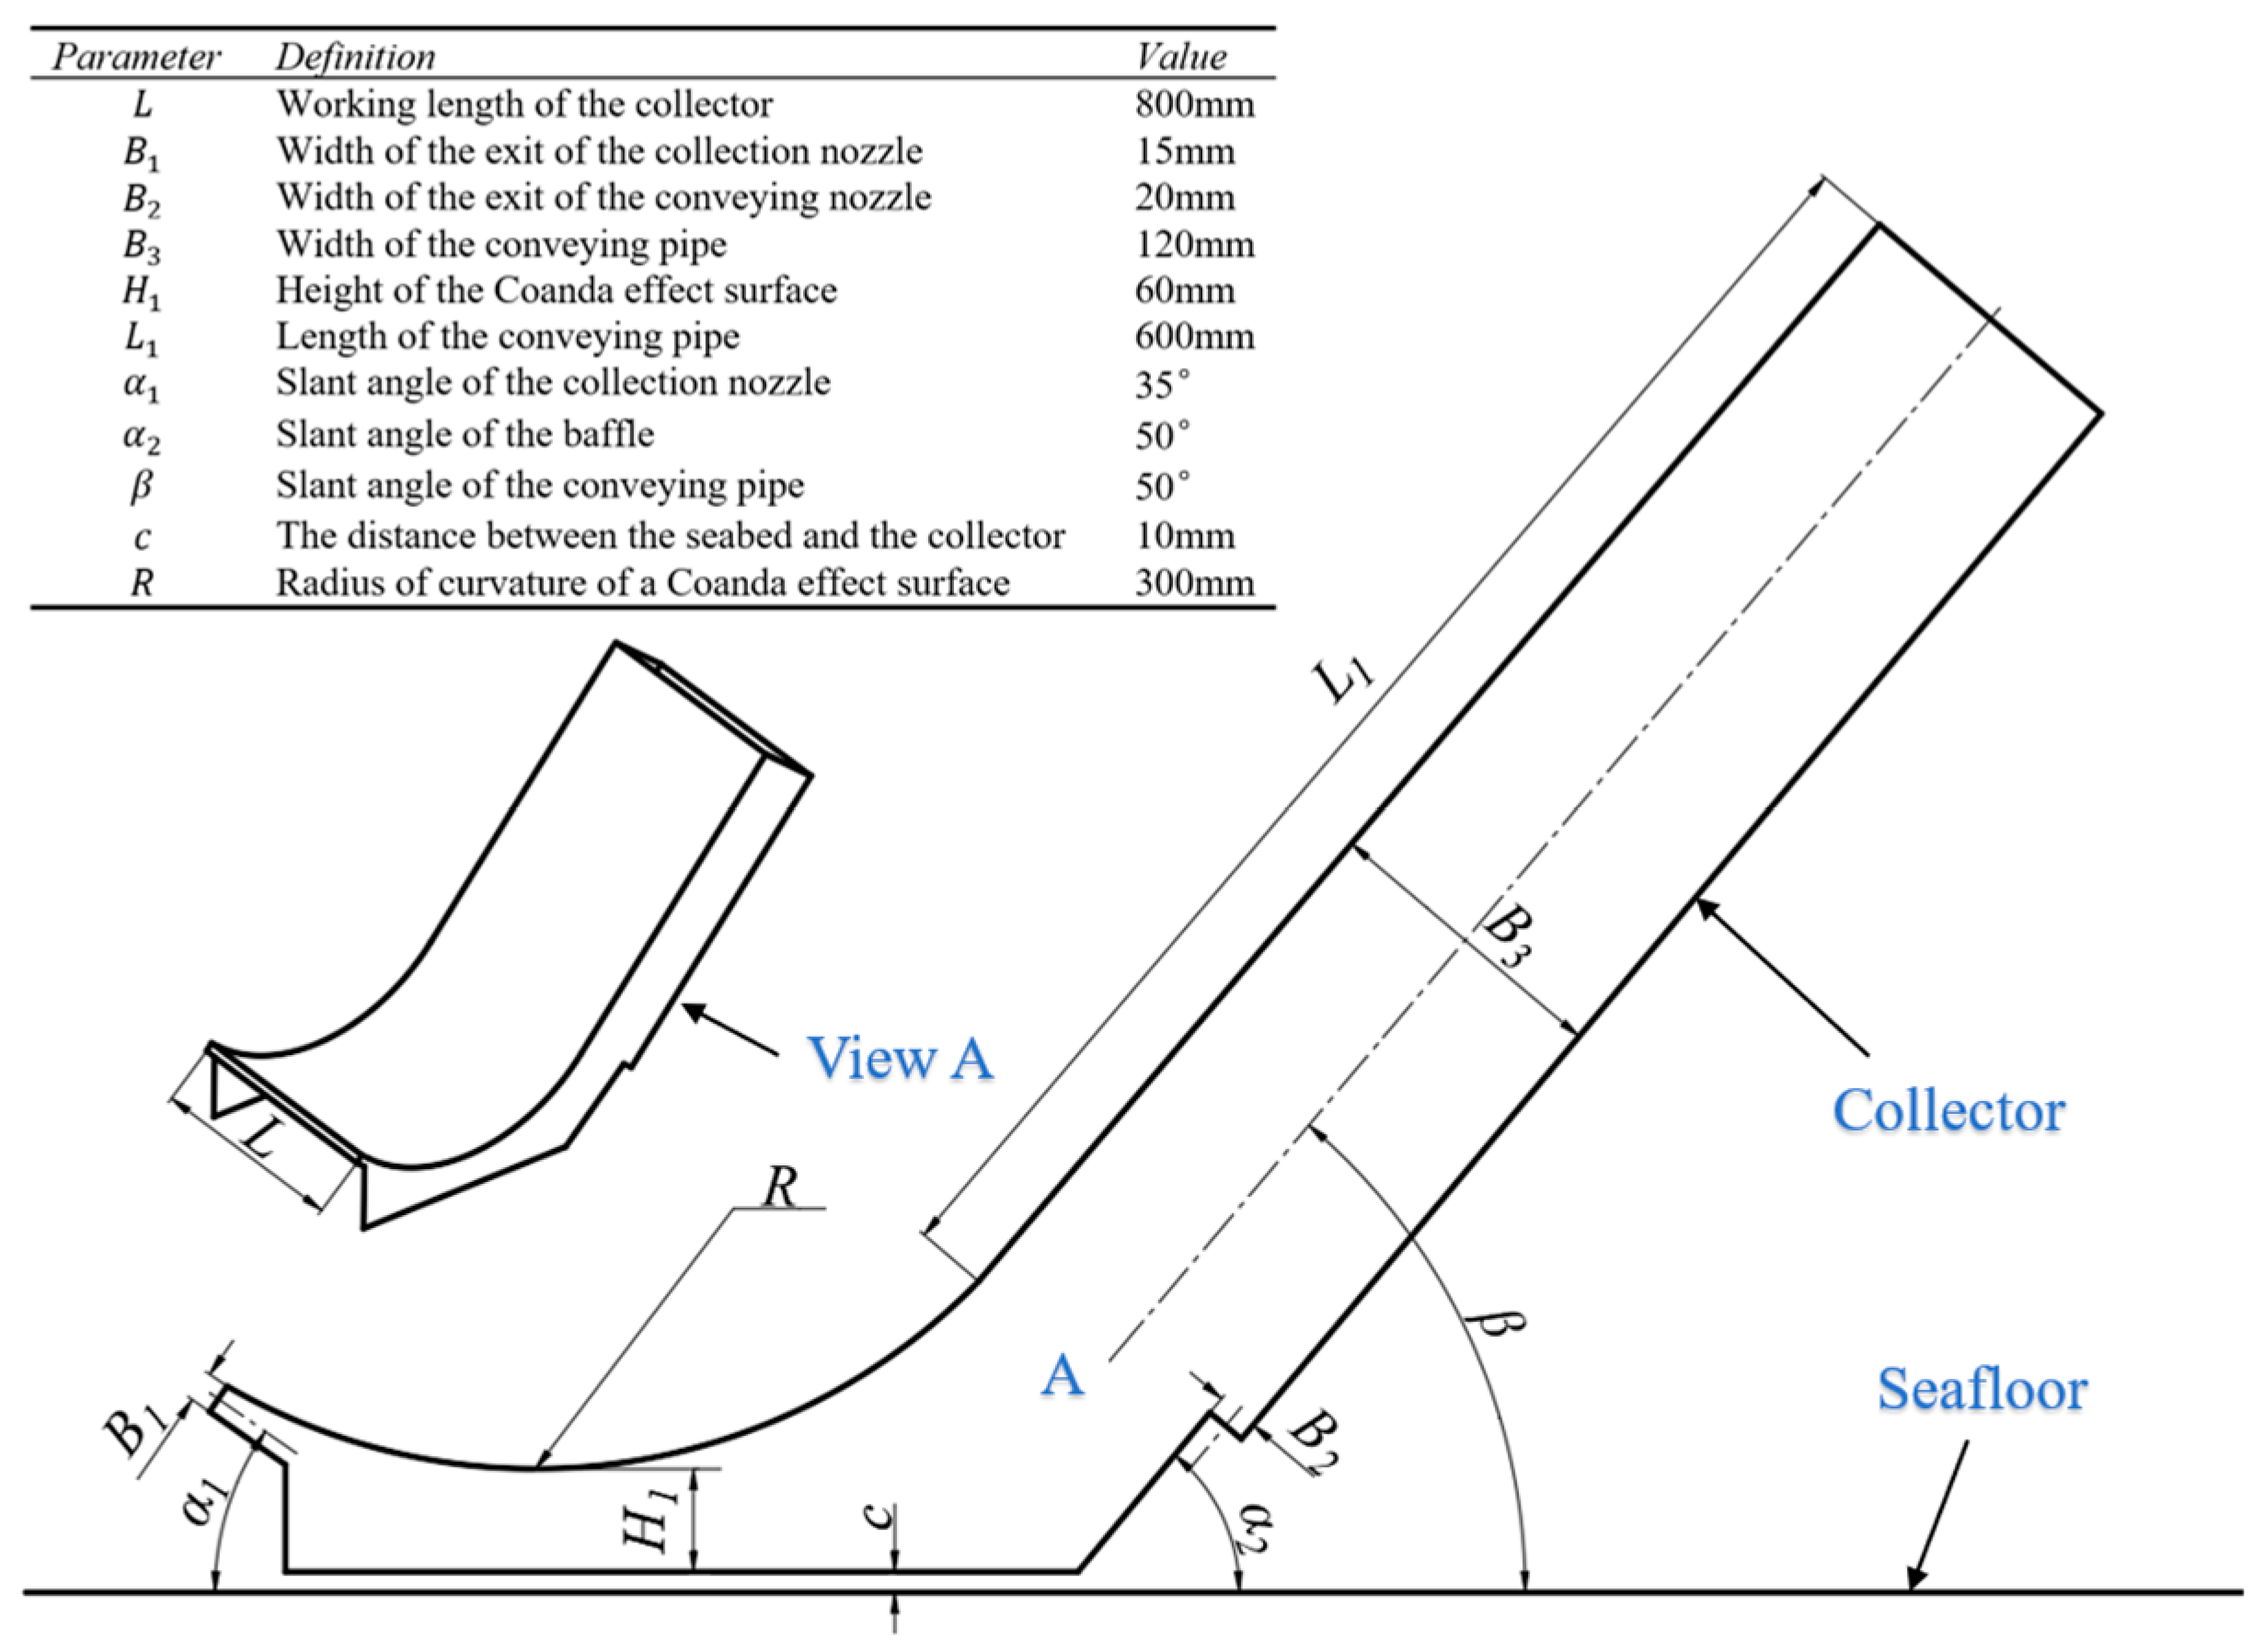
2.1. Structural Composition

This paper proposes an all-hydrodynamic collector scheme with the aim of achieving a high collection rate, minimal disturbance, and low energy loss during collection. This plan considers the conveying stage of the collector and determines the optimal structure and working parameters by studying the collection rate and nodule motion state. The attached wall jet collector consists of two primary components: collection and transportation. Figure 2 illustrates the basic structure of the collector. The collection process primarily uses a collection nozzle and a downward curved surface to create a Coanda effect that strips the nodules from the substrate. The collection device has a slanted baffle behind it, and vertical baffles on both sides. This design limits the initial movement range of nodules, leading to an increase in collection rate. The rectangular-shaped collection and conveying nozzles are connected to the confluence tube at the front and rear sides, respectively. Flanges are used to connect the pump to the confluence tube.

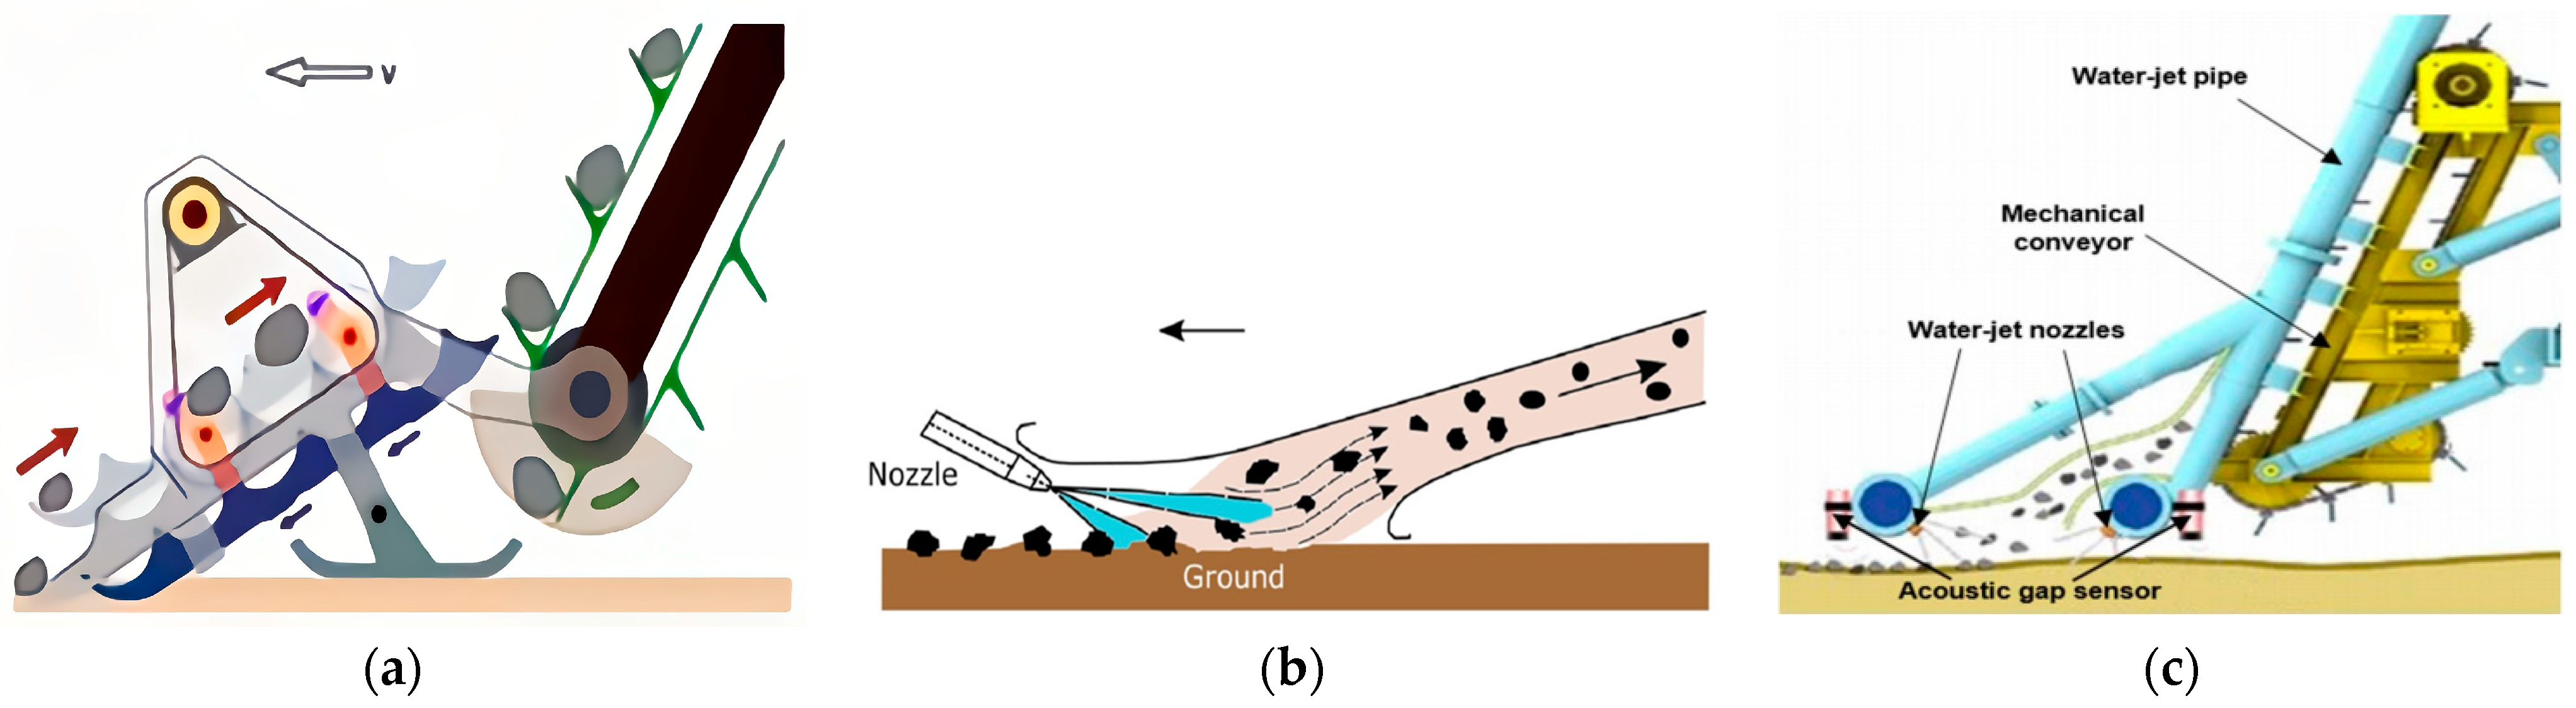
2.2. Working Principle

The Coanda effect is a common phenomenon in fluid dynamics, first discovered and suggested by Romanian scientist Henri Coandă in the early 1900s. During flow, the fluid will show a tendency to flow along the nearby surface. This research examines the working principle of the attached wall jet collector, as illustrated in Figure 3. In this figure, blue arrows are used to represent the flow of water jets. The confluence tube gathers seawater and expels it as a rectangular jet through the collection nozzle, which is located in front of the Coanda effect surface. The Coanda effect causes the water jet to flow at a specific angle towards the Coanda effect surface. As a result, the fluid velocity near the Coanda effect surface is higher than that on the seafloor surface. According to Bernoulli’s principle, this creates a region of negative pressure below the Coanda effect surface. The polymetallic nodules are lifted by the pressure gradient force and subsequently transported to the conveying pipeline by the deflected collection water jet. Ultimately, the conveying water flow moves the nodules to the mining vehicle, concluding the first stage of the conveying process.

3. Numerical Method and Verification

3.1. Theory of Forces on Nodules in a Flow Field

The fluid in the ore collection process is incompressible liquid seawater, which satisfies the basic continuity equation in hydrodynamic calculations for a continuous fluid medium [24]:
ρ t + u ( ρ u ) x + v ( ρ v ) y + w ( ρ w ) z = 0
The Navier–Stokes (N-S) equation is as follows:
ρ d u d t = ρ F b x + p x x x + p y x y + p z x z ρ d v d t = ρ F b y + p x y x + p y y y + p z y z ρ d v d t = ρ F b z + p x z x + p y z y + p z z z
The control equation for the motion of a single solid nodule is
m i d v i d t = F i f p + j = 0 k F i j t p + F i j n p + F i g
where mi and vi denote the mass and velocity of the nodule i, F i j t p and F i j n p denote the tangential and normal contact forces when the nodule i is in contact with the nodule j, and k denotes the total number of nodules interacting with the nodule during the calculation time.
The force of the nodules on the fluid is expressed as follows:
F i f p = F i D r a g + F i t + F i v m + F i S a f f + F i M a g n
The trailing force of fluid acting on solid-phase nodules at relatively small nodule volume concentrations is usually calculated using a free-flow trailing force model with the following formula:
F i D r a g = 1 8 π C D r a g ρ f d p 2 v f v p v f v p
where vf and vp are the fluid and nodule velocities, and CDrag is the coefficient of drag, which is calculated by the following formula:
C D r a g = 24 R e p 1 1 + 0 . 15 R e p 0 . 687 , R e p 1000 0 . 44     , R e p > 1000
Rep is the nodule Reynolds number The force on the nodules in the flow field due to the pressure gradient is calculated as follows:
F = V p d p d y
When the fluid is driven to accelerate along with the nodules due to the accelerated motion of the nodules, the virtual mass force that pushes the fluid to accelerate is expressed as force, and the formula is as follows:
F i v m = C v m ρ f ρ p v p v f v p d v p d t
Cvm is the virtual mass coefficient, which usually adopts the default value of 0.5. When the ratio of the fluid density to the nodule density is far less than 1, the virtual mass force and pressure gradient force can be ignored; however, when the density ratio is greater than 0.1, the virtual mass force and pressure gradient force cannot be ignored. In this paper, the fluid is seawater and the density ratio is greater than 0.1, so the virtual mass force and pressure gradient force must be considered.
The Saffman lift force is the force acting on the nodules due to the inconsistency of the fluid velocity on the two sides opposite the nodule surface as the fluid flows over the nodule surface, calculated as follows:
F i S a f f = 1.615 d p 2 μ f ρ f 1 / 2 C S a f f w f 1 / 2 v f v p w f
where wf is the vorticity of the fluid; CSaff is the slip-shear lift coefficient proposed by Mei et al. [25]. The Magnus force is the rotational lift force due to the pressure difference around the nodules as they rotate in the flow field, expressed as follows:
F i M a g n = 1 2 A p C M a g n ρ f | V | | Ω | ( V × Ω )
where Ap is the projected area of the nodule; V is the fluid-nodule relative velocity; Ω is the fluid-nodule relative angular velocity; and CMagn is the rotational lift coefficient [26].

3.2. Numerical Modeling

3.2.1. Model Simplification

This study focuses on the effect of flow field changes on nodule collection in an attached wall jet collector. Because the structure of the original attached wall jet collector is relatively complex, it is simplified in order to ensure the convergence of the model and shorten the simulation calculation time. The two jet nozzles are simplified to the incident plane of the fluid, and the effects of external structures such as pumps and confluence tubes on the flow field are ignored. Figure 4 illustrates the alterations to the model. Figure 5 displays the structural parameters of the attached wall jet collector.

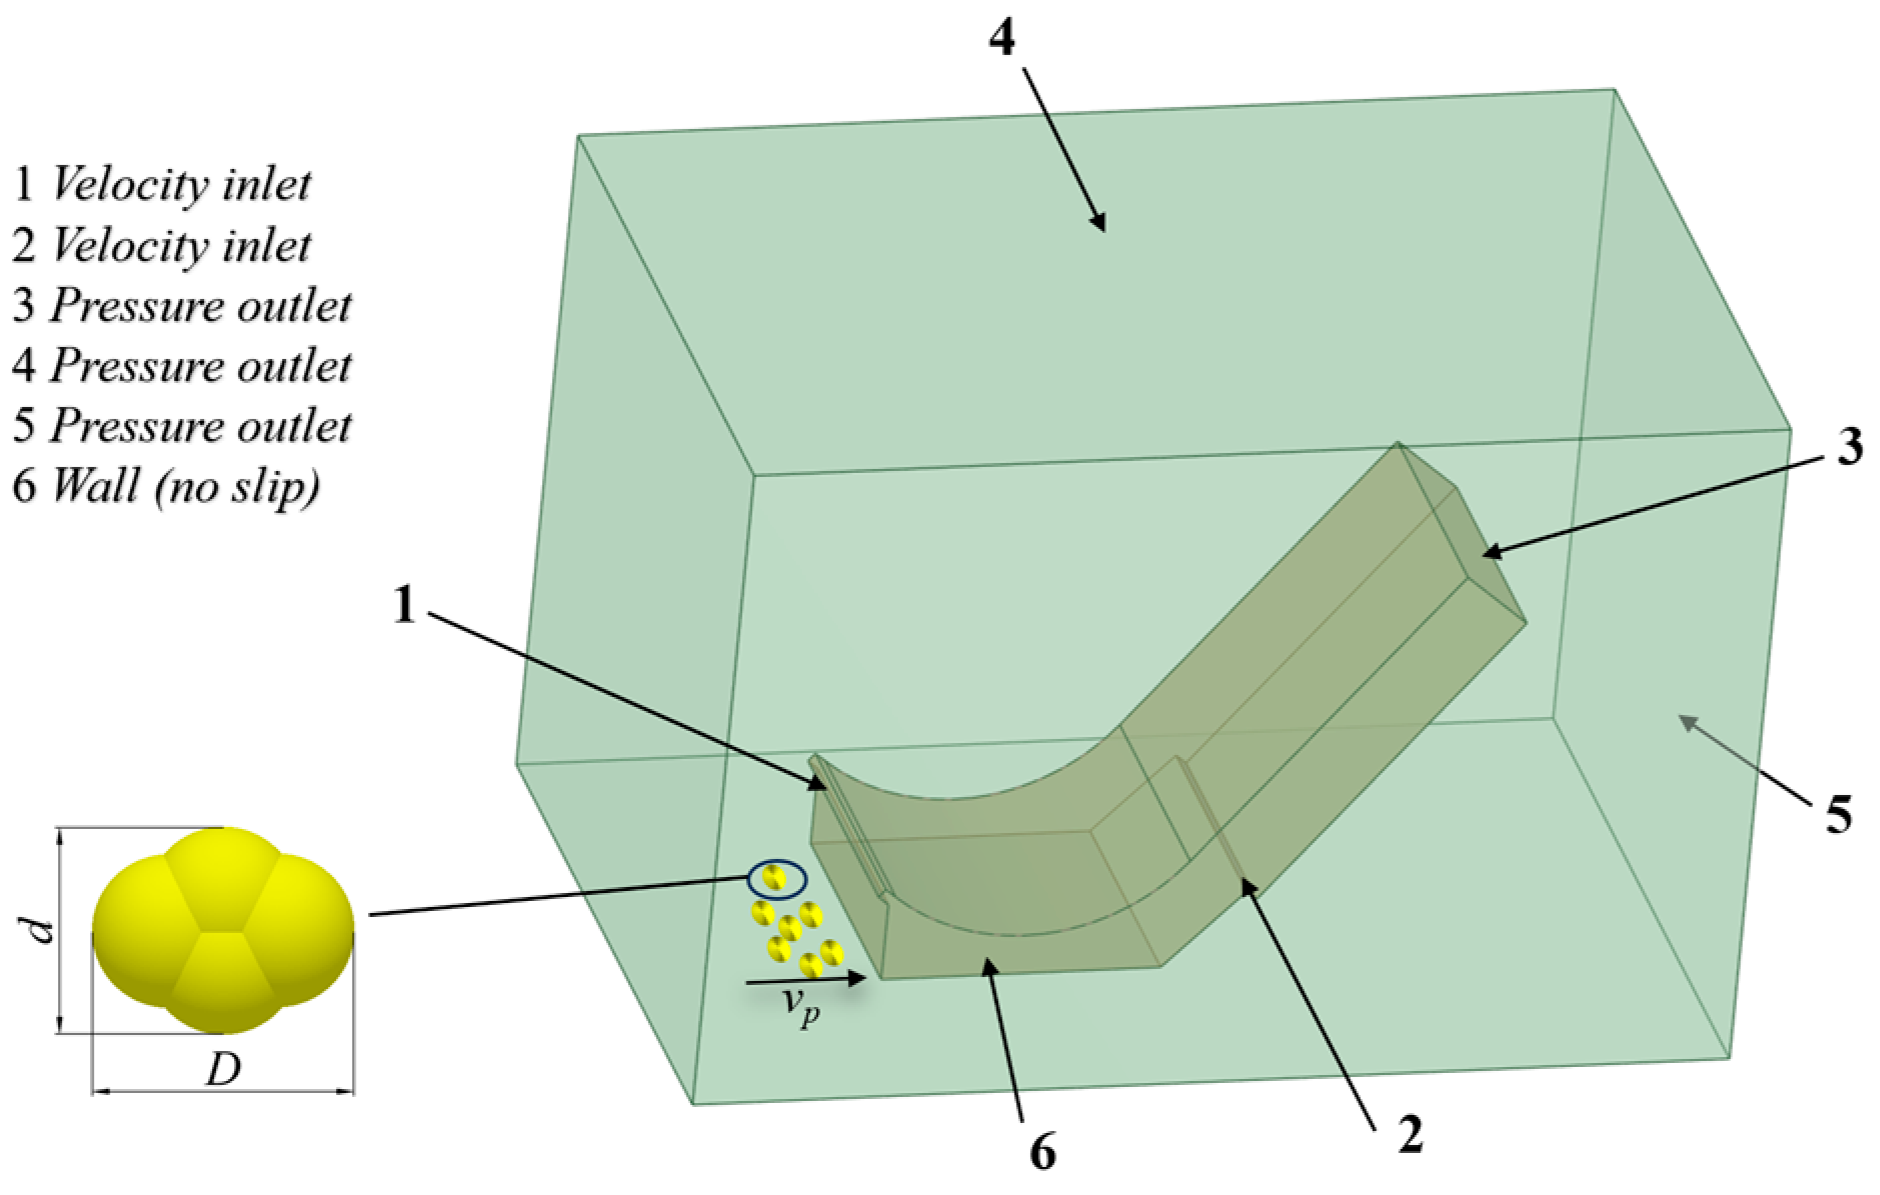
3.2.2. Model Settings

The internal area of the attached wall jet collector is determined as an inner flow field with velocity inlets and a pressure outlet. Furthermore, during the collection process, the exterior water flow will also influence the inner flow field of the collector. Therefore, the area near the collector is defined as an outside flow field. Due to limitations in computational resources, this study neglects the influence of water pressure and seafloor sediments. Figure 6 illustrates the boundary conditions for the simulation. The cross sections of the collection nozzle and conveying nozzle jet exit are defined as the velocity inlet. At the No. 1 inlet, the water jet velocity is 8 m/s, whereas at the No. 2 inlet, it is 3.5 m/s. The outlet end of the conveying pipe in the inner region of the collection device is designated as the No. 3 pressure outlet, while the upper end of the outside region and the right end are designated as pressure outlets No. 4 and No. 5, respectively. The simulation generated the nodules 0.2 m ahead of the collector. During the collection process, the nodules had a starting velocity of 0.5 m/s, which represented the forward movement of the collection device. The natures of the simulated nodules are set with reference to the physical and mechanical properties of natural polymetallic nodules on the seafloor [27,28]. This study uses tetrahedral particles as simulated nodules, and each individual sphere has a diameter of 12 mm. The simulated nodules have a long end length (D) of 20 mm and a short end length (d) of 16 mm, and a density of 2040 kg/m3.
Unstructured grids are used to divide the outside flow field, while structured grids are used to divide the inner flow field. At the grid interface, nodes are combined to guarantee precise data exchange between the inner and outside flow fields. The boundary layer mesh is used to discretize the collector wall in order to provide a precise simulation of the flow state. The number of boundary layers is set to 5, with a growth rate of 1.2. In this study, the RNG k-ε turbulence model is used to simulate turbulence, while the DPM model is used to simulate the behavior of the nodules. The CFD-DEM coupled computation method is used to calculate the interactions between the flow field and the nodules, as well as the interactions among the nodules themselves.

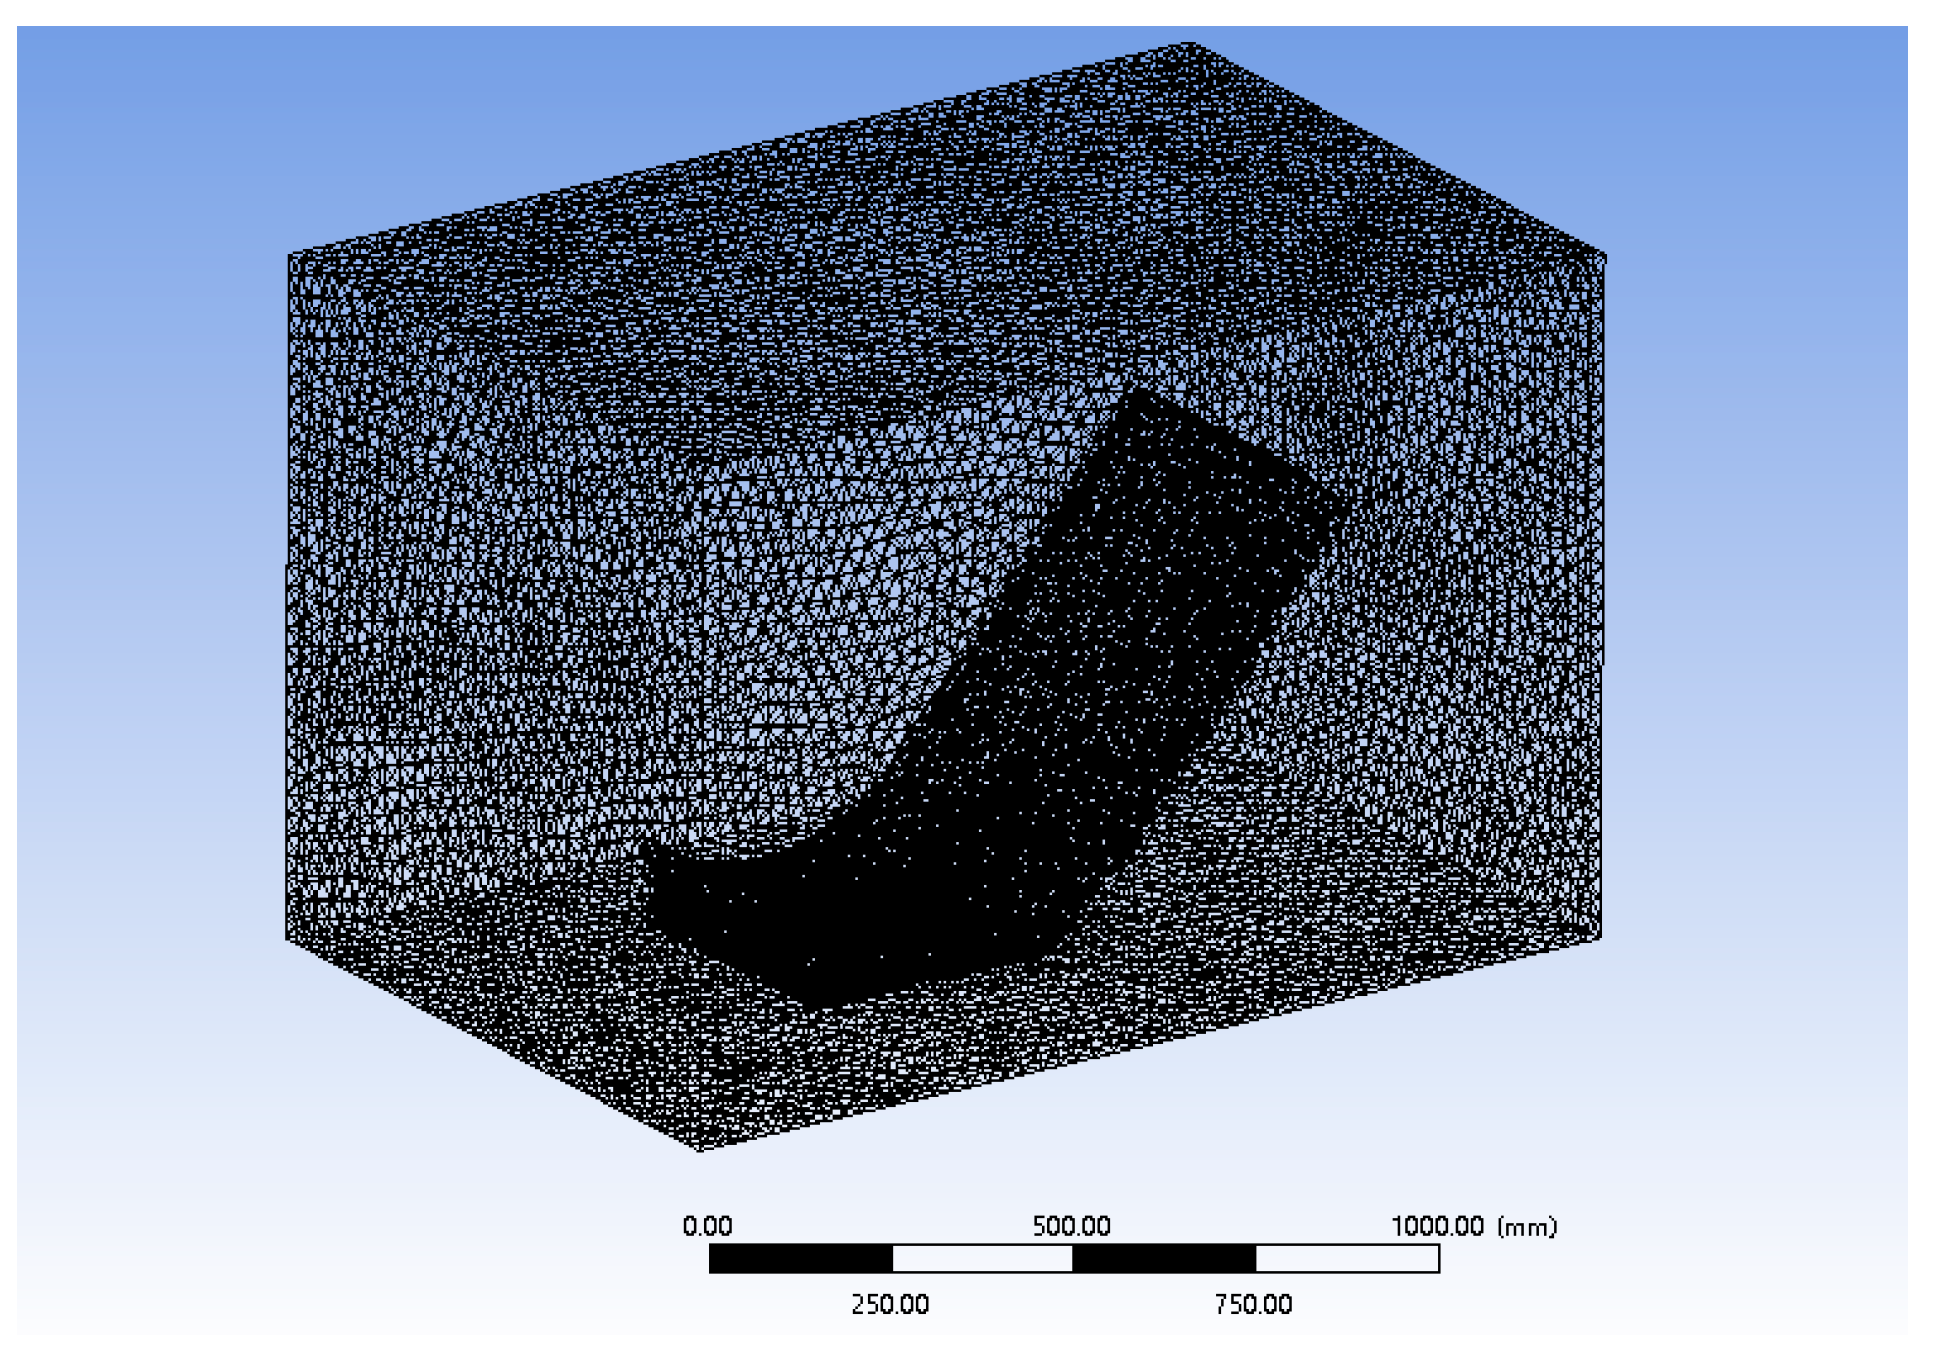
3.2.3. Mesh Independence Study

The flow field of the collector was numerically simulated using four grid configurations, each with a different number of grids. Given that the lifting of polymetallic nodules is mostly dependent on the influence of the pressure gradient forces, the minimum pressure value beneath the collector is regarded as a measure of the mesh independence. Table 1 presents the pressure monitoring data obtained using different numbers of grids.
By analyzing the minimum pressure data change below the collector in Table 1, it is evident that as the number of grids increases, the maximum negative pressure value in the flow field initially increases and then fluctuates within a specific range. When the total number of grids is approximately 1.23 million, the minimum pressure value below the collector is −7328 Pa, with a pressure change of less than 0.5%. Considering the accuracy of the simulation and the computational cost, the third set of grids is chosen for subsequent simulation calculations. Figure 7 displays the results of the grid division.

3.3. Verification

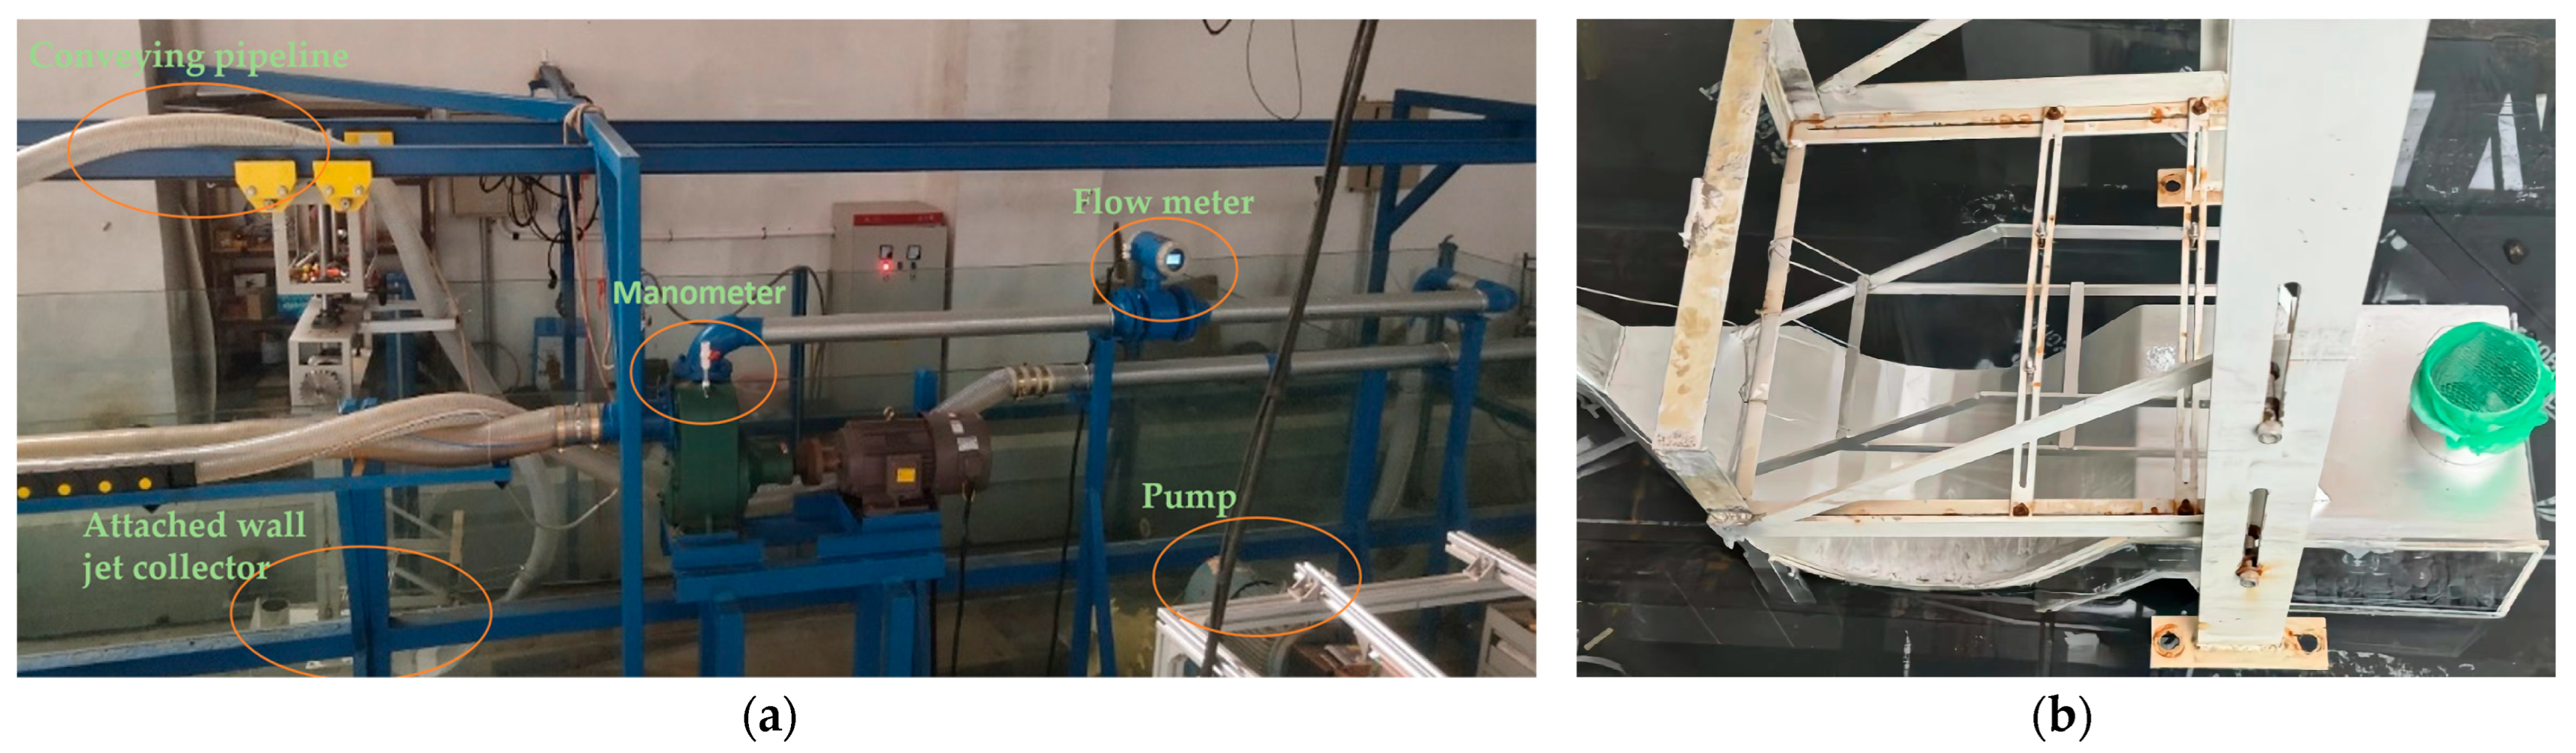
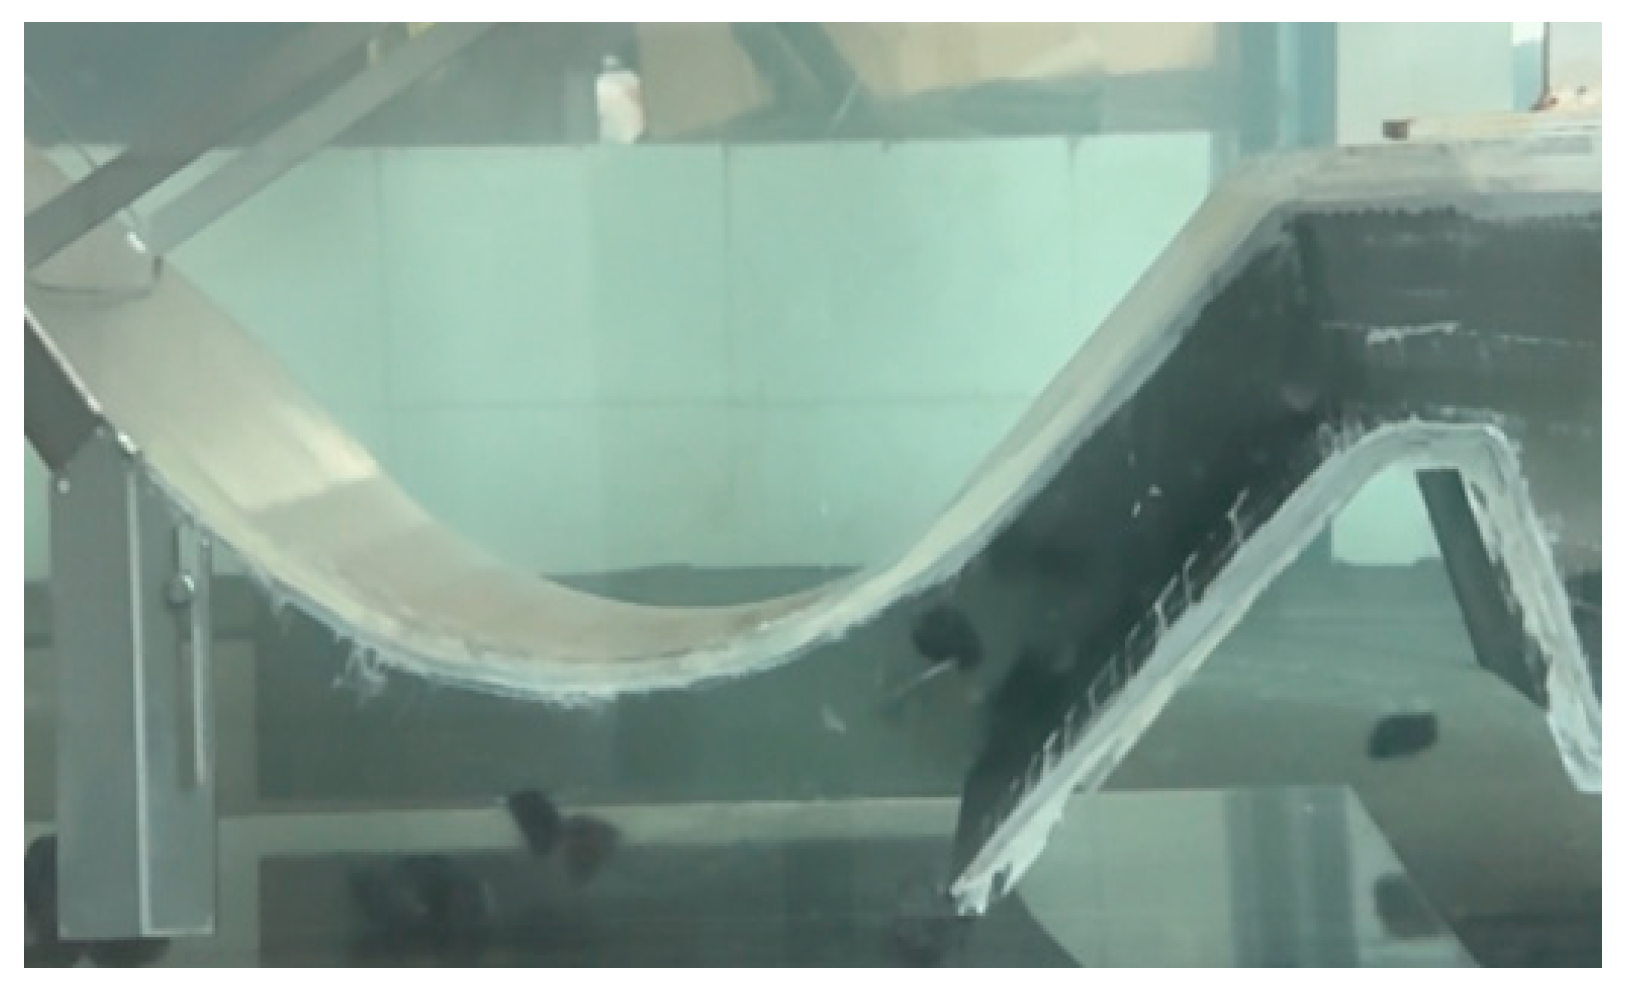
3.3.1. Experimental Settings

To verify the accuracy of the numerical simulation, an experimental system was established, using the newly designed attached walled jet collector to carry out hydraulic collection experiments. The experimental system consists of several key components, including an attached wall jet collector, a water pump, a flow meter, a manometer, and a conveying pipeline. Figure 8a illustrates these components; Figure 8b shows the structure of the attached wall jet collector. Because of the power constraints of the experimental platform, it is not achievable to satisfy both the collection nozzle and the conveying nozzle working at the same time. Therefore, the experiments will entail substituting the conveying pipe and conveying nozzle for the silo. Additionally, a numerical model will be established to compare with the experiment. The remaining parameters of the attached wall jet collector will be consistent with Section 3.2. Since the conveying nozzle only serves the purpose of conveying and does not significantly affect the collection rate, the numerical simulation can be verified through the experiment. Dead mountain stone, with a density of 2400 kg/m3, serves as the simulation material for the nodules. The density difference between the material and the natural nodules is small. The average size of the ore particles is 20 mm, as shown in Figure 9a, while Figure 9b illustrates the state of ore particle laying.

3.3.2. Experimental Verification

To simplify the explanation, we can determine the distance between the collector and the surface of the seafloor as the bottom clearance and use the univariate approach to study the collection rate under different collection jet flow rates and bottom clearances. The collection rate is determined by dividing the mass of particles that were collected by the total mass that was set up.
η = M 1 M 2
The results were compared to the simulation findings. Table 2 presents the comparison data. At different collection jet flow rates and bottom clearances, the error between the experimental and simulation results was consistently small. The maximum error was less than 10%, providing further evidence of the accuracy of the numerical model. Figure 10 shows the movement of the ore particles in the collector.

4. Results and Analysis

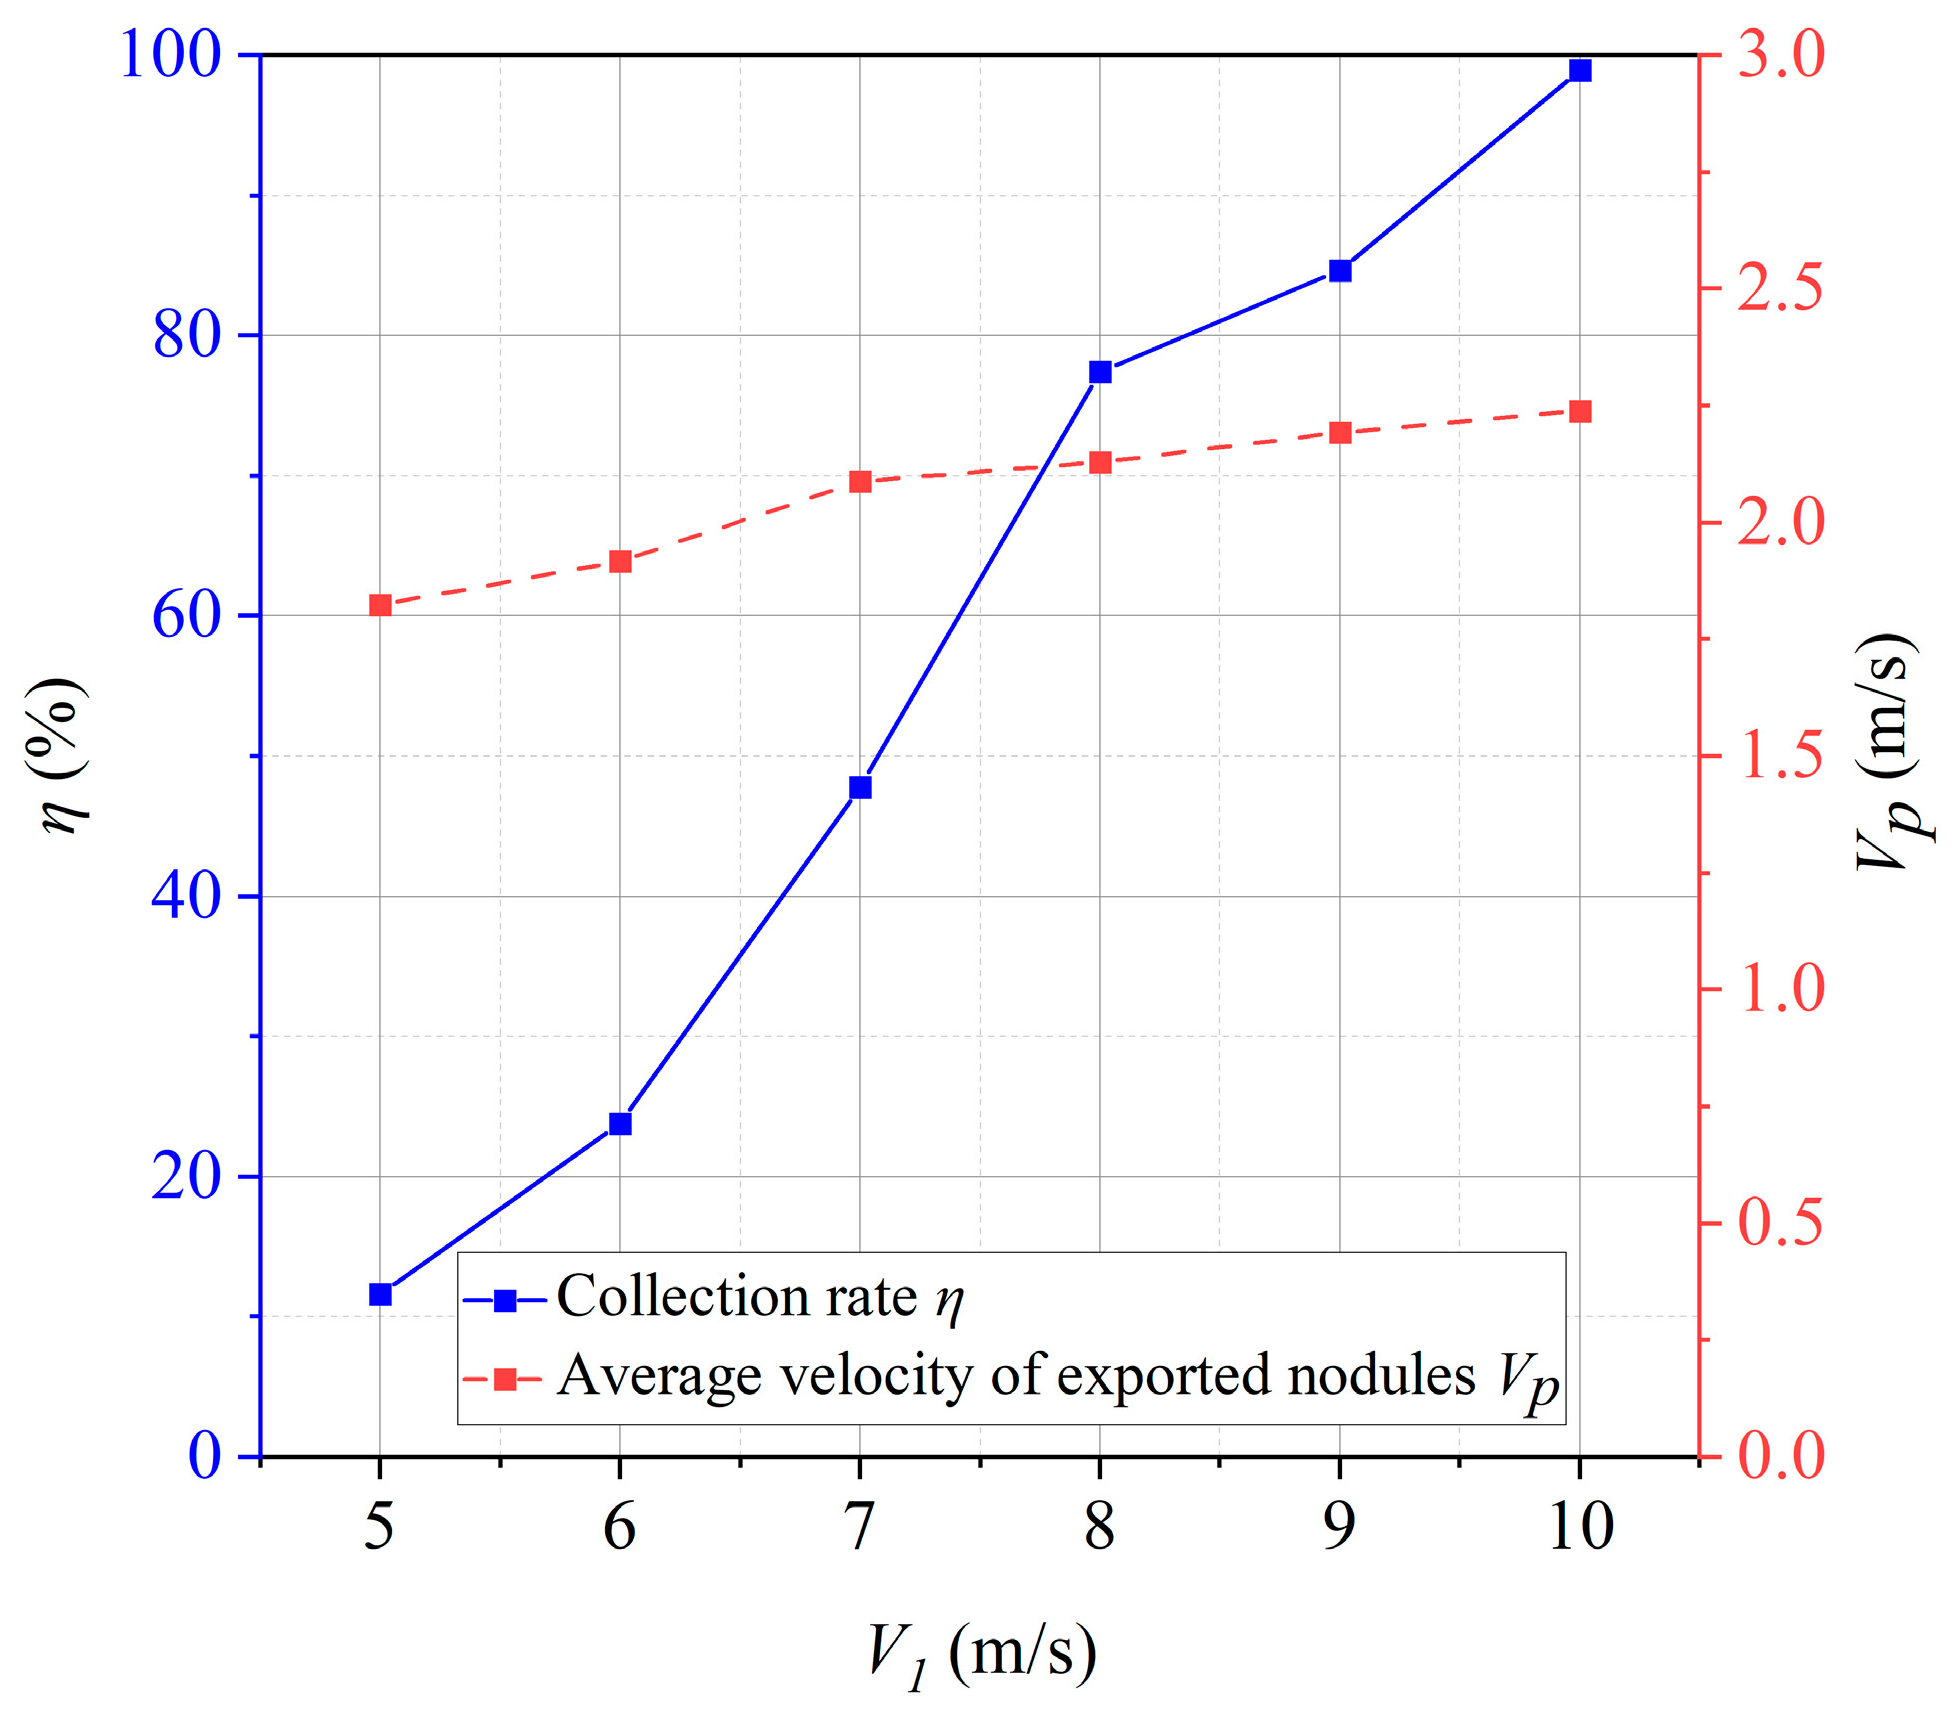
4.1. The Impact of Collection Jet Flow Rate on Collection Rate

The collection jet flow rate is a crucial element in determining the effectiveness of nodule collection. In order to comprehend the impact of collection jet flow rate on nodule collection, the bottom clearance was adjusted to 30 mm while keeping all other parameters consistent with Section 3.2. The collection jet flow rate varied between 5 and 10 m/s. Figure 11 displays the collection rate and the average velocity of exported nodules at different collection jet flow rates. It is evident that the collection rate rises substantially as the collection jet flow rate increases, ranging from a minimum of 11.61% to a maximum of 98.96%. Furthermore, the average velocity of the exported nodules also exhibits an upward trend.
Figure 12 displays the pressure distribution of the flow field at different collection jet flow rates. The negative pressure area is mainly located near the Coanda effect surface. As the flow velocity rises, the maximum negative pressure in the flow fluid increases significantly. A pressure-sensing location is placed beneath the lowest point of the Coanda effect surface in order to monitor the varying negative pressure at different heights. The results are depicted in Figure 13. With the increase in the collection jet flow rate, the negative pressure at the seafloor surface shows minimal variation, while the negative pressure at the Coanda effect surface shows a significant increase. Therefore, when the collection jet flow rate increases, the pressure gradient force on the nodules also increases. A greater pressure gradient force helps in the process of separating the nodules from the seabed, thereby leading to an increase in the collection rate.
Figure 14 shows the nodule velocity distribution under different collection flow rates at time t = 5 s. The results show that at a collection jet flow rate of 5 m/s, the velocity of nodules beneath the Coanda effect surface is low, resulting in a significant accumulation of nodules at the baffle plate. Meanwhile, there are only a few nodules present in the conveying pipe. However, at a collection jet flow rate of 10 m/s, the nodules below the Coanda effect surface maintain a higher velocity, and the majority of nodules enter the conveying pipe. These findings coincide with previous analyses of negative pressure.

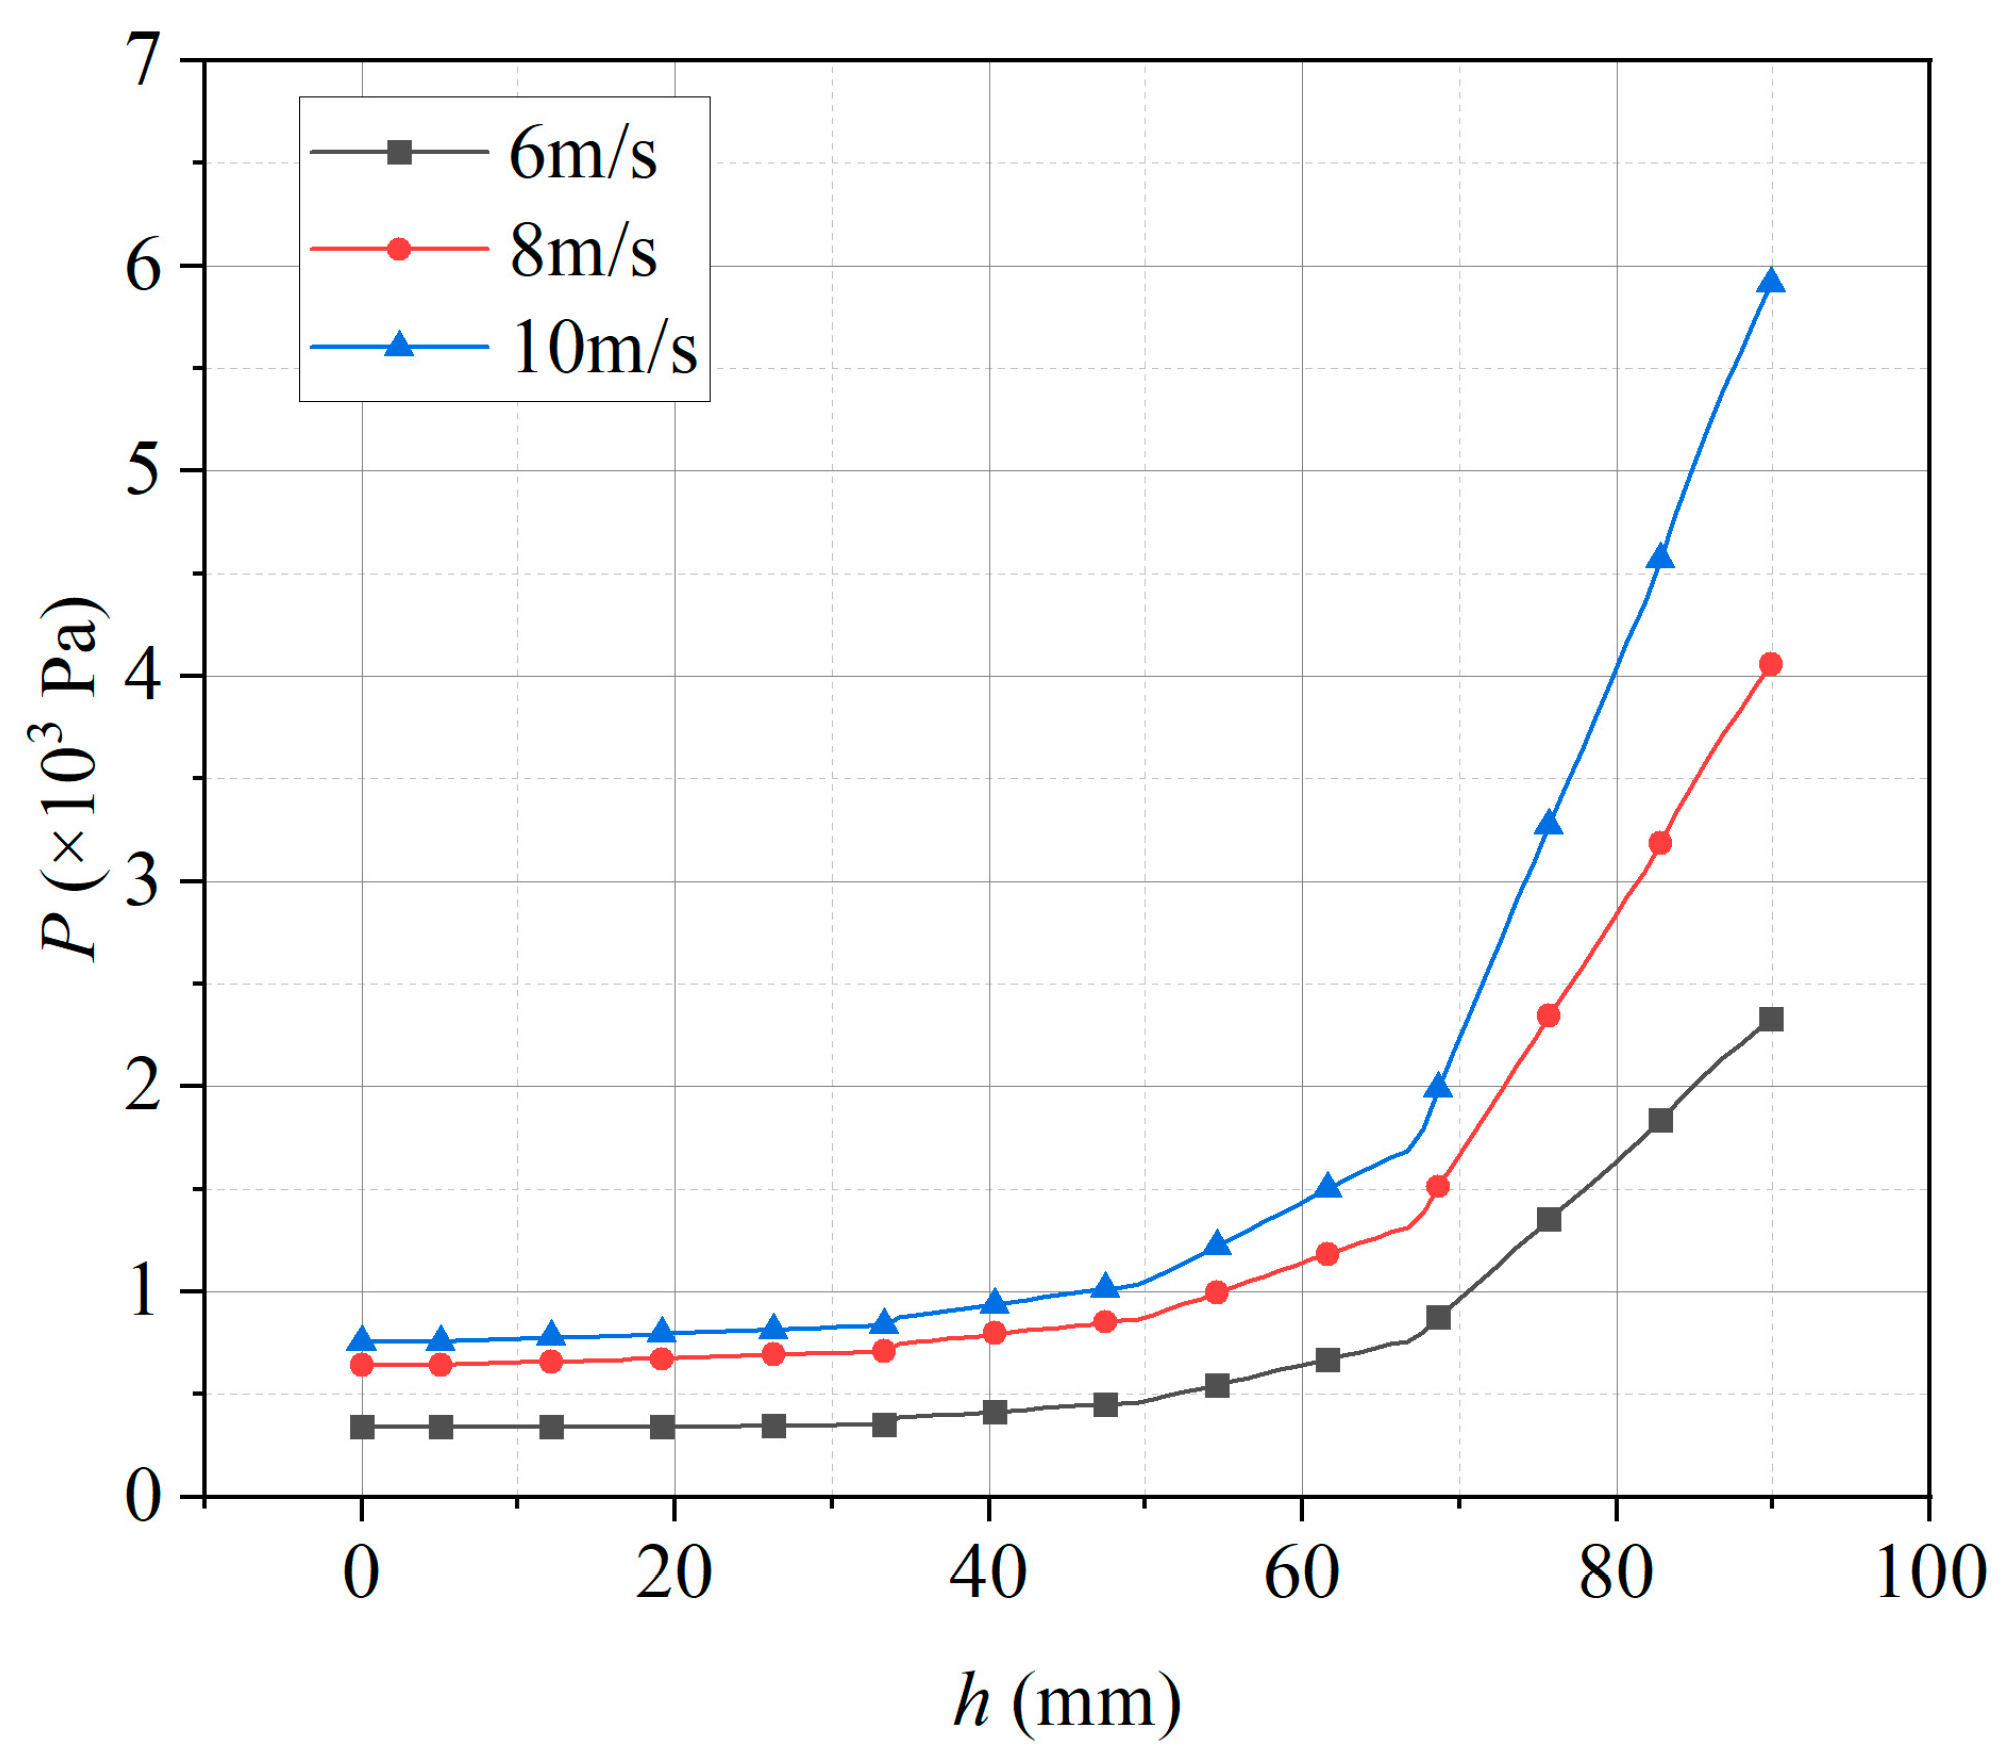
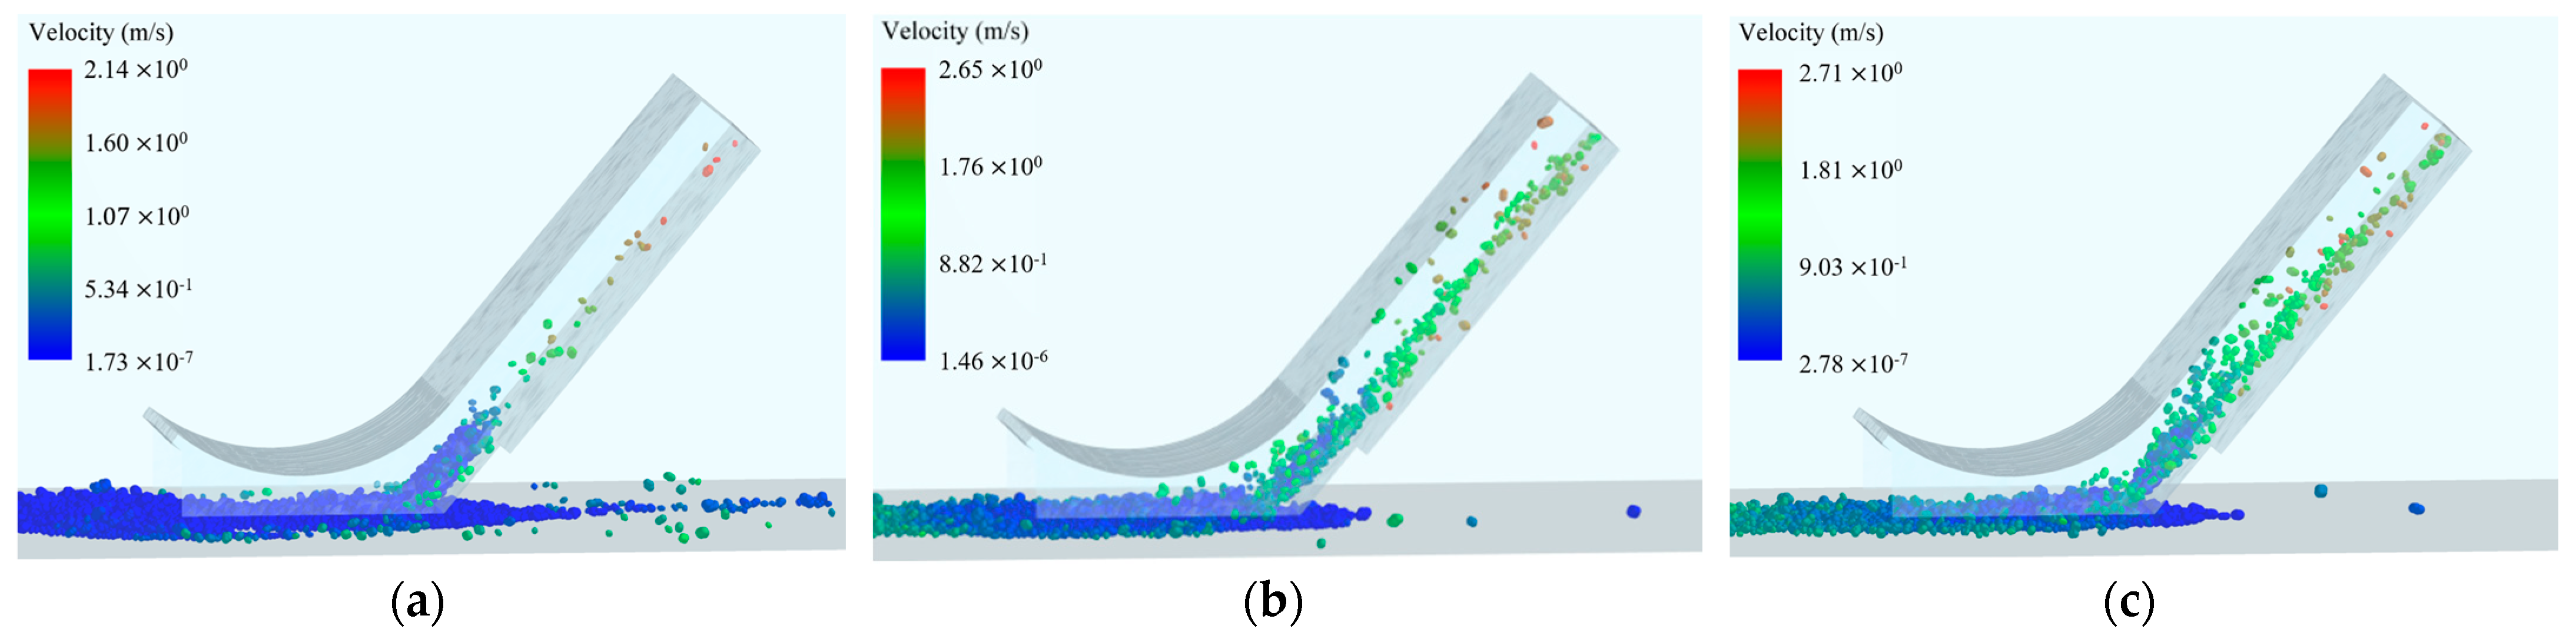
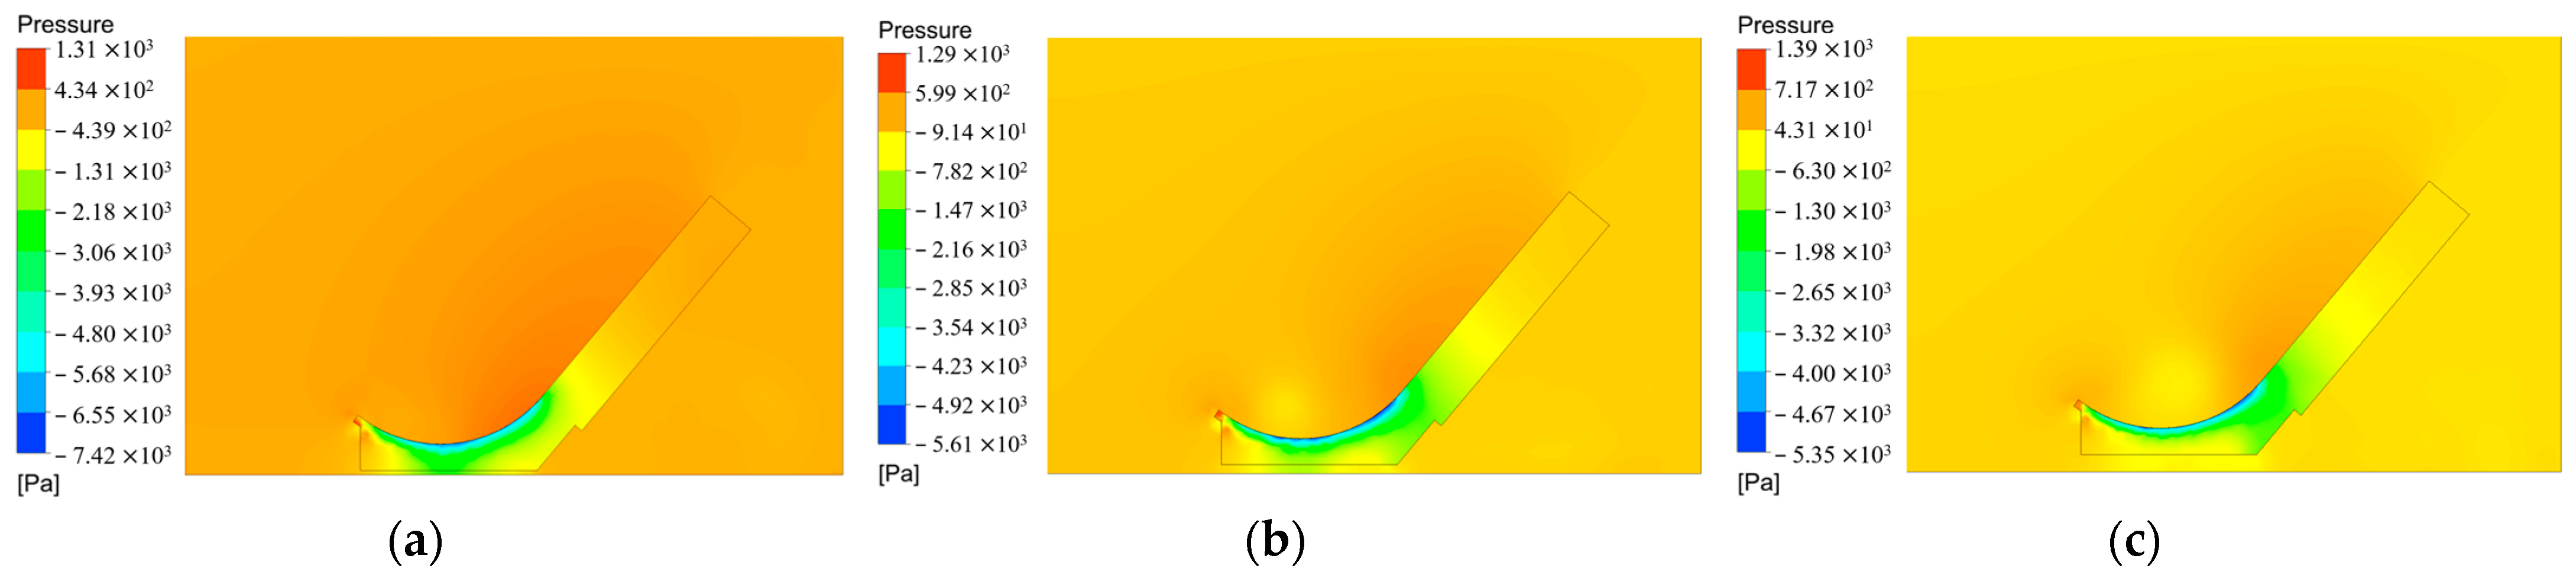
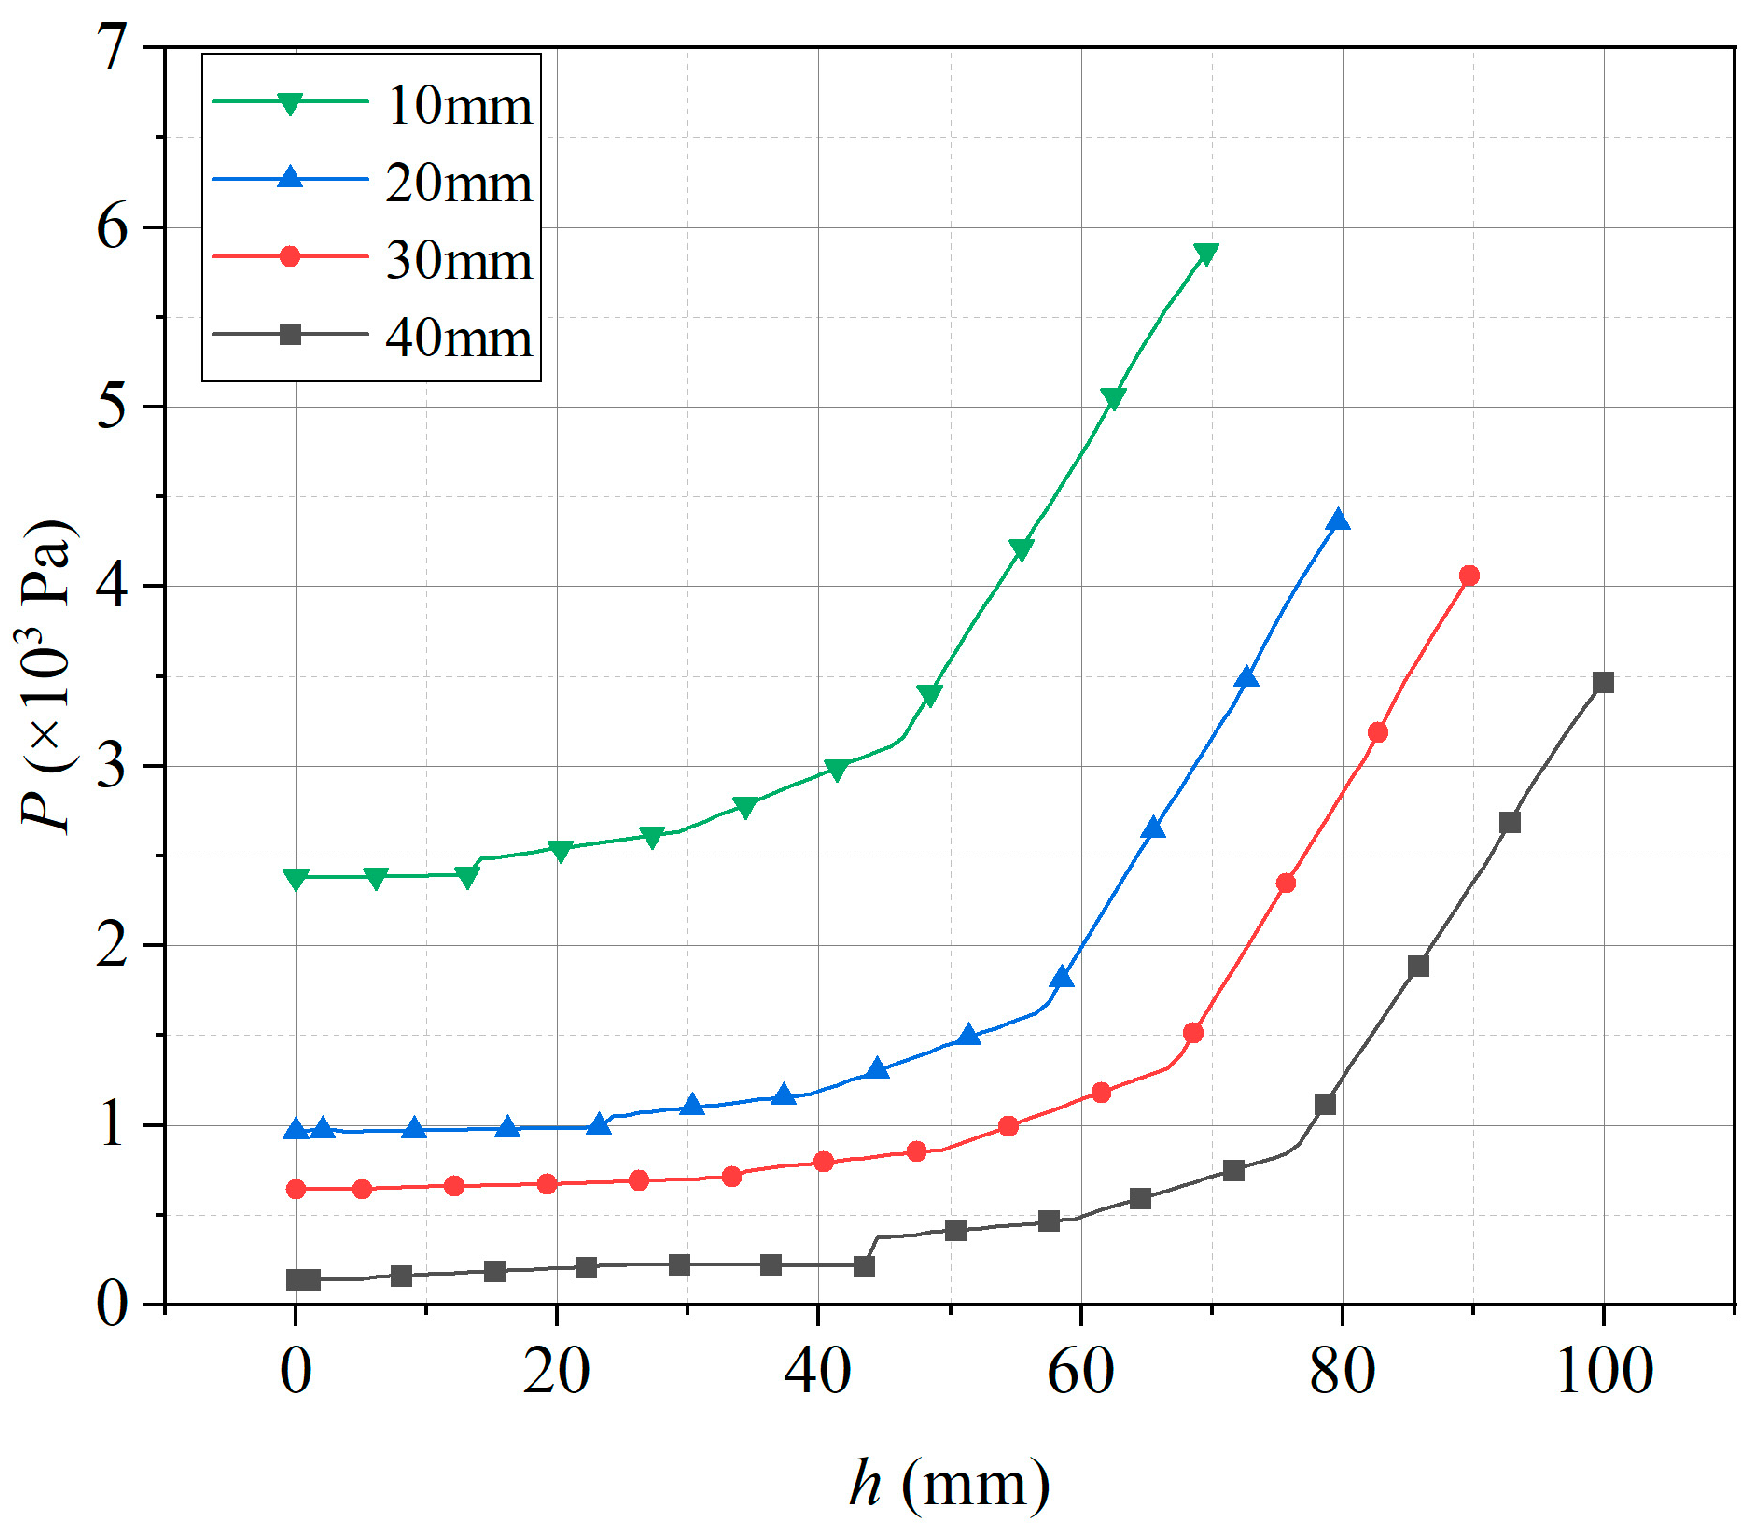
4.2. The Impact of Bottom Clearance on Collection Rate

Figure 15 displays the variation in the collection rate and the average velocity of the exported nodules at different bottom clearances. The other parameters correspond to the values provided in Section 3.2. When the bottom clearance is less than 10 mm, the collection rate reaches 99%, and the difference is not significant. When the bottom clearance reaches over 10 mm, the collection rate drops significantly with increasing bottom clearance. When the bottom clearance reaches 40 mm, the collection rate drops to only 49.52%. Meanwhile, as the bottom clearance increased, the exported nodules showed a decrease in average velocity. This can be explained as follows: the increase in the bottom clearance causes a decrease in the water flow into the conveying pipe, which in turn leads to a decrease in the fluid force on the nodules in the conveying pipe.
Figure 16 illustrates a cloud diagram of the pressure distribution in the flow field at different bottom clearances. It is evident that as the bottom clearance increases, the area of negative pressure impact within the collector shifts from below the Coanda effect surface to the rear side baffle. The initial startup position of the nodules moves backwards, and the startup time is shortened, resulting in the nodules being difficult to lift. Figure 17 shows the negative pressure values of different heights at different bottom clearances below the Coanda effect surface. It shows that the pressure difference between the Coanda effect surface and the bottom surface remain relatively constant at different bottom clearances. However, the distance between these two surfaces increases, which leads to a reduction in the pressure gradient force. This results in a notable drop in the collection rate.
Figure 18 displays a cloud diagram illustrating the distribution of nodule velocity under different bottom clearances at time t = 5 s. When the bottom clearance is 10 mm, the velocity of nodules below the surface of the Coanda effect is high, showing a tendency for upward movement. Furthermore, there is no significant nodule accumulation at the baffle, allowing nodules to enter the conveying pipe smoothly. As the bottom gap increases, it becomes more difficult for the pressure gradient force to satisfy the needs of nodules in collection. Therefore, the velocity of nodules below the Coanda effect surface decreases significantly, resulting in a significant accumulation of nodules at the baffle. In addition, the number of nodules in the conveying channel also decreases. Once the bottom clearance exceeds the nodule size, a number of nodules escape from the back of the baffle, resulting in a decrease in collection rate.

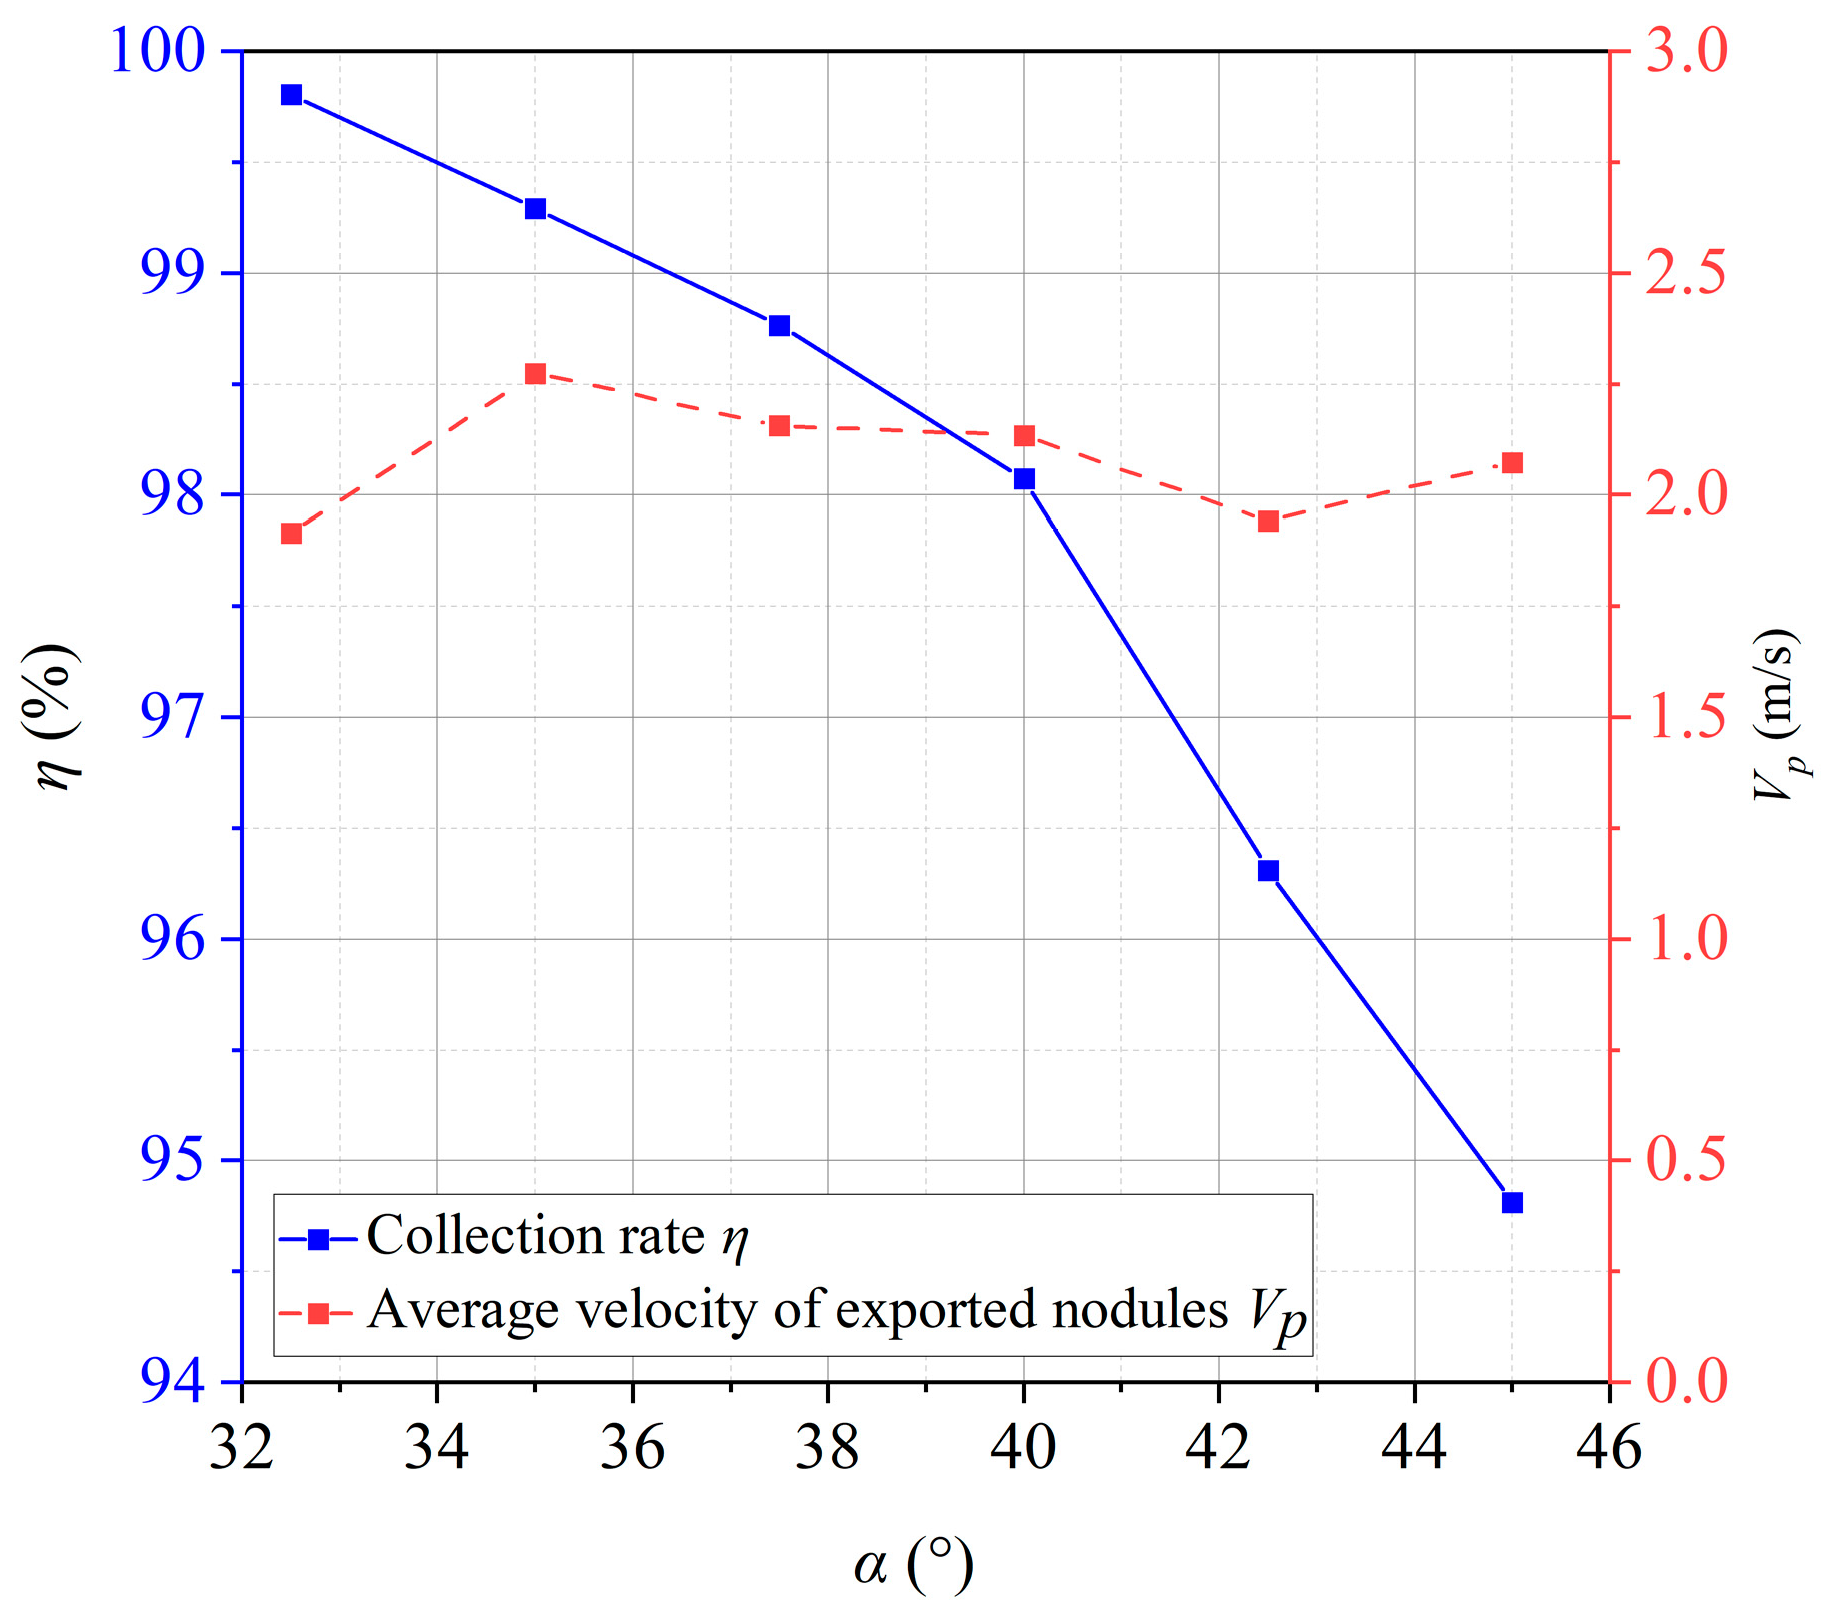
4.3. The Impact of the Collection Nozzle Slant Angle on Collection Rate

Figure 19 displays the changes in the collection rate and average velocity of the exported nodules at different collection slant angles. The remaining parameters remain constant, as mentioned in Section 3.2. The slant angle of the collection nozzle ranges from 32.5° to 45°. As the slant angle of the collection nozzle increases, the collection rate of the collector falls progressively. However, the overall change is minimal. Even when the inclination angle approaches 45°, the collection rate still remains at 94.81%, which satisfies the mining objective. The average velocity of the exported nodules fluctuated around 2 m/s. The highest value of the average velocity of exported nodules is 2.27 m/s when the collecting nozzle inclination angle is 35°.
Figure 20 displays the pressure distribution of the flow field at different collection nozzle slant angles. The negative pressure impact area of the flow field is near the Coanda effect surface at all the different collecting nozzle slant angles. Figure 21 shows the negative pressure change curve of different heights at different collection nozzle slant angles below the Coanda effect surface. The pressure difference between the three situations is negligible, indicating that the pressure gradient force on the nodules remains nearly constant, resulting in minimal variation in the final collection rate.
Figure 22 illustrates the nodule velocity distribution under different collection nozzle slant angles at time t = 5 s. It is evident that the nodules exhibit high starting velocities beneath the Coanda effect surface, which enables the start of nodules and allows their further transportation. Therefore, the collection rate of nodules is consistently maintained at a high level.

5. Conclusions

  • This study investigates the attached wall jet hydraulic ore-collecting device. A baffle is incorporated into the fundamental structural design of a single nozzle and a single surface to enhance the collection rate. By conducting a comparison between the numerical simulation and the experiment, it was determined that the maximum error of the collection rate was below 10%.
  • The collection of nodules has two phases: extraction and transportation. The flow rate of the collection jet and the bottom clearance have a substantial impact on the collection of nodules. Furthermore, there exists a strong association between these two factors. The collection jet flow rate required increases proportionally with the bottom clearance, based on satisfying the 90% collection rate index. At a bottom clearance of 10 mm, the collection jet flow rate needs to be 8 m/s. However, when the bottom clearance grows to 30 mm, the required collection jet flow rate increases to 10 m/s.
  • The slant angle of the collection nozzle does not have a substantial impact on the rate of collection. It is recommended to set the collection nozzle slant angle at 35° to reduce energy loss.

Author Contributions

This paper emerged from the long-term collaboration of the authors. Conceptualization, Y.L. and Z.L.; methodology, Y.L. and Z.L.; software, Y.L. and Z.H.; validation, Y.L. and Z.H.; formal analysis, Y.L.; investigation, Z.L.; resources, Z.L.; data curation, Y.L.; writing—original draft preparation, Y.L.; writing—review and editing, Z.L. and Z.H.; visualization, Z.L. and Z.H.; supervision, Y.L.; project administration, Y.L.; funding acquisition, Y.L. All authors have read and agreed to the published version of the manuscript.

Funding

This research was supported by the Hunan Provincial Natural Science Foundation of China, grant number 2021JC0014.

Data Availability Statement

Data are contained within the article.

Acknowledgments

The authors would like to thank the editors and anonymous reviewers for their careful work and thoughtful suggestions that have helped improve this paper substantially.

Conflicts of Interest

The authors declare no conflicts of interest.

References

  1. Cao, L.; Yang, Z.; Liao, S.; Xu, Q. Analysis on Ore-controlling Factors of Submarine Hydrothermal Polymetallic Sulphide Deposits. Mod. Min. 2019, 35, 6–11+42. [Google Scholar]
  2. Wang, F.; He, G.; Yao, H.; Deng, X. The progress in the study of REE-Rich deep-sea sediments. Geol. China 2017, 44, 449–459. [Google Scholar]
  3. Liu, S.; Liu, C.; Dai, Y. Status and Progress on Researches and Developments of Deep Ocean Mining Equipments. J. Mech. Eng. 2014, 50, 8–18. [Google Scholar] [CrossRef]
  4. Li, X. Preliminary Discussion on Chinese Deep-sea Polymetalllic Nodules Pilot Mining Test. Ocean Dev. Manag. 2017, 34, 63–66. [Google Scholar]
  5. Wu, C.; Liu, S.; Dai, Y. Exploitation Situation and Prospect Analysis of Seafloor Polymetallic Sulfides. Mar. Sci. Bull. 2008, 27, 101–109. [Google Scholar]
  6. Weaver, P.P.; Billett, D. Environmental impacts of nodule, crust and sulphide mining: An overview. In Environmental Issues of Deep-Sea Mining: Impacts, Consequences and Policy Perspectives; Springer: Berlin/Heidelberg, Germany, 2019; pp. 27–62. [Google Scholar]
  7. Miao, Y.; Xiguang, D.; Huiqiang, Y.; Yonggang, L. The progress in the investigation and study of global deep-sea polumetallic nodules. Geol. China 2018, 45, 29–38. [Google Scholar]
  8. Leng, D.; Shao, S.; Xie, Y.; Wang, H.; Liu, G. A brief review of recent progress on deep sea mining vehicle. Ocean Eng. 2021, 228, 108565. [Google Scholar] [CrossRef]
  9. Zhao, G. Research on Hydraulic Collecting Methods and Fluid particle Dynamic Characteristics for Deep-Sea Mining. Ph.D. Thesis, Shanghai Jiao Tong University, Shanghai, China, 2022. [Google Scholar]
  10. Alhaddad, S.; Mehta, D.; Helmons, R. Mining of deep-seabed nodules using a coandă-effect-based collector. Results Eng. 2023, 17, 100852. [Google Scholar] [CrossRef]
  11. Brockett, T. Nodule collector subsystems. In Proceedings of the Workshop on Proposed Technologies for Deep Seabed Mining of Polymetallic Nodules: International Seabed Authority Meeting, Kingston, ON, Canada, 9–27 August 1999; pp. 67–93. [Google Scholar]
  12. Kim, S.; Cho, S.-g.; Lee, M.; Kim, J.; Lee, T.H.; Park, S.; Hong, S.; Kim, H.-W.; Min, C.-H.; Choi, J.-S. Reliability-based design optimization of a pick-up device of a manganese nodule pilot mining robot using the Coandă effect. J. Mech. Sci. Technol. 2019, 33, 3665–3672. [Google Scholar] [CrossRef]
  13. Orcutt, B.N.; Bradley, J.A.; Brazelton, W.J.; Estes, E.R.; Goordial, J.M.; Huber, J.A.; Jones, R.M.; Mahmoudi, N.; Marlow, J.J.; Murdock, S. Impacts of deep-sea mining on microbial ecosystem services. Limnol. Oceanogr. 2020, 65, 1489–1510. [Google Scholar] [CrossRef]
  14. Boetius, A.; Haeckel, M. Mind the seafloor. Science 2018, 359, 34–36. [Google Scholar] [CrossRef]
  15. Elerian, M.; Alhaddad, S.; Helmons, R.; van Rhee, C. Near-field analysis of turbidity flows generated by polymetallic nodule mining tools. Mining 2021, 1, 251–278. [Google Scholar] [CrossRef]
  16. Wang, P.-J.; Li, L.; Wu, J.-B. Research on the lightweight structural optimization design of the front collector of the polymetallic nodule miner. Ocean Eng. 2023, 267, 113275. [Google Scholar] [CrossRef]
  17. Zhao, G.; Xiao, L.; Hu, J.; Liu, M.; Peng, T. Fluid flow and particle motion behaviors during seabed nodule pickup: An experimental study. Int. J. Offshore Polar Eng. 2021, 31, 210–219. [Google Scholar] [CrossRef]
  18. Cho, S.-g.; Park, S.; Oh, J.; Min, C.; Kim, H.; Hong, S.; Jang, J.; Lee, T.H. Design optimization of deep-seabed pilot miner system with coupled relations between constraints. J. Terramech. 2019, 83, 25–34. [Google Scholar] [CrossRef]
  19. Rodman, L.C.; Wood, N.; Roberts, L. Experimental investigation of straight and curved annular wall jets. AIAA J. 1989, 27, 1059–1067. [Google Scholar] [CrossRef]
  20. Trancossi, M.; Dumas, A.; Vucinic, D. Mathematical Modeling of Coanda Effect; 0148-7191; SAE Technical Paper; SAE International: Warrendale, PA, USA, 2013. [Google Scholar]
  21. Jia, H.; Yang, J.; Su, X. Numerical study on coarse granular flow and performance characteristics of the Coandă effect-based collector for deep sea mining. Appl. Ocean Res. 2024, 148, 104033. [Google Scholar] [CrossRef]
  22. Zhang, B.; Zhao, G.; Xiao, L. Optimization of Geometrical Parameters of Coandă-effect-based Polymetallic Nodule Collection Device. J. Shanghai Jiaotong Univ. 2023, 1–15. [Google Scholar] [CrossRef]
  23. Yang, Q.; Liu, S.; Jiang, X.; Liu, G.; Xia, J. Parameter matching of deep-sea polymetallic nodule collection device based on the Coandǎ effect. Ocean Eng. 2023, 41, 181–192. [Google Scholar] [CrossRef]
  24. Kundu, P.K.; Cohen, I.M.; Dowling, D.R. Fluid Mechanics; Academic Press: Cambridge, MA, USA, 2015. [Google Scholar]
  25. Mei, R. An approximate expression for the shear lift force on a spherical particle at finite Reynolds number. Int. J. Multiph. Flow 1992, 18, 145–147. [Google Scholar] [CrossRef]
  26. Oesterlé, B.; Dinh, T.B. Experiments on the lift of a spinning sphere in a range of intermediate Reynolds numbers. Exp. Fluids 1998, 25, 16–22. [Google Scholar] [CrossRef]
  27. Dreiseitl, I. About geotechnical properties of the deep seabed polymetallic nodules. In Proceedings of the 18th International Conference on the Transport and Sedimentation of Solid Particles, Prague, Czech Republic, 11–15 September 2017; pp. 11–15. [Google Scholar]
  28. Zenhorst, J. Degradation of Poly-Metallic Nodules in a Dredge Pump. Master’s Thesis, Delft University of Technology, Delft, The Netherlands, 2016. [Google Scholar]
Figure 1. Polymetallic nodule collection schemes. (a) Mechanical (modified from [10]); (b) hydraulic [11]; (c) hybrid [12].
Minerals 14 00915 g001
Figure 2. Structure sketch of the attached wall jet collector.
Minerals 14 00915 g002
Figure 3. Schematic of the working principle of an attached wall jet collector.
Minerals 14 00915 g003
Figure 4. Simplification of model geometry.
Minerals 14 00915 g004
Figure 5. Structural parameters of the attached wall jet collector.
Minerals 14 00915 g005
Figure 6. Simulation boundary conditions.
Minerals 14 00915 g006
Figure 7. Mesh of the attached wall jet collector in simulation.
Minerals 14 00915 g007
Figure 8. Experimental system. (a) Integral experimental system; (b) structure of the attached wall jet collector.
Minerals 14 00915 g008
Figure 9. Experimental ore particle. (a) Ore particles morphology; (b) flat spreading of ore particles.
Minerals 14 00915 g009
Figure 10. Movement of ore particles in the collector.
Minerals 14 00915 g010
Figure 11. Collection rate (η) and average velocity of exported nodules (Vp) at different collection jet flow rates (V1).
Minerals 14 00915 g011
Figure 12. Pressure distribution cloud diagram at different collection jet flow rates: (a) 6 m/s; (b) 8 m/s; (c) 10 m/s.
Minerals 14 00915 g012
Figure 13. Negative pressure values of different heights at different collection jet flow rates.
Minerals 14 00915 g013
Figure 14. Velocity distribution cloud of nodules at different collection jet flow rates: (a) 6 m/s; (b) 8 m/s; (c) 10 m/s.
Minerals 14 00915 g014
Figure 15. Collection rate (η) and average velocity of exported nodules (Vp) at different bottom clearances (c).
Minerals 14 00915 g015
Figure 16. Pressure distribution cloud diagram at different bottom clearances: (a) 10 mm; (b) 20 mm; (c) 40 mm.
Minerals 14 00915 g016
Figure 17. Negative pressure values of different heights at different bottom clearances.
Minerals 14 00915 g017
Figure 18. Velocity distribution cloud of nodules at different bottom clearances: (a) 10 mm; (b) 20 mm; (c) 40 mm.
Minerals 14 00915 g018
Figure 19. Collection rate (η) and average velocity of exported nodules (Vp) at different collection nozzle slant angles (α).
Minerals 14 00915 g019
Figure 20. Pressure distribution cloud at different collection nozzle slant angles: (a) 35°; (b) 40°; (c) 45°.
Minerals 14 00915 g020
Figure 21. Negative pressure values of different heights at different collection nozzle slant angles.
Minerals 14 00915 g021
Figure 22. Velocity distribution cloud of the nodules at different collection nozzle slant angles: (a) 35°; (b) 40°; (c) 45°.
Minerals 14 00915 g022
Table 1. Minimum pressure under different mesh densities.
Serial NumberNumber of GridsMinimum Pressure (Pa)
Inner Flow FieldOutside Flow FieldTotal
1494,459261,942756,402−6985
2582,104440,6651,022,769−7446
3637,896594,7221,232,618−7328
4699,388838,1591,537,547−7369
Table 2. Comparison of collection rates.
NumberCollection Jet Flow Rate (m/s)Bottom
Clearance (mm)
Collection RateError
ExperimentSimulation
A151067.3%70.8%−3.5%
A261082.8%81.4%1.4%
A371086.7%87.1%−0.4%
A481091.6%94.0%−2.4%
A591093.2%94.1%−0.9%
A6101095.5%94.9%0.6%
B18595.6%99.2%−3.6%
B281091.8%99.1%−7.3%
B381591.7%92.1%−0.4%
B482080.3%87.7%−7.4%
B583070.6%74.5%−3.9%
B684040.7%48.1%−7.4%
Disclaimer/Publisher’s Note: The statements, opinions and data contained in all publications are solely those of the individual author(s) and contributor(s) and not of MDPI and/or the editor(s). MDPI and/or the editor(s) disclaim responsibility for any injury to people or property resulting from any ideas, methods, instructions or products referred to in the content.

