Article

Characteristics of Micropore-Throat Structures in Tight Oil Reservoirs: A Case Study of the Jiufotang Formation in the Houhe Region, NE China

1
Liaohe Oilfield Company, Panjin 124010, China
2
School of Earth Sciences and Resources, China University of Geosciences (Beijing), Beijing 100083, China
*
Author to whom correspondence should be addressed.
Minerals 2024, 14(9), 918; https://doi.org/10.3390/min14090918
Submission received: 22 July 2024 / Revised: 27 August 2024 / Accepted: 4 September 2024 / Published: 6 September 2024
(This article belongs to the Topic Petroleum Geology and Geochemistry of Sedimentary Basins)

Abstract

:
In order to examine further the characteristics of micropore-throat structures of the tight oil reservoir in the Jiufotang Formation in the Houhe region, this study used whole rock X-ray diffraction, routine physical property analysis, and routine thin section observations to analyze the material composition and physical properties of the tight oil reservoir. CT scanning, high-pressure mercury infiltration, and other test methods were employed to analyze the characteristics of the pore-throat structures in the tight oil reservoir. In addition, the Pearson correlation coefficients quantified the relationships between nine parameters and pore-throat structures. The parameters with high correlations were optimized for analysis, and a comprehensive classification scheme for micropore-throat structures in the tight oil reservoir in the study area was established. The results show that the reservoir in the Jiufotang Formation in the Houhe region is composed of feldspathic and lithic arkosic sandstone, with feldspar and clast pore dissolution pores as the main type of reservoir pore space. The tight oil reservoir has small pore-throat radius, complex structures, poor connectivity, and high heterogeneity. It generally contains micron-sized pores with submicron to nanometer throat widths and small- and medium-sized pores to fine micropore-throat structures. Porosity, permeability, coefficient of variation, skewness coefficient, and average pore-throat radius, were selected for k-means cluster analysis. The micropore-throat structures of the tight oil reservoir were divided into three categories: classes I, II, and III. The study area is dominated by class II pore throats, accounting for 58%. Diagenesis mainly controls the pore-throat structure. These results provide an effective reference for the identification and evaluation of favorable sweet spots in tight oil reservoirs in similar blocks in China.

1. Introduction

Tight oil (gas), as a continuous unconventional oil and gas of significant economic value with no clear trap boundaries, has received increasing attention in the early 21st century and is defined as oil (gas) stored in tight carbonate, tight sandstone, and other reservoirs with an overpressure matrix permeability of less than or equal to 0.1 × 10⁻³ μm2 (gas permeability of less than 1 × 10⁻³ μm2) [1,2]. Tight oil is generally deposited in the adsorbed or free state and is adjacent to oil-generating rock; more often than not, it has not undergone large-scale long-distance oil and gas migration. In the process of unconventional oil and gas exploration and development, tight oil (gas) is undoubtedly the second most popular topic, second only to shale oil (gas). Its main characteristics include wide distribution, with multiple layers involved, and a huge resource potential (global technically recoverable reserves are about 639.3 × 10⁸ t), and it is therefore known as “black gold” in the oil industry [3,4]. The United States led the development of tight oil in its early stages, and after approximately 20 years of exploration and technological breakthroughs, it commercially expanded tight oil in the 2010s. Experience from around the world has revealed the following: (1) Tight oil with abundant recoverable reserves is often located near high-quality source rocks, and many regions, such as North America, Europe, and Africa, have higher recoverable tight oil reserves because of the development of total organic carbon (TOC) > 4% of high-quality source rocks [5,6,7]. (2) Moderate mud content is beneficial to the recoverable amount of tight oil. An example of the Spraberry Formation in the Permian Basin shows that excessively high mud content can reduce reservoir quality, while too low mud content can result in a weak hydrocarbon generation capacity [5,7,8]. (3) Favorable sedimentary facies have a significant enhancing effect on relatively tight oil; that is, reservoirs developed close to the source area, such as delta front and carbonate platform slopes, have better physical properties [5,9]. The De Witt and Karnes Groups, which were formed far from the sedimentary center in the Gulf Basin, have a high tight oil production capacity due to their high porosity [5,9,10]. (4) Positive structural zones and slope zones are conducive to tight oil accumulation, e.g., the tight oil of the Bakken Formation in the Williston Basin is mainly developed in the southern part of the Nesson Anticline [5,8,11,12,13,14]. (5) The development of new technologies, such as nanofluidic technology, provides important technical support for optimizing the accuracy of theoretical descriptions, while exploration methods for tight reservoirs are becoming more diversified [15,16,17,18,19].
Owing to its abundant resources and wide distribution range the exploration of tight oil in China has also attracted attention. However, compared with the United States, China’s tight oil exploration began relatively late [20,21] and is still in the experimental stage of development. The concepts of exploration related to tight oil are still in the summarizing stages. The main exploration experience obtained can be summarized as follows: (1) Tight oil is mainly distributed in the Junggar Basin, Bohai Bay Basin, Songliao Basin, the Ordos Basin and other continental basins, with obvious disadvantages such as thin effective reservoirs and poor physical properties [21,22,23,24]. (2) Tight reservoirs are often closely connected to source rocks without obvious trap boundaries, such as the Jurassic oil reservoirs in the Ordos Basin [24,25]. (3) The micro pore-throat size and complexity of pore-throat structure in tight reservoirs indicate that tight oil reservoirs are not only characterized by low porosity and permeability, but also have a strong relationships between complex pore permeability and heterogeneity [26,27]. The porosity of the reservoirs is the same, but the permeability varies greatly, ranging from tens to thousands of times, such as the Jiufotang Formation (Fm) in the Houhe region of the Ludong Depression. (4) The lithology that constitutes a tight reservoir is complex and diverse, often composed of sandstone, carbonate rocks, and mixed clastic and carbonate rocks. In specific cases, conglomerate rocks can also form a tight reservoir [21,22,24]. (5) The individual exploration area is relatively small, generally not exceeding 2000 km2, and limits the development scale of tight oil (gas) [6]. (6) Tight reservoirs are clearly controlled by diagenetic evolution, which, along with mineral migration, directly controls the heterogeneity of the reservoir [21,26,27], and macroscopically controls the spatial differences of tight reservoirs, determining the distribution characteristics and scale of tight oil (gas) [21,24,26]. On this basis, the following updates in understanding should be beneficial for improving the depth of China’s research on terrestrial tight reservoirs and exploring the factors controlling terrestrial tight reservoirs: (1) revealing the role of sedimentation in tight reservoirs; (2) clarifying the spatial differences in pore-throat structures in tight oil reservoirs that occur at the micrometer scale; and (3) investigating the factors that control the formation of pore-throat structures in tight oil reservoirs.
To better address the aforementioned issues, we assessed the Jiufotang Fm in the Houhe area of the Ludong Depression, which has had the largest integrated scale increased storage block in Liaohe Oilfield in the past 10 years and has reserves of over 10 million tons. Its widely distributed drilling and exploration wells provide a good database for effectively answering the above questions. Through comprehensive utilization of computed tomography (CT) scanning, high-pressure mercury injection, scanning electron microscopy, and dyed thin section observations, the rock type, reservoir space, and micropore-throat structure characteristics of the tight oil reservoir in the Jiufotang Fm in the Houhe region of the Ludong Sag were thoroughly studied. Subsequently, the 3D micropore structures in the tight oil reservoir were characterized, and the pore and pore-throat types were determined. These characteristics provide important guidance for the analysis and subsequent development of oil and gas enrichment patterns in tight oil reservoirs in China.

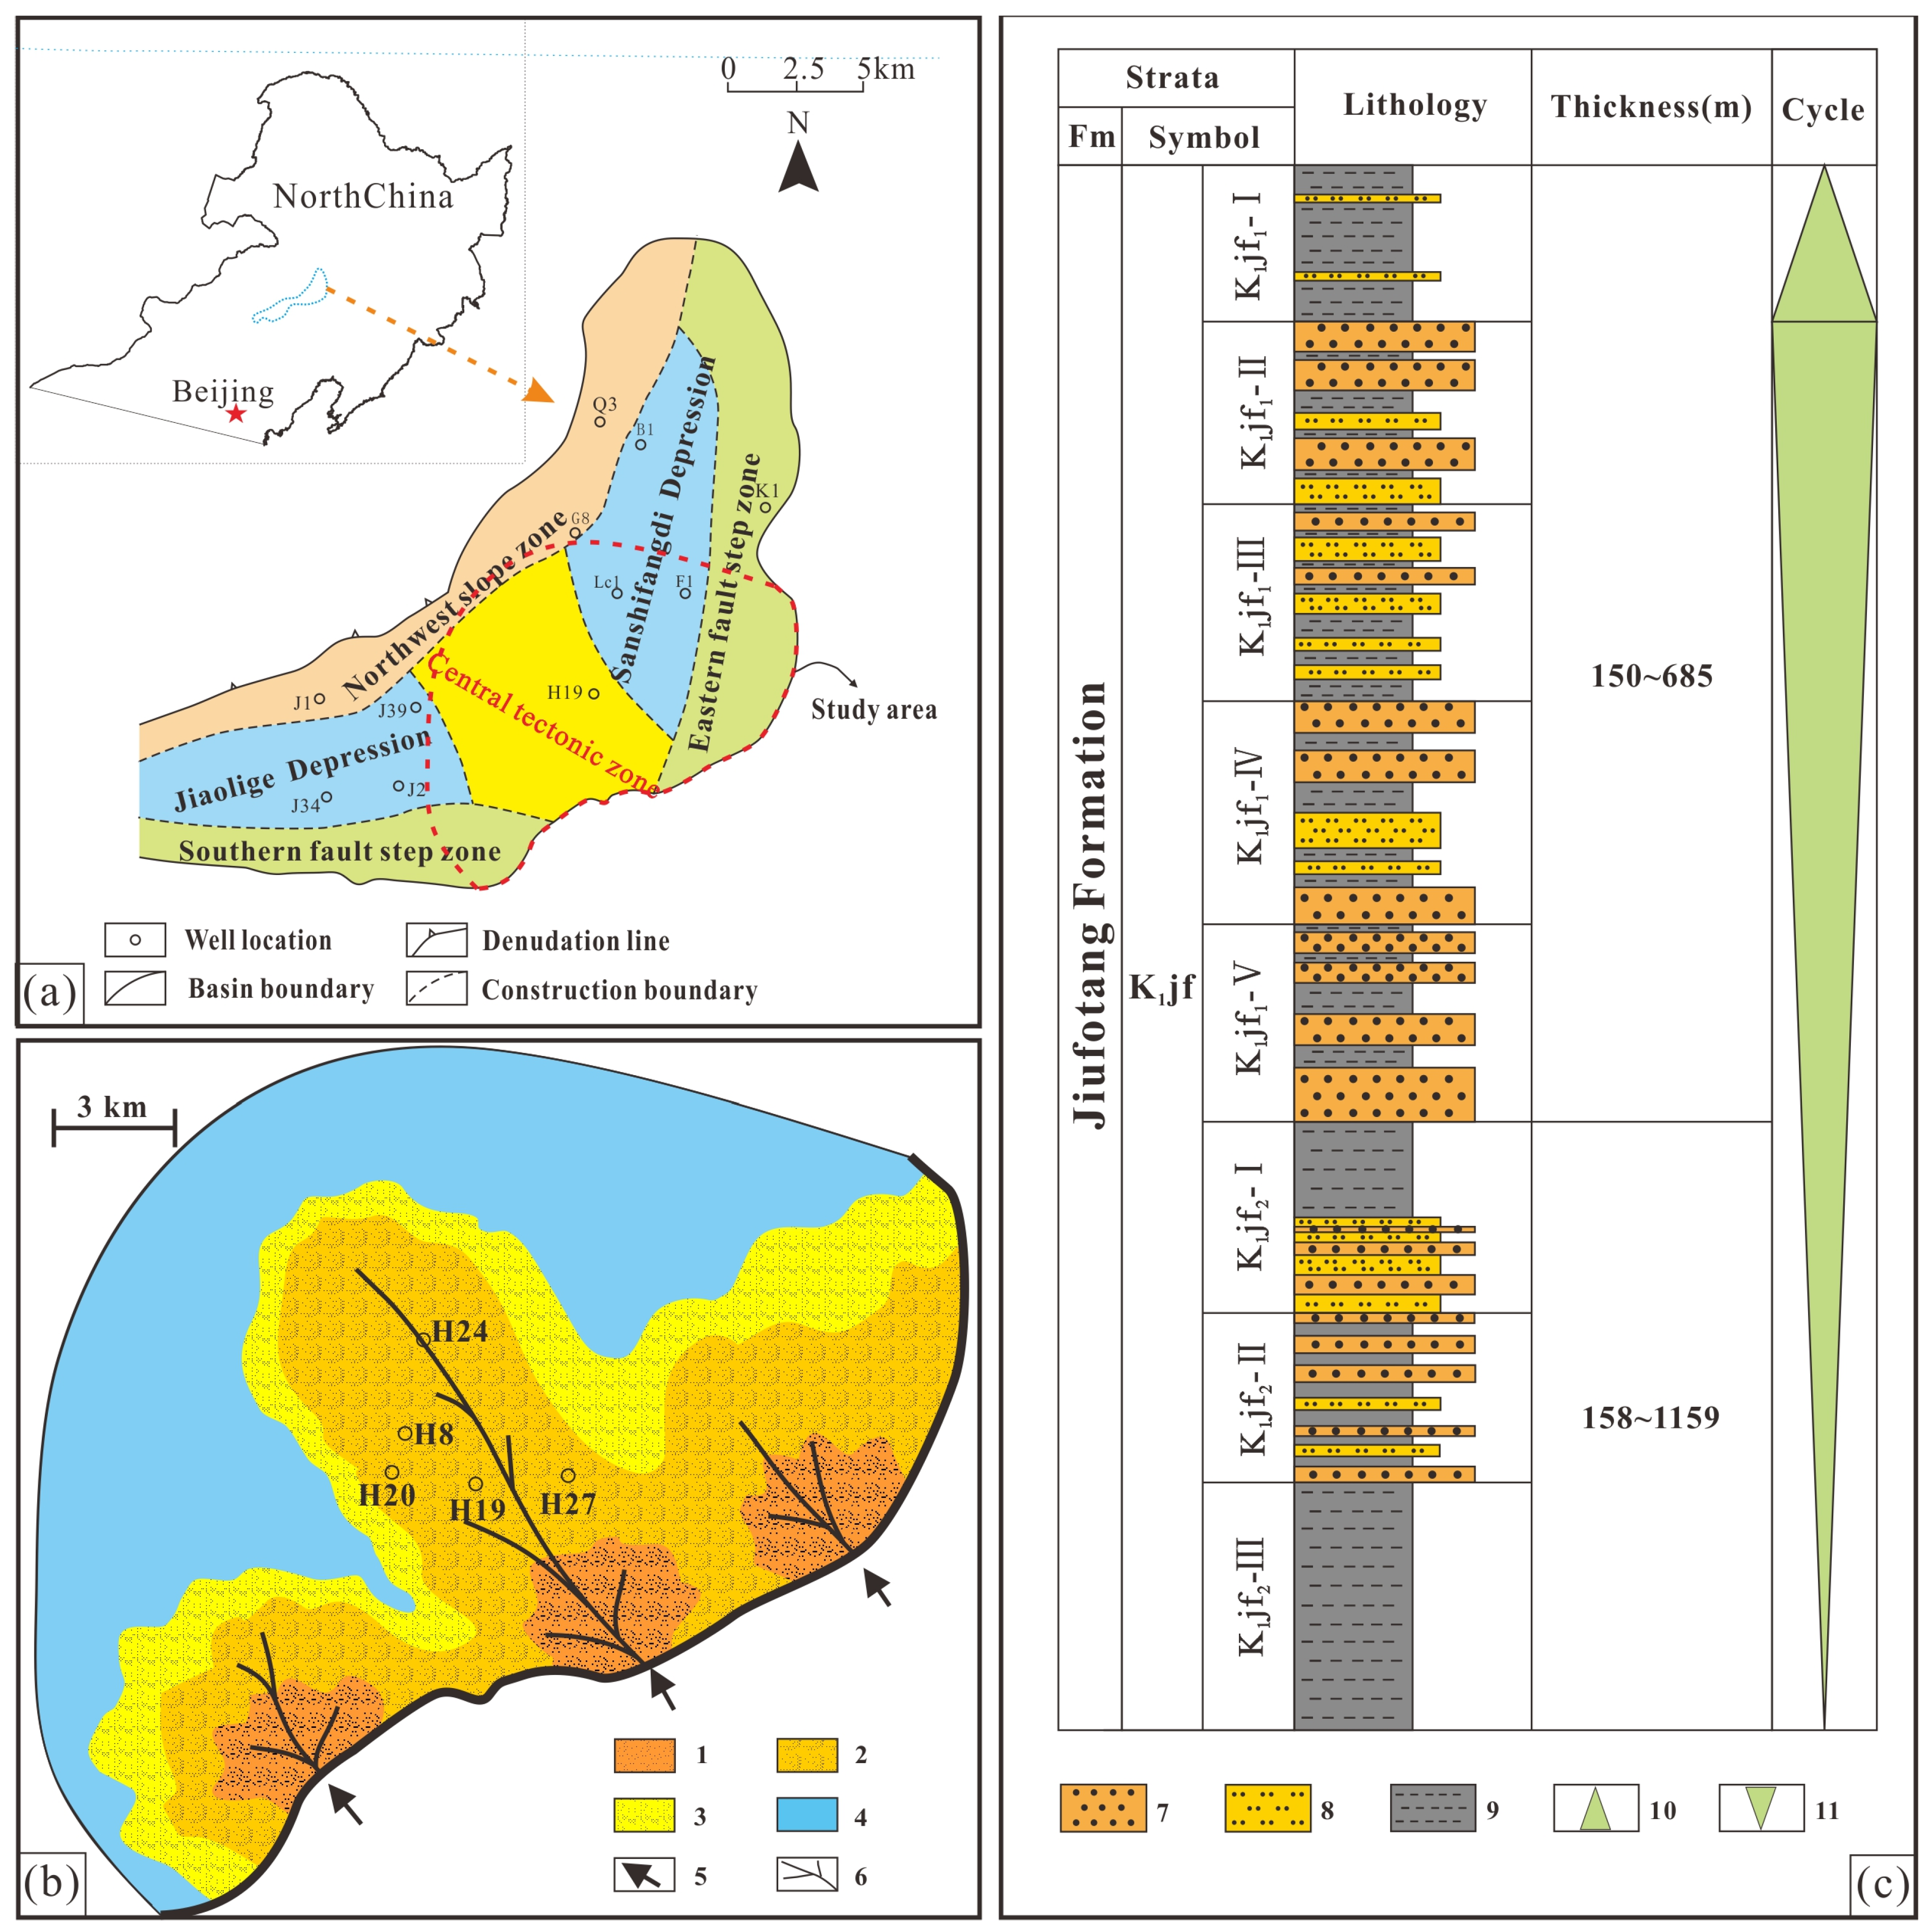
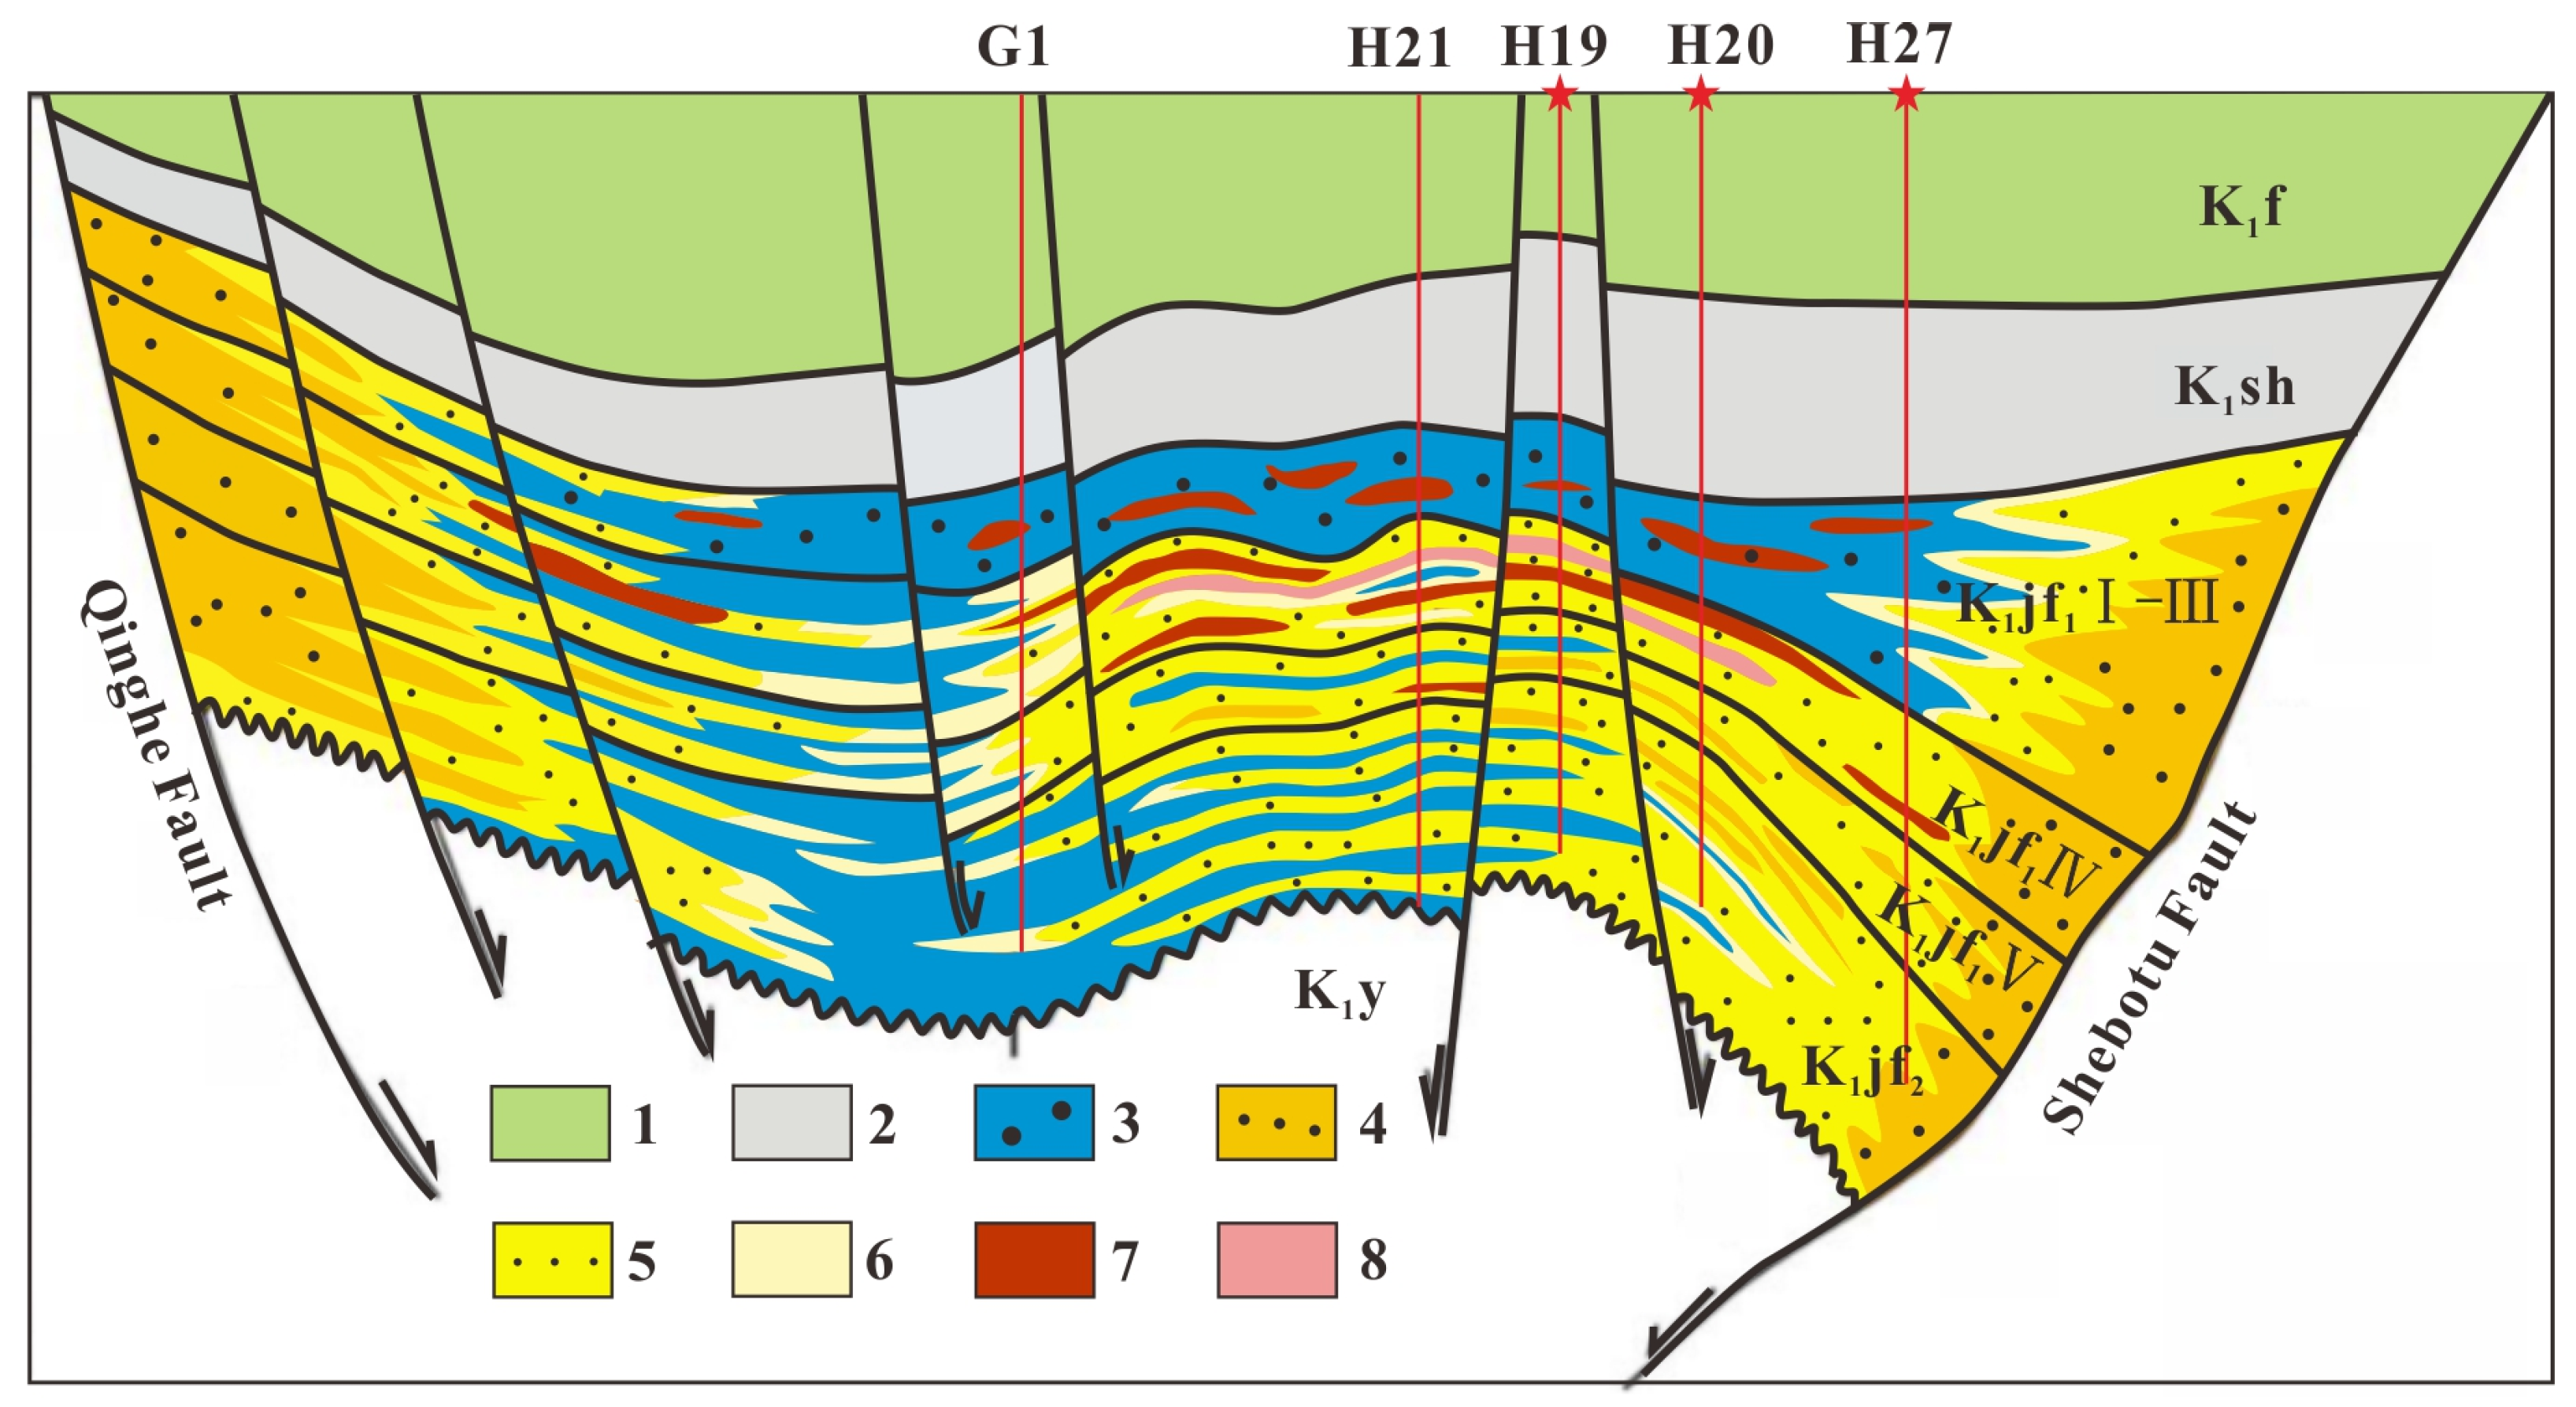
2. Geological Setting

The Ludong Sag is located in the Kailu Basin, a secondary downward-facing tectonic unit of the Mesozoic era [28]. It covers an area of approximately 1740 km2 and has a tectonic pattern with a rift in the south and an onlap in the north, bounded by the Xibohua, Qianhouhe, Talagan, and Qinghe faults. Since its formation, the Ludong Sag has undergone four stages: early rifting, strong faulting, stable subsidence, and subsidence disappearance [28]. Owing to strong tectonic activity, multiple sets of faults have been generated, especially NNE-oriented regional faults. The entire depression is characterized by a gentle slope in the northwest and a steep slope in the southeast, and is further divided into six tectonic subunits: the northwestern slope zone, the eastern and southern fault zones, the Sanshifang and Jiaolige Depressions, and the central tectonic zone [28]. Among them, the Sanshifang and Jiaolige Depressions are the main crude oil-bearing units, from which two main sets of type I–II crude oil layer systems in the Shahai and Jiufotang Formations have been found to have favorable development conditions. They are part of medium-good oil-generating rocks and have a strong oil production capacity, thereby providing favorable conditions and an oil source for this area [28,29,30].
The Houhe region is located in the southern part of the Ludong Sag, in the southern part of the central fault tectonic zone, and between the Jiaolige and Sanshifang hydrocarbon depressions (Figure 1a). This tectonic background has resulted in the formation of multiple sets of sedimentary strata within the study area. The basement of the Carboniferous–Permian is frequently dominated by metamorphic strata, overlying the Cretaceous, Cenozoic, Paleogene, and Neogene strata from bottom to top. According to the lithology, the Lower Cretaceous strata are further divided into the Yixian, Jiufotang, Shahai, and Fuxin Formations. With oil production capacity, the Jiufotang Fm, dominated by sandstone, siltstone, and mudstone, was the main target stratum in this study (Figure 1c). With strong tectonic movements and volcanic activity, the developed Yixian Formation formed a reservoir of volcanic rocks and provided abundant materials for the lake basin formed later in the study area [31,32,33,34]. Owing to the strong activity along the southeastern margin of the fault during the Jiufotang period, the basin subsided rapidly. A series of large alluvial delta fan sediments were deposited in a shallow-partially deep lake environment on the sloped margin of the sedimentary basin (Figure 1b), which is generally characterized by gravity flow sedimentation. These submerged channels and mat-shaped sand units at the leading margin of the delta fan attained a certain thickness that was favorable for the formation of tight oil reservoirs. Accompanied by the weakening of faulting activity and gradually stabilizing sedimentation, the dark mudstones of the Shahai and Jiufotang Formations were deposited together to form a connected self-contained reservoir assemblage, thereby providing both good reservoir and cap rocks and favorable accumulation conditions [32,33].
The Jiufotang Fm was deposited during a period of strong tectonic activity, with significant changes in lake level and strong cyclicity in the strata. Fine-grained sediments, including shale and mudstone, were mainly developed in the lower part of the Jiufotang Fm. At the bottom of this formation, a series of well-developed dark shales developed, the thickness of the sandstone gradually increased, and that of the mudstone gradually decreased upward. In the middle of the Jiufotang Fm, coarse-grained sediments such as sandstone and siltstone dominated the strata, and the thickness of the sandstone gradually increased upward; that is, sandstone and siltstone dominated the upper part of the Jiufotang Fm. Based on this, the Jiufotang Fm can be divided into two members, the lower and upper, and further divided into eight layers (Figure 1c). The Jiufotang Fm constitutes an upward-shallowing sedimentary succession representing the products of the lake-level decline period. At the end of the Jiufotang period, the height of the lake level increased because of the calming of the structure, resulting in the development of a well-developed dark shale at the top of the Jiufotang Fm (Figure 1c). The thickness of the Jiufotang Fm varies significantly across the region, with a general tendency for thicker strata to form in shallow-water areas and thinner strata to form in deep-water areas.

3. Materials and Methods

3.1. Sample Information

To clarify the basic geological information such as mineral composition and pore structure of the Jiufotang Fm in the research area, we evaluated the control effect of various diageneses and other geological events that may affect the micropore-throat structure characteristics of tight oil reservoirs and sampled the Jiufotang Fm, covering the central and peripheral areas of the Houhe area. This study also took samples from different wells (such as H27, H19, H20) far away from the source area, to demonstrate further the differences in conventional physical properties such as porosity, permeability, pore-throat radius, surface area, as well as the pore morphology and structure of tight oil reservoirs controlled by differential sedimentation in the same sedimentary facies.
The samples analyzed in this study were collected from the tight oil reservoir in the Jiufotang Fm in the Houhe region of the Ludong Sag and data were provided by the E&D Research Institute of the CNPC Liaohe Petroleum and Beijing Runze Innovation Co., Ltd.

3.2. Testing Methods

3.2.1. Petrological Analysis

Mineral composition analyses were performed using a German Bruker D8 Advance X-ray diffractometer (E&D Research Institute of the CNPC Liaohe Petroleum, China) under the following test conditions: Cu (monochromatic), working current of 30 mA, working voltage of 40 kV, and a slit width of 1 mm. The scanning speed (2Θ) was 2°/min, the sampling step width (2Θ) was 0.02°, and the scanning range (2Θ) was 5–45°. The relative mineral content was determined by scanning under these conditions.

3.2.2. Thin Sections, Dyed Thin Sections, and SEM Analyses

Using a standard petrographic microscope, 51 sandstone thin sections and 56 fluorescent thin sections were observed in detail to determine rock composition, structure, and formation. Using a ZEISS microscope (E&D Research Institute of the CNPC Liaohe Petroleum, China), 69 blue epoxy-impregnated thin sections were observed, and using a scanning electron microscope (SEM) at E&D Research Institute of the CNPC Liaohe Petroleum in China, 60 rock samples were observed to analyze the pore structures of the samples.

3.2.3. Analysis of Routine Physical Properties

A plug sample of a height and diameter of 2.5 cm was washed with oil and dried. The porosities and permeabilities of the rock samples were measured using the gas method. The technical parameters of the helium porosity test were a helium injection pressure of 0.7–1.5 MPa and a pressure sensor accuracy of ±0.1%. Porosity was obtained according to Boyle’s law, and permeability was obtained according to Darcy’s law.

3.2.4. CT Analysis

CT scanning digital core technology is a technical method that uses X-rays to image rock samples in an all-round, large-scale, rapid, and nondestructive manner. In this method, scanned images are used to numerically reconstruct the 3-D characteristics of the pore-throat structures [35]. A German Bruker SkyScan1173 X-CT scanner (Beijing Runze Innovation Co., Ltd., China) was used with a working voltage of 130 kV, working current of 100 mA, X-ray intensity of 190 keV, and a test accuracy of 100 nm. FEI-Pergeos digital core analysis software (2021.1) was used to analyze the data and calculate the parameters, and 600–1200 grayscale sections were obtained from each sample scan. First, the core was cut into 25.4 mm plugs and X-ray computed tomography (X-CT) scanning was conducted to observe the micropore-throat features (image resolution of 8 μm), after which the image processing software was used to process the attenuated signals into 2D grayscale images. A series of mathematical methods were then used to convert the 2D images into 3D data bodies. Finally, reconstructed images were obtained to characterize the 3D structural data of the samples, such as the porosity, permeability, pore-throat radius, surface area, and other parameters of the core.

3.2.5. High-Pressure Mercury Intrusion Analysis

A high-pressure mercury intrusion test was conducted using an AutoPoreIV9520 automatic mercury pressure instrument (E&D Research Institute of the CNPC Liaohe Petroleum, China). The measurement range of the instrument pore size was 3 nm to 1000 μm, and the volume accuracy of the incoming and declining mercury was less than 0.1 μL. The samples were made into plugs with a diameter and height of 2.5 cm. After drying for 24 h, the maximum pressure of mercury was 200 MPa. Based on these results, the microstructures of pore-throat in the tight oil reservoir were studied.

4. Results

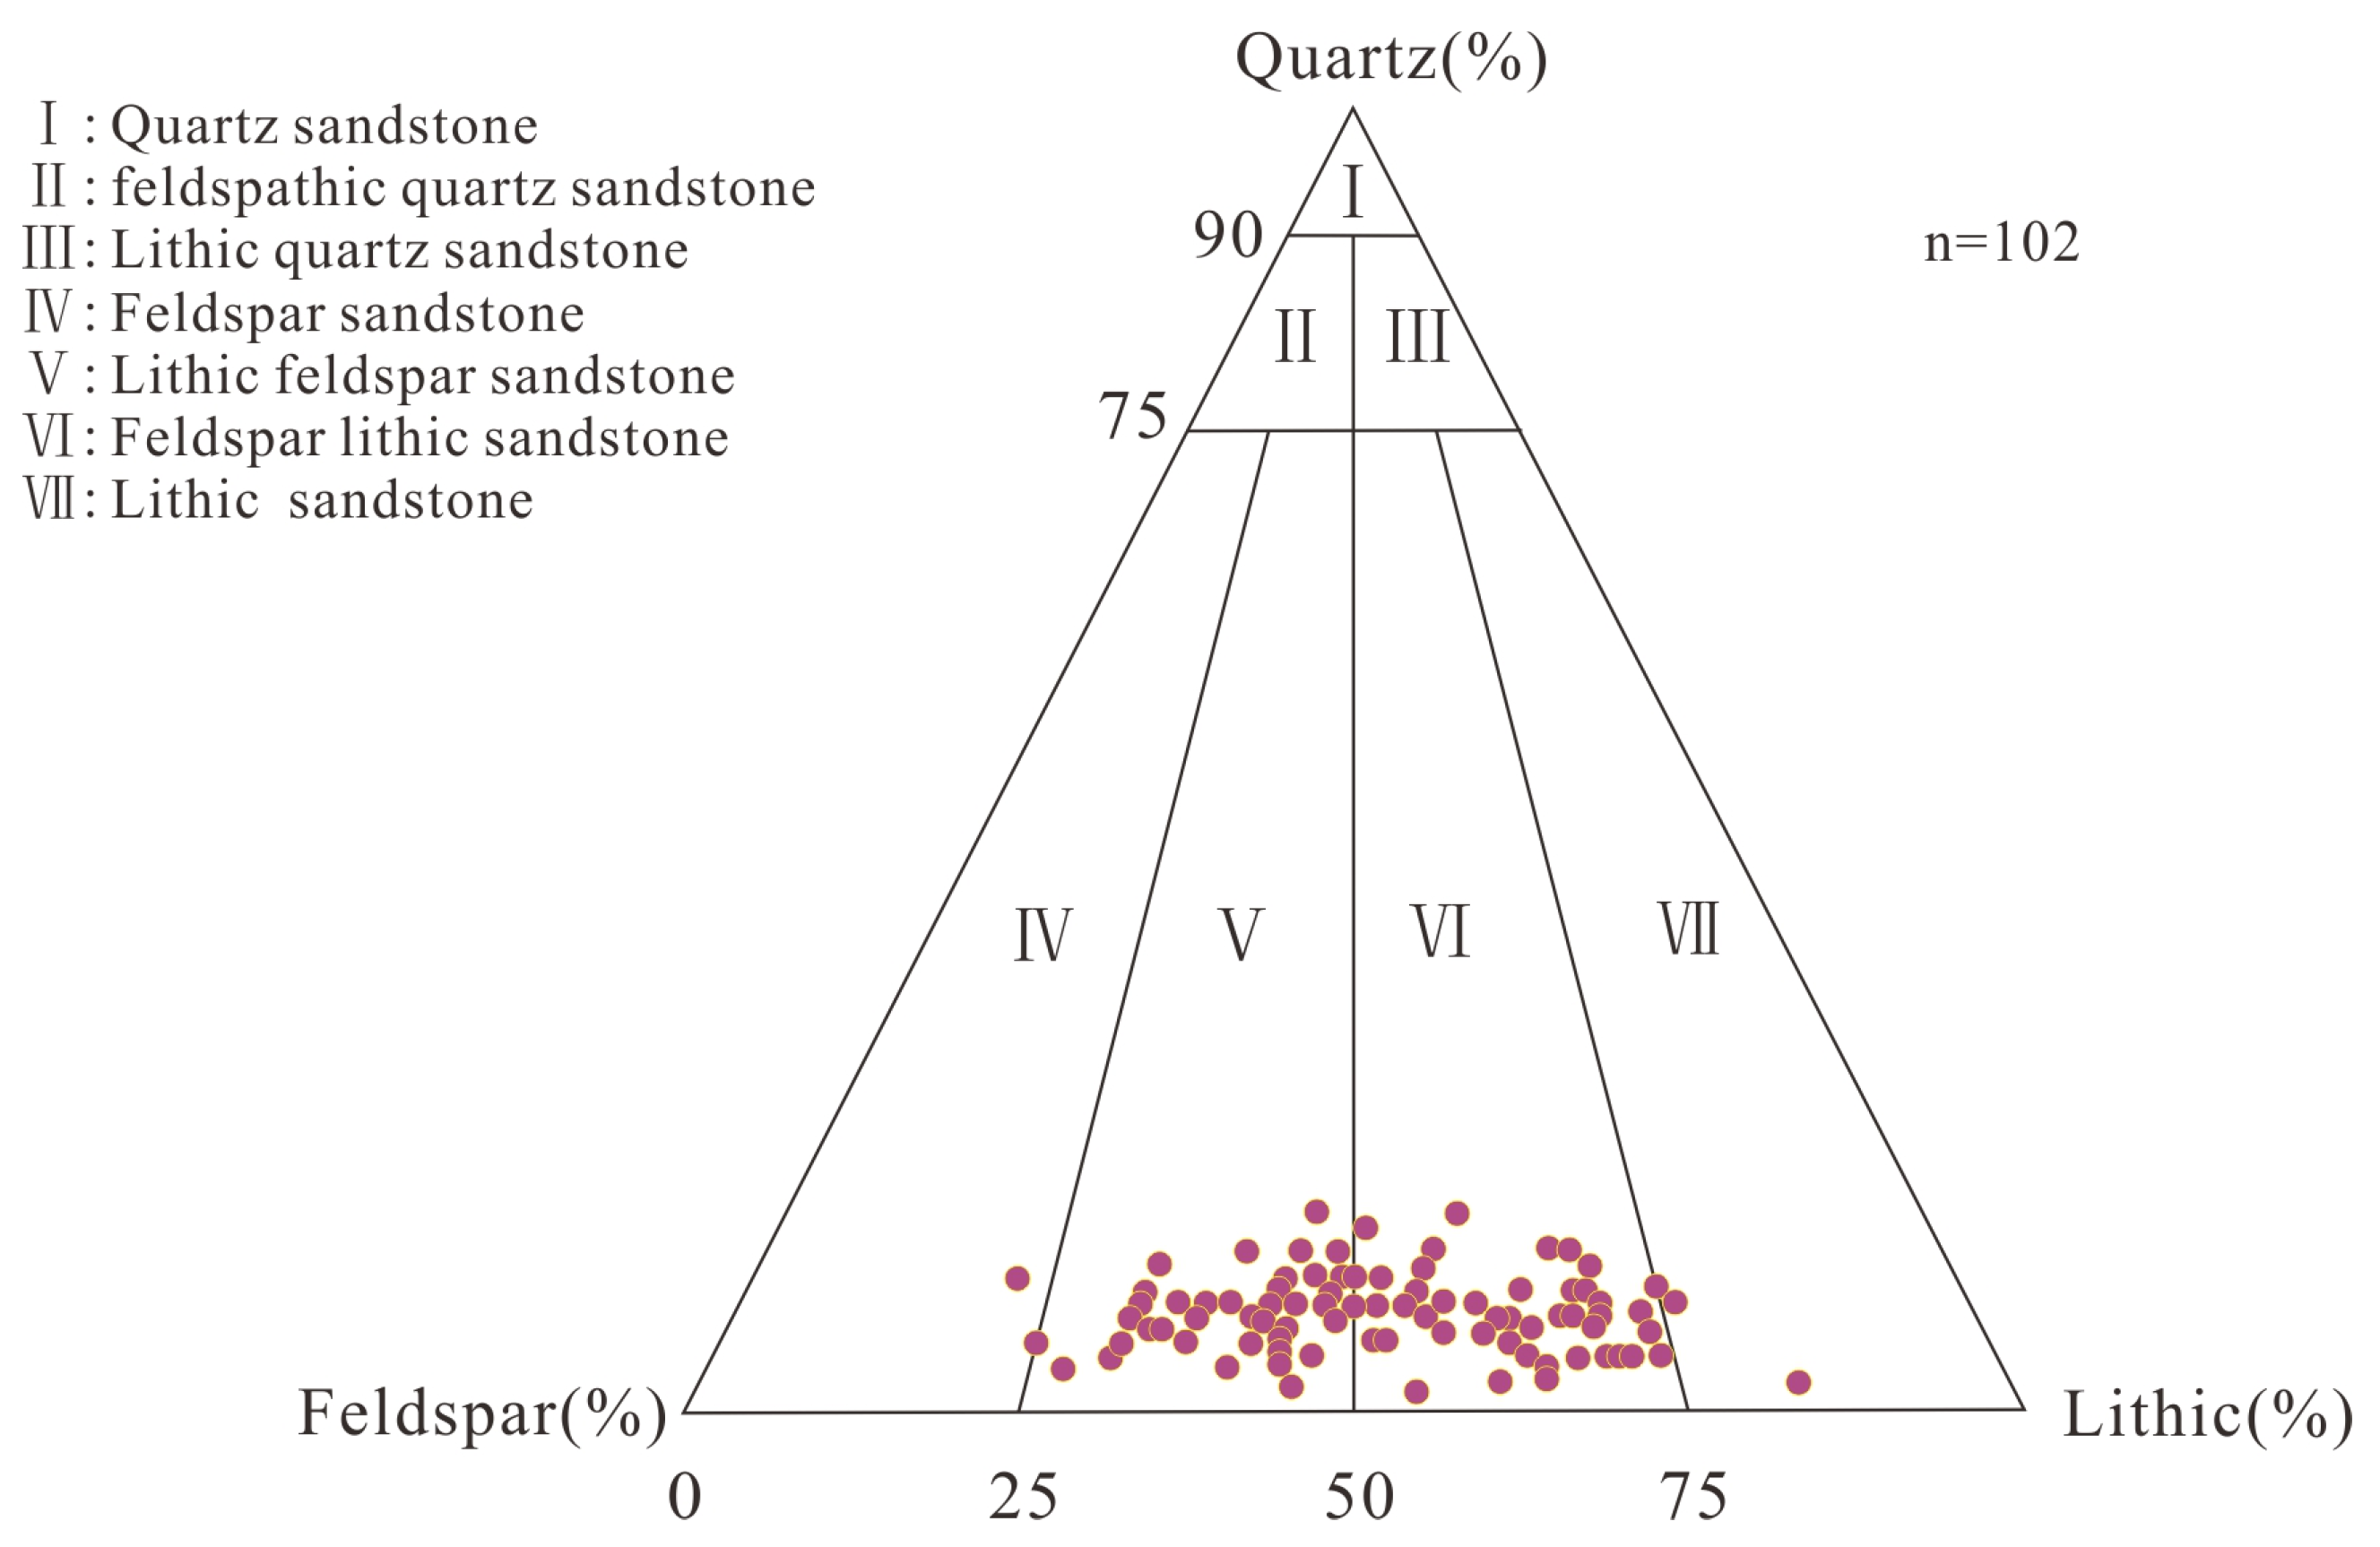
4.1. Reservoir Petrology

The lithology of the tight oil reservoir in the Jiufotang Fm in the study area is mainly fine sandstone and siltstone, and the rock is characterized by large clasts (35.2%), high feldspar content (39.3%), and low quartz content (25.5%). According to the Folk classification method [36], the rock types are feldspathic sandstone and lithic arkosic sandstone (Figure 2), and the lithic clasts are mainly intermediate volcanic rock clasts. The rock composition is characterized by low maturity and is mostly controlled by near-source sedimentation in the delta fan. The clastic particles are poorly sorted and subangular to subrounded, and the types of grain contacts are mainly tangential (point)-long contacts. Grain-supported was the dominant support method, pore cementation was dominant, and the structural maturity was low. The tight oil reservoir is mainly composed of clay and carbonate minerals, which include an illite–montmorillonite mixed layer (43.3%), illite (23.2%), chlorite (22.7%), and a small amount of kaolinite. The carbonate cement was dominated by calcite, accounting for 9.5%. Silica occurs in two main forms: secondary quartz overgrowth, which is generally well developed in the study area [37,38,39], and automorphic quartz crystals within the remaining intergranular pores.

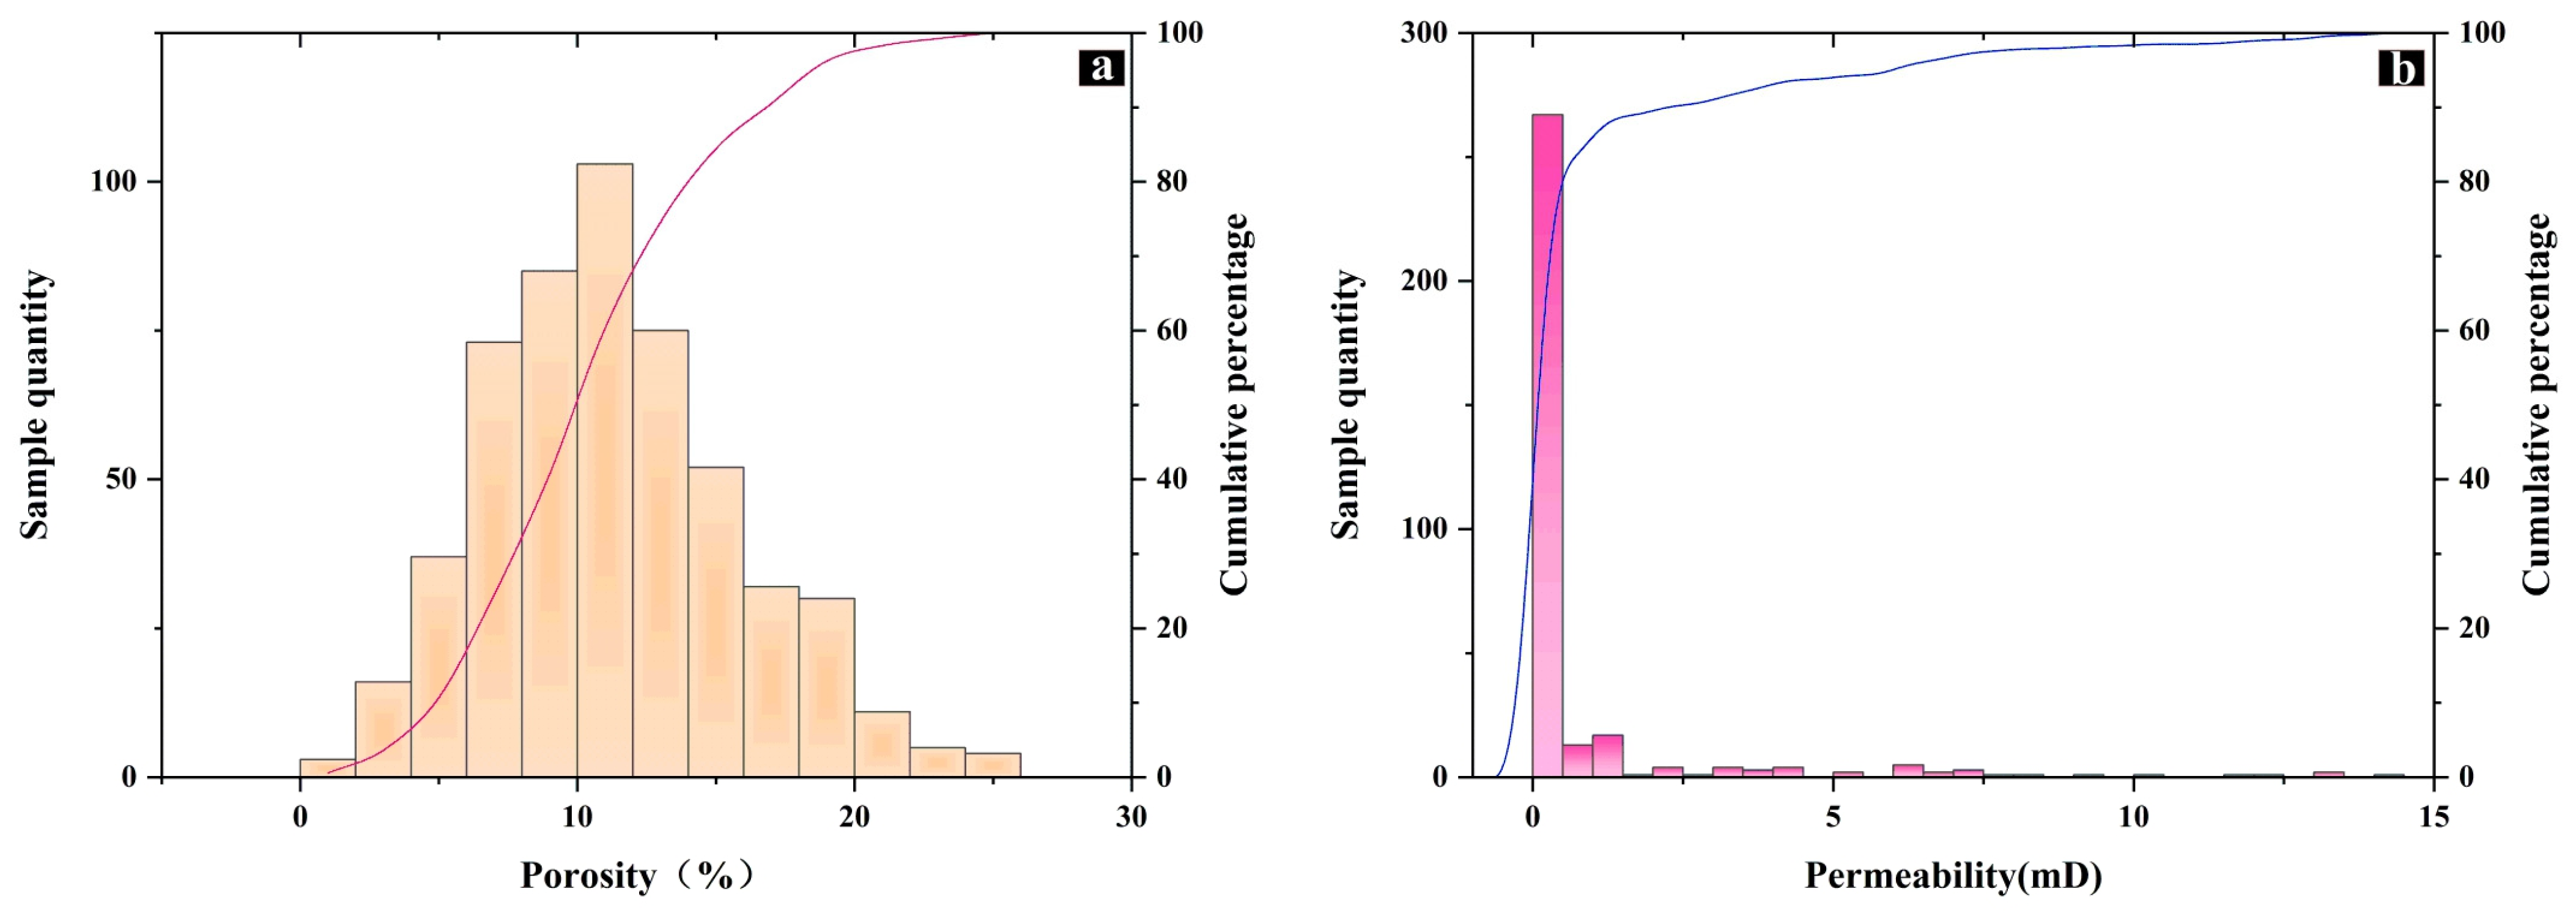
4.2. Physical Characteristics of the Reservoir

According to the results of the physical analysis of the core from the Jiufotang Fm, the porosity of the reservoir is 4.7%–18.7%, with a median value of 13.4%. The porosity of 59% of the samples is greater than 10%, whereas 41% have a porosity of <10% (Figure 3a). The gas permeability is 0.1–124.6 mD, with a median value of 1.5 mD, of which 97% of the samples have gas permeabilities of <1 mD (Figure 3b). This reservoir meets the national standards of the Tight Oil Geological Evaluation Method.

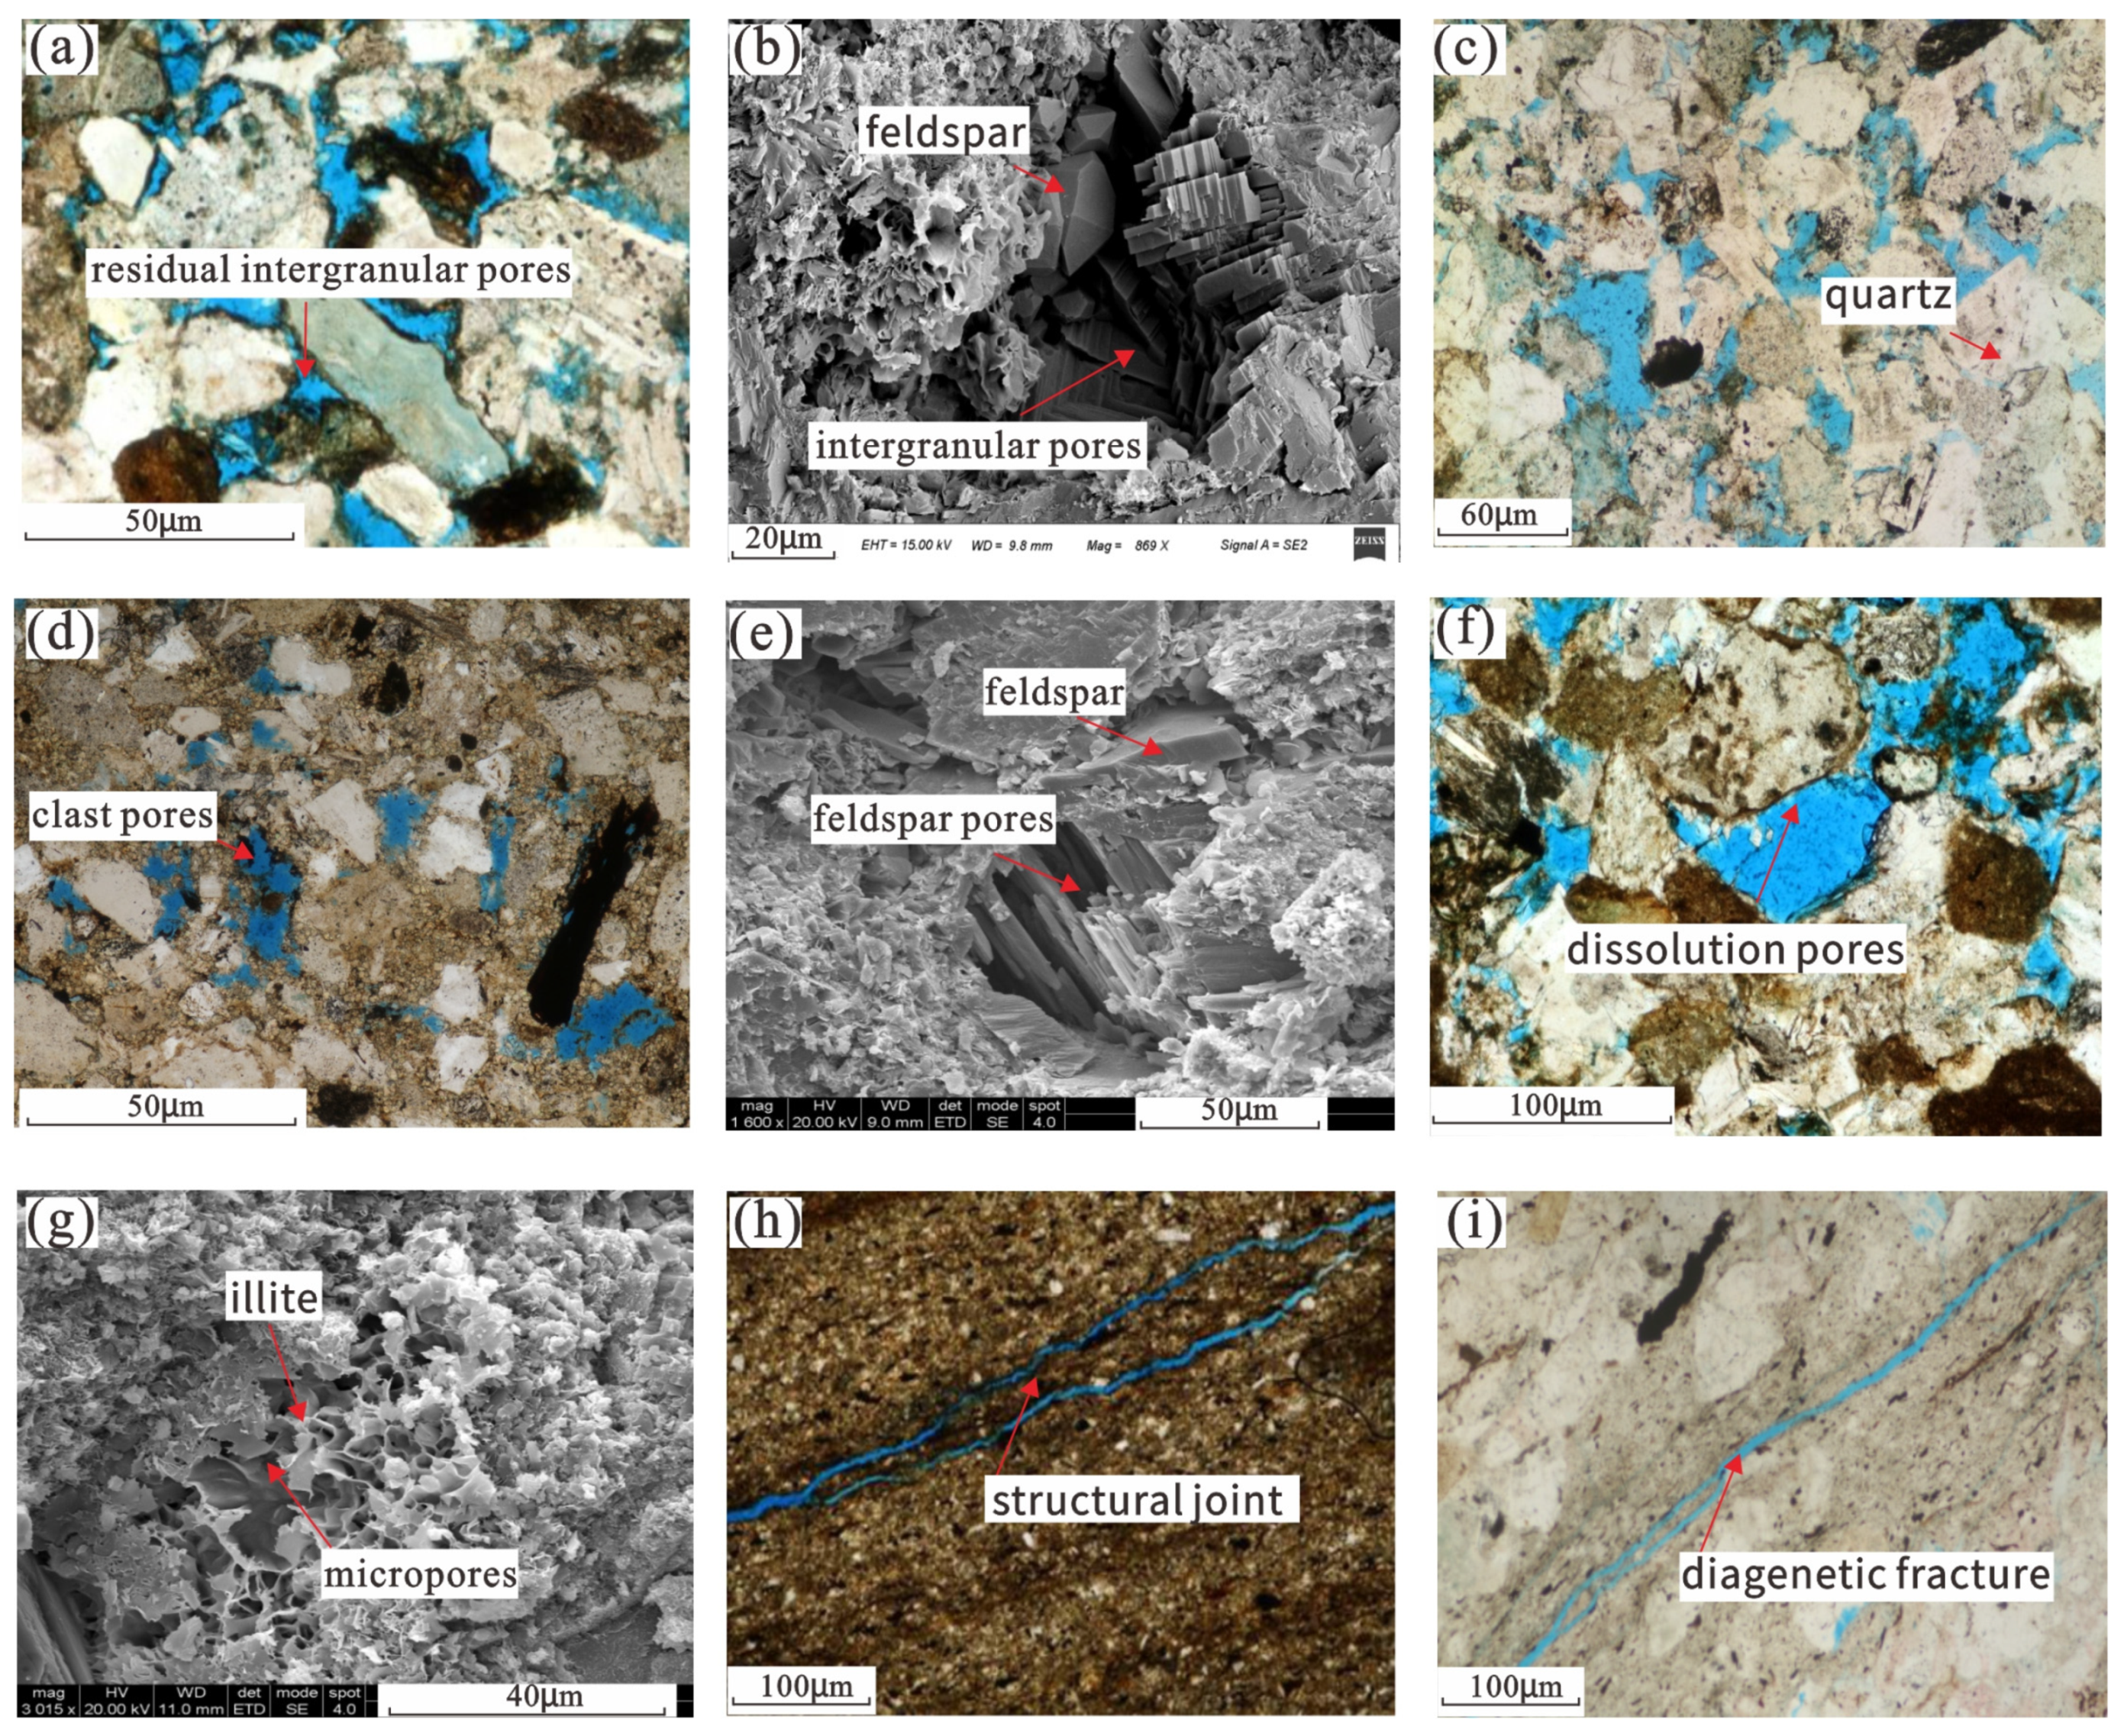
4.3. Types of Reservoir Pore Spaces

Based on routine thin sections, dyed thin sections, and SEM analysis, various types of reservoir pore spaces are developed in the Jiufotang Fm reservoir of Houhe region, including primary intergranular pores, dissolution pores, intercrystalline pores, and microfractures. Dissolution pores are the most important type of reservoir pore spaces in this area.
The primary intergranular pores are predominantly residual intergranular pores (Figure 4a,b) with irregular shapes (e.g., triangular and polygonal), uneven distributions, various pore sizes, and an average surface porosity of 0.42%. Residual intergranular pores are generally defined as pores left behind by the local filling of the original intergranular pores during diagenesis [40,41,42]. Because the lithic clasts in the Jiufotang Fm reservoir are mainly intermediate volcanic rock clasts with a strong degree of shaping, they are easily compacted and exhibit poor original pore retention. Therefore, residual pores after clay mineral filling or carbonate cementation are an important type of reservoir pore space in the study area.
The dissolution pores are mainly intragranular, feldspar, clast, moldic, and intergranular pores (Figure 4c–f) with large pore sizes (generally 10–100 µm) and a surface porosity of 3.07%. Dissolution pores are generally formed by the dissolution of unstable components in reservoirs, and they mainly manifest as the dissolution of mineral grains such as feldspar and lithic clasts as well as the heterogeneous dissolution of carbonate cement [43,44,45]. Dissolution pores are the most developed type of pore in the study area, accounting for >75% of the reservoir pore space; thus, they contributed significantly to the effective porosity of the reservoir.
The intercrystalline pores have a small pore diameter (generally 1.0–5.0 μm) and an average surface porosity of 0.22%. Intercrystalline pores generally refer to pores between mineral microcrystals (Figure 4g) that exist within the infilled material or within grains, including pores formed by the shrinkage of muddy heterogeneous groups of minerals during rock consolidation, intergranular pores formed during clay mineral recrystallization, and intercrystalline pores formed by the dissolution of grains or infilling [46,47,48]. The Jiufotang Fm reservoir in the Houhe region mainly contains intergranular pores between clay minerals such as chlorite, illite–montmorillonite mixed layers, kaolinite, dolomite, and pyrite. These pores have poor connectivity and contribute to the total porosity to a certain extent; however, they have little effect on permeability.
The microfractures are mainly structural joints and diagenetic fractures (Figure 4h,i), with general joint widths of 10–50 μm. They are mostly high-angle or low-angle irregular cracks and often appear in veins. The distribution of microfractures in the reservoir is highly heterogeneous. Fractures make a very small contribution to the pore space; however, the presence of microfractures significantly improves the seepage capacity of a reservoir [49,50].

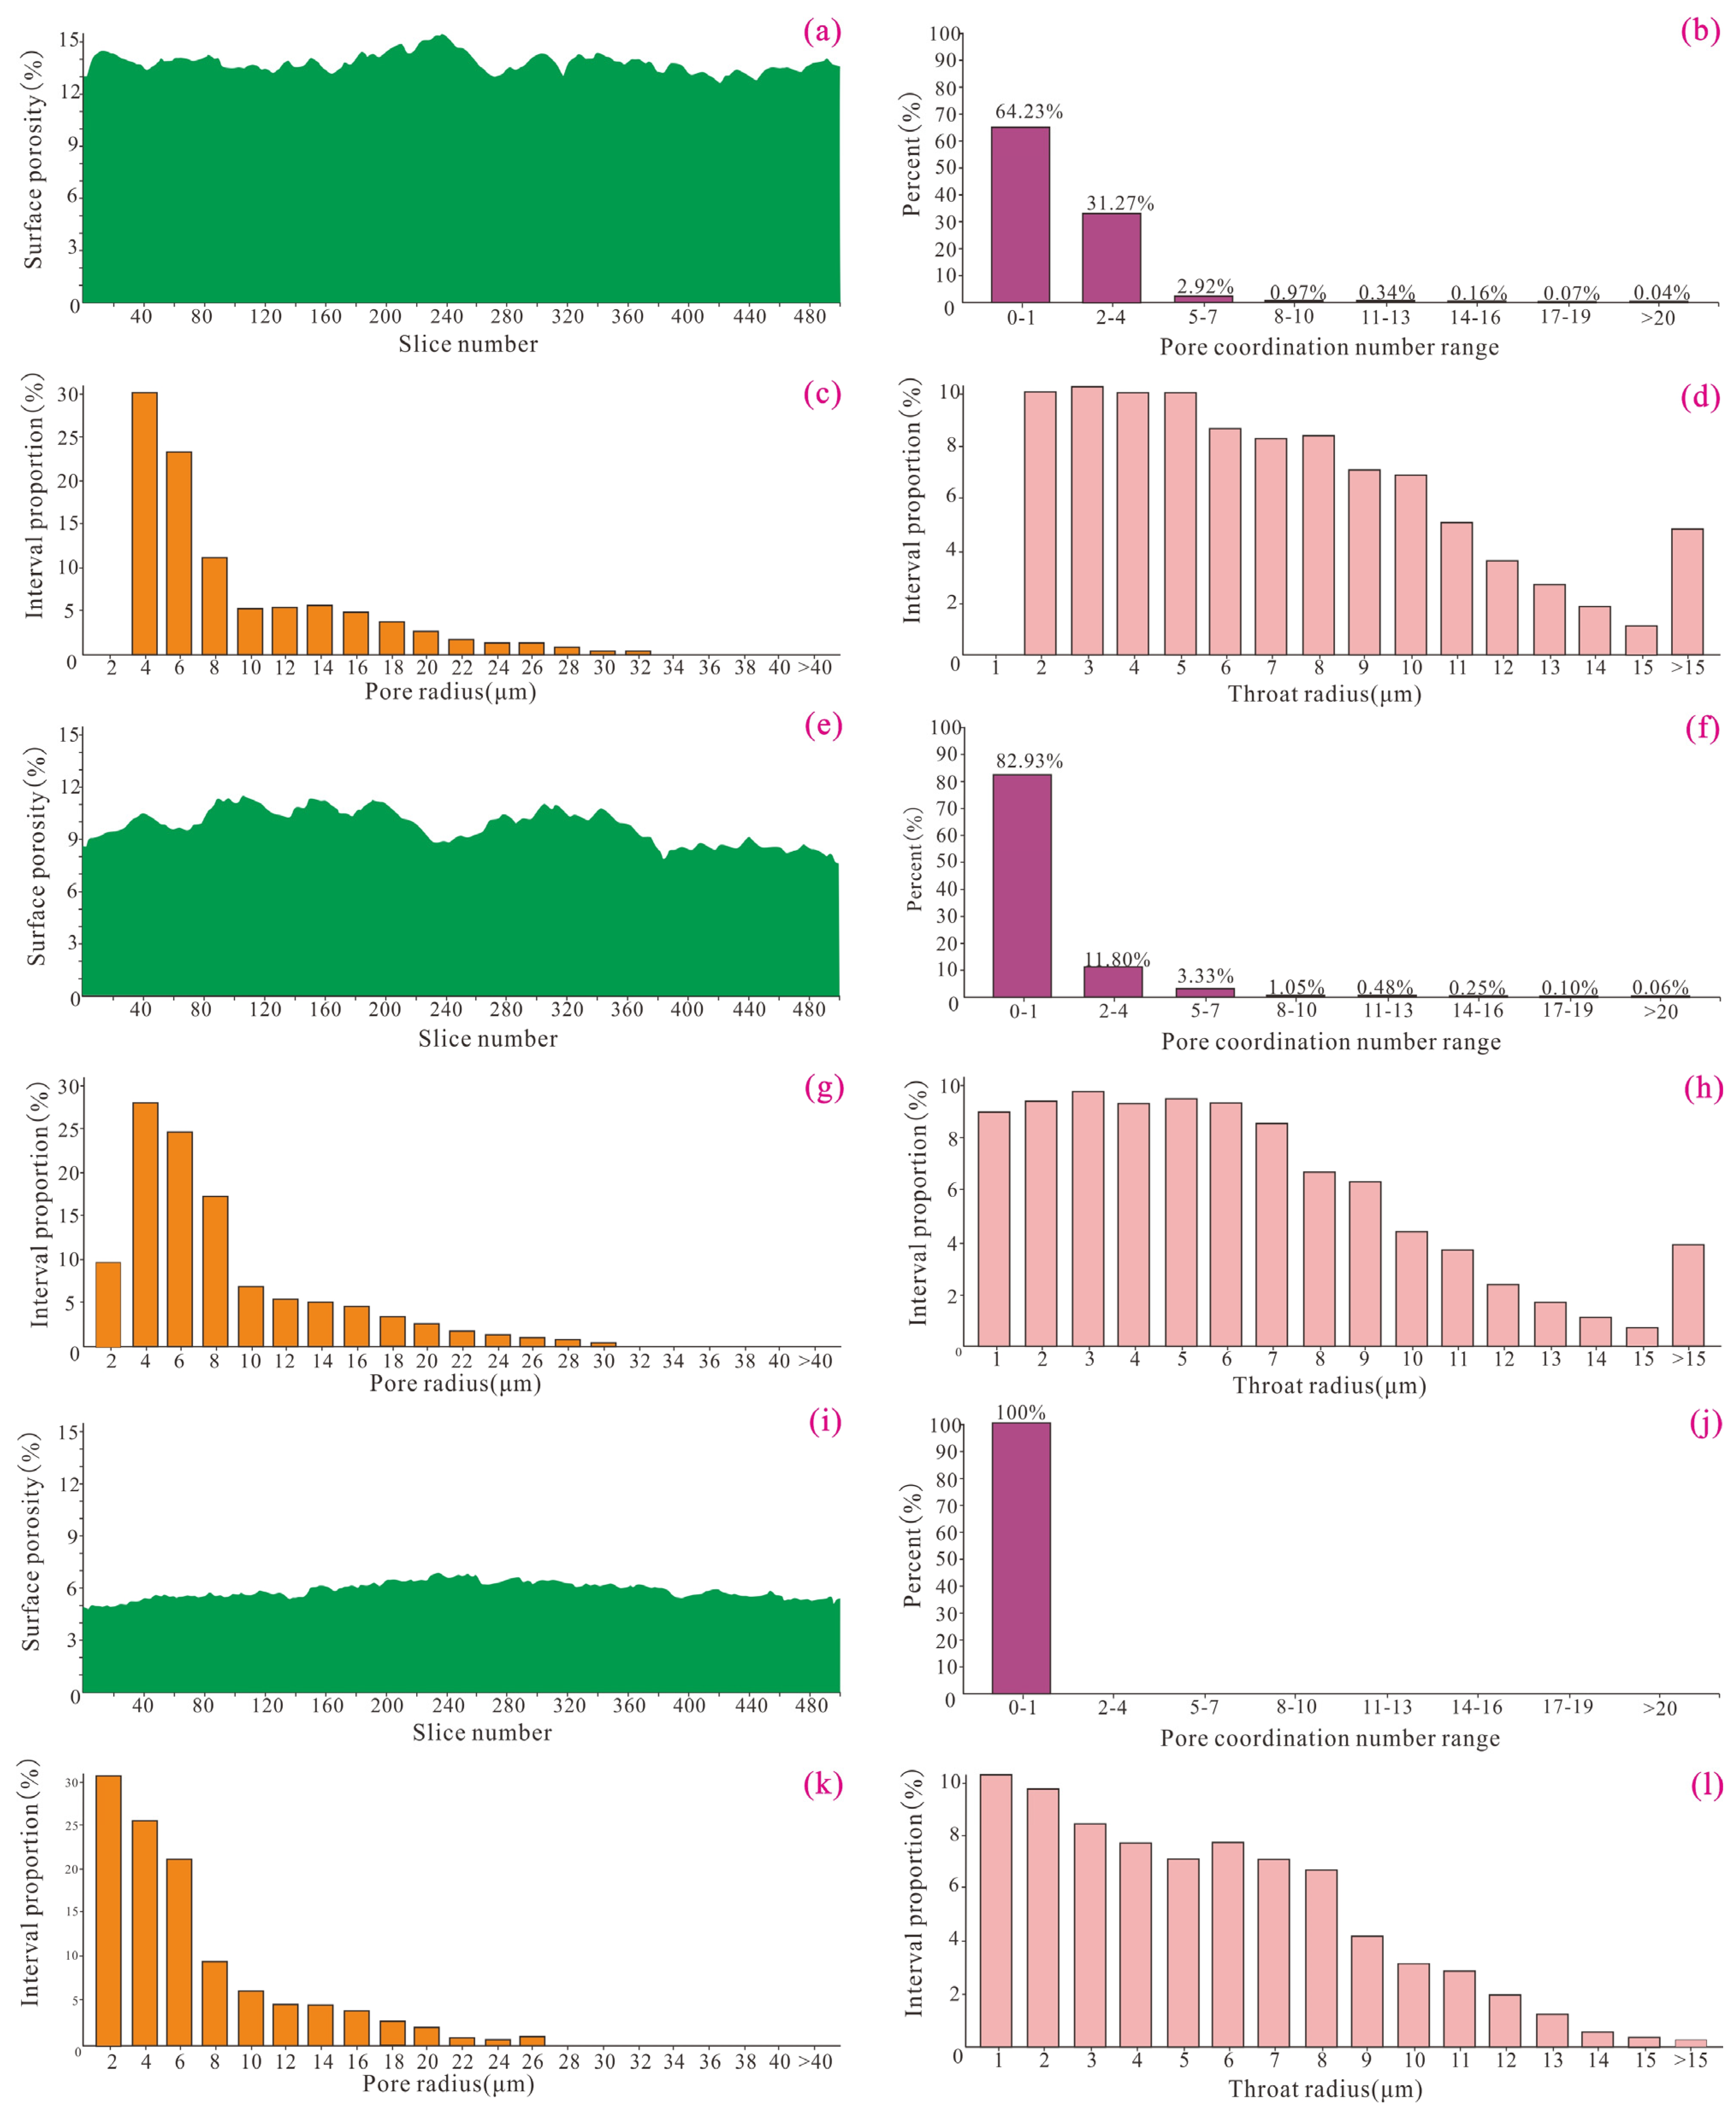
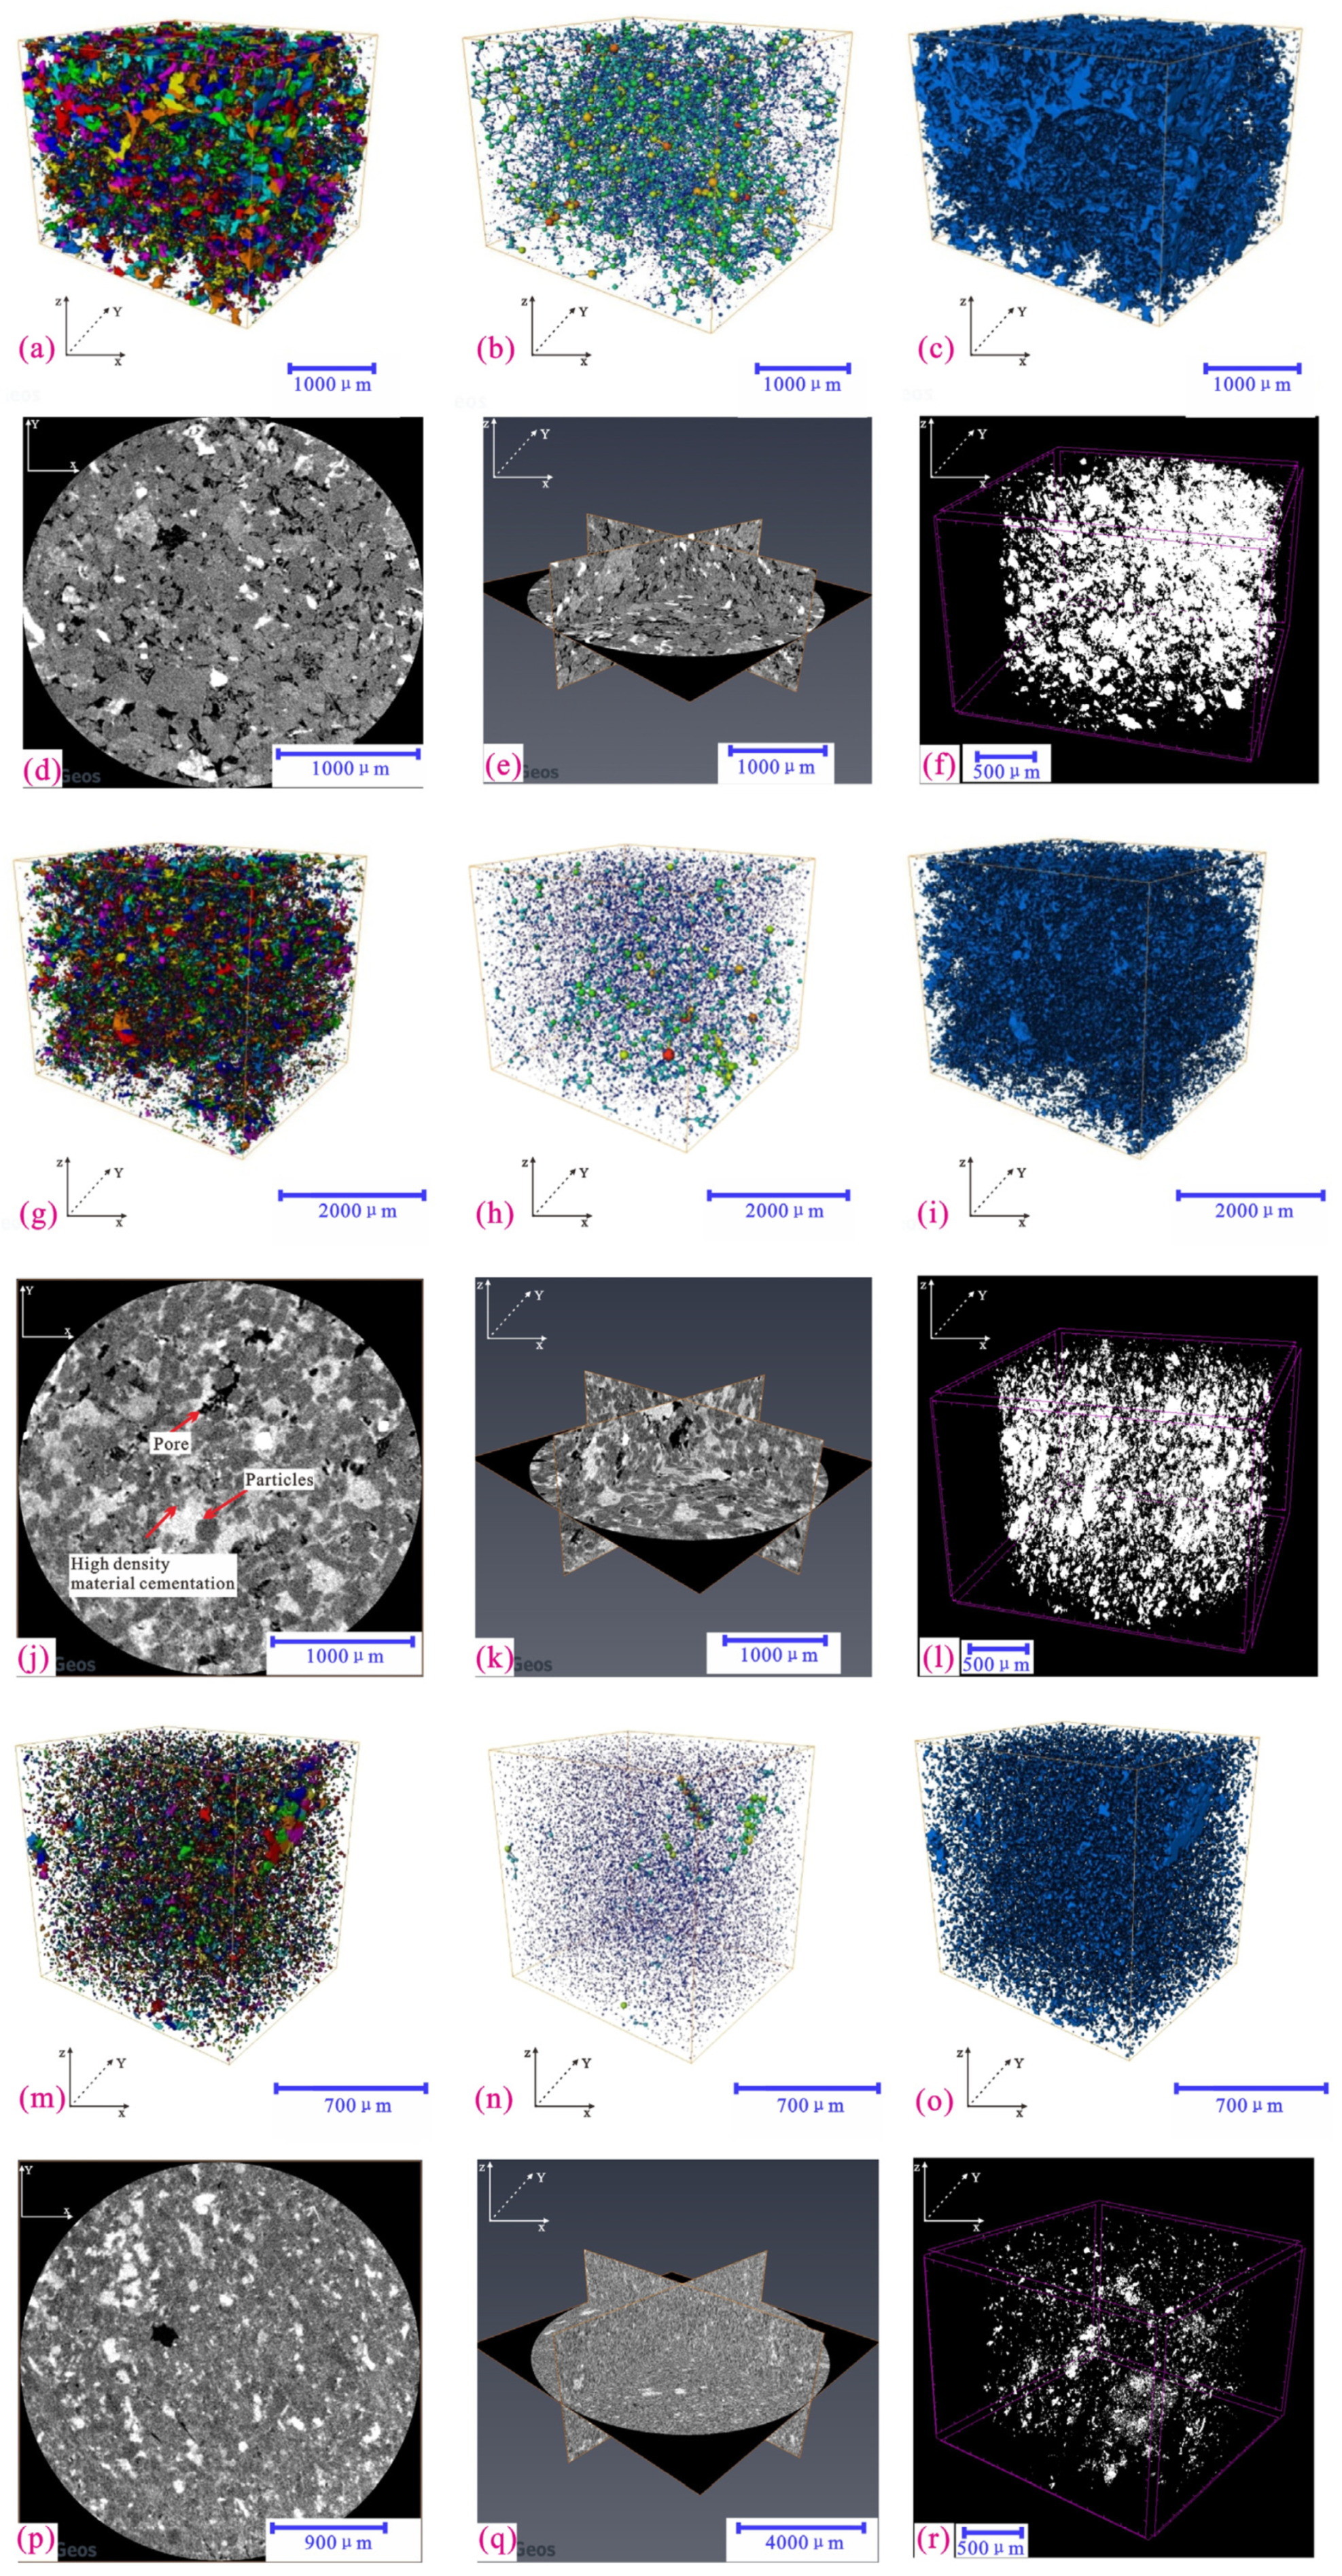
4.4. Characterization of Pore-Throat Structures Based on Micron-Scale CT Scanning

CT scanning is an important technique for the 3-D characterization of unconventional reservoirs, principally through the use of X-rays for the nondestructive testing of rock samples and identification of components and pores according to differences in the penetrative capacity of X-rays in substances of differing densities [51]. The X-ray is concentrated on the sample using an optical lens, magnified by the objective zone plate, and acquired by a charge-coupled element image sensor [52,53]. Phase-locked loop and higher-contrast Zenik phase imaging are added to the back focal plane of the zone plate [54,55]. In this study, 45 samples from the study area were selected for CT scanning, spatial visualization of pore throats, and quantitative analysis of pore-throat structure parameters. The analysis results show that the study area has obvious heterogeneous characteristics, relatively high core compactness, low primary pore development, mainly secondary dissolution pore development, and three types of pore-throat structure characteristics, which are described in detail below.
(1) Well-developed pore-throat structure (Figure 5a–d and Figure 6a–f): The results of the analysis of the CT scan reconstruction of the pore-throat structures revealed that for the samples with a porosity of 14.2% and permeability of 4.52 mD, the pore radii were 2.46–51.98 μm, with an average pore radius of 10.27 μm. In general, the pores with radii of 2–8 μm accounted for 64.70% of the total pores, while those with radii of >10 μm accounted for 26.4%. The throat radii were 0.86–41.73 μm, mainly concentrated within 1–9 μm (accounting for 80.8%), and the average throat radius was 7.31 μm. The general distribution of the surface porosity was 12.63%–15.51%, and the average surface porosity was 13.82%. The pore coordination numbers were concentrated in the range of 0–4, accounting for 95.5% with an average coordination number of 2.08. The pores and pore throats identified via CT scanning were evenly distributed across the samples, and the connectivity of the pore throats was favorable. The effective porosity was high and the more developed pore throats were mainly fine and very fine, with a small quantity of intermediate mesopore throats.
(2) Moderately developed pore-throat structure (Figure 5e–h and Figure 6g–l): For the samples with a porosity of 9.82% and a permeability of 0.2 mD, the pore radii were 1.46–21.82 μm, with an average pore radius of 8.10 μm, and the pore radii were mainly concentrated in the range of 2–8 μm, accounting for 66.61%. The throat radii were generally 0.80–7.95 μm, with an average throat radius of 5.9 μm, and the throat radii were mainly concentrated in the range of 1–5 μm, accounting for 50.19%. The general distribution range of the surface porosities was 7.62%–11.54%, with an average surface porosity of 9.80%. The pore coordination numbers were concentrated in the range of 0–4 (accounting for 94.73%) with an average coordination number of 1.33. The pores and pore throats identified via CT scanning developed locally and in isolation within the sample with medium connectivity between pore throats, medium effective porosity, and moderate development of mainly fine throat sizes in the pore throats.
(3) Underdeveloped pore-throat structure (Figure 5i–l and Figure 6m–r): For the samples with a porosity of 4.72% and a permeability of 0.01 mD, the pore radii were generally 0.76–8.65 μm, with an average pore radius of 4.64 μm. The pore radii were mainly concentrated in the range of 2–6 μm (accounting for 86%), while the >10 μm pores accounted for 1%. The pore-throat radii were generally 0.64–5.85 μm, with an average throat radius of 3.02 μm. The pore-throat radii were mainly concentrated within the range of 1–5 μm, accounting for 83.6%. The general distribution range of the surface porosities was 4.72%–7.1%, with an average surface porosity of 5.84%. The pore coordination numbers were concentrated in the range of 0–2 (accounting for 99.91%) with an average coordination number of 0.11. Pores and pore throats identified via CT scanning developed locally and in isolation. The connectivity between the pores and pore throats was poor, the effective porosity was low, and the throats were not developed, with mainly fine and microporous throats.
Through a comprehensive analysis, it was concluded that the tight oil in the Houhe region is mainly located in micron-level pores and submicron–nanoscale throats. The conventional porosities of the samples were generally 4.72%–17.3%, with an average of 12.27%. The porosities measured via CT were generally 4.85%–16.69%, with an average porosity of 10.72%. The pore radii were generally 1.46–12.27 μm, with an average pore radius of 6.91 μm; and the throat radii were generally 0.86–7.31 μm, with an average throat radius of 5.25 μm. The coordination numbers were generally 0.11–20.08, with an average value of 0.80. The pore-to-throat ratios were generally 1.08–1.71, with an average pore-to-throat ratio of 1.49. Overall, the pore throats had poor connectivity and low effective porosity; therefore, they were classified as small pore-fine throat types.

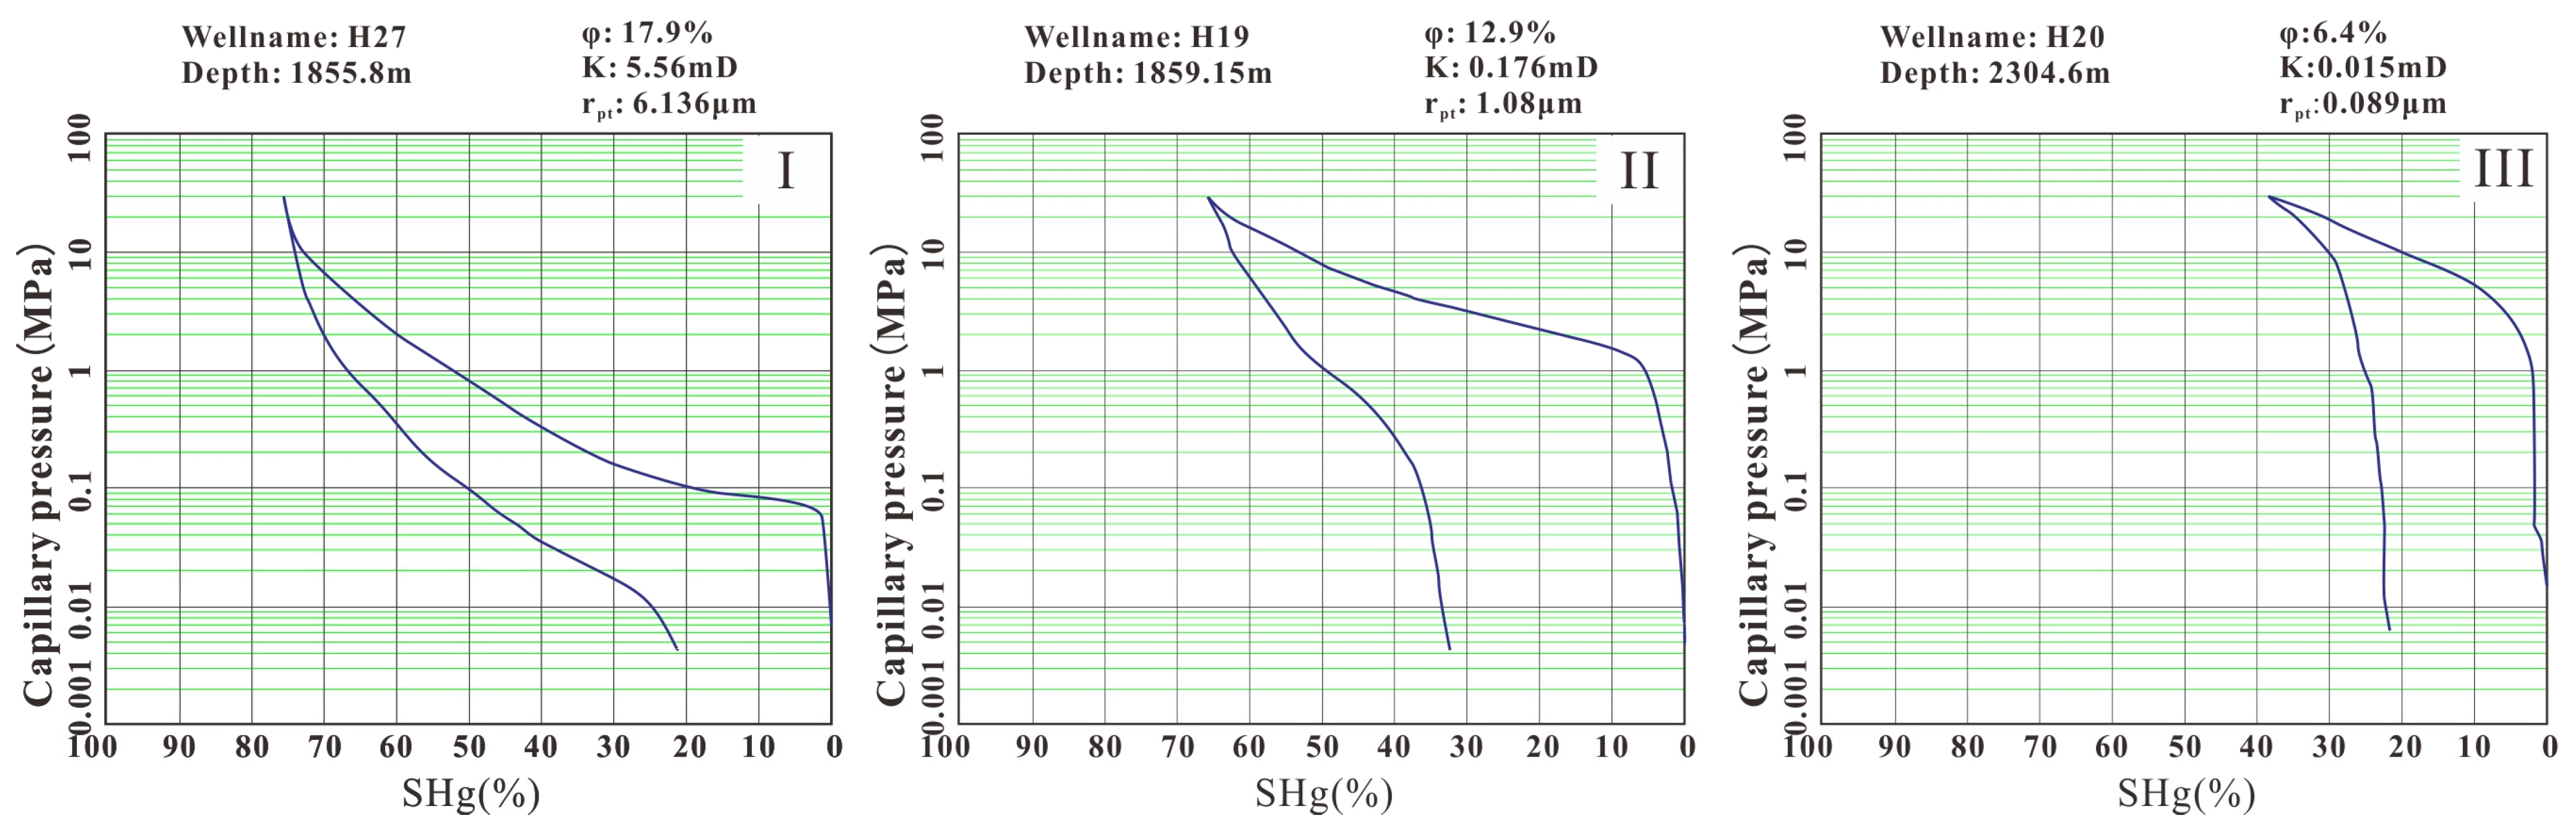
4.5. Pore-Throat Structure Analysis Based on High-Pressure Mercury Intrusion Tests

Reservoir micropore structure refers to the geometry, size, distribution, and connectivity of pores and pore throats in a rock [56,57]. The high-pressure mercury intrusion curve can intuitively reflect the microscopic pore structures in a reservoir, and different capillary pressure curve characteristics represent different pore structure types [58,59] In general, the middle flat section of the mercury pressure curve reflects the pore characteristics of the main rock body, the height of the curve represents the size of the pore throats, while the steep flat section represents the thickness of the throats [60,61]. The more concentrated the distribution of pore size and the better the sorting, the longer is the flat section, the closer it is to a horizontal line the curve, and the larger is the pore radius; the closer the flat section is to the horizontal axis, the smaller is the capillary pressure value [62,63]. The larger the pores, the closer the capillary pressure curve is to the lower-left corner of the plot. By classifying the capillary pressure curves of the 87 samples (Figure 7), the pore structures in the Jiufotang Fm reservoir in the Houhe region were roughly divided into three categories: medium- and small-pore-fine throats (55%), medium-pore-fine throats (25%), and small-to-micropore-micro throats (20%).
The mesopore-fine throat type (I) was represented by the capillary pressure curve for well H27. The reservoir has good sorting and physical properties, with a porosity of 17.9% and a permeability of 5.56 mD. The discharge pressure is low (0.070 MPa), the average radius of the pore throats is 6.136 μm, the maximum saturation mercury injection is 73.24%, and the mercury removal efficiency is 69.97%. This type of curve has a flat section on the capillary pressure curve diagram and is close to the bottom, indicating that the sorting is better, the pore radii are small, and the throat sizes are mainly fine throats, followed by micro-throats and a small quantity of very fine throats. This type of curve represents reservoirs with good pore structure and seepage capacity, most of which are sand units formed in underwater distributary channels at the leading margin of a fan delta.
The small- and medium-pore fine-throat types (II) are represented by the pressure curve of the capillary tube for well H19. The porosity (12.9%) is lower than that of the mesopore-fine throat type and the permeability is 0.176 mD. The discharge pressure of this type of reservoir (1.08 MPa) is higher than that of class I reservoirs, and the average radius of the throats is 1.58 μm. The maximum mercury saturation is 60.59% and the mercury removal efficiency is 53.05%. In the capillary pressure curve, this type of curve is located in the middle section, and there is no flat section. Compared with class I throats, the radii of the pore throats are smaller, and the throats are mainly micro and fine throats. This type of curve represents reservoirs with mesoporous structures and seepage capacities.
The small-to-micropore-micro-throat type (III) is represented by the pressure curve of the capillary tube for well H20. The porosity is low (6.4%), and the permeability is 0.016 mD. The threshold pressure increases more rapidly at 2.021 MPa, the average radius of the throat is 0.068 μm, the maximum mercury saturation is 34.23%, and the mercury removal efficiency is 15.72%. In the capillary pressure curve, this type of curve is located closer to the upper-right corner of the diagram, and there is no flat section. This type has the smallest pore-throat radius, and the throats are mainly micro-throats. This type of curve reflects a dense lithology and low effective porosity.
The capillary pressure curve for the tight oil reservoir in the Jiufotang Fm in the Houhe region is generally steep. The average discharge pressure is 0.23 MPa; it is less than 0.5 MPa in general, and the median pressure is 7.5 MPa on average. Overall, the pore radii are small, and the average pore-throat radius is 1.96 m. The maximum mercury intake saturation is high (generally > 70%), and the mercury removal efficiency is low. These results indicate that the pore-throat size distribution in the study area is not concentrated, and a variety of pore-throat combinations have developed, with poor sorting, fineness and pore-throat connectivity, and strong reservoir heterogeneity.

5. Discussion

5.1. Classification of Pore-Throat Structures in the Tight Oil Reservoir

In order to classify the microscopic pore structure of the tight oil reservoir in the Jiufotang Fm in the study area, 156 groups of samples from the study area were selected for mercury pressure, thin section identification, and CT analyses, and multiple parameters were measured for each group of samples, including the porosity (φ), permeability (K), mean pore-throat radius (R), coefficient of variation (VG), skewness coefficient (Sk), maximum mercury saturation (SHgmax), median pressure (P50), discharge pressure (Pd), and average coordination number (Cn). SPSS software (26.0) was used to classify the microscopic pore structure of the reservoir in the study area via factor and k-means clustering analyses.
The k-means clustering method is based on the analysis of variance principle [64,65]. The principle is that the distance between the sample and the center of the cluster should be within a certain threshold as a criterion for data object classification [66,67]. That is, the smaller the distance between the same type of pore-throat structure parameter and the cluster center, the smaller is the characteristic difference in the group of samples, and the more likely it is that the samples will be classified as the same type [68,69].
First, factor analysis was performed on 156 selected sets of sample data, and Pearson correlation coefficients were obtained to create a correlation factor matrix for the nine parameters (Table 1). According to the data analysis presented in Table 1, the different parameters are well correlated with the porosity (φ) and permeability (K); three parameters (correlation factor > 0.70) have good correlations with the porosity (φ) or permeability (K), namely, the coefficient of variation (VG), skewness coefficient (Sk), and mean pore-throat radius (R). Based on this, the porosity (φ), permeability (K), and three selected parameters were used as the variables for the k-means clustering analysis. The 156 samples were clustered using SPSS software. According to the analysis results and the CT scanning and high-pressure mercury intrusion analysis results, the pore-throat structures of the tight oil reservoir in the Jiufotang Fm in the study area were divided into three categories: classes I, II, and III (Table 2). The detailed parameters and characteristics are listed in Table 2.
Class I has a well-developed pore-throat structure and is mostly composed of mesopores and fine throats. It has an average porosity of 12.6%, average permeability of 2.81 mD, average coefficient of variation of 0.82, average skewness of 2.44, and average pore-throat radius of 12.75 μm.
Class II has moderate pore-throat development and is mostly composed of small- and medium-sized fine pore throats. It has an average porosity of 8.75%, an average permeability of 0.30 mD, an average coefficient of variation of 1.19, an average skewness of 1.31, and average pore-throat radius of 7.63 μm.
Class III exhibits a good pore structure. It has an average porosity of 3.8%, average permeability of 0.08 mD, average coefficient of variation of 2.27, average skewness of 0.87, and average pore-throat radius of 3.86 μm.
These pore-throat classification standards have been widely used in the evaluation and development of tight oil reservoirs in the Liaohe Oilfield. Testing confirmed that this classification standard has a high agreement rate with actual reservoirs. Because the pore-throat structure of a tight oil reservoir determines its oil content, reservoirs with class I pore throats are relatively well developed. The connectivity is relatively good, and the display of oil and gas in oil spots is the main focus of actual drilling. Reservoirs with class II pore throats are moderately developed and show moderate connectivity. Oil and gas mainly occur as oil spots and traces, respectively. Reservoirs with class III pore throats have the poorest pore-throat development and oil and gas display, most of which are characterized by fluorescence or no display. The reservoirs in the study area are mainly composed of class II reservoirs, which are widely distributed within the Houhe region, accounting for 58%. The development of other reservoir classes is relatively limited, and their distributional range is also relatively limited.

5.2. Analysis of Factors Controlling Tight Oil Reservoirs

Sedimentation and diagenesis are considered the main influencing factors controlling the pore-throat structure of tight oil reservoirs [67,68,69]. The former controls the type, combination, and arrangement of sedimentary particles and macroscopically controls the pore-throat structure of tight oil reservoirs. The latter directly controls the pore-throat structure of tight oil reservoirs by changing the composition and arrangement direction of the primary minerals. Long-term exploration has shown that tectonic movements can not only indirectly control pore-throat structures by influencing diagenesis, but also directly transform local pore-throat structures through the formation of microcracks, intercrystalline pores, and other pathways.

5.2.1. Depositional Environment

The depositional environment determines the basic characteristics of sediments, such as the composition, particle size, sorting, and rounding, as well as the initial appearance of the pore structure [70]. Sediments formed under different hydrodynamic conditions exhibited different structures and lithological compositions. More explicitly, sand units with different sedimentary microfacies generally have different pore-throat structural characteristics [71,72].
However, the sedimentary microfacies of the tight oil reservoir in the Jiufotang Fm in the Houhe area are underwater distributary channels in front of the fan delta with a single facies belt and relatively similar hydrodynamic conditions. Therefore, the sedimentary environment has a certain primary controlling effect on the differences in the pore-throat structure, but it is not the main cause. Some subtle spatial differences may reflect the overall trend of sedimentary control over the pore-throat structure: (1) the porosity and permeability of proximal sandstones are often higher, generally dominated by mesopores and fine throats (such as H27 well), while the porosity and permeability of sandstones deposited at the end of underwater distributary channels are often lower, generally dominated by small pores and fine throats (such as H20 well); (2) the frequency of primary intergranular pores and lithic dissolution pores developed in the proximal sandstone is often relatively higher. The frequency of intragranular dissolution pores developed in the sandstone at the end of underwater distributary channels is relatively high.
These phenomena reflect the basic control effect of sedimentation on pore-throat structure. The hydrodynamic conditions of the underwater distributary channel near the source area of the fan delta front are relatively high, and the sandstone deposited in the near-end environment has strong sorting and roundness. At the end of the underwater distributary channel, owing to the weakening of hydrodynamic forces, the proportion of muddy sediment increases, and the porosity and permeability decrease. In addition, changes in the hydrodynamic conditions lead to a relatively cleaner end environment for underwater distributary channels, which is conducive to the deposition of carbonate minerals. The cementation of minerals such as calcite directly controls the pore-throat structure of sandstone, determining the differences in storage space types in different regions.

5.2.2. Diagenesis

Diagenesis involves compaction, cementation, and dissolution [48,73]. Since sediments enter the burial stage, a series of pore water-rock chemical reactions occur over a long geological history, leading to a significant impact on reservoir diagenesis. Generally, compaction determines the contact relationships between the particles and the original sizes and connectivity of the pores and throats, whereas cementation and dissolution alter the sizes and connectivity of the pores and throats to a certain extent [3]. After the sediment enters the burial environment, a series of pore water-rock chemical reactions occur over a long geological period; thus, diagenesis has a great influence on the tight oil reservoir [4].
The extensive development of residual intergranular pores in tight oil reservoirs indicates that mechanical compaction is common in the Houhe region for the transformation of the Jiufotang Fm. The destructive effect of mechanical compaction on the pores is irreversible, leading to a closer arrangement of clast grains, compression of the intergranular pores, narrowing of the pore throats, and transformation of the pores from large and medium pores to small and intercrystalline pores. The thick- and medium-sized pore throats are transformed into fine pore throats, and the particle contact relationships change from tangentially long contacts to line-sutured contacts, preventing the development of primary intergranular pores and forming large quantities of residual intergranular pores. This is the main reason for the formation of residual intergranular pores in the Jiufotang Fm reservoir in the Houhe region [1,2].
Diagenesis, which is conducive to the pore-throat structure of tight oil reservoirs, also includes dissolution. The widely developed intergranular dissolution pores, intragranular strip-shaped, honeycomb-shaped, grid-shaped dissolution pores, mold-shaped dissolution pores, and rock debris dissolution pores in the Jiufotang Fm in the study area indicate that dissolution is also the main factor controlling the pore-throat structure of tight oil reservoirs. The Jiufotang tight oil reservoir in the Houhe region has high feldspar and lithic clast contents, providing a material basis for dissolution. When the source rock matures and begins to generate hydrocarbons to form oil and gas, the organic matter undergoes decarboxylation to produce a quantity of organic acids and carbon dioxide, which increases the acidity of the formation water [64]. When acidic water flows into the pores, some minerals such as feldspar and lithic clasts that can be dissolved will produce secondary pores [67]. Feldspar is usually selectively dissolved along its cleavage planes or along both the crystal and fracture surfaces to form intragranular cleavage-type, honeycomb-shaped, fenestral-shaped, or moldic pores [63]. Larger feldspar particles and continuous carbonate cement in the reservoir are more likely to form large seepage channels such as dissolution fractures, which improve the seepage capacity of the tight oil reservoir [59]. According to previous studies, dissolution can produce a porosity of 11.91% in 1 mol of potassium feldspar, indicating that the dissolution of feldspar has a major effect on the improvement of the reservoir pore space. The dissolution of lithic clasts mainly involves the selective dissolution of unstable minerals in the lithic clasts to form intragranular pores, and all particles are dissolved to form clastic or moldic pores. The dissolution of the interstitial material and cement is mainly due to early material being dissolved by new solution [74].
However, not all diagenetic processes are favorable for the development of pore-throat structures in tight oil reservoirs. Widespread cementation within the study area severely limits the porosity and permeability characteristics of the tight oil reservoirs. From the perspective of mineral composition, the cement types in the Jiufotang Fm reservoir in the Houhe region were mainly chlorite (22.7%), calcite (9.5%), and zeolite (3.6%), and the occurrence of these three types of cementation may be interrelated. There are two main pathways for the formation of calcite: (1) when the rock formation is buried at a shallow depth and the formation water is alkaline, calcite easily precipitates in the pores; (2) when affected by volcanic material alteration, the hydrolysis of volcanic glass to form zeolite (volcanic glass → clinoptilolite → zeolite) can release calcium ions, and the excess calcium ions favor the precipitation of calcite. In pathway (2), volcanic materials also form iron–magnesium substances during hydrolysis, which provide an Fe-rich material source for the formation of chlorite. In addition, koalinite is transformed into chlorite under alkaline conditions. Because the cement, either calite or pompon-shaped chlorite cement, occupies the pore space, significant alteration of the pore morphology occurs; the pore morphology is irregular, and the infilling of the pores blocks the pore throats. Therefore, the seepage capacity of a reservoir decreases with increasing cement content [59,65,75].
Overall, diagenesis has two contrasting effects on the pore-throat structure of tight oil reservoirs. Compaction and cementation are not conducive to pore-throat development in tight oil reservoirs and mainly occur during the burial stage. However, dissolution is conducive to pore development in tight oil reservoirs and occurs throughout the diagenetic processes. Therefore, late-stage diagenesis has an important positive effect on improving reservoir properties.

5.2.3. Tectonic Activity

Tectonic activity has a dual effect on pore structures in reservoirs. Initially, tectonic activity causes further compaction of the reservoir, increasing its compaction strength [76,77]. Subsequently, the tectonic activity causes rock fracturing and increases the permeability of the reservoir. Although the tight oil reservoir in the Jiufotang Fm in the Houhe region experienced multiphase tectonic activity, core analysis showed that microfractures were not developed. The analysis results indicate that this may be due to the high content of soft lithic clasts in the tight reservoir. Therefore, the tectonic movement only led to further compaction of the reservoir and did not lead to the formation of a large quantity of microfractures.
Interestingly, from the physical and spatial characteristics of reservoirs in H20, H19, and H27, the pore-throat scales of the strata closer to the fault are smaller, and the reservoir properties become worse (Figure 8). The influence of carbonate cementation near fault zones on reservoir properties may be the main reason for this situation [41,42,78,79], reflecting another controlling effect of tectonic movement on reservoir properties; that is, the spatial distribution in the fault affects the surrounding cementation and other diagenesis [78,79,80] and fundamentally controls the differences in reservoir properties in three dimensions.

6. Conclusions

The tight oil reservoir in the Jiufotang Fm in the Houhe region has high feldspar and lithic clast contents, and the rock types are feldspathic sandstone and lithic arkosic sandstone. Various pore types of reservoir spaces are developed, including residual intergranular pores, dissolution pores, intercrystalline pores, and microfractures, among which feldspar pores and lithic clast pores are the most important reservoir pore spaces in this area. According to the results of experimental analyses, such as CT scanning and high-pressure mercury intrusion analysis of samples from the tight oil reservoir, as well as analysis methods, such as K-means clustering, the following conclusions can be drawn:
(1) The pores in the tight oil reservoir in the Jiufotang Fm in the study area are generally at the micron level, and the pore throats are often submicron to nanoscale. Reservoir permeability is mainly controlled by the pore-throat radius, and micropore-throat development is the main reason for low reservoir permeability. The diversity and heterogeneity of reservoir pore structures are the main factors leading to strong reservoir heterogeneity.
(2) Tight oil reservoirs in the study area were divided into three categories: classes I, II, and III. The study area is dominated by class II, accounting for 58% of the total area. The reservoir performances and seepage capacities of the regions with class I and II pore throats were relatively high. In tight oil reservoirs, they represent favorable sweet spots.
(3) Tectonic activity, depositional environment, and diagenesis have a significant impact on the pore-throat structures in tight oil reservoirs in the study area. It was concluded that tectonic activity had two contrasting influences, and the depositional environment was not the main controlling factor in this area. The most important controlling factor is diagenesis, particularly dissolution, which has a positive effect on the physical properties and seepage of reservoirs.

Author Contributions

Writing—original draft preparation, G.Z.; writing—review and editing, C.M. All authors have read and agreed to the published version of the manuscript.

Funding

This work was funded by the National Nature Science Foundation of China (42472217) and the Major Science and Technology Project of CNPC (No. 2017E-1603).

Data Availability Statement

Data are contained within the article.

Acknowledgments

We are grateful for the data provided by E&D Research Institute of the CNPC Liaohe Petroleum and Beijing Runze Innovation Co., Ltd.

Conflicts of Interest

Author Guolong Zhang was employed by the company Liaohe Oilfield Company. The remaining author declares that the research was conducted in the absence of any commercial or financial relationships that could be construed as a potential conflict of interest.

References

  1. Liu, Y.; Lu, Z.; Feng, M.; Wang, J.; Tian, T.; Chao, J. Micro-pore Characteristics of Shale Oil Reservoirs of the Shahejie Formation in the Dongying Sag, Bohai Bay Basin. Acta Geol. Sin. 2017, 31, 629–644. [Google Scholar]
  2. Yang, Y.; Xiao, W.; Zheng, L.; Lei, Q.; Qin, C.; He, Y.; Liu, S.; Li, M.; Li, Y.; Zhao, J.; et al. Pore throat structure heterogeneity and its effect on gas-phase seepage capacity in tight sandstone reservoirs: A case study from the Triassic Yanchang Formation, Ordos Basin. Petrol. Sci. 2023, 20, 2892–2907. [Google Scholar] [CrossRef]
  3. Du, M.; Yang, Z.; Yang, S.; Feng, C.; Wang, G.; Jia, N.; Li, H.; Shi, X. Study on the Quantitative Characterization and Heterogeneity of Pore Structure in Deep Ultra-High Pressure Tight Glutenite Reservoirs. Minerals 2023, 13, 601. [Google Scholar] [CrossRef]
  4. Wu, S.; Zhu, R.; Li, X.; Jin, X.; Yang, Z.; Mao, Z. Evaluation and Application of Porous Structure Characterization Technologies in Unconventional Tight Reservoirs. Earth Sci. Front. 2018, 25, 191–203, (In Chinese with English Abstract). [Google Scholar]
  5. Zhang, X.; Ma, F.; Wang, H.; Wang, K.; Li, W.; Qin, Y. Accumulation Laws of Recoverable Resources in Typical Tight Oil Zones in North America. China Petrol. Explor. 2018, 4, 58–66. [Google Scholar]
  6. Deaf, A.S.; Tahoun, S.S. Integrated Palynological, Organic Geochemical, and Sequence Stratigraphic Analyses of the Middle to Upper Cenomanian Hydrocarbon Reservoir/Source Abu Roash “G” Member: A Depositional Model in Northwestern Egypt. Mar. Petrol. Geol. 2018, 92, 372–402. [Google Scholar] [CrossRef]
  7. Atwah, I.; Mohammadi, S.; Moldowan, J.M.; Dahl, J.E.P. Episodic Hydrocarbon Charge in Tight Mississippian Reservoirs of Central Oklahoma, USA: Insights from Oil Inclusion Geochemistry. Mar. Petrol. Geol. 2021, 123, 104742. [Google Scholar] [CrossRef]
  8. Wilkinson, W.M. Fracturing in Spraberry Reservoir, West Texas. AAPG Bull. 1952, 2, 250–265. [Google Scholar]
  9. Hu, Q.; Quintero, R.P.; El-Sobky, H.F.; Kang, J.; Zhang, T. Coupled Nano-petrophysical and Organic-Geochemical Study of the Wolfberry Play in Howard County, Texas USA. Mar. Petrol. Geol. 2020, 122, 104663. [Google Scholar] [CrossRef]
  10. Sonnenberg, S.A. The Bakken–Three Forks Super Giant Play, Williston Basin. AAPG Bull. 2020, 104, 2557–2601. [Google Scholar] [CrossRef]
  11. Lindsay, R.F. Madison Group (Mississippian) Reservoir Facies of Williston Basin, North Dakota. AAPG Bull. 1985, 2, 279–280. [Google Scholar] [CrossRef]
  12. Roth, K.W. Development in the Nesson Anticline Area, North Dakota. AAPG Bull. 1953, 11, 2616. [Google Scholar]
  13. Abdi, Z.; Rimmer, S.M.; Rowe, H.D.; Nordeng, S. Controls on Organic Matter Accumulation in the Bakken Formation, Williston Basin, USA. Chem. Geol. 2021, 586, 120588. [Google Scholar] [CrossRef]
  14. Sonnenberg, S.A.; Theloy, C.; Jin, H.; Jia, B.; Tsau, J.S.; Barati, R.; Jia, B.; Tsau, J.S.; Barati, R.; Temizel, C.; et al. The Giant Continuous Oil Accumulation in the Bakken Petroleum System, U.S. Williston Basin. AAPG Mem. 2017, 113, 91–119. [Google Scholar]
  15. Zhong, J.; Alibakhshi, M.A.; Xie, Q.; Riordon, J.; Xu, Y.; Duan, C.; Sinton, D. Exploring Anomalous Fluid Behavior at the Nanoscale: Direct Visualization and Quantification via Nanofluidic Devices. Acc. Chem. Res. 2020, 53, 347–357. [Google Scholar] [CrossRef]
  16. Hu, X.; Wang, J.; Zhang, L.; Xiong, H.; Wang, Z.; Duan, H.; Yao, J.; Sun, H.; Zhang, L.; Song, W.; et al. Direct Visualization of Nanoscale Salt Precipitation and Dissolution Dynamics during CO2 Injection. Energies 2022, 15, 9567. [Google Scholar] [CrossRef]
  17. Zhong, J.; Duan, H.; Wang, J.; Ma, B.; Sun, Z.; Yao, J. Simulation of Water Self-Imbibition in Nanometer Throat-Pore Structure Filled with Oil. Geoenergy Sci. Eng. 2023, 221, 211370. [Google Scholar] [CrossRef]
  18. Yao, J.; Ding, Y.; Sun, H.; Fan, D.; Wang, M.; Jia, C. Productivity Analysis of Fractured Horizontal Wells in Tight Gas Reservoirs Using a Gas-Water Two-Phase Flow Model with Consideration of a Threshold Pressure Gradient. Energy Fuels 2023, 37, 8190–8198. [Google Scholar] [CrossRef]
  19. Wang, Z.; Liu, T.; Liu, S.; Jia, C.; Yao, J.; Sun, H.; Yang, Y.; Zhang, L.; Delshad, M.; Sepehrnoori, K.; et al. Adsorption Effects on CO2-Oil Minimum Miscibility Pressure in Tight Reservoirs. Energy 2024, 288, 129815. [Google Scholar] [CrossRef]
  20. Bjørlykke, K. Relationships between Depositional Environments, Burial History and Rock Properties. Some Principal Aspects of Diagenetic Process in Sedimentary Basins. Sediment. Geol. 2014, 301, 1–14. [Google Scholar] [CrossRef]
  21. Li, G.; Lei, Z.; Dong, W.; Wang, H.; Zheng, X.; Tan, J. Progress, Challenges and Prospects of Unconventional Oil and Gas Development of CNPC. China Petrol. Explor. 2022, 27, 1–11. [Google Scholar]
  22. Cai, L.; Xiao, G.; Lu, S.; Wang, J.; Wu, Z. Spatial-Temporal Coupling between High-Quality Source Rocks and Reservoirs for Tight Sandstone Oil and Gas Accumulations in the Songliao Basin, China. Int. J. Min. Sci. Technol. 2019, 29, 387–397. [Google Scholar] [CrossRef]
  23. Wang, R.; Tang, Y. Study on the Rock Physical Mechanical Properties Evaluation of Tight Oil Reservoir in Chang 7 Member, Longdong Area, Ordos Basin, China. Front. Earth Sci. 2024, 12, 1342561. [Google Scholar] [CrossRef]
  24. Peng, Y.; Zhang, H.; Zheng, X.; Wang, Y.; Li, J.; Zhu, Y.; Doolen, Q. Sedimentary Facies Evaluation of Tight Oil Reservoirs of Yanchang Formation in the Ordos Basin. J. Chem. 2023, 2023, 1–11. [Google Scholar] [CrossRef]
  25. Zhao, W.B.; Hu, S.Y.; Deng, X.Q.; Bai, B.; Tao, S.Z.; Sun, B.; Wang, Q.R.; Cheng, D.X. Physical Property and Hydrocarbon Enrichment Characteristics of Tight Oil Reservoir in Chang 7 Division of Yanchang Formation, Xin’anbian Oilfield, Ordos Basin, China. Petrol. Sci. 2021, 18, 1294–1304. [Google Scholar] [CrossRef]
  26. Zhao, X.; Yang, Z.; Zhou, S.; Luo, Y.; Liu, X.; Zhang, Y.; Lin, W.; Xiao, Q.; Niu, Z. Research on Characterization and Heterogeneity of Microscopic Pore Throat Structures in Tight Oil Reservoirs. ACS Omega 2021, 6, 24672–24682. [Google Scholar] [CrossRef] [PubMed]
  27. Wang, Z.; Ge, H.; Wei, Y.; Wang, Y.; Jia, K.; Xu, N.; Zhang, Y.; Du, S. Characterizing the Microscopic Anisotropic Permeabilities of Tight Oil Reservoirs Impacted by Heterogeneous. Miner. Energ. 2022, 15, 6552. [Google Scholar] [CrossRef]
  28. Li, Y.; Yang, K.; Wang, S.; Ye, Z.; Yang, J. Oil shale enrichment mechanisms in the Lower Cretaceous Jiufotang Formation from the Ludong sag, Songliao Basin, Northeast China. Mar. Petrol. Geol. 2024, 167, 106984. [Google Scholar] [CrossRef]
  29. Aliakbardoust, E.; Rahimpour-Bonab, H. Effects of pore geometry and rock properties on water saturation of a carbonate reservoir. Pet. Sci. Eng. 2013, 112, 296–309. [Google Scholar] [CrossRef]
  30. Thota, S.T.; Islam, M.A.; Shalaby, M.R. Reservoir quality evaluation using sedimentological and petrophysical characterization of deep-water turbidites: A case study of Tariki Sandstone Member, Taranaki Basin, New Zealand. Energy Geosci. 2022, 4, 13–32. [Google Scholar] [CrossRef]
  31. Tian, H.; He, K.; Huangfu, Y.; Liao, F.; Wang, X.; Zhang, S. Oil content and mobility in a shale reservoir in Songliao Basin, Northeast China: Insights from combined solvent extraction and NMR methods. Fuel 2024, 357, 129678. [Google Scholar] [CrossRef]
  32. Zou, C.; Zhu, R.; Liu, K.; Su, L.; Bai, B.; Zhang, X.; Yuan, X.; Wang, J. Tight gas sandstone reservoirs in China: Characteristics and recognition criteria. Pet. Sci. Eng. 2012, 88, 82–91. [Google Scholar] [CrossRef]
  33. Liu, M.; Xie, Q.; Liu, Z.; Sun, J.; Ran, B.; Bai, L. Sequence stratigraphic framework and sedimentary facies prediction of the Jiufotang and Shahai Formations of Lower Cretaceous in Ludong Sag, Kailu Basin, Inner Mongolia. J. Palaeogeogr. 2012, 14, 733–746. [Google Scholar] [CrossRef]
  34. Zou, C.; Yang, Z.; Sun, S.; Zhao, Q.; Bai, W.; Liu, H.; Pan, S.; Wu, S.; Yuan, Y. “Exploring petroleum inside source kitchen”: Shale oil and gas in Sichuan Basin. Sci. China Earth Sci. 2020, 63, 934–953. [Google Scholar] [CrossRef]
  35. Sun, M.; Zhang, L.; Hu, Q.; Pan, Z.; Yu, B.; Sun, L.; Bai, L.; Fu, H.; Zhang, Y.; Zhang, C.; et al. Multiscale Connectivity Characterization of Marine Shales in Southern China by Fluid Intrusion, Small-Angle Neutron Scattering (SANS), and FIB-SEM. Mar. Petrol. Geol. 2020, 112, 104101. [Google Scholar] [CrossRef]
  36. Folk, R. Practical Petrographic Classification of Limestones. AAPG Bull. 1959, 43, 1–38. [Google Scholar]
  37. Bai, B.; Zhu, R.; Wu, S.; Cui, J.; Su, L.; Li, T. New Micro-throat Structural Characterization Techniques for Unconventional Tight Hydrocarbon Reservoir. China Petrol. Explor. 2014, 19, 78–86. [Google Scholar]
  38. Swanson, B.F. A Simple Correlation Between Permeabilities and Mercury Capillary Pressures. Pet. Technol. 1981, 33, 2498–2504. [Google Scholar] [CrossRef]
  39. Wang, W.; Lu, S.; Tian, W.; Li, J.; Zhou, W.; Shan, J.; Hu, Y.; Meng, Y. Liaohe Oil Field Shale Reservoir Quality Grading with Micropore Evaluation Parameters in Damintun Depression. J. China Univ. Petrol. 2016, 40, 12–19. [Google Scholar] [CrossRef]
  40. Ghanizadeh, A.; Clarkson, C.R.; Aquino, S.; Ardakani, O.H.; Sanei, H. Petrophysical and Geomechanical Characteristics of Canadian Tight Oil and Liquid-Rich Gas Reservoirs: I. Pore Network and Permeability Characterization. Fuel 2015, 153, 664–681. [Google Scholar] [CrossRef]
  41. Taylor, T.R.; Kittridge, M.G.; Winefield, P.; Bryndzia, L.T.; Bonnell, L.M. Reservoir Quality and Rock Properties Modeling—Triassic and Jurassic Sandstones, Greater Shearwater Area, UK Central North Sea. Mar. Petrol. Geol. 2015, 65, 1–21. [Google Scholar] [CrossRef]
  42. Trojan, M. Effects of Diagenesis on Reservoir Properties and Log Response, Upper Jurassic Taylor Sandstone, Cotton Valley Group. AAPG Bull. 2019, 69, 1430–1431. [Google Scholar] [CrossRef]
  43. Wang, Q.; Chen, Z. Transient mass transfer ahead of a hot solvent chamber in a heavy oil gravity drainage process. Fuel 2018, 232, 165–177. [Google Scholar] [CrossRef]
  44. Elert, K.; Sebastián Pardo, E.; Rodriguez-Navarro, C. Influence of Organic Matter on the Reactivity of Clay Minerals in Highly Alkaline Environments. Appl. Clay Sci. 2015, 111, 27–36. [Google Scholar] [CrossRef]
  45. John, B. A Comparison of Two Methods for Estimating the Organic Matter Content of Sediments. J. Paleolimnol. 2004, 31, 125–127. [Google Scholar] [CrossRef]
  46. Carroll, D.; Starkey, H.C. Reactivity of Clay Minerals with Acids and Alkalies. Clays Clay Miners 1971, 19, 321–333. [Google Scholar] [CrossRef]
  47. Ma, C.; Wu, Y.; Gu, T.; Zhang, B.; Li, Y.G.; Zhang, Y.J.; Dong, W.B.; Cui, J. Trachyte Reservoir Characteristics and Favorable Reservoir Identification and Prediction in the J34 Block, Eastern Sag. Acta Geophys. 2022, 70, 1635–1650. [Google Scholar] [CrossRef]
  48. Yang, Y.; Wen, Z.; Tian, W.; Fan, Y.; Gao, H. A New Model for Predicting Permeability of Chang 7 Tight Sandstone Based on Fractal Characteristics from High-Pressure Mercury Injection. Energies 2024, 17, 821. [Google Scholar] [CrossRef]
  49. Garcia-Fresca, B.; Pinkston, D.; Loucks, R.G.; LeFever, R. The Three Forks Playa Lake Depositional Model: Implications for Characterization and Development of an Unconventional Carbonate Play. AAPG Bull. 2018, 102, 1455–1488. [Google Scholar] [CrossRef]
  50. Eltom, H. Modeling and Simulating Biogenically-Controlled Permeability in Gas Reservoirs. Mar. Petrol. Geol. 2024, 167, 106951. [Google Scholar] [CrossRef]
  51. Bryant, S.L.; King, P.R.; Mellor, D.W. Network Model Evaluation of Permeability and Spatial Correlation in a Real Random Sphere Packing. Transp. Porous Media 1993, 11, 53–70. [Google Scholar] [CrossRef]
  52. Bakke, S.; Ren, P.E. 3-D pore-scale modelling of sandstones and flow simulations in the pore networks. SPE J. 1997, 2, 136–149. [Google Scholar] [CrossRef]
  53. Pilotti, M. Reconstruction of Clastic Porous Media. Transp. Porous Media 2000, 41, 359–364. [Google Scholar] [CrossRef]
  54. Attwood, D. Microscopy: Nanotomography Comes of Age. Nature 2006, 442, 642–643. [Google Scholar] [CrossRef]
  55. Sakdinawat, A.; Attwood, D. Nanoscale X-ray Imaging. Nat. Photonics 2010, 4, 840–848. [Google Scholar] [CrossRef]
  56. Guan, Y.; Gong, Y.; Li, W.; Gelb, J.; Zhang, L.; Liu, G.; Zhang, X.; Song, X.; Xia, C.; Xiong, Y.; et al. Quantitative Analysis of Micro Structural and Conductivity Evolution of Ni-YSZ Anodes during Thermal Cycling Based on Nano-computed Tomography. J. Power Sources 2011, 196, 10601–10605. [Google Scholar] [CrossRef]
  57. Cho, Y. Stochastic Discrete Fracture Network Modeling in Shale Reservoirs via Integration of Seismic Attributes and Petrophysical Data. Interpretation 2021, 9, SG47–SG58, (In Chinese with English Abstract). [Google Scholar] [CrossRef]
  58. Cao, Y.; Xi, K.; Zhu, R.; Zhang, S.; Zhang, X.; Zheng, X. Microscopic Pore Throat Characteristics of Tight Sandstone Reservoirs in Fuyu Layer of the Fourth Member of Quantou Formation in Southern Songliao Basin. J. China Univ. Petrol. 2015, 39, 7–17, (In Chinese with English Abstract). [Google Scholar] [CrossRef]
  59. Woo, J.; Lee, H.S.; Ozyer, C.; Rhee, C. Effect of Lamination on Shale Reservoir Properties: Case Study of the Montney Formation, Canada. Geofluids 2021, 2021, 8853639. [Google Scholar] [CrossRef]
  60. Su, J.; Tian, Z.; Shen, Y.; Liu, B.; Xu, Q.; Wang, Y. Differential Diagenetic Evolution and Hydrocarbon Charging of the Tight Limestone Reservoir of the Da’anzhai Member in the Central Sichuan Basin, China. Interpretation 2020, 8, T1007–T1022. [Google Scholar] [CrossRef]
  61. Davies, G. Morphology of the Pore Space in Claystones—Evidence from BIB/FIB Ion Beam Sectioning and Cryo-SEM Observations. eEarth Discuss. 2009, 4, 15–22. [Google Scholar]
  62. Nelson, P.H. Pore-throat sizes in sandstones, tight sandstones, and shales. AAPG Bull. 2009, 93, 329–340. [Google Scholar] [CrossRef]
  63. Curtis, M.E.; Ambrose, R.J.; Sondergeld, C.H.; Rai, C.S. Transmission and Scanning Electron Microscopy Investigation of Pore Connectivity of Gas Shales on the Nanoscale. In Proceedings of the North American Unconventional Gas Conference and Exhibitio, The Woodlands, TA, USA, 14–16 June 2011; p. SPE-144391. [Google Scholar] [CrossRef]
  64. Bate, B.B.; Boboye, O.A.; Fozao, K.F.; Ndip, E.A.; Anene, N.O. Petrophysical characterization and 3D seismic interpretation of reservoirs in the Baris Field, onshore Niger Delta Basin, Nigeria. Energy Geosci. 2023, 4, 103–116. [Google Scholar] [CrossRef]
  65. Foster, A.G. Pore Size and Pore Distribution. Discuss. Faraday Soc. 1948, 3, 41–51. [Google Scholar] [CrossRef]
  66. Song, M.; Liu, H.; Wang, Y.; Liu, Y. Enrichment Rules and Exploration Practices of Paleogene Shale Oil in Jiyang Depression, Bohai Bay Basin, China. Petrol. Explor. Dev. 2020, 47, 242–253. [Google Scholar] [CrossRef]
  67. Ajdukiewicz, J.M.; Larese, R.E. How clay grain coats inhibit quartz cement and preserve porosity in deeply buried sandstones: Observations and experiments. AAPG Bull. 2012, 96, 2091–2119. [Google Scholar] [CrossRef]
  68. Han, W.; Gao, C.; Han, X. Application of NMR and Micrometer and Nanometer CT Technology in Research of Tight Reservoir: Taking Chang 7 Member in Ordos Basin as an Example. Fault Block Oil Gas Field 2015, 22, 62–66, (In Chinese with English Abstract). [Google Scholar]
  69. Zhao, D.; Guo, Y.; Wang, G.; Guan, X.; Zhou, X.; Liu, J. Fractal Analysis and Classification of Pore Structures of High-Rank Coal in Qinshui Basin, China. Energies 2022, 15, 6766. [Google Scholar] [CrossRef]
  70. Li, Z.; Shen, X.; Qi, Z.; Hu, R. Comparations between Mercury Intrusion and Gas Adsorption for Pore Structure Characteristics of Shale. J. Eng. Geol. 2017, 25, 1405–1413, (In Chinese with English Abstract). [Google Scholar]
  71. Fu, S.; Yao, J.; Li, S.; Zhou, X.; Li, M. Enrichment Characteristics and Resource Potential of Continental Shale Oil in Mesozoic Yanchang Formation, Ordos Basin. Petrol. Geol. Exp. 2020, 42, 698–710, (In Chinese with English Abstract). [Google Scholar] [CrossRef]
  72. Yu, H.; Li, Z.; Bai, Y.; Wang, Y.; Hu, H.; Gao, Y. Influence of Injection Pressure on Gas Adsorption and Desorption of Anthracite. Energy 2024, 288, 129828. [Google Scholar] [CrossRef]
  73. Li, T.; Tian, H.; Chen, J.; Cheng, L. The Application of Low Pressure Gas Adsorption to the Characterization of Pore Size Distribution for Shales: An Example from Southeastern Chongqing Area. Nat. Gas Geosci. 2015, 26, 1719–1728. [Google Scholar] [CrossRef]
  74. Kassi, A.M.; Grigsby, J.D.; Khan, A.S.; Kasi, A. Sandstone petrology and geochemistry of the Oligocene–Early Miocene Panjgur Formation, Makran accretionary wedge, southwest Pakistan: Implications for provenance, weathering and tectonic setting. Asian Earth Sci. 2015, 105, 192–207. [Google Scholar] [CrossRef]
  75. Loucks, R.G. Domal, Thrombolitic, Microbialite Biostromes and Associated Lithofacies in the Upper Albian Devils River Trend along the Northern, High-Energy Margin of the Maverick Basin. Sediment. Geol. 2018, 371, 75–88. [Google Scholar] [CrossRef]
  76. Curtis, M.E.; Ambrose, R.J.; Sondergeld, C.H.; Rai, C.S. Structural Characterization of Gas Shales on the Micro- and Nano-shales. In Proceedings of the Canadian Unconventional Resources and International Petroleum Conference, Calgary, AB, Canada, 19–21 October 2010; p. 137693. [Google Scholar] [CrossRef]
  77. Zhang, Y.; Cen, W.; Huang, W.; Latif, K.; Wang, L. Sequence Stratigraphic Analysis of Devonian Organic-Rich Shales in Northern Guangxi. Mar. Petrol. Geol. 2023, 156, 106450. [Google Scholar] [CrossRef]
  78. Gao, L.; Han, Z.; Han, Y.; Han, C.; Wei, F.; Qin, Z. Controlling of Cements and Physical Property of Sandstone by Fault as Observed in Well Xia503 of Huimin Sag, Linnan Sub-depression. Sci. China Earth Sci. 2013, 56, 1942–1952. [Google Scholar] [CrossRef]
  79. Macquaker, J.H.S.; Taylor, K.G.; Keller, M.; Polya, D. Compositional Controls on Early Diagenetic Pathways in Fine-Grained Sedimentary Rocks: Implications for Predicting Unconventional Reservoir Attributes of Mudstones. AAPG Bull. 2014, 98, 587–603. [Google Scholar] [CrossRef]
  80. Zhang, Y.; Cen, W.; Chai, K.; Huang, Z.; Latif, K.; Cui, X. Sequence Stratigraphic Analysis and Distribution Features of Lower Carboniferous Organic-Rich Shales in Northern Guangxi. Mar. Petrol. Geol. 2024, 162, 106727. [Google Scholar] [CrossRef]
Figure 1. Geological map of the study area and stratigraphic column of the Jiufotang Fm. (a) A map of the tectonic structure of the study area; (b) the paleogeographic pattern of the Houhe region during the sedimentation period of Jiufotang; (c) the sedimentary succession of the Jiufotang Fm. The numbers in the figure represent: 1—Fan delta plain facies; 2—Underwater distributary channels in the fan delta front facies; 3—Sheet sands in the fan delta front facies; 4—Deep lacustrine facies; 5—Provenance direction; 6—Main stream line; 7—Fine sandstone; 8—siltstone; 9—mudstone; 10—Normal cycle; 11—Inverse cycle.
Minerals 14 00918 g001
Figure 2. Ternary classification diagram for sandstone samples from the Jiufotang reservoir in the Houhe Region. The red dots represent sample points.
Minerals 14 00918 g002
Figure 3. Histogram of physical property distribution in Jiufotang reservoir in the Houhe Region; (a) Histogram of porosity distribution in Jiufotang reservoir in the Houhe Region; (b) Histogram of permeability distribution in Jiufotang reservoir in the Houhe Region.
Minerals 14 00918 g003
Figure 4. Typical microscopic photograph of a sample from the Jiufotang Fm reservoir in the Houhe region. (a) Residual intergranular pores, well H8, 1957 m, pore wall with extremely thin chlorite lining; (b) intergranular pore, well H8-1, 2077.45 m; (c) intragranular pores, wells H21–H230, 1876.65 m; (d) clast pores, guide wells H21–H230, 1908.5 m; (e) feldspar pores, wells H21–H218, 1746.2 m; (f) moldic pores, well H8, 1956 m; (g) intercrystalline pores, well H24, 1723.5 m; (h) structural joints, well H19, 1763.69 m; (i) diagenetic fracture, well H27, 1973.15 m.
Minerals 14 00918 g004
Figure 5. Pore-throat structure parameter characteristics of the Jiufotang Fm reservoirs in the Houhe region. (a) Surface porosity r distribution characteristics, H27, 1969.86 m; (b) pore coordination distribution characteristics, H27, 1969.86 m; (c) pore radius distribution characteristics, H27, 1969.86 m; (d) throat radius distribution characteristics, H27, 1969.86 m; (e) surface porosity r distribution characteristics, H19, 1761.26 m; (f) pore coordination distribution characteristics, H19, 1761.26 m; (g) pore radius distribution characteristics, H19, 1761.26 m; (h) throat radius distribution characteristics, H19, 1761.26 m; (i) surface porosity distribution characteristics, H20, 1931.34 m; (j) pore coordination distribution characteristics, H20, 1931.34 m; (k) pore radius distribution characteristics, H20, 1931.34 m; (l) throat radius distribution characteristics, H20, 1931.34 m.
Minerals 14 00918 g005
Figure 6. CT analysis results for the Jiufotang Fm reservoir in Houhe region. (a) Pore-throat classification model, H27, 1969.86 m. (b) Pore-throat ball-and-stick model, H27, 1969.86 m. (c) Pore extraction model, H27, 1969.86 m. (d) X–Y direction slice, H27, 1969.86 m. (e) X–Y–Z direction slice, H27, 1969.86 m. (f) High-density mineral model, H27, 1969.86 m. (g) Pore-throat classification model, H19, 1761.26 m. (h) Pore-throat ball-and-stick model, H19, 1761.26 m. (i) Pore extraction model, H19, 1761.26 m. (j) X–Y direction slice, H19, 1761.26 m. (k) X–Y–Z direction slice, H19, 1761.26 m. (l) High-density mineral model, H19, 1761.26 m. (m) Pore-throat classification model, H20, 1931.34 m. (n) Pore-throat ball-and-stick model, H20, 1931.34 m. (o) Pore extraction model, H20, 1931.34 m. (p) X–Y direction slice, H20, 1931.34 m. (q) X–Y–Z direction slice, H20, 1931.34 m. (r) High-density mineral model, H20, 1931.34 m.
Minerals 14 00918 g006
Figure 7. Typical capillary pressure curve for the Jiufotang Fm reservoir in the Houhe region. (I) The mesopore-fine throat type; (II) The small- and medium-pore fine-throat types; (III) The small-to-micropore-micro-throat type.
Minerals 14 00918 g007
Figure 8. Location of the studied wells and distribution map of surrounding structures in the Middle Section of the Ludong Depression. Key: 1—Mudrocks in the Fuxin Fm. 2—Mudrocks in the Shahai Fm. 3—Oil shales. 4—Fan delta plain facies sandstones. 5—Fan delta front facies sandstone. 6—Sheet sand. 7—Oil layers. 8-Poor oil layer.
Minerals 14 00918 g008
Table 1. Microscopic pore-structure parameter correlation matrix for the tight oil reservoir in the Jiufotang Fm in the Houhe Region.
Parametersφ (%)K (mD)Pd (MPa)P50 (MPa)VGSHgmax (%)SkR (μm)Cn
φ (%)1.0000.856−0.549−0.5920.7760.5700.5540.2470.026
K (mD)0.8561.000−0.229−0.5270.7140.7300.7250.288−0.026
Pd (MPa)−0.549−0.2291.0000.353−0.489−0.2280.188−0.506−0.431
P50 (MPa)−0.592−0.5270.3531.000−0.535−0.812−0.6060.2120.392
VG0.7760.714−0.489−0.5351.0000.6490.5630.170−0.142
SHgmax (%)0.5700.730−0.228−0.8120.6491.0000.6300.042−0.270
Sk0.5540.7250.188−0.6060.5630.6301.000−0.369−0.614
R (μm)0.2470.288−0.5060.2120.1700.042−0.3691.0000.924
Cn0.026−0.026−0.4310.392−0.142−0.270−0.6140.9241.000
Table 2. Classification of pore-throat structures for the tight oil reservoir in the Jiufotang Fm in the Houhe Region.
Typeφ (%)K (mD)VGSkR (μm)
I(9.6–23.2)/12.6(0.74–28.3)/2.81(0.69–1.72)/0.82(0.89–4.86)/2.44(2.08–56.50)/12.75
II(6.4–12.3)/8.75(0.09–4.12)/0.30(0.91–2.06)/1.19(0.61–2.11)/1.31(0.60–23.41)/7.63
III(2.83–9.91)/3.80(0.016–3.27)/0.08(1.45–3.47)/2.27(0.43–1.32)/0.87(0.26–12.92)/3.86
Note: (minimum–maximum)/average value; φ: porosity; K: permeability; VG: the coefficient of variation; Sk: skewness coefficient; R: mean pore-throat radius; Pd: discharge pressure; P50: median pressure, SHgmax: maximum mercury saturation; Cn: average coordination number.
Disclaimer/Publisher’s Note: The statements, opinions and data contained in all publications are solely those of the individual author(s) and contributor(s) and not of MDPI and/or the editor(s). MDPI and/or the editor(s) disclaim responsibility for any injury to people or property resulting from any ideas, methods, instructions or products referred to in the content.

