Abstract
In situ high-temperature Raman spectroscopy (up to 550 °C) and infrared spectroscopy (up to 700 °C) were employed to analyze hydrous Fe-rich ringwoodite (Fo76 composition containing 0.69 wt% H2O). The results demonstrate that the hydrous Fe-rich ringwoodite sample undergoes irreversible structural transformation above 300 °C at ambient pressure, converting to an amorphous phase. This indicates a lower thermal stability threshold compared to Fe-bearing ringwoodite (Fo90) with equivalent water content. Notably, identical infrared spectral evolution patterns were observed during heating (25–500 °C) for the studied Fo76 sample and previously reported Fo82/Fo90 specimens, suggesting minimal influence of iron content variation on hydroxyl group behavior. The material derived from Fe-rich ringwoodite through structural transformation at ~350 °C retains the capacity to preserve water within a defined temperature window (400–550 °C). In situ high-pressure Raman spectroscopy experiments conducted up to 20 GPa detected no notable structural modifications, suggesting that hydrous Fe-rich ringwoodite, hydrous Fe-bearing ringwoodite, and hydrous Mg-endmember ringwoodite exhibit comparable structural stability within this pressure range.
1. Introduction
Ringwoodite is the highest-pressure polymorph of olivine. It is considered to be the most important constituent mineral in the lower part of the mantle transition zone (at depths of approximately 520 to 660 km) [1]. Infrared spectroscopic analysis of natural ringwoodite included in a diamond revealed a high water content of 1.4 wt% H2O, suggesting that the transition zone is hydrous, at least locally [2]. Additionally, studies on synthetic ringwoodite demonstrate a remarkable water storage capacity of up to 2.7 wt% H2O [3], confirming its compatibility with the hydrous conditions of the mantle transition zone [4]. Extensive experimental investigations [5,6,7,8,9,10] have demonstrated that water incorporated within the crystal structure of ringwoodite can significantly alter its physical properties (e.g., electrical conductivity and thermal expansion) and influence the pressure conditions of the wadsleyite–ringwoodite phase transition, thereby exerting control over the structure and properties of the mantle transition zone. The transition of hydrous ringwoodite to perovskite and (Mg,Fe)O forms intergranular melt. Observed abrupt seismic velocity reductions within inferred downwelling mantle coincide with localized melting beneath the 660-km discontinuity. This dehydration melting may release water that becomes trapped in the mantle transition zone, potentially contributing to large-scale hydration of this region [11]. Therefore, studying potential factors (such as Fe content) that may influence the structural behavior and hydration stability of ringwoodite under high-temperature or high-pressure conditions holds significant scientific importance.
Previous studies have examined the high-temperature properties of hydrous ringwoodite, including the thermal response of hydroxyl groups in its crystal structure [6,7,8,12,13,14]. In situ high-temperature Raman spectroscopy revealed that pure-Mg ringwoodite containing ~2.7 wt% H2O shows apparent stability up to 527–600 °C at ambient pressure [12]. Inoue et al. [6] determined the thermal expansion of anhydrous pure-Mg ringwoodite and hydrous pure-Mg ringwoodite (containing ~2.6 wt% H2O) using high-temperature powder X-ray diffraction at ambient pressure. Their results showed that hydrous ringwoodite undergoes dehydration at 400 °C. Prior to dehydration, the thermal expansion coefficient measured for hydrous ringwoodite is slightly lower than that of its anhydrous counterpart. Ye et al. [7,8] measured the thermal expansion coefficients of pure-Mg ringwoodite with water contents of 0.2 wt%, 0.74 wt%, 2.4 wt%, and 2.5 wt% using single-crystal X-ray diffraction at ambient pressure. Their results implied that no linear relationship exists between water content and thermal expansion coefficient. In contrast, the decomposition temperature, indicated by irreversible unit-cell expansion, exhibits a clear dependence on the water content of the ringwoodite. Samples with higher water content break down at lower temperatures. For example, ringwoodite with 0.2 wt% H2O persists up to 646 °C, whereas samples containing 2.4–2.5 wt% water break down around 327 °C.
Research on the high-temperature behavior of hydrous Fe-bearing ringwoodite remains relatively limited. In situ high-temperature infrared spectroscopy analysis [13] indicated that Fe-bearing (Fo90) ringwoodite with a water content of 0.77 wt% undergoes dehydration above 400 °C under ambient pressure, concomitant with prominent changes in infrared spectral characteristics within the OH vibrational region. In contrast, in situ high-temperature Raman spectroscopy analysis [13] revealed apparent stability of this Fe-bearing sample at 600 °C, demonstrating that the temperature conditions for dehydration and phase transformation differ from each other. In situ infrared spectroscopy analysis of Fe-rich (Fo82) ringwoodite with a water content of 1.9 wt% at temperatures up to 500 °C under ambient pressure indicated that the major broad OH band near 3150 cm−1 significantly weakens upon heating, while the OH bands at 3420 cm−1 and 3680 cm−1 intensify. This suggested hydrogen loss and an irreversible rearrangement of part of the hydrogen atoms caused by the heating process. However, the effects of this dehydration and hydrogen redistribution on the framework behavior of Fe-rich ringwoodite require further investigation [14].
High-pressure Raman spectroscopic analysis of anhydrous Mg-endmember ringwoodite and hydrous Mg-endmember ringwoodite indicated that the incorporation of hydrogen (water) in ringwoodite does not significantly alter the Raman modes of ringwoodite below 20 GPa [15,16,17]. Kleppe et al. [10] demonstrated that hydrous Fe-bearing (Fo89) ringwoodite can undergo a structural change at room temperature under pressures up to ~40 GPa, marked by the emergence of a new Raman mode in the 550–680 cm−1 range. However, these changes were not observed in high-pressure investigations [17,18,19] of anhydrous Mg-endmember ringwoodite, hydrous Mg-endmember ringwoodite, or anhydrous Fe-rich ringwoodite.
In this study, in situ high-temperature and high-pressure spectroscopy were employed to investigate hydrous Fe-rich (Fo76) ringwoodite. The experimental results can provide additional insights into the influence of iron on the thermal and pressure behavior of hydrous ringwoodite, as well as the thermal stability of hydroxyl groups in its crystal structure.
2. Sample Preparation and Experimental Methods
The hydrous Fe-rich (Fo76) ringwoodite sample in this study was synthesized at 19 GPa and 1400 °C using a multi-anvil press at the Bayerisches Geoinstitut (BGI), University of Bayreuth, Germany. Details of synthesis and compositional analysis results are reported in Zhang et al. [20].
Single-crystal X-ray diffraction analysis of the Fe-rich ringwoodite sample was conducted using a Bruker D8 Venture diffractometer equipped with a Photon II detector at Center for High Pressure Science and Technology Advanced Research (HPSTAR), Beijing. Mo Kα radiation (λ = 0.71073 Å) was generated by an IµS 3.0 microfocus source with a rotating anode. The crystal structure was refined using the SHELXL-2018 program [21] within the WINGX v2018.1 software suite [22], employing 2581 reflections (2θ ≤ 54.16°). Scattering factors for Mg2+, Si4+, and Fe2+ from Cromer and Mann [23], and for O− from Tokonami [24] were employed. Site occupancies of Mg and Fe at octahedral sites were fixed during refinement based on electron probe microanalysis (EPMA) compositional data [20]. After absorption correction (µ = 3.545 mm−1), 45 unique reflections (Rint = 0.0253) were obtained, of which 44 with Fo > 4σ(Fo) were used for final refinement. The complete XRD experimental dataset, including detailed data collection parameters and refinement procedures, along with the hkl reflection data, is available in the File S1 (CIF file) of the Supplementary Materials.
The Raman spectra of the single-crystal Fe-rich ringwoodite sample (70 × 50 × 40 µm in size) were collected using a WITec (Wissenschaftliche Instrumente und Technologie GmbH, Ulm, Germany) confocal Raman imaging microscope (alpha300R) at the Institute of Geology and Geophysics, Chinese Academy of Sciences. Spectra were excited by a 532 nm diode-pumped solid-state laser at 30 mW power, with a 600 gr/mm grating. The laser spot was focused to a 1 µm diameter on the sample. All spectra were recorded using a 20× microscope objective, with five accumulations of 10-s exposure each. For high-temperature measurements, spectra of the sample mounted on a sapphire substrate were acquired from 25 to 550 °C at 50 °C intervals using a Linkam (Linkam Scientific Instruments Ltd., Redhill, United Kingdom) TS1400 heating stage equipped with a SiO2 window and Rh/Pt thermocouple. At each temperature, the system was stabilized for ≥15 min to ensure thermal equilibrium. Heating and cooling rates during data collection were maintained at 50 °C/min and −50 °C/min, respectively.
A doubly polished sample fragment (original dimensions: 80 × 40 × 30 µm, polished thickness: 11 µm) was prepared for Fourier-transform infrared (FTIR) spectroscopy. Unpolarized spectra were collected at the Institute of Geology and Geophysics, Chinese Academy of Sciences, using a Bruker (Bruker Optics GmbH & Co. KG, Germany) INVENIO-R spectrometer coupled to a HYPERION 1000 microscope (20× objective, CaF2 beam-splitter, MCT detector), with the sample mounted on a sapphire substrate. Each spectrum represents 128 accumulated scans at 2 cm−1 resolution, measured through 50 × 50 µm apertures. Water content of the sample was quantified via the Beer–Lambert law [2].
where Ai tot is the integrated absorbance multiplied by 3 [25], εi denotes the absorption coefficient (estimated as 100,000 L/mol H2O/cm−2 for ringwoodite [26]), C represents concentration (mol H2O·L−1), and t is sample thickness (cm). High-temperature measurements employed a Linkam (Linkam Scientific Instruments Ltd., United Kingdom) TS1400 stage with ZnSe window and Rh/Pt thermocouple. Spectra were recorded from 25–700 °C at 50 °C intervals. Heating and cooling rates were maintained at 50 °C·min−1 and −50 °C·min−1, respectively. Samples were held at each temperature for ≥15 min before data acquisition to ensure thermal equilibrium.
Ai tot = C × t × εi
In situ high-pressure Raman spectroscopic measurements were performed using a symmetric-type diamond-anvil cell (DAC) equipped with type Ia diamond anvils (culet diameter: ~0.3 mm). A rhenium gasket was pre-indented to 50 µm thickness, and a ~0.16 mm diameter hole was drilled as the sample chamber. An Fe-rich ringwoodite fragment (70 × 50 × 25 µm) was loaded into the chamber with two ruby spheres, using argon (Ar) as the pressure-transmitting medium. Raman spectra were acquired using a HORIBA (Horiba, Ltd., Kyoto, Japan) LabRAM HR Evolution spectrometer at Institute of Geology, Chinese Academy of Geological Sciences in the 100–1000 cm−1 range, with five accumulations and ten seconds exposure time under a 20× objective. A 532 nm solid-state laser (40 mW power) was used for excitation. Pressure was calibrated based on the ruby R1 luminescence line shift [27].
3. Results and Discussion
The crystal structure refinement converged to wR2 = 0.0703 and Rw = 0.0273 for reflections with Fo > 4σ(Fo), yielding Rall = 0.0274 and a goodness-of-fit (GooF) value of 1.406. The structure factor F(000) was determined as 613.8 (Table 1), confirming the sample as a high-quality single crystal. The final refined lattice parameters were a = 8.1127(58) Å and V = 533.9(11) Å3 (Table 2). The complete refinement results (including atomic coordinates, bond lengths, etc.) are provided in the File S1 (CIF file) within the Supplementary Materials.

Table 1.
Refinement details of the Fe-rich ringwoodite sample.
Table 2.
Unit-cell parameters and atomic coordinates of the Fe-rich ringwoodite sample.
At ambient temperature, the FTIR spectrum of the sample exhibits a broad, intense OH band centered at 3150 cm−1 spanning 2700–3600 cm−1, accompanied by weaker absorption features at ~2730 and 3660 cm−1 (Figure 1). These spectral characteristics align consistently with previously reported IR signatures of ringwoodite [4,28,29], indicating multiple hydrogen incorporation mechanisms. The broad 3150 cm−1 band originates from octahedral defects of the type [VMg(OH)2]x. Meanwhile, the shoulders observed in the 3350–3500 cm−1 range are ascribed to Mg/Fe substitution for silicon in tetrahedral sites ([(Mg/Fe)Si(OH)2]x) [13,14,30,31]. Based on the integrated areas of the absorption peaks, the water content of the sample is estimated at approximately 0.69 wt% H2O. Comparison of the Fe-rich ringwoodite in this study with reported pure-Mg and Fe-bearing ringwoodite samples (0.74–0.86 wt% H2O) [32] demonstrates a robust correlation between unit-cell volume and Fe concentration (Figure 2).
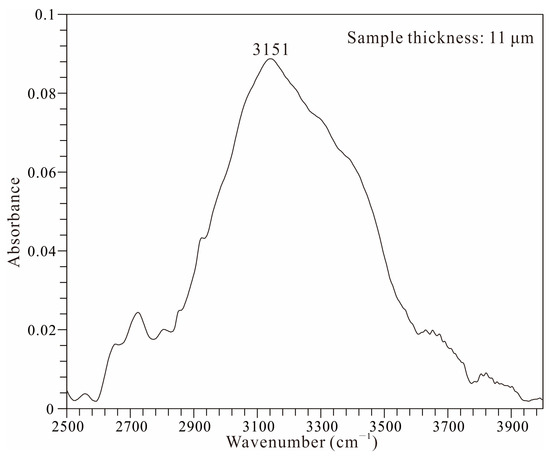
Figure 1.
Infrared spectrum of the Fe-rich ringwoodite sample at ambient conditions.
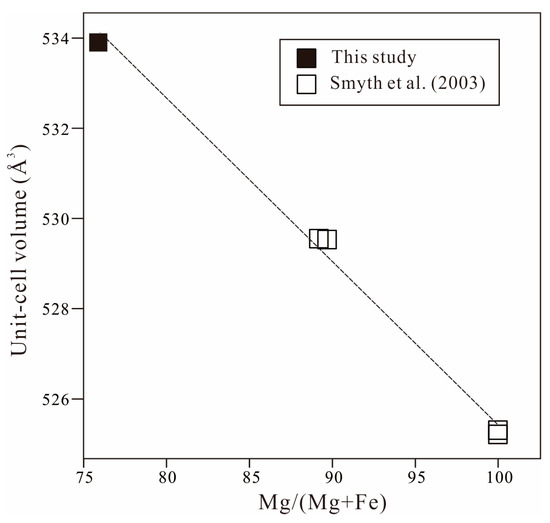
Figure 2.
Correlation between unit-cell volume and Mg/(Mg + Fe) ratio in ringwoodite samples with similar water contents (0.69–0.86 wt% H2O). Literature Citation: Smyth et al. (2003) [32].
The Raman spectrum of the hydrous Fe-rich ringwoodite at ambient temperature exhibits peaks at 212, 797, and 843 cm−1 (Figure 3). These three peaks can also be observed in the reported Raman spectra of hydrous Fe-bearing ringwoodite [13,15]. The two peaks at 797 (T2g) and 843 cm−1 (A1g) correspond to the asymmetric and symmetric stretching vibrations of the SiO4, respectively [13,15,17], while the peak at 212 cm−1 arises from localized modes associated with Fe2+, Fe3+, and H+ substitution in the ideal Mg2SiO4 ringwoodite host structure [10].
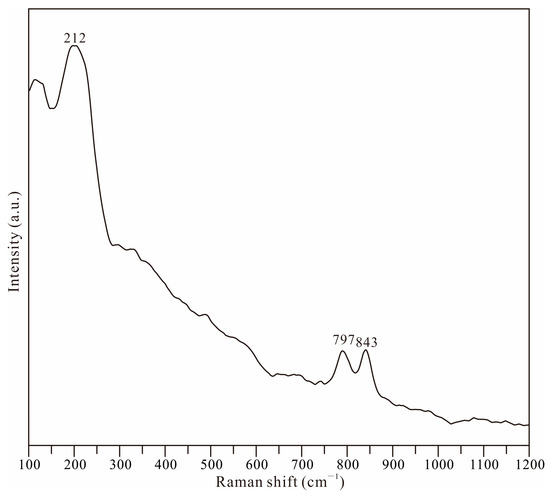
Figure 3.
Unpolarized Raman spectrum of the hydrous Fe-rich ringwoodite at ambient conditions.
Figure 4 present the Raman spectra of the hydrous Fe-rich ringwoodite recorded in the 300–1100 cm−1 range during heating and cooling cycles between 25–700 °C. Throughout the 25–300 °C heating interval, the two distinct peaks (at 797 and 843 cm−1 under ambient conditions), which correspond to SiO4 stretching vibrations, remain clearly discernible and progressively shift toward lower wavenumbers with rising temperature (Figure 4 and Figure 5). When the temperature exceeds 300 °C, the intensities of these two peaks weaken significantly and eventually disappear with further temperature increase, indicating a distinct change in the crystal structure. By 550 °C, no peaks remain observable in the Raman spectrum in the 300–1100 cm−1 range, demonstrating that the sample exists in an amorphous state (Figure 4 and Figure 5). During cooling, a broad peak near 700 cm−1 exhibits progressively increasing intensity. Upon returning to room temperature, this peak dominates the Raman spectrum of the sample within the 300–1100 cm−1 range (Figure 4 and Figure 5). Notably, the two peaks corresponding to SiO4 stretching vibrations fail to reappear. This indicates that the crystal structure transformation occurring in the ringwoodite sample above 300 °C during heating is irreversible.
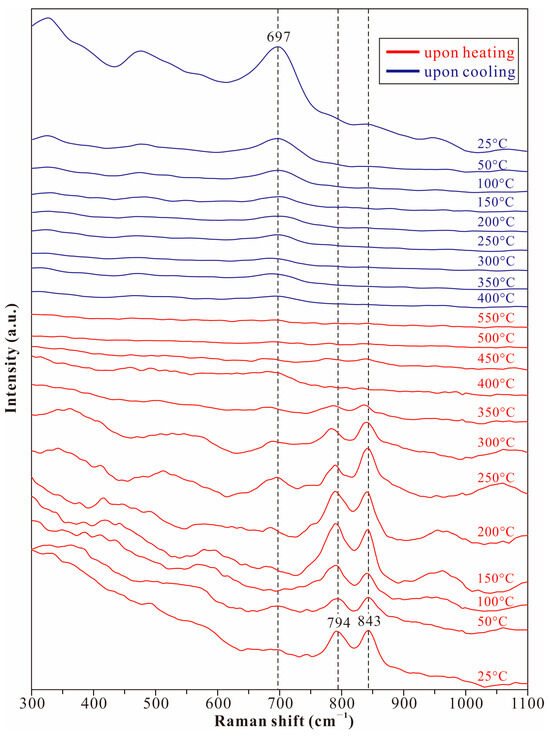
Figure 4.
Raman spectra of the hydrous Fe-rich ringwoodite recorded in the 300–1100 cm−1 range during heating and cooling cycles. The illustrative peak-fitting schematic and functional detail are depicted in Figure S1.
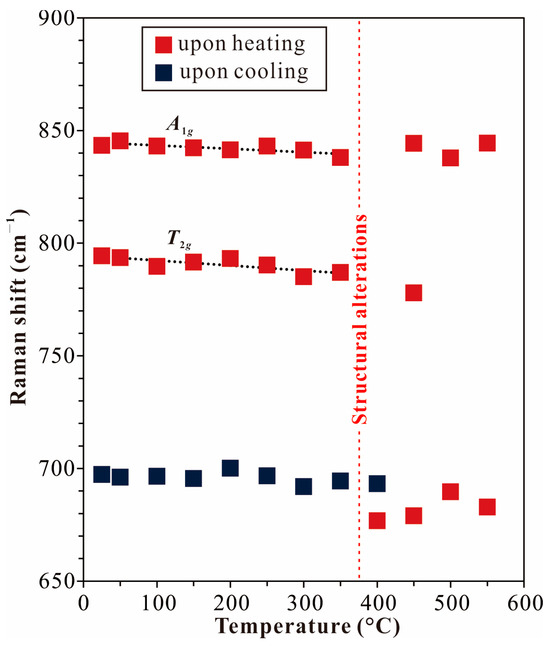
Figure 5.
Temperature dependence of the Raman modes of the hydrous Fe-rich ringwoodite sample in the 650–900 cm−1 range. Errors are within the size of the symbols. Detailed peak positions with uncertainties are tabulated in Table S1.
In situ high-temperature Raman spectroscopy analysis of Fo90 ringwoodite by Jin et al. [13] (up to 800 °C) revealed that the recovered Fo90 ringwoodite sample exhibited characteristic Raman peaks of olivine at 855 and 825 cm−1 under ambient conditions, confirming its transformation into olivine. In contrast, these vibrational peaks were absent in the Raman spectra (Figure 4) of the heat-treated (<600 °C) Fe-rich ringwoodite sample in the present study. Preliminary unit-cell determination through single-crystal X-ray diffraction of the recovered sample in this study revealed a cubic lattice parameter [a = b = c = 8.1604(10) Å, α = β = γ = 90°], consistent with typical ringwoodite cell characteristics. However, refinement based on complete diffraction datasets yielded Rw and Rall values exceeding 0.11. These results demonstrate that the Fe-rich ringwoodite sample underwent amorphization rather than transformation into olivine during heat treatment. The XRD data for this recovered phase are provided in File S2 (CIF file) within the Supplementary Materials.
The Raman spectra of the hydrous Fe-rich ringwoodite recorded in the 100–500 cm−1 range during heating and cooling are shown in Figure 6. The broad peak at 212 cm−1 exhibits a nonlinear shift upon heating from 25 to 300 °C. When the temperature exceeds 300 °C, the intensity of this peak also diminishes sharply due to structural alterations and vanishes completely at 500 °C. Upon cooling back to room temperature, the peak reemerges, indicating that the localized modes associated with Fe2+, Fe3+, and H+ persist after the ringwoodite sample undergoes irreversible structural changes.
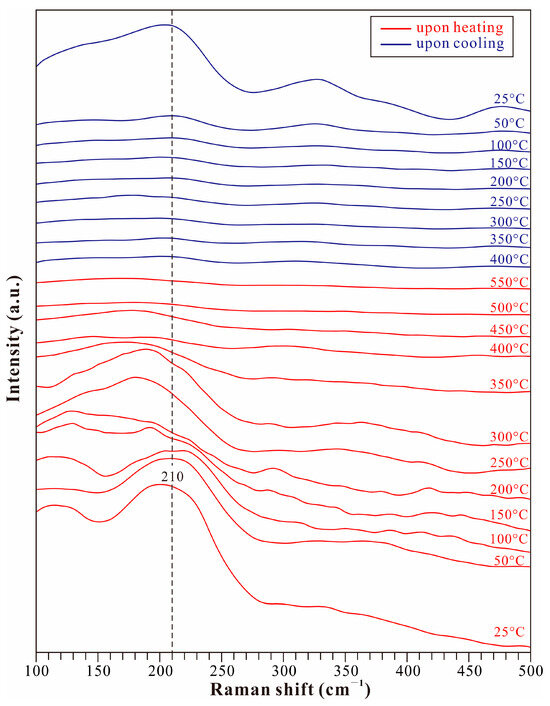
Figure 6.
Raman spectra of the hydrous Fe-rich ringwoodite recorded in the 100–500 cm−1 range during heating and cooling cycles. The illustrative peak-fitting schematic and functional detail are depicted in Figure S2.
Ye et al. [7] showed that pure-Mg ringwoodite with a water content of 0.74 wt% H2O maintains apparent structural stability up to 535 °C under ambient pressure, whereas Fe-bearing (Fo90) ringwoodite containing 0.77 wt% H2O can even maintain stability at temperatures reaching 700 °C [13]. Compared to these ringwoodite samples with equivalent water contents, the hydrous Fe-rich ringwoodite in this study retains apparent stability only up to 300 °C, indicating its diminished thermal persistence capacity.
The infrared spectral characteristics of hydrous Fe-rich ringwoodite during heating and cooling cycles between 25 and 700 °C are shown in Figure 7. As the temperature increases from 25 to 300 °C, the dominant OH band near 3150 cm−1 (νIR2) shifts systematically to higher wavenumbers (Figure 8). This phenomenon may indicate that this OH band is influenced by hydrogen bond interactions at ambient temperature. During heating, the adjacent MO6 octahedra move apart, resulting in weakened hydrogen bond interactions, which causes the band to shift towards higher wavenumbers. Over the temperature range of 25–300 °C, the intensities of all OH bands show no measurable decrease (Figure 7).
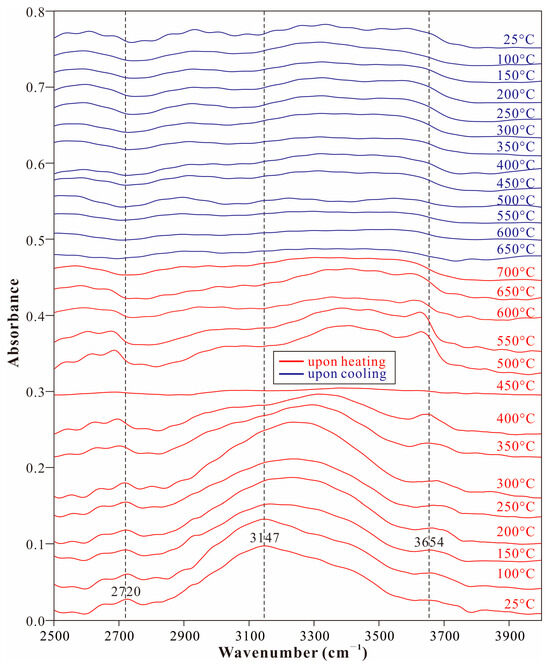
Figure 7.
Infrared spectra of the hydrous Fe-rich ringwoodite recorded during heating and cooling cycles. The illustrative peak-fitting schematic and functional detail are depicted in Figure S3.
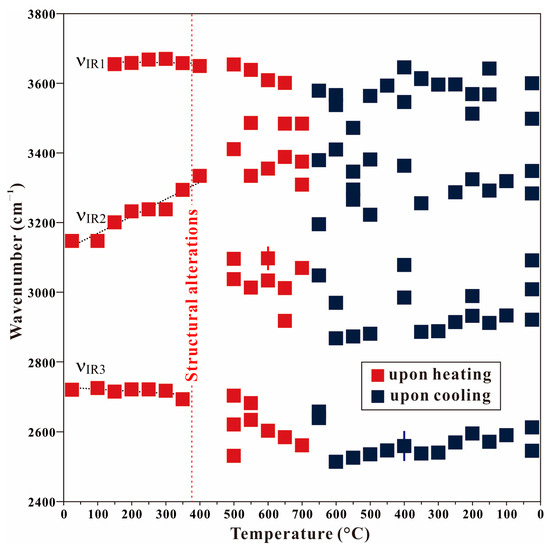
Figure 8.
Temperature dependence of the OH modes of the hydrous Fe-rich ringwoodite sample. Errors are within the size of the symbols or represented as error bars. Detailed peak positions with uncertainties are tabulated in Table S2.
Upon exceeding 300 °C, the intensity of the major OH band centered near 3300 cm−1 decreases significantly. Complete disappearance of all OH absorption bands occur by 450 °C. As the temperature reaches 500 °C, partial re-emergence of OH bands is observed within the 3350–3650 cm−1 region (Figure 7). The infrared spectral features at 500 °C exhibit marked differences compared to those at 400 °C (Figure 7), signifying hydrogen atom rearrangement. Furthermore, the integrated intensity of the OH bands at 500 °C is substantially reduced relative to 400 °C (Figure 7), indicating that the hydrogen rearrangement process occurring between 300 °C and 500 °C is accompanied by dehydration of the ringwoodite. During heating from 500 °C to 700 °C, the intensity of the OH bands initially observed at 500 °C progressively decreases. At 700 °C, the OH peaks become nearly undetectable. This alteration in infrared spectral features remains irreversible upon cooling from 700 °C to 25 °C (Figure 7), demonstrating that the sample undergoes complete dehydration by 700 °C.
Notably, during heating from room temperature to 500 °C, hydrous Fo90 and Fo82 ringwoodite [13,14] with water contents comparable to the hydrous Fo76 ringwoodite in this study exhibit identical infrared spectral evolution to the Fo76 sample. This indicates minimal influence of Fe content variation on the thermal behavior of hydroxyl groups in ringwoodite. The difference in thermal stability between Fe-bearing (Fo90) [13] and Fe-rich (Fo76) ringwoodite samples, as indicated by in situ high-temperature Raman spectroscopy analyses, suggests that the dehydration process associated with hydrogen rearrangement in the temperature range of 300–500 °C may substantially reduce the thermal stability of Fe-rich (e.g., Fo76) ringwoodite, while having minimal effects on the thermal stability of Fe-bearing (e.g., Fo90) ringwoodite.
From another perspective, the high-temperature infrared and Raman spectroscopy analyses in this study (Figure 4 and Figure 7) indicate that the material formed after the structural changes of Fe-rich ringwoodite at approximately 350 °C remains capable of retaining water within a specific temperature range (400–550 °C).
In situ high-pressure Raman spectroscopic analysis up to 20 GPa in this study reveals that the two primary Raman vibrational peaks of the hydrous Fe-rich (Fo76) ringwoodite—initially located at 797 cm−1 (T2g) and 843 cm−1 (A1g) under ambient conditions—exhibit near-linear shifts toward higher wavenumbers with increasing pressure, remaining clearly discernible at the maximum pressure (Figure 9). These observations demonstrate that hydrous Fe-rich ringwoodite also maintains high structural stability within pressures up to 20 GPa at room temperature. Notably, the pressure-dependent shift rates of the T2g and A1g modes in this hydrous Fe-rich ringwoodite [4.19(26) cm−1/GPa and 2.49(22) cm−1/GPa, respectively] were relatively lower than those documented for both hydrous Mg-endmember ringwoodite [12,17] and hydrous Fe-bearing (Fo89) ringwoodite [10] (Figure 10). This discrepancy suggests distinct compressibility behaviors, the quantification of which would require additional in situ high-pressure XRD and spectroscopic investigations at elevated pressures. The Raman peak at 212 cm−1 under ambient conditions maintains its spectral characteristics and position below 18 GPa (Figure 9). While peak splitting becomes observable at 20.3 GPa, complete recovery of the original spectral features occurs upon decompression (Figure 9 and Figure 10), implying limited pressure effects on the localized modes within the 20 GPa range.
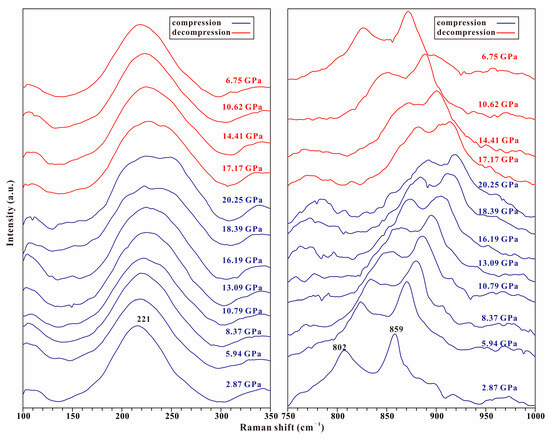
Figure 9.
Raman spectra of the hydrous Fe-rich ringwoodite recorded during compression and decompression. The illustrative peak-fitting schematics and functional details are depicted in Figures S4 and S5.
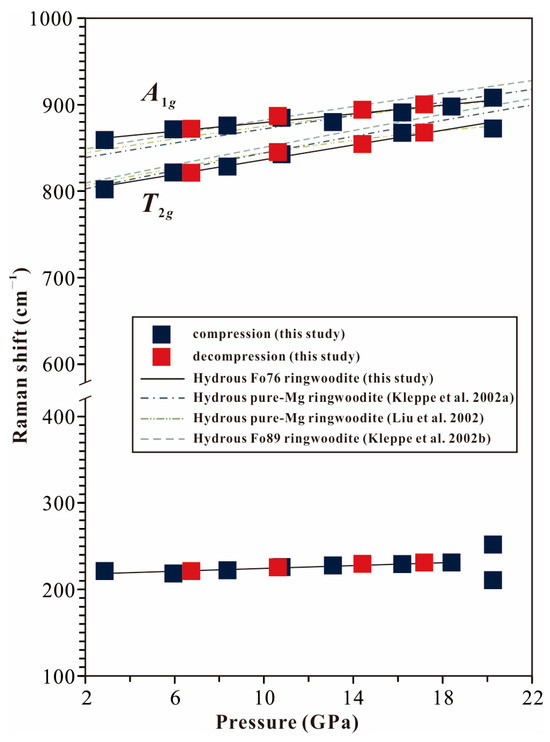
Figure 10.
Pressure dependence of the Raman modes of the hydrous Fe-rich ringwoodite sample. Errors are within the size of the symbols. Detailed peak positions with uncertainties are tabulated in Table S3. Literature Citations: Kleppe et al. (2002a) [17]; Kleppe et al. (2002b) [10]; Liu et al. (2002) [12].
4. Conclusions
- (1)
- The Fe-rich (Fo76) ringwoodite with approximately 0.69 wt% water content undergoes irreversible structural changes at temperatures above 300 °C at one atmosphere, transitioning into amorphous material. This demonstrates that its thermal stability threshold is lower than that of Fe-bearing (Fo90) ringwoodite with identical water content.
- (2)
- Under ambient pressure during heating from 25 °C to 500 °C, the Fe-rich (Fo76) ringwoodite investigated in this study and previously reported Fo82 and Fo90 samples exhibit identical infrared spectral evolution. This indicates minimal influence of Fe content variation on the thermal behavior of hydroxyl groups in ringwoodite.
- (3)
- In situ high-pressure Raman spectroscopy up to 20 GPa reveals no detectable structural changes, indicating consistent stability across hydrous Fe-rich, Fe-bearing, and Mg-endmember ringwoodite within this pressure range.
Supplementary Materials
The following supporting information can be downloaded at: https://www.mdpi.com/article/10.3390/min15101053/s1, Files S1–S2: crystal structure refinement results are provided as CIF files. Figures S1–S5 and Tables S1–S3 were combined into a single PDF file. Figure S1: Illustrative peak-fitting schematic and functional detail of high-temperature Raman spectroscopy in the wavenumber range of 600–1000 cm−1; Figure S2: Illustrative peak-fitting schematic and functional detail of high-temperature Raman spectroscopy in the wavenumber range of 100–500 cm−1; Figure S3: Illustrative peak-fitting schematic and functional detail of high-temperature FTIR analysis; Figure S4: Illustrative peak-fitting schematic and functional detail of high-pressure Raman spectroscopy in the wavenumber range of 100–350 cm−1; Figure S5: Illustrative peak-fitting schematic and functional detail of high-pressure Raman spectroscopy in the wavenumber range of 750–1000 cm−1; Table S1: frequencies (cm−1) of the bands in the spectra from high-temperature Raman spectroscopic measurements of Fe-rich ringwoodite; Table S2: frequencies (cm−1) of the bands in the spectra from high-temperature infrared spectroscopic measurements of Fe-rich ringwoodite; Table S3: frequencies (cm−1) of the bands in the spectra from high-pressure Raman spectroscopic measurements of Fe-rich ringwoodite.
Author Contributions
L.Z. suggested the basis of the paper; J.Y. and L.Z. wrote the paper; T.C. and J.Y. performed Raman spectroscopic measurements; T.C. and J.Y. performed infrared spectroscopic measurements; T.C. and L.Z. performed the XRD analysis. All authors have read and agreed to the published version of the manuscript.
Funding
This study was supported by the National Natural Science Foundation of China (Grant No. 42172044) and the University Innovation Training Program of China University of Geosciences, Beijing.
Data Availability Statement
Data are contained within the article.
Conflicts of Interest
The authors declare no conflicts of interest.
References
- Ringwood, A.E.; Major, A. The system Mg2SiO4-Fe2SiO at high pressures and temperatures. Phys. Earth Planet. Inter. 1970, 3, 89–108. [Google Scholar] [CrossRef]
- Pearson, D.G.; Brenker, F.E.; Nestola, F.; McNeill, J.; Nasdala, L.; Hutchison, M.T.; Matveev, S.; Mather, K.; Silversmit, G.; Schmitz, S.; et al. Hydrous mantle transition zone indicated by ringwoodite included within diamond. Nature 2014, 507, 221–224. [Google Scholar] [CrossRef]
- Kohlstedt, D.L.; Keppler, H.; Rubie, D.C. Solubility of water in the α, β and γ phases of (Mg,Fe)2SiO4. Contrib. Mineral. Petrol. 1996, 123, 345–357. [Google Scholar] [CrossRef]
- Fei, H.; Katsura, T. High water solubility of ringwoodite at mantle transition zone temperature. Earth Planet. Sci. Lett. 2020, 531, 115987. [Google Scholar] [CrossRef]
- Huang, X.; Xu, Y.; Karato, S. Water content in the transition zone from electrical conductivity of wadsleyite and ringwoodite. Nature 2005, 434, 746–749. [Google Scholar] [CrossRef]
- Inoue, T.; Tanimoto, Y.; Irifune, T.; Suzuki, T.; Fukui, H.; Ohtaka, O. Thermal expansion of wadsleyite, ringwoodite, hydrous wadsleyite and hydrous ringwoodite. Phys. Earth Planet. Inter. 2004, 143–144, 279–290. [Google Scholar] [CrossRef]
- Ye, Y.; Schwering, R.A.; Smyth, J.R. Effect of hydration on thermal expansion of forsterite, wadsleyite and ringwoodite at ambient pressure. Am. Mineral. 2009, 94, 899–904. [Google Scholar] [CrossRef]
- Ye, Y.; Brown, D.A.; Smyth, J.R.; Panero, W.R.; Jacobsen, S.D.; Chang, Y.Y.; Townsend, J.P.; Thomas, S.-M.; Hauri, E.H.; Dera, P.; et al. Compressibility and thermal expansion of hydrous ringwoodite with 2.5(3) wt% H2O. Am. Mineral. 2012, 97, 573–582. [Google Scholar] [CrossRef]
- Mrosko, M.; Koch-Müller, M.; McCammon, C.; Rhede, D.; Smyth, J.R.; Wirth, R. Water, iron, redox environment: Effects on the wadsleyite–ringwoodite phase transition. Contrib. Mineral. Petrol. 2015, 170, 9. [Google Scholar] [CrossRef]
- Kleppe, A.K.; Jephcoat, A.P.; Smyth, J.R.; Frost, D.J. On protons, iron and the high-pressure behavior of ringwoodite. Geophys. Res. Lett. 2002, 29, 17-1–17-4. [Google Scholar] [CrossRef]
- Schmandt, B.; Jacobsen, S.D.; Becker, T.W.; Liu, Z.; Dueker, K.G. Dehydration melting at the top of the lower mantle. Science 2014, 344, 6189. [Google Scholar] [CrossRef]
- Liu, L.; Lin, C.-C.; Mernagh, T.P.; Inoue, T. Raman spectra of γ-Mg2SiO4 at various pressures and temperatures. Phys. Chem. Miner. 2002, 29, 181–187. [Google Scholar] [CrossRef]
- Jin, Y.; Huang, W.; Wang, Z.; Sun, W.; Liu, Y.; Xia, Q.; Yang, Y. Behavior of hydrogen defect and framework of Fe-bearing wadsleyite and ringwoodite at high temperature and high pressure. Am. Mineral. 2023, 108, 1232–1241. [Google Scholar] [CrossRef]
- Mrosko, M.; Lenz, S.; McCammon, C.A.; Taran, M.; Wirth, R.; Koch-Müller, M. Hydrogen incorporation and the oxidation state of iron in ringwoodite: A spectroscopic study. Am. Mineral. 2013, 98, 629–636. [Google Scholar] [CrossRef]
- Chopelas, A.; Boehler, R.; Ko, T. Thermodynamics and behavior of γ-Mg2SiO4 at high pressure: Implications for Mg2SiO4 phase equilibrium. Phys. Chem. Miner. 1994, 21, 351–359. [Google Scholar] [CrossRef]
- Liu, L.; Mernagh, T.P.; Irifune, T. High-pressure Raman spectra of β-Mg2SiO4, γ-Mg2SiO4, MgSiO3-ilmenite and MgSiO3 pervoskite. Phys. Chem. Miner. 1994, 55, 185–193. [Google Scholar] [CrossRef]
- Kleppe, A.K.; Jephcoat, A.P.; Smyth, J.R. Raman spectroscopic study of hydrous γ-Mg2SiO4 to 56.5 GPa. Phys. Chem. Miner. 2002, 29, 473–476. [Google Scholar] [CrossRef]
- Zerr, A.; Reichmann, H.; Euler, H.; Boehler, R. Hydrostatic Compression of γ-(Mg0.6,Fe0.4)SiO4 to 50 GPa. Phys. Chem. Miner. 1993, 19, 507–509. [Google Scholar] [CrossRef]
- Meng, Y.; Fei, Y.; Weidner, D.J.; Gwanmesia, G.D.; Hu, J. Hydrostatic compression of γ-Mg2SiO4 to mantle pressures at 700 K: Thermal equation of state and related thermoelastic properties. Phys. Chem. Miner. 1994, 21, 407–412. [Google Scholar] [CrossRef]
- Zhang, L.; Smyth, J.R.; Kawazoe, T.; Jacobsen, S.D.; Niu, J.J.; He, X.J.; Qin, S. Stability, composition, and crystal structure of Fe-bearing phase E in the transition zone. Am. Mineral. 2019, 104, 1620–1624. [Google Scholar] [CrossRef]
- Sheldrick, G.M. SHELXL: Programs for Crystal Structure Analysis; University of Göttingen: Göttingen, Germany, 2018. [Google Scholar]
- Farrugia, L.J. WinGX suite for small-molecule single-crystal crystallography. J. Appl. Crystallogr. 1999, 32, 837–838. [Google Scholar] [CrossRef]
- Cromer, D.T.; Mann, J.B. X-ray scattering factors computed from numerical Hartree-Fock wave functions. Acta Crystallogr. A 1968, 24, 321–325. [Google Scholar] [CrossRef]
- Tokonami, M. Atomic scattering factor for O2−. Acta Crystallogr. 1965, 19, 486. [Google Scholar] [CrossRef]
- Libowitzky, E.; Rossman, G.R. Principles of quantitative absorbance measurements in anisotropic crystals. Phys. Chem. Miner. 1996, 23, 319–327. [Google Scholar] [CrossRef]
- Koch-Müller, M.; Rhede, D. IR absorption coefficients for water in nominally anhydrous high-pressure minerals. Am. Mineral. 2010, 95, 770–775. [Google Scholar] [CrossRef]
- Mao, H.K.; Xu, J.; Bell, P.M. Calibration of the ruby pressure gauge to 800 kbar under quasi-hydrostatic conditions. J. Geophys. Res. 1986, 91, 4673–4676. [Google Scholar] [CrossRef]
- Keppler, H.; Bolfan-Casanova, N. Thermodynamics of water solubility and partitioning. Rev. Mineral. Geochem. 2006, 62, 193–230. [Google Scholar] [CrossRef]
- Bolfan-Casanova, N.; Schiavi, F.; Novella, D.; Bureau, H.; Raepsaet, C.; Khodja, H.; De-mouchy, S. Examination of water quantification and incorporation in transition zone minerals: Wadsleyite, ringwoodite, and phase D using ERDA. Front. Earth Sci. 2018, 6, 75. [Google Scholar] [CrossRef]
- Panero, W.R.; Smyth, J.R.; Pigott, J.S.; Liu, Z.; Frost, D.J. Hydrous ringwoodite to 5 K and 35 GPa: Multiple hydrogen bonding sites resolved with FTIR spectroscopy. Am. Mineral. 2013, 98, 637–642. [Google Scholar] [CrossRef]
- Thomson, A.R.; Piltz, R.O.; Crichton, W.A.; Cerantola, V.; Ezad, I.S.; Dobson, D.P.; Wood, I.G.; Brodholt, J.P. Incorporation of tetrahedral ferric iron into hydrous ringwoodite. Am. Mineral. 2021, 106, 900–908. [Google Scholar] [CrossRef]
- Smyth, J.R.; Holl, C.M.; Frost, D.J.; Jacobsen, S.D.; Langenhorst, F.; McCammon, C.A. Structural systematics of hydrous ringwoodite and water in Earth’s interior. Am. Mineral. 2003, 88, 1402–1407. [Google Scholar] [CrossRef]


Disclaimer/Publisher’s Note: The statements, opinions and data contained in all publications are solely those of the individual author(s) and contributor(s) and not of MDPI and/or the editor(s). MDPI and/or the editor(s) disclaim responsibility for any injury to people or property resulting from any ideas, methods, instructions or products referred to in the content. |
© 2025 by the authors. Licensee MDPI, Basel, Switzerland. This article is an open access article distributed under the terms and conditions of the Creative Commons Attribution (CC BY) license (https://creativecommons.org/licenses/by/4.0/).