Article

Coupled Dissolution with Reprecipitation (CDR) Reactions and Their Impact on Copper Sulphide Mineral Surface Area and Dissolution Rates

1
School of Geography, Earth and Atmospheric Sciences, The University of Melbourne, Melbourne, VIC 3010, Australia
2
WH Bryan Mining and Geology Research Center, Sustainable Minerals Institute, University of Queensland, 40 Isles Rd, Indooroopilly, QLD 4068, Australia
*
Author to whom correspondence should be addressed.
Minerals 2025, 15(3), 214; https://doi.org/10.3390/min15030214
Submission received: 27 January 2025 / Revised: 17 February 2025 / Accepted: 18 February 2025 / Published: 23 February 2025
(This article belongs to the Section Mineral Processing and Extractive Metallurgy)

Abstract

:
Copper is a critical metal required for green energy technologies such as wind turbines and solar cells. However, copper supply is limited by copper recovery from primary copper sulphides (e.g., chalcopyrite-CuFeS2) due to passivating reaction products. Therefore, this study examined surface ‘passivation’ of primary copper sulphide minerals undergoing coupled dissolution with reprecipitation (CDR) reactions and the associated mineral surface changes in acidic and chloride-rich lixiviants (FeCl3-only, AlCl3-rich, NaCl-rich, and CaCl2-rich lixiviants). Acidic FeCl3-only, NaCl-rich, and CaCl2-rich lixiviants resulted in only bornite dissolution and the formation of a residual Cu-S phase and Fe-SO4 phase on the chalcopyrite surface. In contrast, leaching with the AlCl3-rich lixiviant resulted in both chalcopyrite and bornite dissolution with limited hydrolysis of Fe3+ to Fe-hydroxy sulphates and minimal Fe3+ flux inhibition to the copper sulphide minerals surface due to the ion exchange mechanism between Al3+ and Fe3+. Further, there was preferential formation of an Al-SO4 phase at consistently high Eh and acidity, thereby a high availability of Fe3+ in solution for enhanced copper dissolution from both bornite and chalcopyrite. These findings could serve as a reference for coupled dissolution with reprecipitation reactions during copper sulphide leaching, offering a pathway to more efficient and sustainable copper extraction from low-grade ores.

Graphical Abstract

1. Introduction

Copper, an essential component in green technologies such as wind turbines and solar cells, faces extraction challenges from primary copper sulphides such as chalcopyrite (CuFeS2). These challenges arise primarily due to the formation of passivating reaction products that inhibit further dissolution of copper. Examples of common passivating reaction products include elemental sulphur and secondary copper sulphides such as covellite, iron hydroxide, and jarosite, which can block reagent access to the mineral surface, adsorb ions, and alter surface area and porosity [1,2,3,4,5,6,7,8]. This occurs because of density differences and solubility variations between the primary mineral and its reaction products, impacting the efficiency of copper extraction processes [9,10,11,12].
The dissolution of primary copper sulphides, such as chalcopyrite (CuFeS2), presents several unresolved questions regarding the influence of reaction products on copper recovery. One major issue is the unclear role of sulphur formation, particularly whether dense or porous sulphur layers inhibit chalcopyrite dissolution. Previous studies have shown a lack of consensus on how the crystallinity and type of sulphur formed affect the process [1,2,3,13]. Another point of contention is the potential inhibition by a Fe-deficient Cu-S-rich phase during chalcopyrite dissolution. Some research suggests these phases, for example, covellite (CuS) and chalcocite (Cu2S), might enhance copper recovery due to their higher solubility in acidic conditions [14,15] facilitated by galvanic interactions that maintain a redox potential conducive to chalcopyrite dissolution [16]. However, others argue that this phase could hinder dissolution due to the slow solid-state diffusion of copper and iron species through the layer [17].
Additionally, the complex interplay between iron hydroxy sulphates, particularly jarosite (MFe3(SO4)2(OH)6; M = Na+, H3O+, K+, Ag+, NH4+, or ½Pb2+) and its physical and chemical properties significantly impacts the efficiency of copper dissolution from chalcopyrite, necessitating further research to clarify these interactions and optimize copper extraction processes. The substituents present in jarosite significantly affect both its stability and its passivation behaviour. These effects are modulated by the nature of the leaching medium and the interaction with associated gangue minerals [18,19,20]. Jarosite often forms from a precursor like schwertmannite, transforming into more stable compounds over time, with its formation dependent on pH, temperature, and available cations [21,22].
Past studies on copper sulphides (particularly chalcopyrite) have utilized solution stoichiometry analysis, scanning electron microscopy (SEM), optical microscopy, and X-ray diffraction (XRD) to analyse surface reactions, observing phenomena like the replacement of chalcopyrite by jarosite [15,23] or the transformation of bornite/chalcopyrite into covellite/chalcocite [24,25]. These techniques offer qualitative insights but limited quantitative data on metal diffusion and mineral composition. Stoichiometry analysis might not provide direct proof for the existence of a passivation layer [3]. XRD detects bulk mineralogy but is limited to amorphous or nano-sized crystals. XPS has been criticized for its inaccuracies due to impurities or mixed oxidation states, with Fe-deficient sulphides indicated by sulphur peak broadening [3]. To address ex-situ analysis limitations, in-situ techniques, including scanning electrochemistry microscopy, auger electron spectroscopy (AES), and secondary ion mass spectrometry (SIMS) are employed to preserve surface conditions for accuracy [26,27].
The present study builds upon our prior research [18,19,20], which demonstrated an enhancement in the leaching of chalcopyrite and bornite for copper extraction using AlCl3-rich lixiviants. Per fluid chemistry and XRD analysis, the presence of Al3+(aq) in AlCl3-rich lixiviant led to the formation of AlSO4+(aq) species and Al-SO4 phases at consistently high Eh (550–650 mV vs. SHE) and acidity (pH 1–3), which lowered the sulphate activity for ferric hydroxy sulphate phases such as jarosite and sideronatrite formation. This resulted in relatively high availability of ferric iron and an initial high rate of Fe3+(aq)-promoted copper leaching in AlCl3-rich lixiviant as compared to NaCl-rich, FeCl3-only, and acid-only lixiviants. Further, the Al-rich phases formed in AlCl3-rich lixiviants were amorphous and porous, thereby leading to relatively high Fe-diffusion rates to chalcopyrite and bornite mineral surfaces in AlCl3-rich lixiviants.
Therefore, this study utilizes electron microprobe microanalysis (EMPA) and reflective and confocal microscopy to examine changes in topography, mineralogy, and surface chemistry during the dissolution of primary copper sulphides with subsequent precipitation of secondary copper sulphides (e.g., covellite) and iron hydroxy sulphates, including jarosite. This was also supported by monitoring the rate of element consumption/release in acidic chloride reagents (NaCl, FeCl3, CaCl2, and AlCl3) due to the known merits of fast copper sulphide dissolution in chloride media.

2. Materials and Methods

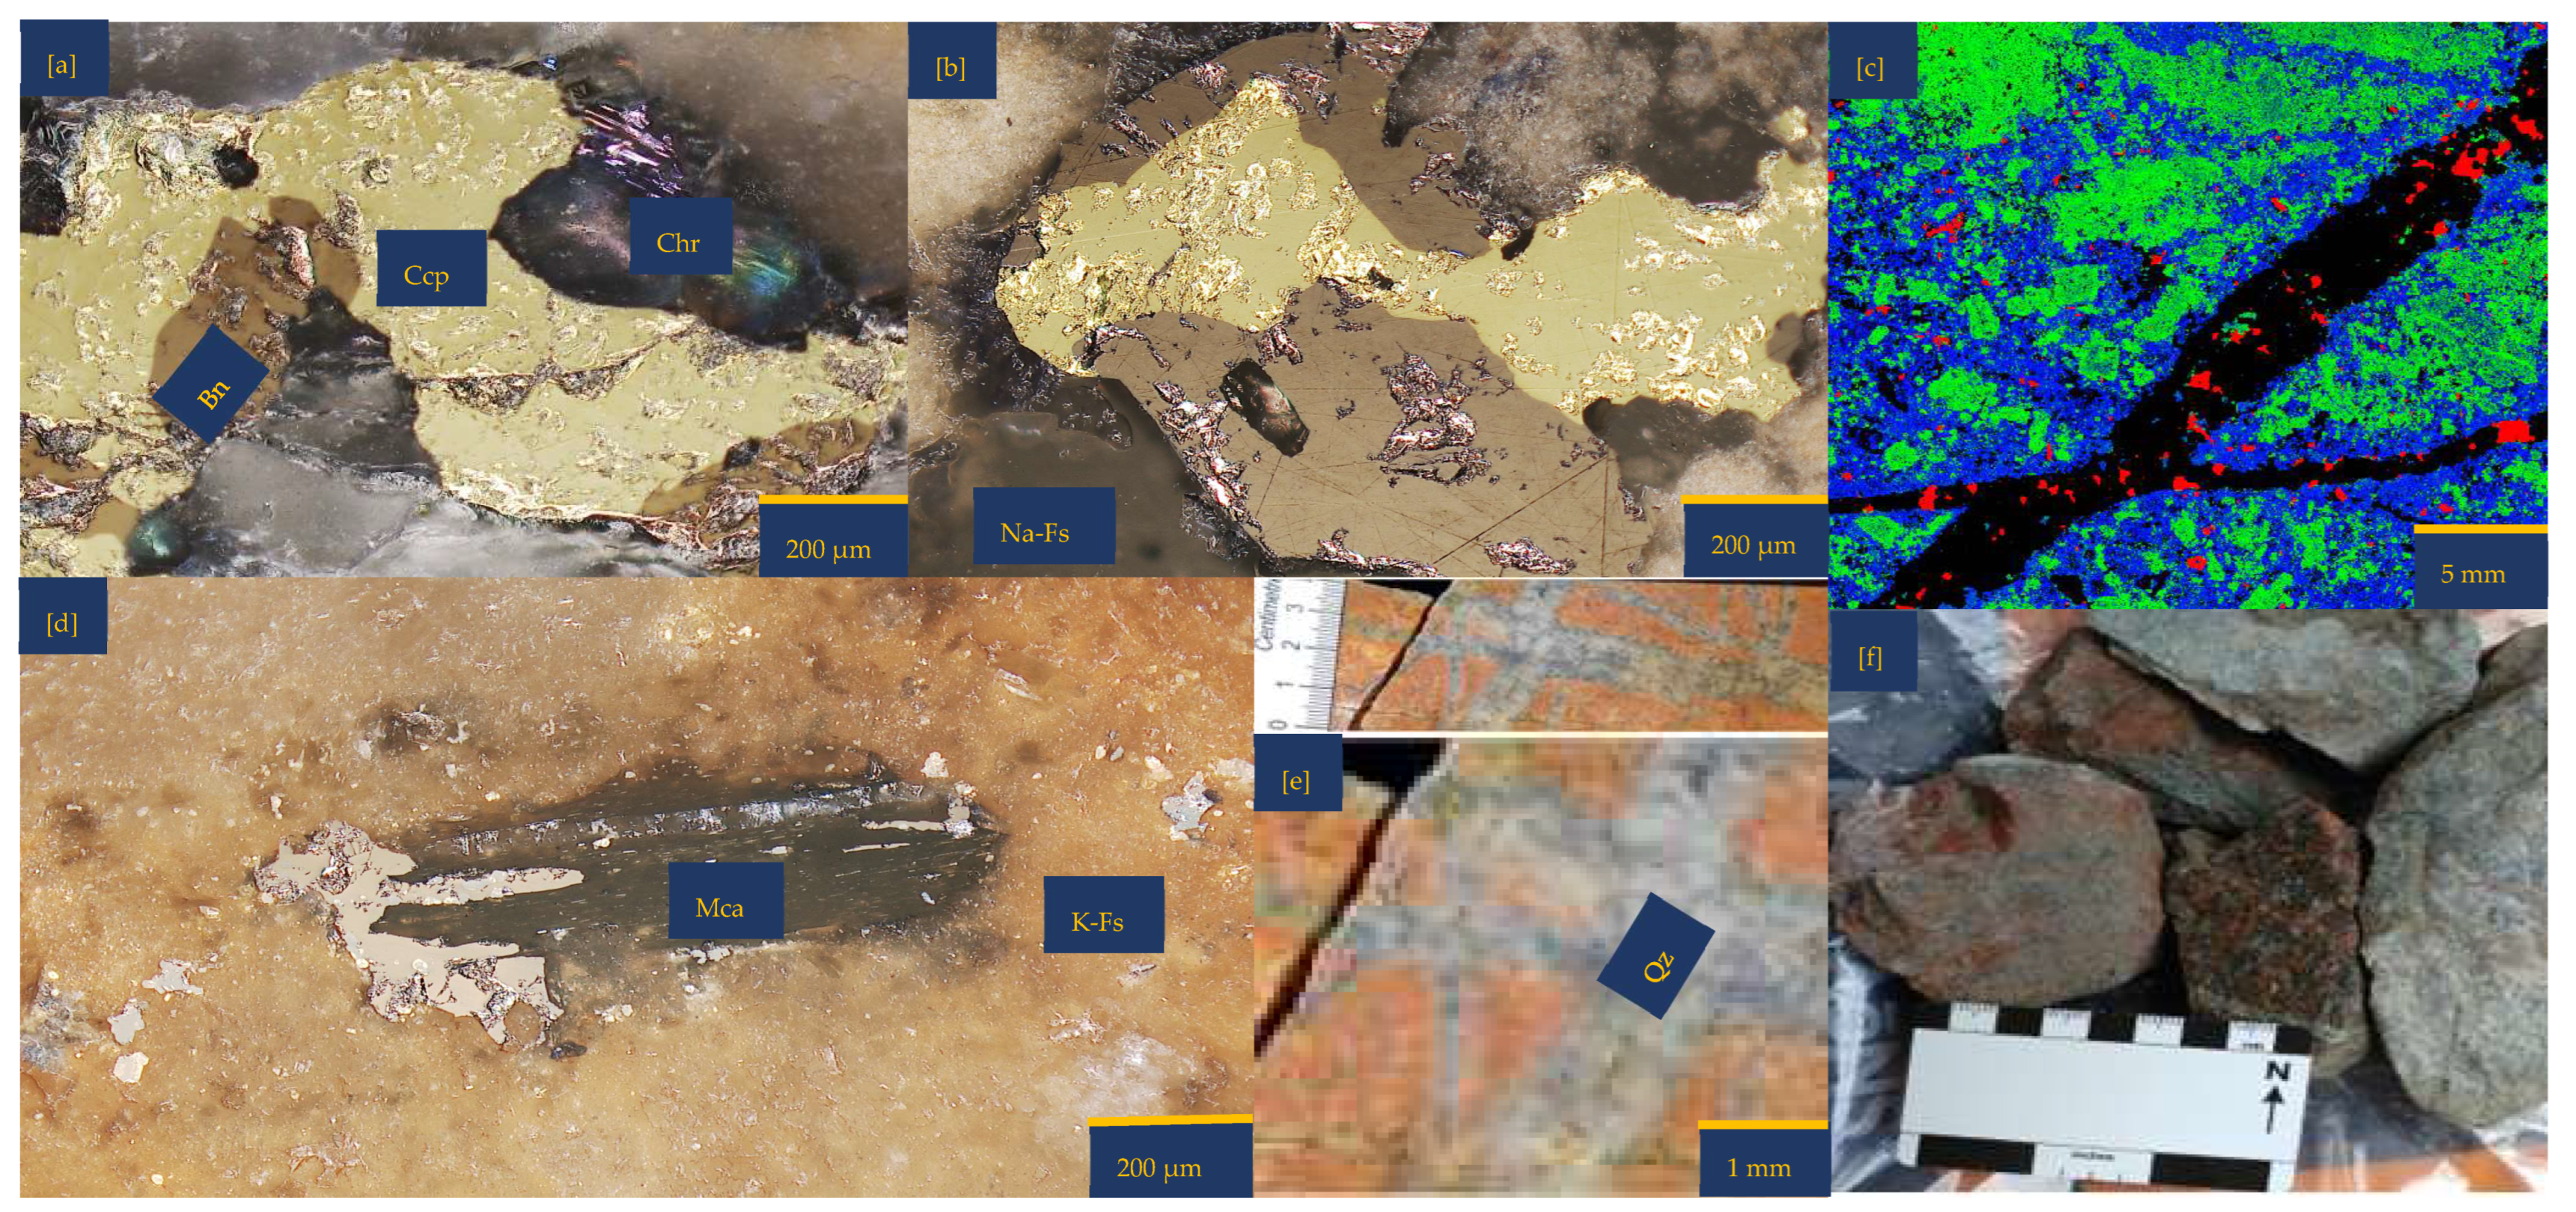
2.1. Ore Characterization Before the Experiment

The ore material used in this study was 1 kg of low-grade porphyry copper-gold mineralized ore from the Northparkes Cu-Au mine in New South Wales (NSW) with a grain size in the range of 2 to 50 mm obtained through the ORE Research & Exploration Pty Ltd. Bayswater, Melbourne, Australia. First, it was sectioned utilizing Struers Accutom–100 equipment and subjected to thin-section preparation. Six thin sections were prepared and analysed under light microscopy using a Zeiss Axio Imager with Trackworks v3.1.10 [28,29].
Grain size fraction analysis was conducted at the University of Melbourne’s Trace Analysis for Chemical, Earth, and Environmental Sciences (TrACEES) platform. The bulk sample was crushed and ethanol-milled, and the granulated sample was screened into three-size fractions. Three samples with different size fractions of the porphyry ore material were submitted to the CSIRO Land Water, Adelaide, Australia, for quantitative mineralogy by X-ray diffraction (XRD) analysis and major and minor element analysis by X-ray fluorescence spectrometry (XRF). For the XRD and XRF analysis details, see the Supplementary Materials. Qualitative analysis was performed on the XRD data using an in-house XPLOT and HighScore Plus (from PANalytical, Malvern, UK) search and match software. Quantitative analysis was performed on the XRD data using the commercial package TOPAS v7.0 for Bruker AXT. The results were normalized to 100% and, hence, do not include estimates of unidentified or amorphous materials.

2.2. Preparation of Wafers for Microscopy, EPMA, and Batch Experiment

Large solid samples were cut to 10 mm × 30 mm × 3 mm wafer size using a sawing machine at the TrACEES platform. The chosen surface of interest on the wafer was roughly polished using a Struers RotoForce-4 and RotoPol-21 rotary polisher for 30–60 min. Water was used as a lubricant during the polishing. The abundance of chalcopyrite within quartz veins or the presence of related feldspathic minerals as distinguishing factors guided the selection of the areas of interest.
The roughly polished surface was gently polished in a multi-step process with Struers RotoForce-4 and Struers RotoPol-21 instruments down to 1 µm over 30–60 min. First, Struers MD-piano grinding discs with 1200 and 2400 mesh numbers were used sequentially for gradual polishing. A water-based polycrystalline diamond suspension (with different particle sizes of 6.0, 3.0, and 1.0 µm in diameter) was successively used on a polishing cloth to further smoothen the surface. An in-house lubricant was used for polishing at this stage.
This rigorous sample preparation was performed to maintain the exact multi-layer sample structures of a micrometer size and thus to ensure the reliable investigation of the samples using the multi-modal microscopy approach in this study. During each of the polishing stages, the sample was regularly observed under a reflective microscope to confirm consistent and uniform polishing. After the polishing, the samples were carbon sputtered and digitized with an in-house digitizer for multi-modal analysis. Please refer to Supplementary Materials for an example optical image of the polished wafers before the batch experiment.

2.2.1. Multi-Modal Fiducial Marking and Digitization

In this study, a multi-modal analysis was considered to reveal coupled dissolution with reprecipitation reactions occurring at specific regions of interest. Firstly, two fiducial marks were placed at the diagonals of the wafer. The Zeiss Axio Imager microscope was employed to identify regions of interest. Then, the wafer was digitized and guided by these fiducial marks as start and end points. The digitization process was done using in-house software called Digimax. This software enabled stage/vector translation of a particular measurement point between the JEOL Field Emission Electron Probe Micro Analyzer (FE-EPMA) and the Zeiss microscope used in this study. In other words, by locating the fiducials in the Zeiss microscope and entering the coordinates into the digitizer file in the software, this information could be converted between the Zeiss microscope and the FE-EPMA. This made it possible to immediately drive to the coordinated areas of interest for EPMA analysis after importing the XYZ points chosen using the Zeiss microscope. The samples were firmly placed on the stages of the Zeiss microscope and FE-EPMA to ensure accurate analysis and reduce error.

2.2.2. Optical (Reflective) Microscopy

Digital images were captured in reflected light mode using a Zeiss Axio Imager M1m motorized microscope fitted with a PI piezo-motor scanning stage and a 4 Megapixel IDS µEye USB 3 CMOS digital camera connected to a control computer using Trackworks software version 3.1.10 [28,29]. The analysis was conducted at the TrACEES platform.
The software enabled the capture of a wide mosaic of almost the whole wafer surface sequentially at 10× and 20× focal points. A mosaic is the cumulative assembly of individual images of various regions of interest (ROI) resembling the whole surface. To obtain an appropriate mosaic image, the coarse setting for focusing was adjusted to 10 μm, the fine setting for focusing to 50 μm, and the brightness was set to 32% in the Trackworks software version 3.1.10 [28,29]

2.2.3. Electron Probe Microanalysis (EPMA)

EPMA was also conducted on the TrACEES platform. A JEOL JXA-8530F Field Emission Electron Probe Microanalyzer (FE-EPMA) instrument with five wavelength dispersive spectrometers (WDS) to analyse elements with detection limits below 100 ppm and an energy dispersive spectrometer (EDS) to independently analyse the same range of elements at detection limits of less than 2000 ppm was used. After the polishing and reflective microscopy study as described above, the samples were carbon-sputtered to minimize charging effects and enhance conductivity prior to the EPMA analysis. The samples were mounted and capped in an air-isolated chamber to avoid further oxidation of the surface after atmospheric exposure.
In this study, both high (15 keV) and low accelerating voltages (7 keV) were utilized for analysis. The reason for the low voltage, especially for the leached surface, was to analyse submicron areas with small spot sizes to enhance the characterisation of reactions occurring at a single ore grain surface. The WDS channels were interchanged for the 7 keV and 15 keV analyses as (i) 7 keV–Cu La, Fe La, K Ka, S Ka, Si Ka, and (ii) 15 keV–S Ka, Na Ka, K Ka, Fe Ka, Cu Ka. The 7 keV analysis used a step size of 2.5 µm and a beam size of 0.5 µm, while the 15 keV analysis used a step size of 5 µm and a beam size of 1 µm. The EPMA data was further processed with the CalcZAF program (Probe for EPMA-Xtreme Edition v. 13.2.2) and reported results as atomic weight percent.

2.2.4. Surface Area Analysis

The granulated solid was rinsed in acetone, Milli-Q® (Merck KGaA, Germany) ultrapure water (resistivity 18.2 MΩ·cm @ 25 °C; total organic carbon (TOC) ≤ 5 ppb) and dried at 40 °C before porosity and surface area analyses. The surface area was measured with a Micrometrics 3 Flex Version 4.05 at the Materials Characterization and Fabrication Platform (MCFP) of the University of Melbourne. The sample mass was 1 ± 0.05 g. The evacuation pressure was 0.67 kPa at a holding pressure of 13.3 kPa. The heating temperature was from 50 to 350 °C for 45–480 min. Helium and nitrogen gas were used in the determination of the Brunauer–Emmett–Teller (BET) total specific surface area (m2/g), t-plot micropore surface area (m2/g), and t-plot external specific surface area (m2/g). The material reported 0.54 m2/g BET, 0.44 m2/g t-external surface area, and 0.10 m2/g t-plot micropore.

2.3. Fluid Preparation

All chemical reagents used were of analytical grade. The fluid preparation in this study followed the same steps as described in [18,20]. The fluid constraints for the various experiments are given in Table 1.

2.4. Batch Experiments

Batch experiments were conducted with 5.00 ± 0.03 g of granulated solid and a single wafer (4.00 ± 0.02 g) per 100 mL of lixiviant at ambient temperature. The granulated solid material served as a source of ions to the solution and, subsequently, the surface of the wafer [30]. This was expected to enhance the coupled dissolution with reprecipitation kinetics of the bulk wafer, owing to the existence of the copper sulphide minerals in a predominantly high silicate gangue mineral matrix (Figure 1).
An in-house setup (Figure S2 of Supplementary Materials) was made to incorporate the continuous stirring of five (5) Nalgene bottles at 25 °C submerged in a water bath. An underwater air-driven turbine magnetic stirrer from Sigma Aldrich, St. Louis, MO, USA, was utilized for the continuous stirring during the experiment. A low-pressure air supply at 3 to 8 psi (21–55 kPa) powered these magnetic stirrers and controlled the stirring rate. A ring with a total mass of 1 kg from Rowe Scientific, Melbourne, Australia, was placed around the neck of each bottle to hold the bottle down onto the stirrer. The purpose of stirring in this study was to suspend the particles to avoid caking and enhance the transport of dissolved ions to the wafer surface.
Pre-processing of both the granulated and wafer samples involved sonication in Milli-Q® ultrapure water (resistivity 18.2 MΩ·cm @ 25 °C; total organic carbon (TOC) ≤ 5 ppb) for 15 min. This was followed by rinsing and sonication in acetone for 15 min and, finally, rinsing and sonication in Milli-Q® ultrapure water for another 15 min. The method was to ensure the sample was free from any oxidized layers and impurities. The samples were then dried at 40 °C overnight. The experiments were run for 30 days. A summary of the various experimental constraints is given in Table 1. The ionic strength and water activity in Table 1 were calculated with PHREEQC version 3.7.3 [31]. According to Table 1, B-H25, B-Fe25, B-Ca25, B-Na25, B-Al25 and B-Al45 define experiments conducted with acid-only, FeCl3-only, CaCl2-rich, NaCl-rich, and AlCl3-rich lixiviants at 25 and 45 °C, respectively. B-H25 and B-Fe25 were acidified with 0.5 M H2SO4.
Table 1. Experimental conditions per this study over a 30-day period. The unit of ionic strength and the various ions is mol/L.
IDMediumFe3+ ClSO42−Ionic StrengthActivity of H2OInitial pH ± 0.1Initial Eh (vs. SHE) ± 0.5Initial Temperature ± 0.1
b B-H25a FW- --0.6900.991pH 1.5609.6 mV25.0 °C
c B-Fe25FW0.10 0.30-1.0610.985pH 1.5650.0 mV25.0 °C
IDMediumFe3+Ca2+K+Mg2+Na+ClSO42−Ionic strengthActivity of H2OInitial pH ± 0.1Initial Eh (vs. SHE) ± 0.5Initial temperature ± 0.1
d B-Ca25CaCl2-rich0.100.060.500.141.001.200.501.9030.948pH 1.7639.0 mV25.0 °C
IDMediumFe3+ K+Mg2+Na+ClSO42−Ionic strengthActivity of H2OInitial pH ± 0.1Initial Eh (vs. SHE) ± 0.5Initial temperature ± 0.1
e B-Na25NaCl-rich0.10 0.500.143.603.680.503.5750.875pH 1.5642.4 mV25.0 °C
IDMediumFe3+Al3+K+Mg2+Na+ClSO42−Ionic strengthActivity of H2OInitial pH ± 0.1Initial Eh (vs. SHE) ± 0.5Initial temperature ± 0.1
f B-Al25AlCl3-rich0.100.870.500.141.003.690.505.2430.900pH 1.3666.6 mV25.0 °C
g B-Al45AlCl3-rich0.100.870.500.141.003.690.505.2980.900pH 1.3666.6 mV45.0 °C
a FW—freshwater system. b B-H25, c B-Fe25, d B-Ca25, e B-Na25, f B-Al25 and g B-Al45 define experiments conducted with acid-only, FeCl3-only, CaCl2-rich, NaCl-rich, and AlCl3-rich lixiviants at 25 and 45 °C, respectively. B-H25 and B-Fe25 were acidified with 0.5 M H2SO4.
Figure 1. Porphyry copper sample from Northparkes, New South Wales (NSW): (a,b) Reflective microscopy image showing bornite (Bn) side by side with chalcopyrite (Ccp). These two copper sulphides are surrounded by feldspathic gangue minerals (Na and K-feldspar) and chlorite (Chr); (c) A multi-coloured segmented image obtained from Electron Probe Microscopy Analysis (EPMA). The segmentation was attained with JEOL EPMA Data Viewer version 12. Blue—K-feldspar; Green—Na-Feldspar; Red—copper sulphides; Black—Quartz; (d) Reflective microscopy image showing mica (Mca) interspersing bornite (Bn) and surrounded by K-Feldspar (K-fs) (e,f) The as-received samples highlight the quartz (Qz) vein and pinkish to the dark brown colouration of the sample due to the high felspathic alteration and composition.
Minerals 15 00214 g001

2.5. Post-Experimental Analysis

Aliquots (1.5 mL) were sampled for pH, Eh, and fluid chemistry analysis during the batch experiments. Samples were taken at 2, 4, 8 and 24 h, and subsequently every 5 days for the 30-day period. They were immediately filtered through a Millipore 0.45 μm nylon membrane, acidified with ultrapure HNO3, and stored at 4 °C. The pH and Eh were measured with the Metrohm, Herisau, Switzerland 902 Titrando instrument. The cationic composition of the solutions was determined using Agilent Technologies, Santa Clara, CA, USA, (5100) ICP-OES instrument against aqueous standards in 2% ultra-pure nitric acid (HNO3).
After the experiment, the wafers were gently washed with isopropanol: water (1:1 vol/vol) to avoid losing the precipitates formed on the surface. Then, the wafers were not polished but subsequently subjected to a microscopic study similar to the pre-experimental case. First, a mosaic of the reacted wafer was taken with the reflective microscope and compared to the image prior to the experiment. Thereafter, the reacted wafer was subjected to EPMA qualitative and quantitative analysis for comparison to the unreacted wafer. It should be noted that the same regions of interest were analysed before and after the experiment. After the experiment, the granulated solids were rinsed in Milli-Q® ultrapure water and dried at 40 °C before being subjected to porosity and surface area analysis as earlier described.

3. Results

An inspection by light microscopy showed bornite (brown) and chalcopyrite (yellowish) side by side (Figure 1a,b). These two Cu-sulphide minerals are surrounded by gangue minerals such as mica and feldspar. The Cu-sulphides are generally shown to be distributed in quartz veins and other feldspathic host rocks. (Figure 1c,e). Mica lamella sheet overgrowth on bornite (Figure 1d) was surrounded by large K-feldspar grains. There are also chlorites associated with the feldspathic minerals. Figure 1b,c,e show veining and potassic alteration that include K-feldspar as veins, selvages to the quartz vein stockwork and fractures, biotite patches, and darkening of the andesitic volcanic country rocks. The XRD results showed the average mineralogical composition of the sample as follows: quartz 21.9%, chlorite 0.3%, mica 7.2%, chalcopyrite 0.7%, hematite 0.3%, orthoclase 34.2%, albite 29.8%, bornite 3.2%, and anhydrite 2.1%. Please refer to the Supplementary Materials for detailed information. Masses of 10.00%, 89.12%, and 0.81% were reported for +0.425–1.00 mm, +0.250–0.425 mm, and +0.125–0.250 mm, respectively. See Table S2 of Supplementary Materials for further details.

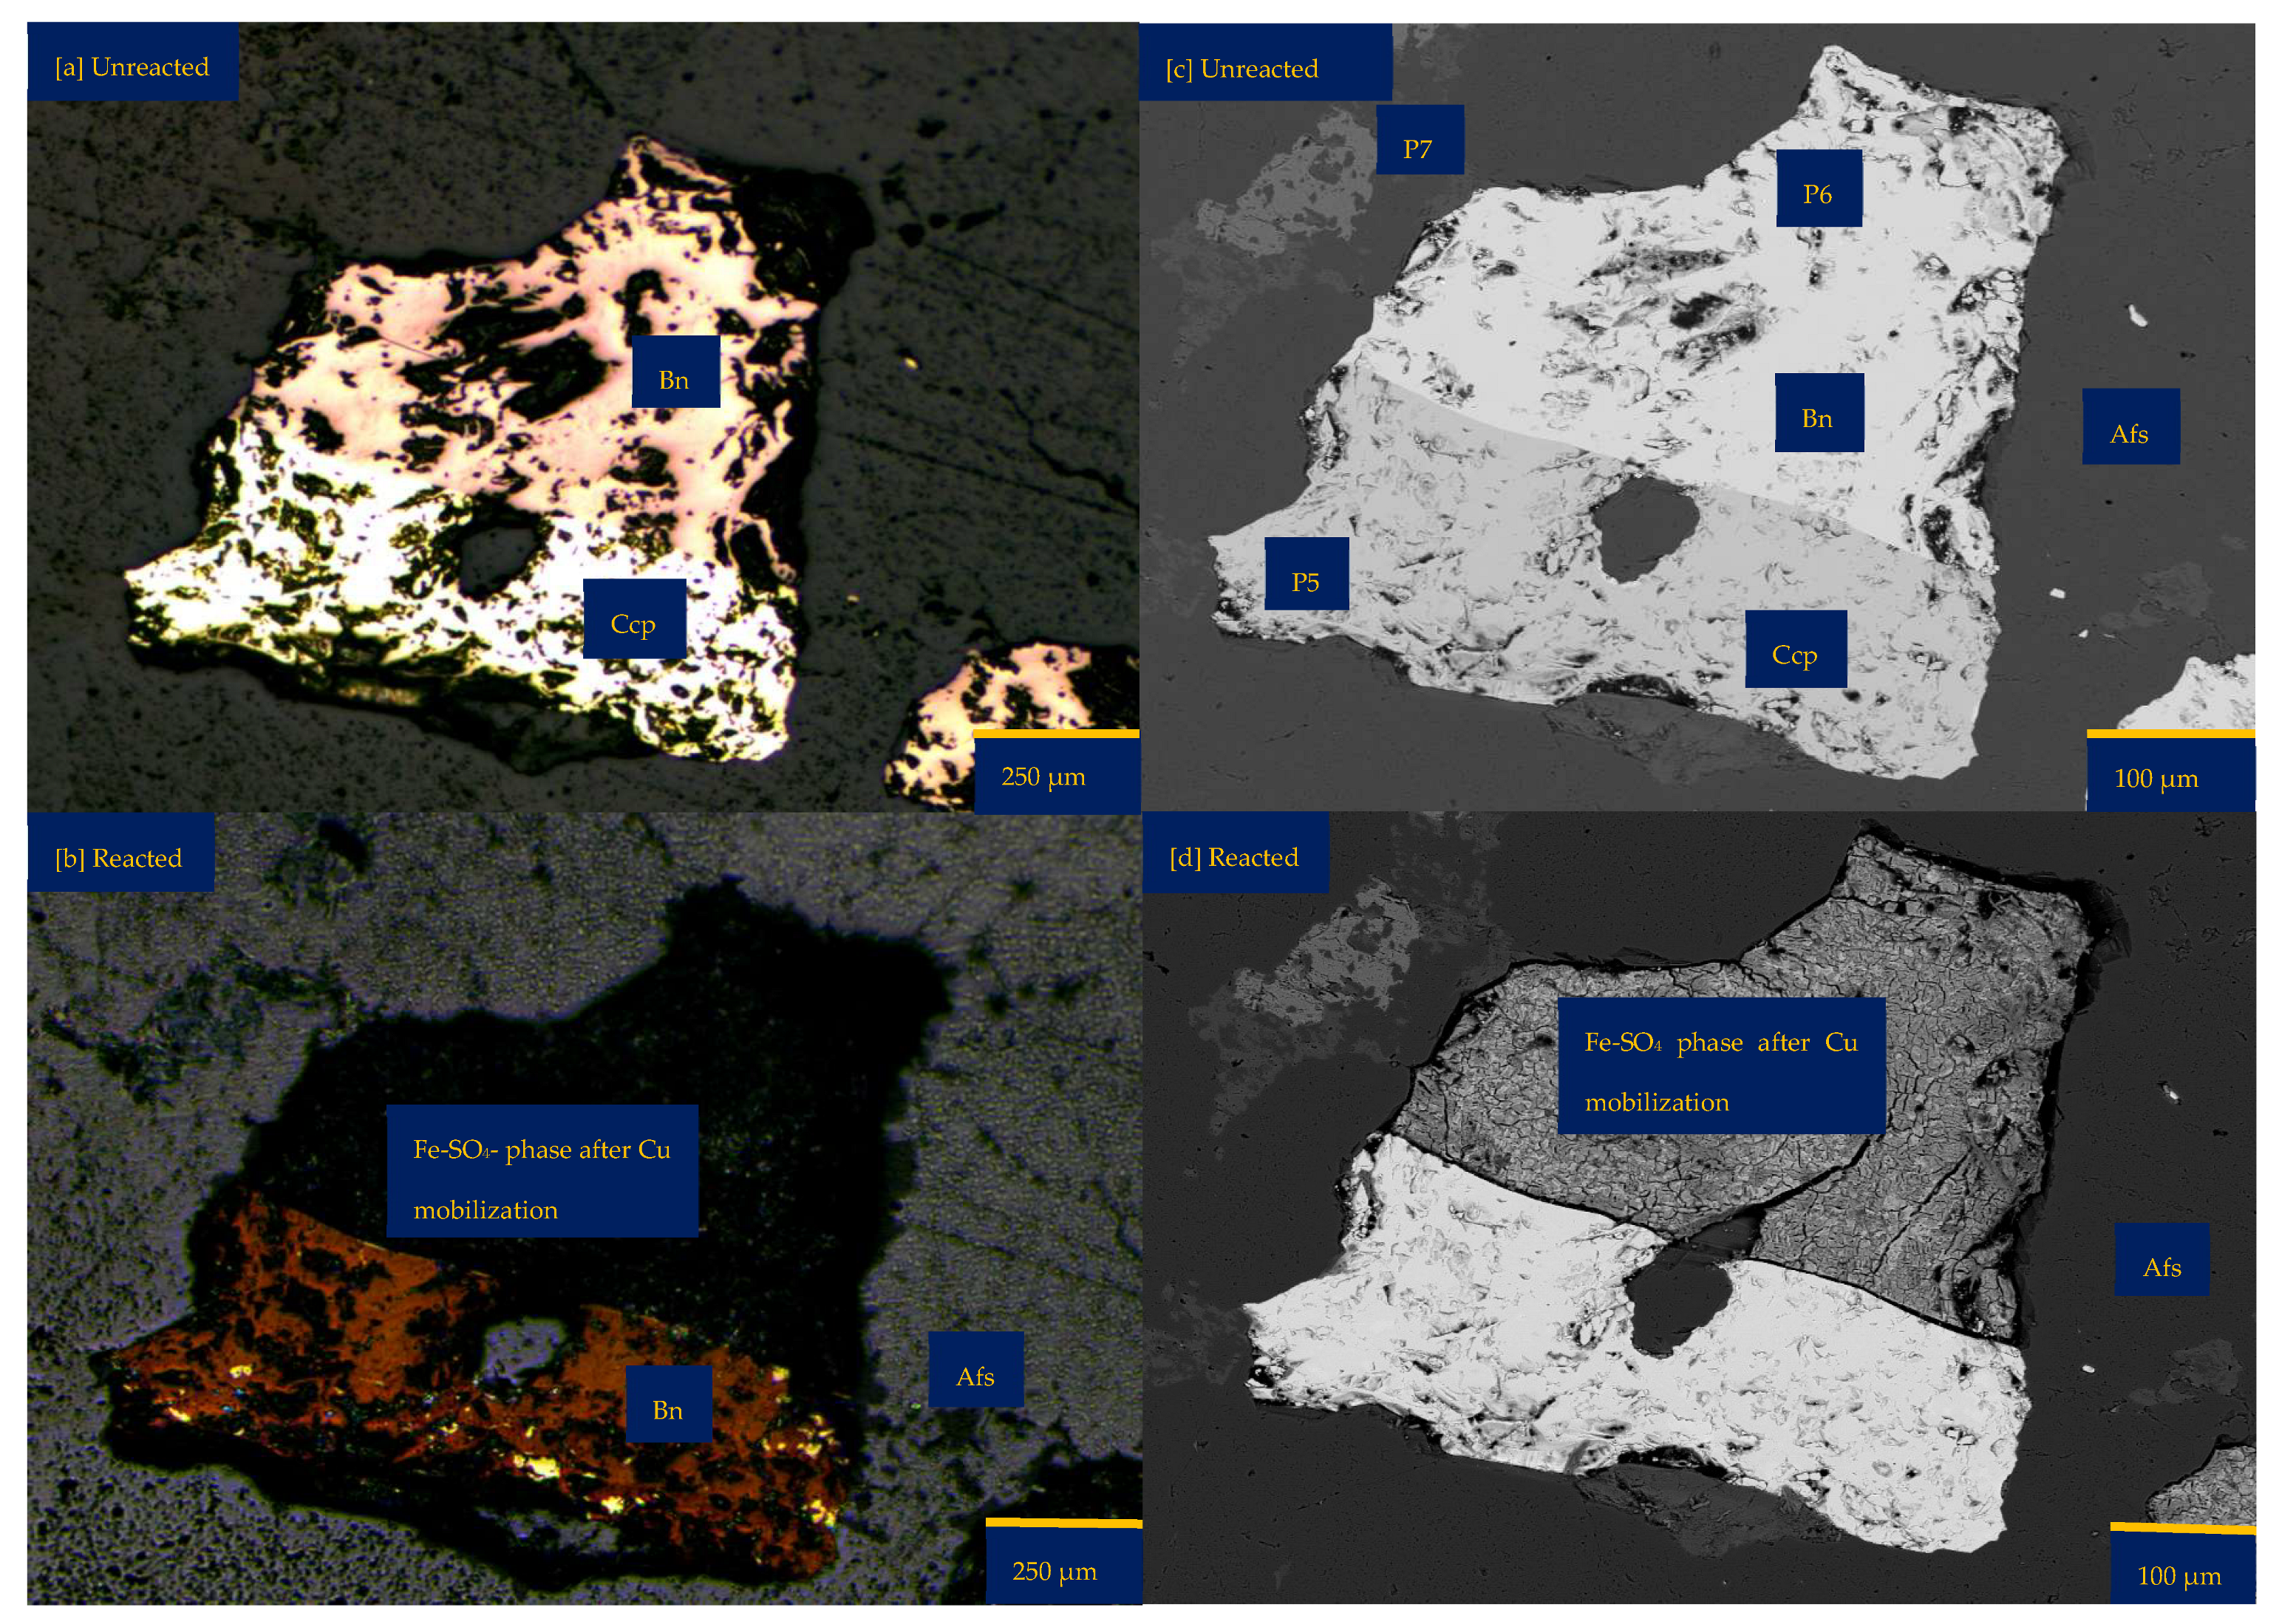
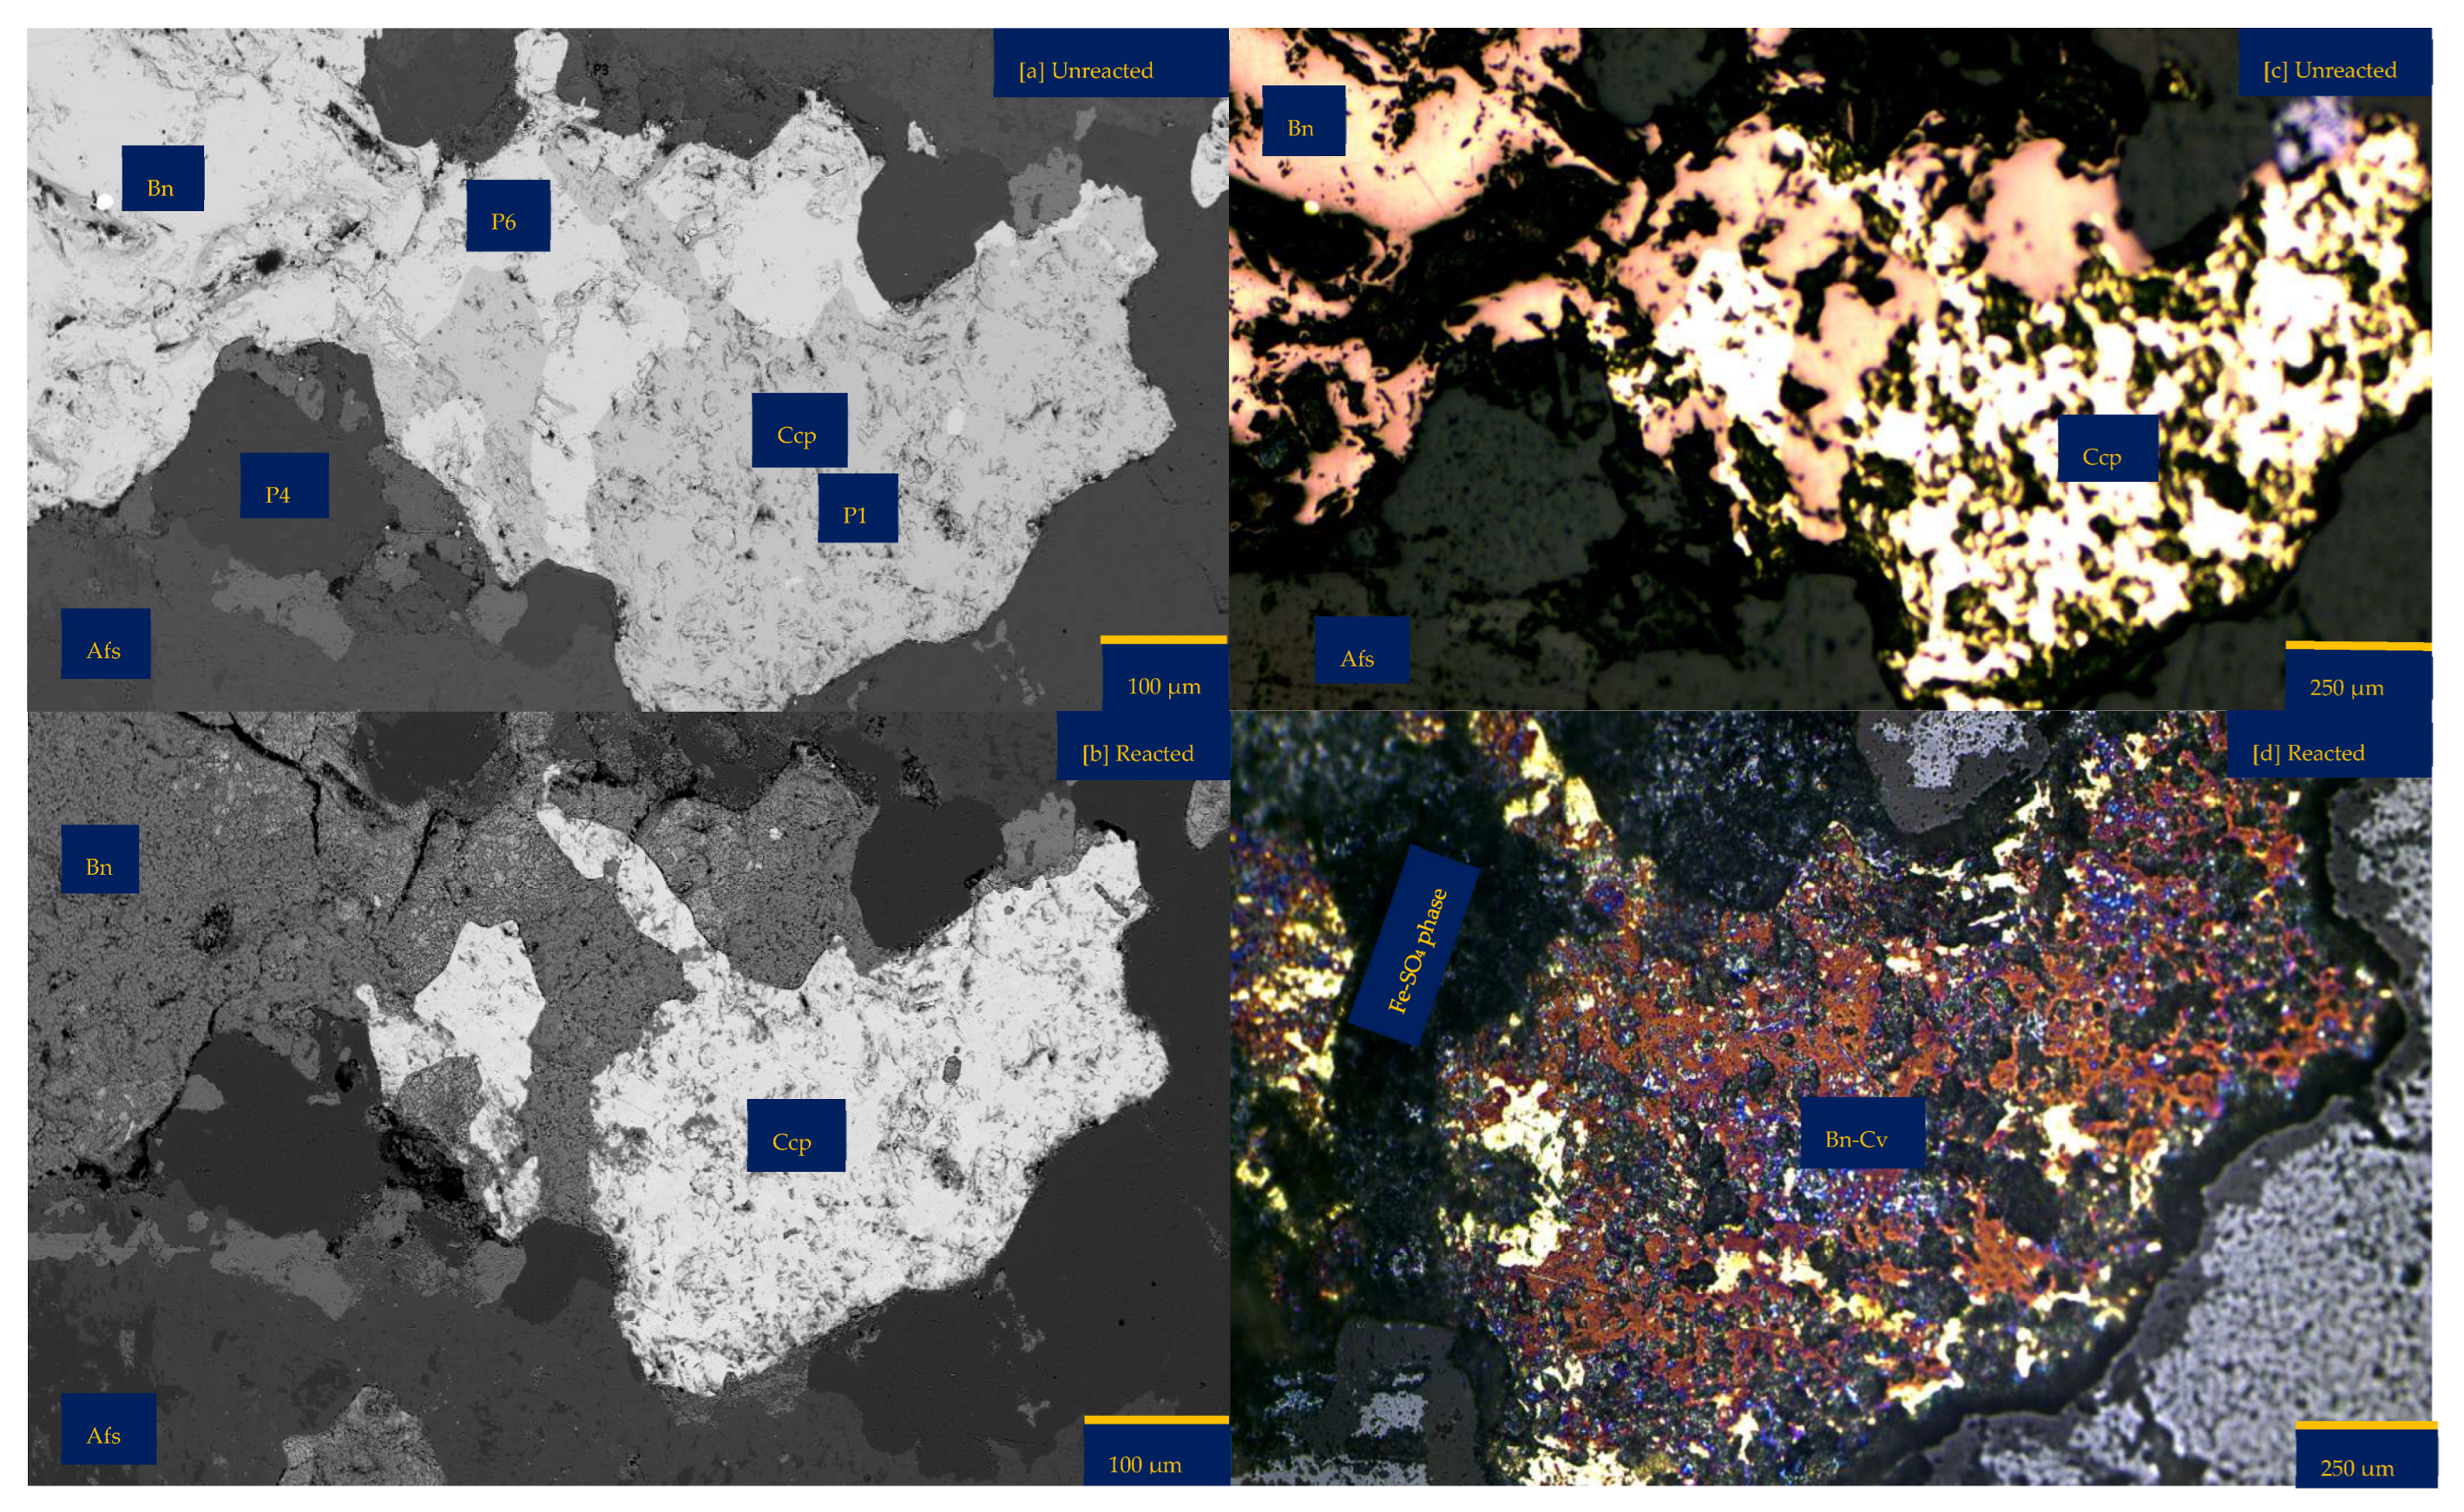
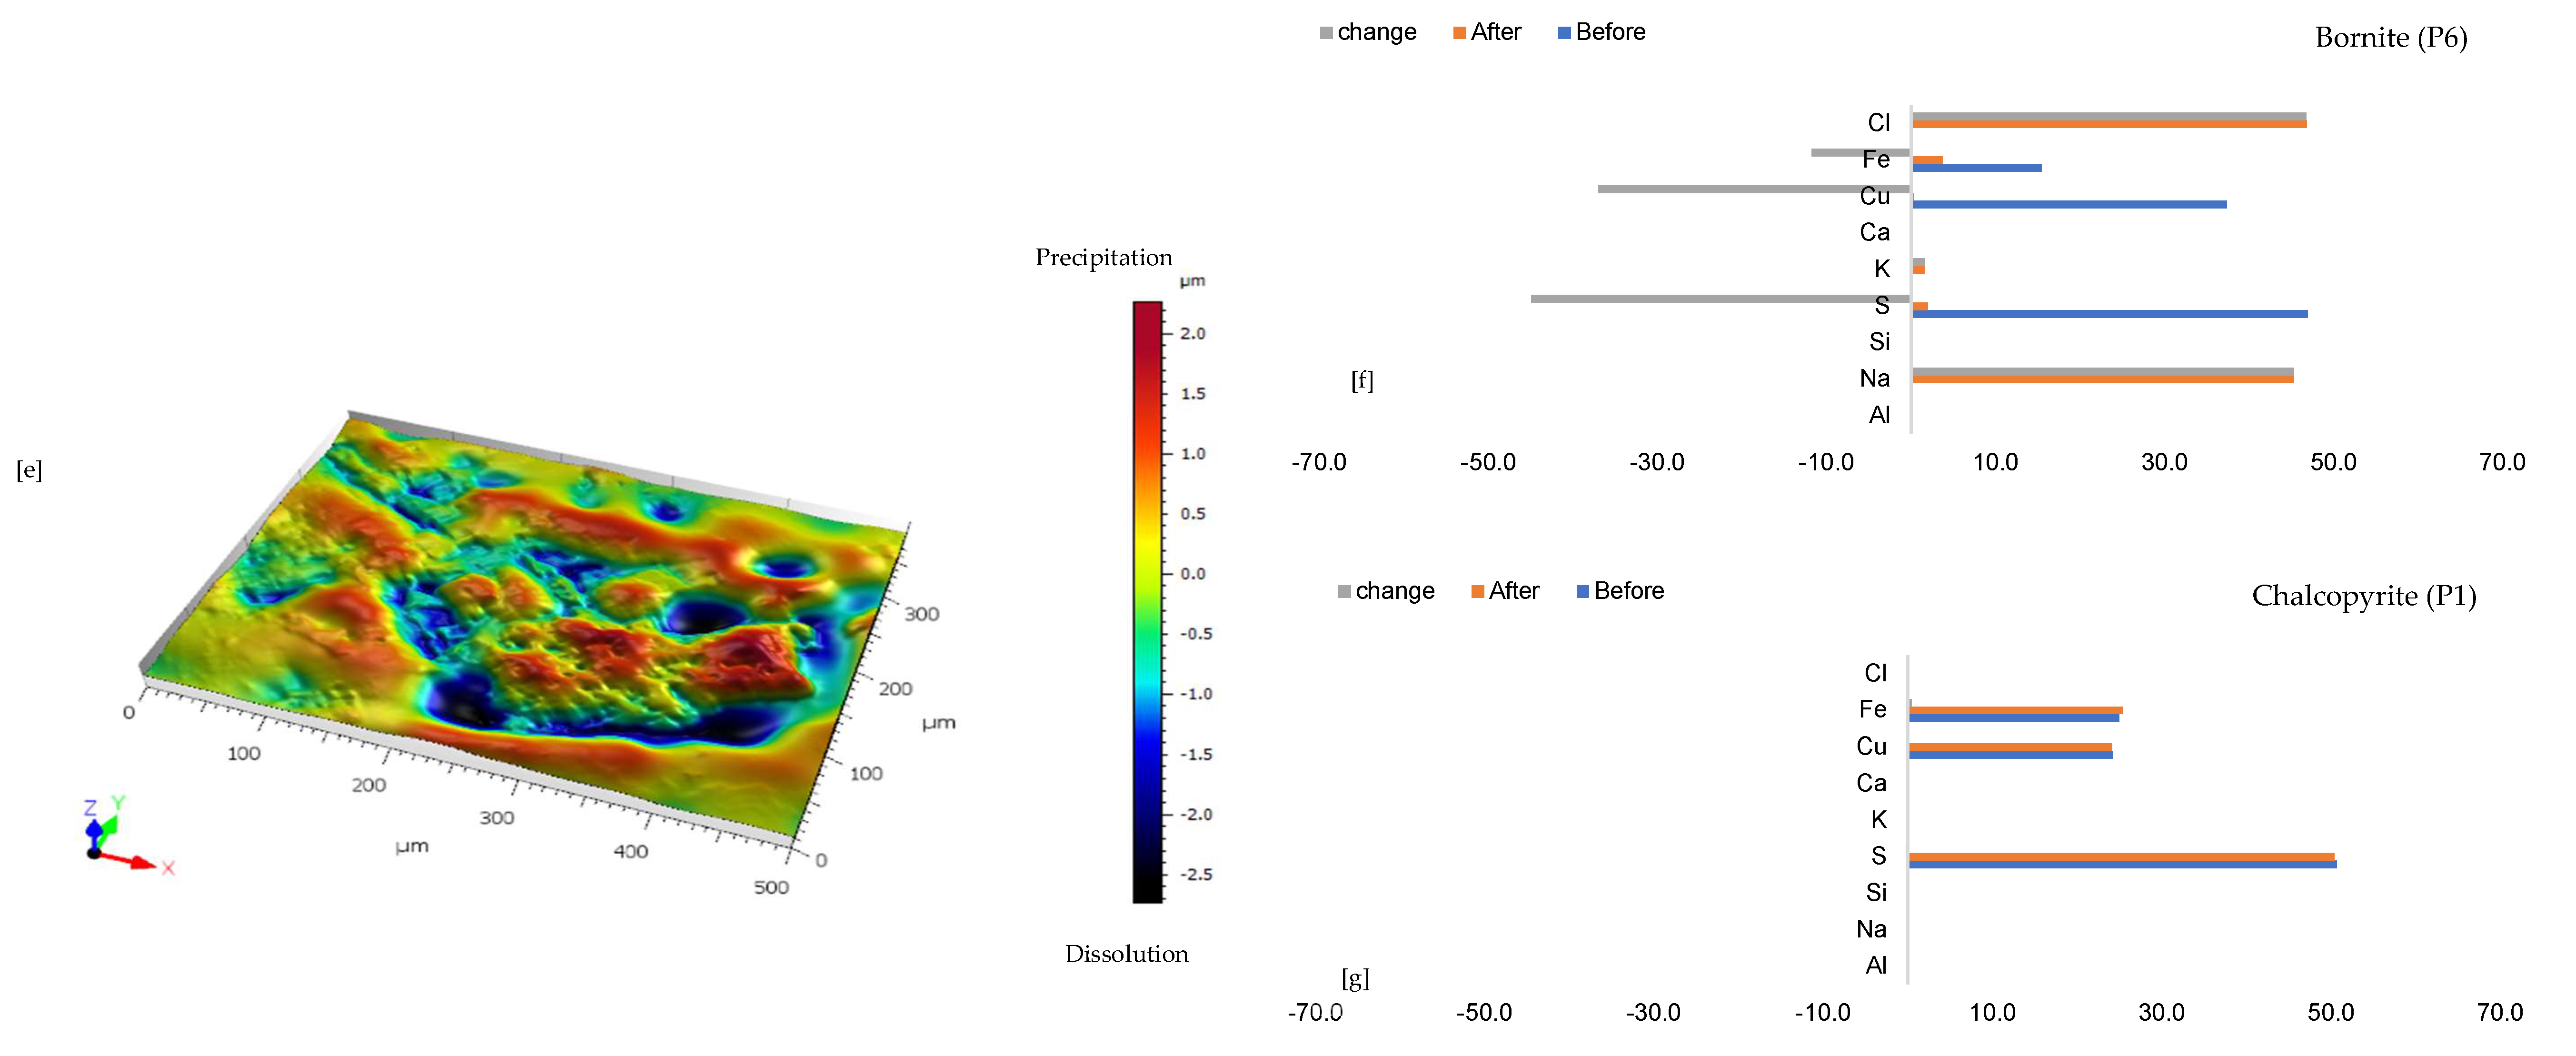
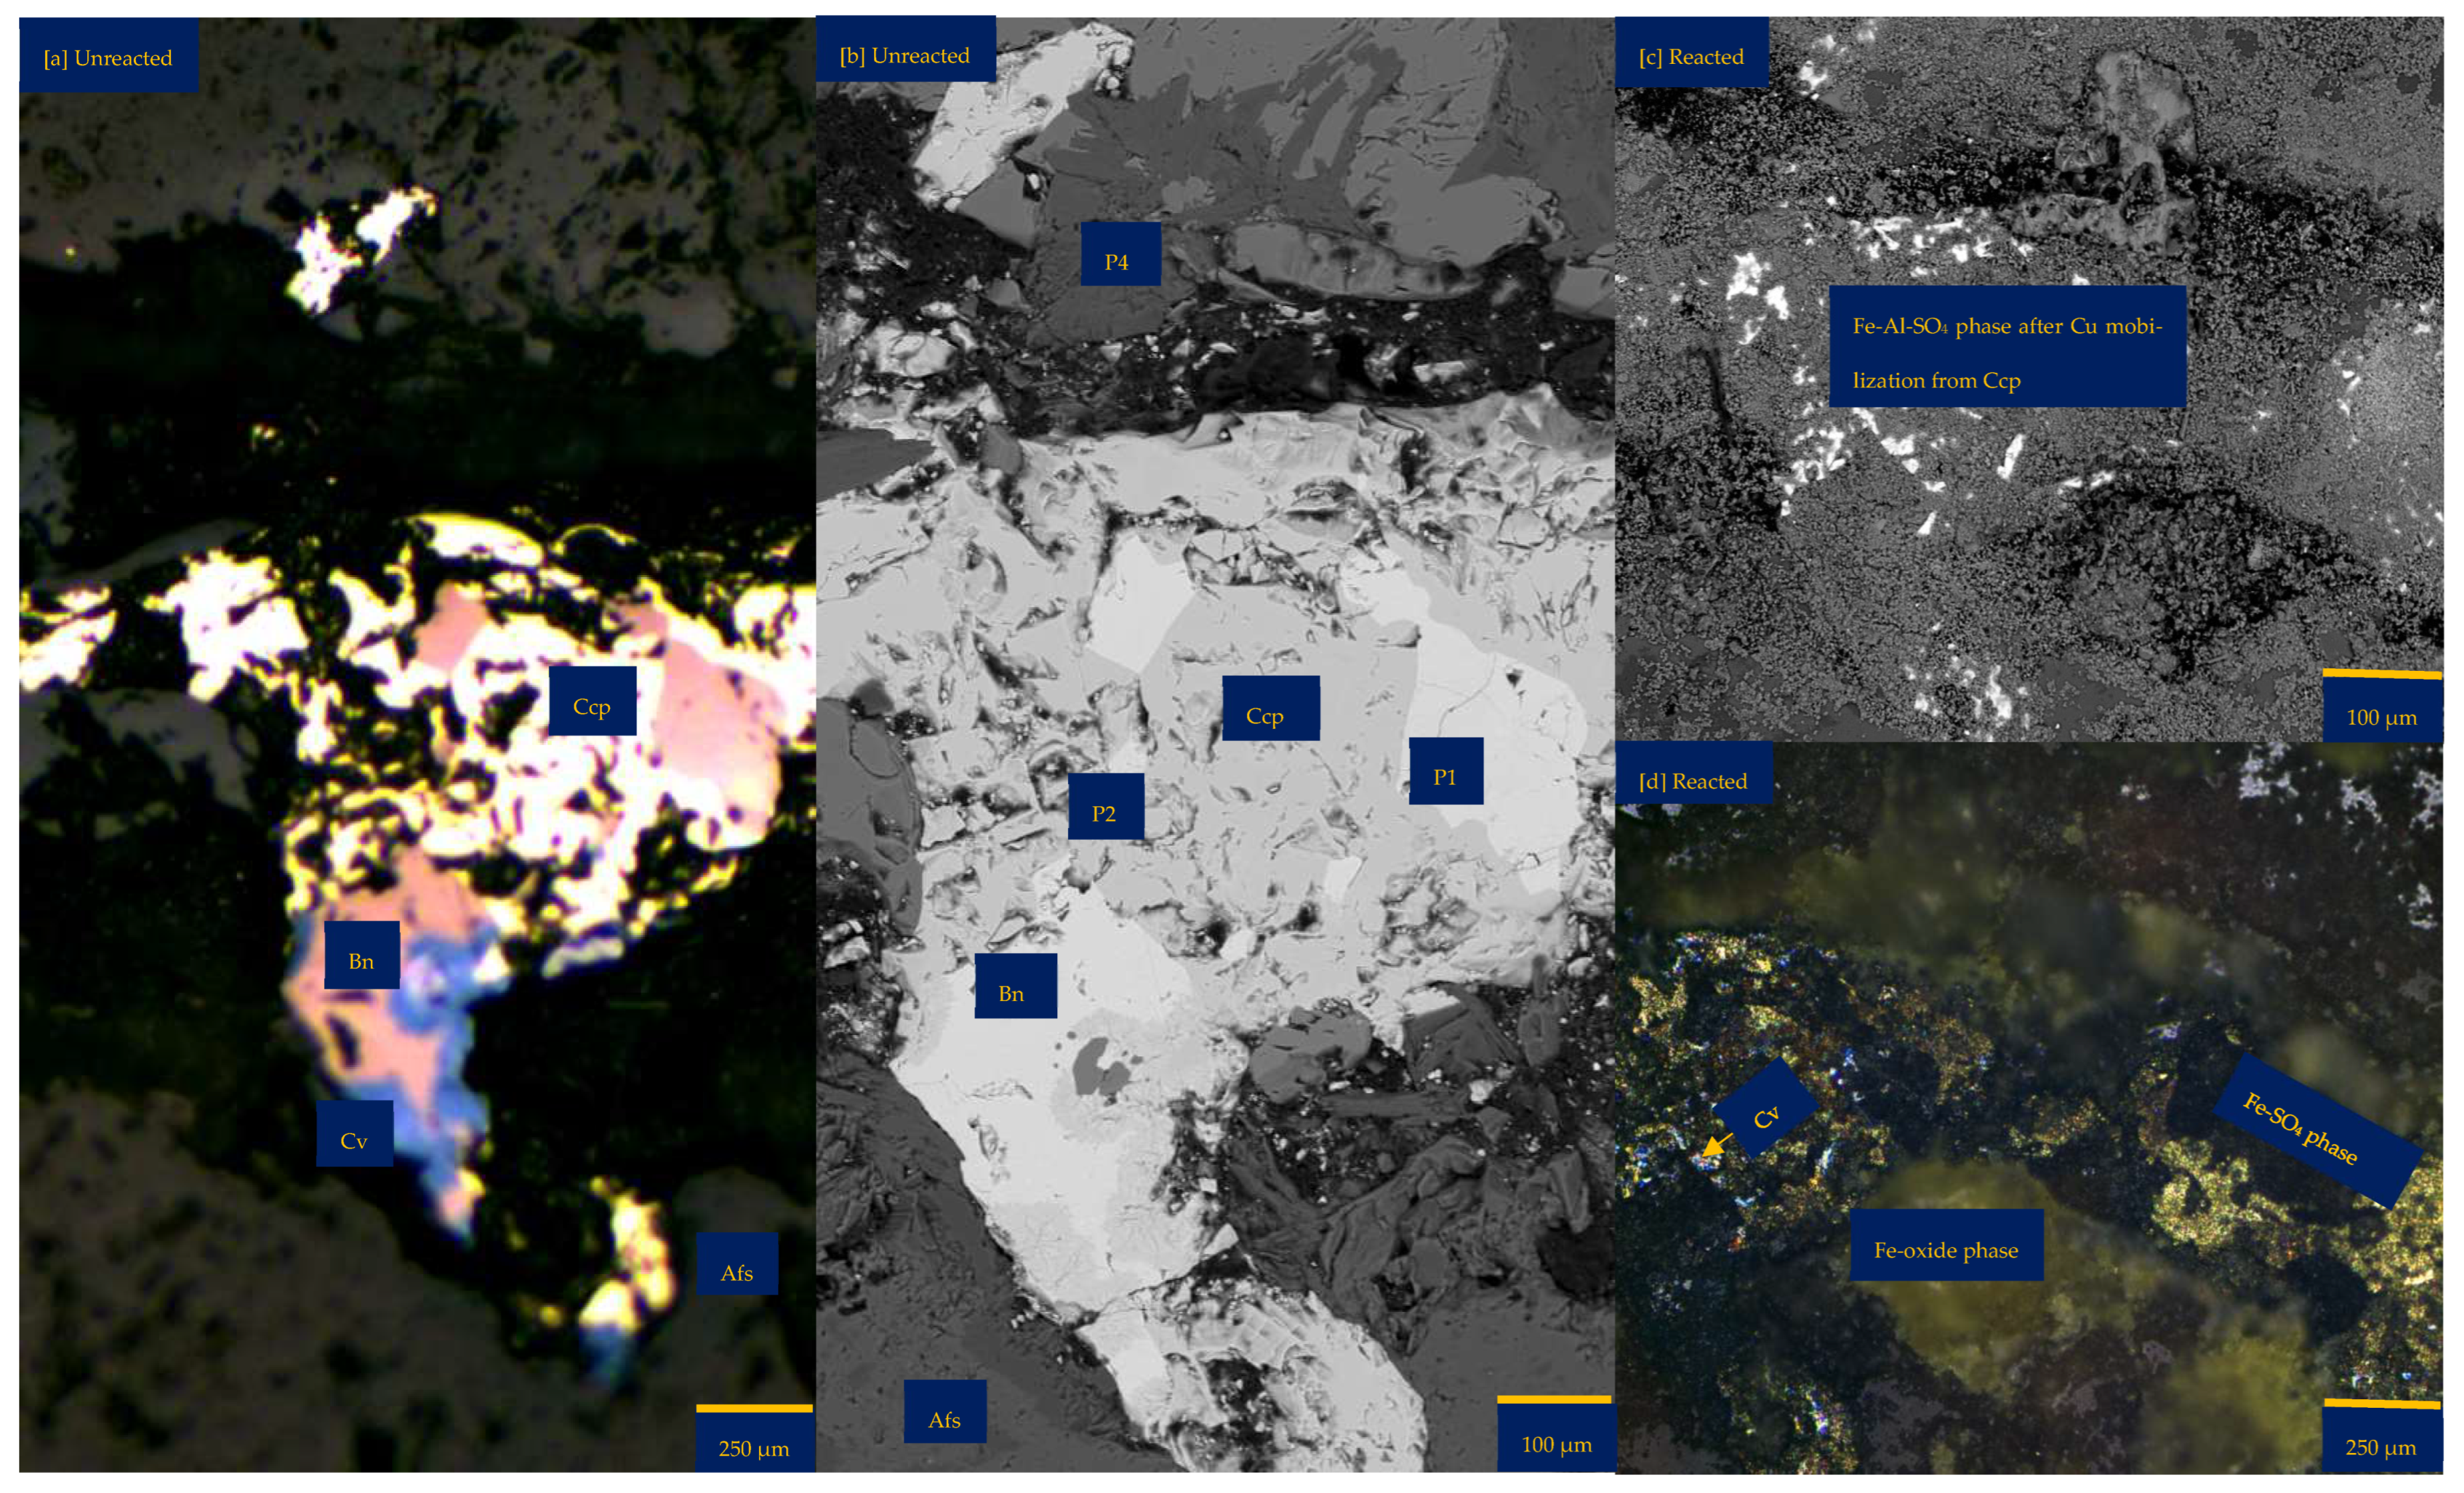
3.1. Local Chemistry and Microscopical Variation During Copper Sulphide Dissolution with Reprecipitation

3.1.1. Leaching in Acid (H2SO4)-Only at 25 °C (B-H25)

Figure 2 shows the mineralogical phase variation of the wafer per proton-promoted dissolution. There is no change in the optical (Figure 2) and compositional (Table S3 of Supplementary Materials) observation of the gangue mineralogy (mainly K and Na-Feldspars). The main difference after 30 days of the experiment was a change in the copper sulphide mineral (Figure 2). There is the preferential release of Fe ahead of Cu and S from the bornite-type copper sulphide phase (Figure 2f). On the other hand, the chemical composition of the chalcopyrite-like phase remains unchanged (Figure 2g); rather, the initial yellowish chalcopyrite surface transforms to pinkish brown, purple, and blue, indicating a bornite phase, a transition phase between bornite and covellite, and a covellite phase (Figure 2a and Figure 2b), respectively.
The assessed grain maintains its overall form (Figure 2). This is despite the erosion of the margins of the initial bornite phase and the formation of pits (Figure 2b,e), indicating the dissolution and dislocation of the bornite phase. It can be asserted, per Figure 2, that the transformation of chalcopyrite to other copper sulphide phases (bornite and covellite) outweighs the overall dissolution of the various mineral phases.
Figure 2. Leaching in acid-only: (a) Fresh wafer surface highlighting yellowish chalcopyrite before the experiment under a reflective microscope (b) Reacted wafer surface showing bornite (Bn) and covellite (Cv) formed due to the proton-promoted dissolution of chalcopyrite (Ccp). (c,d) Back-scattered electron (BSE) images from the FE-EPMA. (e) 3D topographical image of the BSE images obtained with Mountains® version 9 software. (f,g) Quantitative elemental compositional changes (P4 and P5 in atomic weight percent) were recorded for the two different copper sulphide phases. Refer to Table S3 of Supplementary Materials for the average composition of P6.
Minerals 15 00214 g002aMinerals 15 00214 g002b
Figure 2f,g shows the quantitative elemental analysis obtained from the EPMA. Even though the reflective microscopy study showed a near-homogeneous yellowish chalcopyrite mineral grain with faint purple (Figure 2a) before the experiment, the back-scattered electron (BSE) image of the EPMA reported two different phases of this chalcopyrite (Figure 2d). The two phases are one with ~56% copper and the other with less copper (33%). Comparing Figure 2f to Figure 2g shows the release of more iron from the bornite-like phase. The preferential release of Fe ahead of Cu and S, per the averaged point analysis indicated as P5 in Figure 2, leaves behind a phase rich in copper and sulphur. There is a transition from bornite and some chalcopyrite to a covellite/chalcocite-type structure. The topographical image (Figure 2e) shows low points around the grain, suggesting dissolution, whilst there are high points across the copper sulphide grain, thereby indicating the formation of secondary mineral phases with some microporosity.

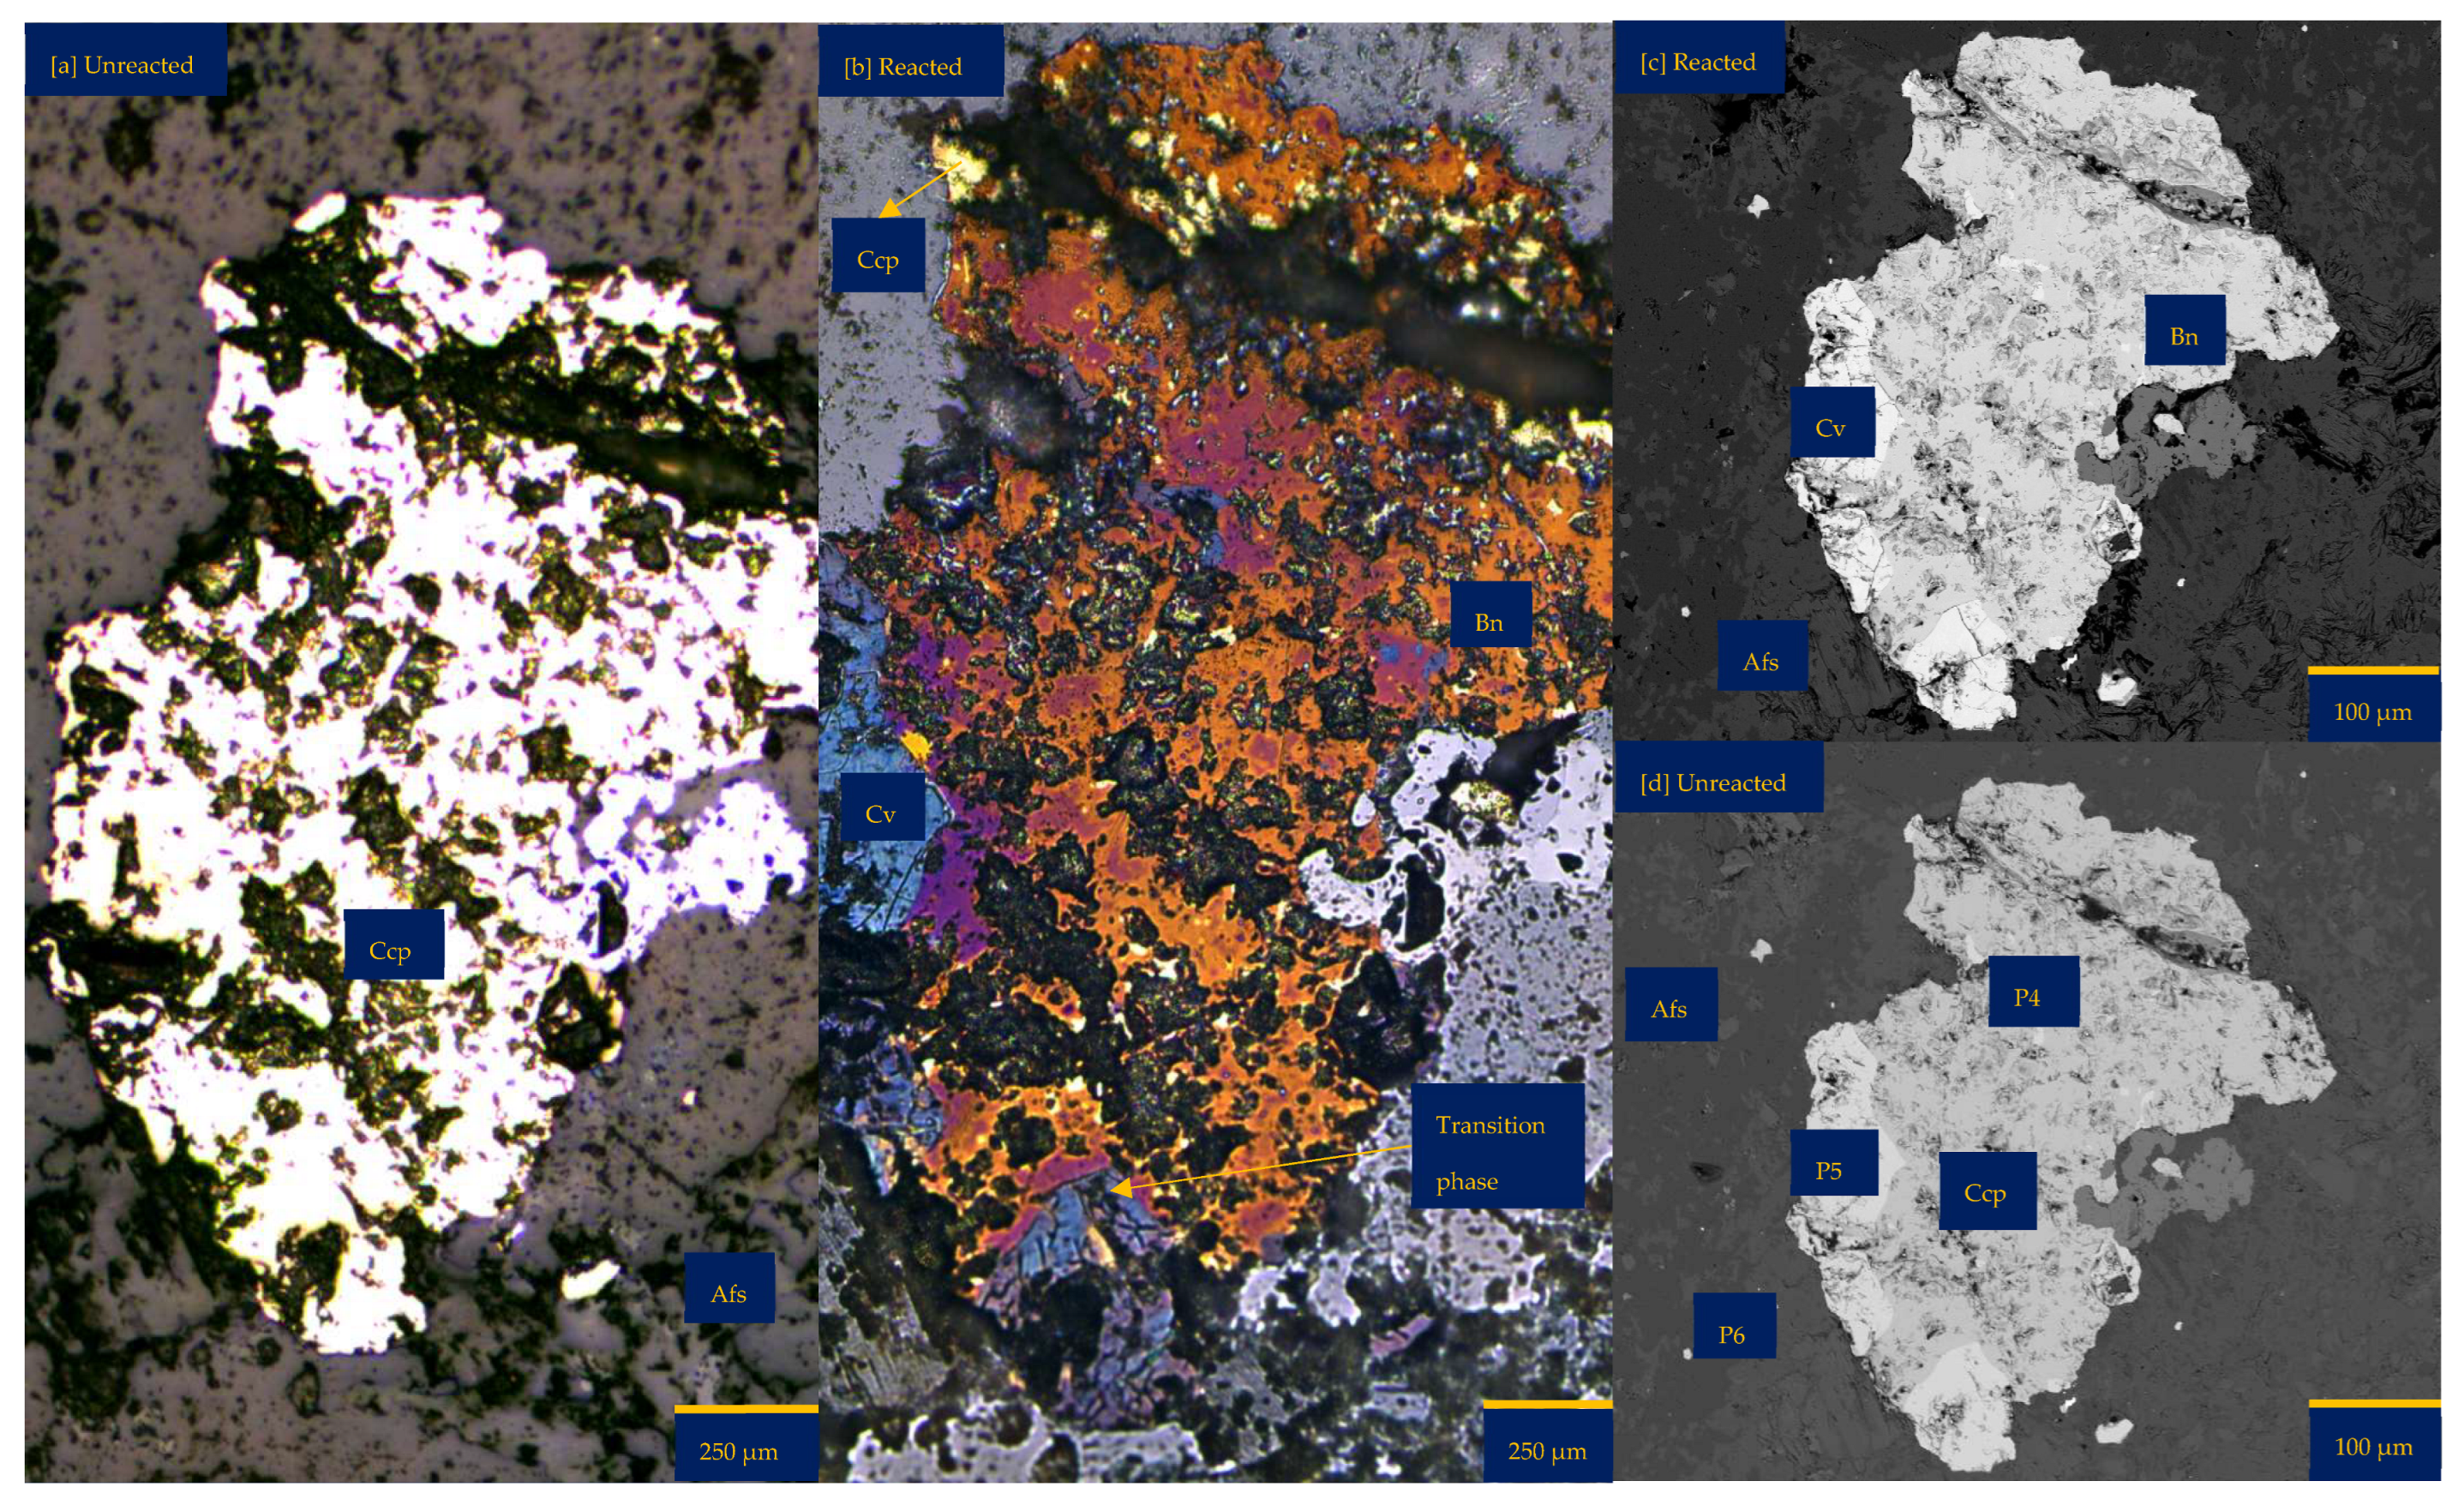
3.1.2. Leaching in Acidic FeCl3-Only at 25 °C (B-Fe25)

Figure 3 shows the mineralogical changes relating to the coupled dissolution with reprecipitation after 30 days of leaching a wafer in FeCl3-only media. In FeCl3-only media (ionic strength of 1.06 mol/L and water activity of 0.985), the bornite phase undergoes dissolution to leave behind a dark matter and more pores on/along the grain for continuous dissolution (Figure 3a). This dark matter is a Fe-SO4 phase with some silicate from the gangue—probably a jarosite mineral, as suggested by the EPMA results (Figure 3f,g). This mineralogical transformation can be related to a substantial release of Cu and S while Fe, Cl, and other cations such as Al and K are enriched where bornite Is found (Figure 3f).
The enrichment of Fe and Cl can be related to the incomplete rinsing of the FeCl3 lixiviant, resulting in the association of Fe-Cl elements with areas where new secondary minerals (with microporosity) are found. The enrichment of the cationic elements may be due to their diffusion from the bulk fluid and/or from the silicate gangue minerals of the wafer surface. In the FeCl3-only media, the original chalcopyrite phase appears brighter, possibly indicating a reaction of the surface layers, for example, to generate an iron-deficient and refractory/passive composition. Figure 3a highlights a possible phase transformation from yellowish (chalcopyrite) to deep brown (bornite) with sparks of bluish mineral (covellite). This observation is similar to that observed in the acid-only medium.
Figure 3. Leaching in FeCl3-only: (a) Unreacted wafer surface highlighting yellowish chalcopyrite side by side with pinkish-brown bornite before the experiment under a reflective microscope. (b) Reacted wafer surface showing Fe-SO4 phase after Cu mobilisation and bornite formed per chalcopyrite transformation. (c) Back-scattered electron (BSE) image from the FE-EPMA before the experiment showing two distinct copper sulphide and gangue phases as observed under the reflective microscope. (d) BSE image of the reacted wafer surface, highlighting fragmented lamella serving as a possible fluid pathway for the reaction of the bornite phase. (e) 3D image of the BSE images obtained with Mountains® version 9 software. (f,g) Quantitative elemental compositional changes (atomic weight percent) were recorded for the two different copper sulphide phases. Refer to Table S3 of Supplementary Materials for the average composition of P7.
Minerals 15 00214 g003aMinerals 15 00214 g003b
The morphology of chalcopyrite and bornite remains unchanged (Figure 3). A significant structural change is the formation of lamella-like pitting on the surface of the bornite and wider pits along the margin of the bornite (Figure 3c,d). This can explain the higher copper mobilisation resulting from more bornite dissolution (Figure 3f) in comparison to chalcopyrite (Figure 3g). The dissolution of the copper sulphide phases is also evident as shown by the lower topographical heights in the 3D BSE image (Figure 3e). In addition, the quantitative EPMA results (Figure 3f) showed a very minimal decrease in copper, a minimal increase in Fe, and no change in sulphur for the chalcopyrite. The alkali feldspar gangue minerals in FeCl3-only media appear not to change.

3.1.3. Leaching in NaCl-Rich Lixiviant at 25 °C (B-Na25)

Figure 4 describes the various phase changes of the sample undergoing combined ferric iron and proton-promoted dissolution in NaCl-rich lixiviant media (ionic strength of 3.575 mol/L and water activity of 0.875) before and after 30 days. Figure 4a,b shows that the bornite surface developed a lamella of fractures, cracks, and numerous pits with a change in structure, whereas the structural integrity of the chalcopyrite surface is unaltered. Figure 4c,d further highlight the transformation of the bornite and chalcopyrite grain surfaces, which are almost totally covered by a dark phase (possibly jarosite) and a deep brown phase (more bornite) with bluish stains (covellite/chalcocite), respectively.
The topographical image (Figure 4e) also shows a higher elevation for the chalcopyrite compared to the bornite sites. This is consistent with galvanic interaction via oxidation at the bornite sites and reduction at the chalcopyrite sites, leading to the formation of secondary copper sulphide phases [17,32]. Hong et al. [16] stipulated that during the co-leaching of chalcopyrite and bornite, galvanic interaction will cause a preferential dissolution of bornite ahead of chalcopyrite. The typical rest potential for bornite is ~0.40 V (vs. SHE), while that of chalcopyrite is ~0.58 V (vs. SHE) [16]. This substantiates the galvanic interaction observed and the claim that bornite is anodic to chalcopyrite.
Figure 4. Leaching in NaCl-rich lixiviant: (a) Back-scattered electron (BSE) image from the FE-EPMA before the experiment showing two distinct copper sulphides–bornite and chalcopyrite—with gangue phases. (b) BSE images of the reacted wafer surface highlight cleavage fractures along the bornite phase. (c) Unreacted wafer surface highlights yellowish chalcopyrite overgrown by pinkish-brown bornite before experimenting under reflective microscope (d) Reacted wafer surface showing Fe-SO4 phase after Cu mobilisation and bornite formed via chalcopyrite transformation. (e) 3D image of the BSE images obtained with Mountains® version 9 software. (f,g) Quantitative elemental compositional changes (in atomic weight percent), were recorded for the two different copper sulphide phases. Refer to Table S3 of Supplementary Materials for the average composition of P4.
Minerals 15 00214 g004aMinerals 15 00214 g004b
The quantitative EPMA analysis (Figure 4f,g) shows the bornite released ~40% Cu, ~50% S, and ~15% Fe compared to no release of Cu, Fe, and S from the chalcopyrite site. Another observation is the enrichment of Na and Cl due to the high concentration of NaCl used in the experiment. K was also enriched, possibly from the feldspathic gangue (incongruent) dissolution and/or from the lixiviant (Table 1). At these locations, the chemical composition is similar to jarosite (Na/KFe3(SO4)2(OH)6) and is found in wide cracks along the bornite grain. Optically, the alkaline feldspar phase remains unchanged after the experiment except along the copper sulphide grains, which show a dark mineral phase hereby considered as jarosite due to its chemical composition.

3.1.4. Leaching in CaCl2-Rich Lixiviant at 25 °C (B-Ca25)

Combined ferric iron and proton-promoted dissolution in CaCl2-rich lixiviant (ionic strength of 1.903 mol/L and water activity of 0.948) resulted in the transformation of chalcopyrite (Figure 5a—bright yellow) to bluish (covellite—CuS/atacamite-Cu2Cl (OH)3) and brown (bornite) phases in Figure 5b. For these new phases to form, pH increases significantly, suggesting that much of the available acid has to be consumed for Fe2+ oxidation, though acid is also regenerative via jarosite formation.
According to the EPMA elemental data, these newly generated phases release little to no Cu, Fe, or S from the original chalcopyrite mineral (Figure 5f). While this is a rational conclusion based on the data, the explanation for this behaviour is not simple; hence, further research is needed to decipher such a complicated phenomenon. Following the release of Cu (Figure 5b), the bornite (brown) that was initially present in Figure 5a changes to a dark (Fe-SO4 phase) in Figure 5g.
Additionally, Si- and Fe-SO4 precipitate phases are shown in Figure 5c,d. The Si-rich phase is predominantly found at the gangue (feldspar) mineral surface, while the Fe-SO4 phase forms at the location of the copper sulphides. The EPMA elemental results (Figure 5g) showed that the bornite selectively released Cu, leaving behind a residual phase composed of Fe, S, K, and Na (these make up the formula of mixed jarosite: jarosite (KFe3(SO4)2(OH)6) is the K-end member and natro-jarosite (NaFe3(SO4)2(OH)6) the other). Also, there is an enrichment of ~10% chloride. The quartz vein in which the copper sulphide grain can be found is covered with a slightly darker material (presumed to be ~3% S released as the bornite dissolves; Figure 5g). There is no substantial change in the elemental composition of the chalcopyrite phase. Even so, there was minor surface changes as noted previously while there is potential to form trace amounts of elemental sulphur which could not be discretely identified by the EPMA.
Figure 5. Leaching in CaCl2-rich lixiviant: (a) Unreacted wafer surface highlighting continuous yellowish chalcopyrite (Ccp) phase with bornite (Bn) overgrowth at the side before experiment under reflective microscope. (b) Reacted wafer surface demonstrating streaks of blue (covellite—Cv) and brown (bornite—Bn) overgrowth on the chalcopyrite. (c) Back-scattered electron (BSE) image from the FE-EPMA before the experiment showing two distinct copper sulphides- chalcopyrite and bornite separated by a mica overgrowth (d) BSE image of the reacted wafer surface highlight Si-and Fe-SO4 precipitate phases. (e) 3D image of the BSE images obtained with Mountains® version 9 software. (f,g) Quantitative elemental compositional changes (in atomic weight percent) in the phases recorded for the two different copper sulphide phases. Refer to Table S3 of Supplementary Materials for the average chemical composition of P3.
Minerals 15 00214 g005aMinerals 15 00214 g005b

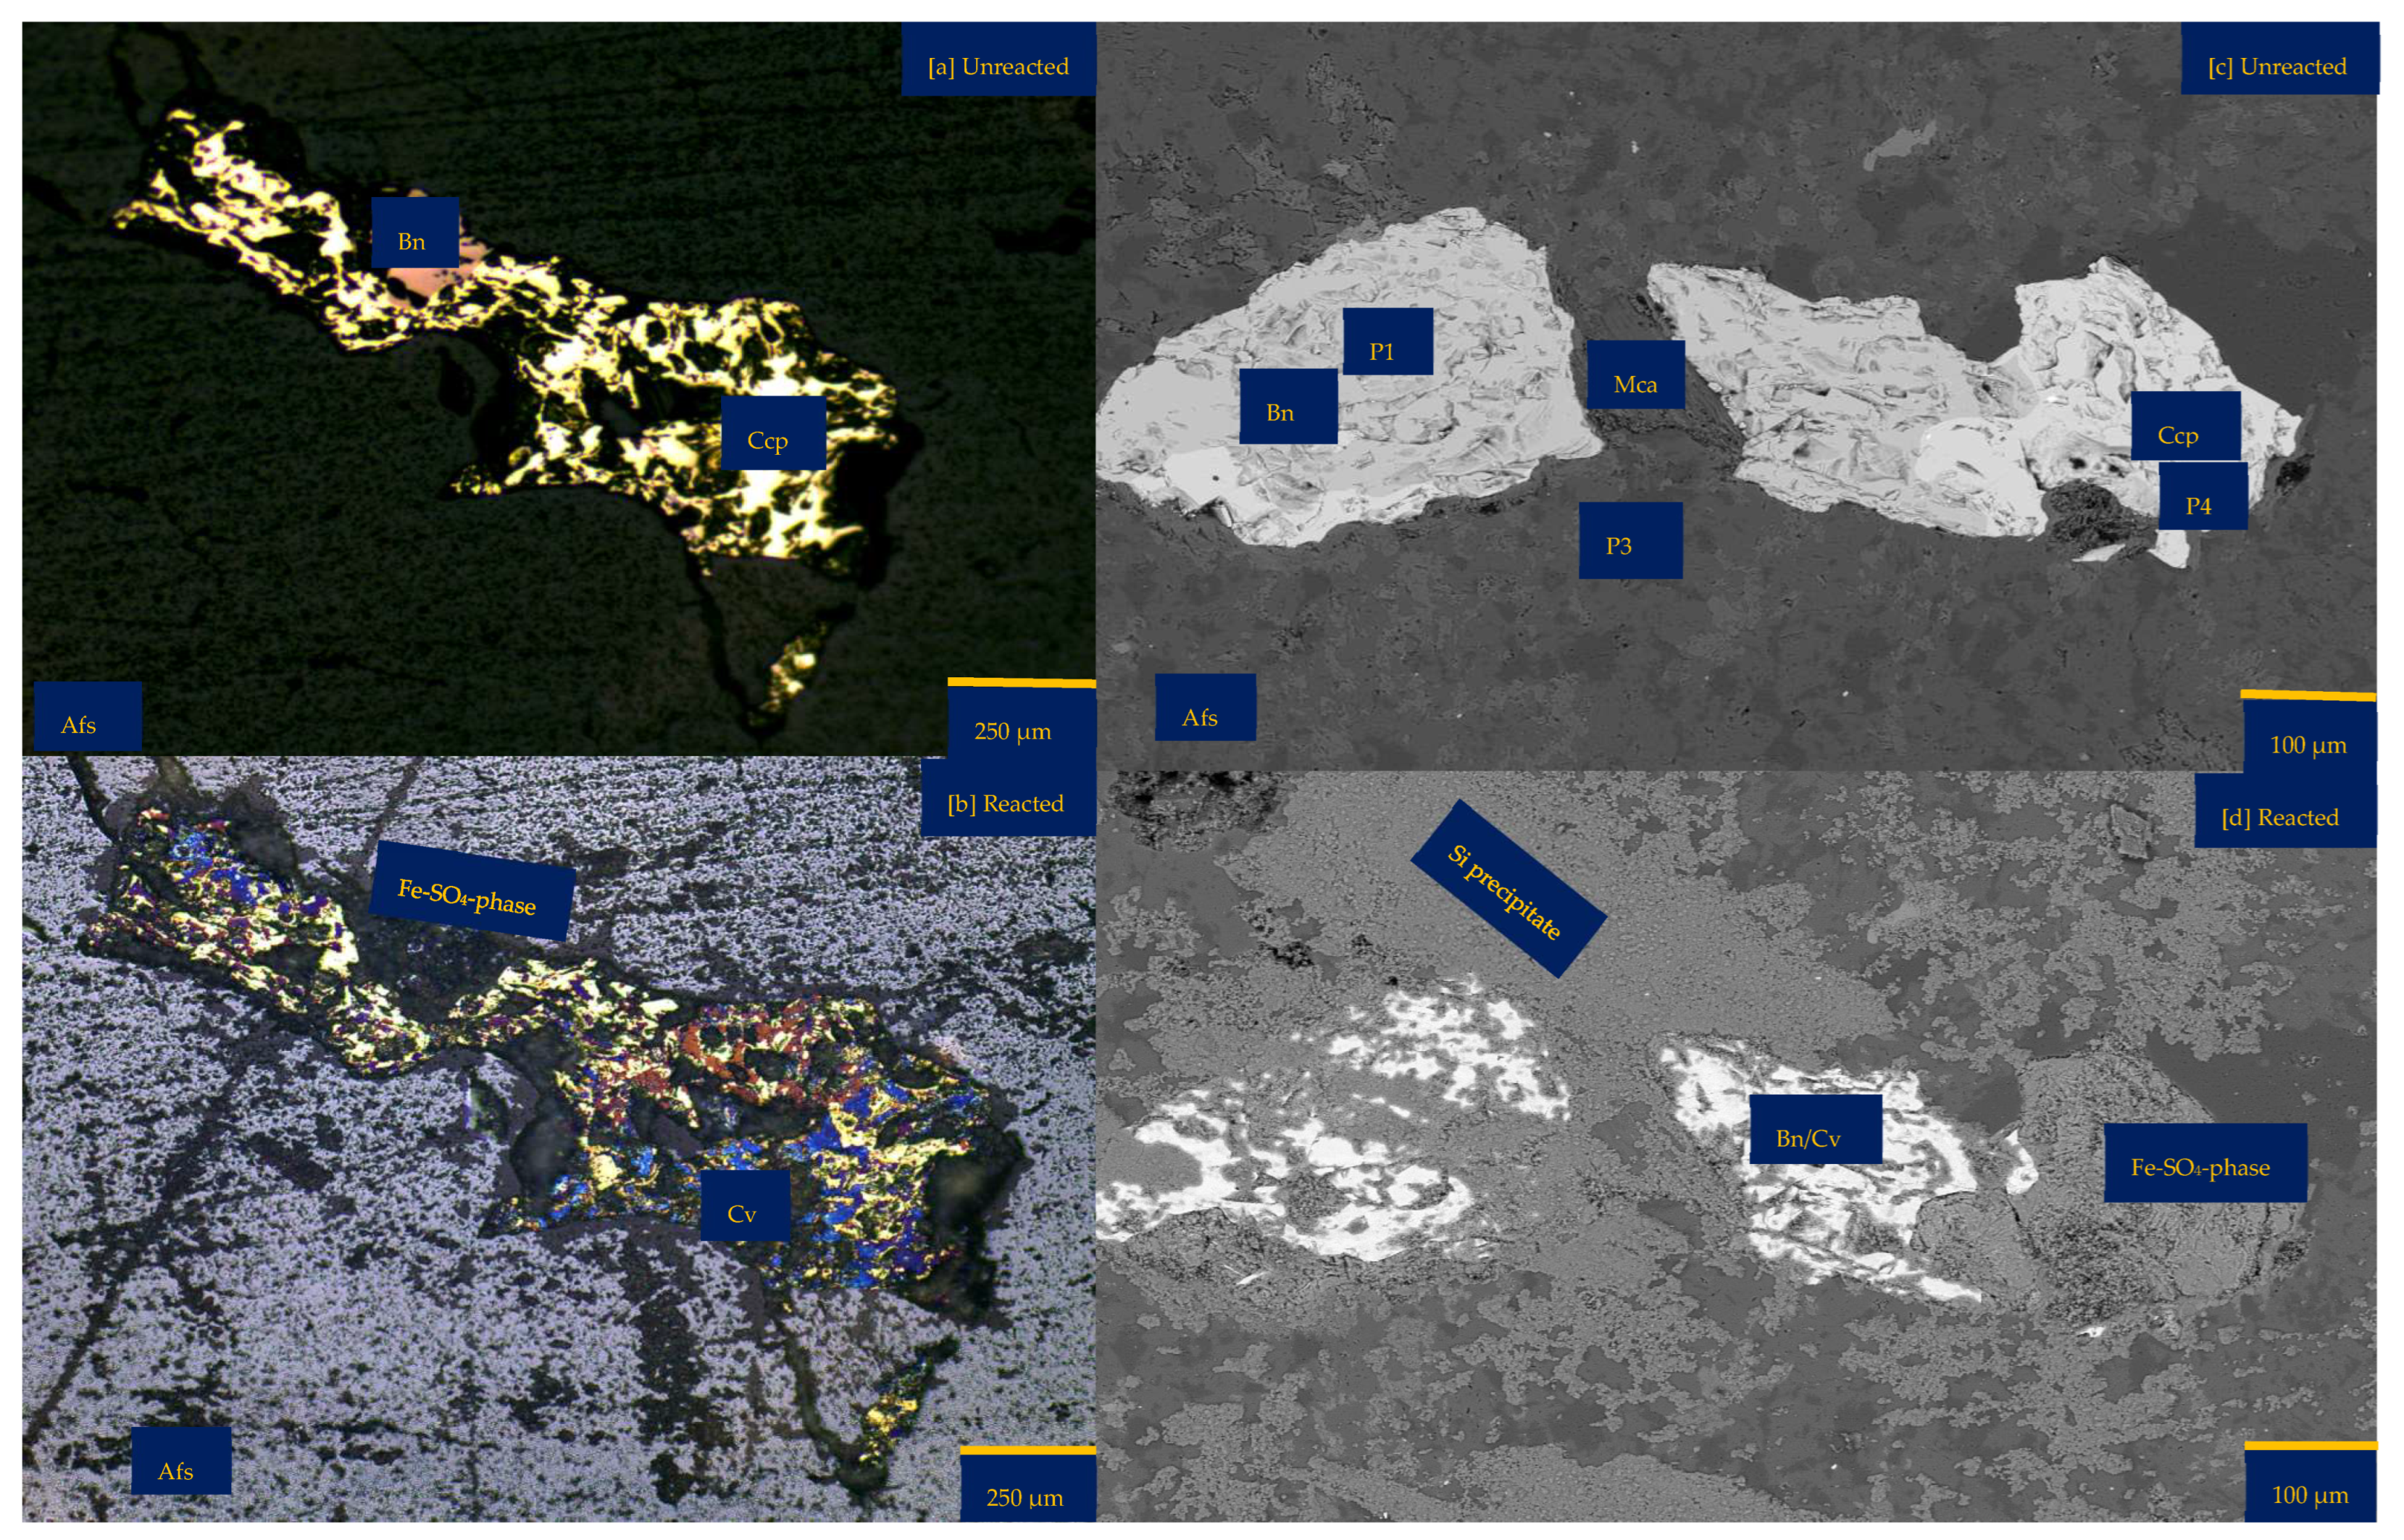
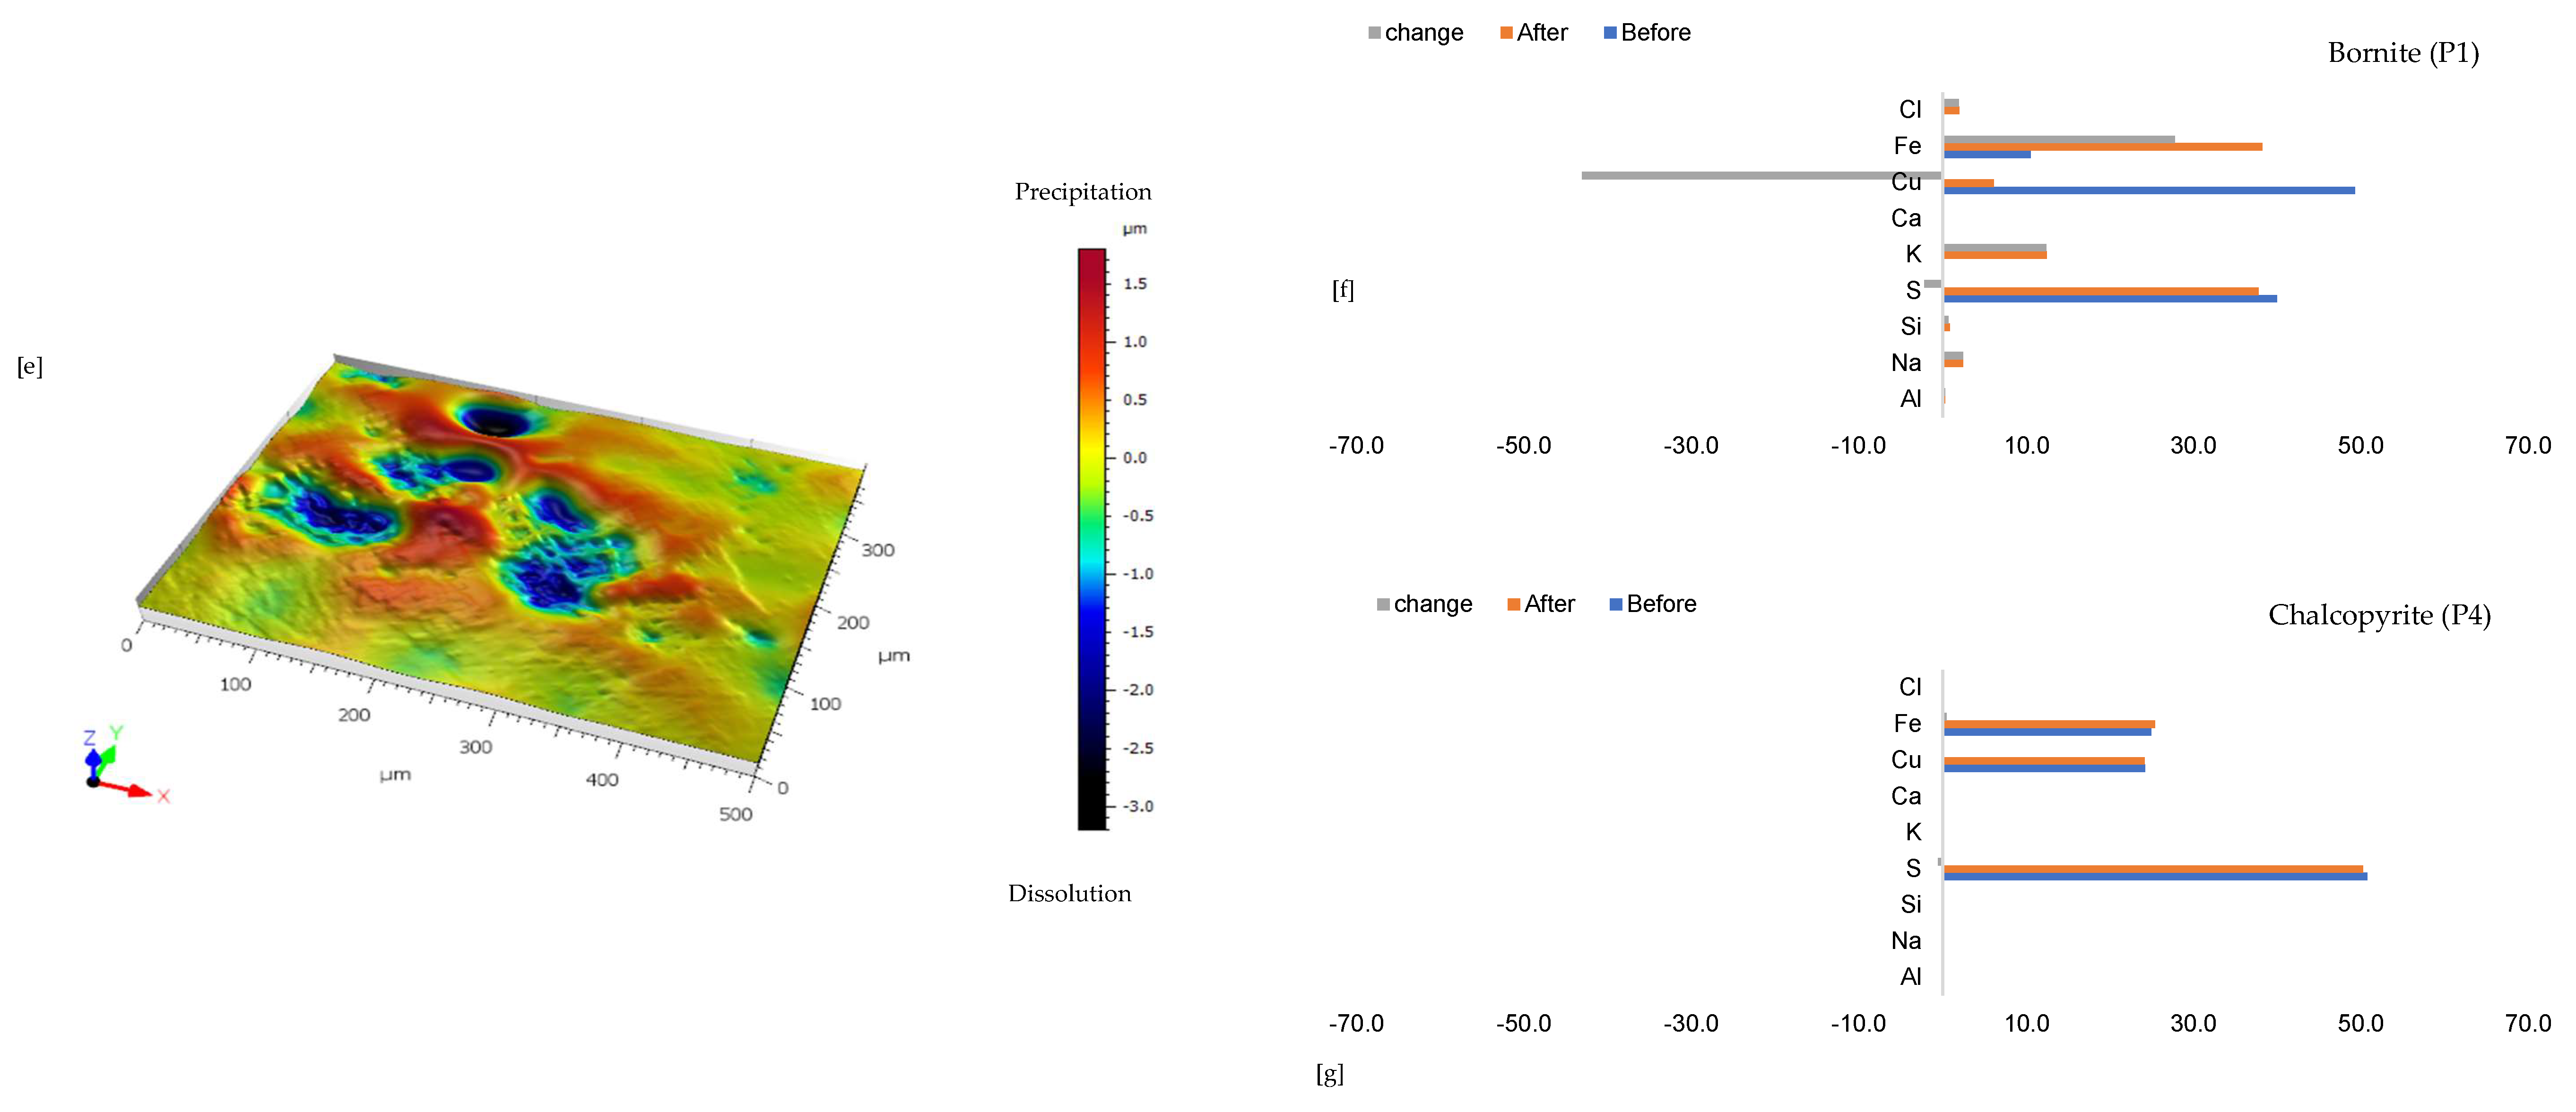
3.1.5. Leaching in AlCl3-Rich Lixiviant at 25 °C (B-Al25)

Figure 6a shows the chalcopyrite (bright yellow) and bornite (pinkish brown) in an alkaline feldspar (grey) vein prior to the leaching in an AlCl3-rich lixiviant (ionic strength of 5.243 mol/L and water activity of 0.9). After the leaching experiment, portions of the bornite appear to have been transformed into covellite (bluish). At the end of the experiment, all the copper sulphide phases (chalcopyrite and bornite) are covered by a yellowish phase, presumably an iron oxide (such as goethite and hematite—Table S3 of Supplementary Materials), with specks of blue (covellite) (Figure 6d). A black cover was also observed, presumably a Fe-SO4 phase or iron hydroxide with sulphur after Cu mobilisation from the copper sulphides. The leached BSE image revealed that the entire wafer surface, particularly at the original position of the copper sulphides, was coated in a porous and amorphous Fe-Al-SO4 phase (Figure 6c). These precipitated phases in the BSE image also showed the highest elevation in the 3D topography in Figure 6d.
Quantitative EPMA analysis revealed copper release from both bornite and chalcopyrite phases during AlCl3-rich lixiviation (Figure 6f,g). This contrasts with previous observations for NaCl-rich, CaCl2-rich, FeCl3-only, and acidic lixiviants, where only bornite dissolution was observed. In the AlCl3 system, bornite leaching exhibited selective release of Cu and Fe, while chalcopyrite leaching preferentially released Cu and S (Figure 6f,g). Chalcopyrite surface analysis (Figure 6f) indicated S and Cu release, leaving behind Fe, K, Al, and Cl-rich phases. Bornite surface analysis (Figure 6g) suggested Fe and Cu release, with residual S, Cl, Al, K, and minor other elements. Interestingly, Al and K enrichment appeared more pronounced on the chalcopyrite surface compared to bornite. The enrichment of Cl and Al on both mineral surfaces was likely an artefact of the highly concentrated AlCl3-rich lixiviant.

3.1.6. Leaching in AlCl3-Rich Lixiviant at 45 °C (B-Al45)

Combined ferric iron and proton-promoted dissolution in an AlCl3-rich lixiviant at elevated temperature (45 °C) and slightly higher ionic strength results in complete passivation of the wafer surface, presumably due to a higher rate of dissolution and reprecipitation reactions compared to rates at 25 °C (Figure 7). Figure 7a,c shows the presence of chalcopyrite (bright yellow), bornite (pinkish brown), anhydrite (purple), and alkaline feldspar (grey) minerals before the start of the experiment. After the experiment, the whole wafer surface is covered by a yellowish-to-white Fe-Al-SO4 phase (Figure 7b). Hence, it was impossible to observe changes in the primary minerals at the end of the experiment, and it was not possible to conduct quantitative microprobe imaging and analysis of the sample after the experiment.

3.2. Fluid Chemistry Analysis

Figure 8 shows ICP-OES data for elemental concentrations in the various leaching solutions. Copper (Cu) mobilisation is linear in AlCl3 and CaCl2-rich acidic media but declines after 20 days in NaCl and FeCl3 solutions (Figure 8a). Copper concentration in solution correlates with the ionic strength of the lixiviants, peaking at 5.3 mol/L for AlCl3-rich media. Higher chloride and ionic strength enhance copper dissolution, with multivalent cations such as Al3+ and Ca2+ promoting proton activity and facilitating oxidation of Fe and Cu at mineral surfaces. These cations also increase hydration and stabilise Fe3+ in solution, reducing the formation of Fe-hydroxy sulphates. The highest copper concentration (~0.025 mol/L) was observed in AlCl3-rich media at 25–45 °C, while the lowest was in acid-only leaching at 25 °C, where Cu mobilisation is slowed due to the absence of initial Fe3+ and/or the need for oxygen to oxidize Fe2+ to Fe3+.
Furthermore, the amount of copper in solution correlates with the total iron (Fe) decline (Figure 8a,b). For example, the highest Cu concentrations are observed for copper sulphide leached at 45 °C in AlCl3-rich (B-Al45) lixiviant due to the relatively quick decline of total Fe. Nonetheless, there are several anomalies. For instance, the dissolved Fe is lower in NaCl-rich lixiviant (B-Na25) than in CaCl2 (B-Ca25) and AlCl3 (B-Al25) rich lixiviants at 25 °C but this does not result in the highest net mobilisation of Cu into solution. Some of the consumed total Fe in the NaCl-rich lixiviant may have resulted in substantial precipitation of an iron hydroxy sulphate phase (such as jarosite, Figure 3, Figure 4, Figure 5, Figure 6 and Figure 7 and [33,34]).
The consumption of Fe3+ by chalcopyrite is corroborated by the total S (as SO42−) decline in solution before 15 days (Figure 8b,c). Figure 8c shows that the decline in total S (as SO42−) before 15 days declines very fast in the AlCl3-rich lixiviant at 45 °C (B-Al45) and the NaCl-rich lixiviant at 25 °C (B-Na25). The swift decline in the total Fe and S (as SO42−) may explain the observed yellowish passivate on the wafer leached in AlCl3-rich lixiviant at 45 °C (Figure 7).
Analysis of the total potassium (K), sodium (Na), and S (as SO4) concentration trends (Figure 8c–e) suggests the precipitation of secondary phases, potentially including jarosite and aluminium sulphate phases (e.g., jurbanite, AlSO4+). These phases may influence Cu mobilisation (Figure 8a) by consuming Fe3+, a crucial reagent for copper sulphide leaching. Additionally, as reported by Dutrizac et al. [8], these iron hydroxy sulphates may adsorb and/or incorporate Cu from dissolved copper sulphide minerals.
Figure 8. Total (a) Cu (b) Fe (c) S (as SO42−) (d) Al (e) Na and (f) K concentrations for the various experimental conditions in Table 1 after 30 days.
Minerals 15 00214 g008
The total aluminium (Al) concentration trendline (Figure 8d) in AlCl3-rich media suggests continuously coupled dissolution-reprecipitation of the Al-rich phases. The introduction of Al3+ (via AlCl3 lixiviant) promotes the formation of AlSO4-rich phases at pH 1–3 (Figure 6 and Figure 7). These reduce the activity of sulphate ions, hindering jarosite formation compared to Al-free systems [20]. Additionally, Al3+ may decrease the activity of ferric sulphate species due to its effect on sulphate activity. This has a positive impact on the concentration of free ferric iron, consequently decreasing the thermodynamic stability region of FeSO4 in the presence of Al3+ [20].

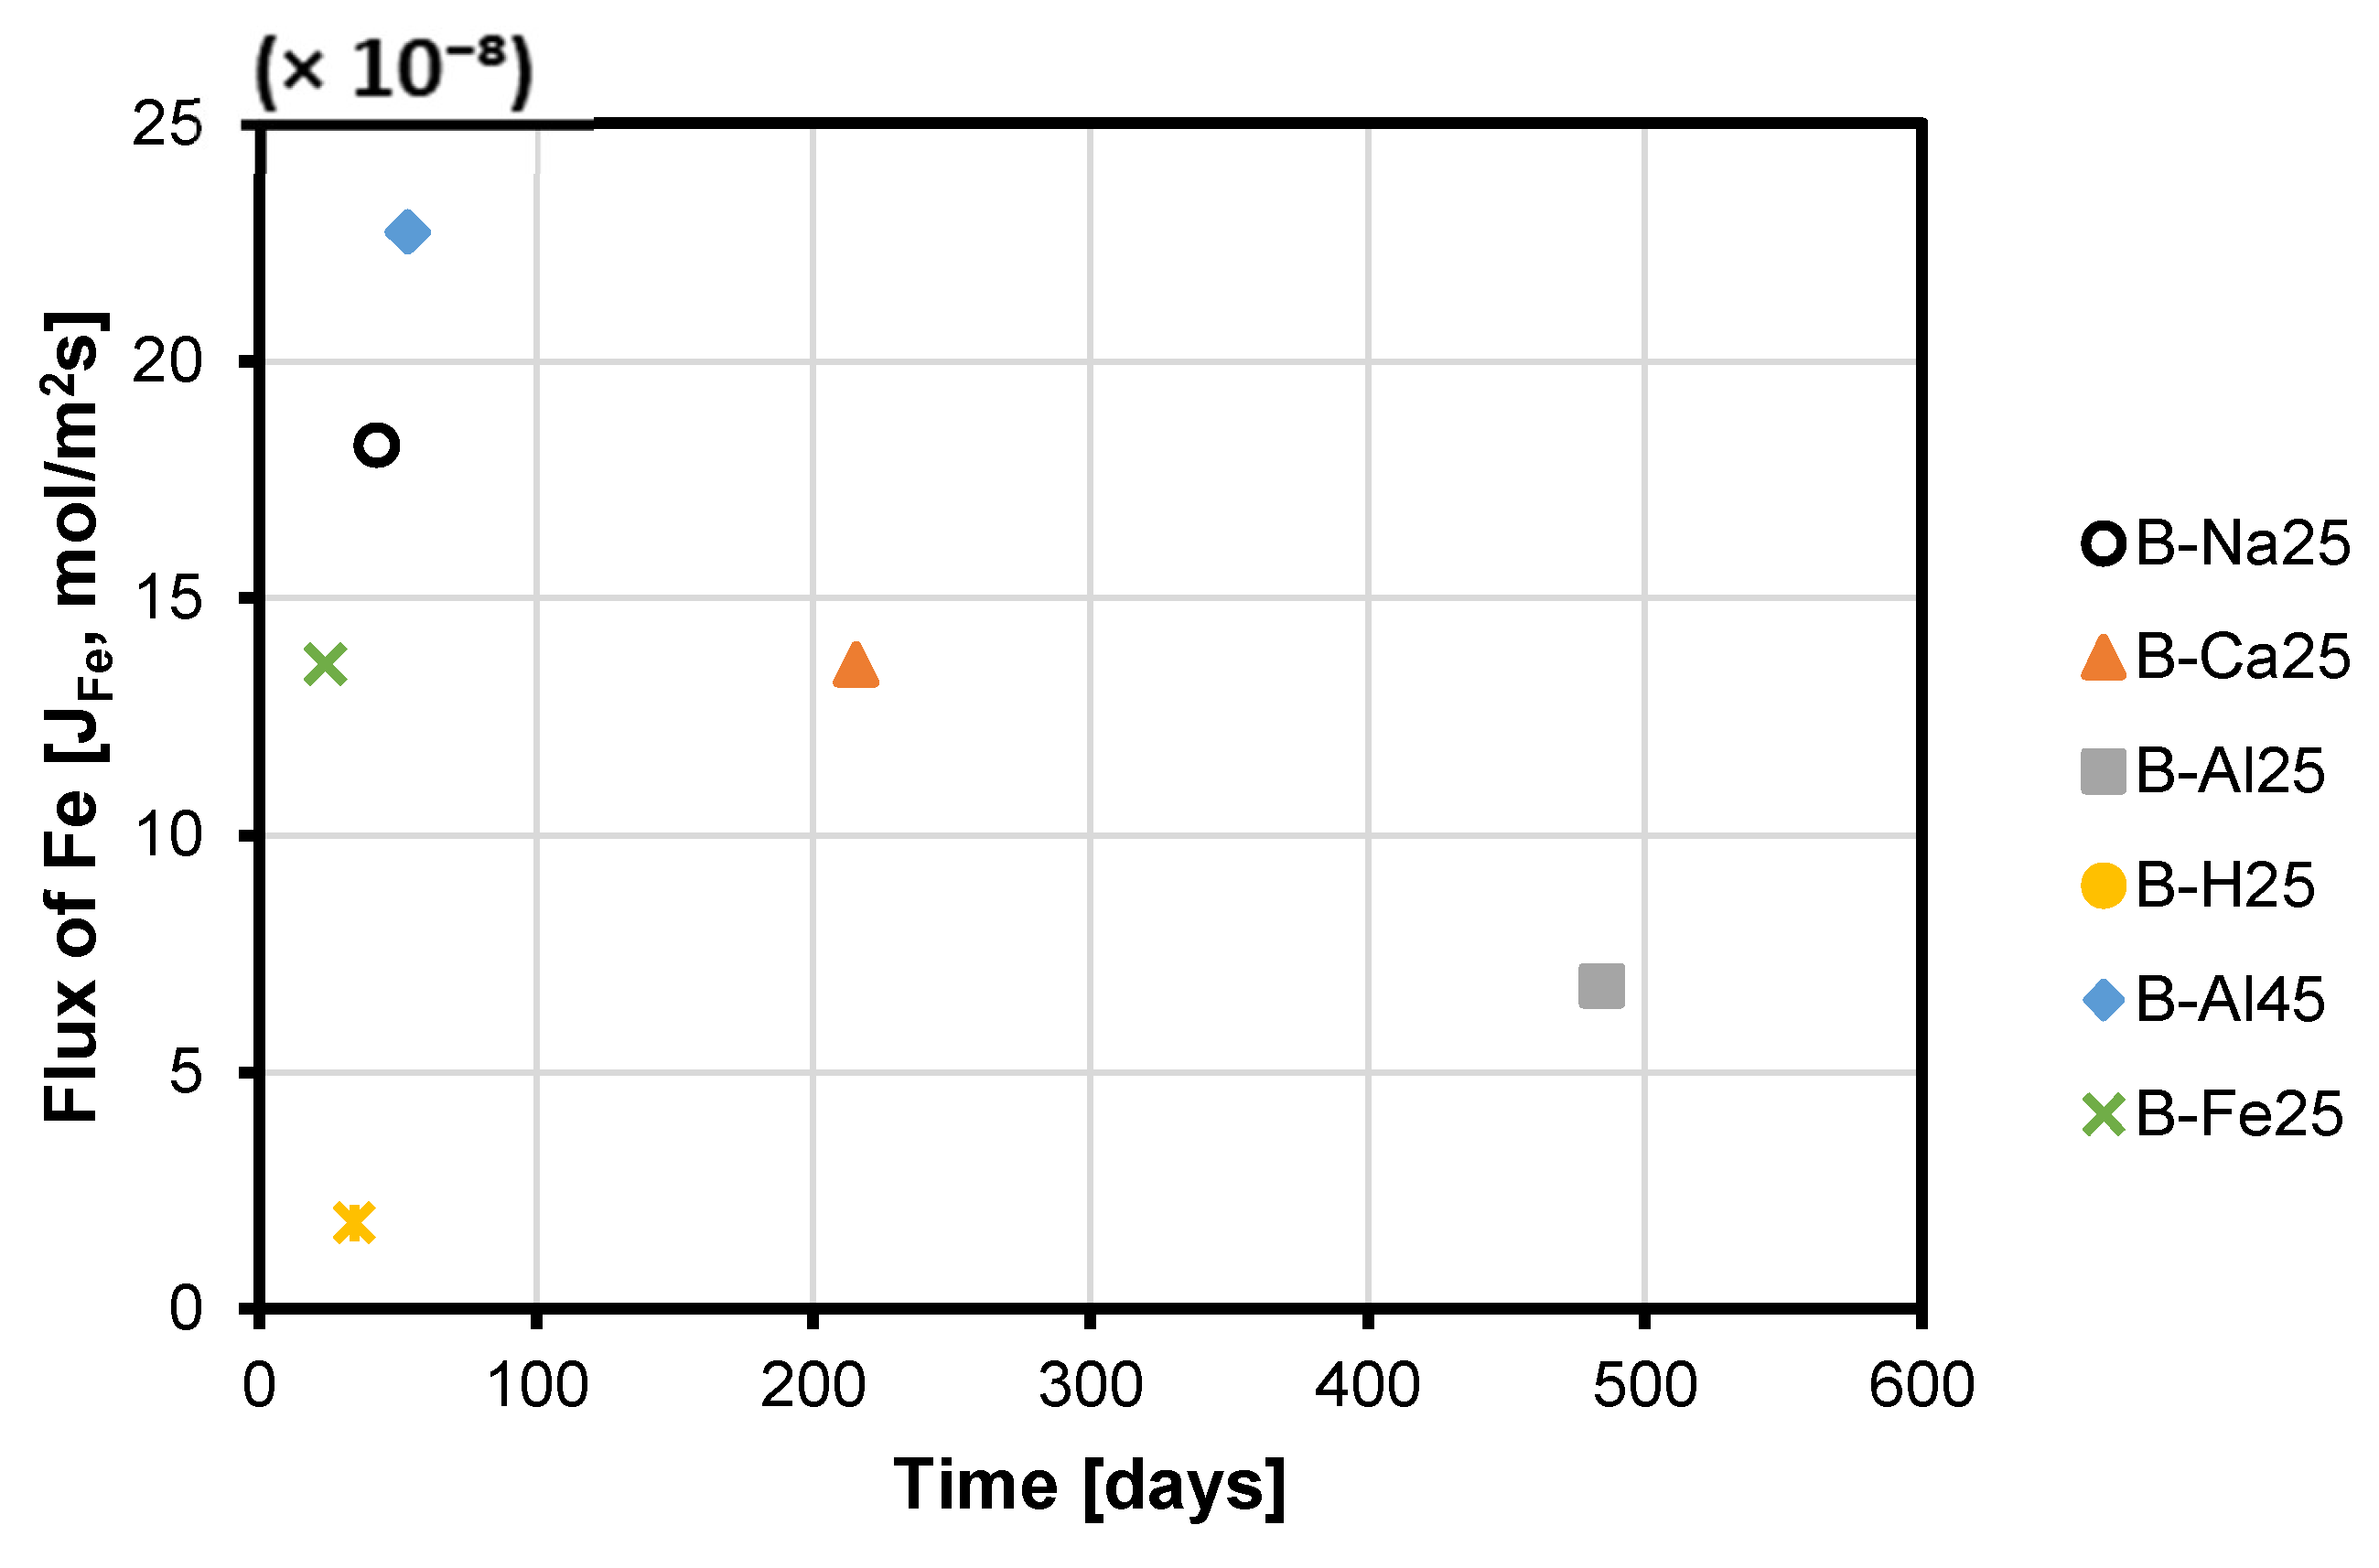
3.3. Cu, Fe, and S (as SO42−) Rates

The rate of element release or uptake in the experiments was estimated per the chord method [35] due to significant amounts of the reactant being consumed. The release or consumption rates ( r i ; mol/s) of the total Cu, Fe, and S (as SO42−) were extracted in each case from the slopes, m t m o / Δ t , of the chords drawn between each concentration m t point and the starting concentration m o . The graphs of the slope of the chord per time were then fitted to a second-order polynomial function. Finally, the initial rate ( r o ) was found by solving the second-order polynomial for the slope at t = 0 . The rates of release (positive rate) or uptake (negative rate) for the three main elements making up chalcopyrite and bornite [Cu, Fe, and S (as SO42−)], the pH and Eh variation after 30 days of leaching in the various lixiviants are compared in Table 1 and Figure 9. According to Figure 9, various symbols are used to represent distinct experimental conditions: circles indicate NaCl-rich lixiviants, rectangles signify CaCl2-rich lixiviants, stars denote AlCl3-rich lixiviants, triangles represent acid-only, and crosses indicate Fe3+-only. The pH changes across these experiments are depicted by the blue line, while the variations in redox potential (Eh) are shown by the orange line for each test.
Analysis of the calculated reaction rates (Figure 9) reveals that total S (as SO42−) and Fe appear to be consumed, while Cu is released, as evidenced by the negative signs for S (as SO42−) and Fe and the positive sign for Cu. Additionally, the absolute rate of Cu release is lower compared to the combined rates of S (as SO42−) and Fe uptake (Figure 9). The observed rates of Cu release followed the trend: acidic AlCl3-rich > CaCl2-rich > FeCl3-only > NaCl-rich lixiviant (Figure 9). Notably, the lowest Cu release rate occurred during the proton-promoted dissolution in acid only (B-H25). This observation can be attributed to the low concentration of Fe3+ in this system. As previously discussed, and observed per the EPMA analysis, proton-promoted dissolution (B-H25) favours the preferential release of Fe compared to Cu and S, leaving behind a residual Cu-S-rich phase. This behaviour contrasts with the combined ferric iron and proton-promoted leaching cases (e.g., B-Na25, B-Ca25, and B-Al25), where copper was also released, leaving behind a residual Fe-SO4 phase (Figure 9).
The Eh for all the experimental cases dropped (Figure 9), consistent with the redox-controlled reaction of the copper sulphide minerals. The Eh drop occurs for the lixiviants in the order: AlCl3-rich < NaCl-rich < CaCl2-rich < acid-only. Also, the drop in Eh is associated with a drop in pH for the AlCl3-rich, NaCl-rich, and CaCl2-rich lixiviants. In contrast, there is an increase in pH for the acid-only and FeCl3-only cases as Eh drops. Figure 8 and Figure 9 show that high Eh and high acidity at 30 days lead to a relative increase in Cu concentration in the AlCl3-rich lixiviant. The Eh for the AlCl3-rich lixiviant at 25 °C decreases from ~660 mV to 507 mV as the acidity increases from pH 1.3 to pH 0.9, resulting in a higher copper concentration compared to the NaCl-rich lixiviant (Eh decrease from ~642 mV to 488 mV). A high Eh value typically indicates a high Fe3+/Fe2+ ratio. As the Fe3+ concentration increases, a higher acidity is required to prevent its hydrolysis. Conversely, a combination of high acidity and high Eh suggests that Fe3+ is less likely to undergo hydrolysis and form Fe-hydroxy sulphates [20]. This allows Fe3+ to remain in solution and promote enhanced dissolution of chalcopyrite and bornite [20].
Figure 9. Rates of (a) Cu (b) Fe and (c) S (as SO4) release (positive values) and consumption (negative values) expressed in mol/m2s, alongside changes in Eh and pH. The symbols denote different experimental conditions: circles for NaCl-rich, rectangles for CaCl2-rich, stars for AlCl3-rich, triangles for acid-only, and crosses for Fe3+-only. pH changes are represented by the blue line, and Eh variations by the orange line for each test.
Minerals 15 00214 g009

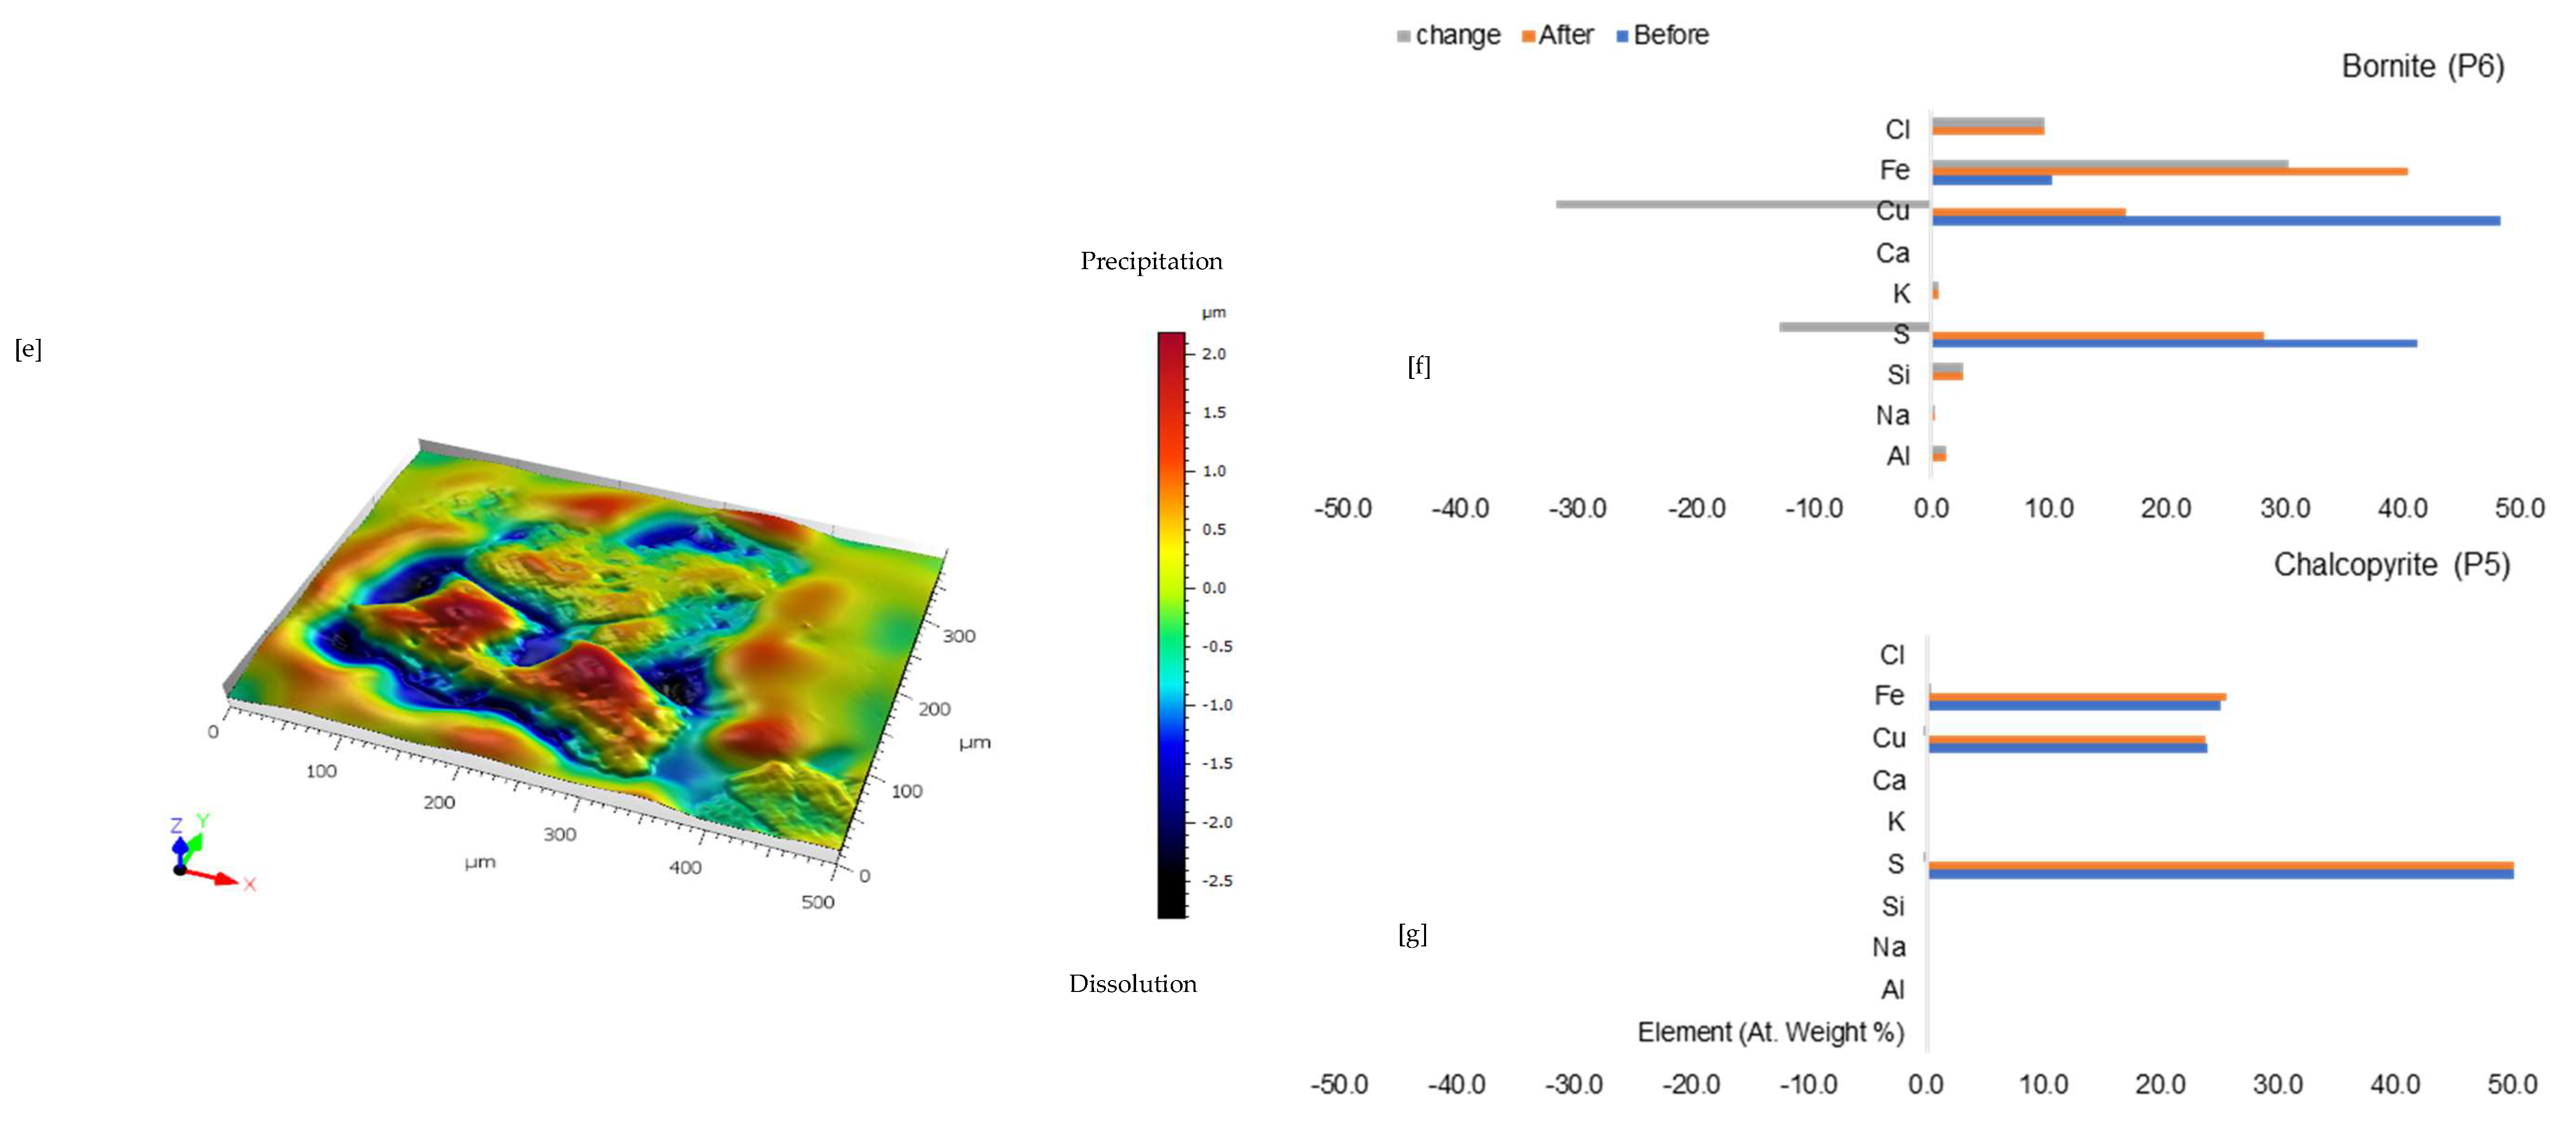
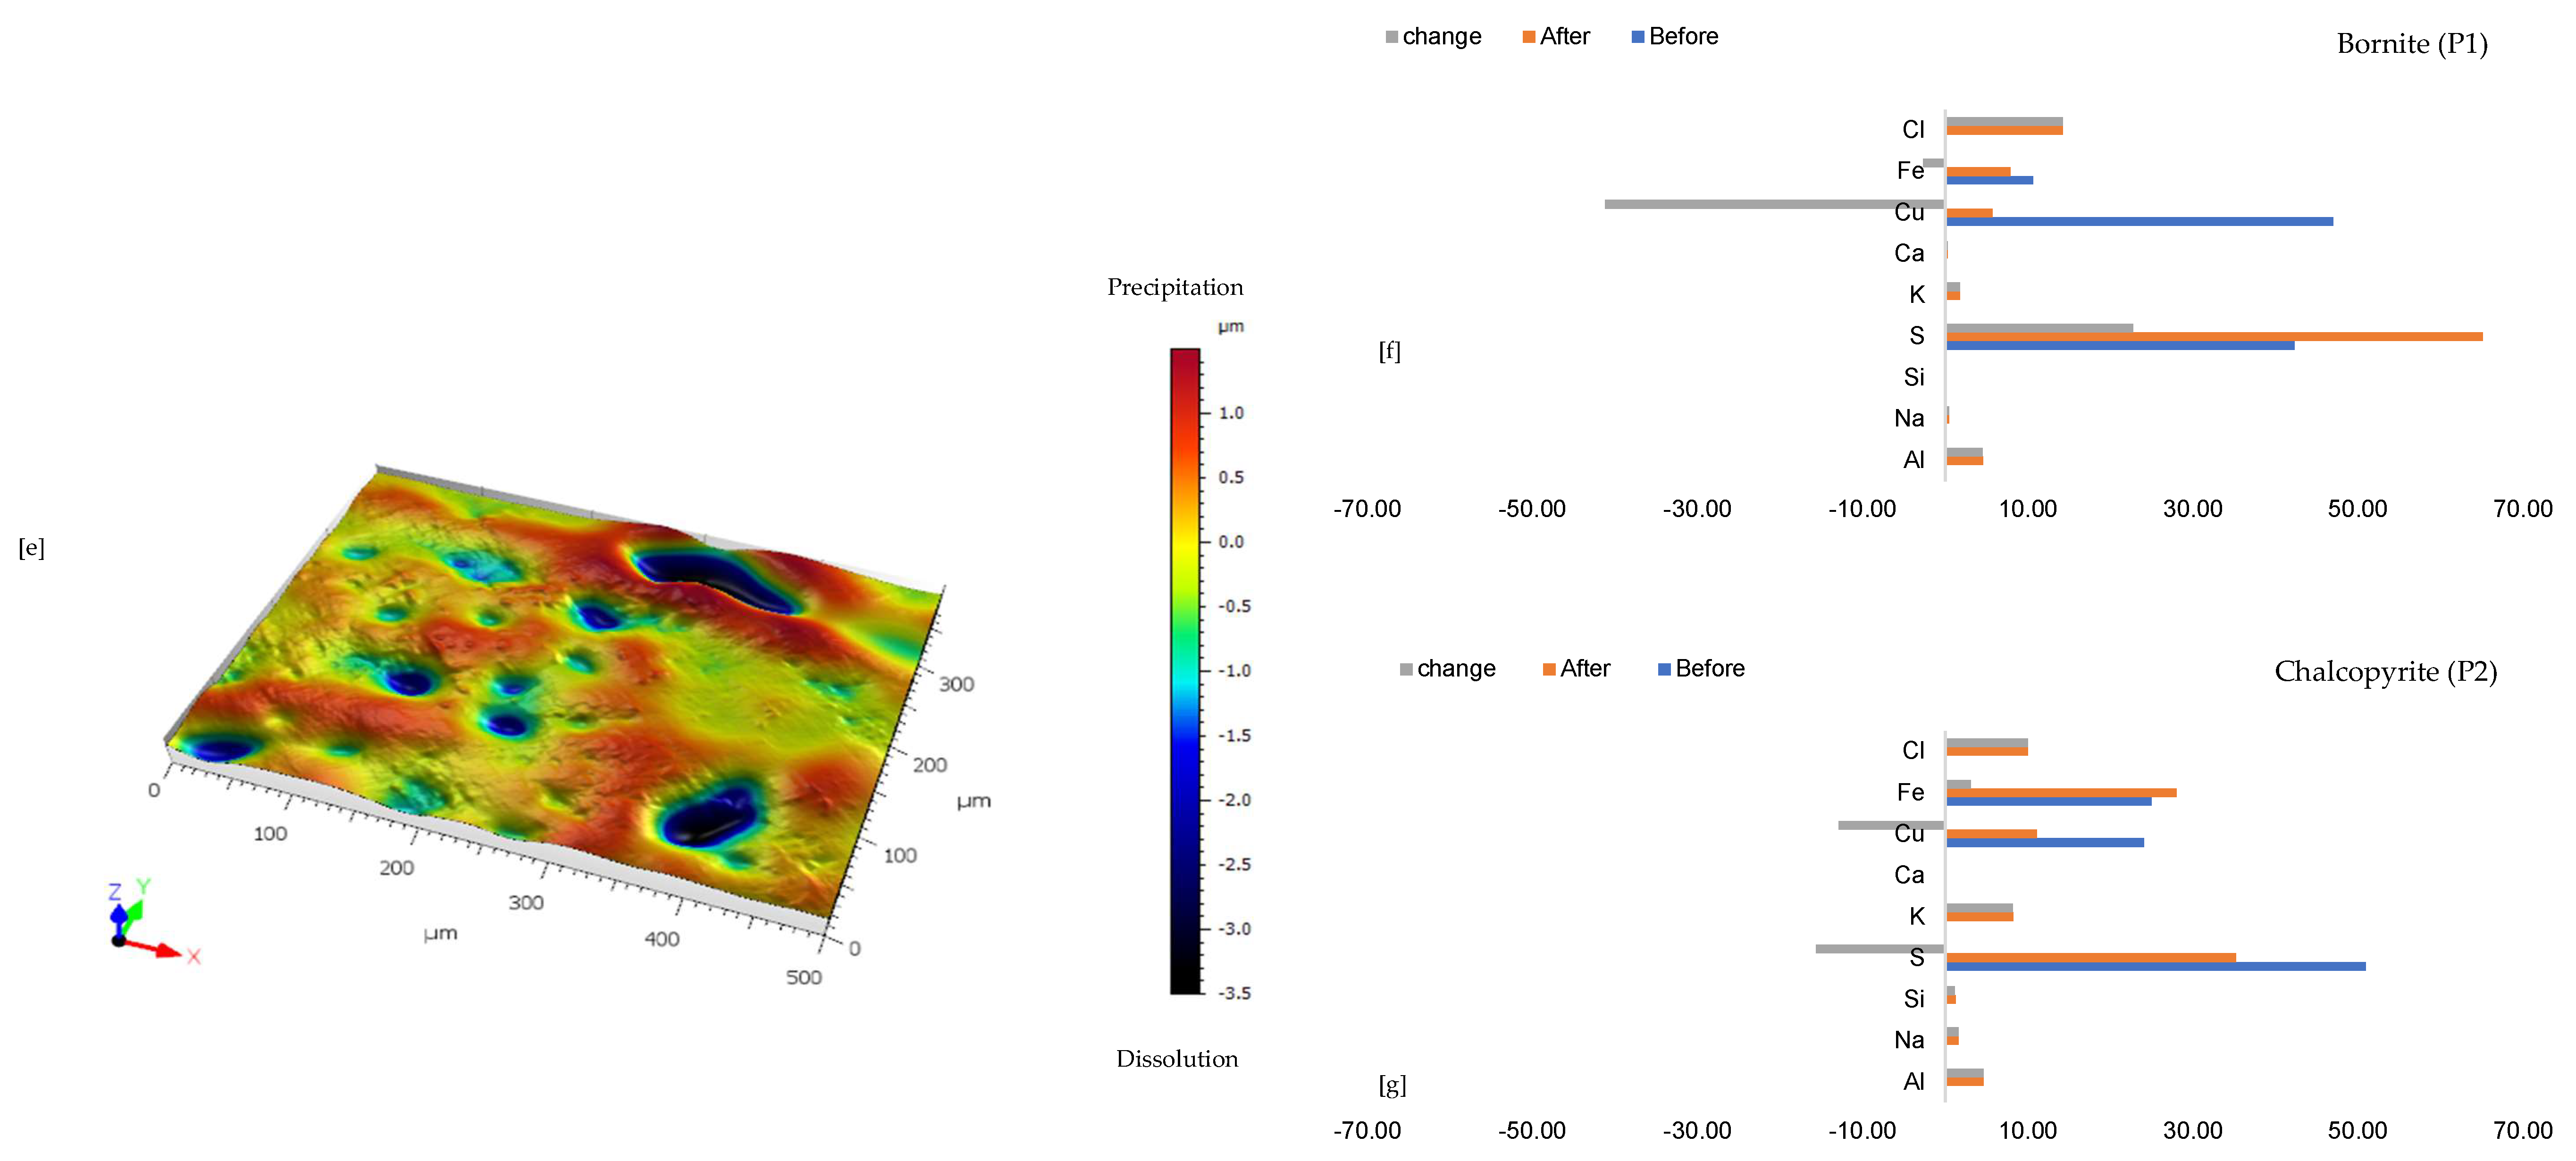
3.4. Rate of Passivate Layer Formation and Its Impact on Copper Dissolution

Coupled dissolution-reprecipitation of minerals can form passivating layers, from amorphous to crystalline, on primary phases. Initially, the reaction rate is interface-controlled, but as a less porous layer develops, diffusion through it becomes rate-limiting. This study examined how Fe flux influences passivate formation and copper release. The rate of Fe release ( r F e ) from the chord method was normalised per the initial BET surface area (m2) of the porphyry copper ore material. This normalised rate defined the flux J F e , m o l / m 2 s —which defines how fast the total Fe component was transferred to or from the mineral-solvent interface. From above, it is observed that r F e = J F e A . By combining these expressions, it is feasible to calculate how the rate of change in an element concentration in solution is related to the dissolution flux of the copper sulphide minerals. A plot of the total Fe flux ( J F e ) from the solution to the copper sulphide ore mineral surface declines as an approximate linear function of the square root of time, steeply or otherwise (Figure S9 of Supplementary Materials). A linear model (Equation (1)) can be observed, where b is the concentration gradient and the intercept, J F e o , is the flux at zero time, before any passivate has permanently formed [35]:
J F e = b t 1 / 2 + J F e o
The slope of J F e versus t 1 2 is steeper for combined ferric iron-proton promoted dissolution in NaCl-rich lixiviant (B-Na25 at 25 °C), and AlCl3-rich lixiviant (B-Al45 at 45 °C) as compared to FeCl3-only (B-Fe25 at 25 °C), AlCl3-rich lixiviant (B-Al25 at 25 °C) and CaCl2-rich lixiviant (B-Ca25 at 25 °C) (Figure 10 and Figure S9 of Supplementary Materials). This is a result of the passivation layer forming more quickly. In contrast, JFe does not sharply decline in an acidic lixiviant without Fe3+ as a reagent (proton-promoted dissolution only, B-H25). This can be attributed to the limited availability of Fe for passivation layer formation, as evidenced by the lower Fe content observed in the solution (Figure 10). Fe3+ concentration will eventually reach a maximum value due to the combined effects of acid leaching of the dissolving minerals and the oxidation of Fe2+ to Fe3+.
Figure 10. The calculated time taken to reduce the initial Fe flux ( J F e o ) to an assumed 5% of the original flux for the various lixiviant media.
Minerals 15 00214 g010
The experimental results and Equation (1) were combined to estimate how long the passivates effectively inhibit the Fe flux from the solution to the mineral surface, thereby hindering Cu dissolution. Therefore, Equation (1) was rearranged to solve for t 1 / 2 as a function of the fractional flux remaining f = J F e / J F e o [35] as:
t 1 / 2 = f 1 b
The time required for the initial Fe flux to decrease to a presumed 5% of its original value was calculated for various experiments (Figure 10). These were 42.5, 215.2, 484.3, 34.4, 53.8, and 23.9 days for B-Na25, B-Ca25, B-Al25, B-H25, B-Al45, and B-Fe25, respectively. Therefore, Fe3+ flux inhibition during leaching at 25 °C occurs more slowly in CaCl2- and AlCl3-rich lixiviants compared to acid-only, FeCl3-only, and NaCl-rich lixiviants.
The Fe3+ flux inhibition is less in CaCl2- and AlCl3-rich lixiviants because the high ionic strength in these solutions increases proton activity and complexation of copper and iron chloride species. Miller et al. [36] asserted that in saturated chloride brines such as CaCl2 and AlCl3, the dissolution rates of FeSO4 phases, including jarosite, increase with chloride activity due to enhanced Fe3+ and Al3+ complexation with Cl. Pritchett et al. [37] further noted that FeCl3 complexes on jarosite surfaces in chloride-rich conditions can break down Fe–O bonds. Also, Ansah et al. [18,19,20] proposed that Al3+ ions engage in an ion exchange with Fe3+, which minimises the passivation caused by Fe-SO4 phases in AlCl3-rich lixiviants. This occurs because Al3+ has a higher charge density and a smaller ionic radius, enabling stronger interactions with SO42− ions. Consequently, this fosters the formation of Al-rich phases and lowers the ion activity product for passivating compounds like jarosite, enhancing copper recovery. Furthermore, Figure 10 shows that it takes a year and a half for chalcopyrite to passivate in AlCl3-rich lixiviant at 25 °C, but only a month and a half at 45 °C. This can be explained by the enhanced kinetic and thermodynamic favourability for AlSO4 formation from AlCl3 and sulphate ions or related precursors at higher temperatures (Figure 6 and Figure 7).

4. Conclusions

This study has demonstrated that the mobilisation of copper from primary sulphides such as chalcopyrite and bornite is significantly influenced by surface passivation phenomena, particularly under conditions of coupled dissolution and reprecipitation (CDR) in acidic and chloride-rich environments. The use of an AlCl3-rich lixiviant has been shown to enhance copper mobilisation by mitigating the formation of Fe-SO4 passivating phases (e.g., jarosite), thereby promoting the dissolution of copper from both bornite and chalcopyrite. In contrast to monovalent and divalent cation-rich lixiviants (NaCl, CaCl2) and acid-only, the presence of trivalent Al3+ ions in the chloride medium maintains high levels of Fe3+ in the solution for copper dissolution via the preferential formation of Al-SO4 phases at high Eh and acidity conditions. These findings suggest that the strategic use of multivalent cations, Al3+ in acidic chloride lixiviants, could substantially improve copper recovery processes in industrial applications, offering a pathway to more efficient and sustainable copper extraction from low-grade ores.

Supplementary Materials

The following supporting information can be downloaded at: https://www.mdpi.com/article/10.3390/min15030214/s1. Figure S1: Mineralogical identifications for the various size fractions of the porphyry copper ore (a) +0.425–1 mm, (b) +0.250–0.425 mm and (c) +0.125–0.250 mm. Figure S2: (a) Experimental set-up for batch experiment in this study showing 5 connected under-water air-stirred tubing. The granulated material and wafer were hung in the bottles (b) Schemat-ic of the wafer used in this study (c) Example of a mosaic image of the wafer obtained with a Zeiss Axio Imager attached with a Trackworks software version 3.1.10. Figure S3: Porosity evaluation of selected grain of the unreacted wafer surface prior to leaching in the AlCl3-rich brine at 45 °C. Figure S4: Porosity evaluation of selected grains of the wafer surface before (a–c) and after (b–d) during proton-promoted leaching of porphyry copper ore. Figure S5: Porosity evaluation of selected grains of the wafer surface in FeCl3 only before (a–c) and after (b–d) leaching for 30 days. Figure S6: Porosity evaluation for combined ferric-proton dissolution in AlCl3-rich brine at 25 °C. Figure S7: Porosity evaluation for combined ferric-proton dissolution in NaCl-rich brine at 25 °C. Figure S8: Porosity evaluation for combined ferric-proton dissolution in CaCl2-rich brine at 25 °C. Figure S9: Fe Flux against square root of time for the various experiments in Table 1 of the manuscript. BBW1-BNa25; BBW2-BCa25; BBW3-BAl25; BBW4-BH25; BBW5-BAl45; BBW6-BFe25. Table S1: Major and minor element and compound analysis results of the bulk oven dried sample (105 °C basis) for the various size fractions of the porphyry copper ore. Table S2: Particle size analysis of the low-grade ore utilised in this study. Table S3: EPMA elemental analysis of the various points analysed on the wafer surface. These values are the average of duplicated measurements at the same area.

Author Contributions

Conceptualization, E.O.A., J.R.B. and R.R.H.; methodology, E.O.A.; software, E.O.A.; validation, E.O.A., J.R.B. and R.R.H.; formal analysis, E.O.A., J.R.B. and R.R.H.; investigation, E.O.A.; resources, R.R.H.; data curation, E.O.A.; writing—original draft preparation, E.O.A.; writing—review and editing, E.O.A., J.R.B. and R.R.H.; visualization, E.O.A.; supervision, J.R.B. and R.R.H.; project administration, R.R.H.; funding acquisition, R.R.H. All authors have read and agreed to the published version of the manuscript.

Funding

This research was funded by Melbourne Research and George Lansell Memorial Scholarships.

Data Availability Statement

All data has been presented in the manuscript. Additional data can be made available upon request from the corresponding author.

Acknowledgments

We thank the Melbourne Trace Analysis Chemical, Earth, and Environmental Sciences (TrACEES) Platform for access to instrumentation and their assistance with correlative microscopy in this investigation. Graham Hutchinson and Ling Chang are gratefully acknowledged. Ranjeet Singh supported the surface area study. The comments and discussion of Hoa Kha of Rowe Scientific and Kodjo Afewu on the work are greatly appreciated.

Conflicts of Interest

The authors declare no conflicts of interest.

References

  1. Ren, Z.; Chao, C.; Krishnamoorthy, P.; Asselin, E.; Dixon, D.G.; Mora, N. The overlooked mechanism of chalcopyrite passivation. Acta Mater. 2022, 236, 118111. [Google Scholar] [CrossRef]
  2. Dutrizac, J.E. The dissolution of chalcopyrite in ferric sulfate and ferric chloride media. Met. Trans. B 1981, 12, 371–378. [Google Scholar] [CrossRef]
  3. Klauber, C. A critical review of the surface chemistry of acidic ferric sulphate dissolution of chalcopyrite with regards to hindered dissolution. Int. J. Miner. Process. 2008, 86, 1–17. [Google Scholar] [CrossRef]
  4. Lázaro-Báez, M.I. Electrochemistry of the Leaching of Chalcopyrite. Ph.D. Thesis, Murdoch University, Perth, Australia, 2001. [Google Scholar]
  5. Lundström, M. Chalcopyrite Dissolution in Cupric Chloride Solutions. Ph.D. Thesis, Aalto University, Espoo, Finland, 2009. [Google Scholar]
  6. Watling, H.R. Chalcopyrite hydrometallurgy at atmospheric pressure: 1. Review of acidic sulfate, sulfate-chloride and sulfate-nitrate process options. Hydrometallurgy 2013, 140, 163–180. [Google Scholar] [CrossRef]
  7. Dutrizac, J.E. The kinetics of dissolution of chalcopyrite in ferric ion media. Met. Trans. B 1978, 9, 431–439. [Google Scholar] [CrossRef]
  8. Dutrizac, J.E.; Dinardo, O. The co-precipitation of copper and zinc with lead jarosite. Hydrometallurgy 1983, 11, 61–78. [Google Scholar] [CrossRef]
  9. Putnis, A.; Putnis, C.V. The mechanism of reequilibration of solids in the presence of a fluid phase. J. Solid State Chem. 2007, 180, 1783–1786. [Google Scholar] [CrossRef]
  10. Ruiz-Agudo, E.; Putnis, C.; Putnis, A. Coupled dissolution and precipitation at mineral–fluid interfaces. Chem. Geol. 2014, 383, 132–146. [Google Scholar] [CrossRef]
  11. Putnis, A. Transient Porosity Resulting from Fluid-Mineral. Rev. Miner. Geochem. 2015, 80, 1–23. [Google Scholar] [CrossRef]
  12. Hidalgo, T.; Kuhar, L.; Beinlich, A.; Putnis, A. Kinetics and mineralogical analysis of copper dissolution from a bornite/chalcopyrite composite sample in ferric-chloride and methanesulfonic-acid solutions. Hydrometallurgy 2019, 188, 140–156. [Google Scholar] [CrossRef]
  13. Córdoba, E.; Muñoz, J.; Blázquez, M.; González, F.; Ballester, A. Leaching of chalcopyrite with ferric ion. Part I: General aspects. Hydrometallurgy 2008, 93, 81–87. [Google Scholar] [CrossRef]
  14. Chaudhari, A.; Brugger, J.; Ram, R.; Chowdhury, P.; Etschmann, B.; Guagliardo, P.; Xia, F.; Pring, A.; Gervinskas, G.; Liu, A.; et al. Synchronous solid-state diffusion, dissolution-reprecipitation, and recrystallization leading to isotopic resetting: Insights from chalcopyrite replacement by copper sulfides. Geochim. Cosmochim. Acta 2022, 331, 48–68. [Google Scholar] [CrossRef]
  15. Hidalgo, T.; Kuhar, L.; Beinlich, A.; Putnis, A. Kinetic study of chalcopyrite dissolution with iron(III) chloride in methanesulfonic acid. Miner. Eng. 2018, 125, 66–74. [Google Scholar] [CrossRef]
  16. Hong, M.; Liu, S.; Huang, X.; Yang, B.; Zhao, C.; Yu, S.; Liu, Y.; Qiu, G.; Wang, J. A review on bornite (bio) leaching. Miner. Eng. 2021, 174, 107245. [Google Scholar] [CrossRef]
  17. Lazaro, I.; Nicol, M.J. The mechanism of the dissolution and passivation of chalcopyrite: An electrochemical study. In Proceedings of the 5th International Symposium on Hydrometallurgy in Honor of Professor Ian Ritchie, Vancouver, BC, Canada, 24–28 August 2003; pp. 405–417. [Google Scholar]
  18. Ansah, E.O.; Jyoti, A.; Black, J.R.; Haese, R.R. Sensitivity of lixiviant chemistry on coupled dissolution–precipitation mechanisms during copper sulphide heap leaching. In Proceedings of the International Mineral Processing Conference (IMPC), Melbourne, VIC, Australia, 22–24 August 2022; p. 10. [Google Scholar]
  19. Ansah, E.O.; Jyoti, A.; Black, J.R.; Haese, R.R. The importance of reaction mechanisms and coupled dissolution with reprecipitation (CDR) reactions when modelling copper leaching in heap systems. Miner. Eng. 2023, 203, 108357. [Google Scholar] [CrossRef]
  20. Ansah, E.O.; Black, J.R.; Haese, R.R. Enhancement of copper mobilization using acidic AlCl3—rich lixiviant. Miner. Eng. 2024, 217, 108953. [Google Scholar] [CrossRef]
  21. Dutrizac, J.E.; Jambor, J.L. Jarosites and their application in hydrometallurgy. Rev. Miner. Geochem. 2000, 40, 405–452. [Google Scholar] [CrossRef]
  22. Jambor, J.L. Nomenclature of the alunite supergroup. Can. Mineral. 1999, 37, 1323–1341. [Google Scholar]
  23. Kartal, M.; Xia, F.; Ralph, D.; Rickard, W.D.; Renard, F.; Li, W. Enhancing chalcopyrite leaching by tetrachloroethylene-assisted removal of sulphur passivation and the mechanism of jarosite formation. Hydrometallurgy 2019, 191, 105192. [Google Scholar] [CrossRef]
  24. Adegoke, I.A.; Xia, F.; Deditius, A.P.; Pearce, M.A.; Roberts, M.P.; Brugger, J. A new mode of mineral replacement reactions involving the synergy between fluid-induced solid-state diffusion and dissolution-reprecipitation: A case study of the replacement of bornite by copper sulfides. Geochim. Cosmochim. Acta 2022, 330, 165–190. [Google Scholar] [CrossRef]
  25. Zhao, J.; Brugger, J.; Ngothai, Y.; Pring, A. The replacement of chalcopyrite by bornite under hydrothermal conditions. Am. Miner. 2014, 99, 2389–2397. [Google Scholar] [CrossRef]
  26. Gómez, C.; Román, E.; Blázquez, M.; Ballester, A. SEM and AES studies of chalcopyrite bioleaching in the presence of catalytic ions. Miner. Eng. 1997, 10, 825–835. [Google Scholar] [CrossRef]
  27. Eghbalnia, M. Electrochemical and Raman Investigation of Pyrite and Chalcopyrite Oxidation. Ph.D. Thesis, University of British Columbia, Vancouver, BC, Canada, 2012. [Google Scholar]
  28. Gleadow, A.; Kohn, B.; Seiler, C. The future of fission-track thermochronology. In Fission-Track Thermochronology and Its Application to Geology; Malusà, M.G., Fitzgerald, P.G., Eds.; Springer Nature: Cham, Switzerland, 2019; pp. 77–92. [Google Scholar]
  29. Gleadow, A.J.W.; Gleadow, S.J.; Belton, D.X.; Kohn, B.P.; Krochmal, M.S.; Brown, R.W. Coincidence mapping-a key strategy for the automatic counting of fission tracks in natural minerals. Geol. Soc. London 2009, 324, 25–36. [Google Scholar] [CrossRef]
  30. Phukan, M.; Vu, H.P.; Haese, R.R. Mineral dissolution and precipitation reactions and their net balance controlled by mineral surface area: An experimental study on the interactions between continental flood basalts and CO2-saturated water at 80 bars and 60 °C. Chem. Geol. 2020, 559, 119909. [Google Scholar] [CrossRef]
  31. Parkhurst, D.L.; Appelo, C.A.J. Description of Input and Examples for PHREEQC Version 3: A Computer Program for Speciation, Batch-Reaction, One-Dimensional Transport, and Inverse Geochemical Calculations; U.S Geological Survey: Denver, CO, USA, 2013. [Google Scholar]
  32. Holmes, P.; Crundwell, F. Polysulfides do not cause passivation: Results from the dissolution of pyrite and implications for other sulfide minerals. Hydrometallurgy 2013, 139, 101–110. [Google Scholar] [CrossRef]
  33. O’malley, M.L.; Liddell, K.C. Leaching of CuFeS2 by aqueous FeCl3, HCl, and NaCl: Effects of solution composition and limited oxidant. Met. Trans. B 1987, 18, 505–510. [Google Scholar] [CrossRef]
  34. Skrobian, M.; Havlik, T.; Ukasik, M. Effect of NaCl concentration and particle size on chalcopyrite leaching in cupric chloride solution. Hydrometallurgy 2005, 77, 109–114. [Google Scholar] [CrossRef]
  35. Rimstidt, J.D. Geochemical Rate Models: An Introduction to Geochemical Kinetics; Cambridge University Press: Cambridge, UK, 2014. [Google Scholar]
  36. Miller, J.; Madden, A.E.; Phillips-Lander, C.; Pritchett, B.; Madden, M.E. Alunite dissolution rates: Dissolution mechanisms and implications for Mars. Geochim. Cosmochim. Acta 2016, 172, 93–106. [Google Scholar] [CrossRef]
  37. Pritchett, B.; Madden, M.E.; Madden, A.S. Jarosite dissolution rates and maximum lifetimes in high salinity brines: Implications for Earth and Mars. Earth Planet. Sci. Lett. 2012, 357, 327–336. [Google Scholar] [CrossRef]
Figure 6. Leaching in AlCl3-rich lixiviant at 25 °C: (a) Unreacted wafer surface showing bornite (Bn) and chalcopyrite (Ccp) in a feldspar (Afs) vein under a reflective microscope. (b) Back-scattered electron (BSE) image from the FE-EPMA before the experiment showing two distinct copper sulphide—chalcopyrite and bornite—interspersed in a feldspar vein (c) BSE image of the reacted wafer surface showing the two copper sulphide phases totally covered with Fe-Al-SO4 phase (d) Reflected microscope image of the reacted wafer surface. (e) 3D topographical image obtained with Mountains® version 9 software. (f,g) Quantitative elemental compositional changes (in atomic weight percent) in the phases recorded for the two different copper sulphide phases. Refer to Table S3 of Supplementary Materials for the average chemical composition of P4.
Minerals 15 00214 g006aMinerals 15 00214 g006b
Figure 7. Leaching in AlCl3-rich lixiviant at 45 °C: (a) Initial state of wafer surface showing the presence of chalcopyrite (bright yellow), bornite (pinkish brown), anhydrite (purple), and alkaline feldspar (grey) under a reflective microscope (b) Fe-Al-rich phase covering the whole wafer surface after the experiment (c) BSE image of the initial wafer surface.
Minerals 15 00214 g007
Disclaimer/Publisher’s Note: The statements, opinions and data contained in all publications are solely those of the individual author(s) and contributor(s) and not of MDPI and/or the editor(s). MDPI and/or the editor(s) disclaim responsibility for any injury to people or property resulting from any ideas, methods, instructions or products referred to in the content.

