Article

Characterization of Intra-Quarry Variability in Pentelic Marble Using Stable Isotopes: A Case Study of the Parthenon

Department of Environmental Science, Willamette University, Salem, OR 97301, USA
Minerals 2025, 15(3), 231; https://doi.org/10.3390/min15030231
Submission received: 19 December 2024 / Revised: 18 February 2025 / Accepted: 22 February 2025 / Published: 26 February 2025
(This article belongs to the Special Issue Provenance Analyses of Ancient Stones Using Scientific Methods)

Abstract

:
This study presents a systematic analysis of stable isotopes (δ13C and δ18O) in Pentelic marble from the ancient quarries of Mount Pentelikon, Greece. A total of 610 samples were collected from 83 quarry pits, including all identified ancient extraction sites, to build a comprehensive reference database. Of those, stable isotope ratios of carbon and oxygen were measured for 384 samples. The results reveal significant variability in stable isotope values across different quarry regions, challenging the assumption of isotopic homogeneity in Pentelic marble. Notably, distinct δ13C and δ18O patterns allow differentiation between quarry areas and specific extraction zones. These findings provide a more refined isotopic framework for provenance studies of ancient artifacts. Application of the new database suggests that marble for the Parthenon’s West Pediment was sourced from the northern upslope quarries in Aspra Marmara, whereas structural elements of the Parthenon were extracted from the lower Spilia Divail quarry, as well as other pits across the ancient quarry zone. The results demonstrate that multiple quarry pits from both the lower slope and upper slope quarries were exploited for the construction of the Parthenon. This research highlights the benefits of extensive sampling and stable isotope analysis in identifying quarry sources, emphasizing the value of undertaking detailed and thorough field surveys and sampling programs to gain new perspectives into ancient resource use.

1. Introduction

Variations in the range of δ13C and δ18O values in discrete marble formations in the eastern Mediterranean have been used with limited success to distinguish between many different ancient white marble quarries [1,2,3,4]. The ability to quantitatively distinguish between the different quarries utilized in antiquity provides a tool for archaeologists, art historians, and museum curators to assign provenance to ancient Greek and Roman marble artifacts. The correct assignment of provenance assists scholars in their investigations of dating an execution of a sculpture, tracing ancient avenues of commerce, giving insight into evolving aesthetic values, and in determining modern forgeries, ancient copies and dissociated fragments [5]. There is a rich literature of archaeometric studies focused on determining the provenance of marble and other antique stones that use multiple physical and chemical techniques [4,6,7,8,9,10,11,12,13].
The quarries on Mount Pentelikon, Attica, Greece, have been a primary source of white marble since the beginning of the fifth century BCE [14]. The quarries were first exploited on a large scale for the 5th century BCE Periclean building projects, including the construction of the Parthenon and other monuments on the Athenian acropolis. During the Roman era, the immensely popular Pentelic marble was widely exported throughout the Mediterranean for both architectural and sculptural uses [15,16,17]. The Romans were so fond of the material that Pausanias (i.19) writes that Herodes Atticus exhausted the quarries for his various building programs in the 2nd century AD, though Pentelic marble was still being exported to North Africa in the 3rd century CE [18].
Despite its importance in Greek and Roman archaeology, the ability to accurately, physically, and geochemically characterize Pentelic resources has been met with challenges. A prevailing assumption of marble quarry characterization studies is that each quarry region is relatively isotopically homogenous. While there may be isotope variation within the region, spatially the spread of data is evenly distributed. This approach is problematic for Pentelic marble, as the distribution of δ13C and δ18O is quite large, especially when compared to the ranges of other known ancient sources [19,20] (Figure 1). Research published in the 1990s suggested that the reference sample collection used to develop the stable isotope signature field for the Pentelic quarries inadequately represented the entire quarry region. Matthews et al. [21] showed that marble samples of sculptural and architectural elements from the Parthenon and other monuments currently housed at the British Museum, which are historically documented as being Pentelic [22], have a higher oxygen isotope ratio than those in the established databases. Matthews et al. further suggested that there may be some spatial patterning or trends of stable isotope variation within the Pentelic quarry field.
Kane et al. [24] provided further support for the proposed idea of isotopic spatial patterning in the Pentelic quarries through their analysis of Pentelic sculptures from the Nymphaeum of Herodes Atticus at Olympia, Greece. Ancient financial records confirm the Pentelic origin of the marble used in this monument [25]. Stable isotope analyses of the marbles from various statues, their disassociated bases, and construction phases indicated that the materials may not all derive from the same quarry or individual block but instead from isotopically distinct blocks or possibly different quarries within the Pentelic region. However, the existing databases lack sufficient spatial information of the exact sampling locations, limiting their capacity to map isotope variations accurately across the quarry area.
To address these gaps, a comprehensive study was conducted to systematically characterize the isotope profile of Mount Pentelikon’s ancient quarry region. The project involved detailed survey, sampling, and analysis phases. The pedestrian survey was necessary to create a detailed geologic and topographic map that also delineated quarry features. The map was used as a guide to for an extensive sampling program throughout the quarry field that collected 610 samples [26]. Of those, 384 unaltered samples were analyzed using stable isotope analysis. This report focuses on the results from the spatially-rectified δ13C and δ18O isotope database of the ancient white marble quarries of Mt. Pentelikon.

2. Materials and Methods

To successfully model the isotopic profile of the ancient quarries on Mount Pentelikon, it was critical that a representative marble reference collection be obtained. Only this way can the reference sample collection be assured that every quarry is represented and that, if present, spatial isotopic trends can be mapped. To this end, an extensive topographic and geologic field survey was conducted. A detailed description of the survey and sampling program, the methodology employed, and findings are reported in Pike [26]. A summary of the results of the survey and sampling are reported here.
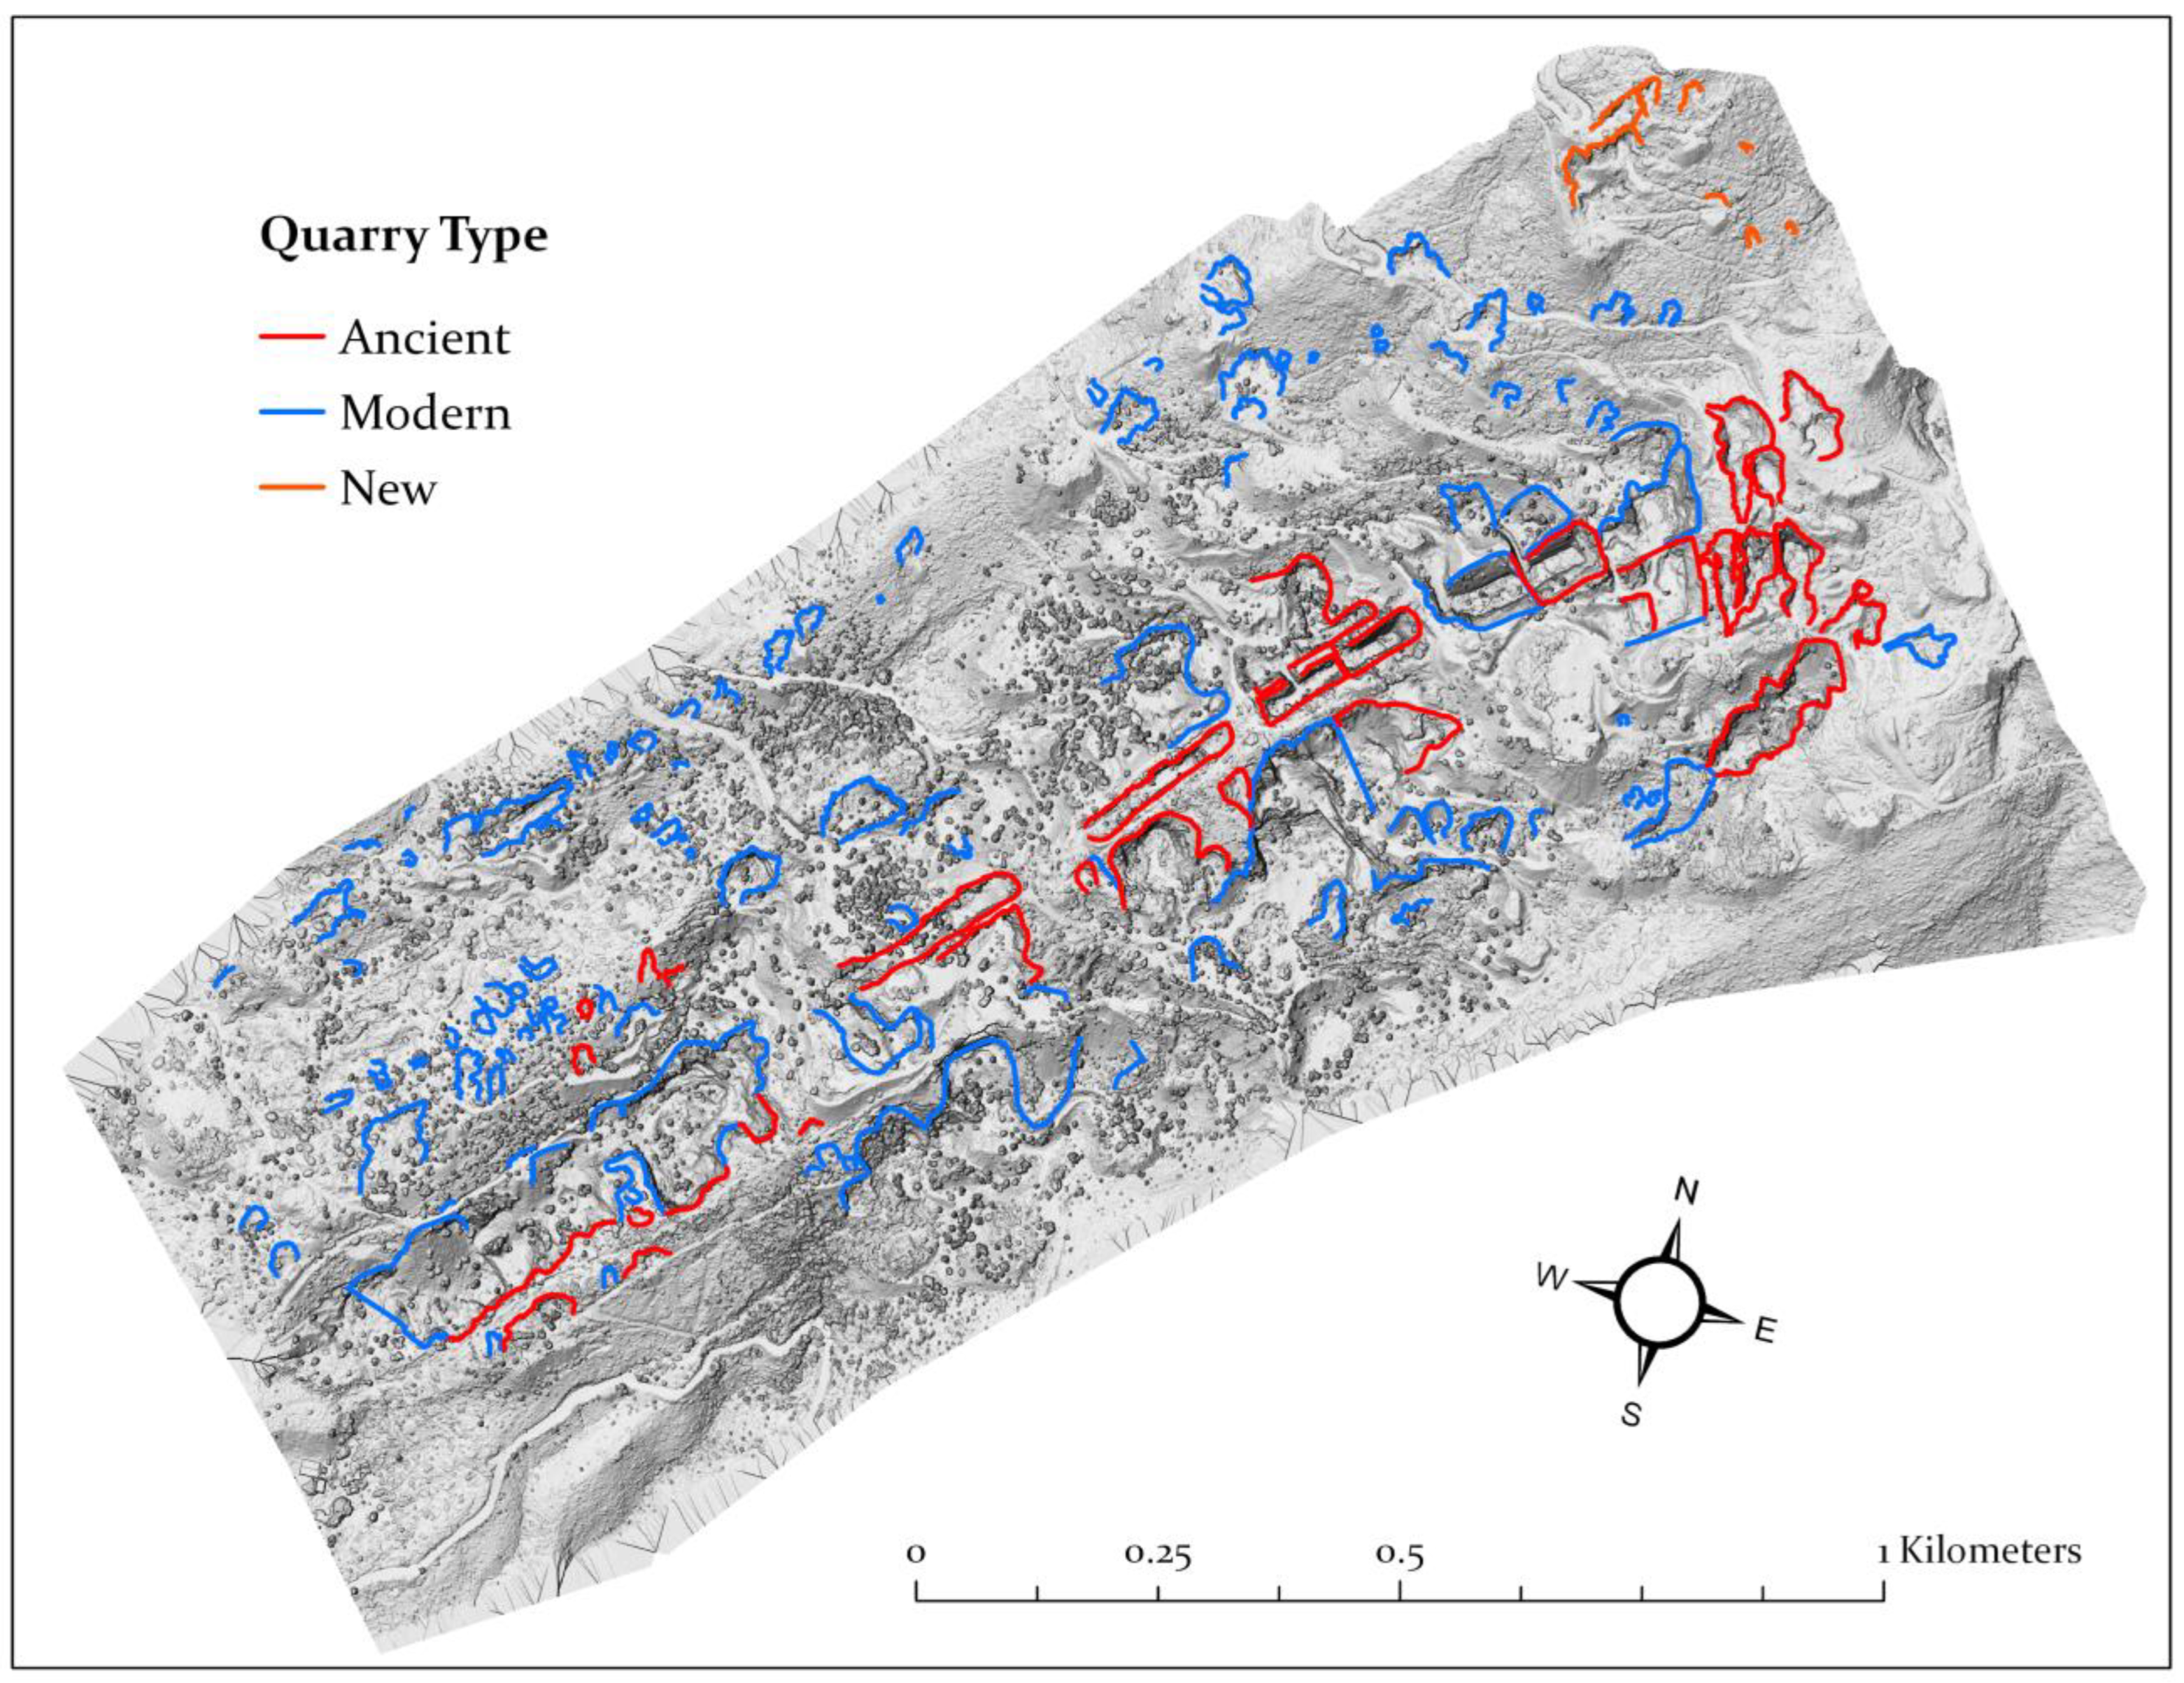
A quarry location map identifies 172 discrete quarries (Figure 2). Tool marks and unfinished worked blocks indicate that no fewer than thirty quarries were actively worked in antiquity [27,28] (Figure 3). The ancient quarries are distinguished by red traces that outline surviving quarry walls. In contrast, quarries traced in blue lack any physical evidence of ancient extraction activity and are displayed as modern quarry pits. For the purposes of this study, “modern” refers to the period following Greece’s independence from the Ottoman Empire in the mid-19th century. However, it is important to note that many modern quarries expanded into abandoned ancient extraction sites, thereby altering or obliterating physical evidence of earlier activity. Consequently, it is plausible that several quarries currently classified as modern were, in fact, exploited in antiquity. This complicates efforts to differentiate between ancient and modern operations solely based on surface observations.
The survey also documented key observations related to the geological structure of the quarries. Geologists studying northern Attica and Mount Pentelikon describe the mountain as an autochthonous, low- to medium-grade metamorphic complex that has been folded and uplifted into a northeastward-plunging anticlinorium. The primary geological composition of the mountain includes two distinct marble formations—the Upper Marble and the Lower Marble—separated by an intermediate schist layer known as the Kaisariani Schist. This schist is believed to extend eastward to Mount Hymettus. Within the Kaisariani Schist, a significant marble lens, often referred to as the Middle or Intermediate Marble, has been identified [29,30,31,32].
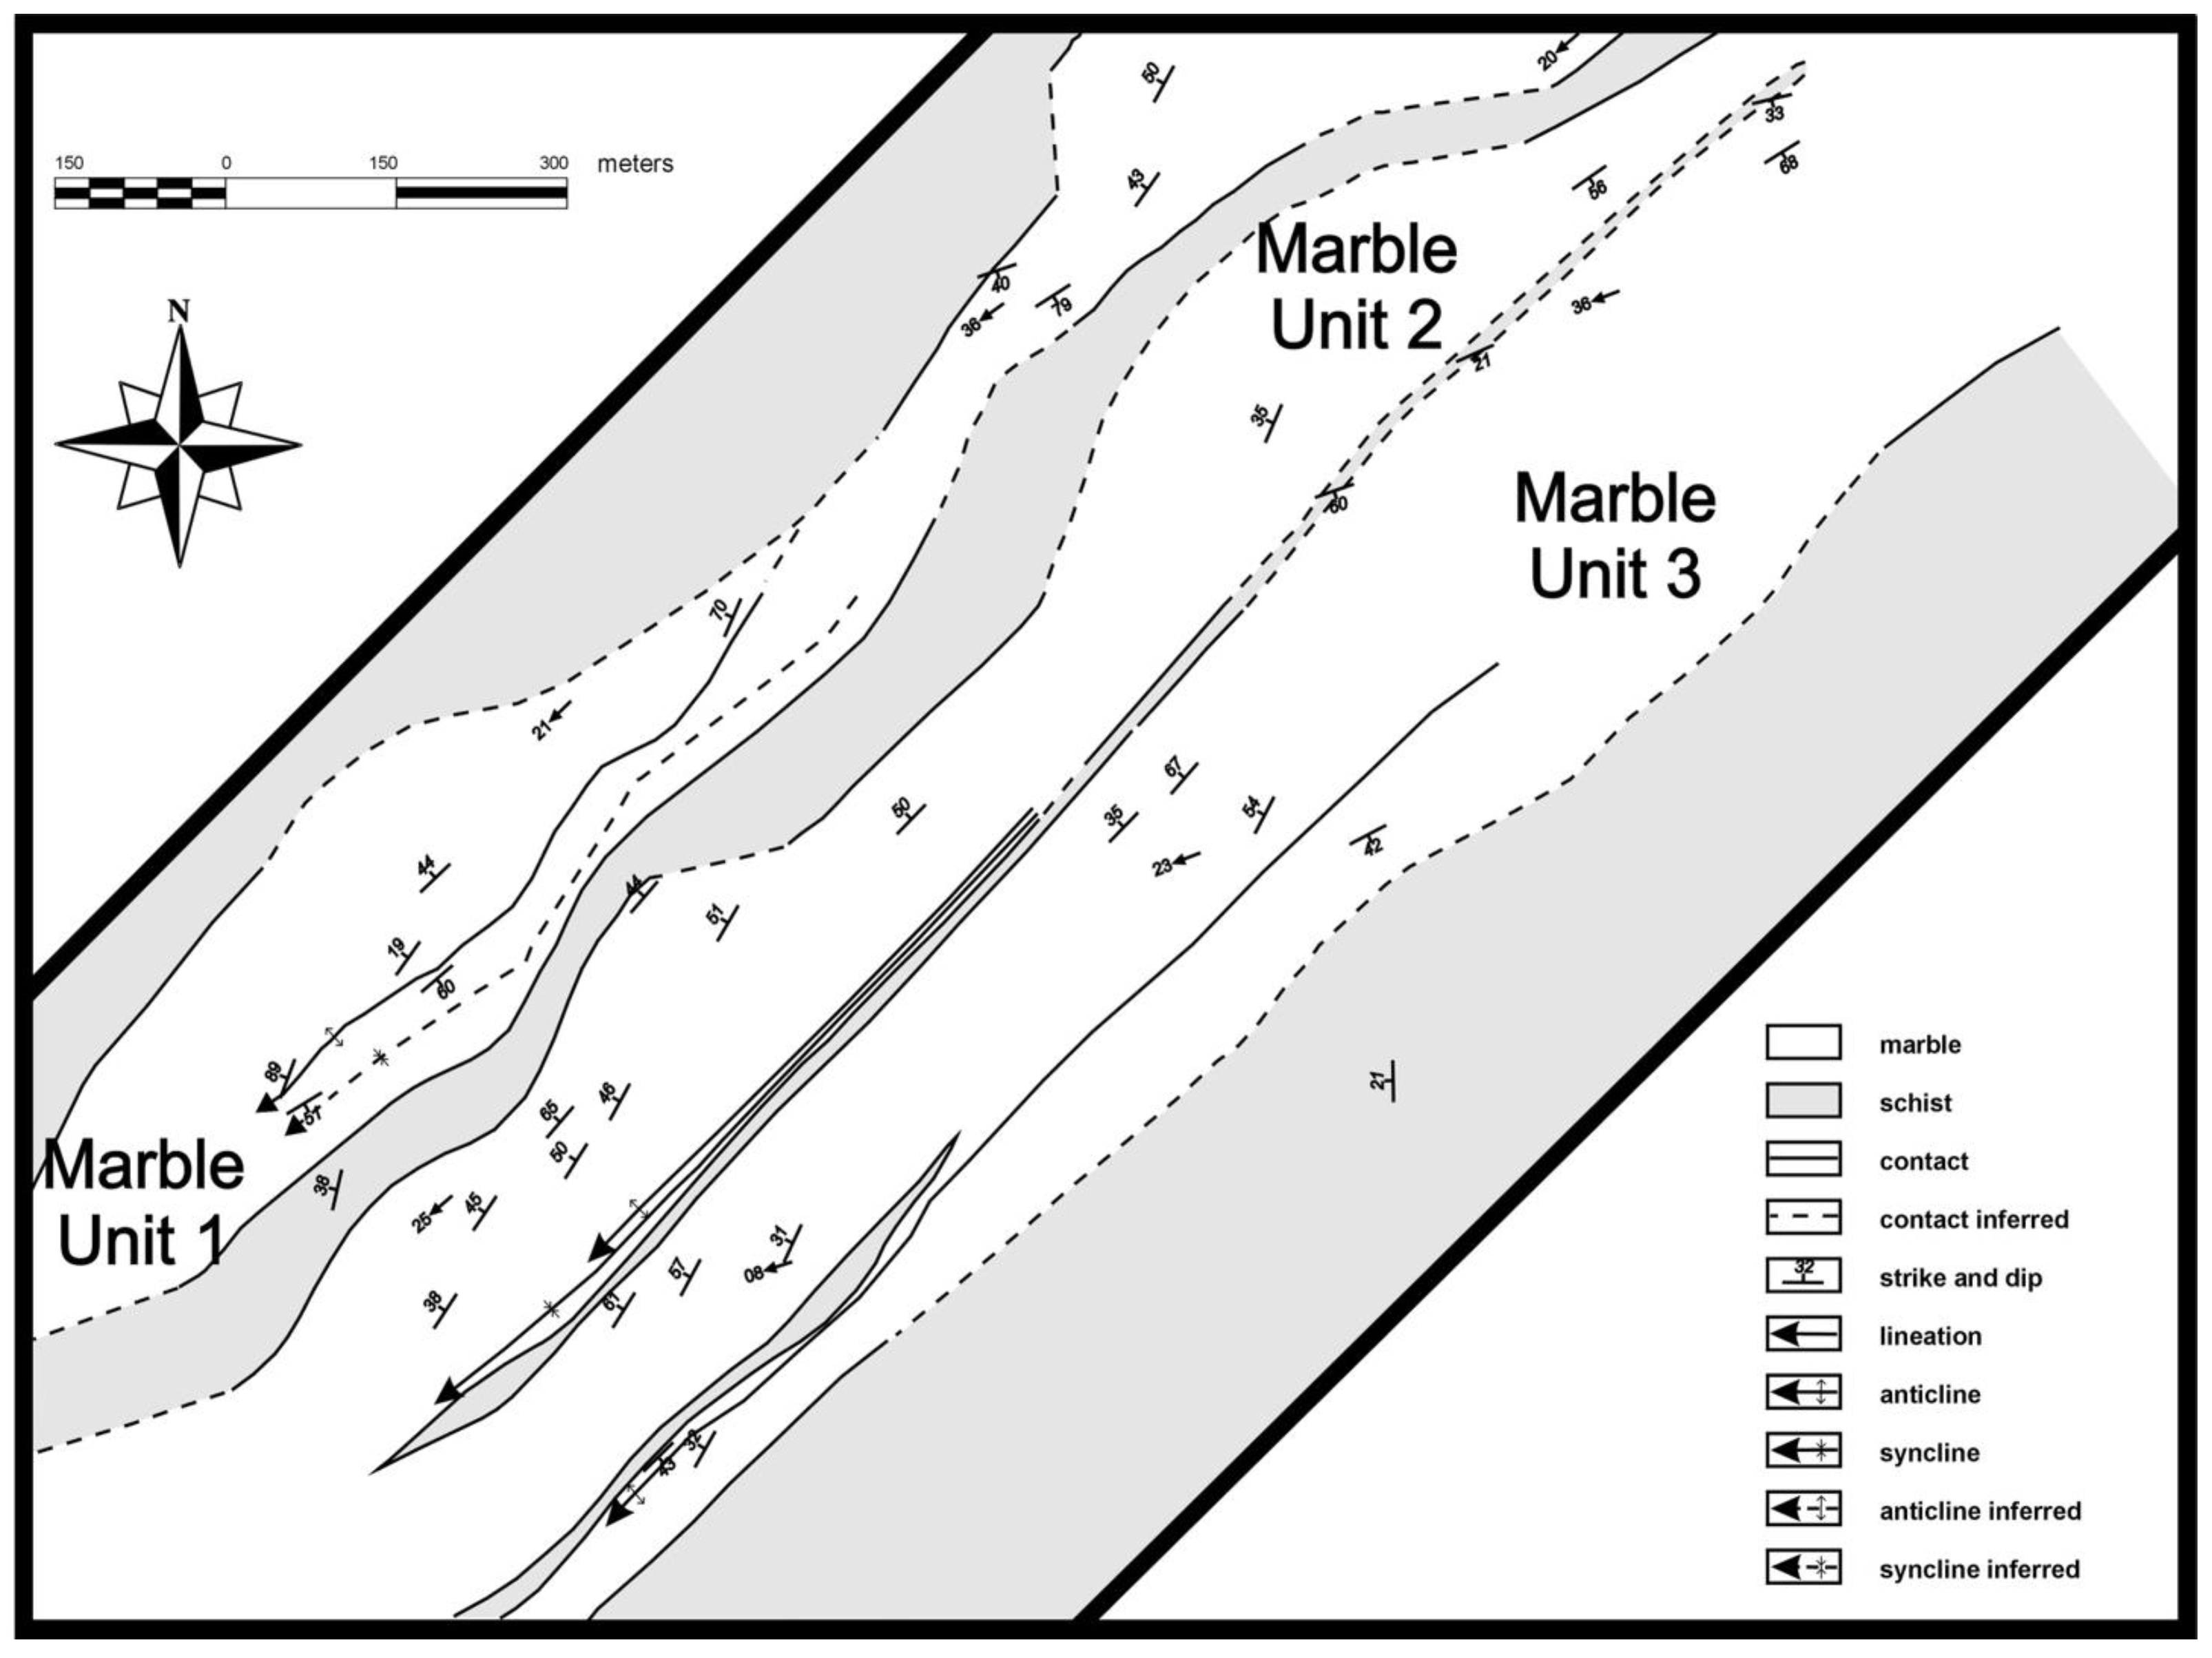
The quarries are predominantly located on the eastern limb of the plunging anticlinorium (Figure 4). A prominent ridge, trending northeast–southwest through the quarry area on the southern slopes of Mount Pentelikon, aligns with the axis of a major anticlinal fold. This central fold is flanked by parallel axes of minor anticlines and synclines, creating a complex structural framework. The surviving ancient quarries, along with most modern quarry pits, are situated along the limbs of this central ridge, reflecting both the geological accessibility and marble quality in these zones. These structural features not only influenced ancient quarrying strategies but also provide critical context for understanding spatial patterns in the isotopic variation of Pentelic marble.
Figure 2. LiDAR-generated digital terrain model of the ancient quarry region on the south slope of Mount Pentelikon outlining the surviving boundaries of quarry pits [33]. Those highlighted in red are ancient quarries as indicated by surviving traces of ancient activity. Blue boundaries are modern quarries, and the orange quarries to the north were identified after the initial survey and have not been sampled for this study.
Minerals 15 00231 g002
Figure 3. Tool marks and unfinished worked blocks abandoned in quarries that were used to identify antiquity of the quarry operations. (A) Garland-type tool marks associated with the long-handle pick (Quarry Π54); (B) horizontal tool marks associated with the Archaic and early Classical short-handled pick (Quarry Π44); and (C) unfinished column capital from the floor of Quarry Π23 [34].
Minerals 15 00231 g003
Figure 4. A geologic map showing the lateral distribution of marble and schist interbeds in the upper portion of the Lower Marble formation. The younger units are towards the NW. Note the geologic distinction between marble groups 1, 2 and 3.
Minerals 15 00231 g004
The geologic map (Figure 4) displays three NE–SW trending marble units exposed at the surface, representing the uppermost section of the Lower Marble, with progressively younger rocks observed toward the west. Markoulis et al. [35] caution that these units, while appearing distinct, may actually represent a single geological formation. Recumbent folding and preferential weathering processes likely caused the surface exposures to appear as separate units. Nevertheless, for the purposes of this localized study, the three units are treated individually and are labeled as Marble Unit 1, Marble Unit 2, and Marble Unit 3 on the geologic map. The majority of ancient quarries are concentrated within Marble Unit 3, with a smaller number located in Marble Unit 2. No evidence of ancient quarrying activity has been observed in Marble Unit 1; although, modern quarry pits are prominent at lower elevations within this unit. With the aid of the quarry location (Figure 2) and geologic (Figure 4) maps, a sample reference collection of 610 samples was collected. For a detailed description of the field survey and acquisition of the Pentelic marble reference collection refer to Pike [26].
Reference samples were collected from 83 of the 172 identified quarries, including all quarries with evidence of ancient activity. To avoid contamination, all samples were taken directly from exposed quarry walls, ensuring accurate representation of their specific locations. No material was collected from loose debris on quarry floors or from rubble piles. Each sample’s location and elevation were recorded and are marked on a detailed quarry map. Where possible, multiple samples were taken from each individual quarry pit to assess potential lateral or vertical variations in texture, geochemistry, and isotopic composition. Some quarries were excluded from the sampling due to inaccessibility or the absence of fresh marble surfaces. Standard geological tools, such as steel chisels, hammers, and picks, were used for sampling, with great care taken to avoid damaging or altering any surviving ancient worked surfaces.
Stable isotope analysis was conducted at the Stable Isotope Laboratory, Department of Geology, University of Georgia, using a Finnigan MAT-delta E gas-source mass spectrometer. Ten–twenty mg aliquots of white marble powder were reacted with anhydrous phosphoric acid in a vacuumed reaction tube at 50 °C, following the protocol outlined by Swart, Burns, and Leder [36]. The resultant CO2 gas was then purified in a glass extraction line and analyzed with the mass spectrometer. The obtained isotope ratios 13C/12C and 18O/16O were then compared to the PDB standard of the University of Chicago (Belemnitella americana, PeeDee formation, Cretaceous, South Carolina) and transformed to the standard delta notation by using the following equations [37]:
C 13 = C 13 C 12 sample C 13 C 12 standard C 13 C 12 standard × 1000
O 18 = O 18 O 16 sample O 18 O 16 standard O 18 O 16 standard × 1000
During the analyses, the mass spectrometer was programmed to measure the mass of the sample gas eight times. The multiple readings allow for the assessment of the homogeneity of the CO2 gas and provide an important check on the precision of the analysis.
Two methods were employed to prepare sample aliquots prior to isotopic analysis. The first method utilized a variable-speed dental drill fitted with a carbide drill bit. To minimize the potential for isotopic fractionation caused by high frictional temperatures interacting with ambient room moisture [38], the drill operated at the lowest possible speed. Additionally, the outer 2 mm of each sample was removed and discarded to avoid contamination from weathered or isotopically altered marble surfaces. Drilling is preferred for marble stable isotope analysis as it mirrors the conditions under which archaeological samples are typically collected and allows for highly precise sampling of specific artifact surfaces while minimizing damage. However, drilling is not suitable for all physio-chemical characterization techniques. For instance, electron spin resonance (ESR) analysis produces a prominent “drilling peak”, attributed to electrons partially filling defects generated during drilling, regardless of speed [39].
The second method involved crushing samples using an agate mortar and pestle. Small fragments were first separated from the hand samples with a two-pound crack hammer, ensuring that only unweathered portions from the core of the samples were used. The agate mortar and pestle were designated exclusively for carbonate materials to prevent contamination from other substances. This method provided an alternative approach to prepare samples while maintaining the integrity and purity of the material for analysis. All samples, whether crushed or drilled, were reacted with anhydrous phosphoric acid in a vacuumed reaction tube at 50 °C, following established protocols [36]. The resultant CO2 gas was then purified in a glass extraction line and analyzed by a Finnigan Delta mass spectrometer.
Of the 610 samples in the reference collection, stable isotope analyses were conducted on 384 samples. The remaining samples were excluded from analysis due to evidence of diagenetic alteration. Signs of alteration included chloritic mica veins permeating the samples and deep pink or orange discoloration plumes. Such features suggest potential isotopic fractionation between metamorphic fluids and calcite grains at the calcite–hydrous mineral interface [40]. Including these altered samples in the Pentelic marble database could compromise its integrity and accuracy. To ensure analytical precision, several samples were reanalyzed in separate runs. In all cases, the resulting values were consistent, falling within a single standard deviation, thus confirming the reliability of the analytical procedures.

3. Results

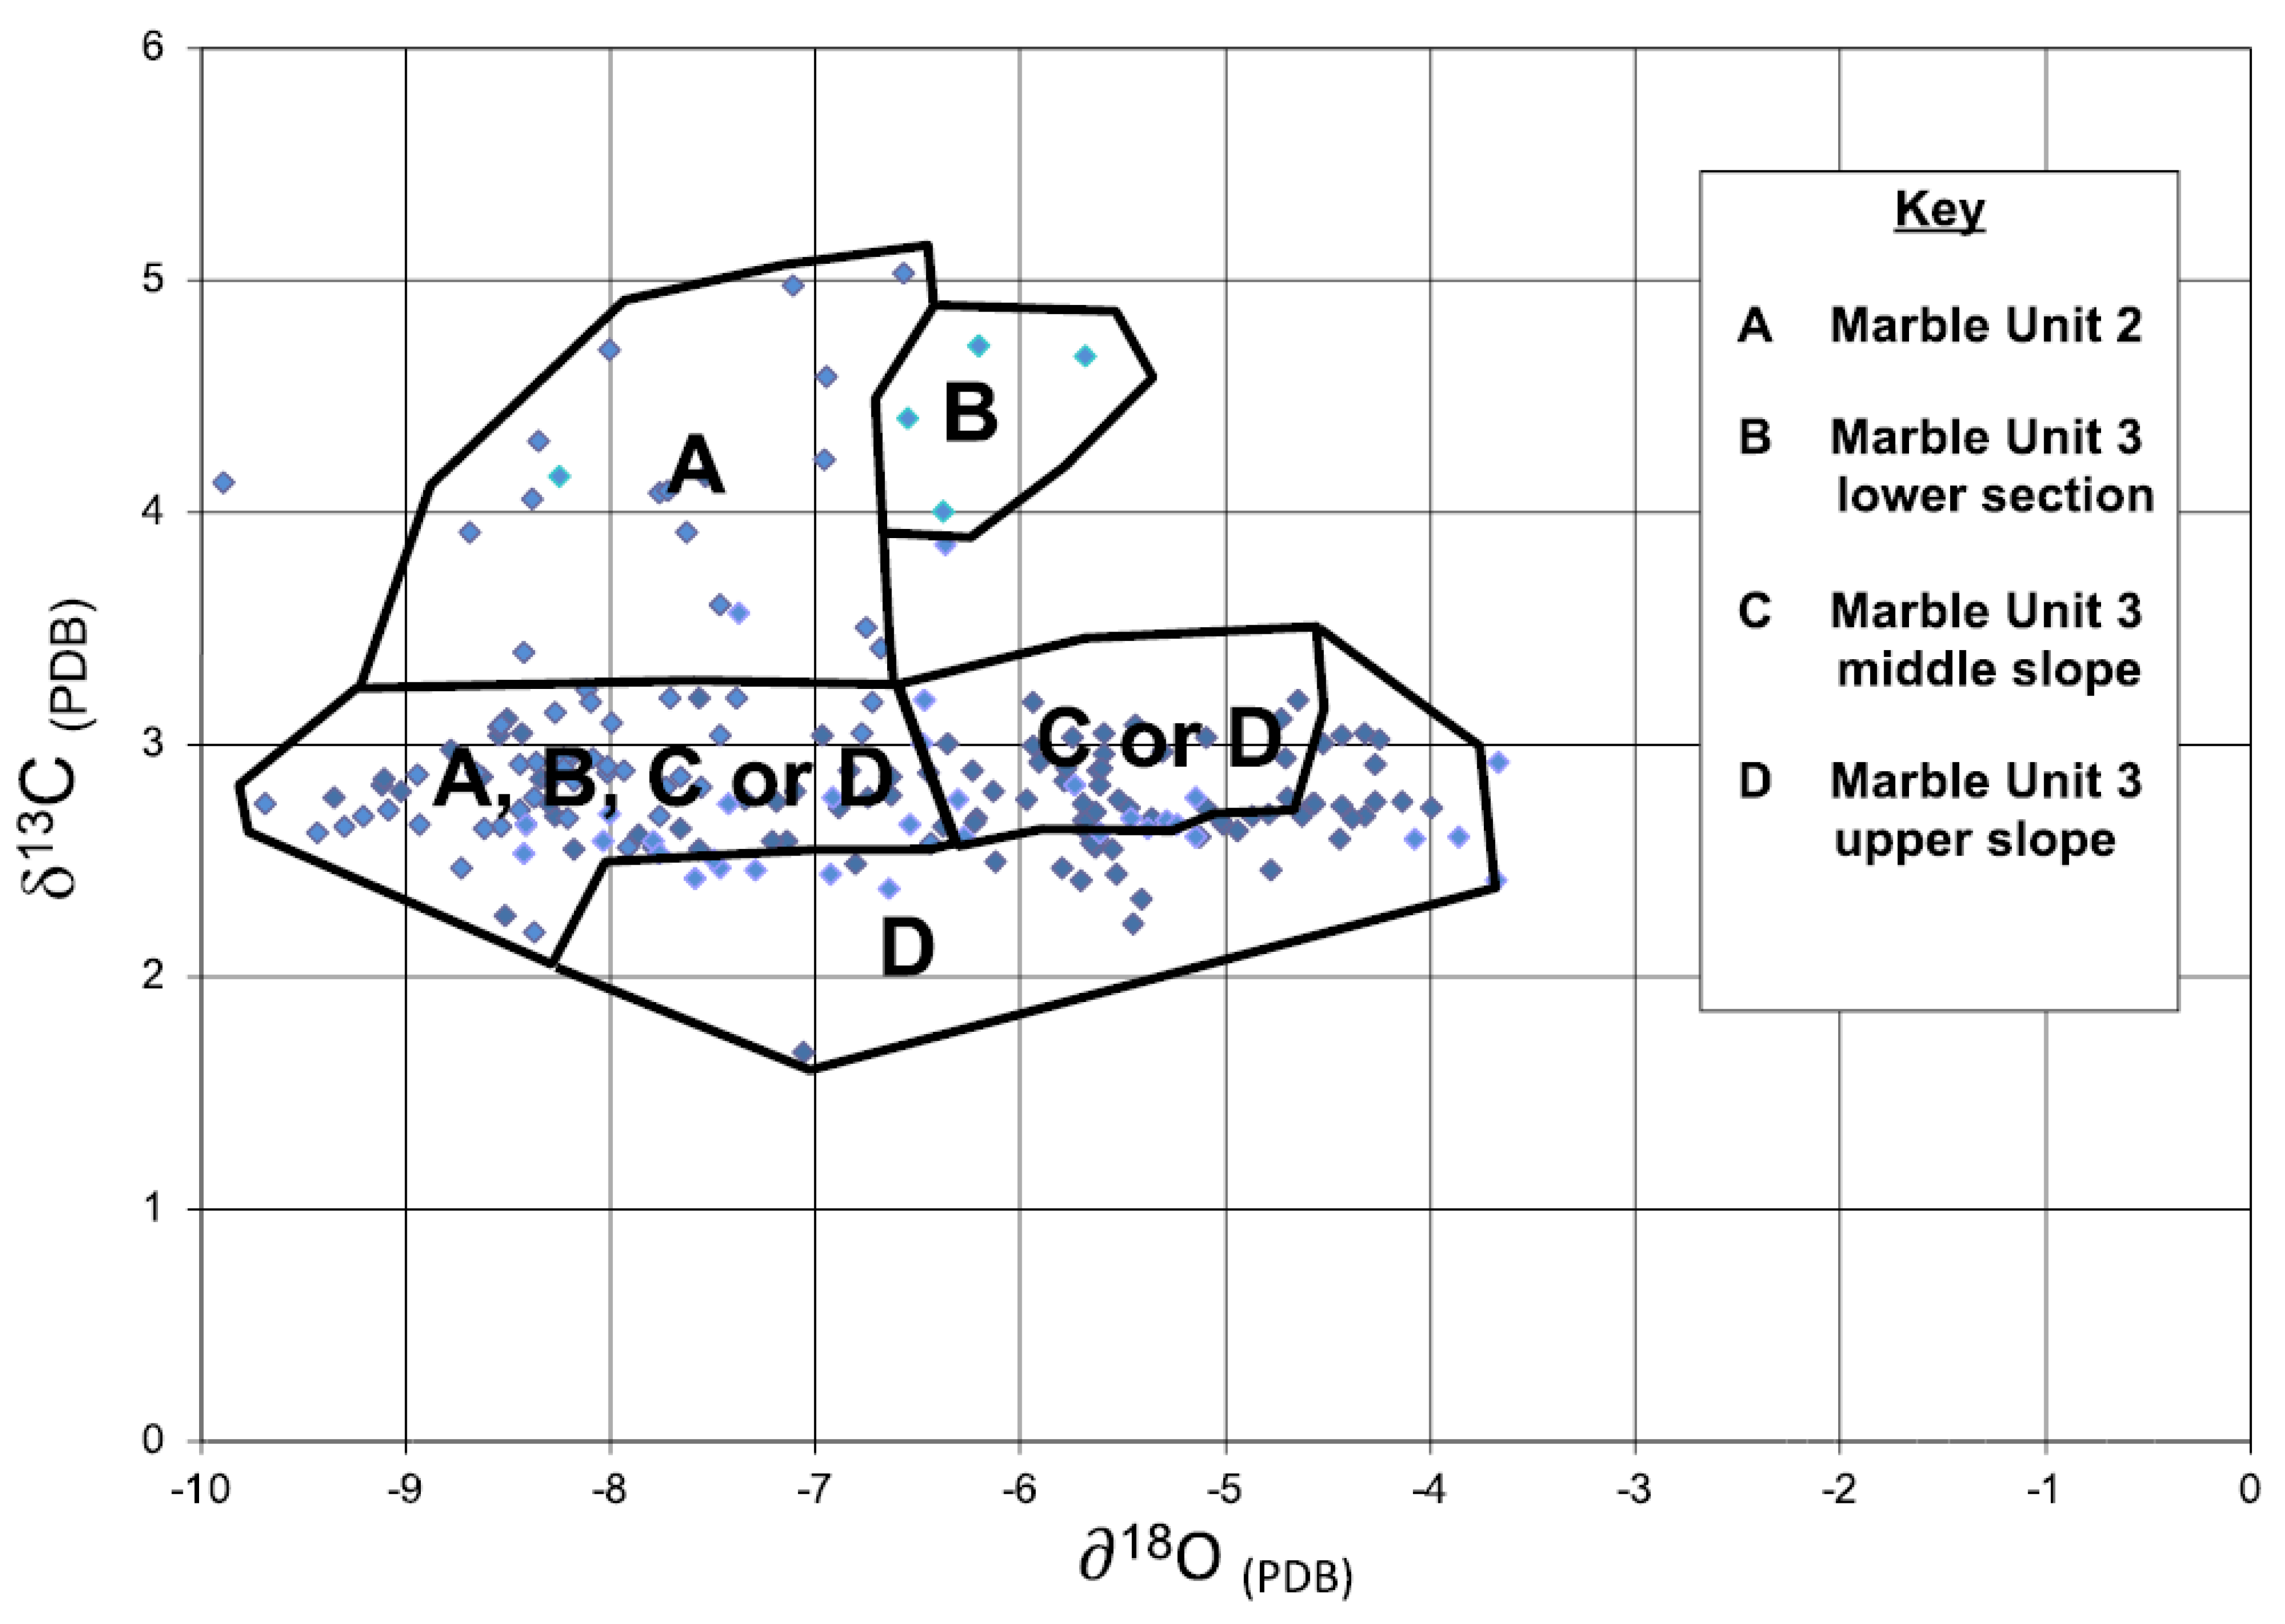
Table A1 in the Appendix A presents the results of the stable isotope analyses, with averaged data from multiple runs marked by asterisks. These results are displayed graphically in the scatter-plot diagram in Figure 1. As illustrated, the sample distribution spans the entire 90% probability ellipsoid defined by Matthews et al. [21], while also extending the δ13C range further into positive values. A notable pattern emerges when the data are grouped according to their respective Marble Units (Figure 5). The scatter-plot reveals that quarries within Marble Units 1 and 2 exhibit higher δ13C values compared to those in Marble Unit 3. This observation is statistically supported by an independent sample t-test, which confirms—with over 95% confidence—that the mean δ13C value of the combined Marble Units 1 and 2 differs significantly from that of Marble Unit 3 (Figure 6).
While there is some overlap in δ13C values (2‰–3.5‰) among the three units, the elevated δ13C values of Marble Units 1 and 2 distinctly separate from the narrower range seen in Marble Unit 3. Since Marble Unit 1 lacks archaeological quarries, any archaeological Pentelic sample with a high δ13C value must have originated from Marble Unit 2. Furthermore, only Marble Unit 3 samples exhibit relatively high δ18O values (>−5.5‰) combined with relatively low δ13C values (<3.5‰), distinguishing this unit from the others.
The scatter-plot diagrams in Figure 7, Figure 8 and Figure 9 display the sample distributions of all the quarries identified as ancient during the initial field survey, as well as Quarry Π69. Quarry Π69 is included in this subgroup because of its very large size, its location in the apparent center of ancient quarrying activities, and because it most likely is an ancient quarry with no physical evidence preserved.
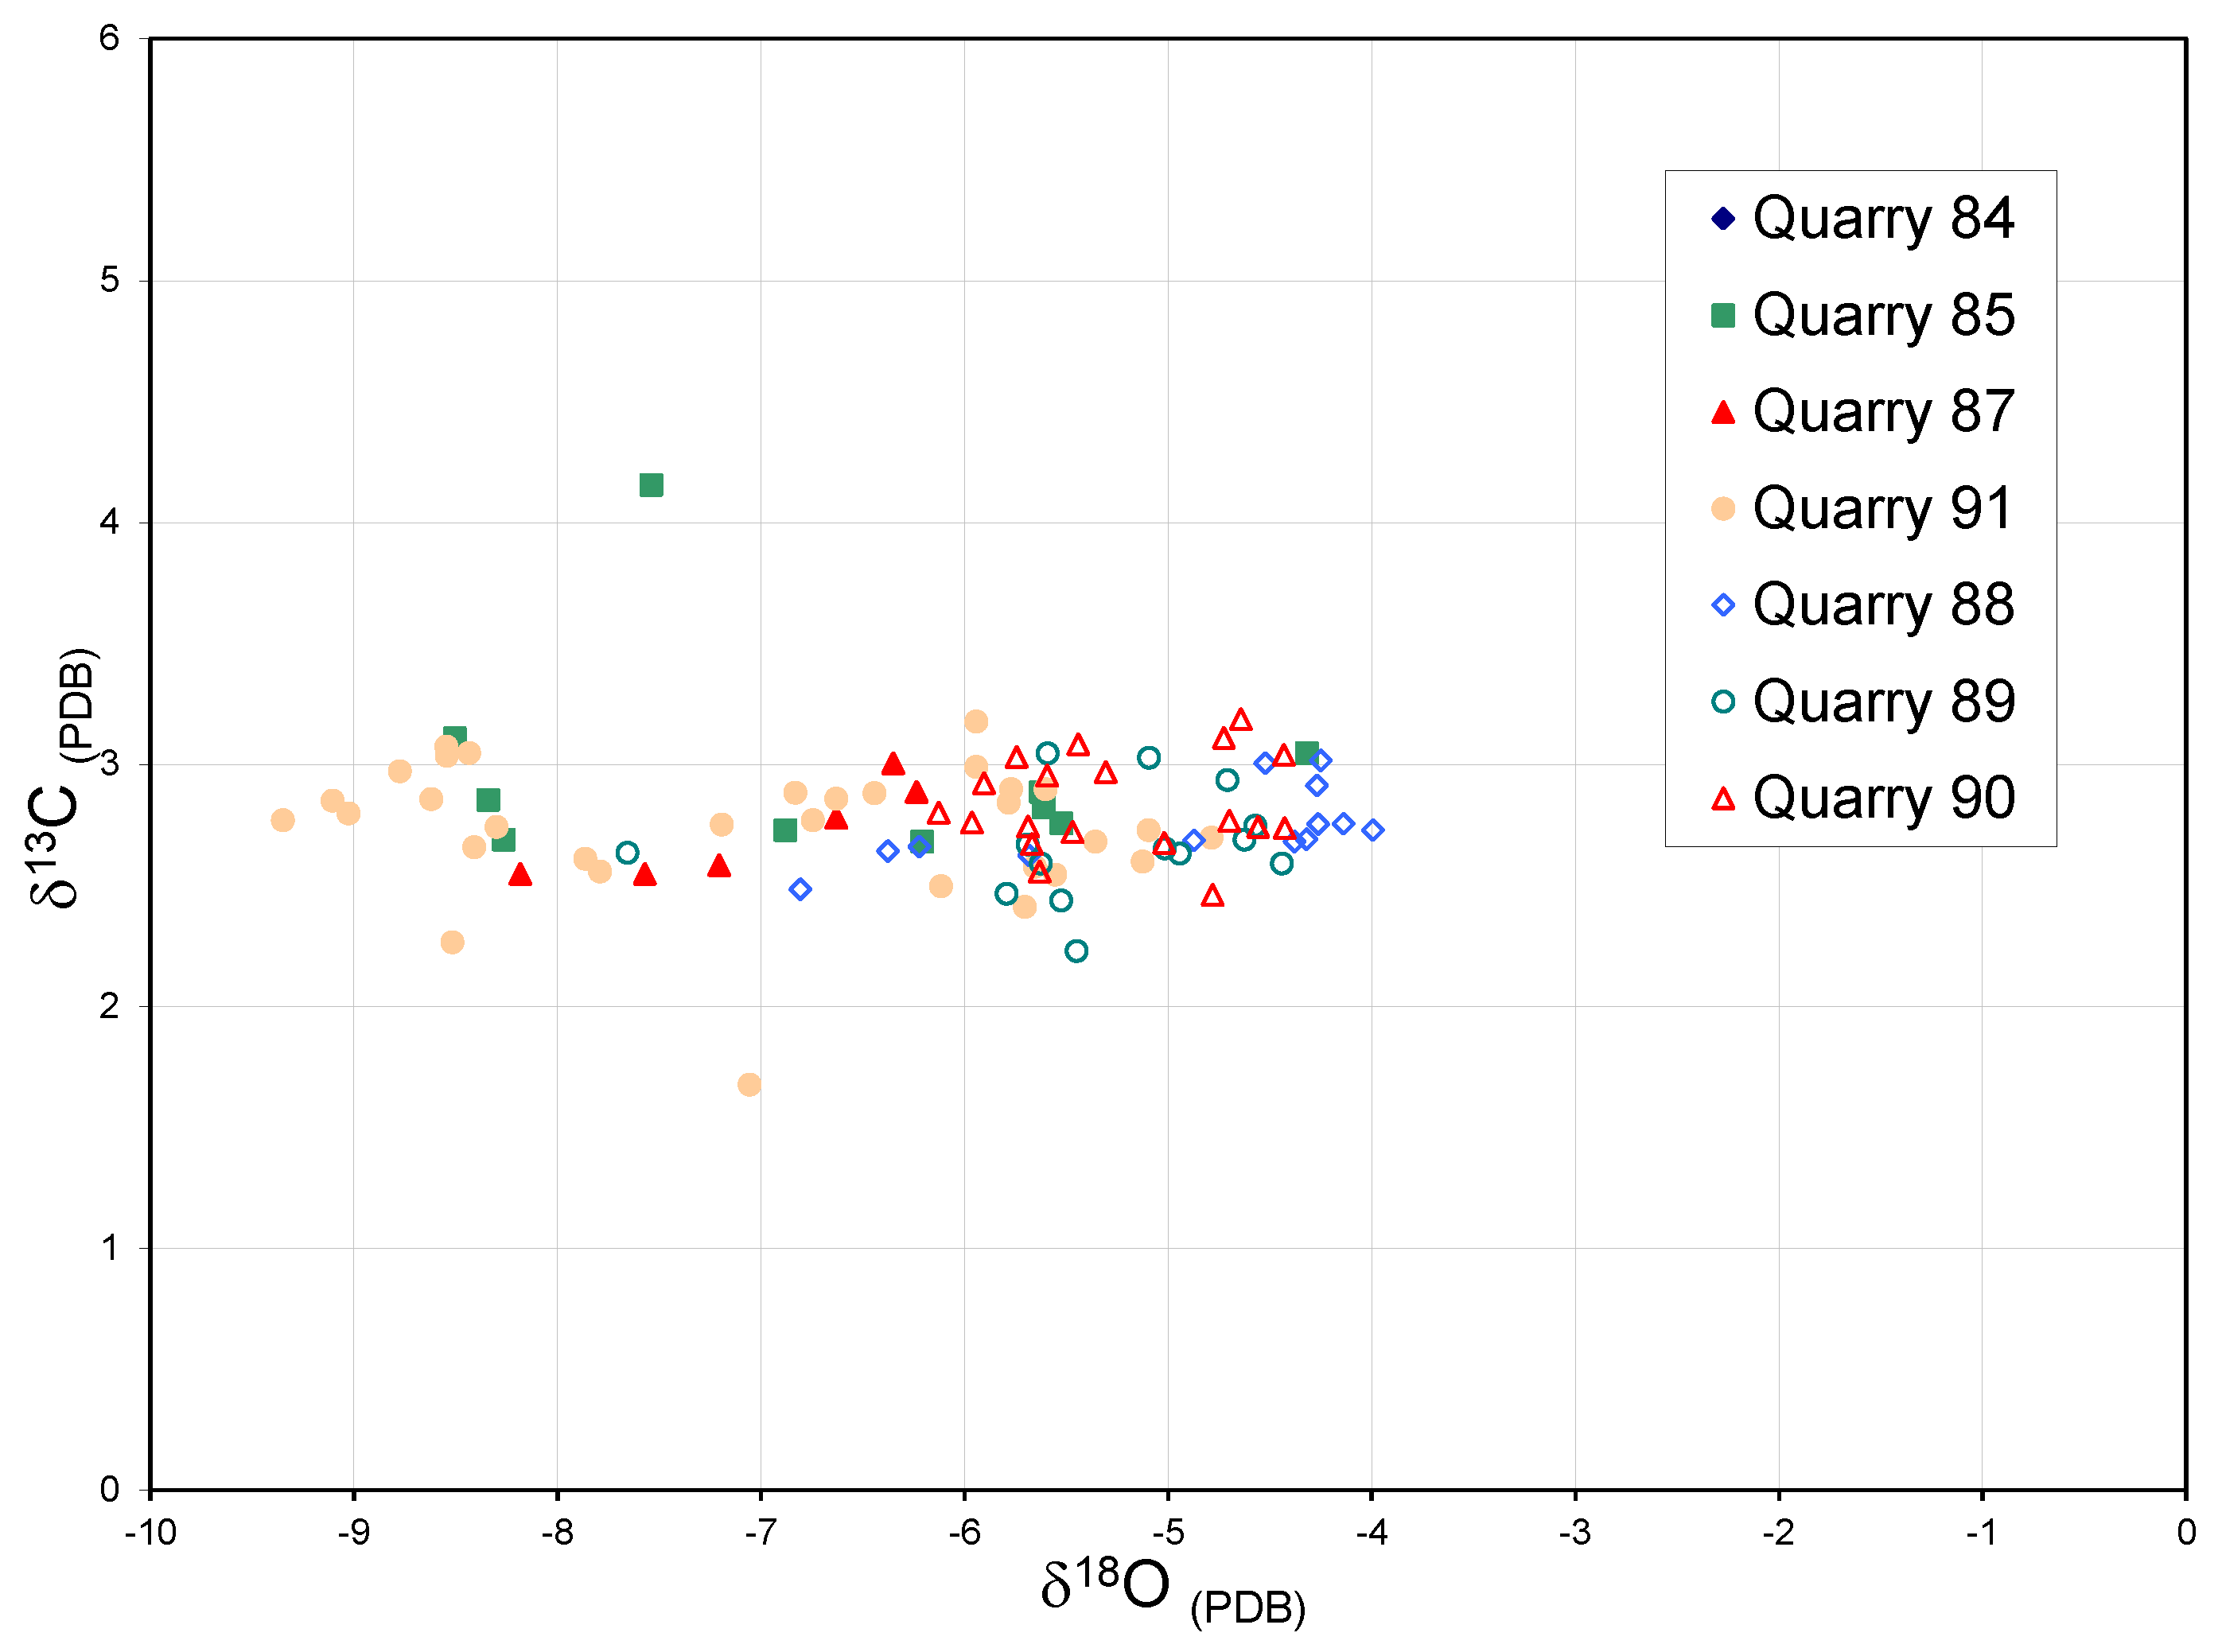
The scatter-plot diagram in Figure 7 represents all the upslope quarries within Marble Unit 3. Quarries Π88, Π89, and Π90, located in the northern upslope section known as Aspra Marmara [41], exhibit the highest δ18O values in the database and are denoted by open symbols. The Aspra Marmara marbles are qualitatively among the highest quality, whitest, and least impure marbles within the entire quarry field. Furthermore, the elevated δ18O values distinguish these quarries from all others in the region. Quarry Π85 has one sample with a high δ18O value (−4.3‰), but this is a statistical outlier, as it falls outside the 95% confidence interval for that quarry. Some samples from Quarry Π88 and one from Quarry Π89 trend toward the lower δ18O values more typical of other Pentelic quarries. Notably, the lower δ18O values from Quarry Π88 originate from its southern end, where the marble quality is poorer and exhibits significant weathering, alteration, and discoloration.
The δ18O signatures of the other Marble Unit 3 upslope quarries—Π84, Π85, Π87, and Π91—do not display the same high values or patterns as Quarries Π88, Π89, and Π90. Represented by solid symbols in Figure 7, these quarries exhibit δ18O values ranging from −9.4‰ to −5.5‰, with Quarry Π85 containing a single statistical outlier (−4.3‰). The maximum δ18O value for this group is still higher than most other reference samples in the database. Quarry Π91, an extensive quarry, shares a δ18O range similar to the grouping of Quarries Π84, Π85, and Π87.
The δ13C values for Quarries Π84, Π85, and Π87 show less variance, ranging from 2.7‰ to 3.2‰, with one outlier measuring 4.2‰. For Quarry Π91, δ13C values range from 2.4‰ to 3.2‰, with one anomalous sample at 1.7‰, which falls well outside the 95% confidence interval for the quarry. No distinguishable physical features were identified in the quarry space to account for either of the δ13C outliers.
The scatter-plot diagram in Figure 8 represents the remaining ancient quarries in Marble Unit 3. The closed symbols indicate the quarries in the mid-slope region, the crossed symbols represent the three ancient quarries on the lower slope of the quarry field, and the open symbols reflect Quarry Π55, the renowned Spilia Divali quarry. Quarry Π55 is isolated, as it has been identified by M. Korres as having been the quarry to supply essentially all the marble for the construction of the Parthenon [34]. Comparing the isotope profiles of the large, mid-slope quarries reveals that they share a similar profile with one another. The δ13C ratios representing Quarry Π70 fill a narrow range between 2.7‰ and 3.1‰ and are roughly 0.2‰ below the average δ13C value for Quarry Π69. The δ18O values range between –8.7‰ and –4.1‰. Further downslope ancient quarries, Π64 and Π67, have a very similar distribution of δ13C and δ18O ratios.
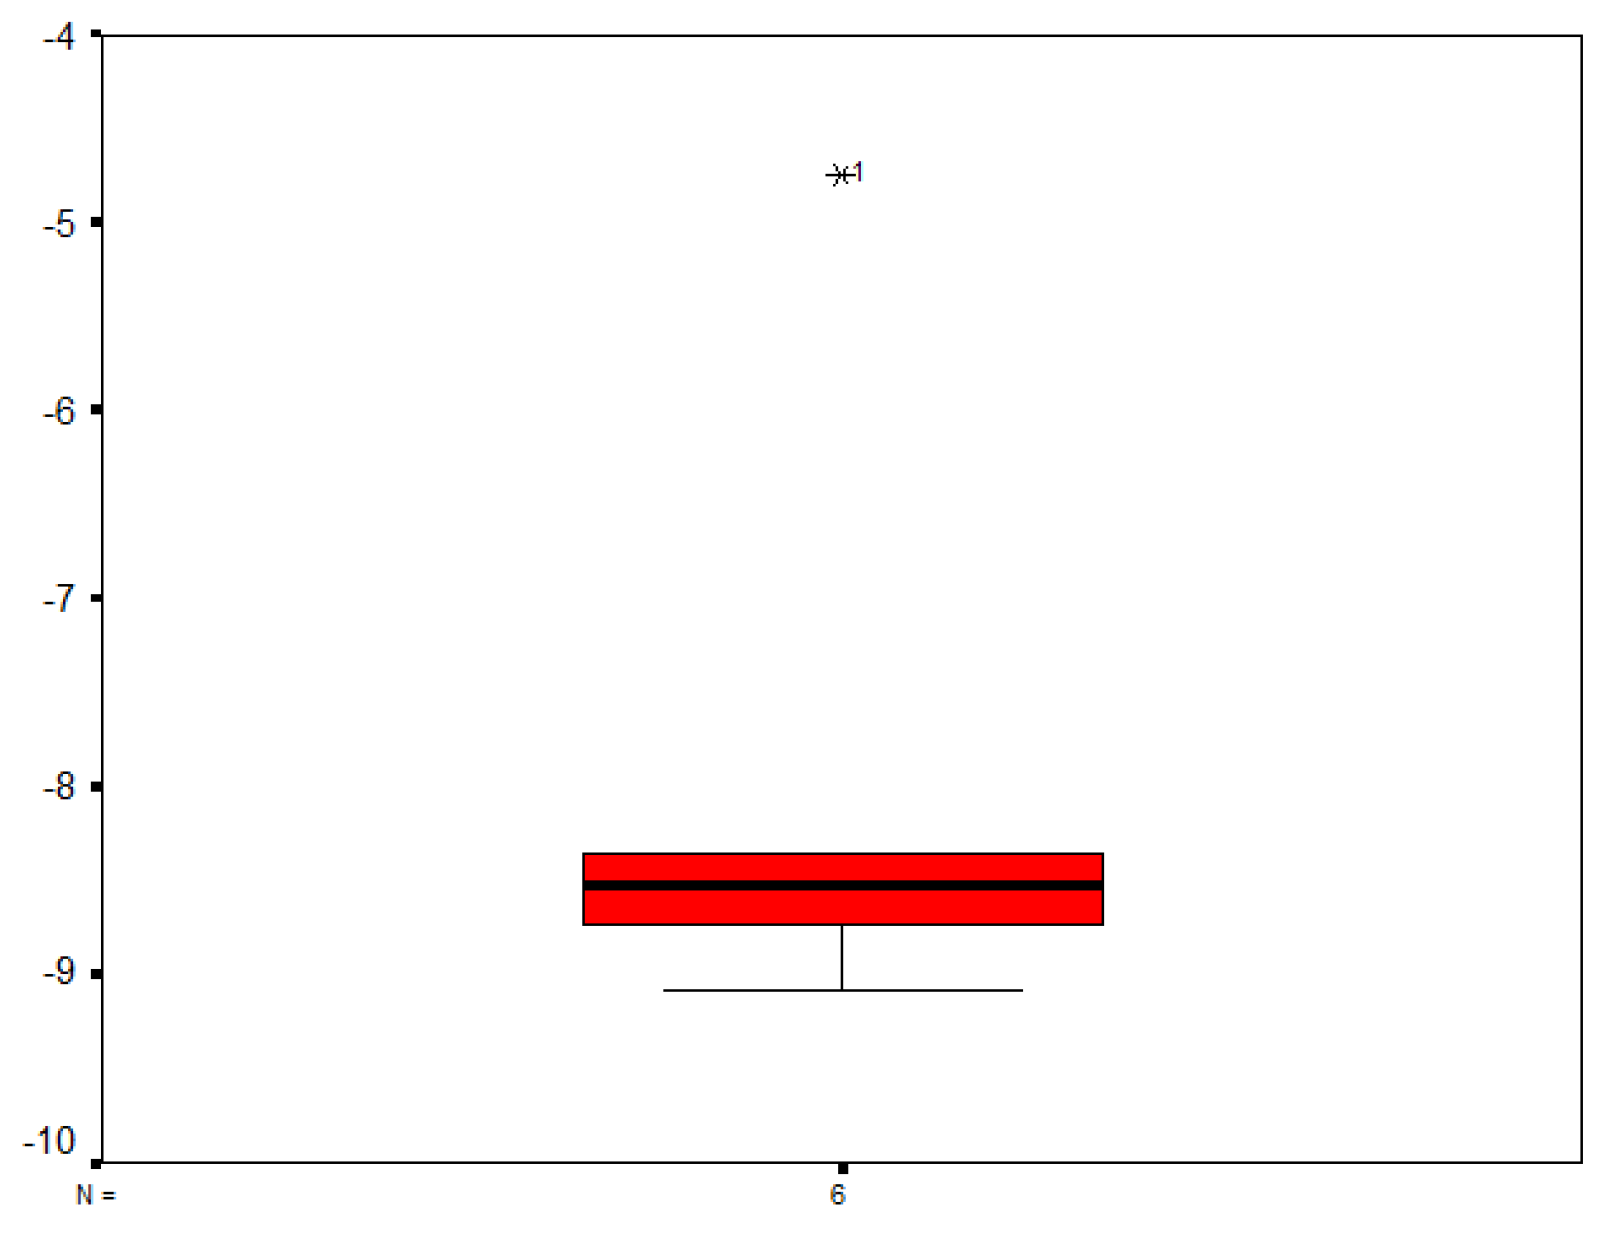
Quarry Π55 (Figure 8, open symbols) exhibits a narrow range of five measurements with one anomalous sample showing a relatively higher δ18O value. The box plot in Figure 6 highlights the extent to which this value deviates as an outlier. The main cluster of samples lies within a δ13C range of 2.7‰ to 3.1‰ and a δ18O range of −9.1‰ to −8.4‰. Two independent analyses of the outlier produced an averaged stable isotope signature of 2.9‰ for δ13C and −4.8‰ for δ18O. Upon reconciling sample locations with the isotope data, it is evident that the outlier originated from the quarry’s northeast wall. This section, lacking evidence of ancient extraction, was likely exposed in the modern area, possibly to supply marble for the construction of the royal palace in Athens in 1846 [42]. The remaining grouped samples were collected from the quarry’s west wall, which is marked extensively by ancient tool grooves.
Further examination of Figure 8 reveals that the small ancient Quarries Π39, Π48, and Π49, located on the lower flanks of Mount Pentelikon’s southern slope and within Marble Unit 3, exhibit more negative δ18O values combined with δ13C values near 3.0‰. In contrast, Quarries Π35 and Π38—the lowest sampled ancient quarries in the study area—deviate from this trend. These quarries display higher δ13C values, ranging between 4.4‰ and 4.7‰, and δ18O values between −6.6‰ and −5.7‰, distinguishing them from the broader Marble Unit 3 dataset.
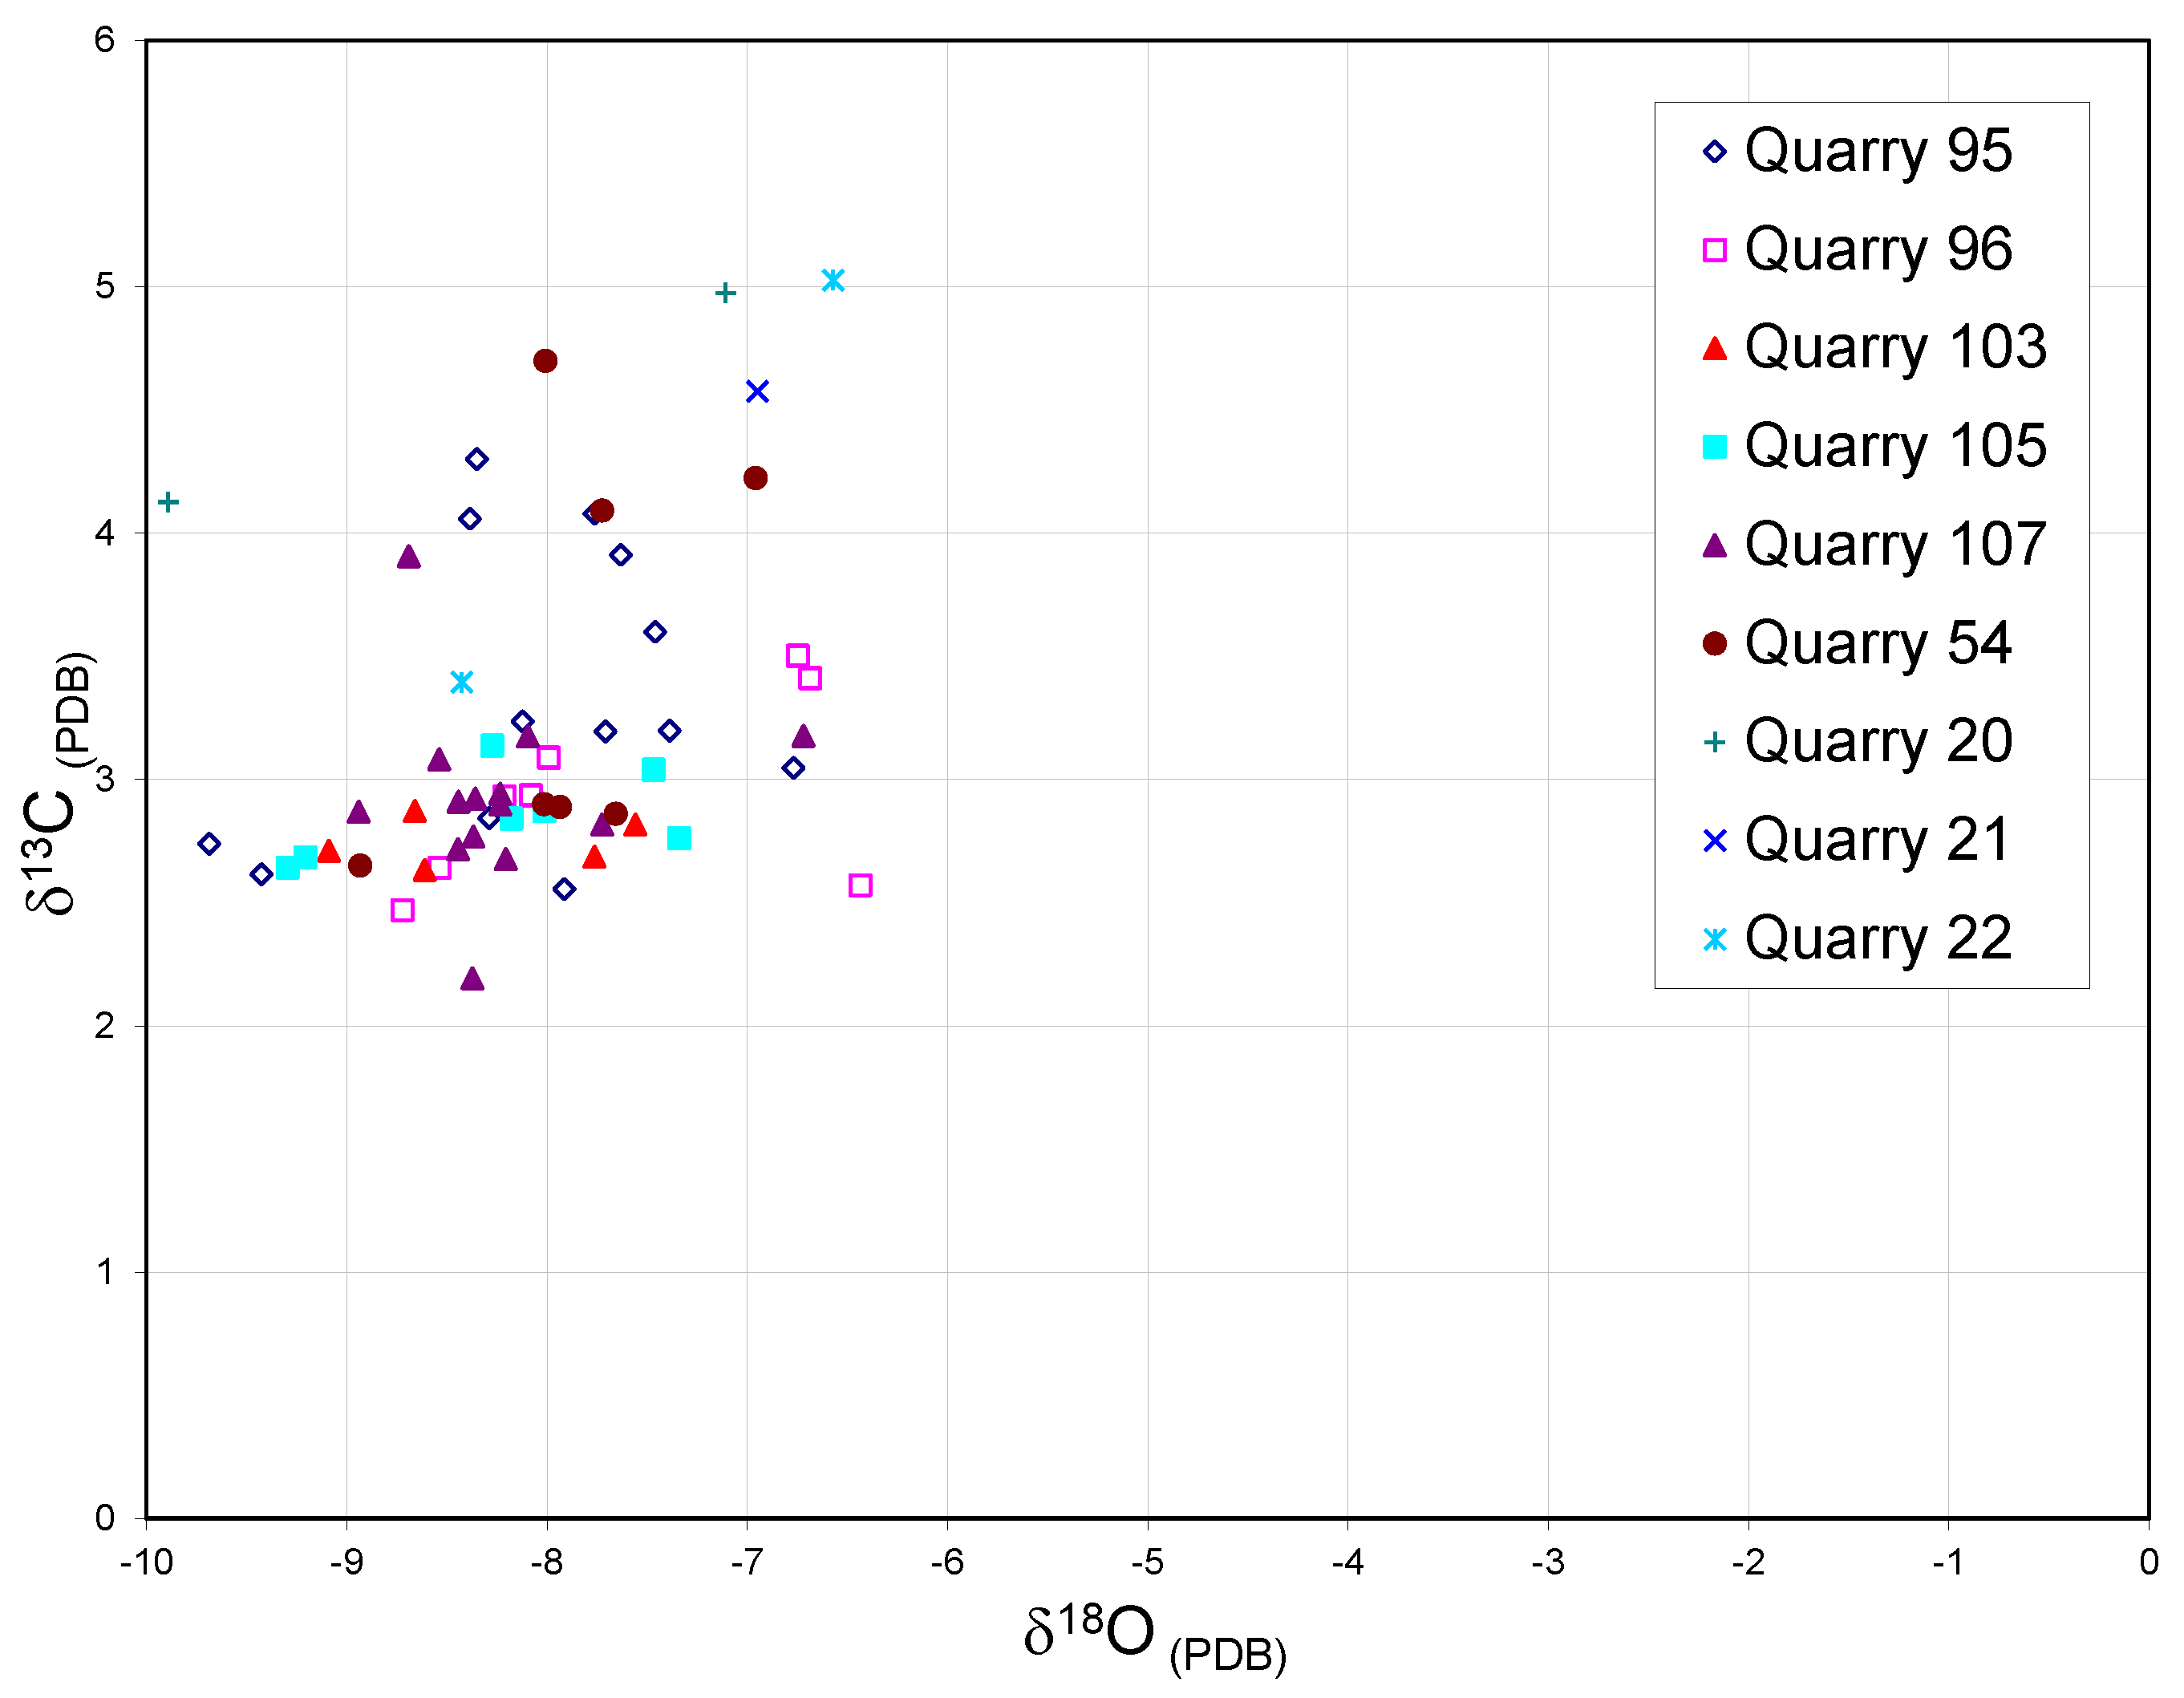
Figure 9 presents the δ13C–δ18O scatter-plot diagram for all the ancient quarries in Marble Unit 2. Quarries Π95 and Π96, located at the top of Mount Pentelikon’s southern slope and represented by open symbols, display a significantly higher δ13C range compared to the upslope quarries of Marble Unit 3 (Figure 5). Additionally, these two quarries exhibit lower maximum δ18O values of −6.8‰ and −6.4‰, respectively, when compared to neighboring Marble Unit 3 quarries. To the west and north of Quarry Π70, across the thick mica schist layer that separates Marble Unit 2 from Marble Unit 3, lie Quarries Π103 and Π105. These quarries show a narrow δ13C range and a relatively small δ18O range, with values at the lower end of the Pentelic marble spectrum: δ13C ranges from 2.6‰ to 3.1‰, and δ18O ranges from −9.9‰ to −7.3‰. Further downslope, along the schist interlayer, Quarry Π107 shows a similar δ18O range (−8.9‰ to −7.7‰) but a wider δ13C range (2.2‰ to 3.9‰). The highest value (3.9‰) falls outside the 95% confidence interval for this quarry.
The seven samples from Quarry Π54 exhibit consistently low δ18O values (−8.9‰ to −7.0‰) but show two distinct δ13C groups. One group has δ13C values below 3.0‰, while the other has values above 4.0‰. A reconciliation of sample locations with isotopic data reveals that the lower δ13C values correspond to samples from the quarry’s eastern wall, adjacent to the schist interlayer. In contrast, the higher δ13C values were collected from the western wall, indicating a significant δ13C increase of over 1.0‰ across the narrow 15–20 m width of the quarry. A similar pattern is observed in Quarry Π107, where the sample Π107-1, collected from the west wall furthest from the schist interlayer, displays the highest δ13C value (3.9‰).
The stable isotope data from the smaller ancient quarries on the lower slopes of Marble Unit 2, represented by crossed symbols in Figure 9, provide further insight. Quarry Π20 shows a wide δ18O variation of nearly 2‰, yet both Quarries Π20 and Π21 maintain isotopic signatures characterized by relatively low δ18O and high δ13C values. The single sample from Quarry Π23 has a δ13C value comparable to those of the lower Marble Unit 3 quarries. The close proximity of these three quarries, combined with their wide isotopic range, suggests that the upper portion of Marble Unit 2 may not exhibit the same degree of isotopic distinctiveness as Marble Unit 3.

4. Discussion

There is ongoing debate regarding the specific quarries that supplied marble for the construction of the Parthenon. M. Korres, the former architect of the Parthenon reconstruction project, proposed that the marble used in the Parthenon was sourced from the renowned Spilia quarry, Quarry Π55. Korres suggests that the ancient Greeks systematically began quarrying on the lower slopes of Mount Pentelikon and progressively moved upslope as the lower quarries were exhausted [43]. In addition, Quarry Π55 is the lowest surviving large ancient quarry, notable for its widely spaced joints, which facilitated the extraction of large, dimensionally uniform marble blocks. Given that the Parthenon was the first monumental construction project to use Pentelic marble, Korres argues that it would have been logical to source its material from this lowest and most accessible quarry. This hypothesis contrasts with the findings of Matthews et al. [21], who propose that the marble used for the Parthenon, or at least parts of the sculptural program, was sourced from the upper quarries in Aspra Marmara.
To address this debate and to test the applicability of the Pentelic stable isotope database, stable isotope values from samples from the architectural blocks and sculptural members of the Parthenon were compared to those in the database presented here. Matthews et al. published the ∂13C and ∂18O values of seven south metope, seventeen frieze, and six west pediment samples from the Parthenon Marbles currently housed at the British Museum [21]. In addition to the published data, this report presents previously unpublished stable isotope data from recently collected and analyzed architectural blocks from the Parthenon, including material from the original colonnade, west wall, and northwest corner.
The scatter-plot in Figure 10 graphically shows the stable isotope values from the original Classical period colonnade, the west wall, and northwest architectural blocks in squares, each represented by orange, blue, and purple, respectively. The green triangles show the frieze values published by Matthews et al., as well as west pediment samples being reported here for the first time. Comparing the stable isotope ratios of the sculptural monuments to those of the database reveals that the high δ18O values obtained for the Parthenon sculptures correlate with the high values obtained for Quarries Π88, Π89 and Π90 (Figure 10), the Aspra Marmara quarries. The architectural blocks have more variety and span much of the Pentelic marble database, suggesting that the builders were using marble from various quarry pits. Yet, it is interesting that the northwest architectural blocks group relatively close to one another, with two outliers. Might this suggest, then, that marbles for the colonnade may have been preferentially selected from one quarry? Even more revealing is that the west pediment material groups nicely with the higher ∂18O values of the upper slope of Marble Unit 3. The Parthenon’s building accounts indicate that the temple’s superstructure was completed in time for the dedication of the cult statue Athena Parthenos in 438/437 BCE, yet the pediment sculptural program was not completed until at least 433/432 BCE [21,44]. The west pediment stable isotope data suggest, then, that the Aspra Marmara quarries were preferentially selected to supply marble for this final phase of the sculptural program, which occurred several years after the completion of the Parthenon’s superstructure. The dearth of architectural blocks from Aspra Marmara suggests that the high-quality marble from this area of Pendeli was preferentially limited to sculptural activity.
Importantly, the stable isotope data reveal that in the Greek Classical period, quarrying on Mt. Pentelikon did not take place systematically from the lower quarries to the upper quarries. Rather, as the isotope record of the Parthenon demonstrates, builders exploited at least two, if not more, regions in the greater Pentelic quarry area. Marble from Aspra Marmara, being purer and whiter, appears to have been favored for sculptural components of the monument, whereas other Pentelic quarries supplied marble for the superstructure. The Spilia Divali quarry, having relatively long distances between natural joints, appears to have been one of the quarries selected to supply the larger elements of the structure, such as column drums and lintels.

5. Conclusions

Prior to this extensive study of the Pentelic quarry region, the heterogeneous nature of the Pentelic stable isotope field was perceived to be a limiting factor on the resolution of the Pentelic quarry database. The wide ranges for δ13C and δ18O were seen as problematic, since the large signature field increased the likelihood that the Pentelic quarry field would overlap signature fields of other quarry districts. Overlapping signature fields make provenance assignments more difficult for those artifacts that fall within the overlap. However, this research has illustrated that the wide range of isotope values at Mt. Pentelikon can be an asset rather than a hindrance.
With detailed surveying and systematic and extensive sampling, the presented database improves the discriminatory ability of stable isotopic analysis for marble provenance studies. Rather than treating the entire Pentelic quarry region as a homogenous whole, the presented database distinguishes between three mappable and exploited marble units. By correlating individual samples within the Marble Units to their quarry sample spots it is possible to recognize stable isotopic sub-regions within the quarry area. In some special cases individual quarries or groups of quarries can be identified. The utility of the database is illustrated by determining the probable quarry or group of quarries from which the Parthenon sculptures were extracted. The extensive field survey and sampling of the quarry region provided the information necessary to investigate and identify intra-quarry isotopic variation. Future characterization projects of other ancient quarry districts should undertake similar extensive sampling protocols.

Funding

This research was funded in part by the Fulbright Foundation, The Kress Foundation, The University of Georgia, the Wiener Laboratory of the American School at Athens, and The Malcolm Wiener Foundation.

Data Availability Statement

The original contributions presented in this study are included in the article. Further inquiries can be directed to the corresponding author.

Acknowledgments

The author wishes to acknowledge and thank the Committee for the Conservation of the Acropolis Monuments for permitting me to collect samples of the Parthenon. In particular, I would like to thank Lena Lambrinou and Olga Palagia for their assistance in sample procurement. I also with to thank Manolis Korres who gave me a guided tour of my first visit to Mt. Penteliko and Yannis Maniatis, the former director of the Archaeometry Laboratory at Demokritos, for his support and assistance throughout the fieldwork component of this project. Lastly, I wish to thank the anonymous reviewers who provided excellent feedback and suggestions that greatly improved the manuscript.

Conflicts of Interest

The author declares no conflicts of interest. The funders had no role in the design of the study; in the collection, analyses, or interpretation of data; in the writing of the manuscript; or in the decision to publish the results.

Appendix A

Table A1. Stable isotope data of δ13C and δ18O for all analyzed samples from the Pentelic marble sample reference collection.
QuarrySample IDδ13Cδ18O
44-14.2−7.2
44-23.8−6.5
1111-14.0−7.8
1212-14.3−7.1
1212-22.7−8.2
1212-33.8−9.1
1313-13.9−7.6
1313-23.6−8.6
1414-14.1−7.6
1515-14.6−7.0
1515-24.5−7.4
1616-14.7−7.6
1616-24.8−7.1
1717-14.8−7.6
2020-15.0−7.1
2020-24.1−9.9
2121-14.6−6.9
2222-15.0−6.6
2222-33.4−8.4
2323-12.8−8.4
2525-13.3−8.2
2525-23.2−8.2
2626-12.7−8.3
2727-14.0−7.4
2727-24.3−6.7
2727-33.3−7.6
2727-43.2−7.2
3535-14.7−6.2
3636-14.2−8.3
3636-24.0−6.4
3838-14.7−5.7
3838-24.4−6.5
3939-12.9−8.5
4040-12.8−7.8
4343-12.6−8.0
4646-12.7−8.8
4646-22.7−8.6
4646-33.0−7.3
4646-52.8−5.4
4646-62.7−5.8
4646-72.8−6.8
4848-12.6−8.2
4848-23.1−8.5
4949-13.5−7.2
5353-22.5−7.1
5454-12.9−7.7
5454-22.9−8.0
5454-32.9−7.9
5454-44.1−7.7
5454-54.2−7.0
5454-62.7−8.9
5454-74.7−8.0
5555-12.9−8.4
5555-23.0−8.4
5555-33.1−9.1
5555-42.8−8.7
5555-52.7−8.7
5555-62.9−4.7
5656-23.0−7.0
5656-33.2−7.2
5656-43.1−7.1
6464-12.8−7.8
6464-12.8−7.8
6464-23.0−8.1
6464-23.0−8.1
6464-33.0−7.9
6464-33.0−7.9
6464-42.7−6.0
6767-12.8−6.9
6767-22.7−5.5
6767-32.8−4.8
6767-43.0−5.3
6767-53.3−5.5
6767-53.4−5.6
6767-62.9−6.2
6767-73.0−8.0
6767-82.8−9.0
6767-92.8−9.1
6767-103.0−7.9
6767-113.0−8.3
6767-122.8−7.8
6969-13.1−5.6
6969-23.3−4.9
6969-33.1−5.1
6969-42.8−5.3
6969-53.1−5.3
6969-63.4−4.7
6969-73.0−6.8
6969-83.0−8.7
6969-102.9−7.0
6969-112.7−6.4
6969-122.9−7.1
6969-133.2−5.9
6969-143.1−7.2
7070-12.7−5.2
7070-23.0−8.3
7070-32.7−8.3
7070-42.7−6.7
7070-52.7−7.4
7070-62.9−4.1
7171-12.5−7.1
7272-12.5−7.5
7979-12.7−7.5
7979-22.8−7.5
8181-12.7−9.1
8181-22.9−8.8
8282-12.8−8.4
8282-23.6−8.2
8383-12.2−9.7
8383-23.3−8.6
8383-32.5−8.9
8383-42.7−9.0
8484-12.6−7.1
8484-22.8−9.1
8484-33.0−7.0
8484-42.8−7.1
8484-53.2−7.6
8585-12.9−8.3
8585-22.9−5.6
8585-32.7−6.9
8585-42.8−5.6
8585-52.7−6.2
8585-62.8−5.5
8585-73.1−8.5
8585-83.0−4.3
8585-92.7−8.3
8585-104.2−7.5
8787-12.9−6.2
8787-22.8−6.6
8787-32.5−8.2
8787-42.6−7.2
8787-52.5−7.6
8787-63.0−6.4
8888-12.7−4.3
8888-22.7−4.9
8888-32.7−4.0
8888-42.8−4.1
8888-53.0−4.5
8888-63.0−4.3
8888-72.8−4.3
8888-82.9−4.3
8888-92.7−4.4
8888-112.7−6.2
8888-122.6−6.4
8888-142.5−6.8
8888-152.6−5.9
8989-12.6−7.7
8989-22.7−5.7
8989-32.6−5.6
8989-42.5−5.8
8989-52.4−5.5
8989-62.7−4.6
8989-72.9−4.7
8989-83.0−5.6
8989-92.2−5.5
8989-102.7−5.0
8989-113.0−5.1
8989-122.7−4.6
8989-132.6−4.4
8989-142.6−4.9
9090-13.0−5.7
9090-23.1−5.4
9090-33.2−4.6
9090-42.7−4.4
9090-53.0−5.3
9090-62.8−6.1
9090-72.9−5.9
9090-83.0−4.4
9090-93.1−4.7
9090-102.5−4.8
9090-112.7−4.6
9090-122.6−5.6
9090-132.7−5.7
9090-142.7−5.7
9090-152.8−4.7
9090-163.0−5.6
9090-172.7−5.0
9090-182.8−6.0
9090-192.7−5.5
9191-12.7−5.4
9191-102.8−5.8
9191-113.0−8.8
9191-122.8−9.0
9191-132.7−8.3
9191-142.8−9.4
9191-152.8−7.2
9191-163.0−8.4
9191-11a1.7−7.1
9191-13a3.0−8.5
9191-15a2.9−6.8
9191-173.1−8.5
9191-182.9−8.6
9191-192.7−8.4
9191-22.5−5.6
9191-202.6−7.8
9191-222.3−8.5
9191-232.9−6.4
9191-242.9−6.6
9191-252.9−9.1
9191-262.6−7.9
9191-272.7−4.8
9191-282.7−5.1
9191-293.0−5.9
9191-32.5−6.1
9191-303.2−5.9
9191-42.4−5.7
9191-52.9−5.8
9191-62.8−6.7
9191-72.6−5.7
9191-82.6−5.1
9191-92.9−5.6
9292-22.3−5.4
9292-32.7−5.6
9393-12.8−8.4
9393-103.4−7.0
9393-113.1−8.7
9393-122.7−6.4
9393-132.7−8.4
9393-32.7−7.5
9393-43.3−6.8
9393-52.8−8.1
9393-63.0−8.0
9393-72.8−7.6
9393-83.0−8.2
9595-13.2−7.7
9595-102.8−8.3
9595-112.6−9.4
9595-122.4−11.0
9595-132.7−9.7
9595-142.6−7.9
9595-23.2−8.1
9595-34.3−8.3
9595-43.0−6.8
9595-53.9−7.6
9595-64.1−8.4
9595-73.2−7.4
9595-84.1−7.8
9595-93.6−7.5
9696-12.5−8.7
9696-23.1−8.0
9696-32.9−8.1
9696-43.5−6.7
9696-53.4−6.7
9696-62.6−6.4
9696-72.9−8.2
9696-82.6−8.5
9797-103.5−7.6
9797-113.4−7.7
9797-124.3−6.5
9797-134.3−7.9
9797-23.5−8.1
9797-33.7−7.6
9797-44.1−7.6
9797-53.4−7.9
9797-63.4−7.7
9797-73.9−8.2
9797-84.0−7.2
9797-93.3−7.2
9898-12.7−6.9
9898-22.5−7.3
9898-32.6−7.5
9898-42.7−8.7
9898-52.5−7.8
9898-62.3−9.4
103103-12.9−8.7
103103-22.8−7.6
103103-32.7−7.8
103103-42.7−9.1
103103-52.6−8.6
104104-24.5−8.1
104104-33.7−6.4
104104-43.8−6.8
105105-12.9−8.0
105105-22.8−7.3
105105-32.8−8.2
105105-43.1−8.3
105105-52.7−9.2
105105-62.6−9.3
105105-73.0−7.5
106106-122.9−9.9
106106-144.0−7.9
107107-13.9−8.7
107107-102.8−8.4
107107-113.1−8.5
107107-122.7−8.2
107107-132.9−8.9
107107-142.7−8.4
107107-23.2−6.7
107107-32.9−8.4
107107-42.9−8.2
107107-53.2−8.1
107107-62.9−8.2
107107-72.9−8.4
107107-82.8−7.7
107107-92.2−8.4
109109-14.3−8.1
109109-23.6−6.9
109109-33.4−6.7
109109-43.5−6.7
109109-54.4−6.7
109109-63.5−6.5
109109-74.2−6.5
122122-13.1−7.9
122122-22.9−8.0
124124-12.8−7.3
125125-13.3−6.6
125125-22.7−7.2
127127-13.1−7.5
129129-14.6−8.3
129129-24.4−7.8
130130-12.9−9.2
130130-22.8−6.1
130130-33.2−8.1
130130-43.1−9.2
130130-52.6−11.7
130130-64.0−9.0
130130-63.3−8.4
131131-12.8−7.2
131131-24.0−7.1
131131-33.7−7.1
132132-12.7−7.9
132132-104.3−5.8
132132-22.9−7.7
132132-43.2−7.7
132132-54.1−6.9
132132-64.0−6.7
132132-83.7−6.2
132132-93.5−6.0
133133-13.6−6.2
133133-22.8−6.8
134134-12.9−5.9
134134-22.9−6.5
135135-13.8−5.8
135135-23.1−8.8
135135-33.6−6.4
135135-42.7−6.0
136136-14.3−5.0
136136-104.1−6.4
136136-114.5−5.5
136136-133.6−6.6
136136-143.5−6.6
136136-154.2−5.7
136136-163.4−6.0
136136-183.4−5.6
136136-23.4−5.1
136136-34.2−5.8
136136-43.5−6.3
136136-54.1−5.5
136136-63.9−7.5
136136-83.4−6.3
136136-94.2−5.7
137137-14.2−11.4
137137-24.0−8.1
142142-13.7−9.6
142142-43.9−9.6
154154-13.2−6.5
154154-23.6−7.1
155155-23.0−8.3
156156-13.1−6.2
156156-23.2−7.0
157157-13.4−6.8
158158-22.9−7.7
158158-33.4−7.4
158158-42.9−6.0
159159-14.6−8.3
162162-13.4−6.7
162162-23.4−8.0
164164-13.4−9.3
164164-22.8−5.4
164164-32.6−6.4
164164-42.7−6.1
164164-62.8−8.9
164164-72.7−5.8
165165-12.6−5.0
168168-13.3−7.8
169169-14.5−7.7
169169-24.7−7.3
169169-34.4−5.7
169169-44.4−7.2
169169-54.9−7.0
169169-65.1−6.5
171171-14.1−7.3
171171-23.9−8.4
172172-13.5−8.0

References

  1. Herz, N. Isotopic analysis of marble. In Archaeological Geology; Rapp, G., Gifford, J.A., Eds.; Yale University Press: New Haven, CT, USA, 1985; pp. 331–351. [Google Scholar]
  2. Herz, N. The oxygen and carbon isotopic database for classical marble. In Classical Marble: Geochemistry, Technology and Trade; Herz, N., Waelkens, M., Eds.; NATO ASI Series E: Dordrecht, Belgium, 1988; pp. 305–314. [Google Scholar]
  3. Van der Merwe, N.J.; Tykot, R.H.; Herrmann, J.J., Jr.; Newman, R. Isotopic source determination of Greek and Roman marble sculptures in the Museum of Fine Arts, Boston: Recent analyses. In Archéomatériaux: Marbres et Autres Roches; Schvoerer, M., Ed.; Presses Universitaires de Bordeaux: Bordeaux, France, 1995; pp. 177–184. [Google Scholar]
  4. Prochaska, W. The use of geochemical methods to pinpoint the origin of ancient white marbles. Mineral. Petrol. 2023, 117, 401–409. [Google Scholar] [CrossRef] [PubMed]
  5. Herz, N. Carbon and oxygen isotopic ratios: Classical Greek and Roman marble. Archaeometry 1987, 29, 35–43. [Google Scholar] [CrossRef]
  6. Attanasio, D.; Bruno, M.; Prochaska, W.; Yavuz, A.B. A multi- method database of the black and white marbles of Göktepe (Aphrodisias), including isotopic, EPR, trace and petrographic data. Archaeometry 2015, 57, 217–245. [Google Scholar] [CrossRef]
  7. Lazzarini, L.; Antonelli, F. Petrographic and isotopic characterization of the marble of the island of Tinos (Greece). Archaeometry 2003, 45, 541–552. [Google Scholar] [CrossRef]
  8. Brandl, M.; Martinez, M.M.; Hauzenberger, C.; Filzmoser, P.; Nymoen, P.; Mehler, N. A multi-technique analytical approach to sourcing Scandinavian flint: Provenance of ballast flint from the shipwreck “Leirvigen 1”, Norway. PLoS ONE 2018, 13, e0200647. [Google Scholar] [CrossRef] [PubMed]
  9. Marinova, I.; Ivanova, P.; Tacheva, E.; Vitov, O. Mineral composition and rock provenance of a prehistoric stone axe head from the surroundings of Nevestino village, Kyustendil District, SW Bulgaria. Archaeol. Anthropol. Sci. 2019, 11, 2929–2936. [Google Scholar] [CrossRef]
  10. Antonelli, F.; Lazzarini, L. Mediterranean trade of the most widespread Roman volcanic millstones from Italy and petrochemical markers of their raw materials. J. Archaeol. Sci. 2010, 37, 2081–2092. [Google Scholar] [CrossRef]
  11. Dilaria, S.; Bonetto, J.; Germinario, L.; Previato, C.; Girotto, C.; Mazzoli, C. The stone artifacts of the National Archaeological Museum of Adria (Rovigo, Italy): A noteworthy example of heterogeneity. Archaeol. Anthropol. Sci. 2024, 16, 14. [Google Scholar] [CrossRef]
  12. Friederike, J.; Hollerbach, R.; Schröder, A.; Wennrich, V. The signature of the stones: pXRF studies on prehistoric axes from the Eastern Sahara. J. Archaeol. Sci. Rep. 2023, 49, 104028. [Google Scholar] [CrossRef]
  13. Dilaria, S.; Ricci, G.; Secco, M.; Beltrame, C.; Costa, E.; Giovandardi, T.; Bonetto, J.; Artioli, G. Vitruvian binders in Venice: First evidence of Phlegraean pozzolans in an underwater Roman construction in the Venice Lagoon. PLoS ONE 2024, 19, e0313917. [Google Scholar] [CrossRef]
  14. Wycherley, R.E. Pentelethen. Annu. Br. Sch. Athens 1978, 68, 350. [Google Scholar] [CrossRef]
  15. Russell, B. The Economics of the Roman Stone Trade; Oxford University Press: Oxford, UK, 2013. [Google Scholar]
  16. Abraldes, A.M. Pentelethen: The Export of Pentelic Marble and Its Use in Architectural and Epigraphical Monuments. Ph.D. Thesis, University of California, Berkeley, CA, USA, 1996. [Google Scholar]
  17. Fant, C. Augustus and the city of marble. In Archéomatériaux: Marbres et Autres Roches; Schvoerer, M., Ed.; Presses Universitaires de Bordeaux: Bordeaux, France, 1995; pp. 277–280. [Google Scholar]
  18. Bianchi, F.; Bruno, M.; Pike, S. Pentelic Marble in the Severan Complex in Leptis Magna (Tripolitania, Libya). In Interdiscplinary Studies on Ancient Stone: ASMOSIA X; Pensemebe, P., Gasparini, E., Eds.; L’ERMA di Bretschneider: Rome, Italy, 2015; pp. 23–34. [Google Scholar]
  19. Antonlli, F.; Lazzarini, L. An updated petrographic and isotopic reference database for white marbles used in antiquity. Rend. Fis. Acc. Lincei 2015, 26, 399–413. [Google Scholar] [CrossRef]
  20. Attanasio, D.; Brilli, M.; Ogle, N. The Isotope Signature of Classical Marbles; L’ERMA di Bretschneider: Rome, Italy, 2006; p. 299. [Google Scholar]
  21. Matthews, K.J.; Moens, L.; Walker, S.; Waelkens, M.; de Paepe, P. The re-evaluation of stable isotope data for Pentelic marble. In Ancient Stones: Quarry, Trade and Provenance; Waelkens, M., Herz, N., Moens, L., Eds.; Leuven University Press: Leuven, Belgium, 1992; pp. 203–212. [Google Scholar]
  22. Dinsmoor, W.B. The Architecture of Ancient Greece; W.W. Norton and Company: New York, NY, USA, 1975. [Google Scholar]
  23. Craig, H.; Craig, V. Greek marbles: Determination of provenance by isotopic analysis. Science 1972, 176, 401–403. [Google Scholar] [CrossRef] [PubMed]
  24. Kane, S.; Polikreti, K.; Maniatis, Y.; Herz, N.; Carrier, S. Investigation of the Pentelic marble sculptures of the Nymphaeum of Herodes Atticus in Olympia, Greece. In Archéomatériaux: Marbres et Autres Roches; Schvoerer, M., Ed.; Presses Universitaires de Bordeaux: Bordeaux, France, 1995; pp. 317–323. [Google Scholar]
  25. Walker, S. Roman Nymphaea in the Greek World. In Roman Architecture in the Greek World; Macready, S., Thompson, F., Eds.; Society of Antiquaries: London, UK, 1987; pp. 60–70. [Google Scholar]
  26. Pike, S. Archaeological Geology and Geochemistry of Pentelic Marble, Mount Pentelikon, Attica, Greece. Ph.D. Thesis, University of Georgia, Athens, AL, USA, 2000. [Google Scholar]
  27. Kozelj, T. Extraction of blocks in antiquity: Special methods of analysis. In Classical Marble: Geochemistry, Technology and Trade; Herz, N., Waelkens, M., Eds.; NATO ASI Series; Kluwer Academic Publishers: Dordrecht, The Netherlands; Boston, MA, USA; London, UK, 1988; pp. 31–39. [Google Scholar]
  28. Waelkens, M.; de Paepe, P.; Moens, L. The quarrying techniques of the Greek world. In Marble; The J. Paul Getty Museum: Malibu, CA, USA, 1990; pp. 47–66. [Google Scholar]
  29. Markoulis, M. (IGME, Athens, Greece). Personal communication, 1995.
  30. Katsikatos, G. (IGME, Athens, Greece). Personal communication, 1994.
  31. Lepsius, G.R. Geologie von Attica; Springer: Berlin, Germany, 1893. [Google Scholar]
  32. Katsikatos, G.; Migiros, G.; Triantaphyllis, M.; Mettos, A. Geologic structure of the Internal Hellenides (E. Thessaly, S.W. Macedonia, Euboea—Attica—Northern Cyclades Islands and Lesvos). Geol. Geophys. Res. 1995, Special Issue, 191–212. [Google Scholar]
  33. Pike, S.; Drazen, C.; Kemp, A. UAV-Based Survey of Ancient White Marble Quarries on Mt. Pentelikon: Challenges and Successes of a LiDAR and Photogrammetric Survey in a High Relief Environment. J. Greek Archaeol. 2014; Submitted. [Google Scholar]
  34. Korres, M. From Pentelicon to the Parthenon: The Ancient Quarries and the Story of a Half-Worked Column Capital of the First Marble Parthenon; Publishing House “Melissa”: Athens, Greece, 1995. [Google Scholar]
  35. Markoulis, M.; Papagiannis, K.; Papadopoulos, G. Geologic Map of Mount Pentelikon; National Technical University of Athens: Athens, Greece, 1975. [Google Scholar]
  36. Swart, P.K.; Burns, S.J.; Leder, J.J. Fractionation of the stable isotopes of oxygen and carbon in carbon dioxide during the reaction of calcite with phosphoric acid as a function of temperature and technique. Chem. Geol. 1991, 86, 89–96. [Google Scholar] [CrossRef]
  37. Faure, G. Principles of Isotope Geochemistry, 2nd ed.; John Wiley & Sons: New York, NY, USA, 1986. [Google Scholar]
  38. Wenner, D.; Havert, S.; Clark, A. Variation in stable isotope compositions of marble: An assessment of causes. In Classical Marble: Geochemistry, Technology and Trade; Herz, N., Waelkens, M., Eds.; NATO ASI Series; Kluwer Academic Publishers: Dordrecht, The Netherlands; Boston, MA, USA; London, UK, 1988; pp. 325–338. [Google Scholar]
  39. Mandi, V.; Maniatis, Y.; Bassiakos, Y.; Kilikoglou, V. Provenance investigation of marbles with ESR spectroscopy: Further developments. In Ancient Stones: Quarrying, Trade and Provenance; Waelkens, M., Herz, N., Moens, L., Eds.; Leuven University Press: Leuven, Belgium, 1992; pp. 213–219. [Google Scholar]
  40. Rye, R.O.; Schuiling, R.D.; Rye, D.M.; Jansen, J.B.H. Carbon, hydrogen, and oxygen isotope studies of the regional metamorphic complex at Naxos, Greece. Geochim. Cosmochim. Acta 1976, 40, 1031–1049. [Google Scholar] [CrossRef]
  41. Lepsius, G.R. Grieschische Marmorstudien; Springer: Berlin, Germany, 1890. [Google Scholar]
  42. Dworakowska, A. Quarries in Ancient Greece; Polish Academy of Sciences, Institute of the History of Material Culture: Warsaw, Poland, 1973; p. 178. [Google Scholar]
  43. Korres, M. The geologic factor in ancient Greek architecture. In Engineering Geology of Ancient Works, Monuments and Historical Sites: Preservation and Protection; Marinos, G., Koukis, G., Eds.; A.A. Balkema: Rotterdam, The Netherlands, 1990; pp. 1779–1793. [Google Scholar]
  44. Barletta, B. The architecture and architects of the Classical Parthenon. In The Parthenon: From Antiquity to the Present; Neils, J., Ed.; Cambridge University Press: Cambridge, UK, 2005; pp. 68–99. [Google Scholar]
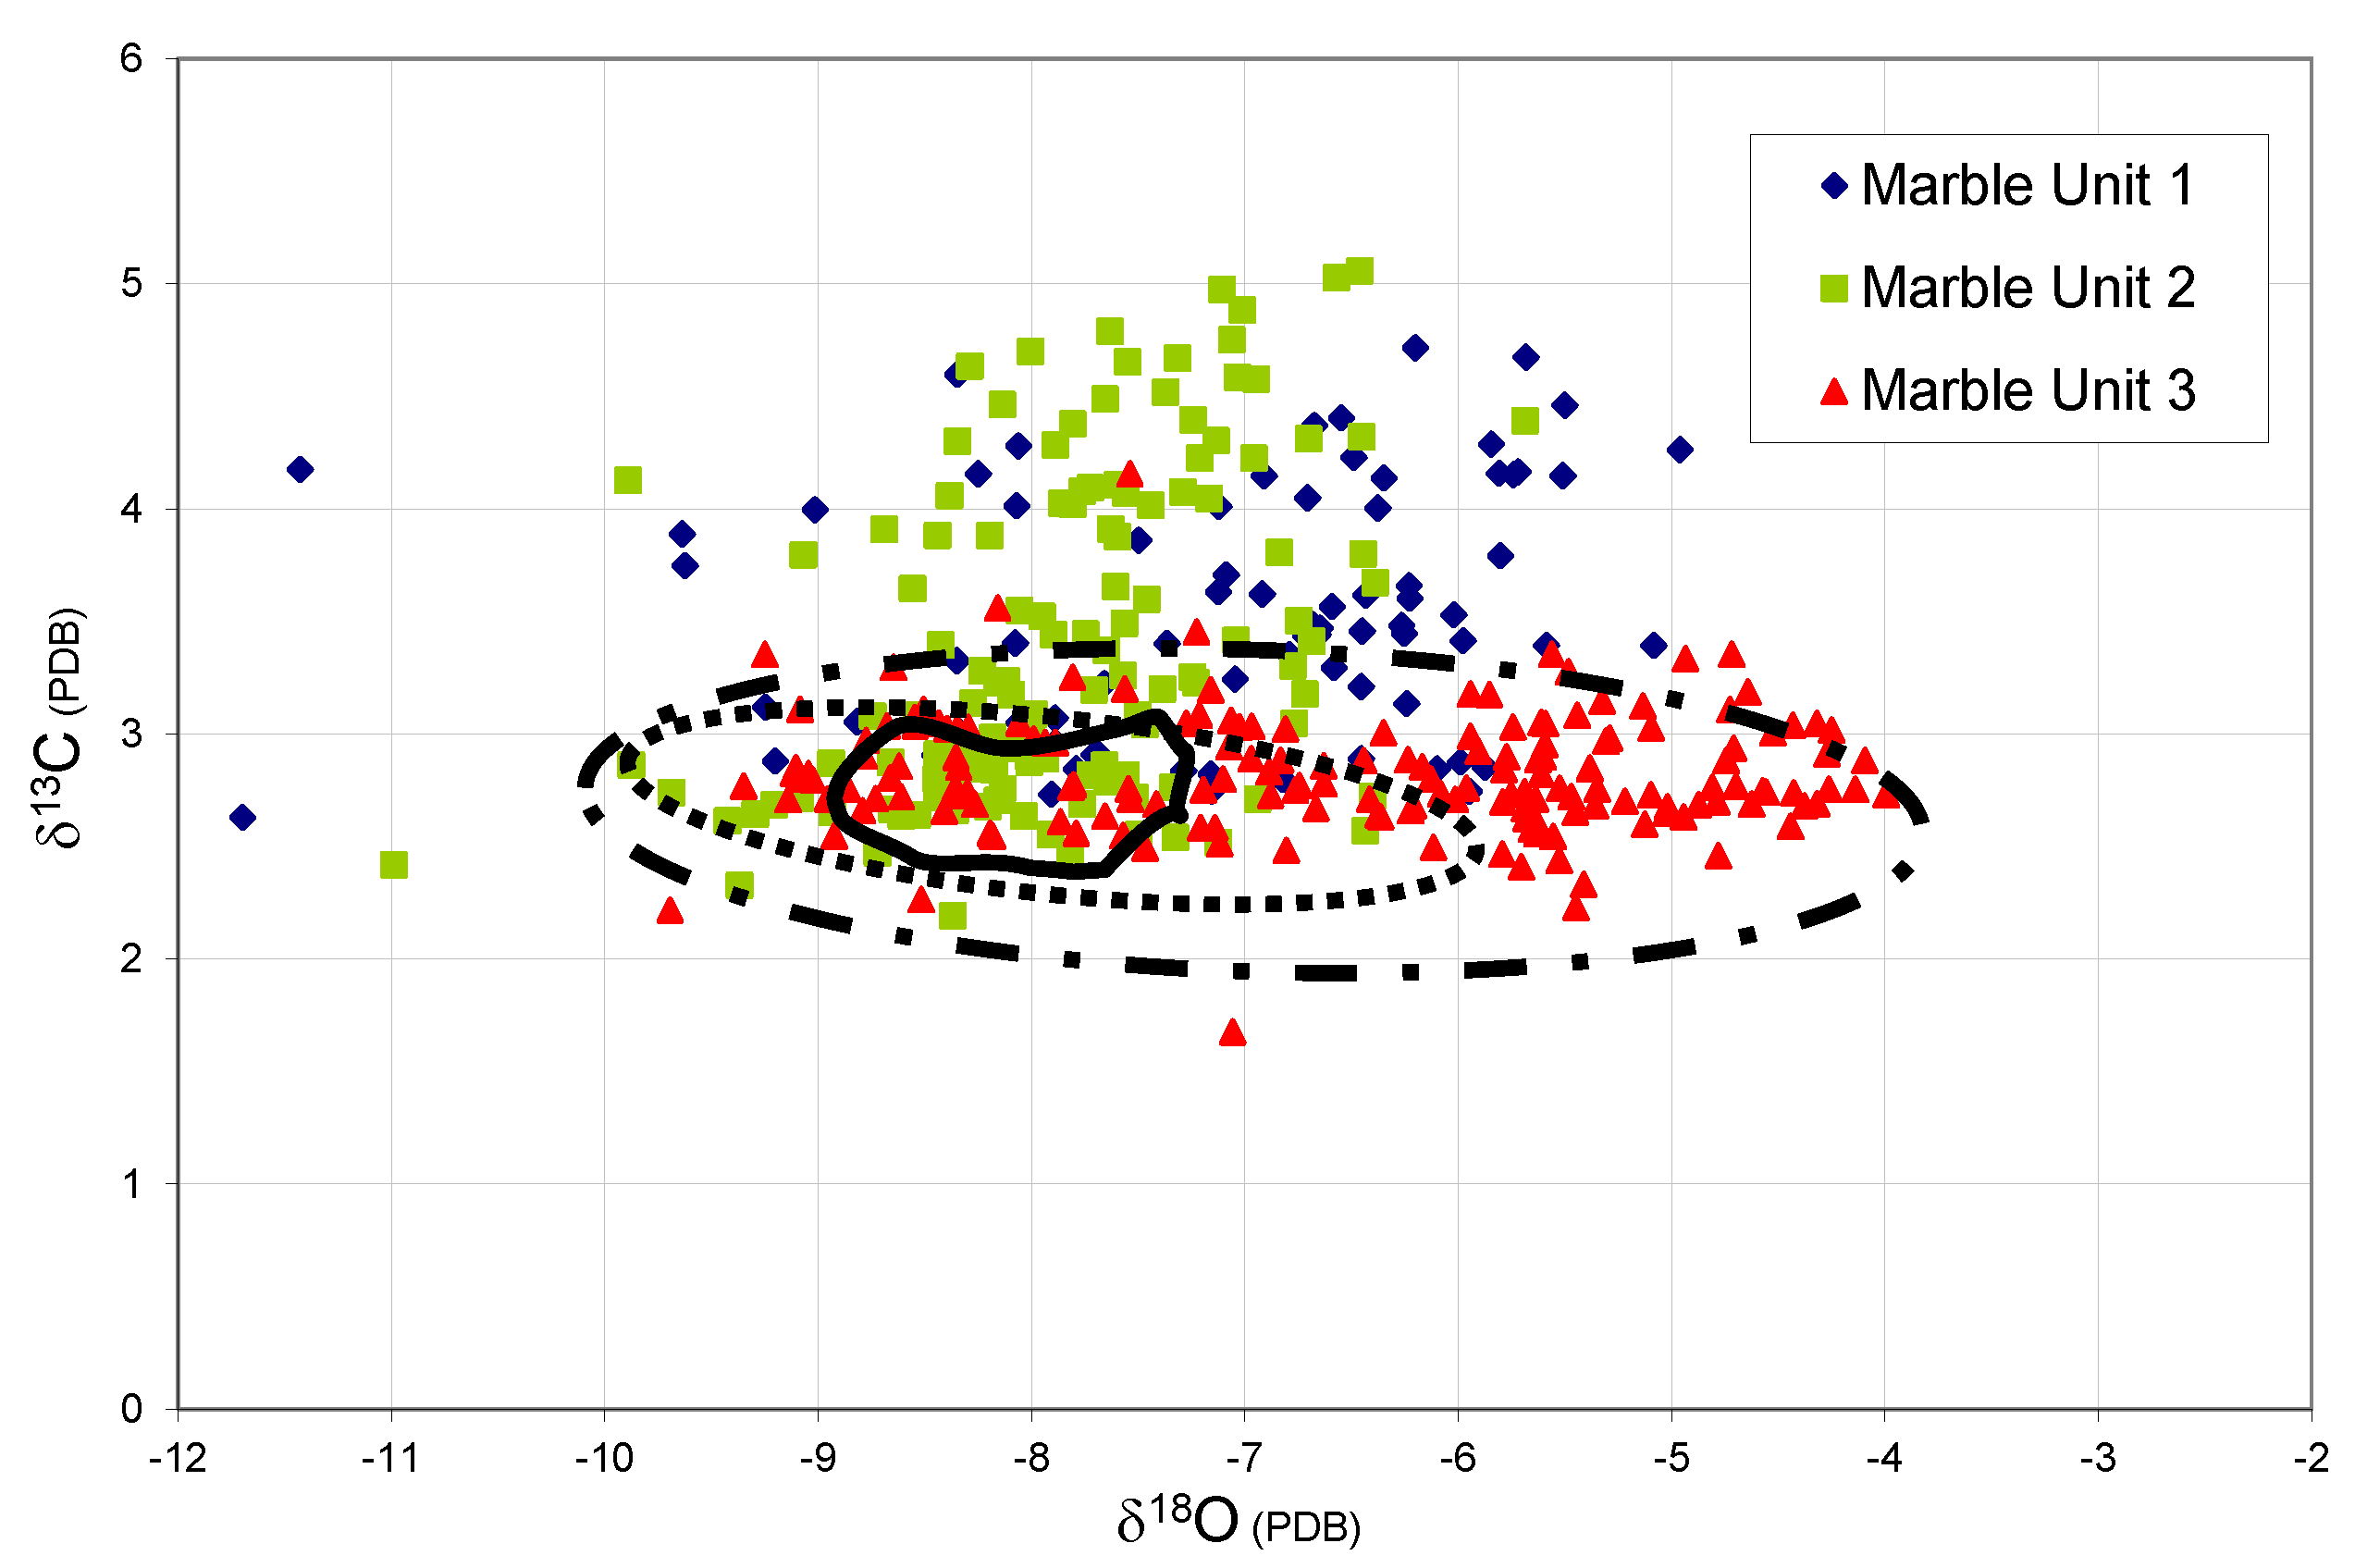
Figure 1. The development of the δ13C and δ18O stable isotope field for Pentelic marble. The inner polygon (solid line) represents the data first published in 1972 by Craig and Craig [23]. The middle ellipse (stippled line) represents the 90% probability ellipsoid of the 1987 Pentelic database of Herz [5]. The outer ellipse (dashed line) represents the 90% ellipsoid of the combination of the earlier published data and Matthews et al. 1992. Analyzed samples in the current study verify the δ18O range of the Matthews ellipsoid. The δ13C range is significantly expanded in the positive direction. Samples from each of the marble units are distinguished by distinctive symbols. Note the relatively high δ18O values for Marble Unit 3 and the relatively high δ13C values for Marble Units 1 and 2.
Minerals 15 00231 g001
Figure 5. Stable isotope plot of ∂13C and ∂18O of the Pentelic marble stable isotope database with the isotopically-defined marble unit subregions outlined.
Minerals 15 00231 g005
Figure 6. Box-plot of δ18O values from the six samples collected at Spilia Divali, Quarry 55. The box represents the 95% interval. The outlying sample at the top of the diagram is the lone sample collected from the northeast wall of the quarry. This northeast wall was most likely exposed in the modern era, possibly during the construction of the new Royal Palace in Athens in 1846. The remaining five samples were all sampled from the steep, ancient tool marked exposed west wall of the quarry.
Minerals 15 00231 g006
Figure 7. δ13C and δ18O scatter-plot diagram of all analyzed samples from the ancient quarries located on the upper slope of Marble Unit 3. The open symbols represent the Aspra Marmara samples from which the Parthenon sculptures most likely were extracted.
Minerals 15 00231 g007
Figure 8. δ13C and δ18O scatter-plot diagram of all analyzed samples from all archaeological quarries and Quarry Π69 on the mid- and lower-slope of Marble Unit 3. The open-symbol represents quarry Π55, the Spilia Divali quarry. The solid symbols represent the other mid-slope quarries. The crossed and dashed symbols represent those quarries on the lower slope. Note the narrow range of δ13C values and the relatively positive values of Quarries Π35 and Π38.
Minerals 15 00231 g008
Figure 9. δ13C and δ18O scatter-plot diagram of all analyzed samples from the ancient quarries located on the upper slope of Marble Unit 2. The open symbols represent the Aspra Marmara samples from which the Parthenon’s west pediment sculptures most likely were extracted.
Minerals 15 00231 g009
Figure 10. Scatter-plot diagram displaying stable isotope values of different elements of the Parthenon. Architectural marble is marked with squares and sculptural marble with triangles. The close spacing of the west pediment marbles, marked by purple triangles, indicates that the Aspra Marmara quarries supplied the high-quality white marble after the completion of the completion of the main building by 438/437 BCE. The broader distribution of the architectural samples indicates that multiple quarries were used to supply marble for the building of the Parthenon, yet the Aspra Marmara quarries appear to be preferred and perhaps purposefully limited to sculptural elements.
Minerals 15 00231 g010
Disclaimer/Publisher’s Note: The statements, opinions and data contained in all publications are solely those of the individual author(s) and contributor(s) and not of MDPI and/or the editor(s). MDPI and/or the editor(s) disclaim responsibility for any injury to people or property resulting from any ideas, methods, instructions or products referred to in the content.