Article

Geometallurgical Characterization of the Arthur River Magnesite Deposit, Northwestern Tasmania for Pathways to Production

by
Alfredtina Akua Abrafi Appiah
1,2,*,
Julie Hunt
1,2,
Mohammadbagher Fathi
1,2,
Owen P. Missen
1,2,
Wei Hong
1,2,
Ivan Belousov
1,2,
Verity Kameniar-Sandery
3 and
Mick Wilson
4
1
Centre for Ore Deposit and Earth Sciences (CODES), University of Tasmania, Private Bag 79, Hobart-Sandy Bay, TAS 7001, Australia
2
Regional Research Collaboration Program: Environmentally Sustainable Production of Critical Metals, University of Tasmania, Private Bag 79, Hobart-Sandy Bay, TAS 7001, Australia
3
Mineral Resources Tasmania, Department of State Growth, Hobart-Rosny Park, TAS 7018, Australia
4
GWR Group Limited, Perth, WA 6005, Australia
*
Author to whom correspondence should be addressed.
Minerals 2025, 15(3), 247; https://doi.org/10.3390/min15030247
Submission received: 16 January 2025 / Revised: 19 February 2025 / Accepted: 25 February 2025 / Published: 27 February 2025
(This article belongs to the Special Issue Microanalysis Applied to Mineral Deposits)

Abstract

:
The Arthur River magnesite deposit is in the northwestern part of Tasmania, Australia, within the Arthur Metamorphic Complex. Physical, mineralogical, and chemical characteristics of the deposit were studied using geological drill core logging and analytical techniques (scanning electron microscopy, portable x-ray fluorescence, and laser ablation–inductively coupled plasma–mass spectrometry). The results document variations within the ore body, and three ore types have been identified for the potential production of an economic magnesite concentrate separated from associated gangue minerals (dolomite, quartz, and talc and iron bearing minerals such as pyrite and pyrrhotite). The ore types were identified based on a combination of physical, chemical, and mineralogical differences. Type 1 has a relatively high magnesium content and appears in drill core as hard white crystalline magnesite. Type 2 has relatively lower magnesium and higher iron contents than type 1 and occurs visibly as creamy-yellowish soft magnesite. Type 3 ore has the lowest magnesium and the highest iron content of the three ore types and is reddish brown in color. From the characterization studies, potential beneficiation routes for each ore type are suggested along with potential processing challenges. Examples of processing challenges include magnesium present in both magnesite and in dolomite, and the association of magnesite with quartz and talc results in a relatively high silica content.

Graphical Abstract

1. Introduction

The unique desirable properties of magnesium (Mg), such as its high strength-to-weight ratio, extremely low density (1.74 g/cm−3), and recyclable nature, have led to the metal being used in a wide range of applications in high technological industries including energy, information technology, medical prosthesis, mining, automotive, stone-cutting equipment, refractories for steel making, and as a SO2 sorbent in environmental protection technologies [1,2,3]. Due to these diverse applications, demand for the metal is progressively increasing and a potential disruption of its supply chain could have major consequences [4]. This has led to magnesium been added to the official critical minerals lists in Australia, the United States, and the European Union [5,6,7]. Australia has Mg resources (economic demonstrated resources in 2022) of 294 million tons (Mt), occurring as magnesite (MgCO3) [8], but the annual production amount is less than 5% of the total resources [5]. This is mainly due to the complexity of magnesite beneficiation processes as well as some environmental concerns (e.g., greenhouse gas emissions) associated with magnesium production [9]. Also, the production of magnesite concentrate for Mg extraction by thermal processing (e.g., the Pidgeon unit [10]) can be very challenging, as most deposits of magnesite are formed in association with other carbonate minerals, which contaminate the concentrate with calcium ions [11]. The carbonate gangue minerals (dolomite CaMg(CO3)2; calcite CaCO3) typically exhibit similar physical and chemical properties to those of magnesite [12,13], and both gangue and valuable minerals may show similar affinities for reagents in the case of recovery via flotation. Another main gangue mineral in magnesite deposits is quartz [14] and, if not effectively removed, it can reduce the value of the magnesite concentrate by increasing the smelting costs [15]. Therefore, the efficient removal of quartz from magnesite ore is critical in producing a high-quality magnesite concentrate [16].
This paper is focused on the Arthur River deposit, in northwestern Tasmania, Australia, which has an inferred JORC 2012 (Joint Ore Reserve Committee, 2012) mineral resource estimate of 25.1 Mt of magnesite grading 42.4% of MgO, 4.8% of SiO2, 1.4% of Fe2O3, and 2.6% of CaO with a cut-off grade of 40% of MgO [17]. A description of the Arthur River magnesite deposit is presented in this paper based on detailed geological, mineralogical, and geochemical characterization. This level of understanding is essential in investigating pathways to the production of economic concentrates of magnesite from which magnesium can be recovered.

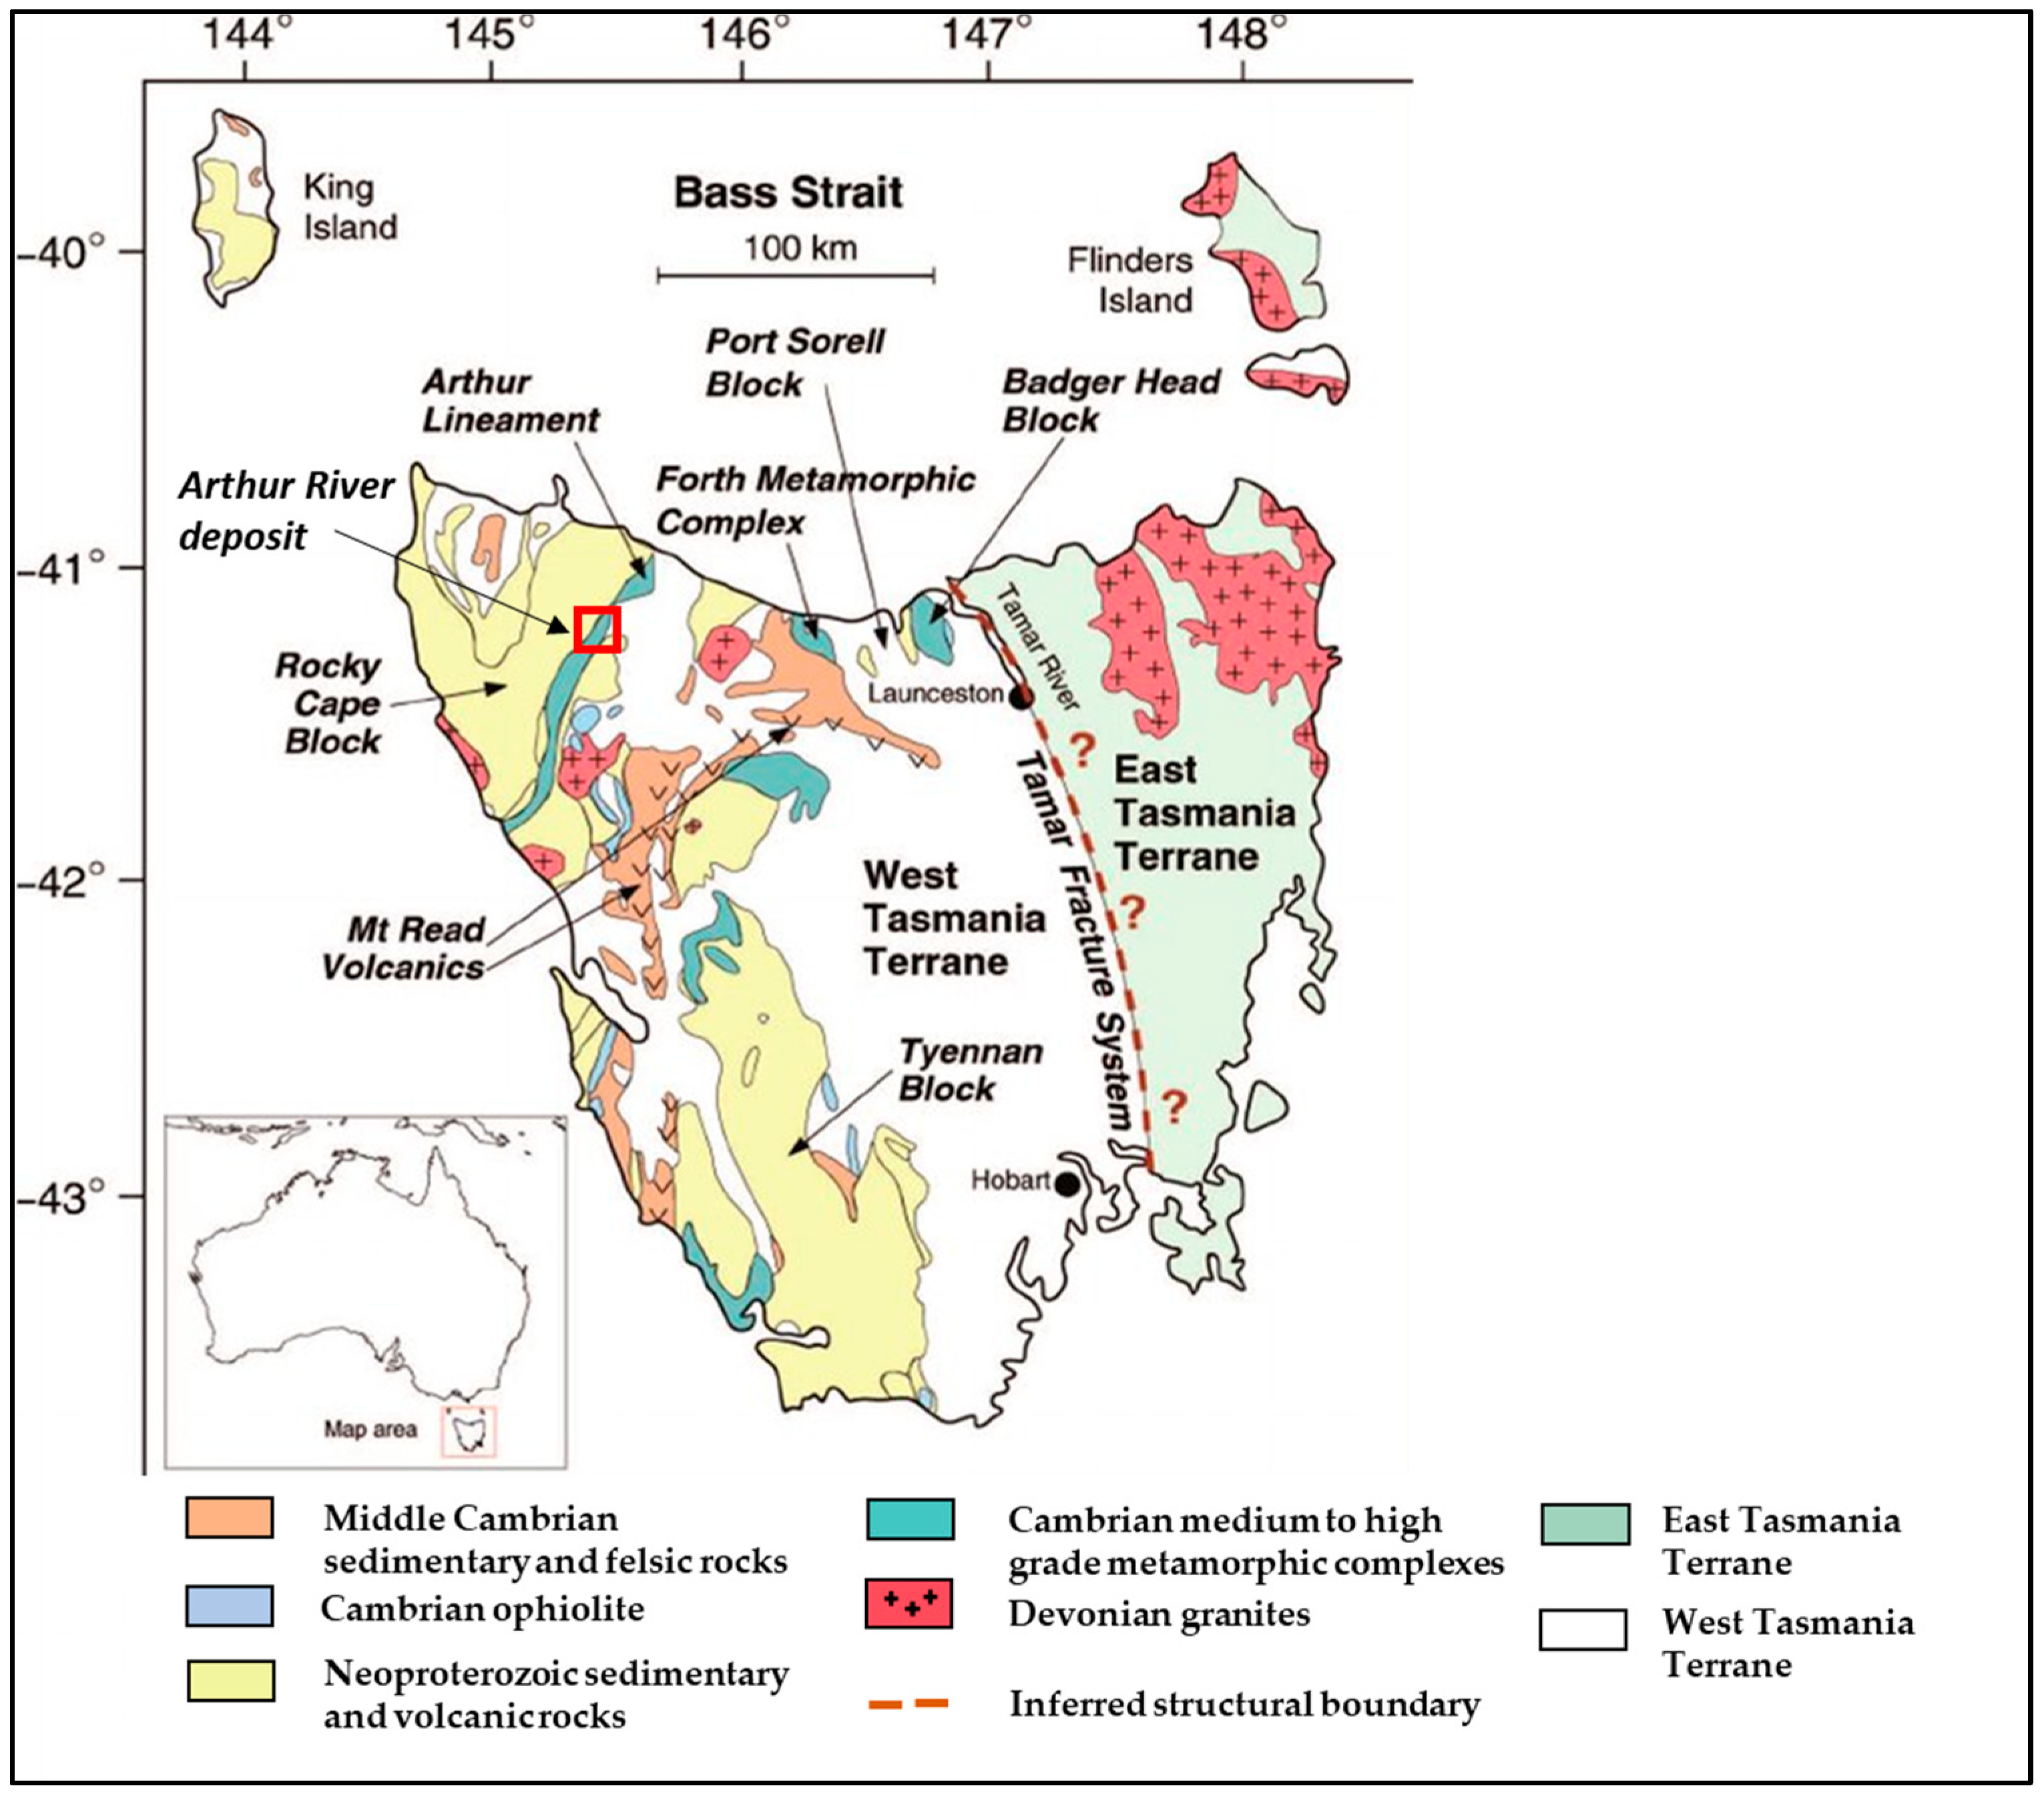
2. Geological Background

The Arthur Lineament is a narrow (~110 km long by up to 10 km wide) tectonic feature that transects northwest Tasmania from the west to the north coast separating the open folded rocks of the Rocky Cape domain to the west, from strongly deformed parts of the Tyennan Orogeny to the east (Figure 1). The lineament is composed of strongly folded and faulted steeply dipping greenschist facies metamorphic rocks of Cambrian age [18]. The lineament comprises tholeiitic amphibolites, metasediments, and carbonates [19]. The units in the Arthur Metamorphic Complex are subdivided into two (Timbs Group and Oonah Formation) [20]. The Timbs Group comprises schist formed after banded pelitic schist, dolomites, and tuffaceous sediments with amphibolite layers. The Oonah Formation consists of phyllite and micaceous quartzite derived from interbedded mudstone, siltstone, and quartzose turbiditic sandstone [20]. Six known magnesite deposits exist within the Arthur Lineament: Main Creek, Bowry Creek, and Savage River magnesite deposits are in the southern part of the lineament, while the northern part hosts the Arthur River, Lyons River and Cann Creek magnesite deposits [21]. Savage River is best known as a magnetite deposit but also contains magnesite lenses [19]. In the Lyons River area, there is extensive cover of Tertiary basalt, whilst in the Arthur River tenement area, with the exception of minor exposures in the watercourses, almost all the resource zone is concealed beneath a cover of quaternary-aged alluvium, scree, and residual soils (Figure 2, [22]).
The Arthur River deposit was initially discovered in 1925 by P.B. Nye after he assayed a sample to determine the characteristics of a rock previously interpreted to be dolomite for an investigation run by the Hydro Electric Department [23]. The deposit has a maximum width of approximately 10 km and its boundaries are transitions into less deformed and less metamorphosed rocks [20,24]. A large area of northwestern Tasmania is considered Precambrian, mainly from the fact that the oldest fossiliferous beds overlying it are dated to the Middle Cambrian period in a formation known as the Dundas Group [25]. The Arthur River deposit is located in a unit of chloritic schist with trace amounts of phyllitic rock, dolomite, and magnesite in the Arthur Metamorphic Complex Formations [20]. The Precambrian in this area is divided usually into two main groups, the first being a sequence of regionally metamorphosed deformed schists and quartzites, and the second, a sequence of sandstones, lates, and mudstones, which are less deformed [26].
The genesis of the Arthur River deposit is currently unclear due to a lack of detailed work on the deposit to confirm its origin. However, there are some theories which suggest the origin of the deposit. Frost (1982) explored the occurrence of the Main Creek and Savage River magnesite and suggested that all the magnesite deposits within the Arthur Lineament may share a common mode of formation [22]. Based on his findings, he suggested that the magnesite was derived as a result of the Mg metasomatism of dolomite, and the solution carrying the Mg was a dilute chloride solution with a low temperature of formation, probably less than 400 °C. Urquhart (1966) also favored a formation model of Mg metasomatism based on the concordant of magnesite with adjacent metasediments but mentioned that a sedimentary origin should not be completely dismissed [27]. Impurities found within these deposits are different from that of a typical sedimentary origin. Dickson (1990) suggested a sedimentary origin during his mapping of the Arthur and Lyons River deposit. He discussed that breccia textures throughout the deposit suggest the deposition of magnesite either as soft or hard fragments [28]. Spate (1998), in his studies on magnesite karst in Tasmania, also suggested that magnesites in Tasmania are of metasomatized dolomite, highlighting that calcium was leached and replaced by magnesium-rich waters associated with regional tectonic activity [29].
The Arthur River magnesite ore body is a Precambrian deposit, ~2500 m long and ~400 m wide, with a vertical extent of ~290 m with limited outcrop. The body dips to the southeast between 70 and 90° based on the contact from the hanging wall and the footwall. The geologic setting is summarized as recent/quaternary; gray sand/silt/boulder alluvium, Tertiary; basalt rocks with minor sediments. Intrusives into the Proterozoic sequence are mafic dolerite, gabbro dykes, and/or plugs of both Proterozoic and Jurassic age (Figure 2). Proterozoic: hanging wall quartz schist, magnesite with minor dolomite horizons, and a footwall pyritic schist. There are a few stratigraphic or structural features visible within the magnesite body as the carbonate zone is crystalline with a simple mineralogy, which is formed mainly by mixtures of magnesite and dolomite within minor quartz, pyrite, talc, and chlorite [28].

3. Materials and Methods

The methods summarized in Table 1 were used in this study and are described in more detail in the sections below.

3.1. Samples

Samples collected for this study were diamond drill cores from four historic drill holes stored at the Minerals Resources Tasmania (MRT) core library and three new holes drilled in 2023; the drill holes range from 99.8 m to 282.5 m in length (Table 1). Rock samples were prepared as both polished tiles of 30 × 30 mm (length × width) and thin sections of 50 × 25 mm, 30 µm thick on 76 × 26 mm glass slides for the estimation of modal composition to further characterize the carbonates in the Arthur River magnesite deposit. The location of some studied drill holes is shown in Figure 3.
To identify ore types, potential processing methods, and how each ore type will affect processing, a total of 138 samples was collected. The samples were pieces of drill cores about 5 cm in length each. An interval of 5 m was deemed appropriate to cover the entire drill hole for characterization after considering core recovery. The sample selection was based on macroscopic observations. The rocks with interesting structural and textural features were used to make thin sections for optical microscopy, while those with varied mineralogical compositions were used for laser mounts for mineral liberation analysis. In addition to texture, some samples were selected to either confirm or identify unknown minerals found during manual logging. Selected samples were cut and mounted in 25 mm resin mounts or cut into ~30 mm by ~12 mm tiles to use in the SEM or laser ablation–inductively coupled plasma–mass spectrometry (LA-ICPMS) systems. Pulverized samples (d80 = 140 µm) used for automated mineralogy analysis were made into polished grain mounts (PGR) by mounting in resin, cutting in half, then re-mounting in resin, and the top surfaces were polished using 1 µm diamond in the CODES lapidary laboratory.

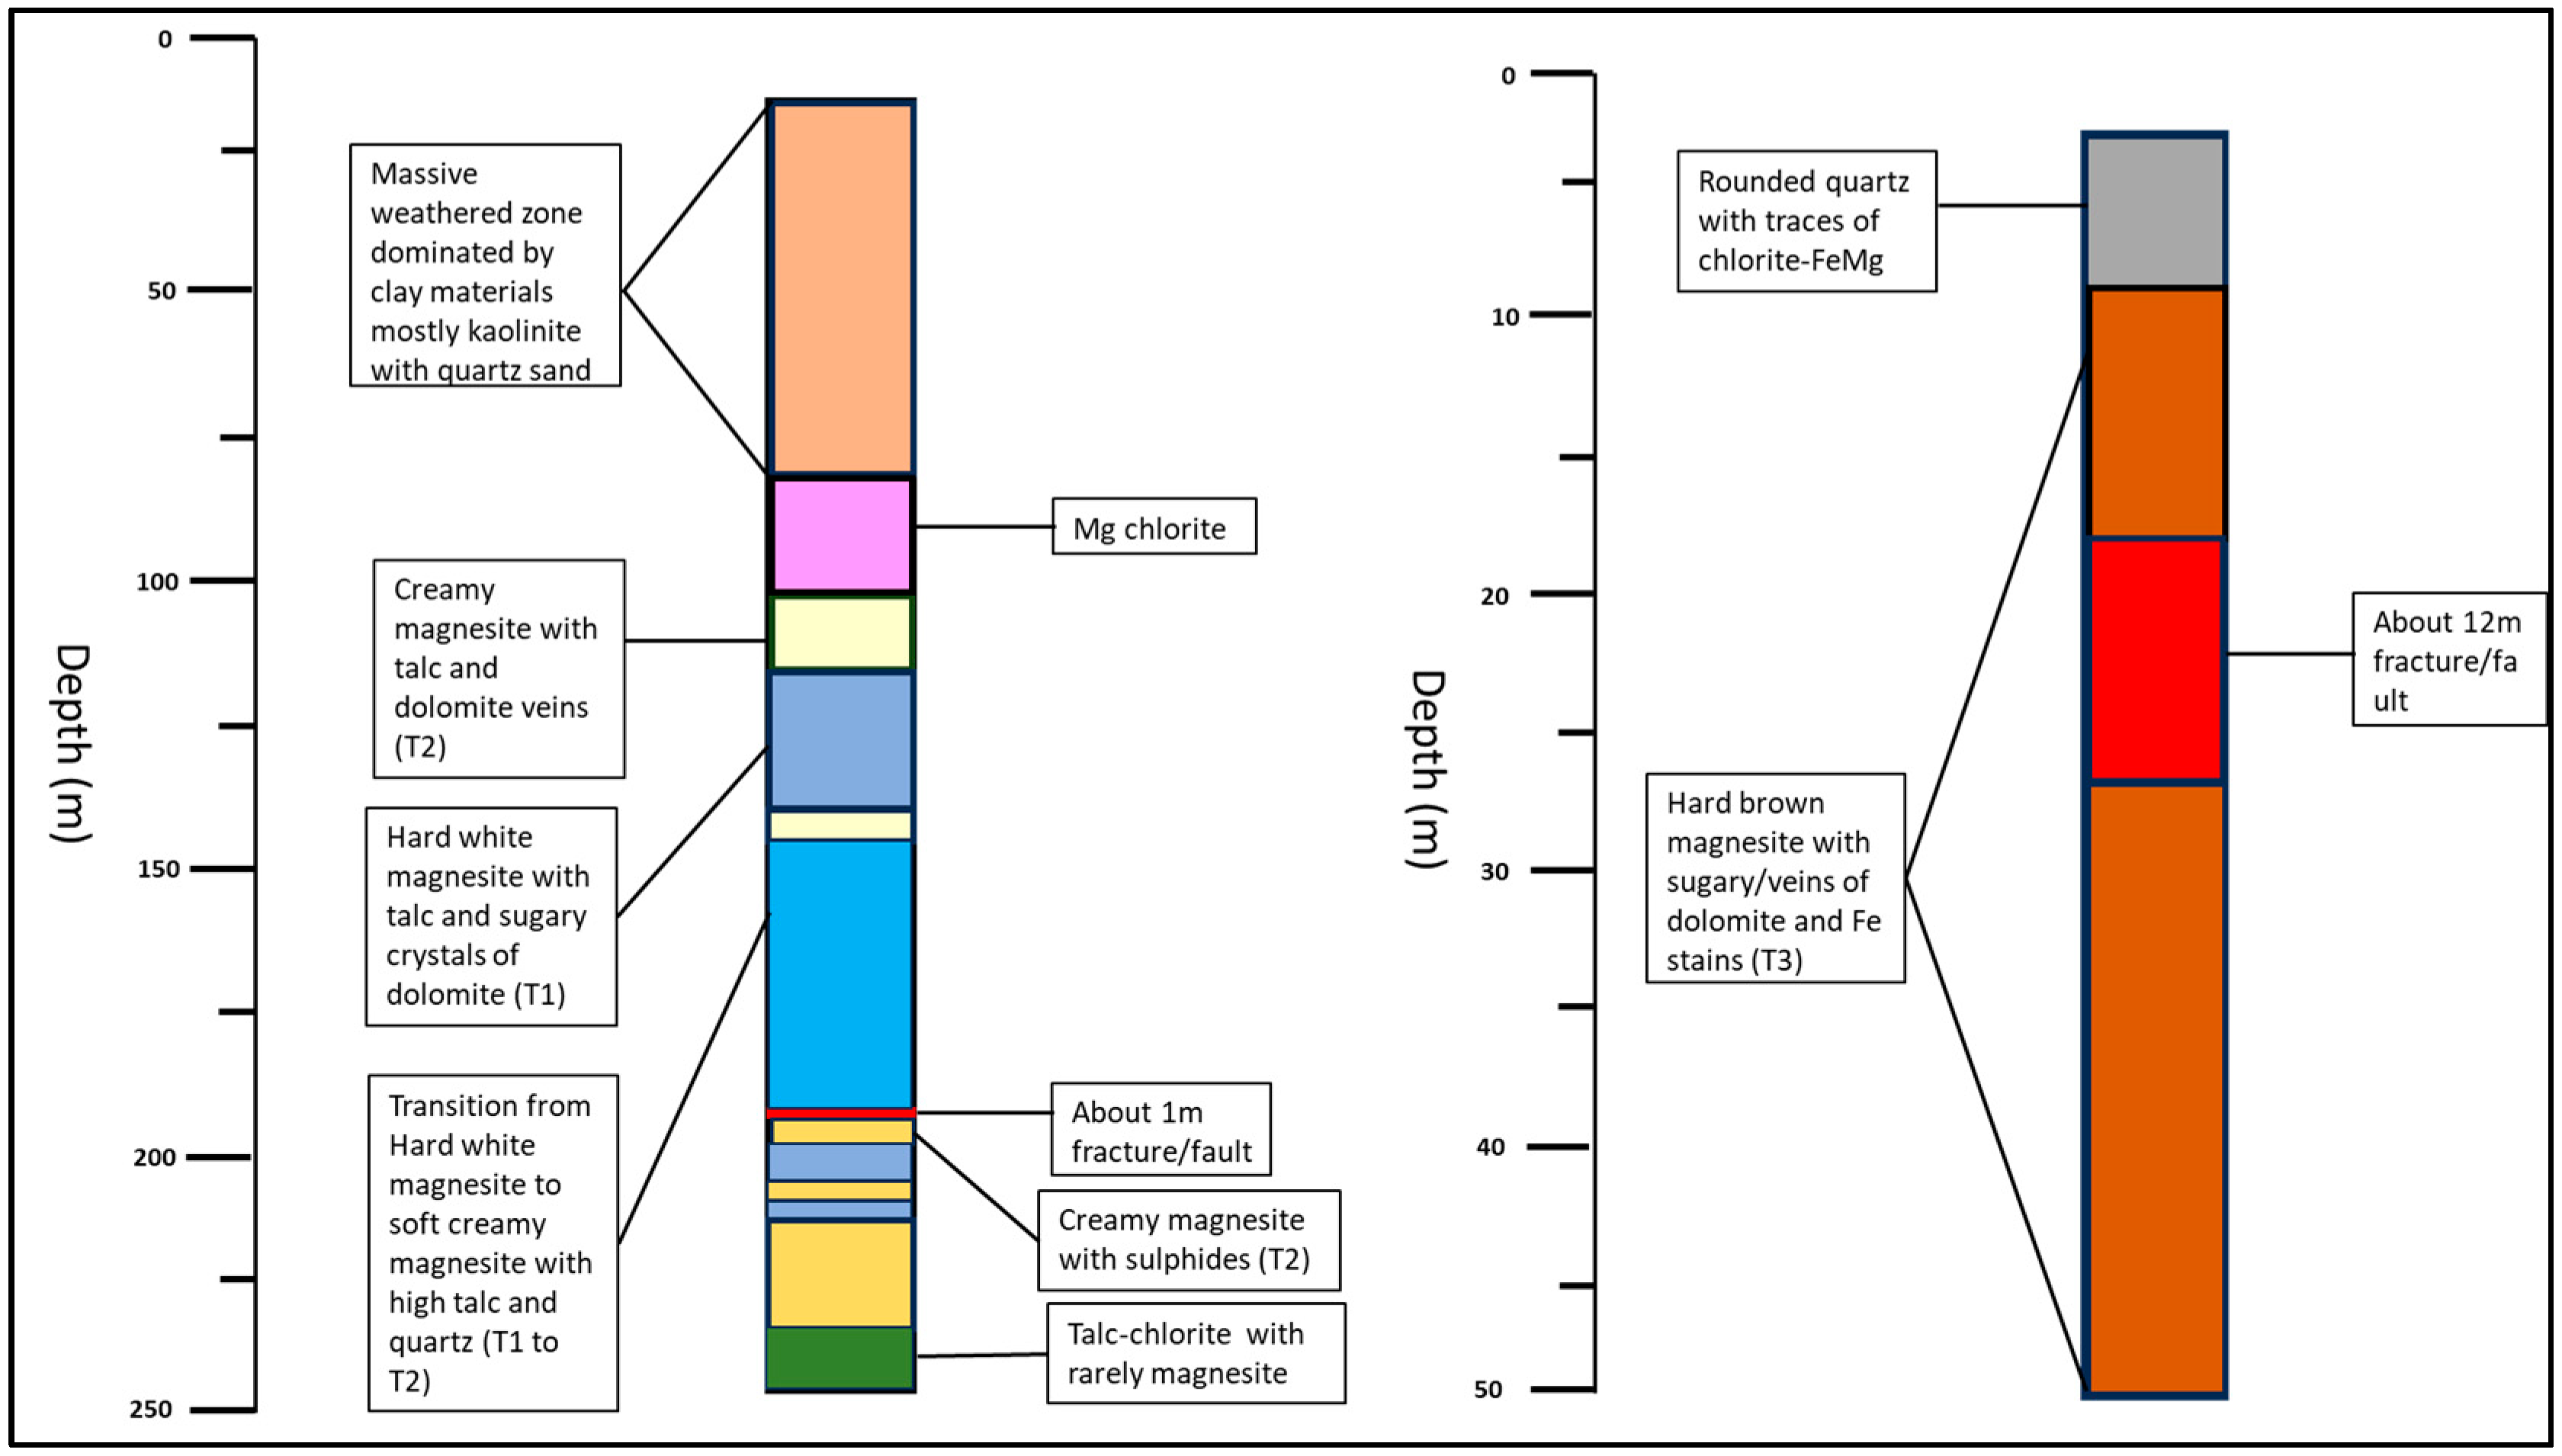
3.2. Drill Core Logging Procedure

Eight diamond drill holes from the Arthur River magnesite deposit were logged to identify and distinguish between different ore types. These drill holes were DD83AR002, DD83AR007, DD83AR0016, MB008, AR035, AR036, AR037, and AR038, which were logged using the anaconda logging method [30]. Logging was primarily focused on mineralogy, alteration, and chemistry to identify ore types. Since the identified 3 ore types remained consistent in all drill holes, only two drill holes, DD83AR002 and MB008, are presented in the results and discussion of the drill core section. A total of 100 samples were collected across the drill holes for subsequent studies.

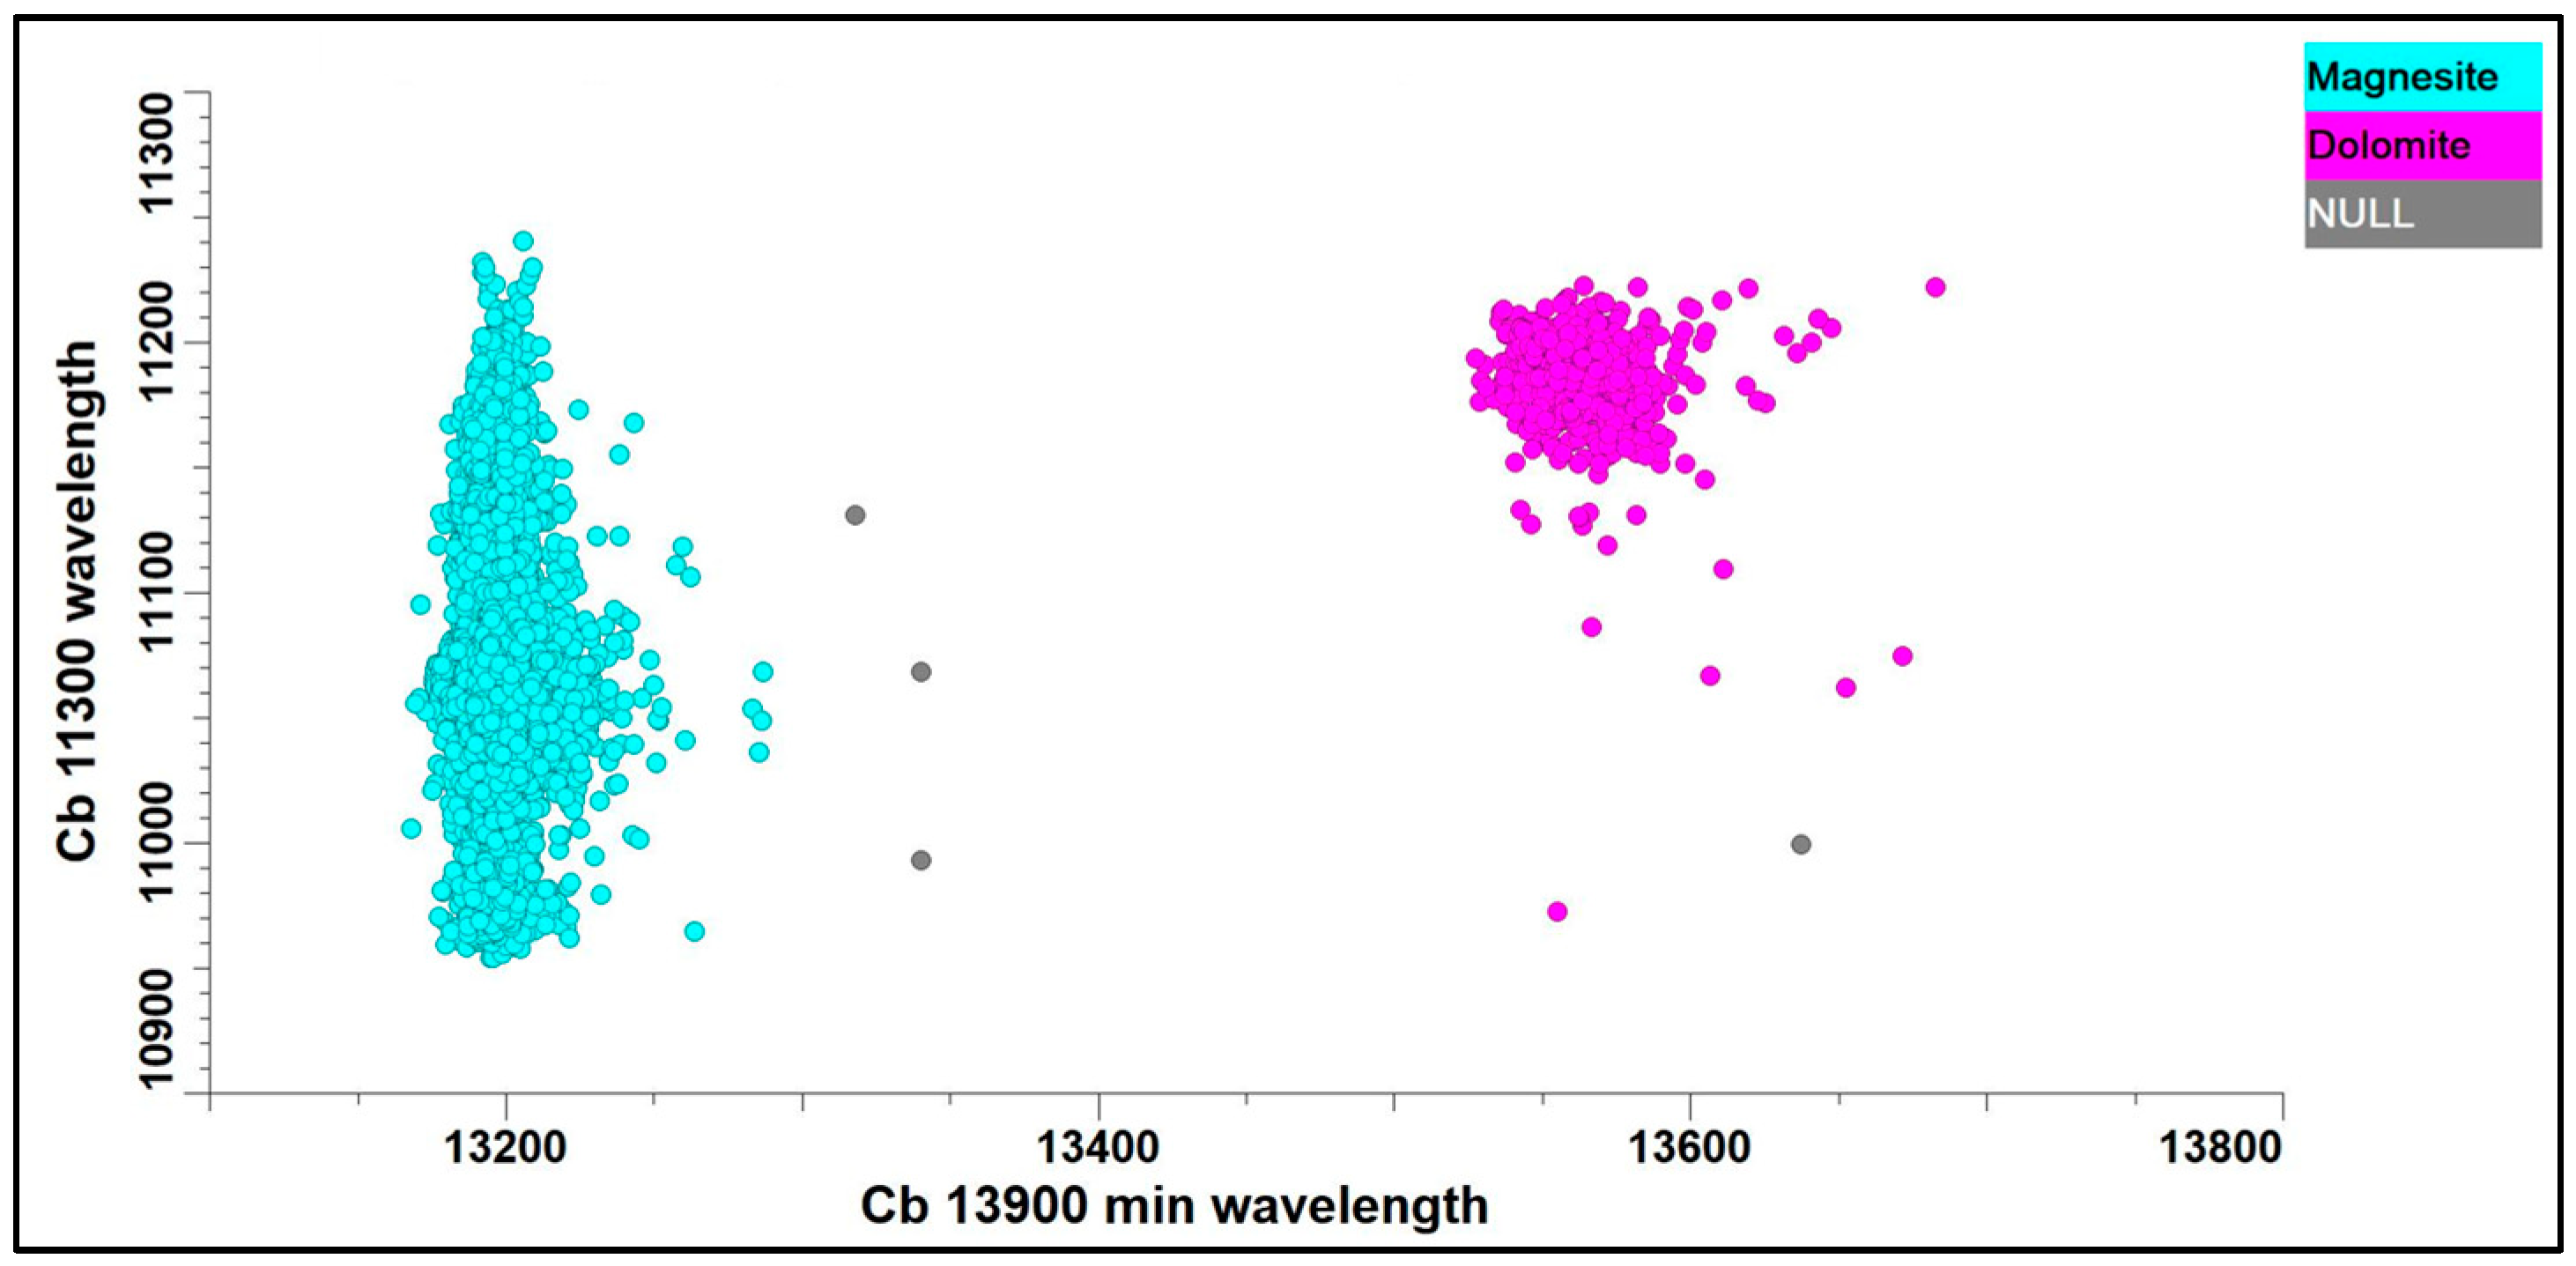
3.3. Hyperspectral Mineralogy

Traditional methods of logging drill cores (visual inspection) can be inconsistent and subjective, especially when dealing with carbonates that have similar properties (like dolomite, calcite, and magnesite) [31,32]. This can result in the variability and potential misinterpretation of the mineralogy. Hyperspectral logging can provide a fast, non-destructive, and objective supplement to traditional manual core logging techniques [33] and was used to examine drill core samples from drill holes (DD83AR002 and DD83AR016). Sample preparation for this analysis included cleaning core samples to remove powders, dust, and wood chips on trays. Spectral data were collected using HyLogger-3TM (CSIRO, Melbourne, Australia) operated at Mineral Resources Tasmania, Hobart, Tasmanian both shortwave infrared (SWIR) and thermal infrared (TIR) within a range of wavelengths from 1300 to 2500 nm and 6000 to 14,500 nm, respectively. For the identification of various carbonates, 11,300 nm (x-axis) and 13,900 nm (y-axis) wavelengths were plotted to identify different carbonate populations. Reflectance calibration was performed prior to each measurement to ensure reproducible reflectance measurements. The correction of relative reflectance was undertaken using primary standards. The Labsphere Spectralon® reflectance standard for the near-visible infrared SWIR reflectance measurements and the Labsphere Infragold® reflectance standard for TIR reflectance measurements were the two primary standards used. During the TIR calibration, background radiance was measured to prevent interference of the background with measured reflectance. Acquired data were the spectral geologist software (TSGTM, version 8) [34].

3.4. Optical Microscopy and Carbonate Staining

Microscopic observations of thin sections and polished sections were carried out using a Leica (Leica Welt, Wetzlar, Germany) optical microscope model SC50 at CODES Laboratories. Twinning or deformations twinning [35,36] was one of the important features that was used in identifying different carbonates. Textural and compositional difference in carbonates can also be identified through staining using alizarin red S (ARS) and potassium ferricyanide [37,38]. Although there are some limitations to this technique, it has been of great use in the identification of different fine-grained carbonates [39]. In this project, staining was performed on both thin sections and rock samples. Prior to mineral staining, the thin sections were etched with dilute HCl (1.5%) for 10 s to remove impurities such as dust, and then washed. The staining solution was made up of 2 g of ARS and 2 g of potassium ferricyanide powder in 100 mL of 2% HCl and was contacted with samples for 60 s and blow-dried.

3.5. Mineralogical Studies

SEM-AM analysis was performed on drill core samples using an FEI MLA 650 scanning electron microscope (FEI Company, Hillsboro, OR, USA) equipped with Bruker XFlash 5030 detectors (Bruker Corporation, Billerica, MA, USA) at the Central Science Laboratory at the University of Tasmania, Australia. The analysis was conducted at 20 kV and 7 nA. The Advanced Mineral Identification and Characterization System (AMICS) software version 3.1 was utilized for the quantitative mineralogical analysis, size distribution, and liberation of magnesite [40].
Scanning electron microscopy (SEM) coupled with energy dispersive X-ray spectrometry (EDS) was performed on a Hitachi SU-70 SEM (Hitachi, Ltd., Tokyo, Japan) at the Central Science Laboratory (CSL), at the University of Tasmania. The accelerating voltage used was 15 kV with a current of ~3 nA. Electron beam current was calibrated using a cobalt metal standard. EDS spectra were collected for 10 s on points and areas of interest with data analyzed in the AZtec software (version 6.0) suite (by Oxford Instruments, Abingdon, UK).

3.6. Geochemical Elemental (Major and Minor) Composition by pXRF and LA-ICPMS

The major elemental composition of core samples was determined using an Olympus Vanta portable X-ray fluorescence analyzer (pXRF) (Olympus Corporation, Tokyo, Japan) model VMR at CODES Laboratories. Core samples were spot analyzed for 30 s each using the fixed analyzer mode with each spot measurement repeated twice on two separate parts of the sample to minimize measurement variation. Spots were analyzed on veins and magnesite areas. A secondary calibration was performed using samples of a Tasmanian granite (TASGRAN) and a Tasmanian basalt (TASBAS) with known compositions. These were measured consecutively with the magnesite and vein samples to ensure consistency and improve data accuracy.
Thirteen polished laser mounts were analyzed using laser ablation–inductively coupled plasma–mass spectrometry (LA-ICP-MS) at the University of Tasmania CODES Analytical Laboratories. Analyses were conducted on Resolution SE laser ablation systems with an ATL ATLEX-I LR ArF excimer laser (ATL Lasertechnik GmbH, Wermelskirchen, Germany) operating at a 193 nm wavelength and a pulse width of ~5 ns coupled with an Agilent 7900 quadrupole mass spectrometer (Agilent, Santa Clara, CA, USA). Analyses were performed in a time-resolved mode. The sample ablation was performed in the atmosphere flowing at 0.35 L/min and immediately combined with Ar flowing at 1.05 L/min. Before each analysis, 5 pre-ablation shots were used to ’clean’ the surface of any contaminants followed by a 20 s ‘washout’ delay. Each analysis began with a 30 s blank gas measurement followed by a further 60 s of analysis time when the laser was switched on. The ablation spot size was set to 30 µm with the frequency at 5 Hz and a laser fluence of 3.5 J/cm2. Trace element abundances were calibrated on the NIST612 glass using values of [41], using secondary standard corrections based on the compositions of glasses BCR-2G and GSD-1G (GeoReM preferred values; [42]). The primary standard NIST612 was analyzed at a beam size of 60 µm and a 10 Hz frequency, while secondary standards GSD-1G and BCR-2G were analyzed at the same conditions as the magnesite. Standards were run throughout the analytical session for calibration, quantification, and secondary correction. ICPMS was tuned to maximize sensitivity while maintaining a U/Th of ≈1.05 during a line scan (3 μm/s) ablation of the NIST612 glass. The production of molecular oxide species (i.e., 232Th16O/232Th) was maintained at levels below 0.2%, while doubly charged ion species production (i.e., 44Ca++/44Ca+) was kept under 0.1% while ablating the line scan with a 40 µm beam at 10 Hz and 3.5 J/cm2 of laser beam fluence.
The isotopes measured in magnesite and the primary and secondary standards were 7Li, 13C, 23Na, 24Mg, 27Al, 29Si, 31P, 39K, 43Ca, 47Ti, 51V, 53Cr, 55Mn, 57Fe, 59Co, 60Ni, 63Cu, 66Zn, 75As, 88Sr, 89Y, 90Zr, 93Nb, 107Ag, 111Cd, 118Sn, 137Ba, 139La, 140Ce, 146Nd, 147Sm, 153Eu, 157Gd, 163Dy, 166Er, 172Yb, 175Lu, 178Hf, 181Ta, 197Au, 206Pb, 207Pb, 208Pb, 232Th, and 238U. Data reduction was performed according to the methods established by [43] using LADR software (version 1.1.07) [44]. Quantification was performed using 24Mg as the internal standard element, normalizing all measured cations to the carbonate total of 100% with calculated stoichiometric carbon used rather than measured. This is performed due to low accuracy on measured carbon due to high ionization potential and high gas backgrounds. Oxide form was used only for Na, Al, Si, P, K, and Ti, as those elements are believed to be present as oxide inclusions rather than in carbonate structure. The data were filtered by selecting time intervals from the 60 s acquisition that did not include mixing with other minerals or inclusions. This interval selection was conducted visually in LADR.

4. Results

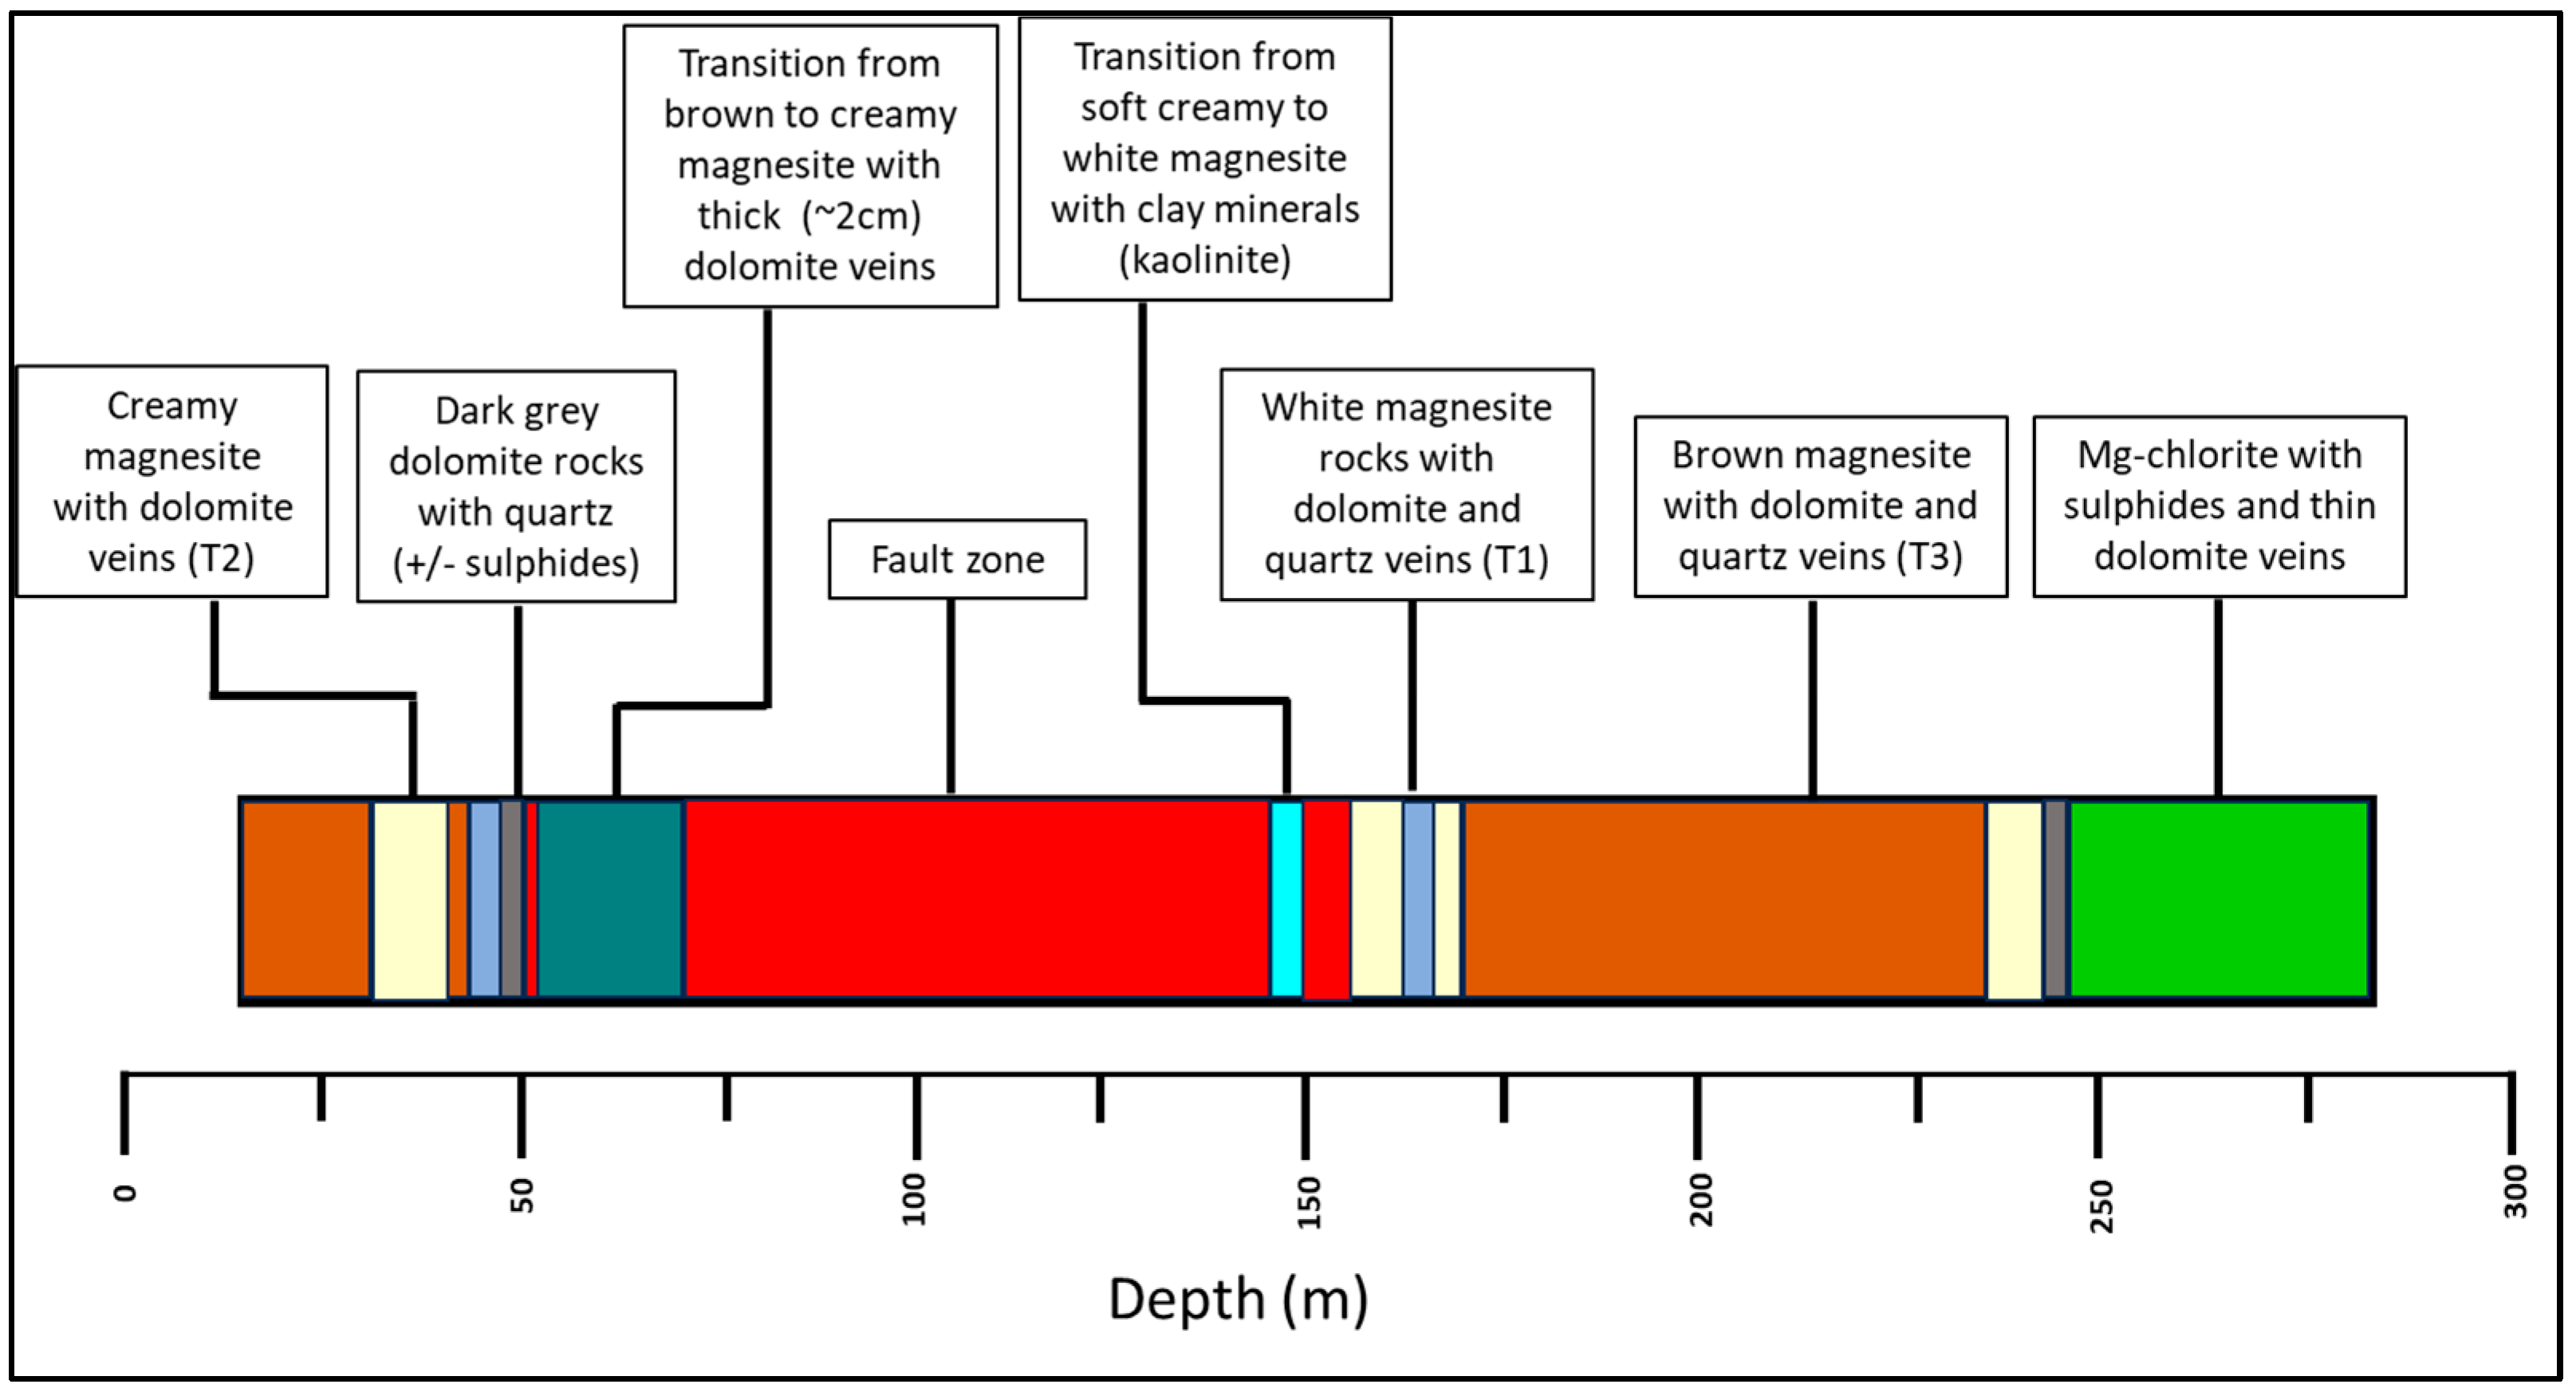
4.1. Ore Type Definition

Different ore types were identified during manual and hyperspectral logging and were designated as ore type 1 (T1), ore type 2 (T2), and ore type 3 (T3). These ore types are distinctive in their mineral composition and color. The chemistry was also observed to vary across the three ore types. To aid in the accurate sorting of ore types and preventing biasness caused by human error in just using physical appearance, a summary of ore types is defined considering the geochemical data of all drill holes from the Arthur River deposit and is shown in Table 2.
Drill core description was the first approach used to characterize the Arthur River magnesite deposits. From the logging, the main variations observed in the magnesite ore were color, hardness, and texture. The major mineral components identified were magnesite, dolomite, quartz, and talc, with minor iron sulfides (pyrite, pyrrhotite) and chlorite (Figure 4). In drillhole DD83AR002, the upper 60 m is a highly weathered zone composed of kaolinite and quartz sand; this is underlain by about 20 m of Mg-chlorite and traces of magnesite. The upper part of the magnesite ore is fairly soft, creamy magnesite with minor talc and dolomite veins and is classed at T2. This transitions to hard white magnesite (classed as T1) with prominent dark-green veins identified as talc (based on SEM analysis) and dolomite veins. Down the hole, the T1 ore changes to the T2 ore (Figure 4). The creamy magnesite is cut by a fault and contains minor sulfides and transitions at the base of the hole into a talc–chlorite schist with minor magnesite veins—this section of the drill core is not considered to be an ore due to the low magnesite content. T3 magnesite ore, i.e., hard reddish-brown magnesite with veins and crystals of dolomite and Fe stains, was identified in other drill holes during logging. For instance, MB008 is predominantly made up of T3 (Figure 4). Unlike T1 and T2, where talc veins are easily identified, talc is rare in T3.
An analysis of hyperspectral data was used to identify different types of carbonates in the Arthur River samples. A plot of TIR at 11,300 nm versus 13,900 nm peak wavelengths indicates that, mainly, Mg-carbonate and CaMg-carbonate are present (Figure 5). There is a large population of Mg-carbonate (magnesite), which plots as a feature between 11,000 nm and 11,300 nm wavelengths. Another population of CaMg-carbonate (dolomite) can be seen plotted around the 11,200 nm wavelength. The Mg-carbonate was seen to have a high-volume scattering effect characterized by 13,900 nm and 11,300 nm. Volume scattering can occur as a result of surface roughness as well as particle size [45]. Notably, 11,300 nm shifts the peak of magnesite to a longer wavelength, while 13,600 nm shifts the peak of magnesite to a greater amplitude change.
In summary, in terms of qualitative mineral composition, T1 is predominantly magnesite and quartz but also has relatively high talc content. T2 has similar mineral composition to T1 but is more creamy yellowish in color instead of white. T3 is reddish brown in color and has relatively high dolomite (sugary crystal texture) and magnesite content but rarely has talc present.

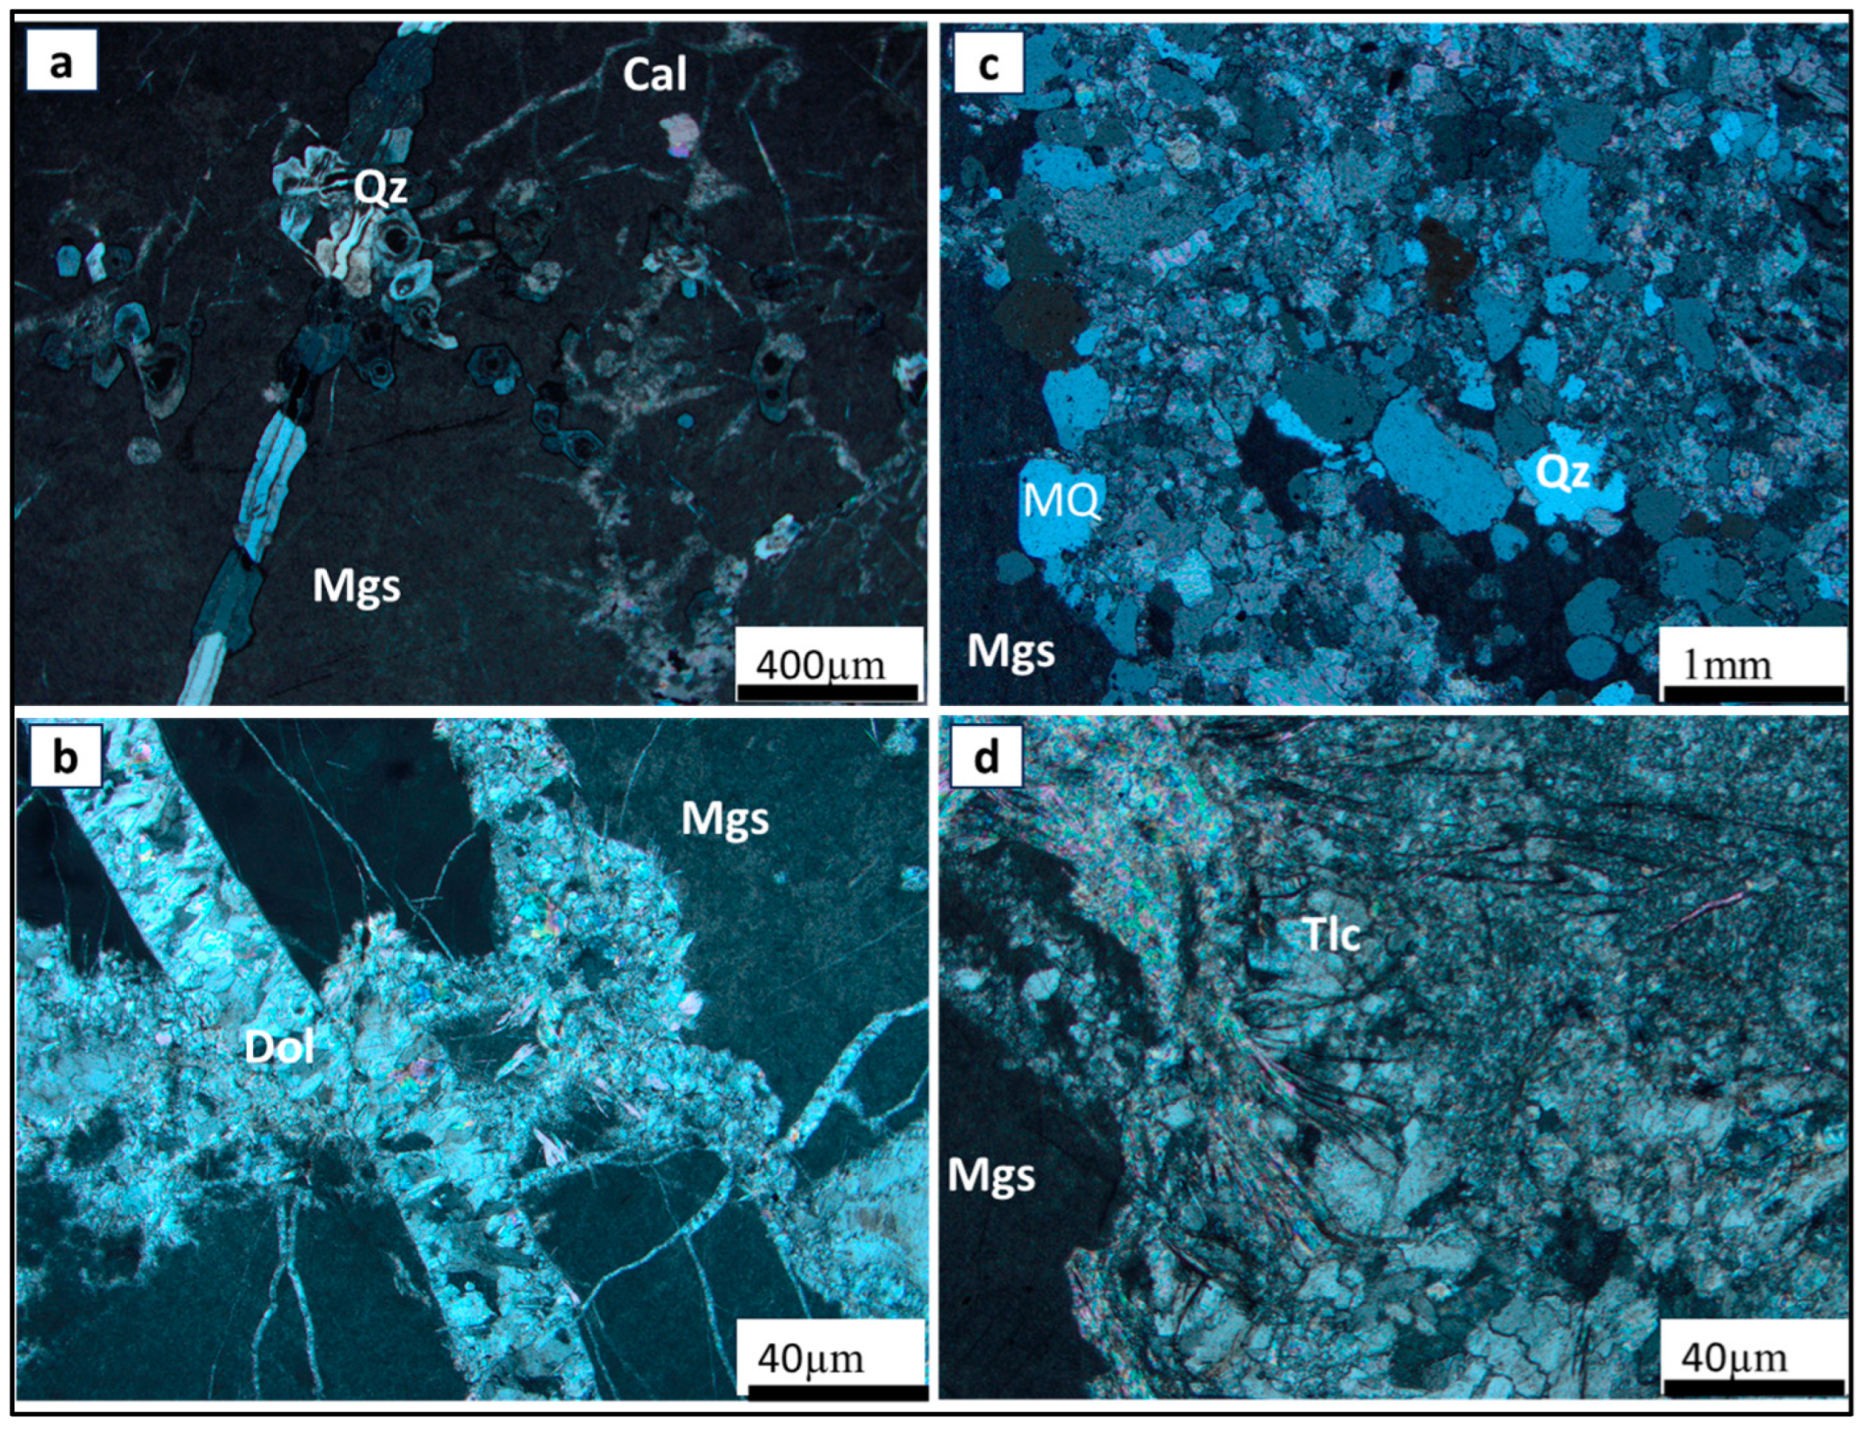
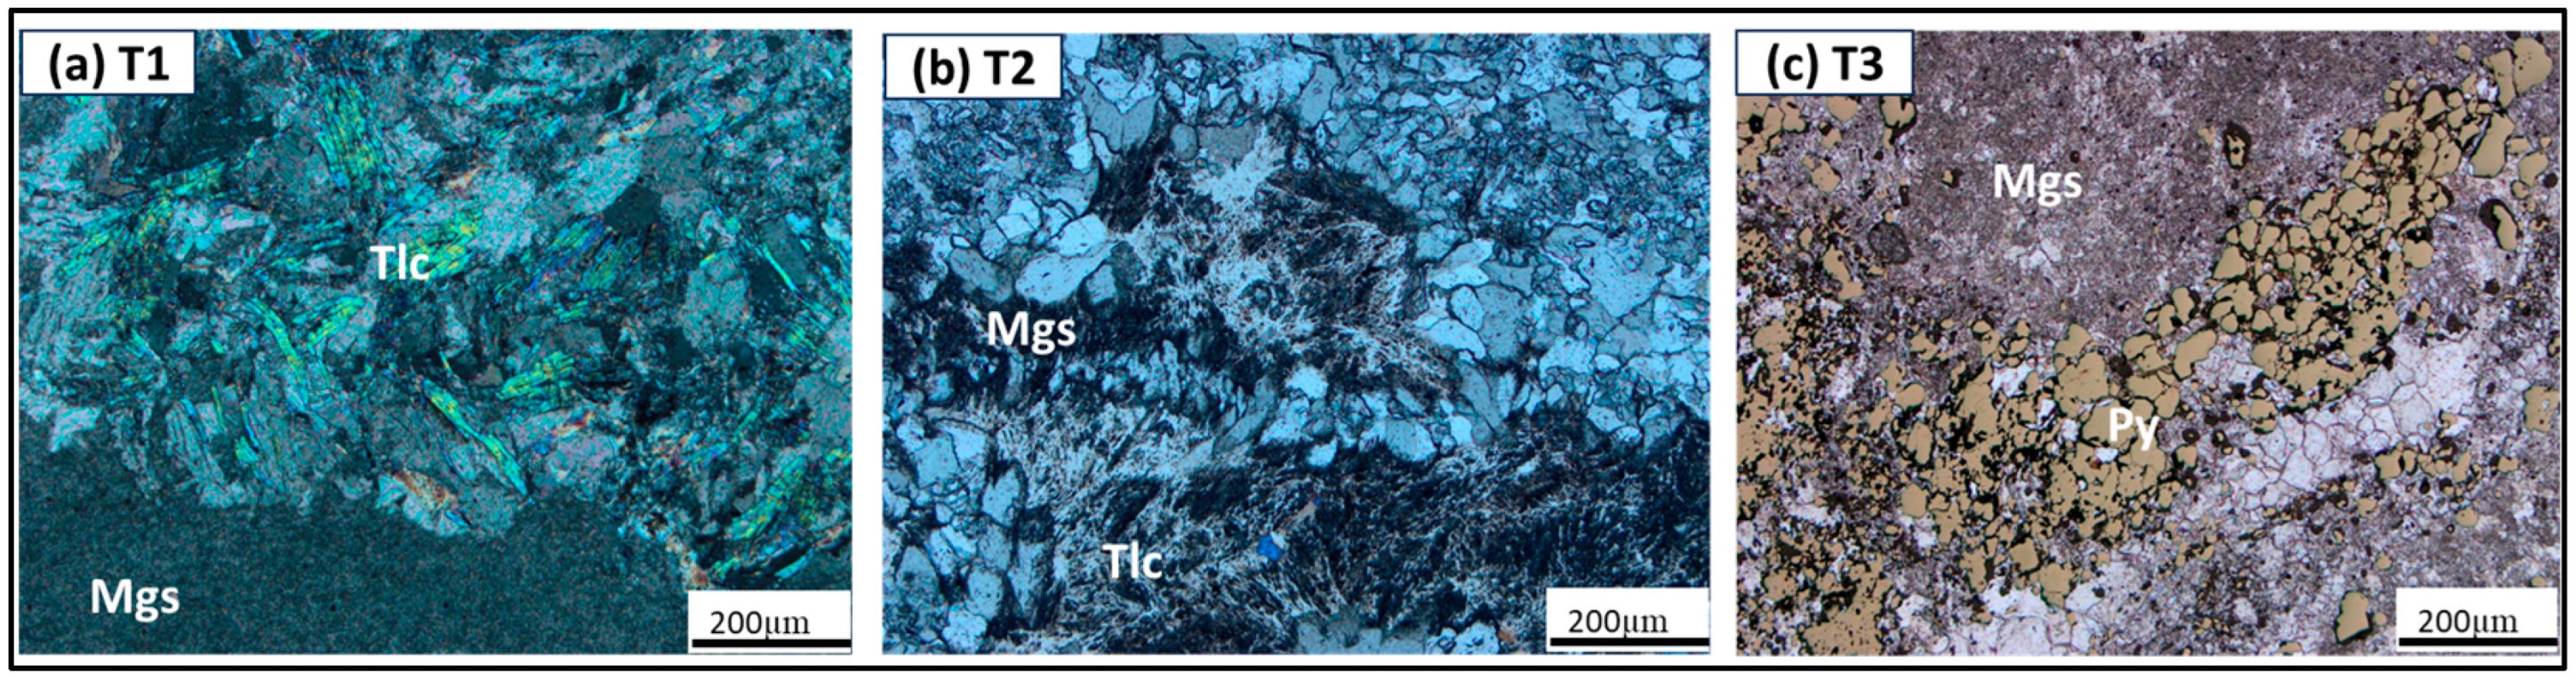
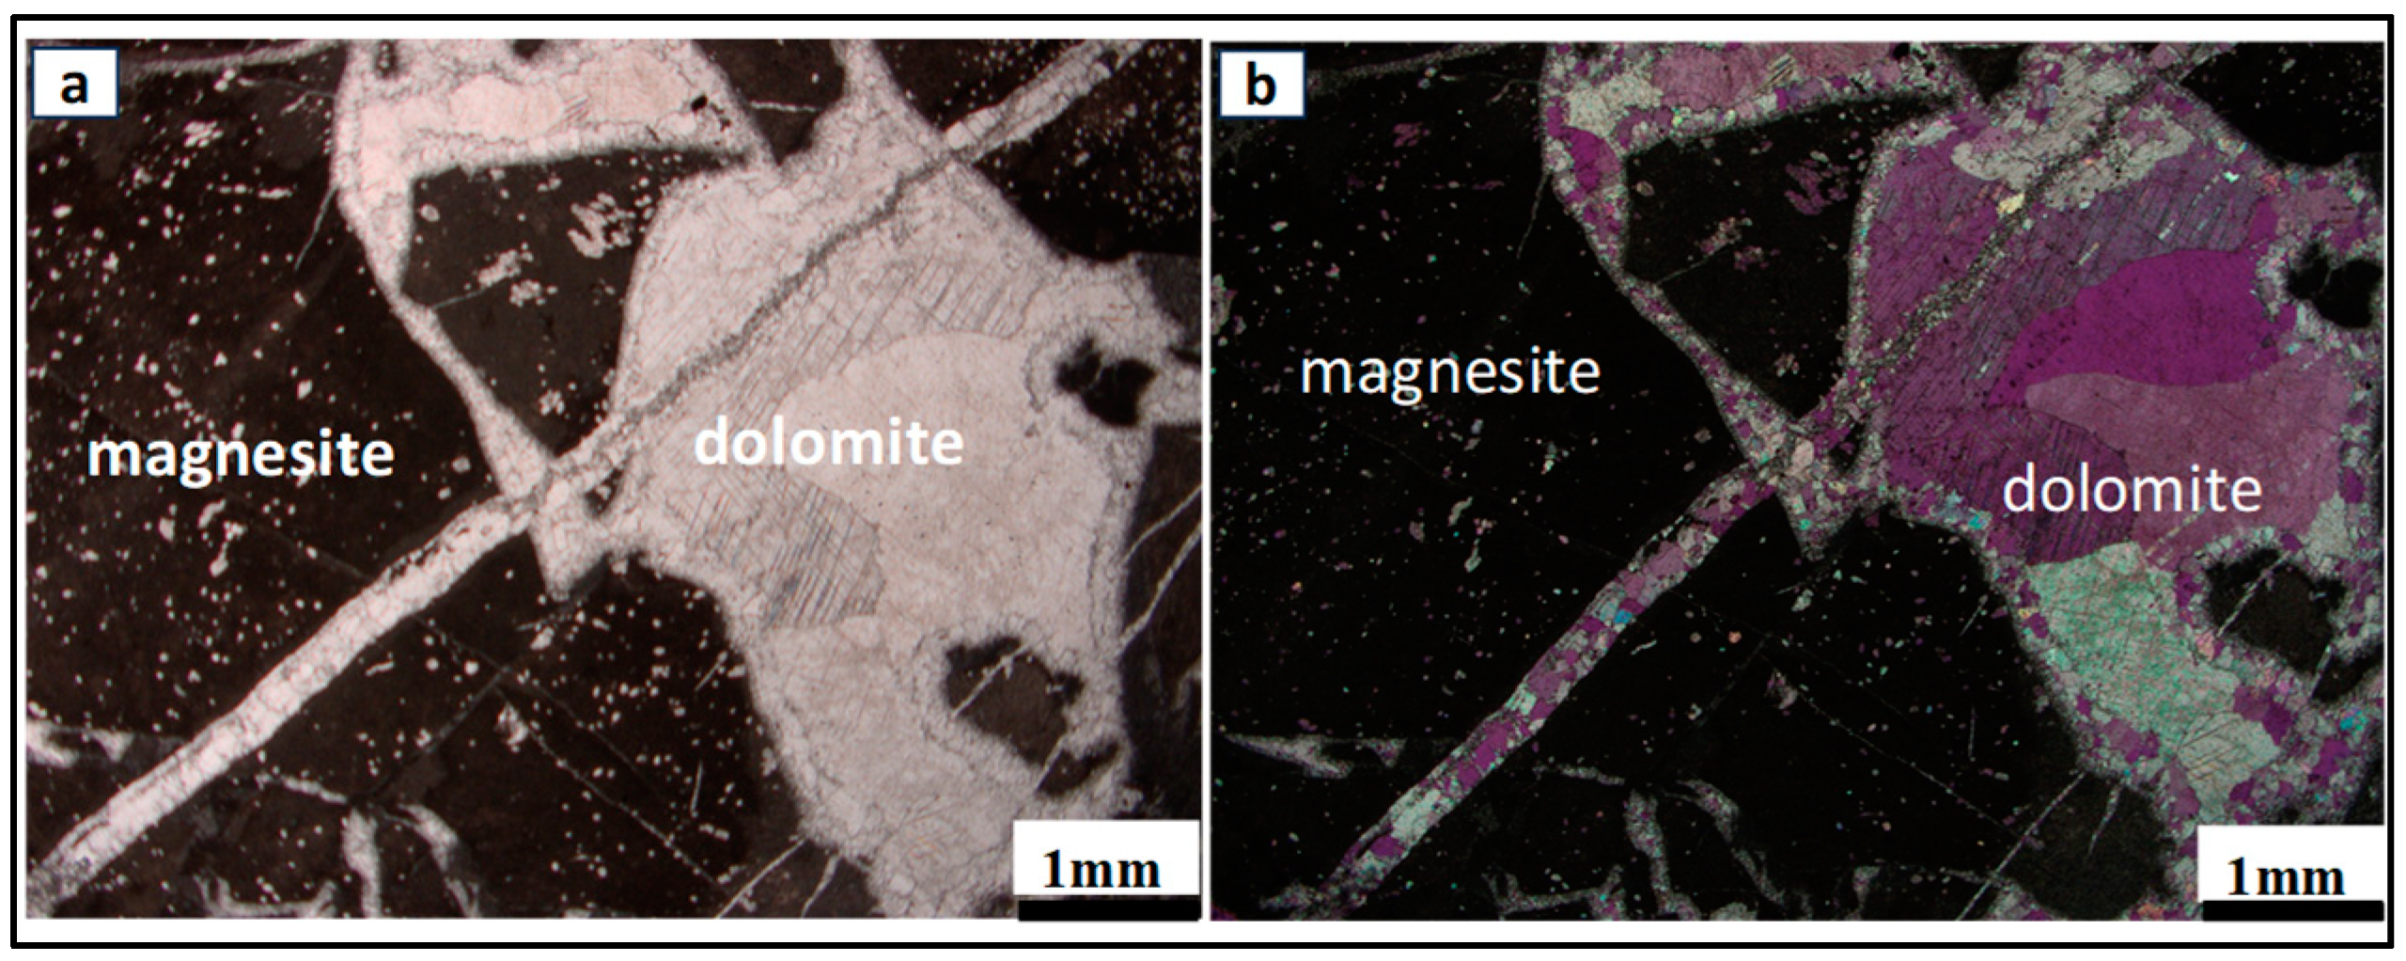
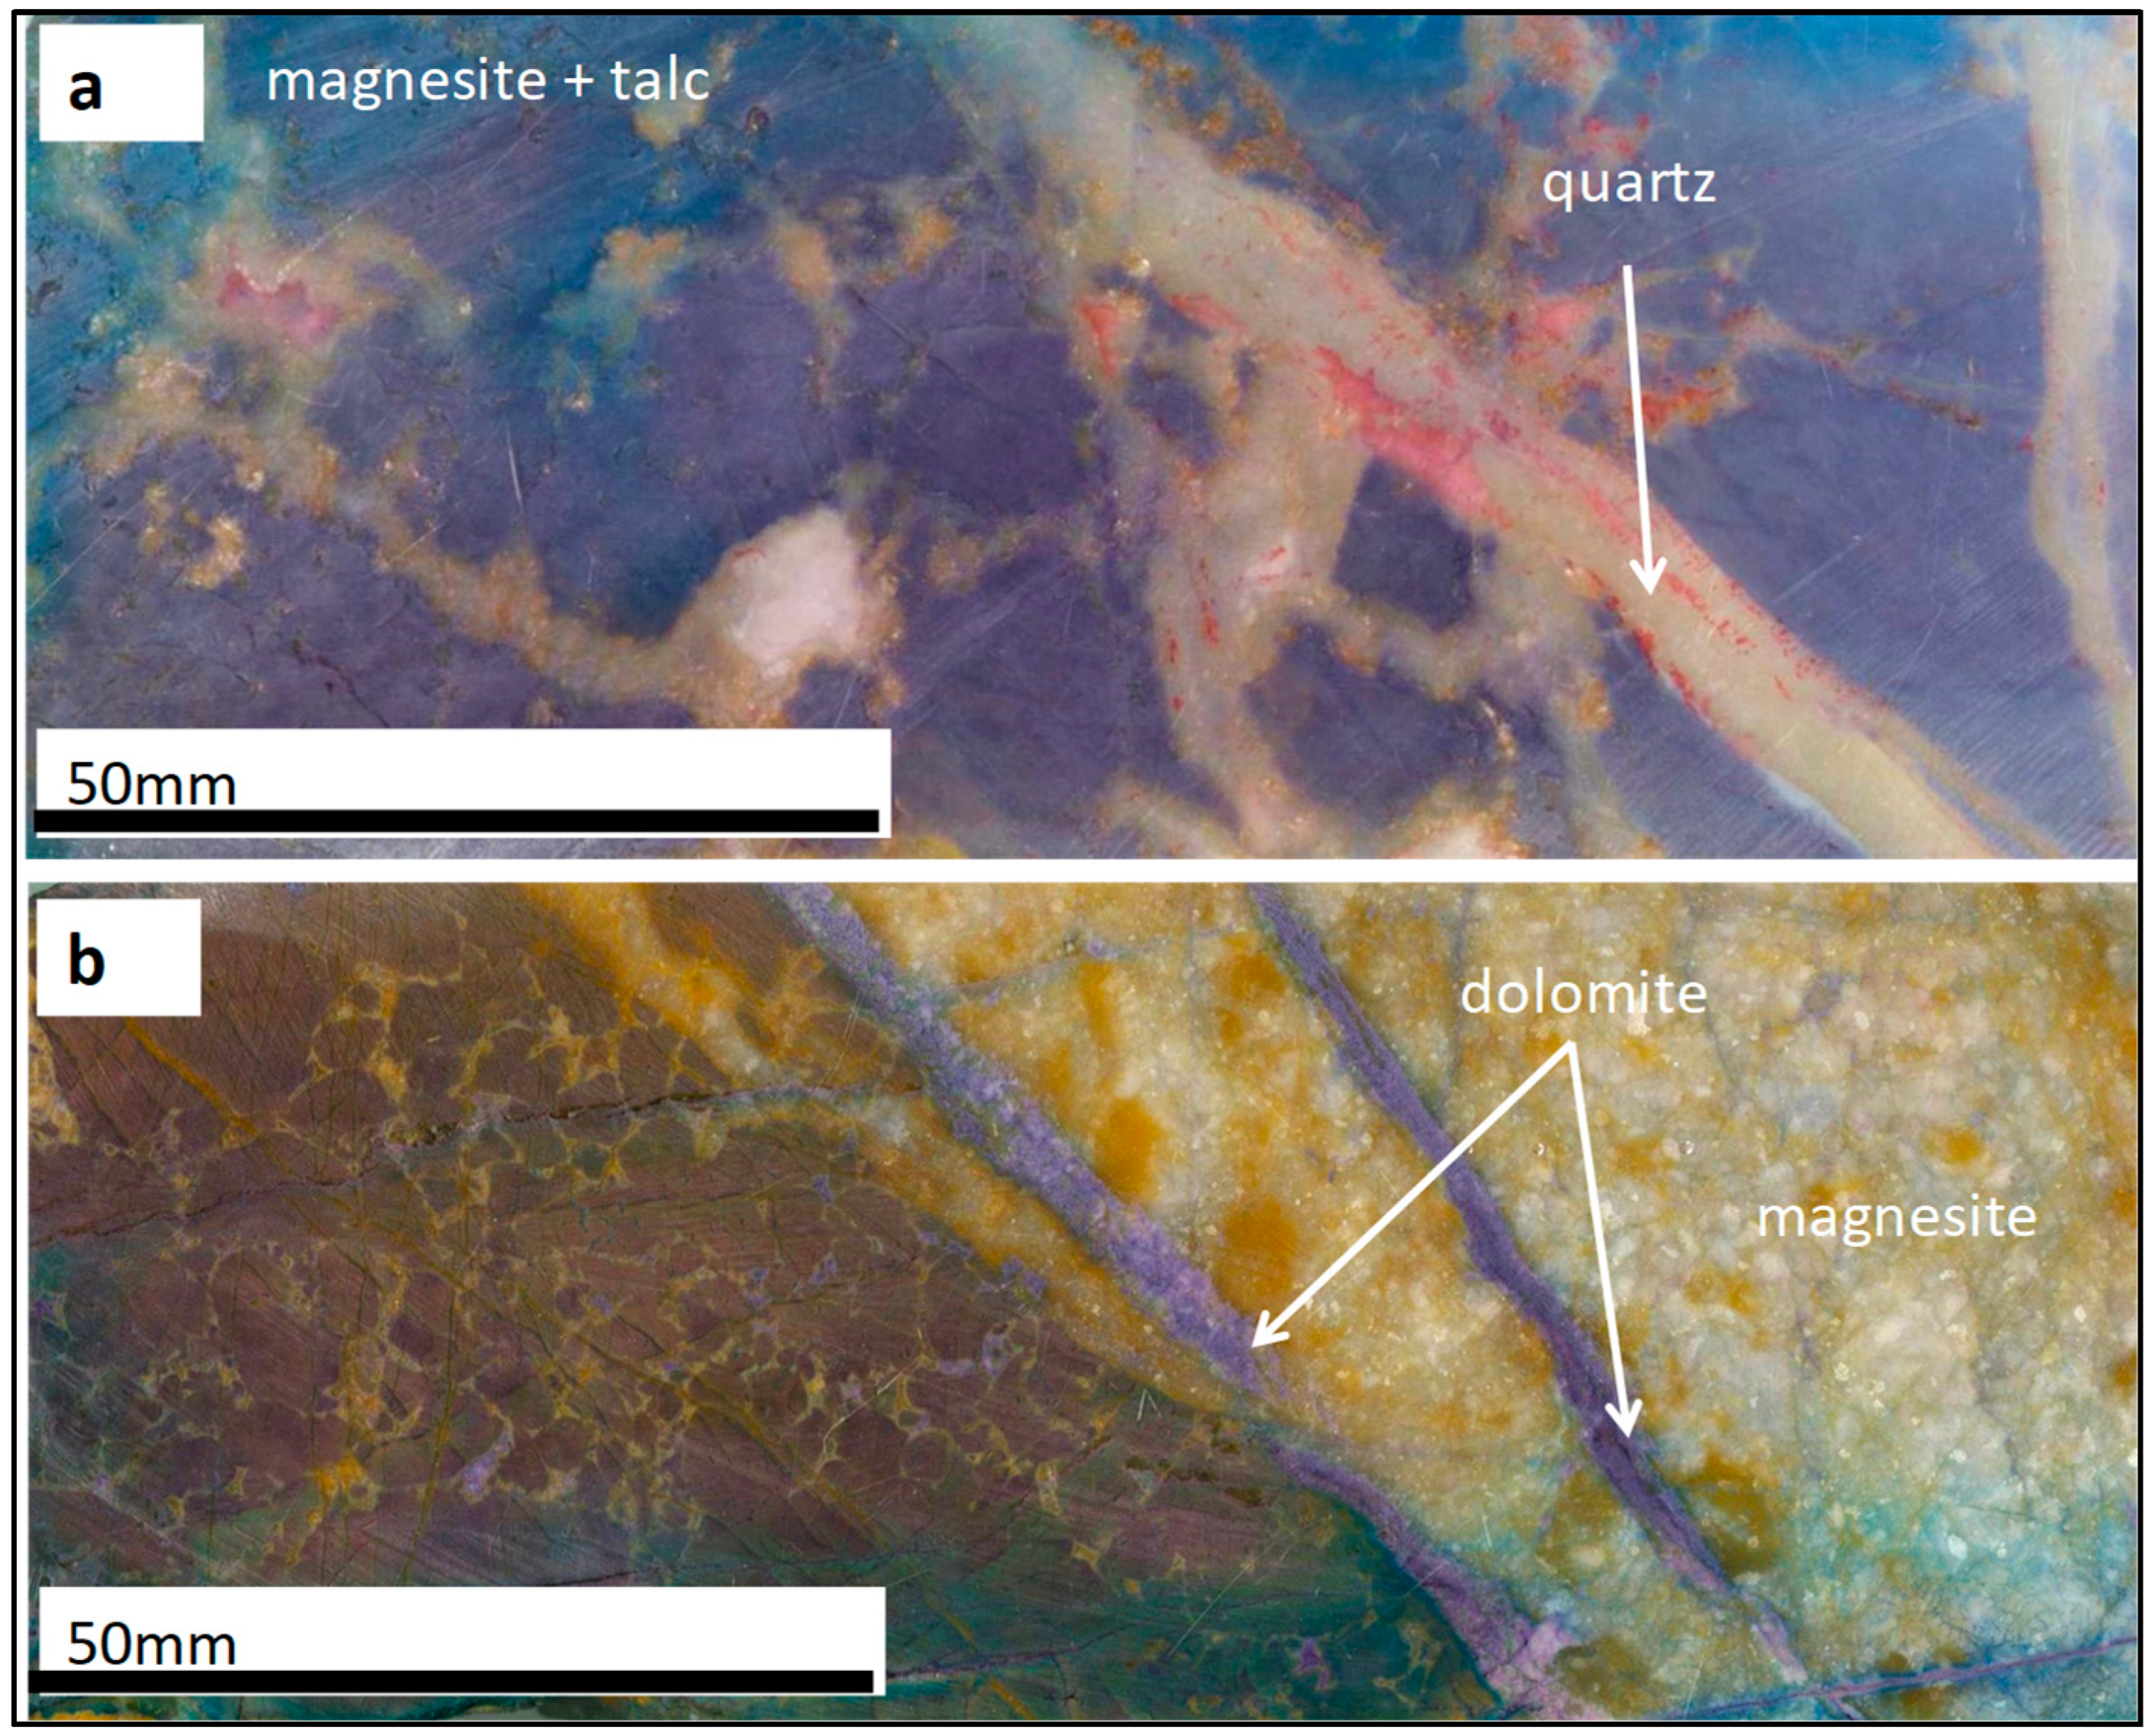
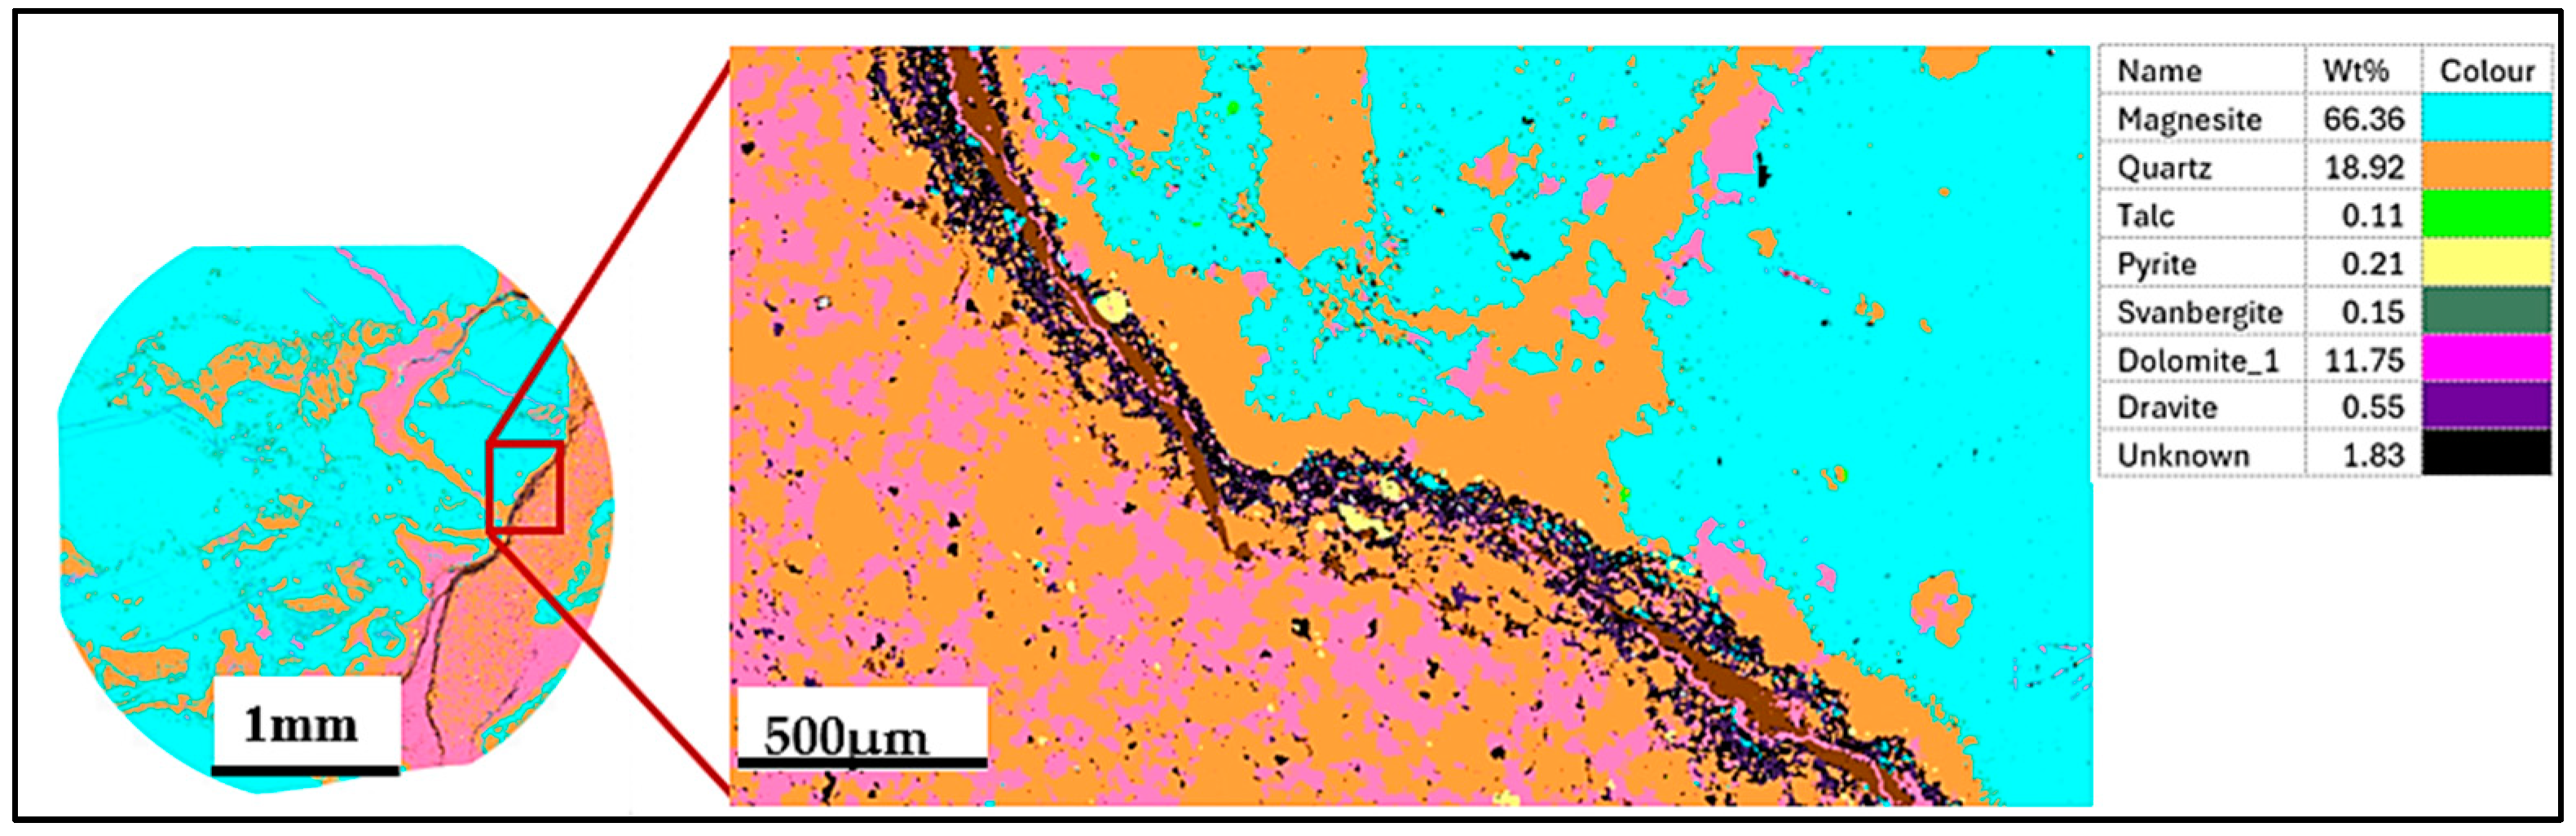
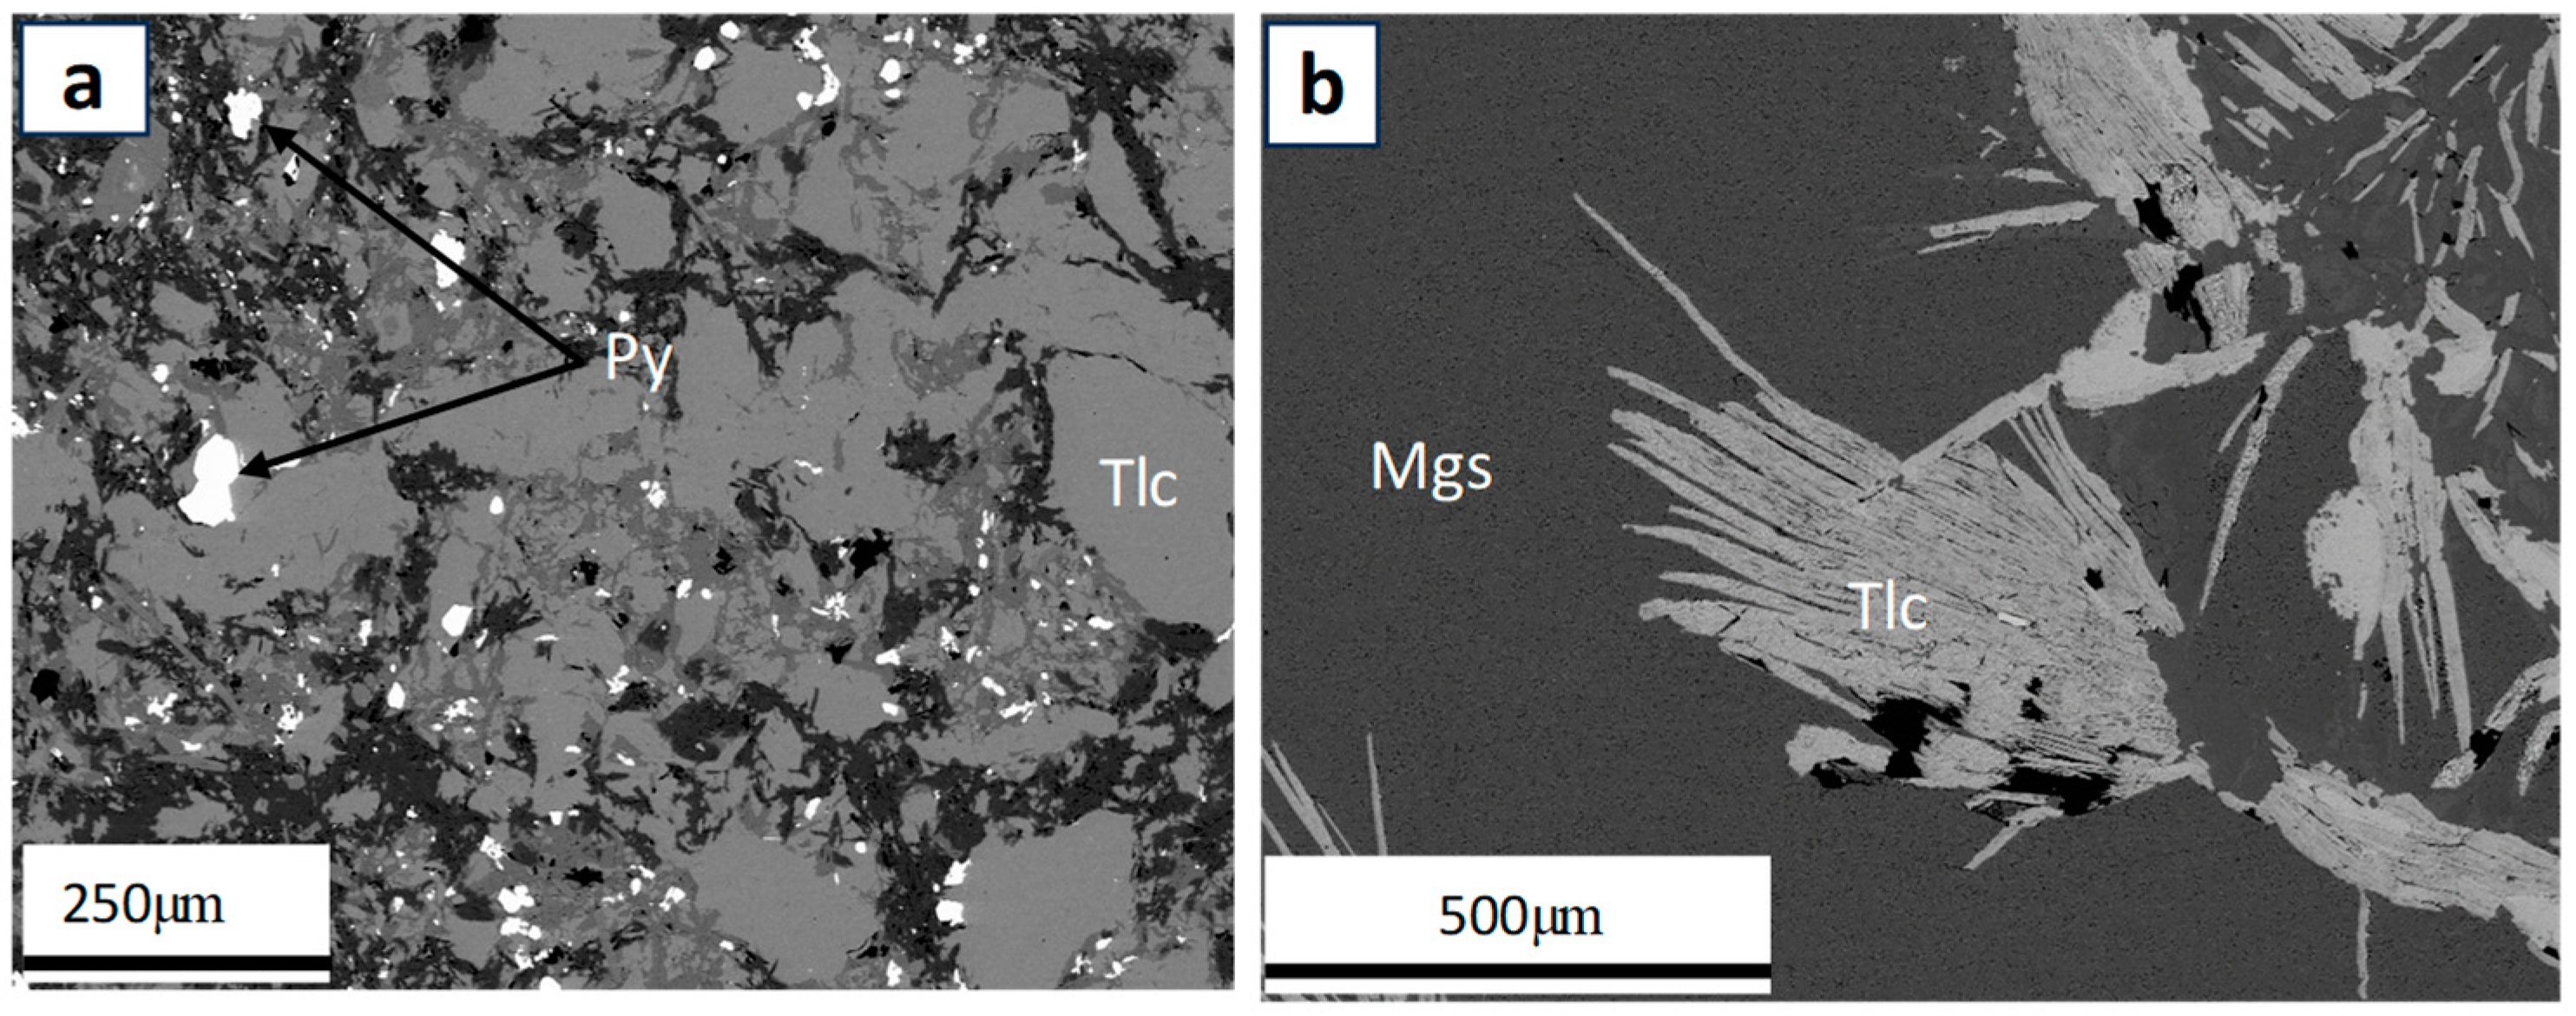
4.2. Ore–Gangue Mineral Composition and Structural–Textural Characteristics

Not much petrographic difference exists between these three ore types. However, from observation under the optical microscope, it is evident that in T1, magnesite looks unweathered and is fine-grained and mostly cemented by either dolomite or quartz (Figure 6a,b). In some cases, quartz may appear as a well-rounded medium to coarse grains dominated by monocrystalline quartz (MQ; Figure 6c). The mineralogy in T1 and T2 appeared similar, with dolomite, quartz, and talc being the main gangue minerals, but in T3, dolomite, pyrite, and quartz are the major gangue minerals with minor talc. Also, magnesite in T3 appears weathered (Figure 7).
In terms of the carbonate staining test on thin sections, stained carbonate minerals did not show any color change under plain polarized light (PPL; Figure 8a), but under cross-polarized light (XPL; Figure 8b), dolomite veins appeared stained (reddish pink) with interference colors, whereas magnesite remained unchanged. The samples of stained drill core behaved differently from stained thin sections where different colors of minerals from royal blue, pink, and purple were seen with some minerals unstained (Figure 9). Interestingly, it was observed that magnesite was stained purple on the T1 core but unstained on the T3 core, while dolomite veins were also stained purple on the T3 core (Figure 9). This could possibly be the influence of talc on the stain solution leading to areas with a mixture of magnesite and talc in the T1 ore appearing as royal blue–HyLogger data indicate high talc content in the T1 ore. It is not clear what caused dolomite veins in the T3 ore drill core to be stained purple, as [39] stated both minerals should not be affected by ARS and potassium ferricyanide unless other elements are present; possibly, these dolomite veins were ferroan dolomite causing the carbonate to stain. Following staining, elemental analysis was performed on the three ore types using LA-ICPMS to further understand the staining results (see below).

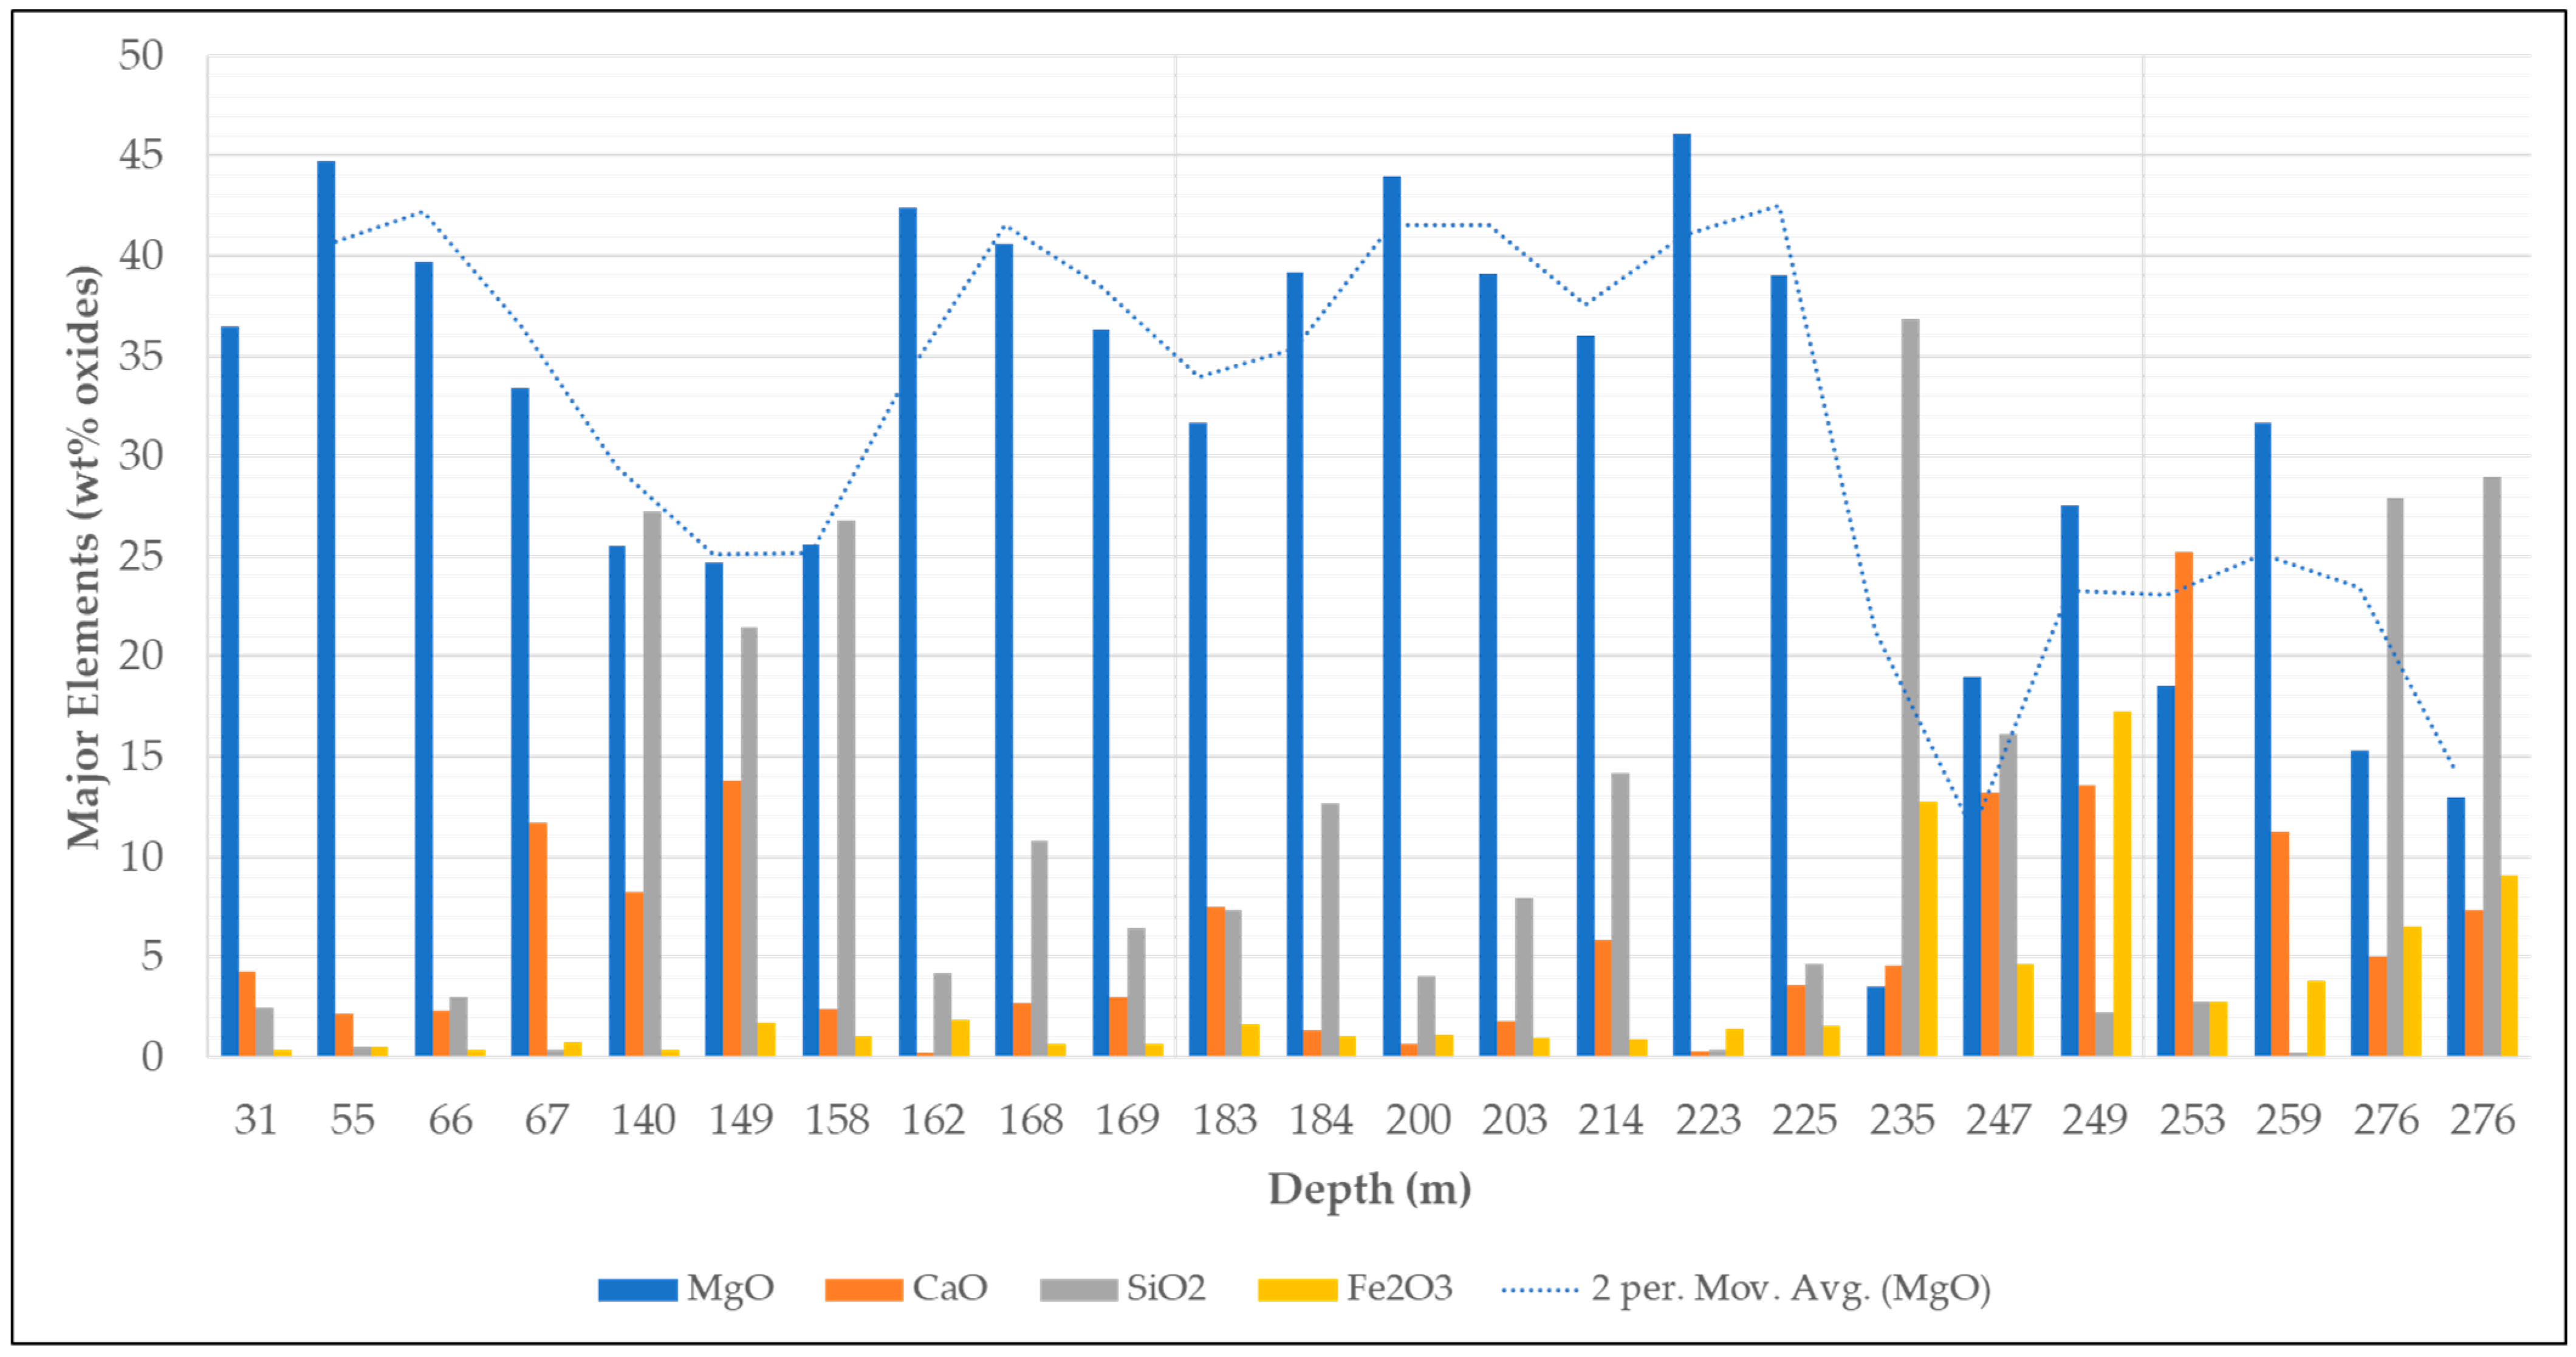
4.3. Chemical Composition of Magnesite Ore

Results from both pXRF and LA-ICPMS spot analyses indicate that the main elemental compositions of all three magnesite ore types include the following: Mg, Al, Si, S, Ca, Mn, Fe, Zn, and Mn. The concentrations of these elements appear to be depth-dependent, with Fe and S contents increasing downhole (Figure 10). The pXRF analysis indicates an average (31% MgO) as the major element which is distributed across the drill hole. A similar case is observed for the laser ablation data where Mg is the major element with a maximum concentration of 28.00% in magnesite in the T2 ore, whereas the T1 and T3 magnesite ores have 27.98% Mg and 27.09% Mg, respectively (Table 3).
In the example shown in Figure 11, from a depth of 55.45 m to 158.46 m, there is a sharp decrease in MgO content (44.7% down to 25.6%), and the CaO and SiO2 increase significantly from 4% up to 13% and 2% up to 21%, respectively at a depth of 31 m to 149 m. This is likely because the magnesite ore has higher associations with dolomite and quartz at that depth, which decreases the grade of Mg. A comparable trend was noted at the end of the drill hole, but here, Fe concentration was relatively high due to a high sulfide concentration on the contact between the ore zone and gangue zone (end of the hole, where rocks were predominantly chlorite and sulfide with MgO below 20% and not considered as magnesite ore).
In general, the zones of the magnesite ore with a high Fe content (pXRF results) were mainly composed of the T3 magnesite ore. This aligns with the LA-ICPMS data where magnesite in the T3 ore is relatively high in Fe (2.06%) and may be responsible for giving the T3 ore the reddish-brown color (Figure 10), whereas for T1 (Fe 0.40%) and T2 (Fe 1.10%), lower amounts of Fe were present. From Table 3, trace element Ni is observed to increase from T1 through to T3 (0.83, 2.08, and 12.34 ppm average concentrations). T3 appears to contain a relatively high concentration of Si of about 0.59%, whereas Si content in T1 and T2 is relatively low (0.29%, 0.03% respectively%). The concentrations of Mo, Ag, Ta, Au, Nb, and Yb were not more than 1.50 ppm and mostly below detection limits. Minor amounts of Al, S, Cr, Mn, and Zn were present with no patterns worth mentioning.
Intact samples of drill cores were analyzed using SEM-based automated mineralogy to study the composition and association properties of gangue minerals with the mineral of interest (magnesite) for mineral processing purposes. A production pathway based on mineralogical studies is highlighted in the Discussion Section. Since all three ore types exhibited similar mineralogical composition, only the T1 results have been shown in this paper. Figure 12 shows an example of the results for a typical T1 sample.
Results indicate that T1 is averagely composed of magnesite (65.2 wt%), dolomite (17.6 wt%), and quartz (15.5 wt%), with minor amounts of talc, ankerite, kaolinite, pyrite, sphalerite, and dravite, which were each less than 1 wt% (Figure 13). The main gangue minerals in all three ore types were dolomite and quartz, with minor amounts of sulfides occurring as pyrite (FeS2), pyrrhotite (Fe1−xS), and sphalerite (ZnS). Interlocking and intergrowth relationships were observed between quartz and dolomite.
All three types seemed to be composed of similar minerals, indicating a fairly simple mineralogy across the Arthur River magnesite deposit. However, during the studies with the backscattered imaging using the SEM, it was observed that the appearance of talc was different within the ore types. Well-preserved fibrous talc with sulfide inclusions occurred in T1, whereas in T2 and T3, deformed talc with pyrite inclusions was observed (Figure 14).
In general (based on the results of nine samples from the three ore types), magnesite is observed as fine-grained, while the particle sizes of the gangue minerals vary from fine-grained to coarse-grained. For instance, quartz generally ranges from fine-grained (20–90 µm) to coarse-grained (1000–3800 µm), while pyrite (25–100 µm) and talc (10–100 µm) are entirely fine-grained.

5. Discussion

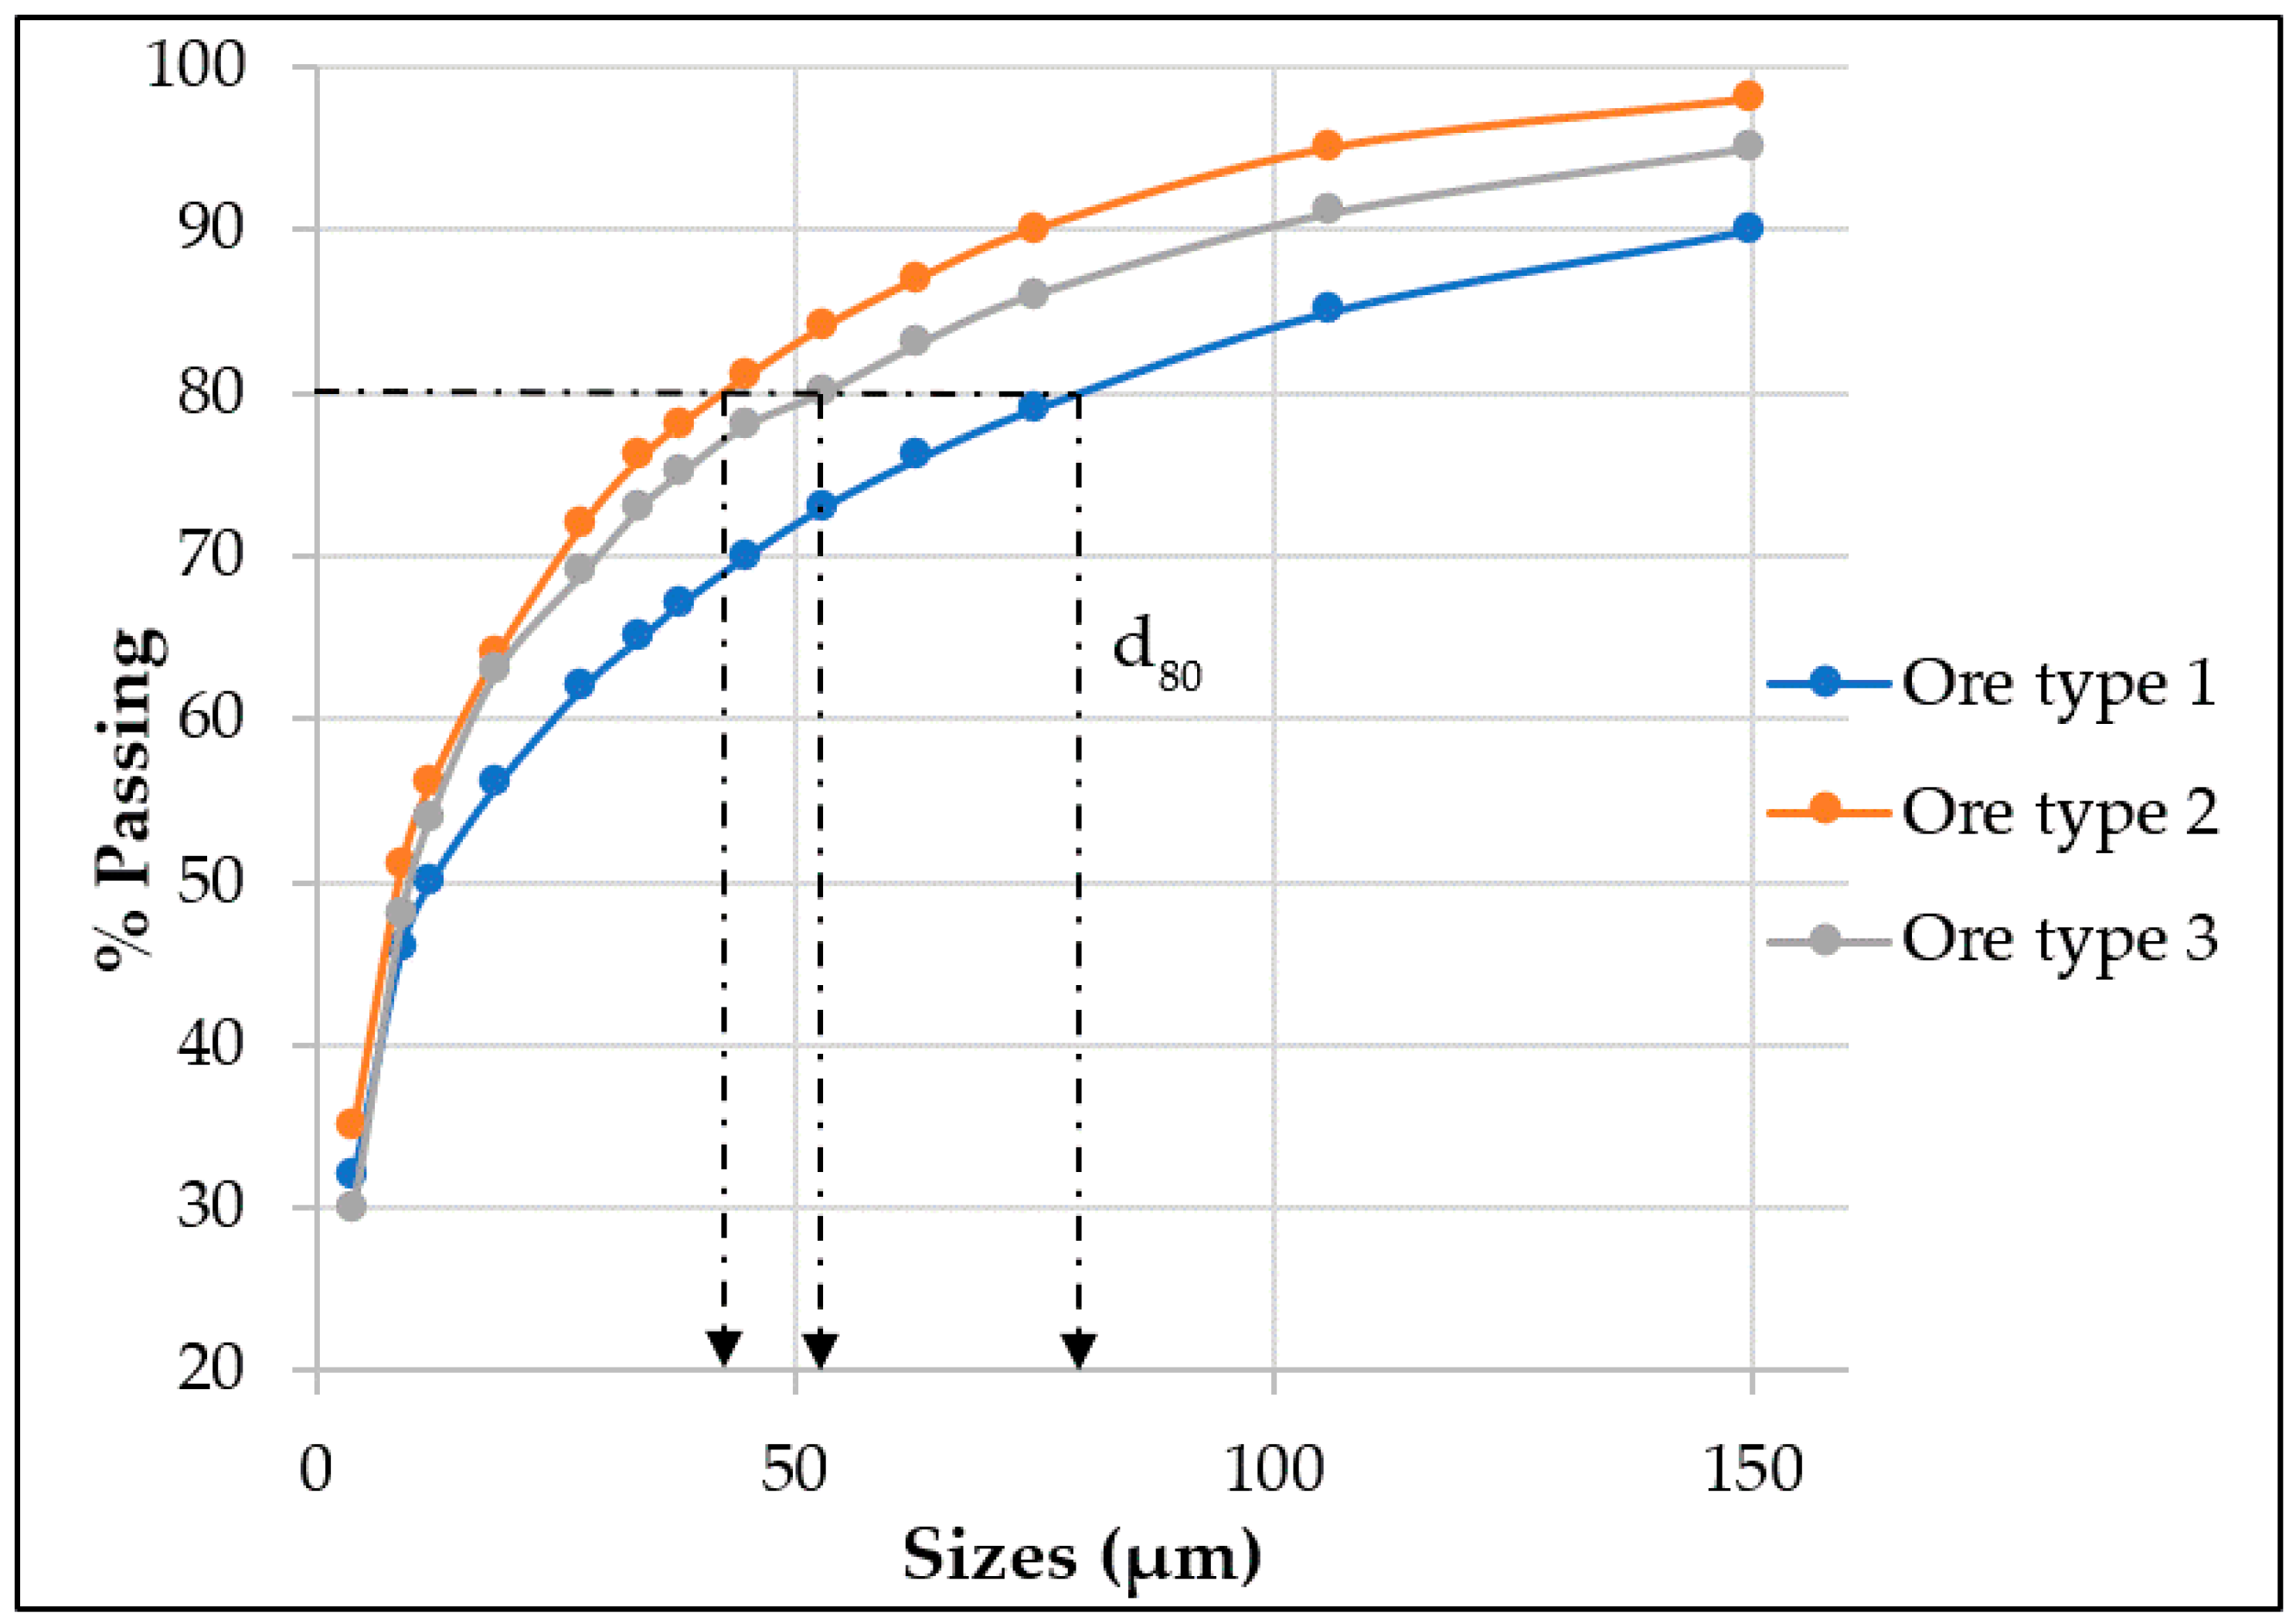
5.1. Particle Size Distribution (PSD)

Three ore types (T1, T2, and T3) were defined based on data from the HyLogger, LA-ICPMS, SEM-AM, and optical microscopy studies. Each ore type varies in terms of mineralogy, chemical composition, and physical properties. Based on these variations within the three ore types, their processing route may also differ. Therefore, this discussion will focus on possible processing routes for each identified ore type. The particle size distribution analyses for 80% passing for the T1, T2 and T3 ore types were 78 µm, 43 µm, and 52 µm, respectively (Figure 15). This indicates a fine particle feed size material for mineral processing. Carbonates are known to be brittle in nature, and their comminution can lead to fines generation even at the crushing stage, which was what led to almost 80% of samples from all three types passing 100 µm after milling. These fines, if not controlled, may impact on flotation recovery curves by the concept of “entrainment”. Entrainment is the transfer of suspended particles (fine/ultrafine particles) into the froth phase, thereby lowering the grade of the concentrate [46]. However, process parameters such as revolution per minute (rpm), feed rate, feed size, and the gap setting of the impact/primary crusher can be optimized to reduce the percentage of fines generated at the crushing stage of the brittle samples [47].

5.2. Liberation

Mineral liberation is an important step in developing a mineral processing workflow which controls the comminution stage of mineral processing. Mineral liberation degree is a concept describing the valuable mineral being separated from others to some degree through size reduction processes by breaking large pieces of ore into smaller particles which are suitable for the subsequent separation process [48]. The liberation degree of magnesite in the T2 magnesite ore was classified based on the surface area of magnesite and the degree of association with gangue minerals at three levels, i.e., mainly liberated (75% < x ≤ 100%), moderately liberated or middlings (50% < x ≤ 75%), and poorly liberated or “locked” (0% < x ≤ 50%: Figure 15). From Figure 16, the majority of the magnesites which were not fully liberated are either associated with quartz or locked in dolomite and/or quartz with only a minor in talc. The mainly liberated magnesite may lead to higher processing efficiencies because the liberated minerals can be more effectively targeted and processed, resulting in better recovery rates and lower processing costs. Conversely, poorly liberated minerals can hinder processing efficiency as they require additional energy and resources to break down the mineral–gangue association, leading to lower recovery rates and potentially higher processing costs.
From the liberation data (Table 4), 93.43% of the magnesite that was liberated was “mainly liberated” with only 3.99% and 2.58% of the magnesite within the moderately liberated “middlings” and poorly liberated “locked” classes, respectively. This revealed that grinding at d80 43 µm could subsequently lead to about 93% of the magnesite being fully liberated, which can be easily recovered via flotation processes. In terms of middlings, since only 3.99% of the magnesite is still in association with quartz and dolomite at d80 43 µm (80% passing—d80), regrinding material to free these portions may not be economical as comminution deals with high energy consumption [49]. Also, the d80 of the magnesite is 64 µm (Table 4), and regrinding could possibly lead to fines and/or ultrafine generations, which could also impact the flotation recovery. The same can be said for the locked magnesite within quartz and dolomite.

5.3. Beneficiation Routes

In this section, the beneficiation routes for each magnesite ore type (Figure 17) will be discussed, focusing on preconcentration using gravity separation, magnetic separation, and flotation. Some reagents commonly used in the flotation of magnesite will also be highlighted.

5.3.1. Type 1 and Type 2 Magnesite Ore

From the mineralogical studies’ results, the T1 ore has an average of 66.36% magnesite with relatively high quartz of about 18.92% and 11% dolomite, making quartz the major gangue mineral in the T1 magnesite ore. Also, the microscopy data from the SEM-AM indicated that T1 contained well-preserved talc minerals, which possibly contributes to the high Si in T1 in addition to quartz. Processing such an ore to produce an upgraded magnesite product would require preconcentration to reject some of these gangue minerals after comminution and before flotation. However, gravity separation as a preconcentration unit may not be feasible for this ore type due to closely related densities between gangues and minerals of interest [50]. For instance, the densities of dolomite and quartz are 2.84 g/cm3 and 2.65 g/cm3, respectively, while magnesite has a density of 3–3.1 g/cm3. According to the concentration criterion, gravity separation is relatively easier when the quotient is greater than 2.5 and becomes relatively difficult or may not be feasible below 1.25 [51]. Nevertheless, a multi-gravity separator (MGS) has been used to separate particles that are very closely related in size. The MGS is suitable for the treatment of fines with a maximum particle size of approximately 0.5 mm [52] but could potentially lead to a significant weight loss after separation [52,53,54]. For instance, [50] obtained a good upgrade of magnesite feed material from 48.57% MgO to 63.9% MgO after rejecting a significant amount of SiO2 in the feed material. In obtaining this, [50] reported a weight loss of 31.75% in feed material after the separation. For this reason, if fines generations are well controlled at the comminution stage, it could potentially lead to minimizing the losses of material at the preconcentration stage with MGS. The spiral concentrator has also been utilized to achieve a complete separation between talc and magnesite at a particle size of <2.5 mm by [55]. They conducted a series of gravity concentrations in an attempt to separate magnesite from talc. The results showed that the spiral concentrator yielded a good result with a maximum MgO of 75% and 49.0% talc, while the jigging machine and concentration table yielded 66.93% and 72.78%, respectively.
The type 2 ore exhibits a similar mineralogy to type 1, but their elemental compositions from the LA-ICPMS have been proven to be different. It contains about 28.00% of Mg, 0.03% of Si, and 1.1% of Fe. Although a similar preconcentration unit can be said for both ore types, due to the relatively higher Fe content in type 2, which is contained in either pyrite or pyrrhotite, a magnetic separator may be employed to remove the pyrrhotite, as it is ferromagnetic [56]. However, the same cannot be said for pyrite, as pyrites are weakly magnetic minerals, and to remove them with a magnetic separator, a strong or high field gradient may be required [56], which may not be economical considering the intensive energy involved in generating a high magnetic field. Pyrite may float either by collector-induced or self-induced hydrophobicity [57,58], and it may be more economical to float the sulfide minerals with a collector (mostly used; xanthate) during the flotation stage. Depressants (organic, inorganic) could also be used to potentially depress these sulfides, but the flotation of such minerals is strongly pH dependent [59]. Pyrites floatability is usually poor under alkaline pH, and therefore, using alkalis such as NaOH, NaCO3, and lime could significantly render pyrites hydrophilic, thereby depressing them. Other inorganic depressants such as cyanide and sodium sulfides have also been utilized for the depression of pyrites [60,61]. Some organic depressants employed in pyrite depression include polysaccharides polymers (starch, dextrin, guar gum, carboxymethyl cellulose, and chitosan), polyacrylamides (PAM), wood extracts (lignosulfonate-based biopolymers), and diethylenetriamine (DETA) [60,62,63].

5.3.2. Type 3 Magnesite Ore

The T3 ore can be considered the most complex ore type for processing compared to the T1 and T2 ores (Figure 17). From the laser ablation, it contains 27.1% of Mg, 0.6% of Si and 2.1% of Fe. The relatively high Fe content in this ore type could significantly impact their beneficiation route. From the backscattered electron microscope studies, sulfides (pyrite and pyrrhotite) were contained in weathered talc. Also, most of the magnesite in this ore type had Fe substitutes, which in some areas appeared to have been altered to ankerite. The preconcentration unit may vary from that of T1 and T2. A high-intensity magnetic separator may be used to remove iron oxides along with some sulfides (pyrrhotite) to upgrade the ore prior to flotation. This stage is essential for this ore type in rejecting gangue minerals and increasing the magnesite grade before flotation.
The centrifugal gravity concentrator is one of the most common gravity separators used for fine particle separation. The Falcon and the Knelson concentrators are the most utilized centrifugal concentrators [64]. A rotating bowl generates a centrifugal force where heavy minerals (specific gravity > 4 g/cm3) are trapped against the groves of the rotating bowl and become the gravity concentrate, while lower specific gravity material is carried along with the flowing fluid as gravity tails [65]. The specific gravity for pyrite and pyrrhotite is 5 g/cm3 and 4.58–4.65 g/cm3, respectively. Considering the relatively high content of pyrites in the type 3 magnesite ore, they may be rejected using either the Knelson or Falcon concentrators to remove a significant portion of the sulfides, but with this method, the tails will be the concentrate, while the concentrate (heavy minerals) becomes the tails. This can be carried out in a semi-continuous mode where the tails can be periodically washed to achieve maximum efficiency.

5.3.3. Flotation

Following preconcentration, flotation might be the subsequent phase. Upgraded materials from the preconcentration unit could be further upgraded via flotation with appropriate reagents. The flotation separation of Mg carbonates from other minerals (sulfides, talc, and quartz) is relatively less difficult compared with their separation from other carbonate minerals such as calcite and dolomite [66]. This is mainly because these minerals exhibit similar physical, surface, and chemical properties, which could impact the selectivity of collectors during flotation [67]. For example, sodium oleate (anionic collector) is one of the most studied anionic collectors for flotation and has been used for dolomite flotation; however, its selectivity between magnesite and dolomite is very low when used alone [67]. Due to the low selectively of anionic collectors, modifiers and depressants are used to either enhance collector action or reject unwanted minerals. Water glass, monohydric alcohols, and ferric silicate hydrosol are examples of modifiers commonly used for magnesite flotation. Dodecylamine (DDA), carboxymethylcellulose (CMC), and citric acid have been successfully used in the separation of magnesite from dolomite. Ref. [68] investigated the use of DDA as a collector to separate quartz and dolomite from magnesite in the presence of monosodium phosphate (MSP) as a regulator during reverse flotation. From their results, an optimum pH of 8 was achieved for magnesite separation from dolomite and quartz. At dosages of 30 mg/L of DDA and 12 mg/L of MSP, the contact angles of quartz, dolomite, and magnesite were 81–84°, 81°, and 31–35°, respectively. Their respective recoveries were also 14.24%, 29.16%, and 85.38. A novel flotation depressant, gellan gum (GG) was examined by [67] in an effort to separate magnesite from dolomite. Their findings indicated that GG significantly inhibited the floatability of dolomite while exerting a minimal effect on magnesite flotation.
Associations with talc are seen to be prominent in T1 and T3 magnesite ores from the optical microscopy studies and automated mineralogy studies. Talc is known to present challenges during magnesite flotation, contributing to the presence of slimes during comminution due to their soft nature [55]. However, talc can be floated easily in a collector-less flotation with a frother because of its naturally hydrophobic properties [69,70]. The natural floatability of talc is closely related to its three-layer sheet crystal structure [71]. Hence, talc may be easily removed with quartz during flotation with silicate depressants such as sodium silicate. The contact angle of talc after treatment with sodium silicate changes from ~80° to 66.57° with atoms which replace Si in the tetrahedral layer, thereby impacting the natural hydrophobicity of talc [72]. Reverse flotation with cationic collectors could be a potential flotation route for the T1 magnesite ore due to its relatively higher Si content (4.6%). Flotigam EDA and pentaethoxylated lauryl amine (PEOLA) have been discussed by other authors to be effective for quartz flotation [73]. For instance, ref. [14] achieved an excellent flotation selectivity for quartz against magnesite with 50 mg/L of PEOLA. Almost 95.50% of quartz was removed and 96.50% of magnesite was recovered, realizing an efficient separation at a pH of 6.00.

6. Conclusions

The Arthur River magnesite deposit in Tasmania has been thoroughly characterized to assess its potential for magnesium production. Based on physical, chemical, and mineralogical variations, three distinct ore types were identified, each presenting unique challenges for processing. The following conclusions outline the key findings and recommendations for potential beneficiation routes.
  • The preliminary characterization of the Arthur River magnesite deposit reveals that this deposit could be exploited for Mg critical metal production potential in Tasmania. However, the ore is closely associated with dolomite gangue. Consequently, the comprehensive study of potential ore processing routes is imperative to effectively separate magnesite from dolomite and enhance ore quality.
  • Given the substantial ore body variations indicated by geochemical data, diverse ore types may necessitate distinct preconcentration beneficiation pathways. For example, the desirable standard for magnesite concentrate typically encompasses 40%–45% MgO, <5% SiO2, <2% CaO, 1%–2% Fe2O3, 0.05%–0.5% MnO, and 0.01%–0.1% TiO2. Ore type 1 might readily undergo flotation for the separation of calcium-bearing minerals (such as dolomite and calcite) from magnesite, meeting the specified standards without preconcentration methods like gravity or magnetic separation. However, ore types 2 and 3 may necessitate a clearly defined preconcentration step before flotation to achieve the desired outcomes.
  • The petrographic studies with the optical microscope revealed that ore type 3 may be the challenging ore type for mineral processing, as a pre-flotation stage may be required to remove the pyrite before the commencement of the main flotation stream. Also, given that the mineralogy of ore type 1 and 2 are similar, the same processing route could be applied to both ore types to recover magnesite from dolomite, quartz, and talc.

Author Contributions

Conceptualization, A.A.A.A. and J.H.; Methodology, A.A.A.A., J.H., M.F. and O.P.M.; Investigation, A.A.A.A., J.H., M.F., O.P.M., W.H., I.B. and V.K.-S.; Data Curation, A.A.A.A., J.H., M.F., O.P.M., I.B., V.K.-S. and M.W.; Resources, M.W.; Writing—Original Draft, A.A.A.A.; Writing, Review and Editing, A.A.A.A., J.H., M.F., O.P.M., W.H., I.B., V.K.-S. and M.W.; Supervision, J.H., M.F. and O.P.M.; Funding Acquisition, J.H. All authors have read and agreed to the published version of the manuscript.

Funding

The authors acknowledge support from the project ‘Building capacity in Regional Australia to enhance Australia’s Economy through research, training, and environmentally sustainable production of critical metals’, a Regional Research Collaboration (RRC) project supported by the Australian Government Department of Education.

Data Availability Statement

All data presented in this study are available upon contact with the corresponding author.

Acknowledgments

The authors world like to thank the staff at MRT (Ralph Bottrill, Andrew McNeil, David Green, Jake Moltzen and Steve Newett) for access to older Arthur River deposit drill holes, and for data collection and data reduction on HyLogger facilities, the professional staff at CODES (Karen Huizing, Jonathon Traynor and Helen Scott) for all their help with travel, finance and logistics, the CODES Analytical Laboratories (Jeffrey Oalmann, Sebastian Meffre and Alexander Cuison) and Central Science Laboratories (Sandrin Feig and Karsten Goemann) at the University of Tasmania for their help with sample preparation and analyses. We appreciate the Australian Government Department of Education’s Regional Research Collaboration Program for funding this research and GWR group (Teck Wong and William Moore) for their support. Finally, all authors would like to acknowledge other research students from the RRC project for their moral support and scientific insights.

Conflicts of Interest

The authors declare that they have no known conflicts of interest. Author Mick Wilson was employed by the company GWR Group Limited, a company involved in the ‘Building capacity in Regional Australia to enhance Australia’s Economy through research, training, and environmentally sustainable production of critical metals’ project through a non-financial agreement. The remaining authors declare that the research was conducted in the absence of any commercial or financial relationships that could be construed as a potential conflict of interest.

References

  1. Tan, J.; Ramakrishna, S. Applications of magnesium and its alloys: A review. Appl. Sci. 2021, 11, 6861. [Google Scholar] [CrossRef]
  2. Hycnar, E.; Sęk, M.; Ratajczak, T. Magnesite as a Sorbent in Fluid Combustion Conditions—Role of Magnesium in SO2 Sorption Process. Minerals 2023, 13, 442. [Google Scholar] [CrossRef]
  3. Drnek, T.L.; Moraes, M.N.; Neto, P.B. Overview of magnesite. J. Refract. Innov. RHIM Bull. 2018, 1, 14–22. [Google Scholar]
  4. Coyne, J. Magnesium Market Highlights Continuing Fragility of Global Supply Chains; Australian Strategic Policy Institute: Barton, Australia, 2022. [Google Scholar]
  5. Government of Australia. Critical minerals at Geoscience Australia. Available online: https://www.ga.gov.au/scientific-topics/minerals/critical-minerals (accessed on 26 April 2023).
  6. Burton, J. U.S. Geological Survey Releases 2022 List of Critical Minerals. Available online: https://www.usgs.gov/news/national-news-release/us-geological-survey-releases-2022-list-critical-minerals (accessed on 7 May 2024).
  7. European Commission. Critical Raw Materials. Available online: https://single-market-economy.ec.europa.eu/sectors/raw-materials/areas-specific-interest/critical-raw-materials_en (accessed on 7 May 2024).
  8. Government of Australia. Australian Critical Minerals Prospectus. Available online: https://www.globalaustralia.gov.au/sites/default/files/2024-01/ATIC_Australian_Critical_Minerals_Jan_2024.pdf (accessed on 7 May 2024).
  9. Feng, G.; Nie, Z.-R.; Wang, Z.-H.; Gong, X.-Z.; Zuo, T.-Y. Assessing environmental impact of magnesium production using Pidgeon process in China. Trans. Nonferrous Met. Soc. China 2008, 18, 749–754. [Google Scholar] [CrossRef]
  10. Du, J.; Han, W.; Peng, Y. Life cycle greenhouse gases, energy and cost assessment of automobiles using magnesium from Chinese Pidgeon process. J. Clean. Prod. 2010, 18, 112–119. [Google Scholar] [CrossRef]
  11. Ramakrishnan, S.; Koltun, P. A comparison of the greenhouse impacts of magnesium produced by electrolytic and Pidgeon processes. Essent. Read. Magnes. Technol. 2016, 169–174. [Google Scholar] [CrossRef]
  12. Sun, W.; Liu, W.; Liu, W.; Li, P.; Shen, Y.; Dai, S. Utilization of a novel bisphosphonic acid surfactant for reverse froth flotation of magnesite and dolomite. Miner. Eng. 2022, 185, 107668. [Google Scholar] [CrossRef]
  13. Luo, N.; Shi, J.; Yan, B.; Wang, X. Flotation Separation of Magnesite from Dolomite Using Sodium Silicate Modified with Zinc Sulfate as a Selective Depressant. Minerals 2024, 14, 355. [Google Scholar] [CrossRef]
  14. Yang, B.; Yin, W.; Yao, J.; Zhu, Z.; Sun, H.; Chen, K.; Cao, S. Selective collection and differential adsorption of pentaethoxylated laurylamine for the flotation recovery of magnesite from quartz. Colloids Surf. A Physicochem. Eng. Asp. 2021, 625, 126991. [Google Scholar] [CrossRef]
  15. Sun, W.; Dai, S.; Liu, W.; Li, P.; Duan, H.; Yu, X. Effect of Ca (II) on anionic/cationic flotation of magnesite ore. Miner. Eng. 2021, 163, 106778. [Google Scholar] [CrossRef]
  16. Liu, W.; Liu, W.; Dai, S.; Yang, T.; Li, Z.; Fang, P. Enhancing the purity of magnesite ore powder using an ethanolamine-based collector: Insights from experiment and theory. J. Mol. Liq. 2018, 268, 215–222. [Google Scholar] [CrossRef]
  17. ASX Announcements. GWR Completes Acquisition of Advanced Magnesium Project. Available online: https://wcsecure.weblink.com.au/pdf/GWR/02495658.pdf (accessed on 8 May 2024).
  18. Rawlinson, N.; Tkalčić, H.; Reading, A.M. Structure of the Tasmanian lithosphere from 3D seismic tomography. Aust. J. Earth Sci. 2010, 57, 381–394. [Google Scholar] [CrossRef]
  19. Green, G.R. Ore deposits and metallogenesis of Tasmania. Epis. J. Int. Geosci. 2012, 35, 205–215. [Google Scholar] [CrossRef]
  20. Turner, N.; Bottrill, R. Blue amphibole, Arthur Metamorphic Complex, Tasmania: Composition and regional tectonic setting. Aust. J. Earth Sci. 2001, 48, 167–181. [Google Scholar] [CrossRef]
  21. Perry, O.C. A Geophysical and Geological Study of the Arthur River Magnesite Deposit, Northwest Tasmania; University of Tasmania: Hobart, Australia, 2011; unpublished. [Google Scholar]
  22. Frost, M. The magnesite deposit at Main Creek, Savage River, Tasmania. Econ. Geol. 1982, 77, 1901–1911. [Google Scholar] [CrossRef]
  23. Broker, A. Red Rock Resources plc. Red. 2005. Available online: https://www.rrrplc.com/wp-content/uploads/2017/06/Admission-Prospectus_290705_RRR.pdf (accessed on 18 November 2024).
  24. Holm, O.; Berry, R. Structural history of the Arthur Lineament, northwest Tasmania: An analysis of critical outcrops. Aust. J. Earth Sci. 2002, 49, 167–185. [Google Scholar] [CrossRef]
  25. Banks, M.I. The Geological History of Tasmania with Special Reference to Events During the Palaeozoic Era. Ph.D. Thesis, University of Tasmania, Hobart, Australia, 1954. [Google Scholar]
  26. Bradley, J. The Geology of the West Coast Range of Tasmania. In Papers and Proceedings of the Royal Society of Tasmania; Palala Press: London, UK, 1954; Volume 88, pp. 193–244. [Google Scholar] [CrossRef]
  27. Urquhart, G. Magnetite Deposits of the Savage River-Rocky River Region; Tasmania Department of Mines: Burnie, Tasmania, 1966.
  28. Dickson, T.W. Arthur river and lyons river magnesite deposits. In Geology of Australian and Papua New Guinean Mineral Deposits; Berkman, D.A., MacKenzie, D.H., Eds.; Australasian Institute of Mining and Metallurgy: Melbourne, Australia, 1990; pp. 1181–1183. [Google Scholar]
  29. Spate, A. Magnesite karst in Tasmania. Available online: https://ackma.org (accessed on 18 November 2024).
  30. Mikkelsen, L.; Moesgaard, K.; Hegnauer, M.; Lopez, A.D. ANACONDA: A new tool to improve mortality and cause of death data. BMC Med. 2020, 18, 61. [Google Scholar] [CrossRef]
  31. Gwynn, X.; Brown, M.; Mohr, P. Combined use of traditional core logging and televiewer imaging for practical geotechnical data collection. In Proceedings of the Slope Stability 2013: Proceedings of the 2013 International Symposium on Slope Stability in Open Pit Mining and Civil Engineering, Brisbane, Australia, 25–27 September 2013; Australian Centre for Geomechanics: Crawley, Australia, 2013; pp. 261–272. [Google Scholar] [CrossRef]
  32. Fresia, B.; Ross, P.-S.; Gloaguen, E.; Bourke, A. Lithological discrimination based on statistical analysis of multi-sensor drill core logging data in the Matagami VMS district, Quebec, Canada. Ore Geol. Rev. 2017, 80, 552–563. [Google Scholar] [CrossRef]
  33. Schodlok, M.; Whitbourn, L.; Huntington, J.; Mason, P.; Green, A.; Berman, M.; Coward, D.; Connor, P.; Wright, W.; Jolivet, M. HyLogger-3, a visible to shortwave and thermal infrared reflectance spectrometer system for drill core logging: Functional description. Aust. J. Earth Sci. 2016, 63, 929–940. [Google Scholar] [CrossRef]
  34. Geologist, T.S. Unlocking the Secrets of The Spectral Geologist (TSG). Available online: https://spectralgeo.com.au/the-spectral-geologist-tsg-software (accessed on 8 May 2024).
  35. Barber, D.; Wenk, H.-R. Deformation twinning in calcite, dolomite, and other rhombohedral carbonates. Phys. Chem. Miner. 1979, 5, 141–165. [Google Scholar] [CrossRef]
  36. Lacombe, O.; Parlangeau, C.; Beaudoin, N.E.; Amrouch, K. Calcite twin formation, measurement and use as stress–strain indicators: A review of progress over the last decade. Geosciences 2021, 11, 445. [Google Scholar] [CrossRef]
  37. Friedman, G.M. Identification of carbonate minerals by staining methods. J. Sediment. Res. 1959, 29, 87–97. [Google Scholar] [CrossRef]
  38. Dickson, J. A modified staining technique for carbonates in thin section. Nature 1965, 205, 587. [Google Scholar] [CrossRef]
  39. Dickson, J. Carbonate identification and genesis as revealed by staining. J. Sediment. Res. 1966, 36, 491–505. [Google Scholar] [CrossRef]
  40. Bruker AMICS Automated Mineralogy System for SEM. Available online: https://www.bruker.com/en/products-and-solutions/elemental-analyzers/eds-wds-ebsd-SEM-Micro-XRF/software-amics-automated-mineralogy-system.html (accessed on 11 March 2024).
  41. Jochum, K.P.; Weis, U.; Stoll, B.; Kuzmin, D.; Yang, Q.; Raczek, I.; Jacob, D.E.; Stracke, A.; Birbaum, K.; Frick, D.A. Determination of reference values for NIST SRM 610–617 glasses following ISO guidelines. Geostand. Geoanal. Res. 2011, 35, 397–429. [Google Scholar] [CrossRef]
  42. GeoRem. GeoReM Preferred Values. Available online: http://georem.mpch-mainz.gwdg.de/ (accessed on 20 September 2024).
  43. Longerich, H.P.; Jackson, S.E.; Günther, D. Inter-laboratory note. Laser ablation inductively coupled plasma mass spectrometric transient signal data acquisition and analyte concentration calculation. J. Anal. At. Spectrom. 1996, 11, 899–904. [Google Scholar] [CrossRef]
  44. Norris, A.; Danyushevsky, L. Towards Estimating the Complete Uncertainty Budget of Quantified Results Measured by LA-ICP-MS; Goldschmidt: Boston, MA, USA, 2018. [Google Scholar]
  45. Green, D.; Schodlok, M. Characterisation of carbonate minerals from hyperspectral TIR scanning using features at 14,000 and 11,300 nm. Aust. J. Earth Sci. 2016, 63, 951–957. [Google Scholar] [CrossRef]
  46. Wang, L.; Peng, Y.; Runge, K.; Bradshaw, D. A review of entrainment: Mechanisms, contributing factors and modelling in flotation. Miner. Eng. 2015, 70, 77–91. [Google Scholar] [CrossRef]
  47. Eswaraiah, C.; Gupta, A.; Nagarajan, R.; Rajavel, M.; Nandakumar, K. Minimization of fines generation in size reduction of coals by impact crusher. Fuel Process. Technol. 2008, 89, 704–714. [Google Scholar] [CrossRef]
  48. Mariano, R.; Evans, C.; Manlapig, E. Definition of random and non-random breakage in mineral liberation—A review. Miner. Eng. 2016, 94, 51–60. [Google Scholar] [CrossRef]
  49. Tromans, D. Mineral comminution: Energy efficiency considerations. Miner. Eng. 2008, 21, 613–620. [Google Scholar] [CrossRef]
  50. Erdogan, N. The Best Suitable Beneficiation Method for Magnesite Ore. Organ. Comm. Honor. Chair 2017, 265. Available online: https://www.researchgate.net/publication/380637989_The_best_suitable_beneficiation_method_for_magnesite_ore (accessed on 18 November 2024).
  51. Burt, R. Gravity concentration methods. In Mineral Processing Design; Springer: Dordrecht, The Netherlands, 1987; pp. 106–137. [Google Scholar] [CrossRef]
  52. Roy, S. Recovery improvement of fine iron ore particles by multi gravity separation. Open Miner. Process. J. 2009, 2, 17–30. [Google Scholar] [CrossRef]
  53. Ozbayoglu, G.; Atalay, M.Ü. Beneficiation of bastnaesite by a multi-gravity separator. J. Alloys Compd. 2000, 303, 520–523. [Google Scholar] [CrossRef]
  54. Falconer, A. Gravity separation: Old technique/new methods. Phys. Sep. Sci. Eng. 2003, 12, 31–48. [Google Scholar] [CrossRef]
  55. Hojamberdiev, M.; Arifov, P.; Tadjiev, K.; Yunhua, X. Characterization and processing of talc-magnesite from the Zinelbulak deposit. Min. Sci. Technol. 2010, 20, 415–420. [Google Scholar] [CrossRef]
  56. Gaudin, A.; Spedden, H. Magnetic separation of sulphide minerals. AIME Trans. 1943, 153, 563–575. [Google Scholar]
  57. Mu, Y.; Peng, Y.; Lauten, R.A. The depression of pyrite in selective flotation by different reagent systems—A Literature review. Miner. Eng. 2016, 96, 143–156. [Google Scholar] [CrossRef]
  58. Ozun, S.; Hassas, B.V.; Miller, J.D. Collectorless flotation of oxidized pyrite. Colloids Surf. A Physicochem. Eng. Asp. 2019, 561, 349–356. [Google Scholar] [CrossRef]
  59. Hicyilmaz, C.; Altun, N.E.; Ekmekci, Z.; Gokagac, G. Pyrite–DTPI interaction as a function of pulp potential and pH. Colloids Surf. A Physicochem. Eng. Asp. 2004, 233, 11–24. [Google Scholar] [CrossRef]
  60. Guo, B.; Peng, Y.; Parker, G. Electrochemical and spectroscopic studies of pyrite–cyanide interactions in relation to the depression of pyrite flotation. Miner. Eng. 2016, 92, 78–85. [Google Scholar] [CrossRef]
  61. Todd, E.; Sherman, D.; Purton, J. Surface oxidation of pyrite under ambient atmospheric and aqueous (pH = 2 to 10) conditions: Electronic structure and mineralogy from X-ray absorption spectroscopy. Geochim. Cosmochim. Acta 2003, 67, 881–893. [Google Scholar] [CrossRef]
  62. Ahmadi, M.; Gharabaghi, M.; Abdollahi, H. Effects of type and dosages of organic depressants on pyrite floatability in microflotation system. Adv. Powder Technol. 2018, 29, 3155–3162. [Google Scholar] [CrossRef]
  63. Zhang, X.; Wang, X.; Li, Y.; Han, Y.; Gu, X.; Wang, S. Adsorption mechanism of a new depressant on pyrite surfaces and its application to the selective separation of chalcopyrite from pyrite. Colloids Surf. A Physicochem. Eng. Asp. 2021, 625, 126892. [Google Scholar] [CrossRef]
  64. Chen, Q.; Yang, H.-Y.; Tong, L.-L.; Niu, H.-Q.; Zhang, F.-S.; Chen, G.-M. Research and application of a Knelson concentrator: A review. Miner. Eng. 2020, 152, 106339. [Google Scholar] [CrossRef]
  65. McLeavy, M.J. Continuous Centrifugal Concentrator Operation and Control. Ph.D. Thesis, University of British Columbia, Vancouver, BC, Canada, 2005. [Google Scholar] [CrossRef]
  66. Zhu, Z.; Wang, D.; Yang, B.; Yin, W.; Ardakani, M.S.; Yao, J.; Drelich, J.W. Effect of nano-sized roughness on the flotation of magnesite particles and particle-bubble interactions. Miner. Eng. 2020, 151, 106340. [Google Scholar] [CrossRef]
  67. Wang, L.; Li, Z.; Zhang, H.; Huang, L.; Zhu, Y.; Li, F. Flotation separation of magnesite from dolomite with gellan gum as depressant and its depression mechanism. Miner. Eng. 2024, 212, 108718. [Google Scholar] [CrossRef]
  68. Sun, H.; Yin, W.; Yang, B.; Han, F. Simultaneous separation of quartz and dolomite from magnesite using monosodium phosphate as a regulator via reverse flotation. Miner. Eng. 2021, 172, 107185. [Google Scholar] [CrossRef]
  69. Leterme, P.; Gayot, A.; Finet, G.; Bizi, M.; Flament, M. Influence of the morphogranulometry and hydrophobicity of talc on its antisticking power in the production of tablets. Int. J. Pharm. 2005, 289, 109–115. [Google Scholar] [CrossRef] [PubMed]
  70. Ann Bazar, J.; Rahimi, M.; Fathinia, S.; Jafari, M.; Chipakwe, V.; Chehreh Chelgani, S. Talc flotation—An overview. Minerals 2021, 11, 662. [Google Scholar] [CrossRef]
  71. Brezáni, I.; Zeleňák, F.; Zeleňák, M. Collectorless flotation of talc-magnesite ore with respect to particle size. Acta Montan. Slovaca 2013, 18, 198. [Google Scholar]
  72. Wu, W.; Chen, T.; Shao, Y.; Ye, G.; Tong, X. The flotation separation of molybdenite from talc using zinc sulfate in sodium silicate system and related mechanism. Colloids Surf. A Physicochem. Eng. Asp. 2022, 641, 128451. [Google Scholar] [CrossRef]
  73. De Melo, C.; de Araujo, A.C.; Filippov, L. Reverse cationic flotation of iron ores with complex silicate gangue minerals. In Proceedings of the Iron Ore 2017, Perth, Australia, 24–26 July 2017; pp. 241–244. [Google Scholar]
Figure 1. Geological map of Tasmania showing the location of the Arthur Lineament plus major structural and stratotectonic features, rock types, and formations [18]. Red box in the figure is the location of the Arthur River deposit.
Minerals 15 00247 g001
Figure 2. Location of the Arthur River deposit [17]. The inset shows the location of the Prospect Ridge project, the name used for the deposit by the current owners [17].
Minerals 15 00247 g002
Figure 3. Arthur River prospect showing the location of drill holes [17]. Hole AR016 was examined during this project, Table 1.
Minerals 15 00247 g003
Figure 4. Examples of drill core logging, MB008 (right) and DD83AR002 (left), illustrating magnesite ore types (T1, T2, and T3).
Minerals 15 00247 g004
Figure 5. Example of classification of carbonates using TIR data by plotting 11,300 nm versus 13,900 nm peak wavelengths. Data shown are for drillhole DD83AR002.
Minerals 15 00247 g005
Figure 6. Photomicrographs of optical microscope (XPL) showing ore and gangue mineral associations for magnesite in the T1 ore (monocrystalline quartz, MQ; magnesite, Mgs; dolomite, Dol; talc, Tlc; quartz, Qz; cement, d). (a) Fine-grained magnesite with quartz vein and calcite (b) Fine-grained magnesite with off-set dolomite vein (c) Magnesite with monocrystalline quartz(d) Fine-grained magnesite with talc contamination.
Minerals 15 00247 g006
Figure 7. Photomicrographs of optical microscope of the three ore types. (a) Type 1 magnesite in XPL. (b) Type 2 magnesite in XPL. (c) Type 3 magnesite in PPL.
Minerals 15 00247 g007
Figure 8. Photomicrographs showing the texture and grain sizes after staining with ARS, optical microscope PPL (a), and XPL (b).
Minerals 15 00247 g008
Figure 9. Photos showing drill core stained with ARS and potassium ferricyanide: (a) T1 ore: magnesite with quartz veins; (b) T2 ore: magnesite with dolomite veins.
Minerals 15 00247 g009
Figure 10. Graphic log of drill hole DD83AA007 illustrating the distribution of different rock types.
Minerals 15 00247 g010
Figure 11. Chemical characterization of Arthur River drill core (DD83AR007) showing major elemental composition (wt% oxides) changes with depth. Elemental composition is based on the portable XRF analysis. Dotted line shows graph trendline for MgO. Mineralogical Composition.
Minerals 15 00247 g011
Figure 12. Identification of carbonates and associated minerals in type 1 magnesite ore based on SEM-based automated mineralogy (SEM-AM).
Minerals 15 00247 g012
Figure 13. Pie chart showing the average mineralogical composition of T1 magnesite ore by SEM-AM. (Unknowns, and other minerals such as calcite, dravite and iron oxides make up 1.5%).
Minerals 15 00247 g013
Figure 14. Backscattered electron micrographs of polished samples from the Arthur River magnesite deposit: (a) highly weathered magnesite (Mgs) with pyrite (Py) contained in talc (Tlc; T3 ore); (b) magnesite with well-preserved fibrous talc (T1 ore).
Minerals 15 00247 g014
Figure 15. Particle size distribution (PSD) curve for the three ore types.
Minerals 15 00247 g015
Figure 16. Graphical presentation of the liberation degree of magnesite in type 2 ore in different fine-sized fractions.
Minerals 15 00247 g016
Figure 17. Different types of identified magnesites within the Arthur River magnesite ore: (a) type 1 (T1): white magnesite with talc veins; (b) type 2 (T2): creamy-yellowish magnesite with quartz veins; (c) type 3 (T3): reddish-brown magnesite with iron stain and talc, quartz veins.
Minerals 15 00247 g017
Table 1. A summary of methodology for data acquisition. For details see individual sections in the text below.
Drill Hole IDProcedureSample TypeNo. of SamplesLength of Drill Hole (m)
DD83AR002Drill core logging using the anaconda method/optical mineralogy/staining for carbonatesDiamond drill core/polished thin sections52244.5
DD83AR0016Hyperspectral (SWIR and TIR) analysis: logging with/HyLogger-3/LA-ICPMS/pXRF Diamond drill core26239
DD83AR007pXRFDiamond drill core21282.5
AR035/AR036/AR037/AR038SEMSEM tiles39145.7/99.8/123.5/115.4
Table 2. Chemical composition of defined ore types based on historic geochemical data (data provided by GWR).
Type 1 (T1)Type 2 (T2)Type 3 (T3)
MgO≥40%≥30%≥20%
SiO2≤10%≤25%≤50%
CaO≤2.5%≤7.5%≤25%
Fe2O3≤1%≤5%≤30%
Al2O3≤0.05%≤2.5%≤10%
Table 3. LA-ICP-MS spot analysis data for magnesite found in ore types T1, T2, and T3. Values are in wt% for Mg, Ca, Si, Fe, and Mn; remaining values are in parts per million (ppm).
wt%PPM
TypesItemMgCaSiFeMnNaSrPZnKCuAlNiCoLi
Type 1
(n = 18)
Minimum26.160.170.020.050.010.003.619.924.853.440.090.210.060.010.63
Maximum28.682.800.030.990.160.0222.728.5218.6421.80.560.662.080.431.73
Mean27.980.790.290.400.060.019.2518.7610.007.190.220.420.830.191.00
Median28.330.270.030.310.040.017.1119.149.094.460.150.360.660.220.86
Std Dev0.941.050.000.350.060.017.026.044.667.240.180.190.790.160.42
Type 2
(n = 13)
Minimum27.000.040.020.060.032.550.097.805.861.240.081.760.040.020.05
Maximum28.710.690.522.290.200.0416.227.3730.7752.70.428.737.942.240.66
Mean28.000.090.031.090.120.0112.4314.8717.1415.00.184.792.080.760.20
Median28.220.050.030.770.100.0131.5613.1611.0911.70.123.312.290.230.16
Std Dev0.520.020.010.730.050.0124.256.6619.9014.80.132.533.190.870.18
Type 3
(n = 17)
Minimum26.150.060.031.390.090.000.4214.582.922.620.115.629.820.580.12
Maximum27.580.092.802.550.130.108.9620.2117.0324.372.3930.1116.820.861.25
Mean27.090.080.592.060.110.024.4313.799.7813.790.9213.8812.340.430.57
Median27.190.080.032.030.120.014.2817.338.1017.210.197.4311.840.490.50
Std Dev0.580.011.230.490.020.033.362.396.299.921.0810.642.790.330.42
n: stands for number of spots.
Table 4. Mineral liberation of minerals of interest in weight percentages (wt%) with different classes and their respective 80% and 50% passing; mainly liberated (75% < x ≤ 100%), moderately liberated, (50% < x ≤ 75%) and poorly liberated (0% < x ≤ 50%).
Minerals of InterestMainly
Liberated
(75% < x ≤ 100%)
Moderately Liberated
(50% < x ≤ 75%)
Poorly
Liberated
(0% < x ≤ 50%)
d80d50
Magnesite93.433.992.586428
Dolomite86.087.213.077227
Quartz85.76.054.417236
Talc29.328.1628.511910
Disclaimer/Publisher’s Note: The statements, opinions and data contained in all publications are solely those of the individual author(s) and contributor(s) and not of MDPI and/or the editor(s). MDPI and/or the editor(s) disclaim responsibility for any injury to people or property resulting from any ideas, methods, instructions or products referred to in the content.

