Article

Economic Valuation of Metal Recovery from Mobile Phones in India

1
Department of Applied Mechanics, Motilal Nehru National Institute of Technology Allahabad, Prayagraj 211004, Uttar Pradesh, India
2
Commonwealth Scientific and Industrial Research Organization (CSIRO) Energy/Mineral Resources, Private Bag 10, Clayton South, VIC 3169, Australia
*
Authors to whom correspondence should be addressed.
Minerals 2025, 15(3), 259; https://doi.org/10.3390/min15030259
Submission received: 13 January 2025 / Revised: 23 February 2025 / Accepted: 27 February 2025 / Published: 1 March 2025
(This article belongs to the Section Mineral Processing and Extractive Metallurgy)

Abstract

:
This study analyses Indian export–import and domestic production data of mobile phones and smartphones to quantify historically generated e-waste from discarded devices over a 20-year period (2001–2021). An exponential time smoothing method was used to forecast the waste generation trends for 2022–2035. The metal recovery and embedded values of the metals (precious metals, base metals, and rare earth battery metals) in the PCBs and displays of mobile phones and smartphones were assessed for the same period. The findings indicate that in the PCBs, Au and Pd contribute the most, while Ag is the dominant contributor in displays of mobile phones. The potential economic value of metals varies mainly because of the fluctuating prices of metals in the international market.

1. Introduction

1.1. E-Waste Generation

Electronic waste (e-waste) is from electronic goods, instruments, and equipment that have endured their useful life and can no longer be utilized effectively. These devices can house significant amounts of toxic compounds and metals like mercury, cadmium, and arsenic, which are hazardous to the ecosystem if not properly disposed of [1]. As we move towards technological advancements, it is estimated that the usage of electrical and electronic equipment (EEE) will grow significantly. According to Vats and Singh (2015) [2], every year, between 50 and 80 million metric tonnes (Mt) of electronic waste is produced all over the globe. In 2019, global e-waste generation was estimated at approximately 54 Mt, with only 18% of this waste being adequately collected and recycled. This amount could rise to approximately 71 Mt by the end of 2030 [3]. The consequences of e-waste generation and disposal may damage the health of the environment and humans [4]. The top 10 countries generating e-waste globally are presented in Table 1, with the amount of e-waste produced and recycled listed. India, as one of the largest consumers of mobile phones, generates a substantial amount of e-waste, with an estimated 3230 Mt produced annually. Despite this, the country has a notably low e-waste recycling rate of approximately 1%, highlighting a significant gap in resource recovery efforts.
There is a rising concern over the influence of e-waste on the health of humans and the natural environment. There have been many calls for the government to establish appropriate and strict standards for recycling companies and ensure that these companies are performing this properly. This will benefit the environment, human health, and society through income generation [6,7,8]. Different rare earths and critical metals in e-waste can also be used for clean energy production to accomplish net-zero emissions [9].
Along with recycling, another way to reduce e-waste volumes is to encourage manufacturers to create more environment-friendly products designed to last longer and that can be more easily repaired or upgraded, thereby decreasing environmental degradation caused by e-waste disposal [10].
Previous literature has used different methodologies to forecast the e-waste generation [11], recovery, and recycling of the contained metals [12,13,14] and to assess environmental implications [15,16,17]. Researchers have also examined e-waste management at different locations worldwide for other electronic devices [18,19,20,21,22,23,24,25,26]. For example, export–import data from Bangladesh for the quantification of e-waste generation for four types of electronic devices (mobile phones, TVs, tablets, and computers/laptops) was assessed using the Weibull probability density function. Metal recovery (precious metals, base metals, and rare earth metals) and the potential valuation of the metals were calculated, and future trends were discussed.

1.2. Mobile Phone E-Waste

Mobile phone usage has grown significantly in the recent decade due to advancements in mobile phone technology. Therefore, the value of mobile phones has increased [27]. India has 1.2 billion mobile phone users, out of which 600 million are smartphone users. Essential metals are embedded in the PCBs (printed circuit boards) and displays of mobile phones [3]. The quantity of metals that may be recovered from PCBs can fluctuate depending on many variables, including the age of the equipment, the type of equipment, and the recycling technique used to remove the metals. It is estimated that approximately 0.04 to 0.4 grams of gold could be recovered from one mobile phone PCB, along with other valuable metals such as copper, silver, and palladium as well as other non-metallic materials [28]. The e-waste from mobile phones includes glass, the display, and the PCB, which contains essential metals. Figure 1 shows the metallic constituents of mobile phone e-waste in India. The PCB contains metalloids, ceramics, and polymers of various metals [2]. The extraction and recovery of these metals presents a crucial opportunity for economic and environmental benefits. Effective e-waste recycling and metal recovery can reduce dependence on primary mining, mitigate environmental pollution, and contribute to resource sustainability.
Previous work has focused on the analysis of the metals used in different mobile phone components and the recovery of these metals. Jha et al. (2013) [30] proposed an eco-friendly leaching technique for recovering lithium and cobalt from the spent lithium-ion batteries in mobile phones to resolve environmental restrictions and natural resource shortages. The process was optimized by adjusting the leachate concentration, pulp density, reductant volume, and temperature. In 60 min, 99.1% of the lithium and 70.0% of the cobalt were recovered using 2M sulfuric acid with 5% H2O2 at a pulp density of 100 g/L and 75 °C. H2O2 was an effective reducing agent in increasing the metal leaching percentages for higher oxidation state metal oxides. Sahan et al. (2019) [31] discussed the recovery of various essential metals from the PCBs and displays of mobile phones. They found the metal content in mobile phone e-waste to be 1.6 g/kg Au, 0.82 g/kg Pd, 0.033 g/kg Pt, and 8.3 g/kg Ag. Vats and Singh (2015) [2] used hydrometallurgy methods to recover the metals from mobile phone PCBs. The metals present were classified as precious metals (Ag, Au, Pd, and Pt), base metals (Cu, Fe, Al, Sn, Ni, Zn, and Pb), rare earth metals (La, Ce, Co, and Li), and hazardous metals (Hg, Be, Cd, As, and Sb). The PCBs and displays of mobile phones contain metalloids, ceramics, and polymers of the metals, and the older PCBs from around 2002–2003 contain palladium (0.010%), gold (0.025%), silver (0.100%), tin (3%), copper (16%), and zinc (1%) [32]. PCBs from Bangladesh were analysed to determine metal, ceramic, and volatile contents, leading to a three-stage recovery process for Cu, Ag, Au, and Sn. Process flowsheets simulated unit sizes, with capital and operating costs estimated. Financial viability was evaluated using the net present value and internal rate of return [33]. Gupta et al. (2020) [34] claimed that a cell phone mass split is roughly 41.5% plastic, followed by metals (37.4%), ceramics (12.5%), epoxy (6.3%), and various organic compounds (2.3%).
A series of studies have investigated the environmental and health impacts of mobile phone e-waste, highlighting challenges and opportunities for sustainable management. Kaushal and Nema (2012) [35] investigated mobile phones’ significant contribution to e-waste pollution. Using a strategic game theory model, the study implies that hazardous substance-free mobiles may be a preferred alternative for producers and customers if the expense of hazardous mobile disposal can be internalized and a marginal incentive provided. Zink et al. (2013) [36] assessed via LCA the environmental effect of reusing end-of-life (EoL) smartphones, comparing traditional refurbishing, repurposing with battery power, and repurposing with a portable solar charger. Song et al. (2015) [37] investigated mobile e-waste recycling through the manual and mechanical disassembly of cathode ray tubes (CRTs) and printed circuit boards (PCBs). The findings highlighted e-waste recycling’s environmental benefits but emphasized lead contamination risks in CRT workshops. A life cycle study revealed an environmental advantage, emphasizing the need to prevent environmental contamination while recycling e-waste. Sarath et al. (2015) [38] reviewed global mobile phone waste management and recycling research from 1999 to 2015. The assessment emphasizes that commercially successful refurbishment or recycling of mobile phone waste is achievable in an ecologically beneficial way, but it needs sufficient consumer knowledge. Singh et al. (2018) [39] assessed the human health risks and ecotoxicity of waste mobile phones, utilizing life cycle impact assessment methodologies and regulatory restriction data on devices produced between 2001 and 2015 based on 19 substances. The findings revealed an increase in the relative mass of harmful compounds in smartphones, with nickel as the most significant producer of carcinogens from mobile phones, followed by lead and beryllium, while copper components were prominent for ecotoxicity issues. Singh et al. (2018) [40] also examined 20 discarded mobile phones to assess the recovery of constituent minerals and precious metals. The investigation indicated that smartphones included more valuable minerals than cellular phones. A kilogram of cellular phones comprised around 1600 mg of silver, 186.5 mg of gold, and 36.9 mg of palladium, whereas a kilogram of smartphones contained approximately 1732.9 mg of silver, 190.9 mg of gold, and 40.1 mg of palladium, suggesting waste mobile phones might be a good secondary resource of precious and rare metals. Almanza et al. (2019) [1] developed a technology to recover cobalt from waste mobile phone batteries. After dismantling, crushing, and leaching with sulfuric acid and hydrogen peroxide, cobalt was selectively extracted. The process was optimised for the best extractant, acid concentration, pH, and contact duration. Precious metals were recovered through cobalt electroplating. Sahan et al. (2019) [31] optimized ICP-OES parameters to analyse metal concentrations in waste mobile phones from Turkey, estimating the recovery potential of precious and rare earth metals and aiding recycling strategies and sustainability. Annamalai and Gurumurthy (2021) [41] analysed mobile phone e-waste to examine PCBs and identify the valuable base, precious, and toxic elements. For the latter, they found cadmium, lead, and mercury. The analysis also revealed that discarded mobile phones could be a source of energy that can be recovered via gasification or pyrolysis. Brozova et al. (2021) [28] explored mobile phone PCBs, emphasizing the rich non-ferrous and precious metal content and toxic compounds. They undertook some leaching studies and found that copper was readily leached, producing a liquor containing 68.45 g/dm3 Cu using a hydrochloric acid and ozone leaching system. Koshta et al. (2021) [42] investigated mobile phone e-waste trends in Delhi, anticipating a less than 1% growth rate through 2030. The findings are valuable for planning and managing the reverse logistics network. Prabhu N and Majhi (2021) [43] discussed the environmental and health effects arising from mobile phone waste. They summarized data on the disposal of old mobile phones, including motives for replacement and disposal techniques, emphasizing the need for sustainable practices such as reduce, reuse, and recycle to manage e-waste. Finally, Switzer et al. (2023) [44] proposed to repurpose 1.5 billion smartphones sold annually, many discarded within two years, into “junkyard computers” to prolong their lives and minimize carbon emissions. The study recommends computational carbon intensity to optimize reuse, suggesting microservices on reused devices and analysing expansion to larger cloudlets.

1.3. The Indian Scenario
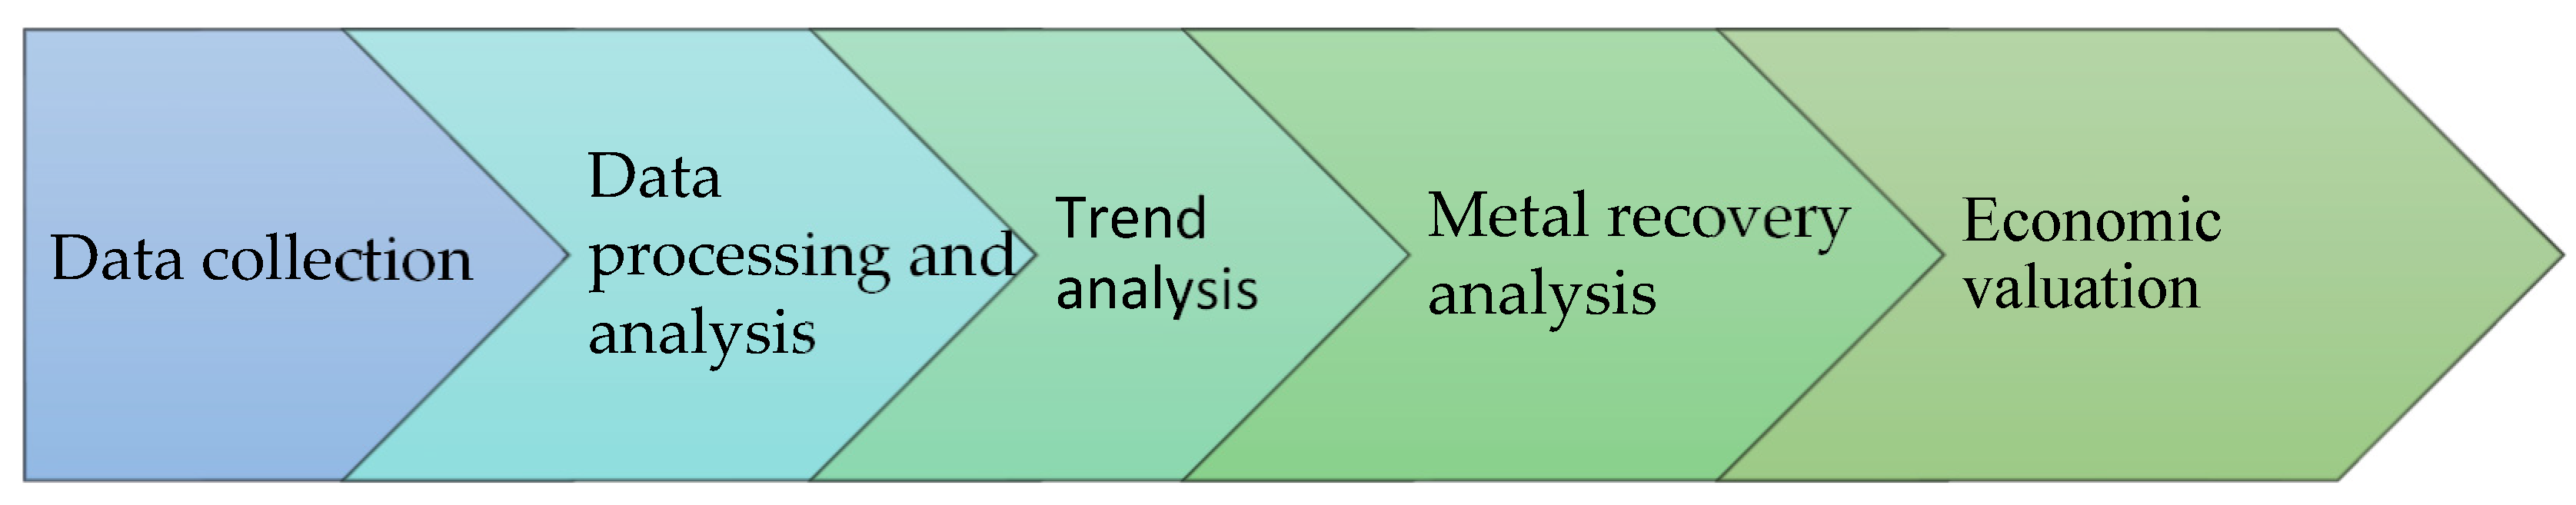
India, with a population of approximately 1.35 billion, is observing an increase in the usage of electrical and electronic equipment (EEE) due to its increasing population and economy. E-waste collection in India is predominantly managed by the informal sector. India’s e-waste management faces significant challenges due to the informal sector’s dominance, where hazardous practices endanger both workers and the environment. Low public awareness of proper disposal exacerbates improper recycling [45,46]. Furthermore, inadequate infrastructure and a lack of advanced recycling technologies impede effective metal recovery from electronic waste, reducing metal recovery efficiency [23]. E-waste is a rich source of metals, which can be recovered and reintroduced into the production cycle. There is significant economic potential in the efficient recovery of valuable materials from e-waste, which can generate income for both individuals and businesses [47]. Domestic production and export–import data of mobile phones from the UNCOMTRADE (United Nations Commodity Trade) statistics database provide entrepreneurs and governments of countries the ability to make decisions for business and policies beforehand (Islam et al., 2022) [3]. Addressing e-waste concerns requires a collaborative approach involving designers, recyclers, and policymakers to decrease waste, boost value retention, and promote repair, reuse, and recycling. Developing a closed-loop solution for e-waste could benefit both the environment and the economy [48].
The research gap identified in this study lies in the lack of comprehensive data on mobile phone e-waste generation and metal recovery in India. Similar studies have been conducted in countries like Turkey [31], Bangladesh [49], Indonesia [50], and Australia [51]. India lacks detailed collection data on mobile phone e-waste and its economic potential. This study aims to fill this gap by assessing e-waste generation and the recovery of metals from PCBs and displays in mobile phones and providing economic valuation insights that could help in revenue generation from the waste for the country. The data obtained can be used for assessing the environmental impact of the recycling processes. It will also be useful in helping the government and businesses make policies and decisions about mobile phone e-waste management.
The present work focuses on the estimation of e-waste generation in India over the past two decades (2001–2021) and further uses the exponential time smoothening (ETS) method forecasting future trends for 2022–2035. As there are many essential metals embedded in the PCBs and displays of mobile phones, this study also evaluates the recovery of metals from them and the potential economic valuation of the metals recovered forecast for the next 14 years.

2. Methodology

This study aims to quantify mobile phone e-waste generation based on historical data and predict future trends. Secondly, it aims to determine the different metals (precious metals, base metals, and rare earth metals) present in PCBs, displays, and batteries of mobile phones. The third objective is to estimate the revenue generated from the metals recovered from the e-waste and make a prediction of the future revenue received from the waste by using the extrapolation and extreme gradient boosting regression approach, which would help increase the country’s revenue overall. The complete methodology is represented in Figure 2 and in depth is represented in subsequent sections.
Put on market (POM), the Weibull probability distribution function, and exponential time smoothing are the key parameters used for the analysis. The key assumptions include considering all domestically produced phones as used within India and assuming direct e-waste contribution upon their end of life without accounting for storage or reuse. Weibull distribution parameters were applied based on non-EU country data. The economic valuation of recovered metals considered average historical metal prices.
This study analyses the accumulation of export–import and domestic production data of mobile phones and smartphones in India for the last 20 years (2001–2021). The data on export–import were collected from UNCOMTRADE (United Nations Commodity Trade statistics database), where the data for mobile phones and smartphones are provided in harmonized system (HS) codes. For the present study, the HS codes related to mobile phones and smartphones are HS8517, HS851711, HS851719, HS851721, and HS851722. For the domestic production of mobile phones and smartphones in India, the data were taken from Gupta et al. (2021) [27] and Singh (2008) [52]. The total products that are produced in India are assumed to be used in India only until these mobile phones enter their end of life, after which they would be considered in the category of e-waste. The dynamic lifespan of the mobile phones and smartphones that have been introduced in a particular year was calculated by using the Weibull probability distribution function, which is shown in Equation (2). This is a function that estimates the lifespan of the particular product. The process for the estimation of e-waste for the last 20 years (2001–2021) is shown in Figure 3, where POM is put on market and w is the Weibull probability distribution function.

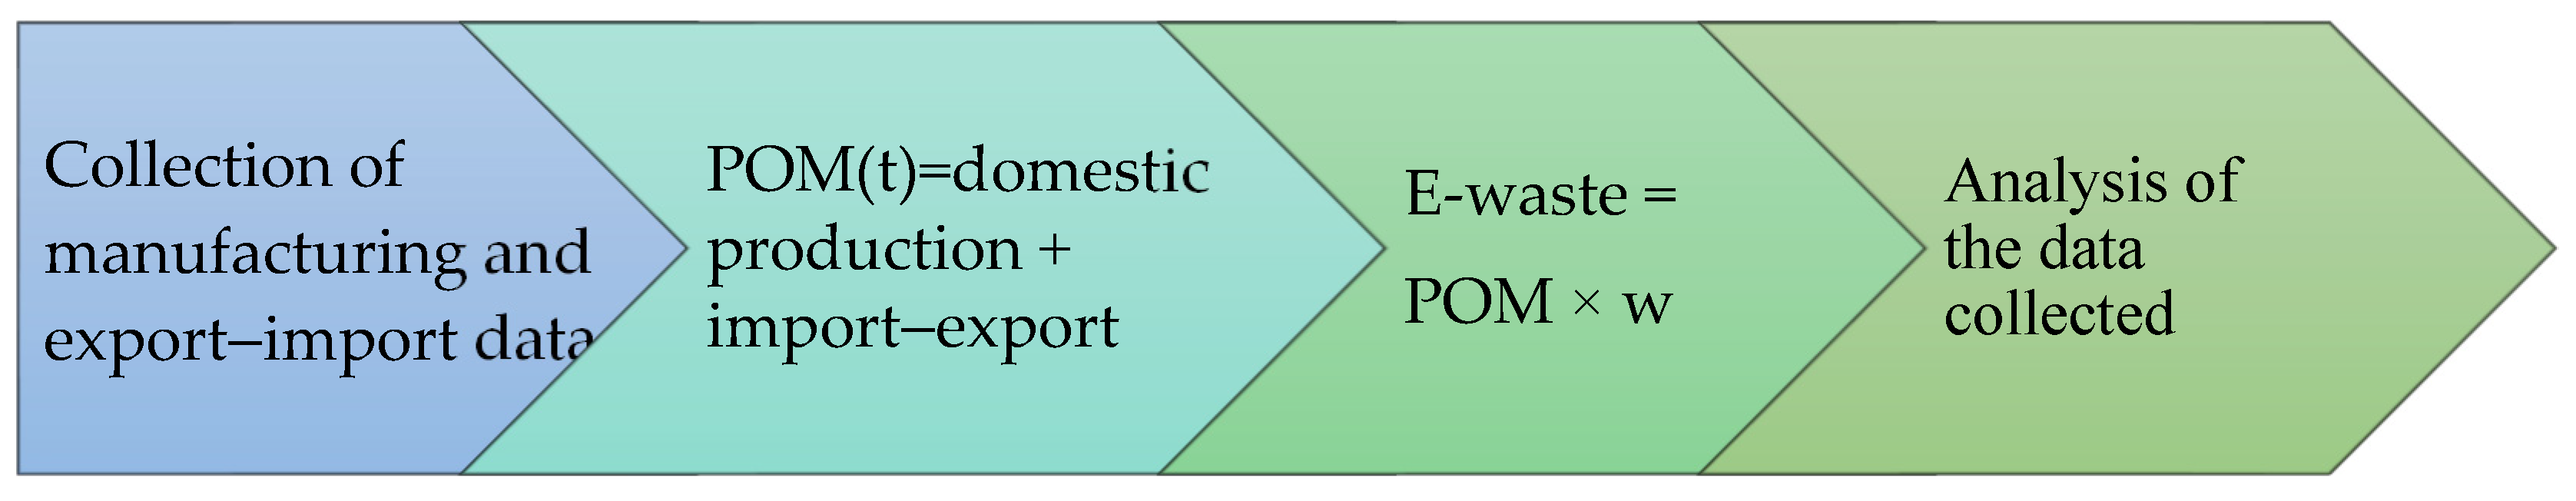
2.1. Estimation of Put on Market (POM) of Mobile Phones

POM is “put on market” for a product that is coming into the market for sales purposes in a particular financial year for the country. For the present study, POM was calculated using Equation (1), where the HS code mobile phone data were collected from UNCOMTRADE and domestic production data were taken from the ICEA (Indian Cellular and Electronic Association) for mobile phones with the HS codes noted above. These HS codes include Samsung, Nokia, Vivo, Oppo, Blackberry, Micromax, Mi, Realme, Oneplus, and Apple phones and were taken from UNCOMTRADE site for further calculations. For the calculation of POM, the collected values for import–export and domestic production were put in Equation (1).
POM ( t ) = Domestic   Production ( t ) + Imports ( t ) Exports ( t )

2.2. Weibull Probability Distribution Function

Weibull probability distribution function is a function that is used in the estimation of product lifespan considering whether the product has entered its end-of-life period or not. This tool in the present study was used to estimate the amount of POM mobile phones and smartphones being added to the waste stream of the batch for a particular year. The mobile phones that can be considered as discarded can be estimated using Equation (2).
w = α β t β α 1 × e ( t β ) α
where w is termed as the Weibull probability distribution function, t is the year in which the POM is being introduced, and α and β are the shape factor (Weibull slope or the threshold parameter) and scale factor (characteristic life parameter), respectively. The values of the shape factor and scale factor are 1.52 and 5.62, respectively, for all non-European Union countries [53]. By using Equation (2), the failure rate for all individual years from 2001 to 2021 were calculated and used in the estimation of the e-waste volumes.
In this study, the Weibull probability density function is used because of its ability to analyse the trends for the failure of datasets provided and also to provide forecasts for the failure of the datasets on the basis of provided sample data collected or received. Secondly, this probability density function can be applied to a small sample size with high versatility and effectiveness. The Weibull distribution offers a versatile framework for modelling system and component dependability and calculating POM. Its capacity to record varied failure patterns makes it an important tool in dependability analyses and decision making on maintenance, replacement, and design enhancements.

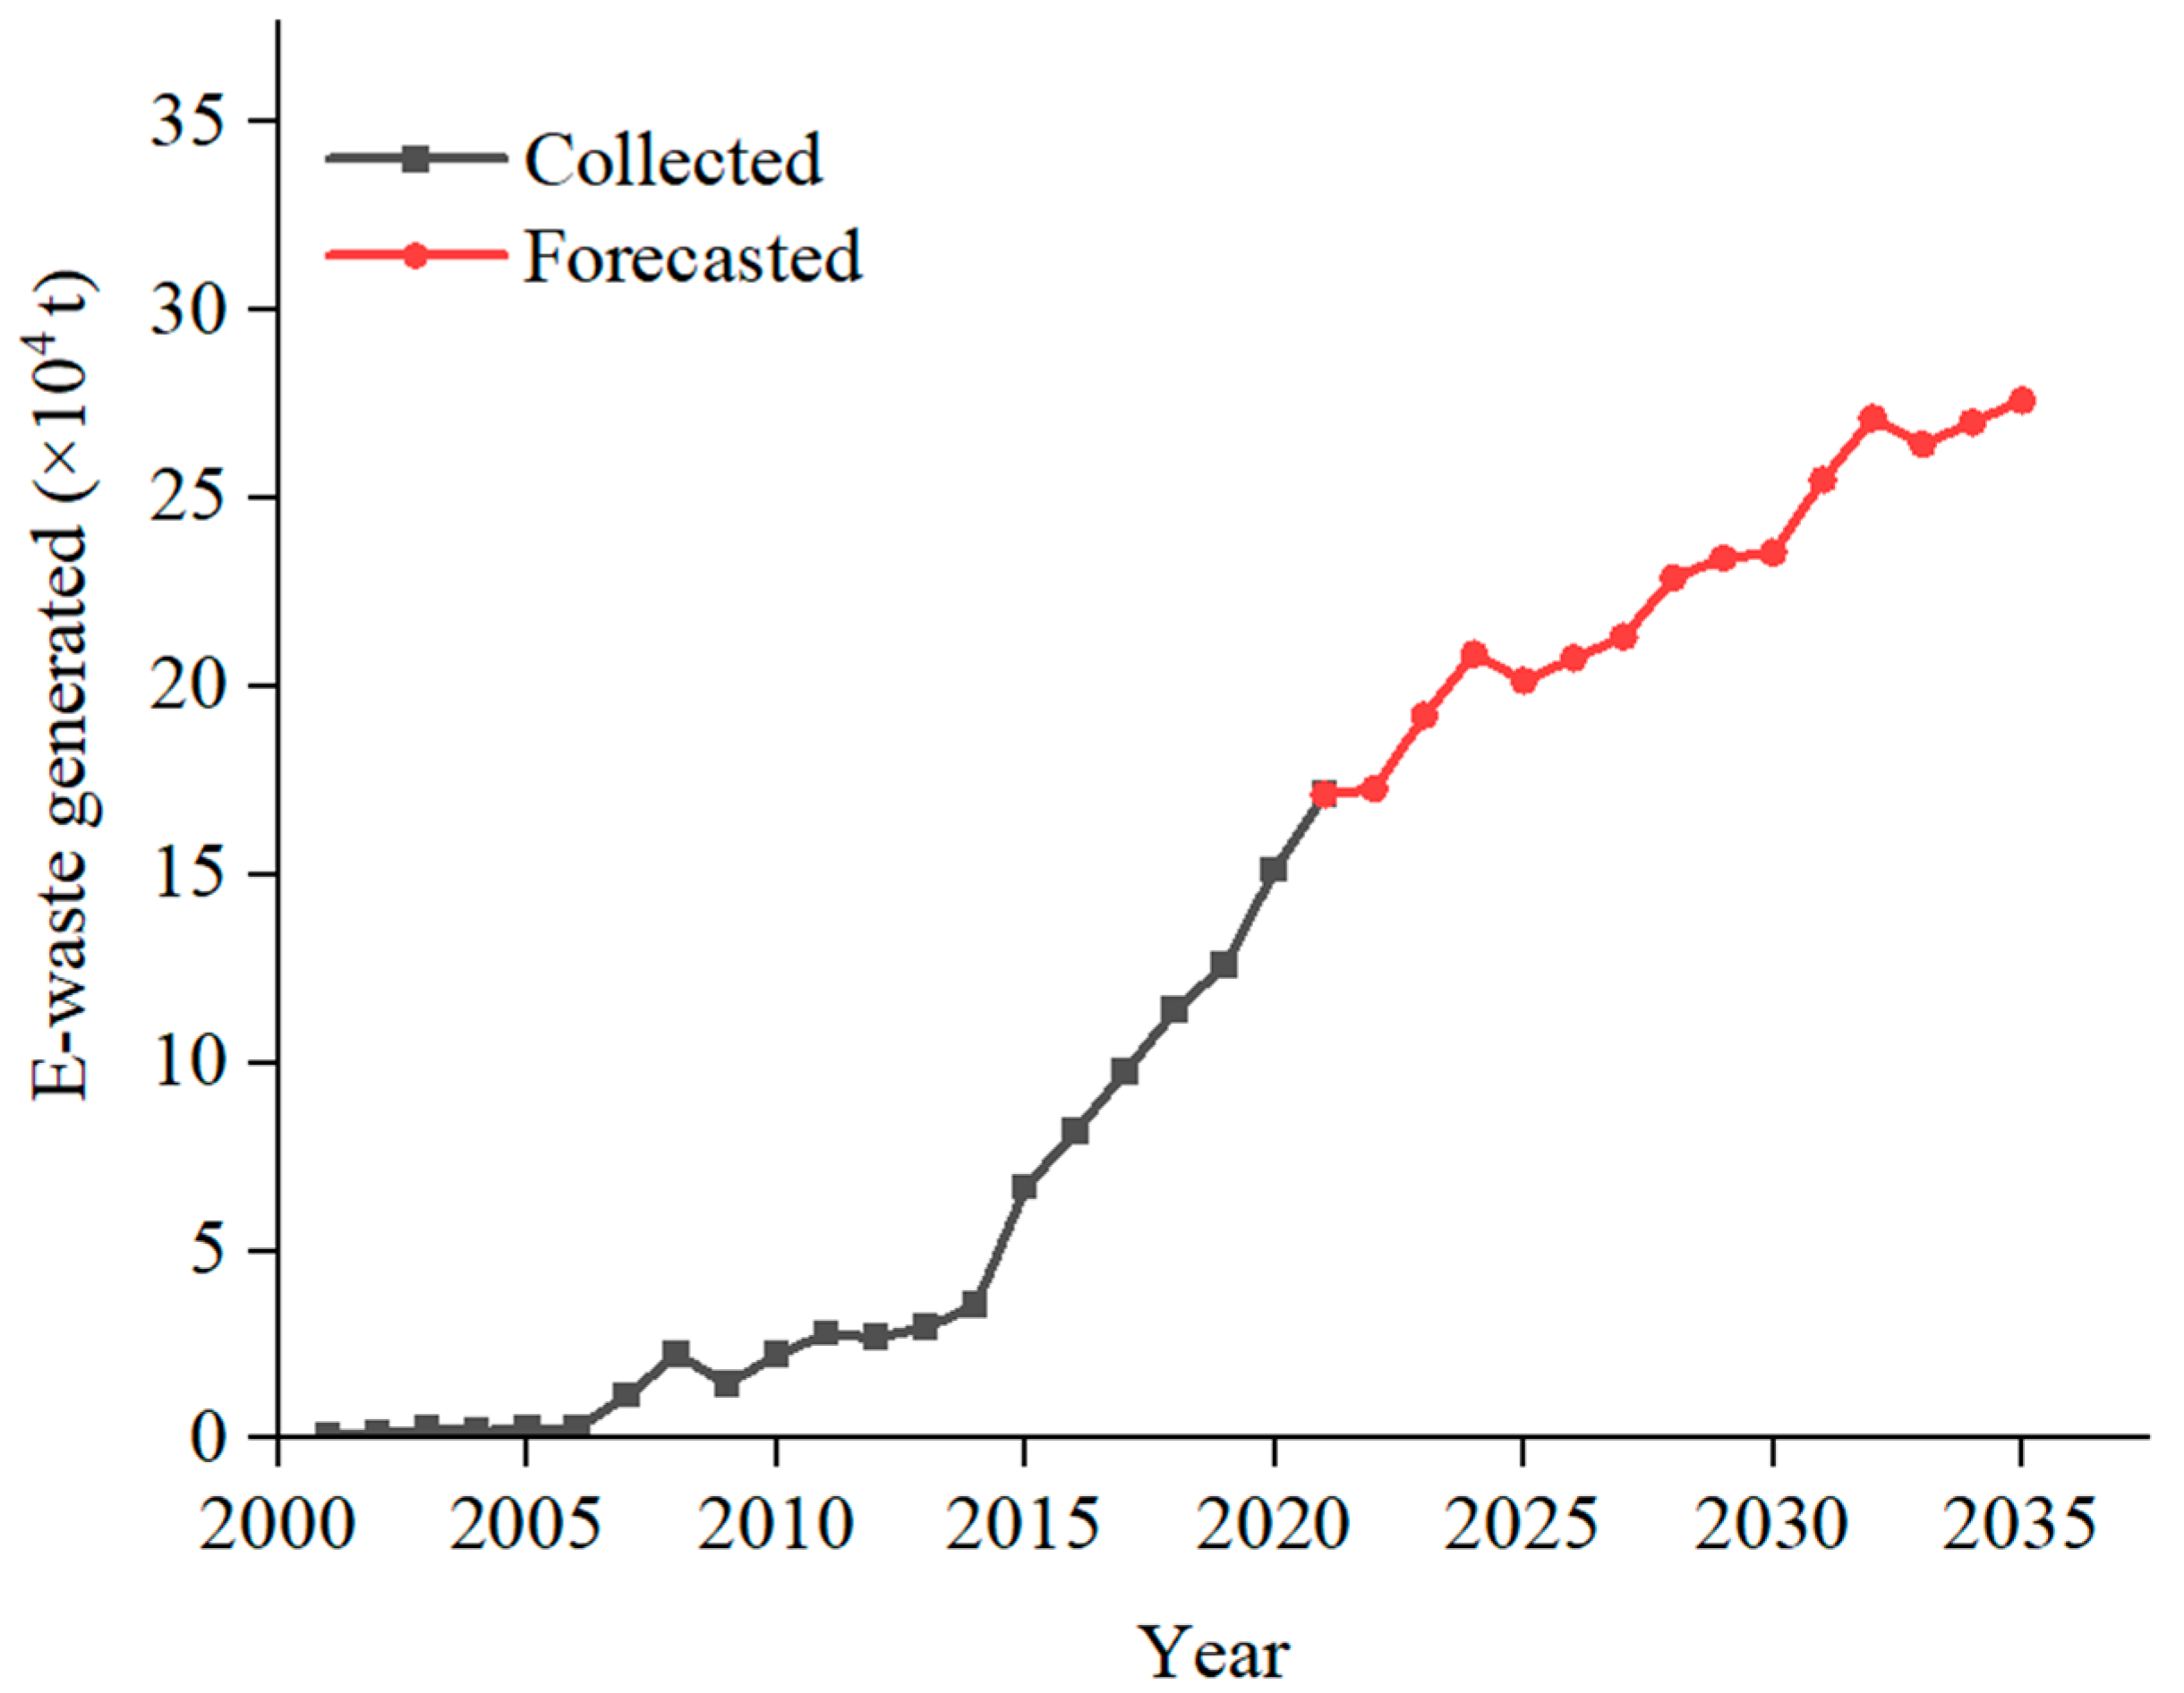
2.3. Estimation of E-Waste Generation from Rejected Mobile Phones

The estimation of e-waste generation for the years 2001–2021 was calculated by multiplying the put on market (POM) of all individual years with that of the individual Weibull probability distribution function and then summing all the year’s e-waste, as per Equation (3).
E waste   generation ( y ) = t = t 0 y POM ( t ) × w ( t , y )
where E-waste generation (y) is the total e-waste generated for the 20 years, t0 is the year in which the sale of the mobile phone occurred, POM(t) is the mobile phone put-on-market sales in t, and w(t,y) is the probability density function.
After estimating the total e-waste up to the year 2021, forecasting for the years 2022–2035 was achieved by using the exponential time smoothening (ETS) method due to its higher accuracy than the simple moving average method (which uses only three datasets from the past for forecasting), its flexibility, and ease of use.

2.4. Metal Recovery from PCB and Display of Mobile Phones

Mobile phone PCBs and displays contain various recoverable materials, but this study focuses on extracting “essential” metals for the economic valuation. The three groups of essential metals are precious metals (Ag, Au, Pd, and Pt), base metals (Cu, Fe, Al, Sn, Ni, Zn, and Pb), and rare earth metals (La, Ce, Co, and Li). The extraction data from Sahan et al. (2019) [31] for similar types of mobile phones are employed to estimate the metal recovery. The whole process flowchart for the recovery of metals in the present study is shown in Figure 4, and Table 2 provides the concentration in g/kg for both PCB and display components.
These concentrations were multiplied by the annual e-waste generated from 2001 to 2021 to estimate the overall metal recovery for precious metals, base metals, and rare earth metals over the 20-year period. The analysis provides insights into the potential resource recovery from the mobile phone e-waste over a 20-year period.

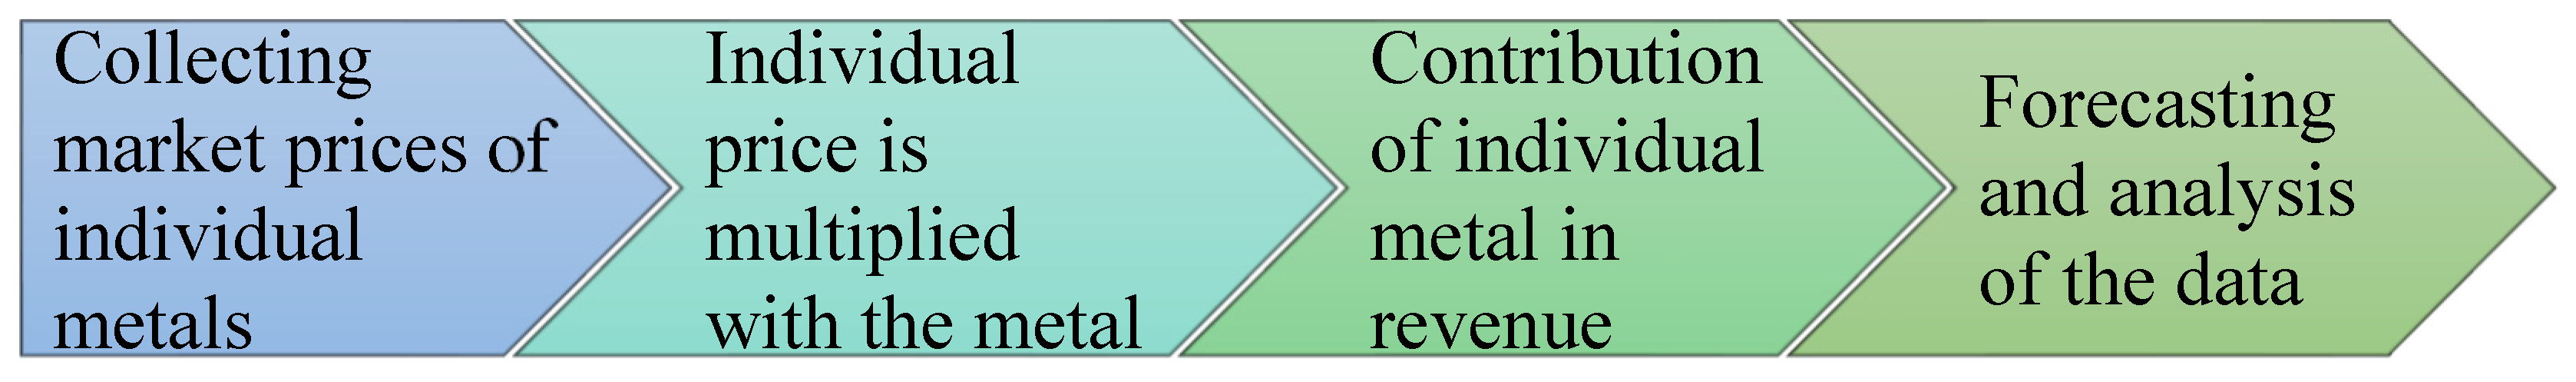
2.5. Estimation and Forecasting of Economic Valuation in Revenue

Following the calculation of e-waste generation and metal recovery, the present study accounted for the estimation of economic valuation of the metals obtained. The process for the economic valuation of the metals recovered is shown in Figure 5.
For calculating the economic valuation, the individual prices of all the metals recovered for the last 20 years was taken from the ICAI (Institute of Chartered Accountants of India) [54] and index mundi [55]. The prices taken are the average prices and for the economic valuation, and these individual prices were multiplied by the metals recovered. The forecasting of the economic valuation was then calculated for 2022–2035 by using the exponential time smoothening method (ETS) and taking the seasonality for all the metals as 8, except for the case of tin where the seasonality is taken as 5. Note the unit for the average pricing of individual metals is different, i.e., for Ag it is Rs/kg, Au is Rs/10g, Pd is Rs/28g, Pt is Rs/28g, and for base metals it is Rs/t. The pricing for Au and Pd fluctuates more in the international market, hence the sensitivity in the pricing of Au and Pd is very high with respect to the other metals.

3. Results and Discussion
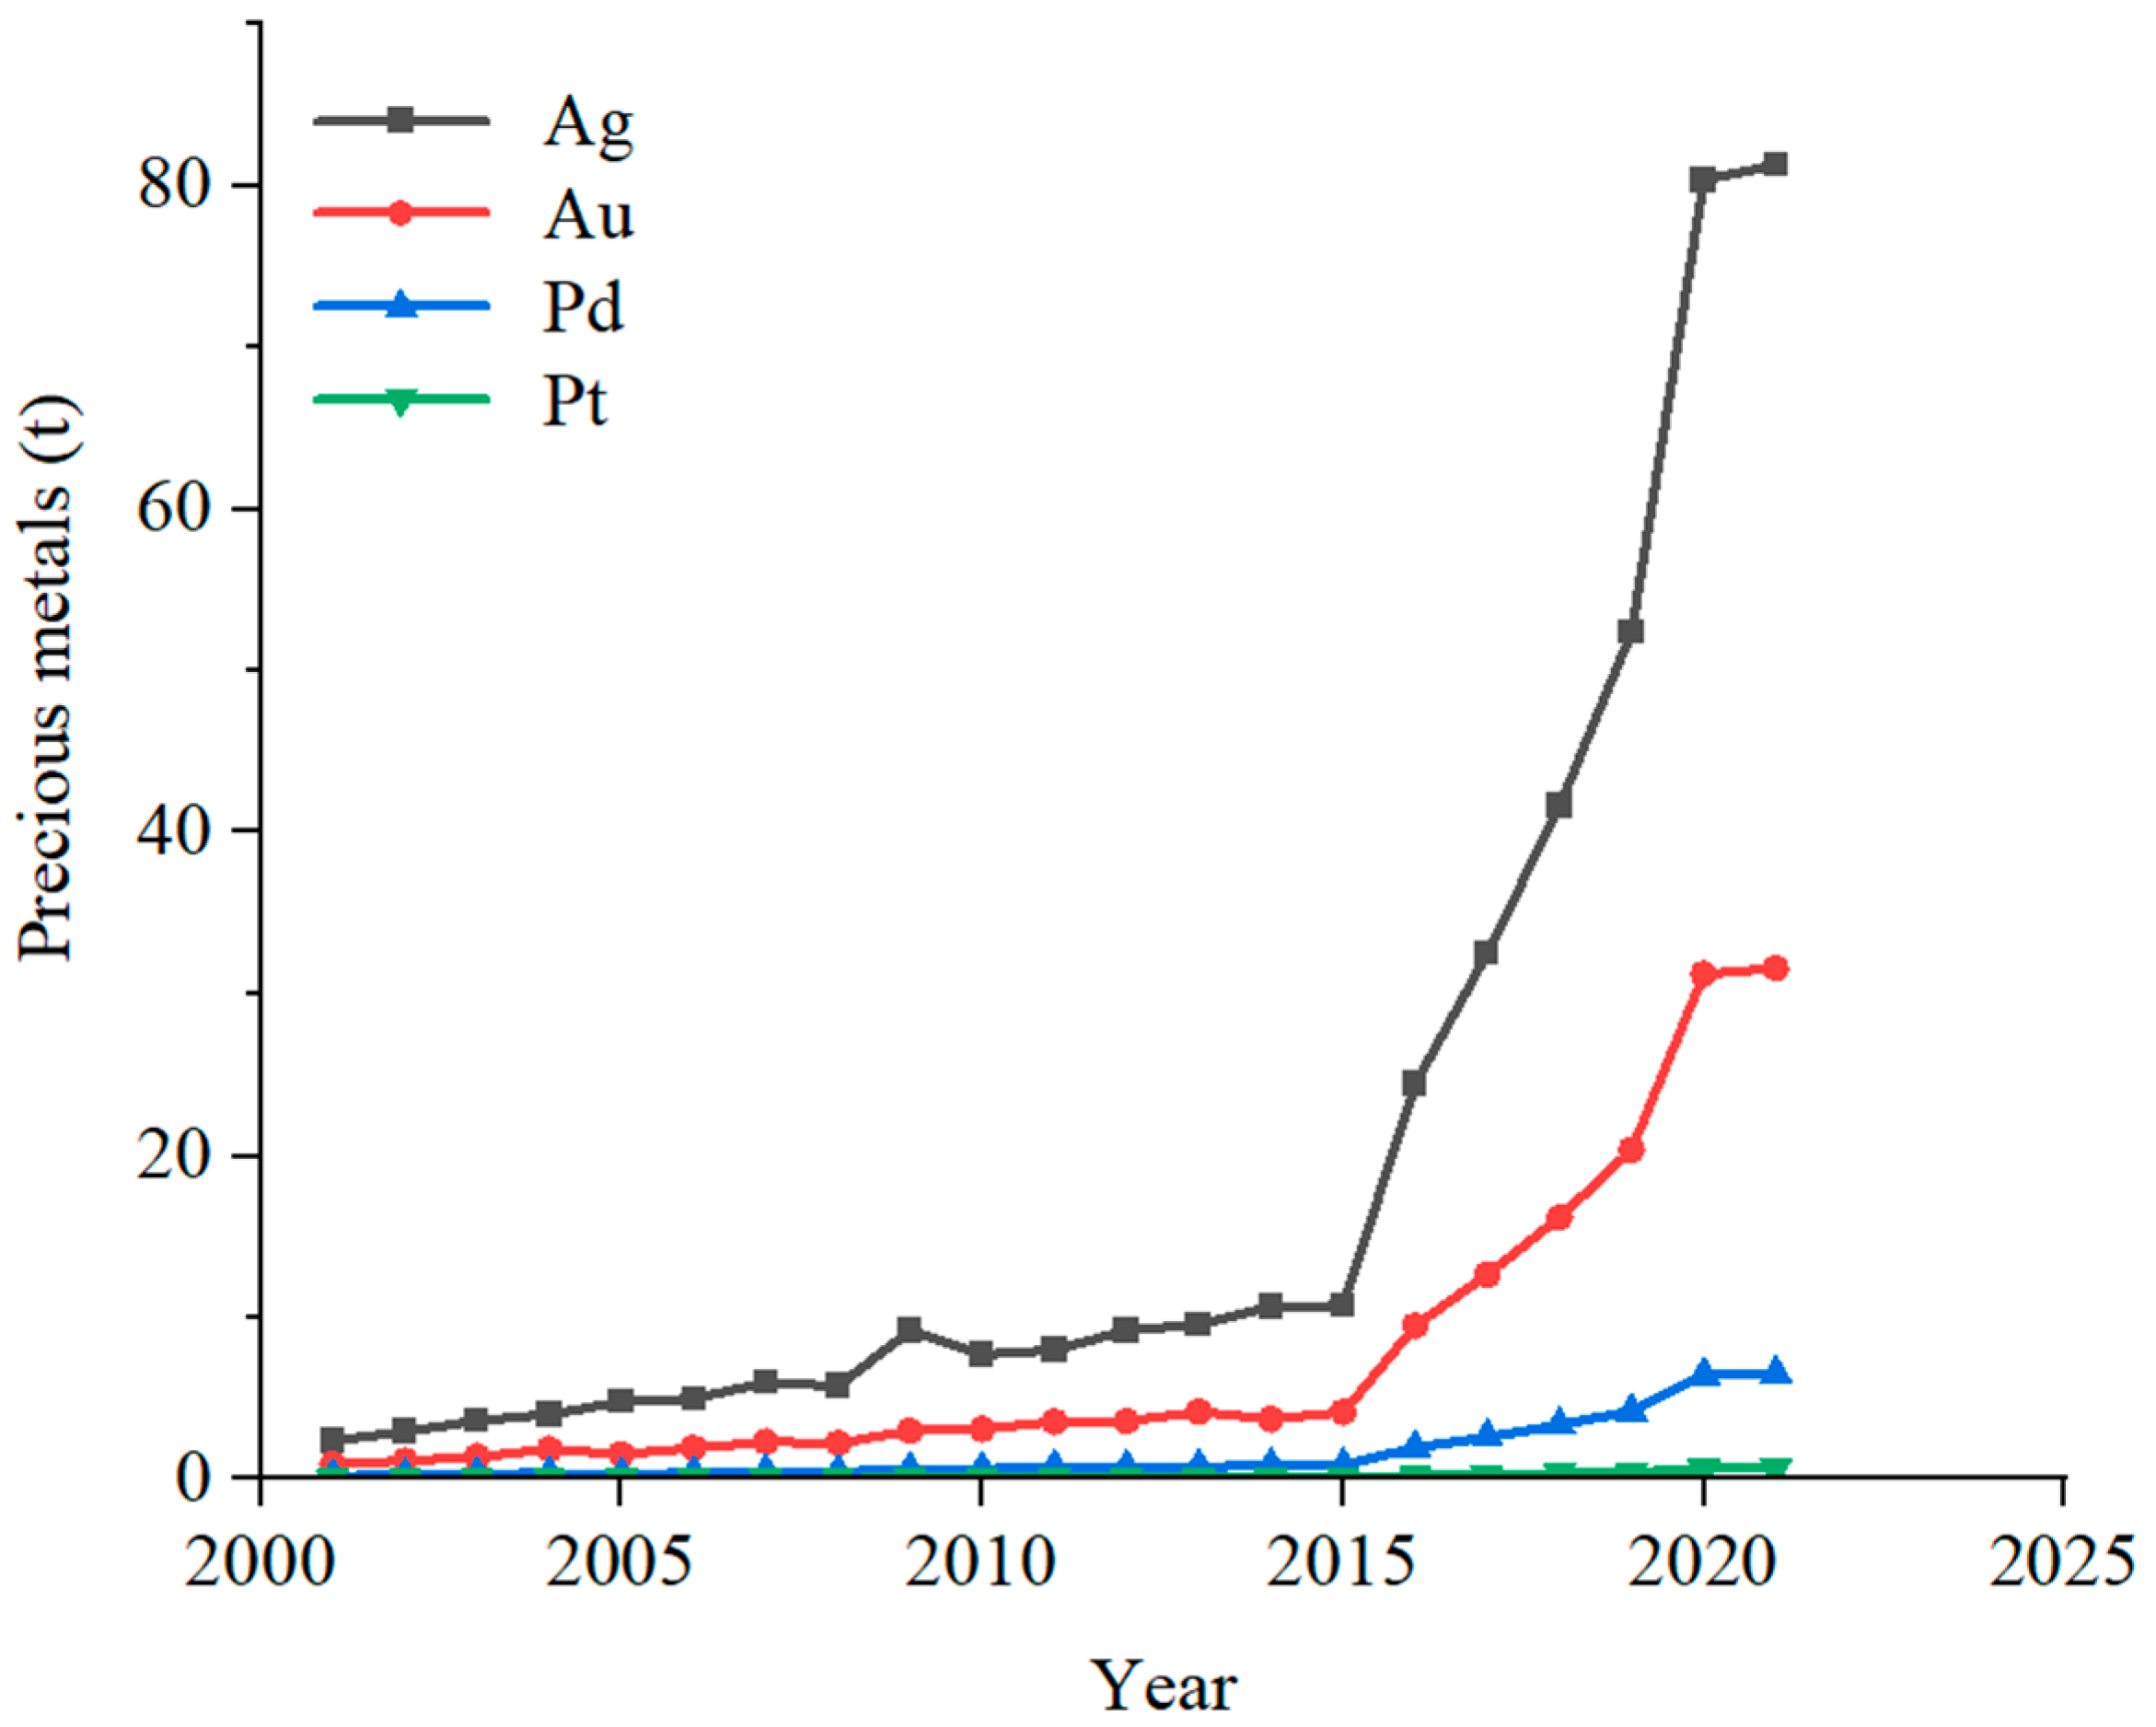
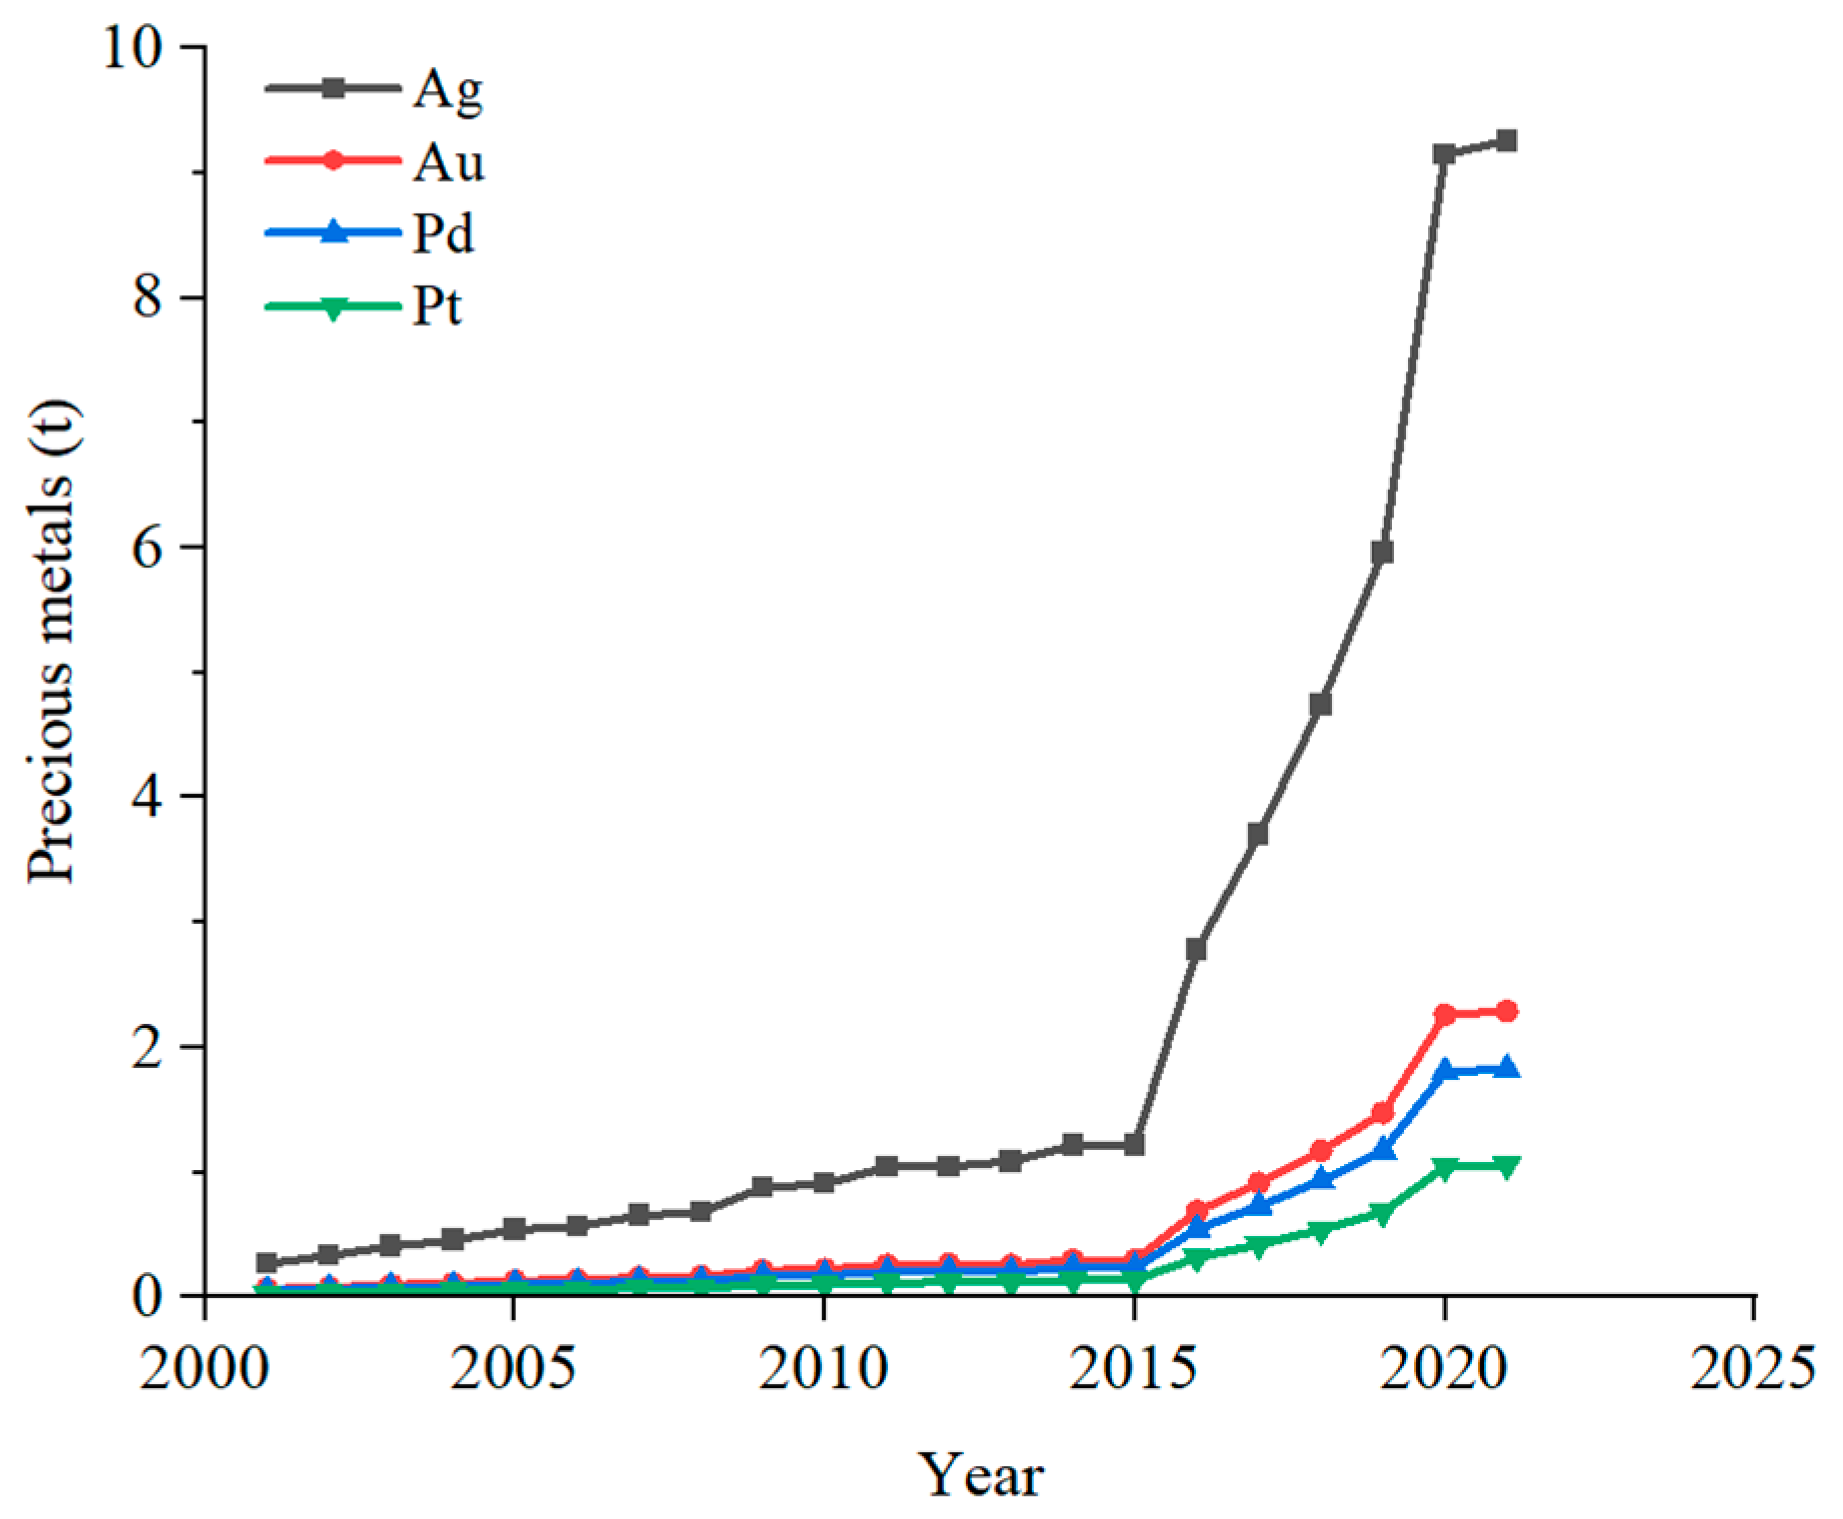
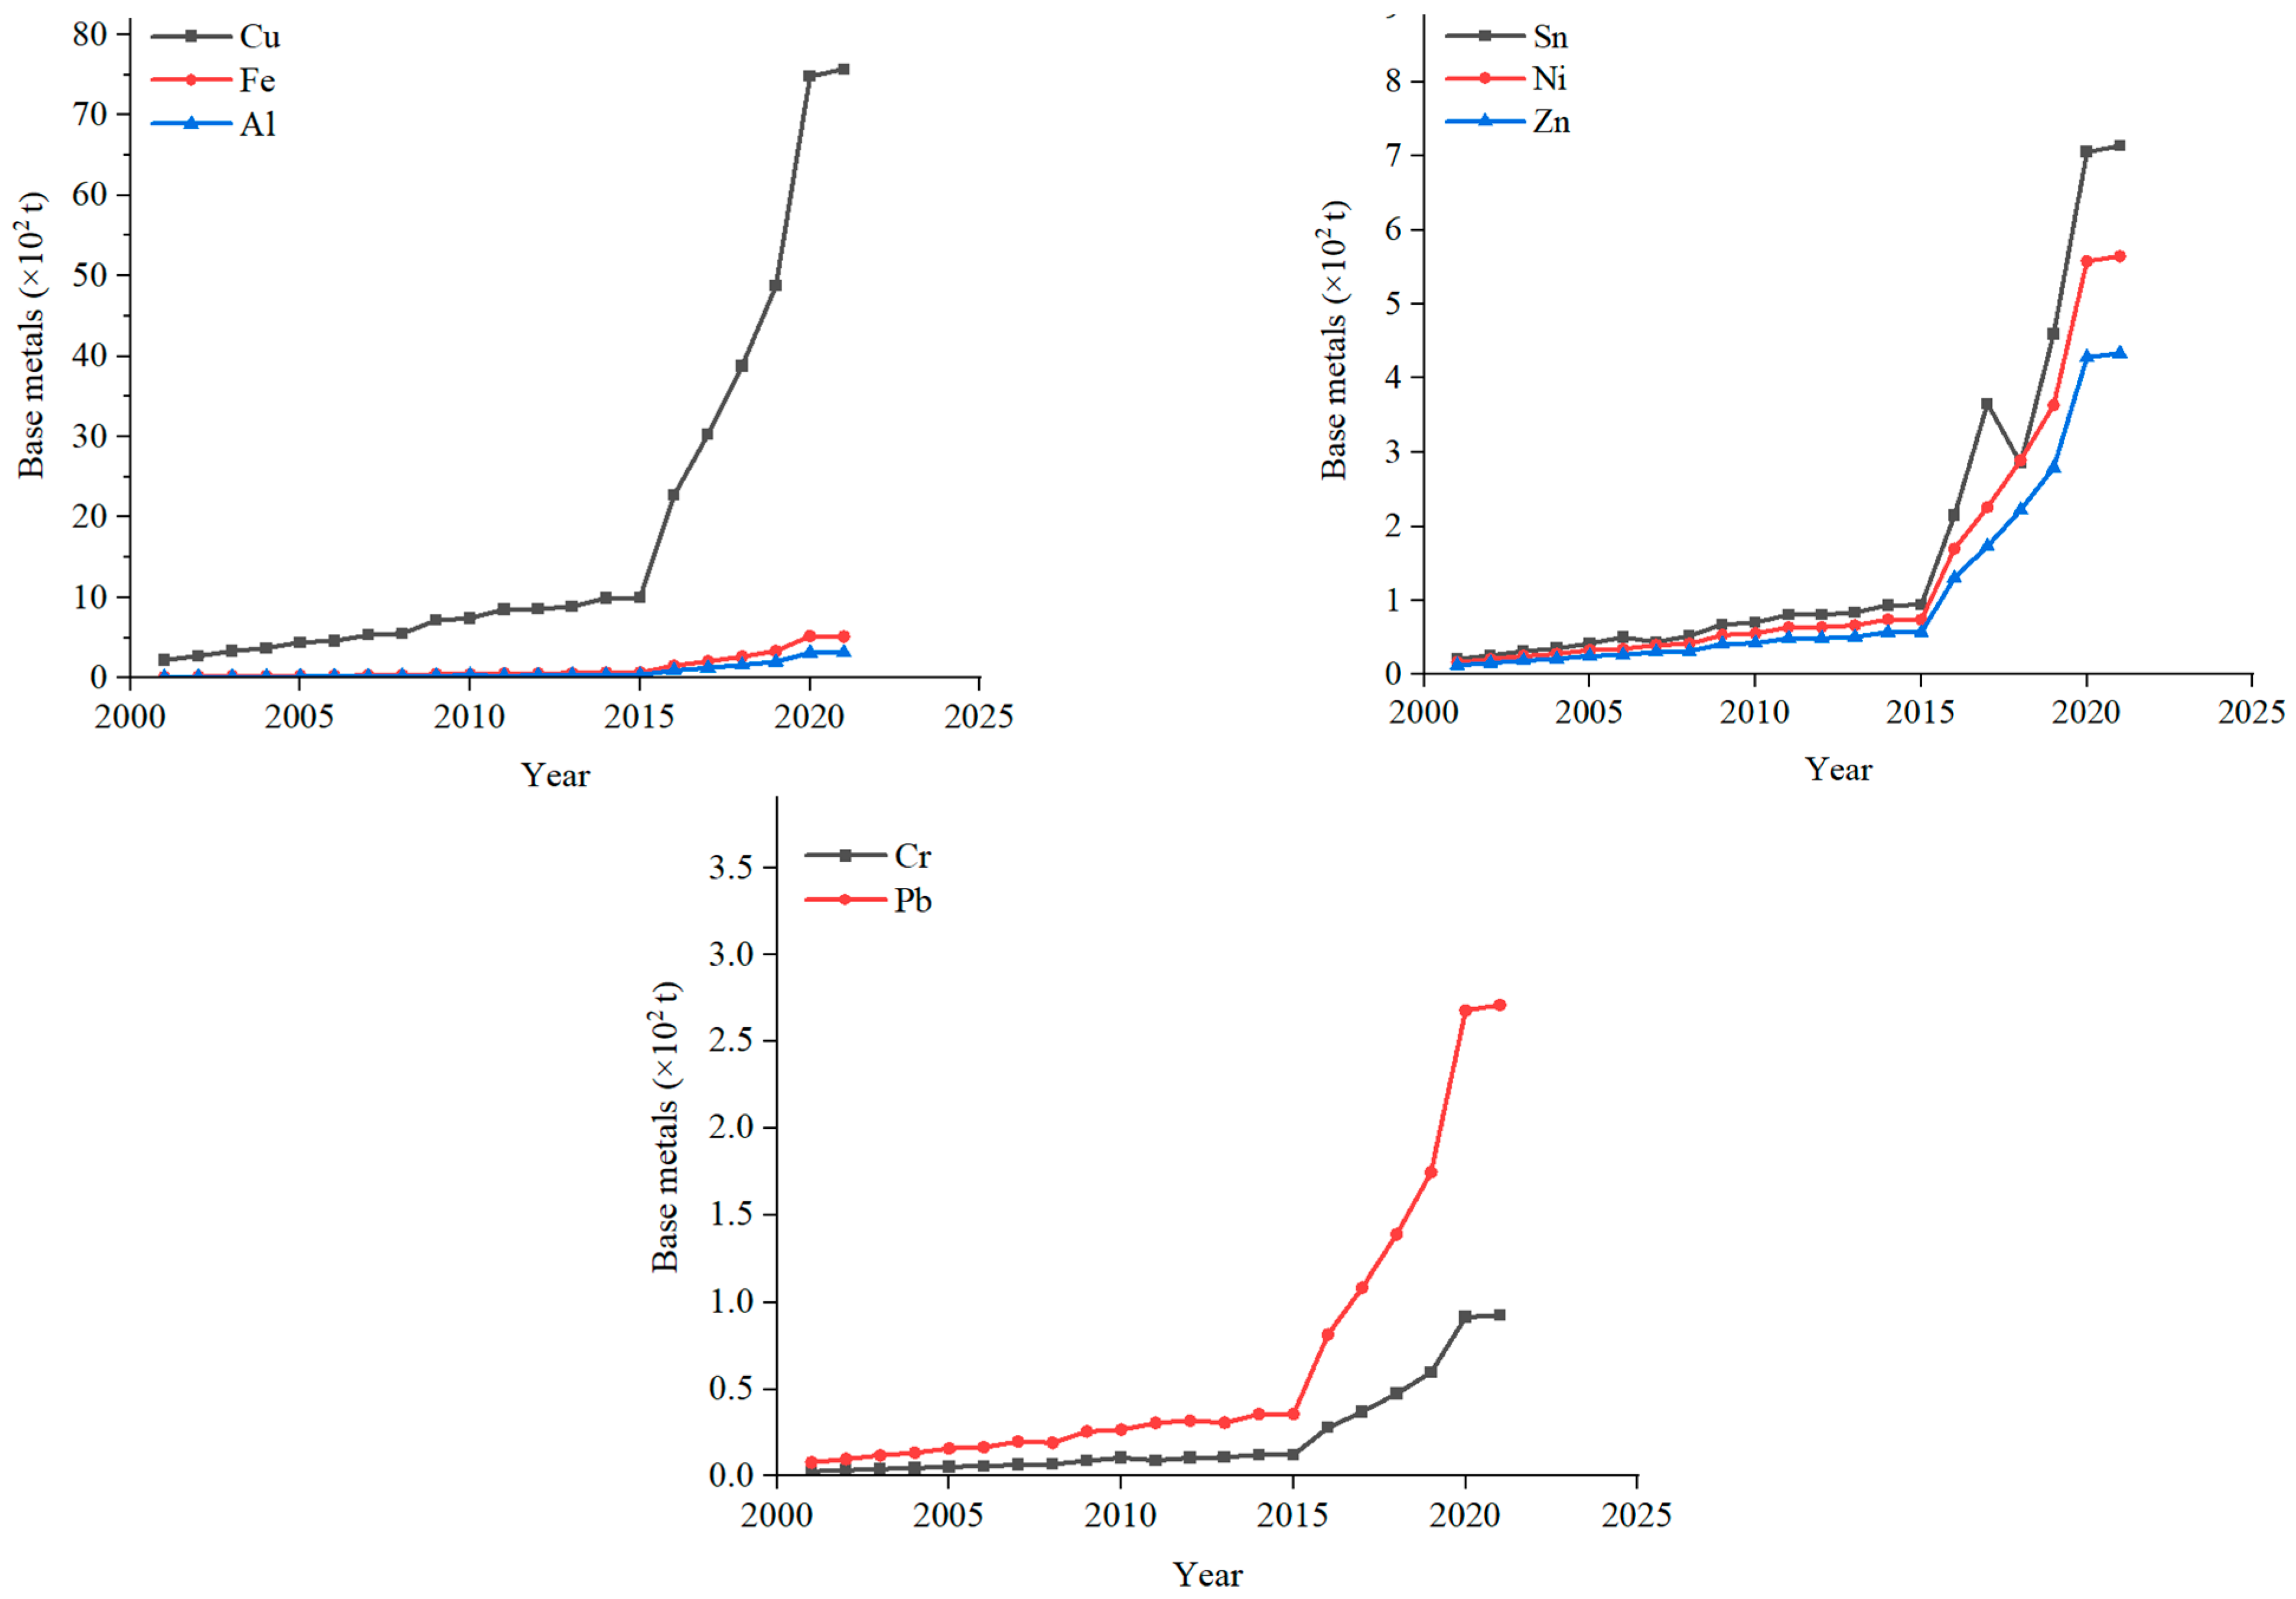
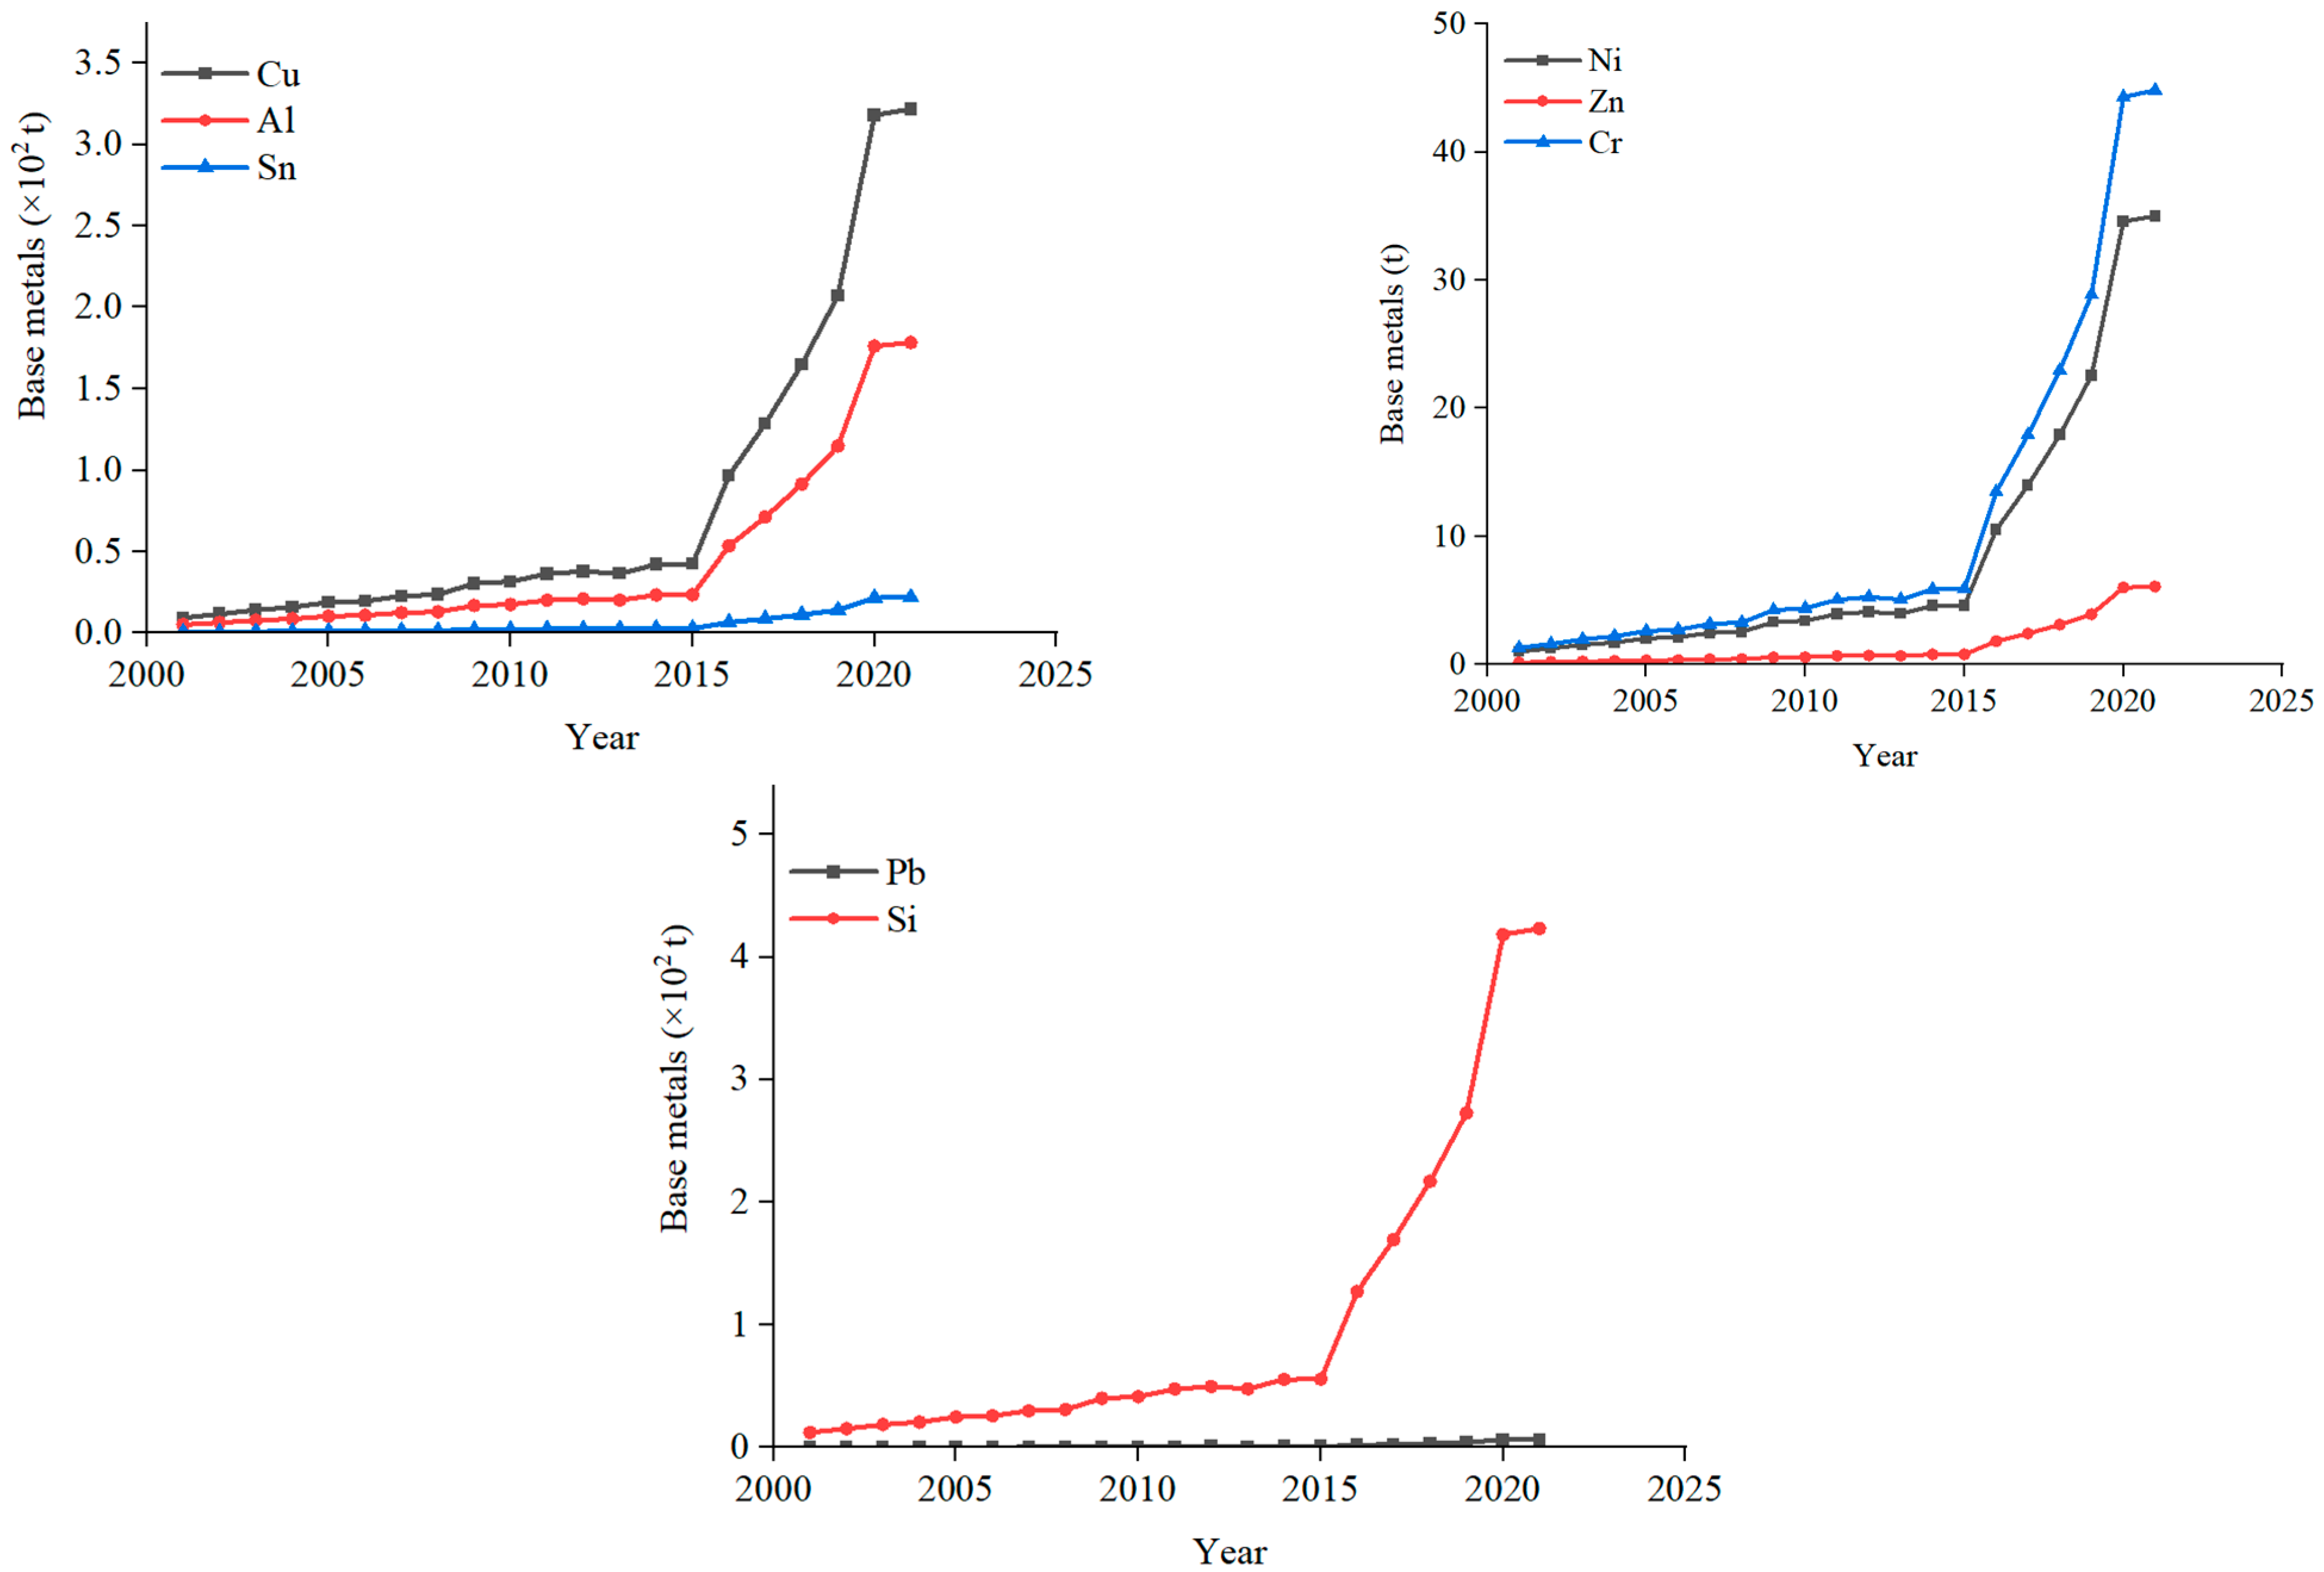
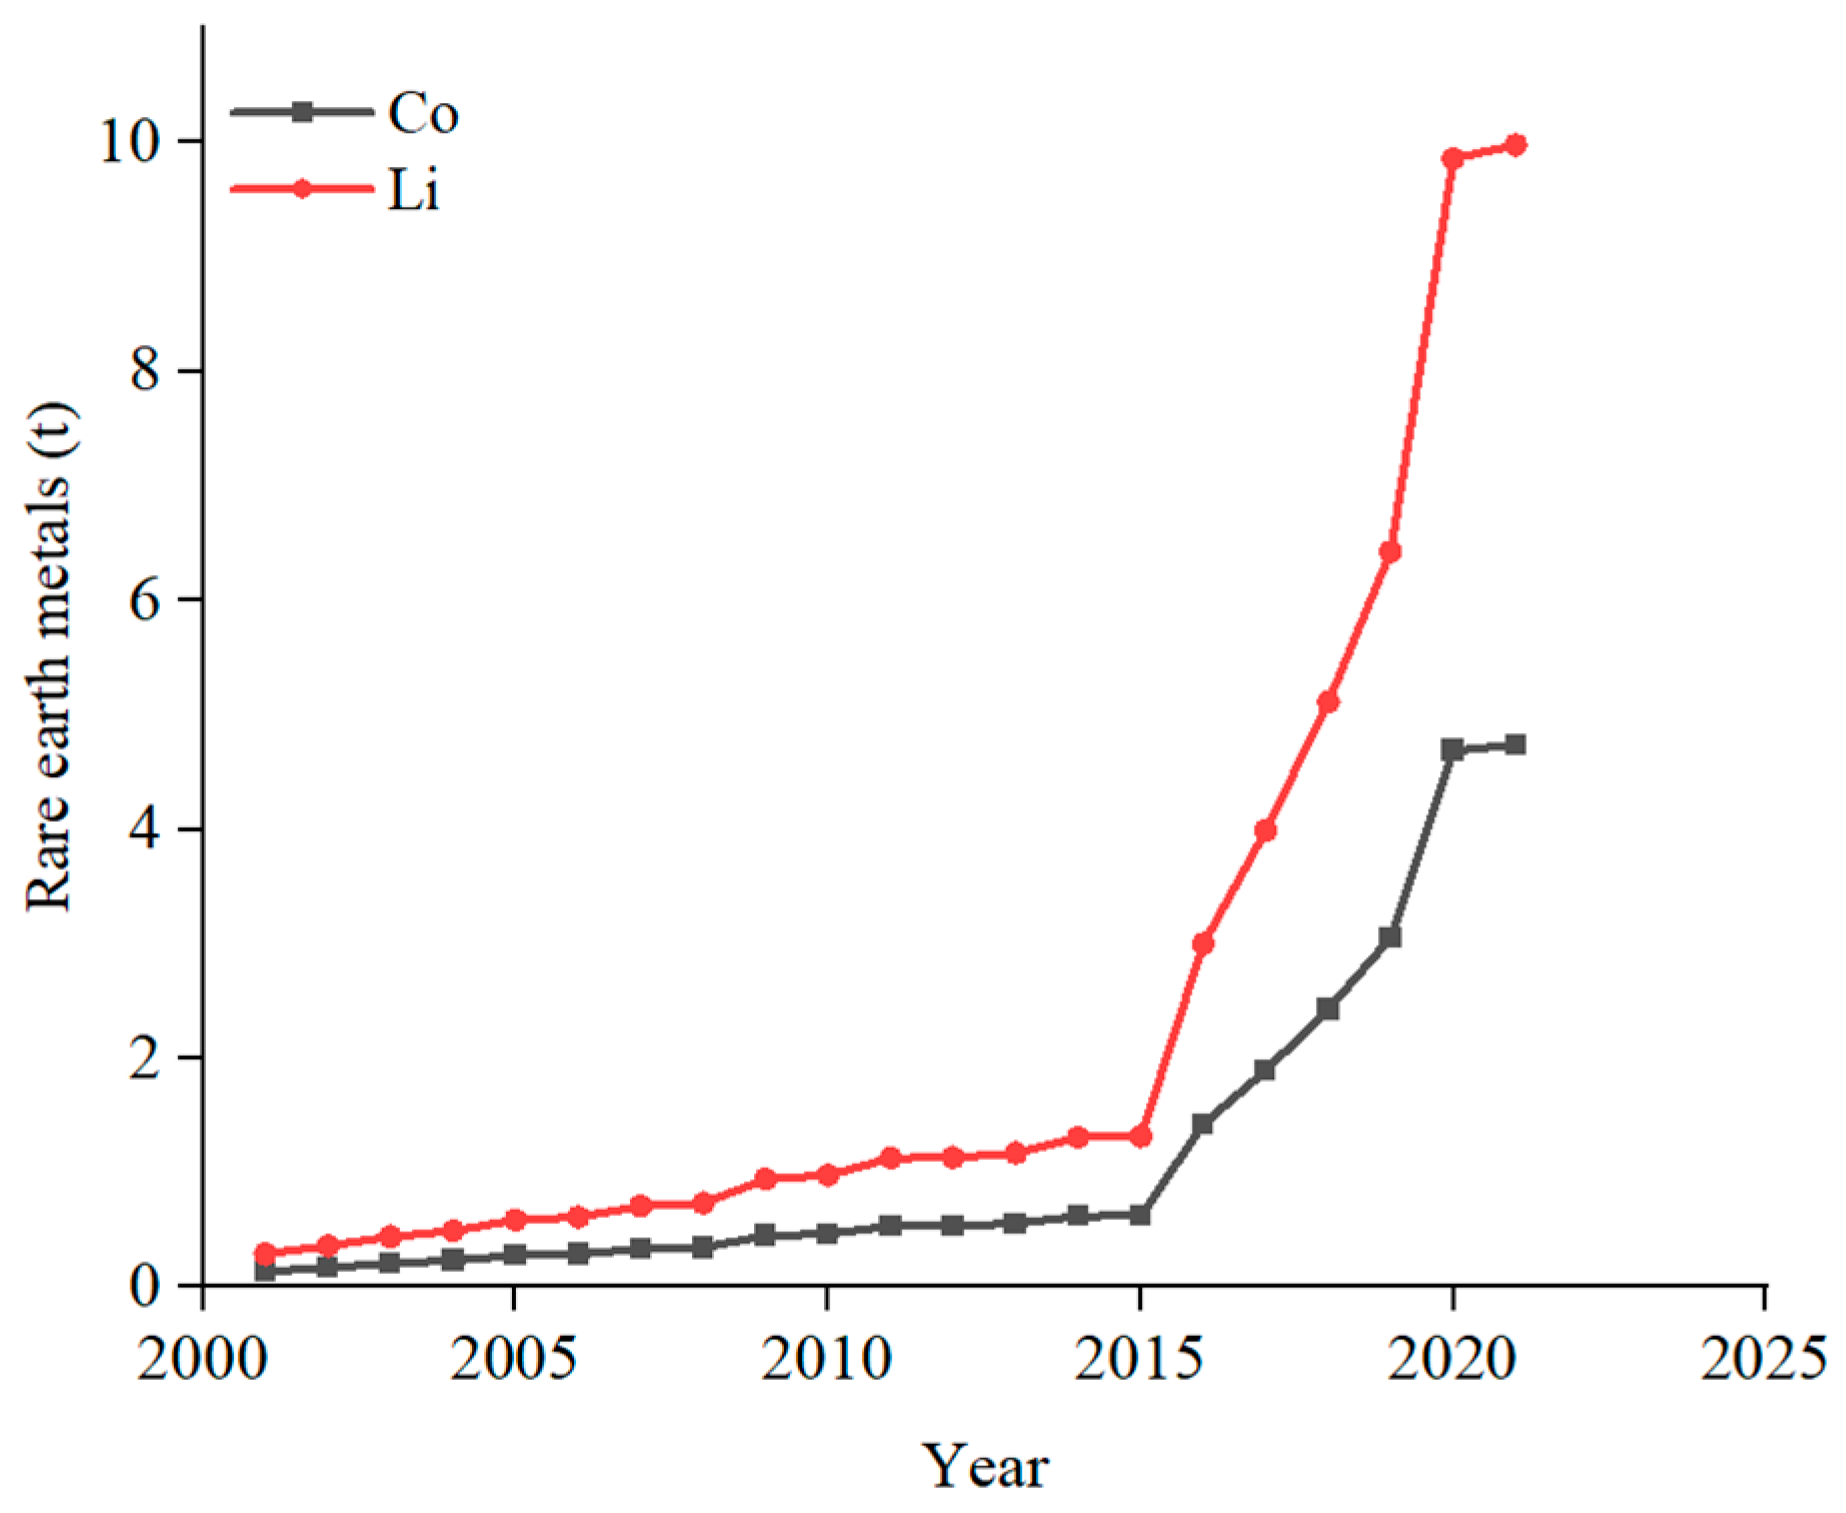
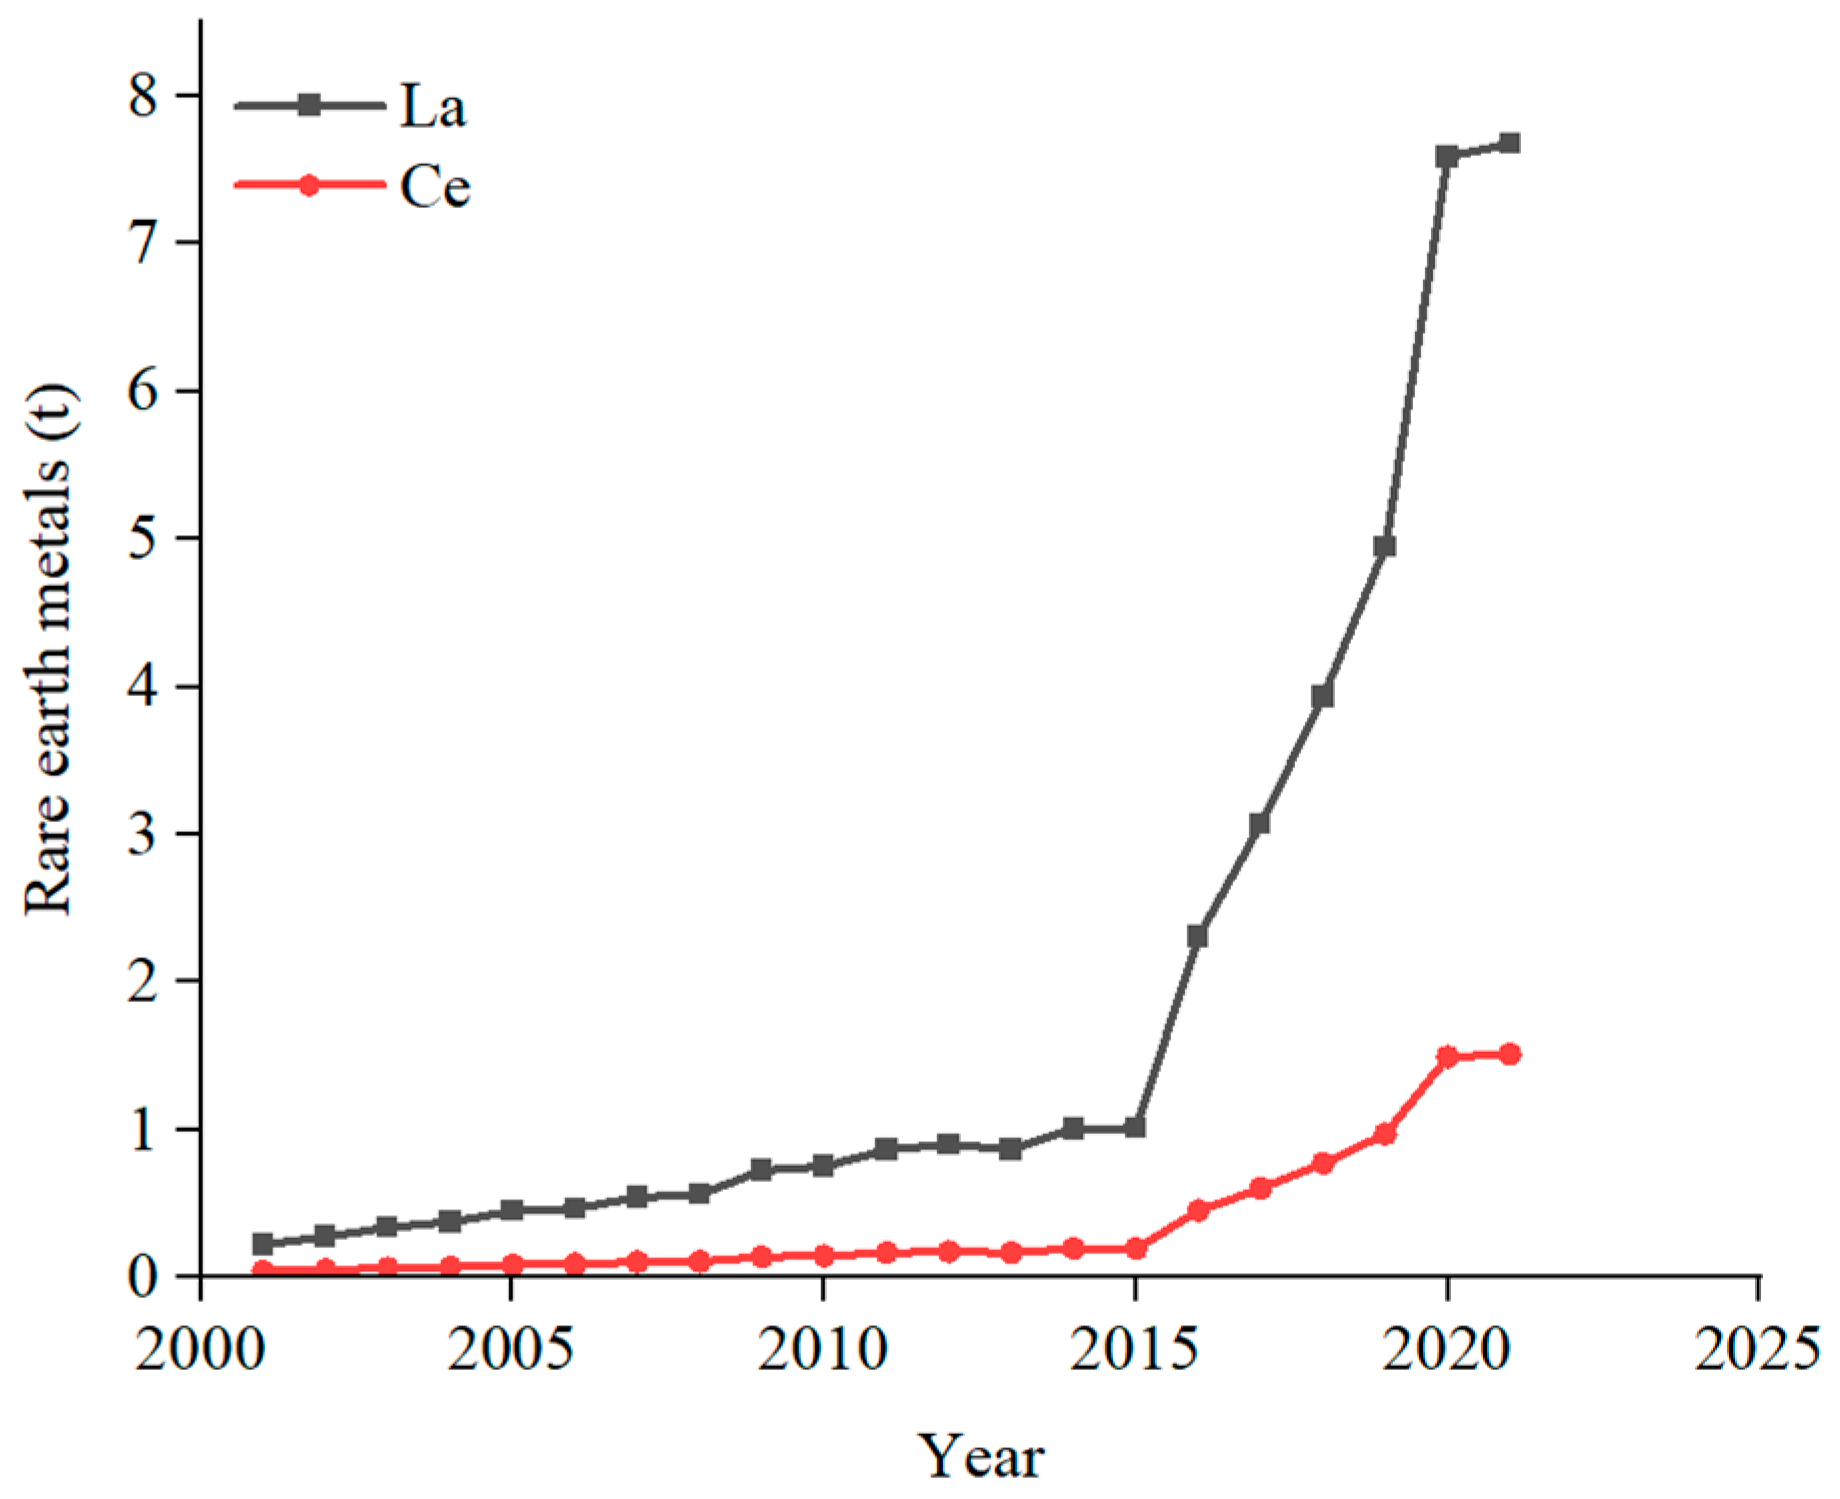
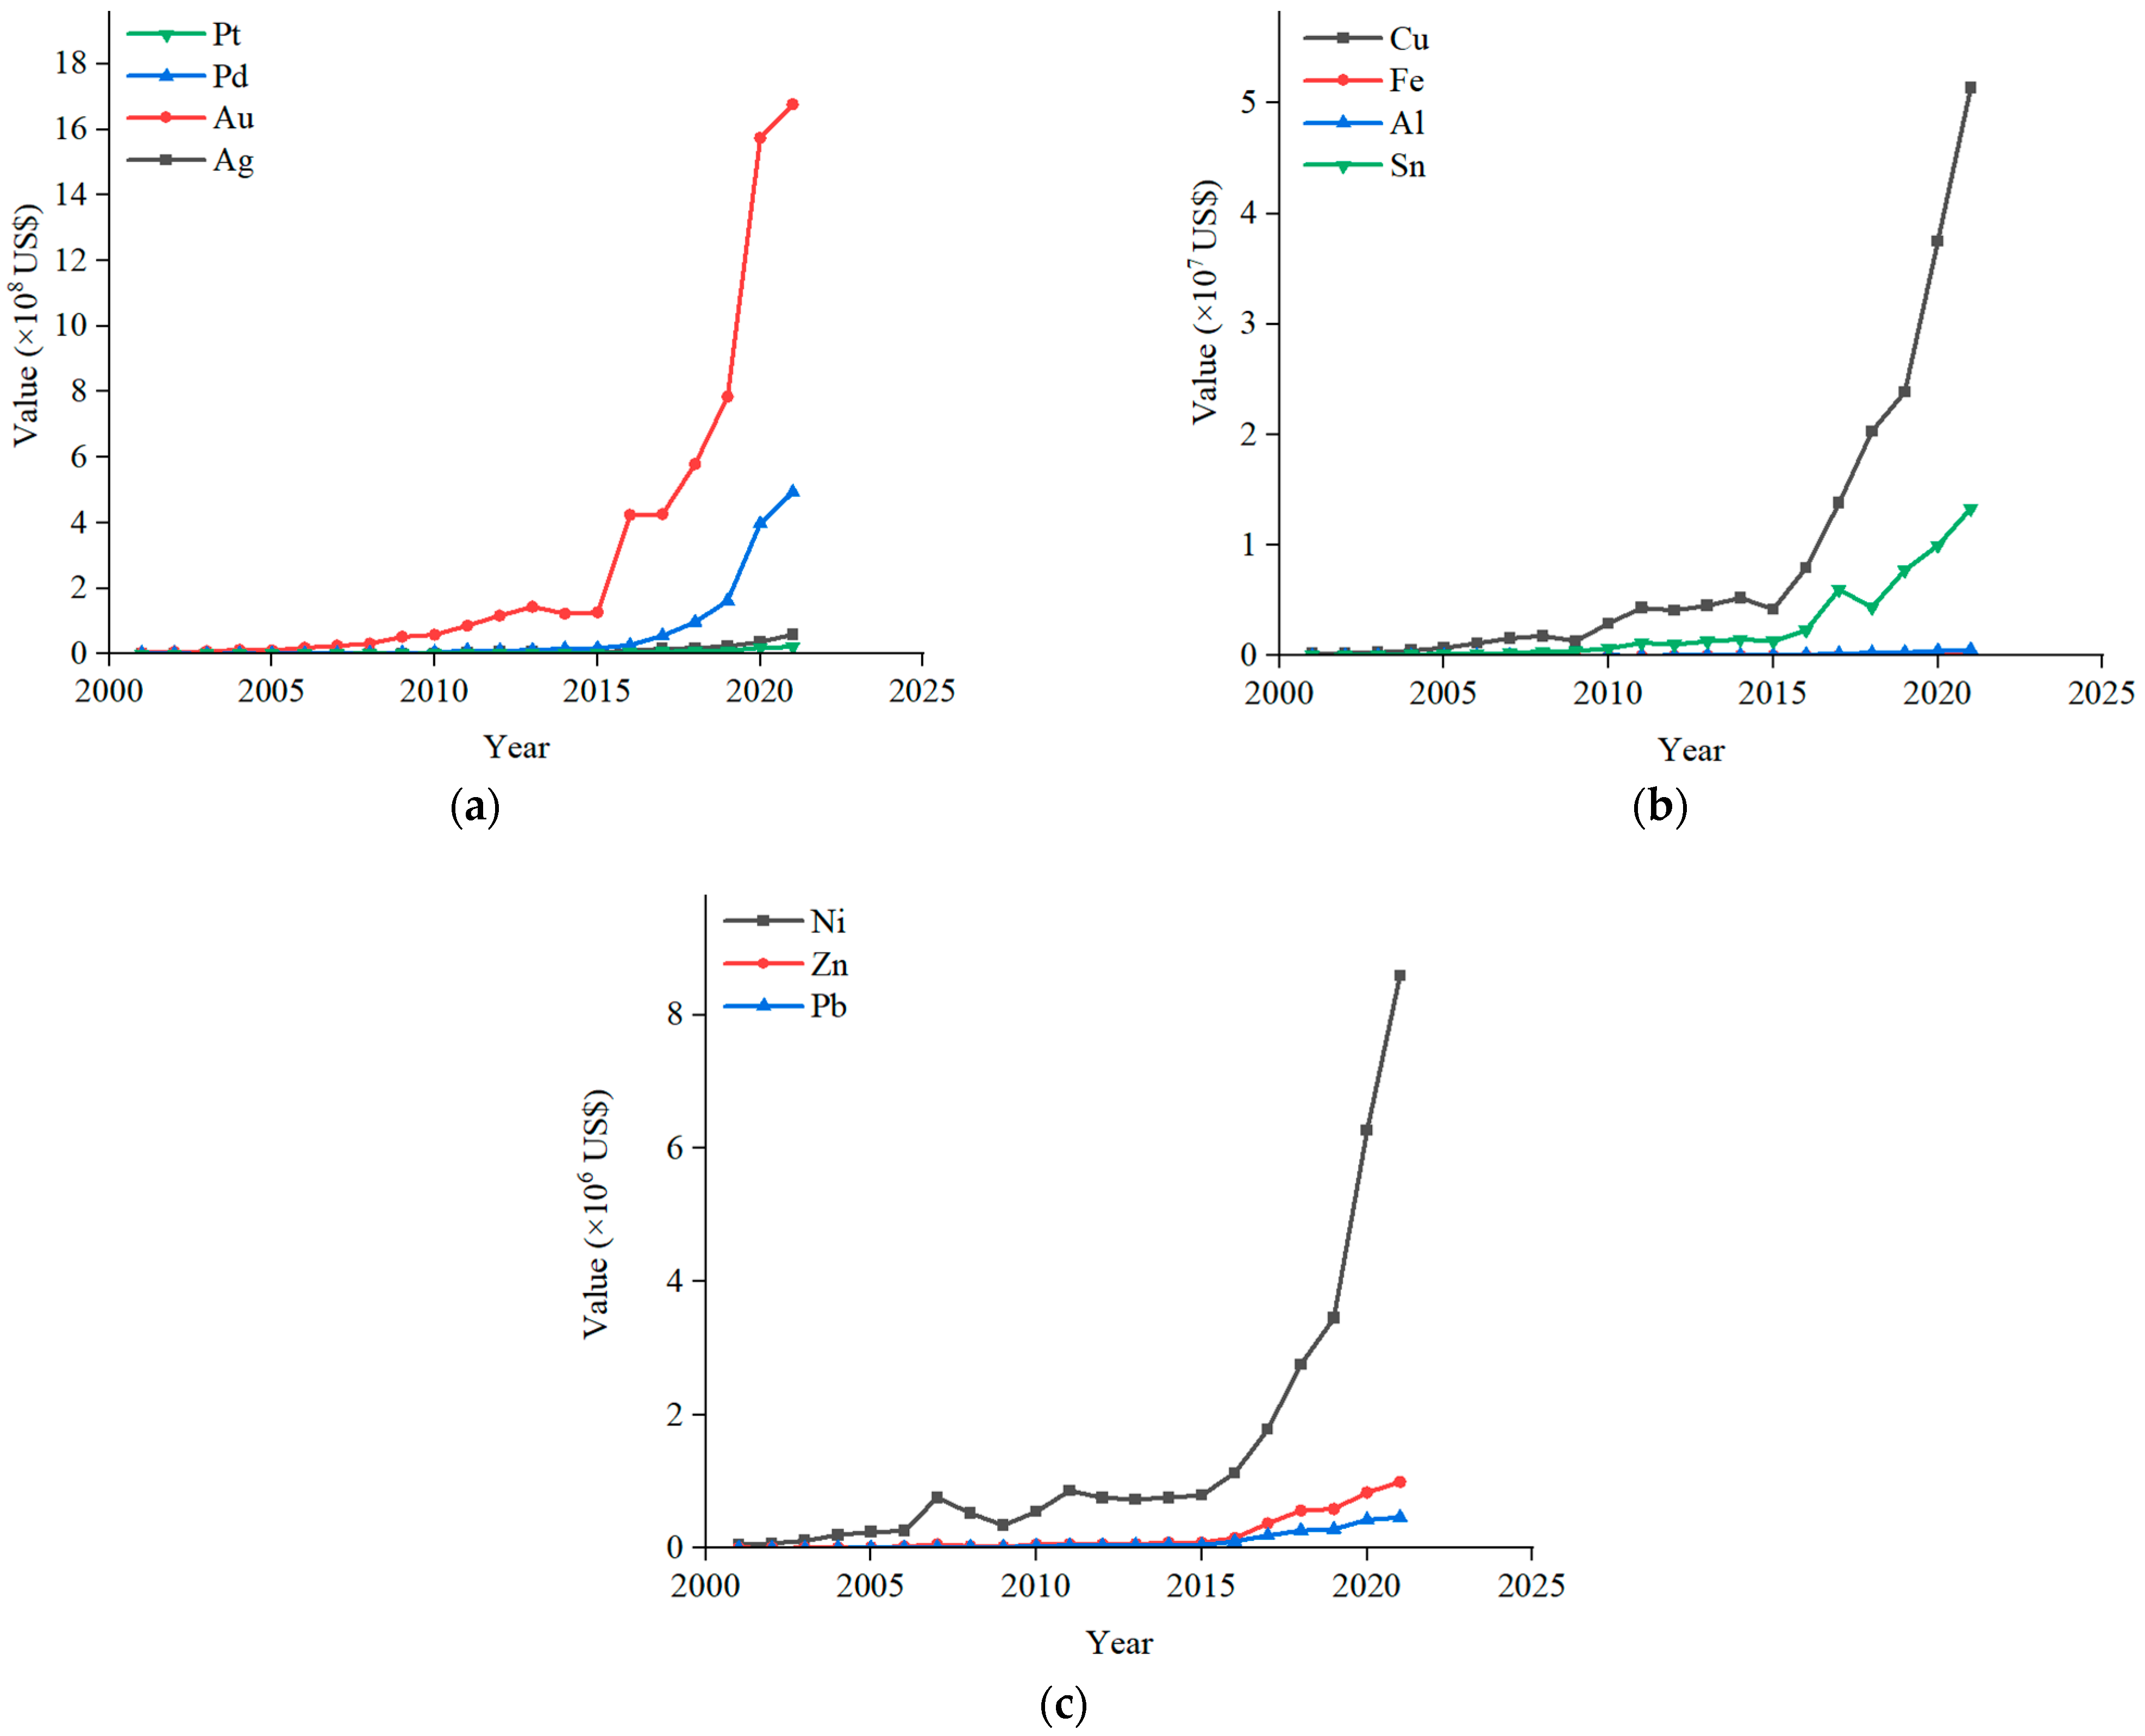
The volume of e-waste generation from 2001–2021 is given in Figure 6, where it is seen that from 2001 to 2008 the generation of e-waste gradually increased and from 2008 to 2009 there was a dip in e-waste generation because of the recession that hit India [56]. From 2012 onwards, there was a sharper rise in the generation of the e-waste because of the technological advancement and because more customers started using mobile phones. In addition, in this period smartphones with touch ability were introduced in the market in large scale. Another reason for the rise in e-waste was that at this time, android mobile phones were introduced in the market. Before 2010, the price of mobile phones was high, so less people were able to afford them, and from 2012 onwards mobile phone prices levelled off; hence, the number of customers increased.
Using an exponential smoothening approach, the forecast volume of e-waste generated from 2022 to 2035 was calculated. The data can be seen in Figure 7.

3.1. Metal Recovery

Different metals can be recovered from e-waste and can be further used in various applications. In the present study, metal recovery from PCBs and displays of mobile phones for 2001–2021 was calculated for precious metals. The data are shown in Figure 8 and Figure 9, respectively. These data show that a large quantity of Ag and Au is used in the PCBs of mobile phones relative to the displays. Taking the year 2021, approximately 81.28 t of Ag and 31.61 t of Au were extracted from PCBs, whereas from the displays of mobile phones, only 9.25 t of Ag and approximately 2.29 t of Au were extracted. Innovative processes recover precious metals from e-waste: waste-copper smelting extracts 95% Au, Ag, Pt, Pd, and Rh [57], whereas CSIR-NML’s scalable methods achieve up to 99.99% Au recovery through hydrometallurgy and adsorption [58].
For the case of the base metals, which are embedded in the PCBs and displays of the mobile phones, the volumes extracted by year up to 2021 are given in Figure 10 and Figure 11, respectively. The data show that the main metals in the case of the PCBs are copper (Cu), iron (Fe), and tin (Sn), where the tonnages extracted were approximately Cu 7568.49 t, Fe 517.72 t, and Sn 713.50 t for the year 2021. In the case of the displays of mobile phones, the main metals are copper (Cu), silicon (Si), and aluminium (Al), where the tonnages extracted were approximately Cu 321.75 t, Si 423.36 t, and Al 178.37 t for the year 2021.
In the case of metals that are embedded in the PCBs and displays of mobile phones, the tonnage extracted up to 2021 is shown in Figure 12 for Co and Li and Figure 13 for La and Ce. The data show that the main rare earth metal that contributes to the PCBs is Li, with approximately 9.98 t in the year 2021, and for the case of the displays of the mobile phones, it is La, with approximately 7.67 t in the year 2021.

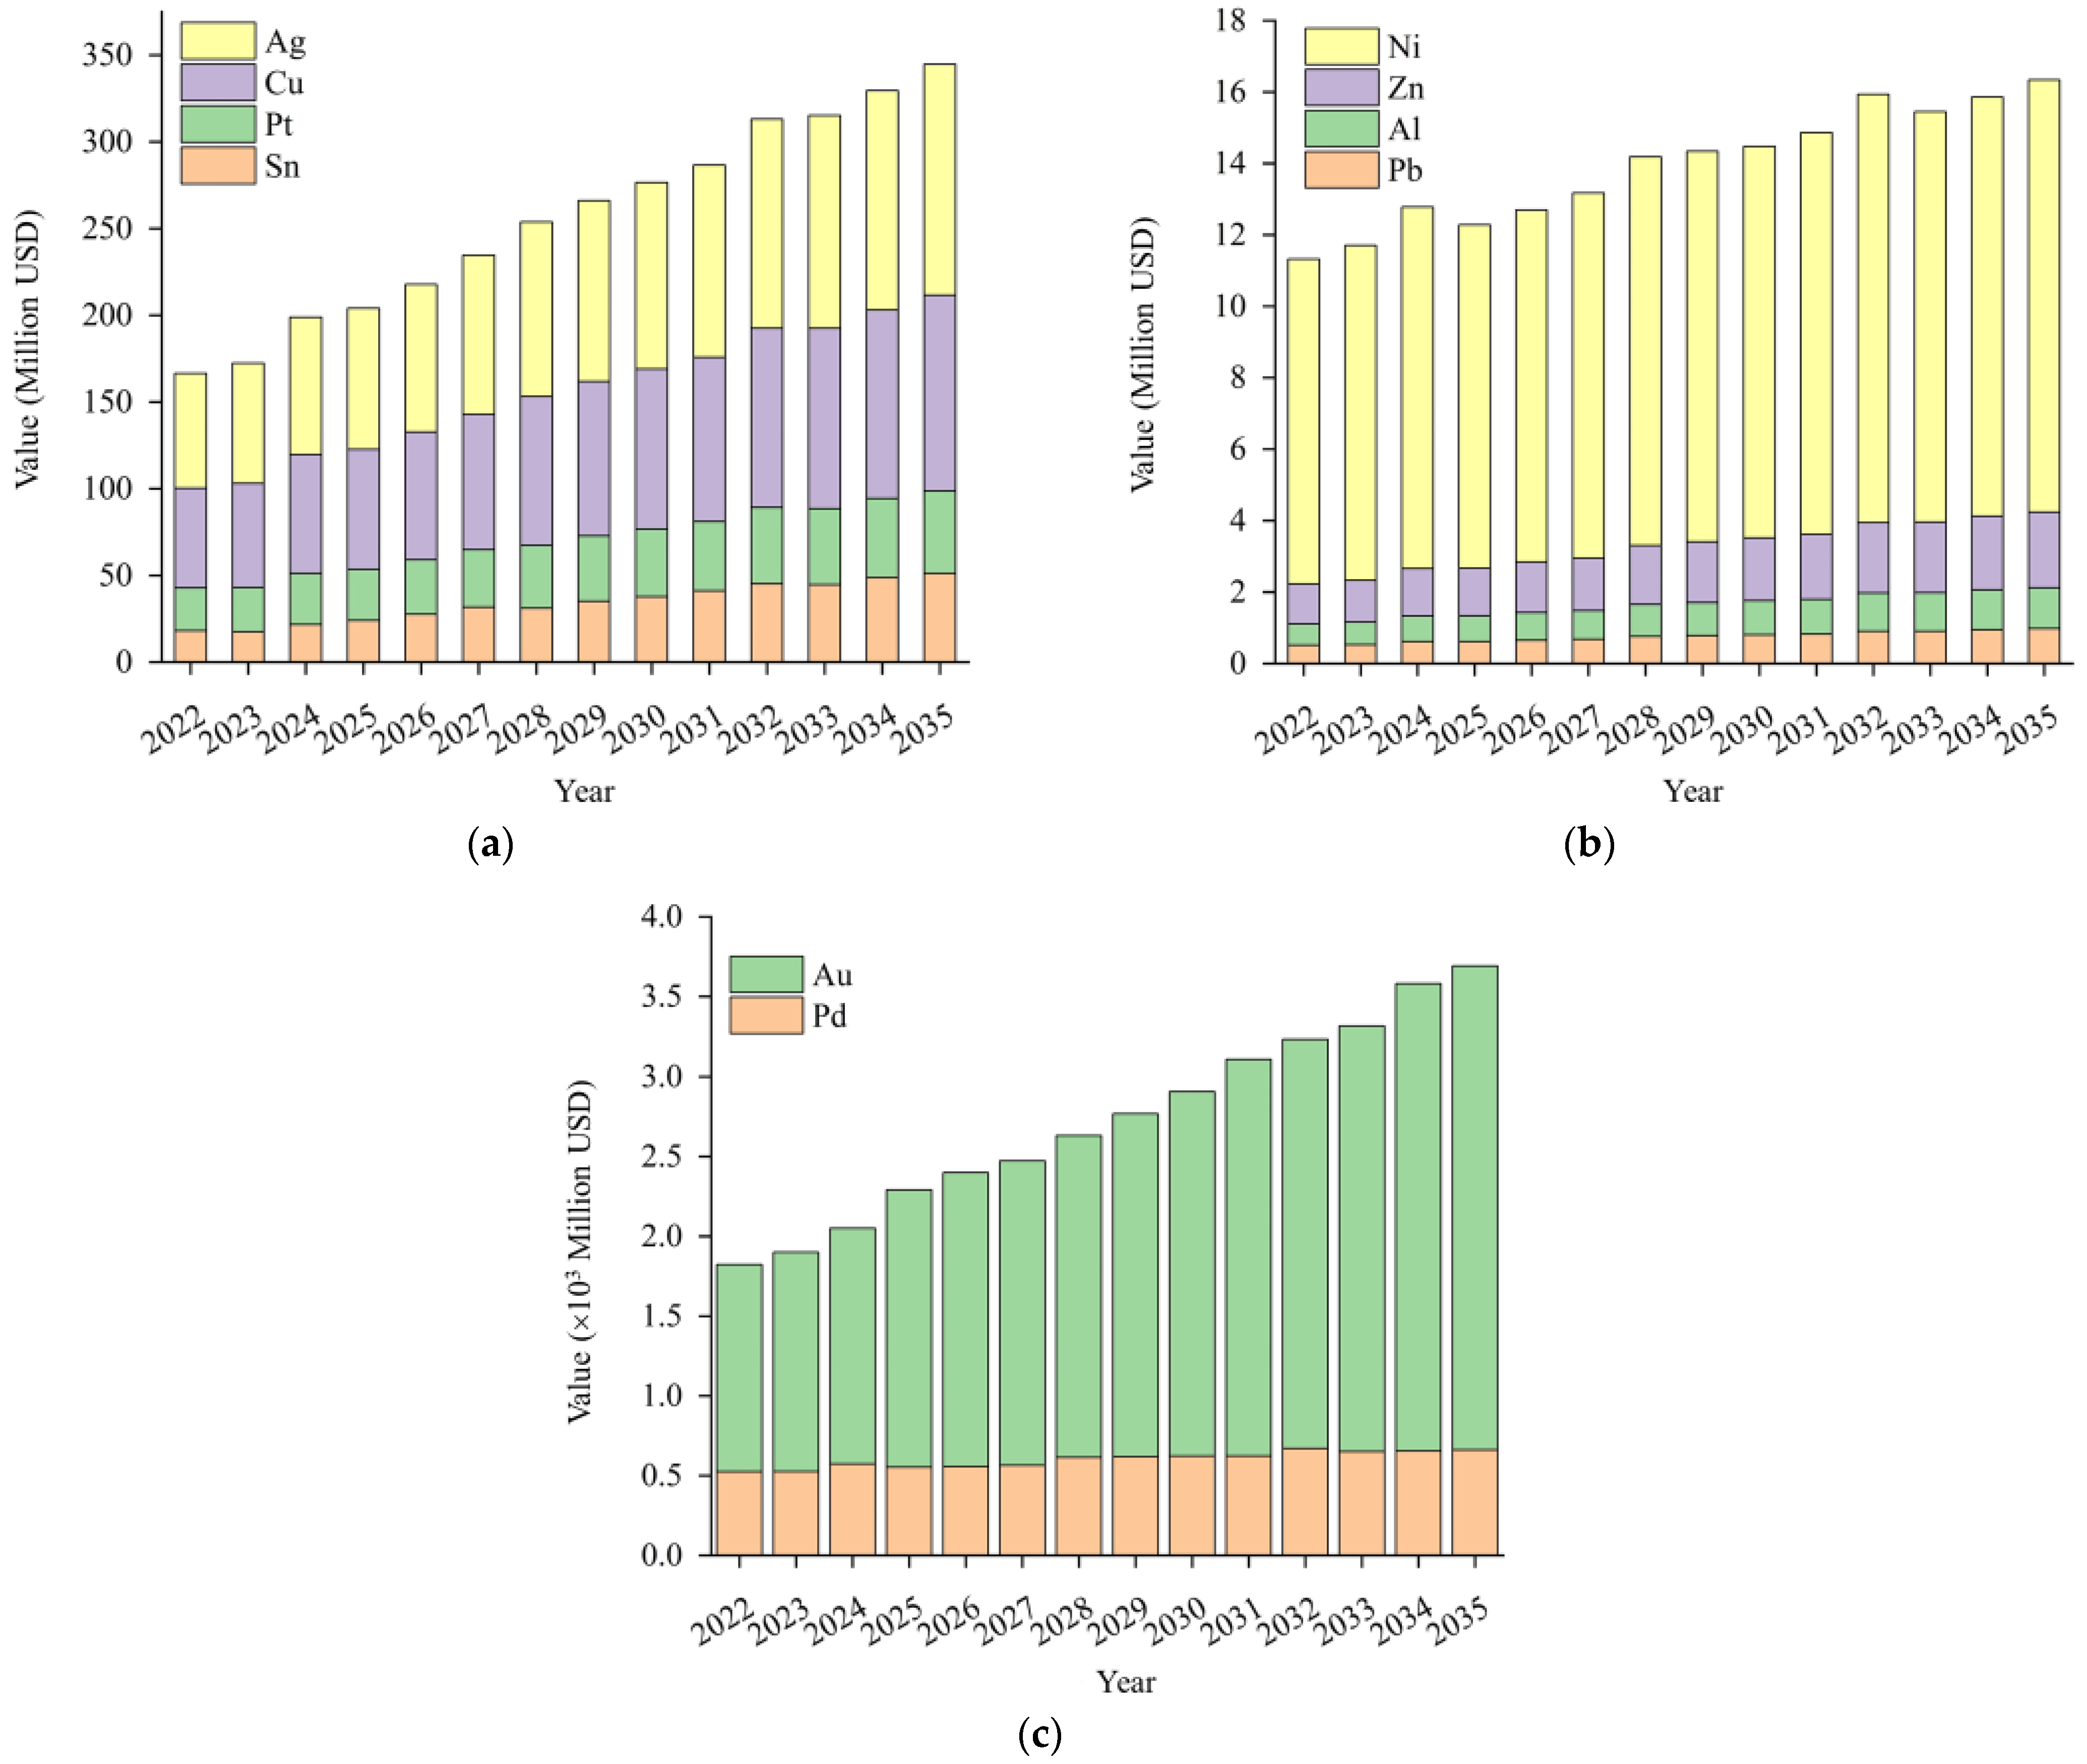
3.2. Economic Valuation from Forecasting for Valuation

The valuation up to 2021 for all the metals recovered from mobile phone e-waste is given in Figure 14a for precious metals and Figure 14b,c for base metals. From the data, it is seen that Au and Pd from the precious metals category contribute most to the economic valuation; in the year 2021, approximately 72% of the total revenue generated was contributed by Au and 21% by Pd, which is approximately USD 230 M for the case of the gold and USD 50.63 M for the case of the palladium. For the year 2021, 96% of the total economic valuation was contributed by the precious metals Au, Ag, Pd, and Pt. Their high valuation is driven by fluctuating international market prices. These variations are primarily driven by global supply–demand imbalances, industrial demand, and geopolitical factors.
The economic valuation for gold (Au) and palladium (Pd) was found to be approximately USD 1745 M and USD 513 M, respectively, towards the end of the year 2021, and after forecasting using the exponential time smoothening method (ETS), their economic valuation can be seen to approximately reach USD 3030 million and USD 661 M, respectively, towards the end of the year 2035, as shown in Figure 15c. Figure 15a,b show the different forecasted values for the other metals from 2022 to 2035. However, Au prices are highly volatile due to being influenced by macroeconomic conditions such as inflation, interest rates, and currency fluctuations. Historically, Au prices have surged during economic uncertainties, increasing the potential revenue from e-waste recycling, while the price of Pd is particularly sensitive to industrial demand, primarily from automotive and electronic sectors. Supply constraints may also contribute to price instability. From Figure 15a,b, it is seen that the economic valuations for Pt, Cu, Sn, Ag, Zn, Ni, Al, and Pb are USD 23 M, USD 54 M, USD 14 M, USD 62 M, USD 2 M, USD 10 M, USD 0.6 M, and USD 0.6 M, respectively, for the year 2021. Monitoring the market trends is essential for optimizing e-waste recycling profitability and sustainability.
The forecasted values for the metals recovered from the PCBs and displays of the mobile phones and smartphones for the year 2022–2035 are shown in Table 3.

4. Conclusions and Recommendations

The present study focuses on the mobile phone e-waste generation in India for the period 2001–2021 and forecasted future trends for 2022–2035 using an exponential time smoothening methodology. The mobile phone e-waste was segregated into that from PCBs and that from displays.
In 2021, approximately 0.171 Mt of mobile phone e-waste was generated, and this is forecasted to rise to 0.276 Mt in 2035. The trend line over this period shows a rapid increase in generation from about 2014 due to advancement in mobile phone technology and an increase in mobile phone users/customers. The valuation of the contained metals in the e-waste was segregated into that from precious metals (Ag, Au, Pd, and Pt), base metals (Cu, Fe, Al, Sn, Zn, Ni, Pb, and Cr), and rare earth/battery metals (La, Ce, Co, and Li). Data for 2021 showed higher levels/valuation from PCB components compared to display components, for example, 30 t of gold in PCBs but 2.5 t in displays. This year, gold accounted for 92% of the total metal valuation, and palladium accounted for 21%, with an economic valuation of USD 1745 M and USD 513 M, respectively. Overall, the forecasting data for the period 2022–2035 show that high and increasing levels of value can be obtained from recycling of spent mobile phone waste, which will be important for India in terms of job creation, revenue generation, and improved environmental outcomes.
The methodology used in the present study can be used in the future for the generation of e-waste for other electronic devices such as computer/laptops, televisions, cameras, etc. Furthermore, LCA can be performed on data from the present study to assess the environmental aspects of mobile phone e-waste generation and recycling units, with the aim of identifying the mitigation strategies. In the present study, the e-waste considered is only the values that are obtained after multiplying the POM with Weibull probability. The effect of left-over POM, which would affect the value of the e-waste, is not considered in the present study, and this aspect can be studied in the future.

Author Contributions

Conceptualization: P.J. and S.V.; methodology: P.J. and S.V.; validation: P.J.; formal analysis: S.V.; investigation: P.J. and S.V.; data curation: P.J. and S.V.; writing—original draft: P.J. and S.V.; visualization: S.V., A.R.P., N.H. and W.B.; writing—review and editing: A.R.P., N.H. and W.B.; supervision: A.R.P., N.H. and W.B.; project administration: A.R.P. and N.H.; funding acquisition: A.R.P. and N.H. All authors have read and agreed to the published version of the manuscript.

Funding

The present study received financial assistance from the research project entitled “Synergistic Supply Chain Assessment of Critical Minerals involving Australia and India” funded by CSIRO, Australia, under the India-Australia Critical Minerals Research Partnership (IACMRP) programme.

Data Availability Statement

The data presented in this study are available on request from the corresponding authors.

Conflicts of Interest

The authors declare no conflicts of interest.

References

  1. Quintero-Almanza, D.; Gamiño-Arroyo, Z.; Sánchez-Cadena, L.E.; Gómez-Castro, F.I.; Uribe-Ramírez, A.R.; Aguilera-Alvarado, A.F.; Ocampo Carmona, L.M. Recovery of cobalt from spent lithium-ion mobile phone batteries using liquid–liquid extraction. Batteries 2019, 5, 44. [Google Scholar] [CrossRef]
  2. Vats, M.C.; Singh, S.K. Assessment of gold and silver in assorted mobile phone printed circuit boards (PCBs). Waste Manag. 2015, 45, 280–288. [Google Scholar] [CrossRef] [PubMed]
  3. Islam, M.K.; Haque, N.; Somerville, M.; Pownceby, M.I.; Bhargava, S.; Tardio, J. Estimation of the generation and value recovery from e-waste printed circuit boards: Bangladesh case study. In REWAS 2022: Developing Tomorrow’s Technical Cycles; Springer International Publishing: Cham, Germany, 2022; Volume I, pp. 91–102. [Google Scholar]
  4. Debnath, B.; Chowdhury, R.; Ghosh, S.K. Sustainability of metal recovery from E-waste. Front. Environ. Sci. Eng. 2018, 12, 2. [Google Scholar] [CrossRef]
  5. Ruiz, A. Latest Global E-Waste Statistics and What They Tell Us. Roundup. 2024. Available online: https://theroundup.org/global-e-waste-statistics/ (accessed on 12 June 2024).
  6. Verma, S.; Paul, A.R.; Haque, N. Selected environmental impact indicators assessment of wind energy in India using a life cycle assessment. Energies 2022, 15, 3944. [Google Scholar] [CrossRef]
  7. Kumar, A.; Gupta, A.; Verma, S.; Paul, A.R.; Jain, A.; Haque, N. Life cycle assessment based environmental footprint of a battery recycling process. In Intelligent Manufacturing and Energy Sustainability: Proceedings of ICIMES 2021; Springer: Singapore, 2022; pp. 115–123. [Google Scholar]
  8. Qadir, M.R.; Haque, N.; Chen, M.; Bruckard, W.J.; Pownceby, M.I. Formal and informal E-waste recycling methods for lithium-ion batteries: Advantages and disadvantages. In Global E-Waste Management Strategies and Future Implications; Elsevier: Amsterdam, The Netherlands, 2023; pp. 73–104. [Google Scholar]
  9. Verma, S.; Paul, A.R.; Haque, N. Assessment of materials and rare earth metals demand for sustainable wind energy growth in India. Minerals 2022, 12, 647. [Google Scholar] [CrossRef]
  10. Borthakur, A.; Govind, M. Computer and mobile phone waste in urban India: An analysis from the perspectives of public perception, consumption and disposal behaviour. J. Environ. Plan. Manag. 2019, 62, 717–740. [Google Scholar] [CrossRef]
  11. Pant, D. E-waste projection using life-span and population statistics. Int. J. Life Cycle Assess. 2013, 18, 1465–1469. [Google Scholar] [CrossRef]
  12. Wath, S.B.; Dutt, P.S.; Chakrabarti, T. E-waste scenario in India, its management and implications. Environ. Monit. Assess. 2011, 172, 249–262. [Google Scholar] [CrossRef]
  13. Ari, V. A review of technology of metal recovery from electronic waste. In E-Waste in Transition—From Pollution to Resource; InTech: Rijeka, Croatia, 2016; pp. 121–158. ISBN 978-953-51-2500-6. [Google Scholar]
  14. Islam, M.K.; Somerville, M.; Pownceby, M.I.; Tardio, J.; Haque, N.; Bhargava, S. Experimental Determination of Liquidus Temperature and Phase Equilibria of the CaO–Al2O3–SiO2–Na2O Slag System Relevant to E-Waste Smelting. In Rare Metal Technology 2021; Springer International Publishing: Cham, Germany, 2021; pp. 265–276. [Google Scholar]
  15. Song, Q.; Wang, Z.; Li, J.; Zeng, X. The life cycle assessment of an e-waste treatment enterprise in China. J. Mater. Cycles Waste Manag. 2013, 15, 469–475. [Google Scholar] [CrossRef]
  16. Joshi, A.; Gupta, A.; Verma, S.; Paul, A.R.; Jain, A.; Haque, N. Life cycle based greenhouse gas footprint assessment of a smartphone. In IOP Conference Series: Earth and Environmental Science; IOP Publishing: Bristol, UK, 2021; Volume 795, p. 012028. [Google Scholar]
  17. He, P.; Feng, H.; Chhipi-Shrestha, G.; Hewage, K.; Sadiq, R. Life Cycle Assessment of e-Waste–Waste Cellphone Recycling. In Electronic Waste: Recycling and Reprocessing for a Sustainable Future; Wiley-VCH: Weinheim, Germany, 2022; pp. 231–253. ISBN 9783527816392. [Google Scholar]
  18. Yu, J.; Williams, E.; Ju, M. Analysis of material and energy consumption of mobile phones in China. Energy Policy 2010, 38, 4135–4141. [Google Scholar] [CrossRef]
  19. Adie, G.U.; Sun, L.; Zeng, X.; Zheng, L.; Osibanjo, O.; Li, J. Examining the evolution of metals utilized in printed circuit boards. Environ. Technol. 2017, 38, 1696–1701. [Google Scholar] [CrossRef] [PubMed]
  20. Holgersson, S.; Steenari, B.M.; Björkman, M.; Cullbrand, K. Analysis of the metal content of small-size Waste Electric and Electronic Equipment (WEEE) printed circuit boards—Part 1: Internet routers, mobile phones and smart phones. Resour. Conserv. Recycl. 2018, 133, 300–308. [Google Scholar] [CrossRef]
  21. Islam, M.T.; Huda, N. E-waste in Australia: Generation estimation and untapped material recovery and revenue potential. J. Clean. Prod. 2019, 237, 117787. [Google Scholar] [CrossRef]
  22. Kiran, M.; Shanmugam, P.V.; Mishra, A.; Mehendale, A.; Sherin, H.N. A multivariate discrete grey model for estimating the waste from mobile phones, televisions, and personal computers in India. J. Clean. Prod. 2021, 293, 126185. [Google Scholar] [CrossRef]
  23. Nithya, R.; Sivasankari, C.; Thirunavukkarasu, A. Electronic waste generation, regulation and metal recovery: A review. Environ. Chem. Lett. 2021, 19, 1347–1368. [Google Scholar] [CrossRef]
  24. Yaashikaa, P.R.; Priyanka, B.; Kumar, P.S.; Karishma, S.; Jeevanantham, S.; Indraganti, S. A review on recent advancements in recovery of valuable and toxic metals from e-waste using bioleaching approach. Chemosphere 2022, 287, 132230. [Google Scholar] [CrossRef] [PubMed]
  25. Roy, H.; Rahman, T.U.; Suhan, M.B.K.; Al-Mamun, M.R.; Haque, S.; Islam, M.S. A comprehensive review on hazardous aspects and management strategies of electronic waste: Bangladesh perspectives. Heliyon 2022, 8, e09802. [Google Scholar] [CrossRef]
  26. Aaltonen, M.; Peng, C.; Wilson, B.P.; Lundström, M. Leaching of metals from spent lithium-ion batteries. Recycling 2017, 2, 20. [Google Scholar] [CrossRef]
  27. Gupta, N.; Kumar, P.; Saini, R. India’s Electronics Industry: Potential for Domestic Manufacturing and Exports. Indian Council for Research on International Economic Relations-India Cellular and Electronics Association Publisher, New Delhi, India. 2021. Available online: https://icrier.org/pdf/India-Electronics-Industry_2021.pdf (accessed on 28 July 2023).
  28. Brožová, S.; Lisińska, M.; Saternus, M.; Gajda, B.; Simha Martynková, G.; Slíva, A. Hydrometallurgical recycling process for mobile phone printed circuit boards using ozone. Metals 2021, 11, 820. [Google Scholar] [CrossRef]
  29. ASSOCHAM. Electricals & Electronics Manufaturing In India. ASSOCHAM NEC Technol. 2018. Available online: https://in.nec.com/en_IN/pdf/ElectricalsandElectronicsManufacturinginIndia2018.pdf (accessed on 8 July 2023).
  30. Jha, M.K.; Kumari, A.; Jha, A.K.; Kumar, V.; Hait, J.; Pandey, B.D. Recovery of lithium and cobalt from waste lithium ion batteries of mobile phone. Waste Manag. 2013, 33, 1890–1897. [Google Scholar] [CrossRef]
  31. Sahan, M.; Kucuker, M.A.; Demirel, B.; Kuchta, K.; Hursthouse, A. Determination of metal content of waste mobile phones and estimation of their recovery potential in Turkey. Int. J. Environ. Res. Public Health 2019, 16, 887. [Google Scholar] [CrossRef] [PubMed]
  32. Chatterjee, S. Electronic Waste and India. Department of Information Technology Electronics Niketan, 6, C.G.O. Complex New Delhi-110 003, India. Available online: www.meity.gov.in/static/uploads/2024/03/EWaste_Sep11_892011.pdf (accessed on 28 May 2024).
  33. Islam, M.K.; Haque, N.; Somerville, M.A. Characterisation and techno-economics of a process to recover value from e-waste materials. In TMS 2021 150th Annual Meeting & Exhibition Supplemental Proceedings; Springer International Publishing: Cham, Germany, 2021; pp. 995–1006. [Google Scholar]
  34. Gupta, N.; Trivedi, A.; Hait, S. Material composition and associated toxicological impact assessment of mobile phones. J. Environ. Chem. Eng. 2021, 9, 104603. [Google Scholar] [CrossRef]
  35. Kaushal, R.K.; Nema, A.K. An analysis of preferences for hazardous substances free products: Manufacturing, use and end of life of mobile phones. Waste Manag. Res. 2012, 30, 1169–1177. [Google Scholar] [CrossRef]
  36. Zink, T.; Maker, F.; Geyer, R.; Amirtharajah, R.; Akella, V. Comparative life cycle assessment of smartphone reuse: Repurposing vs. refurbishment. Int. J. Life Cycle Assess. 2014, 19, 1099–1109. [Google Scholar] [CrossRef]
  37. Song, Q.; Zeng, X.; Li, J.; Duan, H.; Yuan, W. Environmental risk assessment of CRT and PCB workshops in a mobile e-waste recycling plant. Environ. Sci. Pollut. Res. 2015, 22, 12366–12373. [Google Scholar] [CrossRef]
  38. Sarath, P.; Bonda, S.; Mohanty, S.; Nayak, S.K. Mobile phone waste management and recycling: Views and trends. Waste Manag. 2015, 46, 536–545. [Google Scholar] [CrossRef] [PubMed]
  39. Singh, N.; Duan, H.; Ogunseitan, O.A.; Li, J.; Tang, Y. Toxicity trends in E-Waste: A comparative analysis of metals in discarded mobile phones. J. Hazard. Mater. 2019, 380, 120898. [Google Scholar] [CrossRef]
  40. Singh, N.; Duan, H.; Yin, F.; Song, Q.; Li, J. Characterizing the materials composition and recovery potential from waste mobile phones: A comparative evaluation of cellular and smart phones. ACS Sustain. Chem. Eng. 2018, 6, 13016–13024. [Google Scholar] [CrossRef]
  41. Annamalai, M.; Gurumurthy, K. Characterization of end-of-life mobile phone printed circuit boards for its elemental composition and beneficiation analysis. J. Air Waste Manag. Assoc. 2021, 71, 315–327. [Google Scholar] [CrossRef]
  42. Koshta, N.; Patra, S.; Singh, S.P. Estimation of E-waste at micro level for reverse logistics: A case of Delhi. J. Clean. Prod. 2021, 314, 128063. [Google Scholar] [CrossRef]
  43. Prabhu, N.S.; Majhi, R. Disposal of obsolete mobile phones: A review on replacement, disposal methods, in-use lifespan, reuse and recycling. Waste Manag. Res. 2023, 41, 18–36. [Google Scholar] [CrossRef] [PubMed]
  44. Switzer, J.; Marcano, G.; Kastner, R.; Pannuto, P. Junkyard computing: Repurposing discarded smartphones to minimize carbon. In Proceedings of the 28th ACM International Conference on Architectural Support for Programming Languages and Operating Systems, Vancouver, BC, Canada, 25–29 March 2023; Volume 2, pp. 400–412. [Google Scholar]
  45. Bhagat-Ganguly, V. E-Waste Management: Challenges and Opportunities in India; Routledge India: Delhi, India, 2021. [Google Scholar]
  46. Turaga, R.M.R.; Bhaskar, K.; Sinha, S.; Hinchliffe, D.; Hemkhaus, M.; Arora, R.; Chatterjee, S.; Khetriwal, D.S.; Radulovic, V.; Singhal, P.; et al. E-Waste Management in India: Issues and Strategies. Vikalpa 2019, 44, 127–162. [Google Scholar] [CrossRef]
  47. Manish, A.; Chakraborty, P. E-Waste Management in India: Challenges and Opportunities. Energy Resour. Inst. 2019. Available online: https://www.teriin.org/article/e-waste-management-india-challenges-and-opportunities (accessed on 18 November 2023).
  48. Biswas, A.; Singh, S.G.; Singh, S.G. E-Waste Management in India: Challenges and Agenda. Cent. Sci. Environ. 2020, pp. 1–58. Available online: https://www.cseindia.org/e-waste-management-in-india-10593 (accessed on 24 May 2024).
  49. Qadir, M.R.; Chen, M.; Haque, N.; Bruckard, W. Estimated End-of-Life Lithium-Ion Battery Resources for Potential Recycling in Bangladesh. In TMS Annual Meeting & Exhibition; Springer Nature: Cham, Germany, 2023; pp. 161–174. [Google Scholar]
  50. Mairizal, A.Q.; Sembada, A.Y.; Tse, K.M.; Rhamdhani, M.A. Electronic waste generation, economic values, distribution map, and possible recycling system in Indonesia. J. Clean. Prod. 2021, 293, 126096. [Google Scholar] [CrossRef]
  51. Golev, A.; Corder, G.D.; Rhamdhani, M.A. Estimating flows and metal recovery values of waste printed circuit boards in Australian e-waste. Miner. Eng. 2019, 137, 171–176. [Google Scholar] [CrossRef]
  52. Singh, S.K. The diffusion of mobile phones in India. Telecommun. Policy 2008, 32, 642–651. [Google Scholar] [CrossRef]
  53. Forti, V.; Baldé, K.; Kuehr, R. E-Waste Statistics: Guidelines on Classifications, Reporting and Indicators; United Nations University, ViE—SCYCLE: Bonn, Germany, 2018; ISBN 978-92-808-9066-2. [Google Scholar]
  54. ICAI. Available online: https://www.icai.org/ (accessed on 30 March 2023).
  55. Index Mundi. Available online: https://www.indexmundi.com/ (accessed on 30 March 2023).
  56. Keeley, B.; Love, P. From crisis to recovery. In OECD Insights; OECD Publishing: Paris, France, 2010; pp. 1–147. ISBN 978-92-64-06911-4. [Google Scholar]
  57. Kim, B.S.; Lee, J.C.; Jeong, J.; Yang, D.H.; Shin, D.; Lee, K.I. A novel process for extracting precious metals from spent mobile phone PCBs and automobile catalysts. Mater. Trans. 2013, 54, 1045–1048. [Google Scholar] [CrossRef]
  58. Panda, R.; Jha, M.K.; Lee, J.C.; Pathak, D.D. Developed commercial processes to recover au, ag, Pt, and Pd from E-waste. In Rare Metal Technology; Springer International Publishing: Cham, Germany, 2021; pp. 115–126. [Google Scholar]
Figure 1. Metallic constituents in Indian mobile phone e-waste [29].
Minerals 15 00259 g001
Figure 2. Flow chart for the methodology.
Minerals 15 00259 g002
Figure 3. Process flowchart in e-waste generation.
Minerals 15 00259 g003
Figure 4. Process flowchart for metal recovery from PCBs and displays in spent mobile phones [31].
Minerals 15 00259 g004
Figure 5. Process for estimation of economic value.
Minerals 15 00259 g005
Figure 6. E-waste generation from 2001 to 2021.
Minerals 15 00259 g006
Figure 7. Forecasted e-waste generation value from 2022 to 2035.
Minerals 15 00259 g007
Figure 8. Precious metals recovered from PCBs.
Minerals 15 00259 g008
Figure 9. Precious metals recovered from display.
Minerals 15 00259 g009
Figure 10. Base metals recovered from PCB.
Minerals 15 00259 g010
Figure 11. Base metals recovered from display.
Minerals 15 00259 g011
Figure 12. Metals recovered from PCBs.
Minerals 15 00259 g012
Figure 13. Rare earth metals recovered from display.
Minerals 15 00259 g013
Figure 14. Economic valuation of the recovered metals from mobile phone e-waste: (a) precious metals, (b,c) base metals.
Minerals 15 00259 g014
Figure 15. Forecasted economic value of metals from mobile phone e-waste for 2022–2035: (a,b) of the other metals; (c) of Au and Pd.
Minerals 15 00259 g015
Table 1. E-waste generation and recycling in the world [5].
CountryE-Waste Produced (Mt)Recycled Volume (Mt)Recycled (%)
China10,1291620.6416
USA69181037.715
India323032.31
Japan2569565.1822
Brazil21432143100
Russia163197.866
Indonesia161848.543
Germany1607835.6452
UK1598910.8657
France1362762.7256
Table 2. Metal data from PCBs and displays [31].
MetalPCB
(Concentration in g/kg)
Display
(Concentration in g/kg)
Ag3.60 ± 2.000.410 ± 0.190
Au1.40 ± 0.7500.102 ± 0.088
Pd0.290 ± 0.2300.081 ± 0.011
Pt0.030 ± 0.0100.470 ± 0.180
Cu335 ± 74.014.3 ± 0.750
Fe23.2 ± 15.22.50 ± 1.10
Al14.1 ± 3.507.90 ± 4.10
Sn31.6 ± 13.50.975 ± 0.012
Ni25.0 ± 13.11.55 ± 0.150
Zn19.2 ± 17.30.770 ± 0.460
Cr1.70 ± 4.101.99 ± 2.57
Pb12.0 ± 8.700.295 ± 0.114
Si18.8 ± 2.2018.8 ± 1.25
Li0.442 ± 0.2210.321 ± 0.125
Co0.210 ± 0.1800.130 ± 0.020
La0.340 ± 0.1400.210 ± 0.012
Ce0.067 ± 0.0470.016 ± 0.058
Table 3. Forecasted metal economic valuation from 2022–2035 (M USD).
YearAgAuPdPtCuAlSnNiZnPb
202266.131296.89525.0124.6957.530.6018.149.091.110.51
202369.411374.12525.7225.5659.870.6317.559.371.170.53
202479.231477.99573.2429.4968.540.7221.5910.121.330.61
202581.361736.96553.2329.5369.060.7224.079.611.330.61
202685.081840.56557.1031.3873.720.7727.609.861.410.65
202791.721907.87564.6733.0678.130.8031.6810.231.470.68
2028100.592017.22614.2236.2685.830.8931.0910.881.650.76
2029104.202148.87617.9037.6589.080.9235.1310.931.700.78
2030107.542284.02622.1539.0592.390.9537.6210.961.760.81
2031110.822486.06622.8639.9194.730.9841.1411.241.820.82
2032120.642563.29670.3743.84103.401.0745.2311.991.970.91
2033122.772667.16650.3643.88103.921.0744.6311.481.980.91
2034126.492926.14654.2345.74108.581.1248.6711.732.060.95
2035133.133029.73661.8147.42112.981.1551.1612.092.120.98
Disclaimer/Publisher’s Note: The statements, opinions and data contained in all publications are solely those of the individual author(s) and contributor(s) and not of MDPI and/or the editor(s). MDPI and/or the editor(s) disclaim responsibility for any injury to people or property resulting from any ideas, methods, instructions or products referred to in the content.

