
Geometallurgical Sampling and Testwork for Gold Mineralisation: General Considerations and a Case Study


Abstract
1. Introduction
1.1. Background
1.2. Rationale for This Paper
- Part 1 (Section 2 to Section 3) covers key considerations related to geometallurgical sampling, including considerations about composite versus variability samples; sample types; representativity; number of samples required; sample integrity; Quality Assurance/Quality Control (QAQC); and reporting results in the context of the international codes.
- Part 2 (Section 4) presents a case study of the approach used at Beatons Creek, Western Australia, to plan and expedite geometallurgical testwork. The aim of the programme was to acquire an accurate head grade of each mineralised intersection prior to destruction during recovery testwork. Additionally, comminution testwork was also performed before the whole core was crushed for assay. A protocol was developed where each mineralised interval was submitted for core scanning, comminution testwork, recombined for head grade determination by non-destructive PhotonAssay™ (PA), and subsequently submitted for recovery testwork.
2. Geometallurgical Sampling
2.1. Sampling Across the Mine Value Chain
2.1.1. Introduction
2.1.2. Theory of Sampling
2.2. Metallurgical Composite and Geometallurgical Variability Samples
- A composite sample (or master composites for some early-stage process scoping) comprises a blend of different samples (e.g., series of different drill core intersections, each one being a variability sample in its pre-composited form) from a specific domain or across domains.
- A variability sample is an individual sample collected along a continuous drill interval (e.g., core) at a given location within a domain.
- A variability-composite sample is a composite that is formed from sample intervals with minimal spatial separation. As such, they are composites but reflect some local variability in a given domain (e.g., drillholes 10 m apart).
- Deposit limits;
- Sequence of mining from the early payback period through to final years;
- Mineralisation type (geometallurgical domains);
- Mining dilution, where wall rocks may influence processability.
2.3. Geometallurgical Data Types
- ➢
- In support of strategic and tactical geometallurgical programmes:
- In situ information which is extracted virtually/digitally from the mineralisation and/or waste, for example, measure-while-drilling or downhole measurements such as density, conductivity, or assays.
- Direct information, which is extracted via direct measurement from cores or cuttings, for example, pXRF or EQUOtip.
- Ex situ physical sampling extracted from the mineralisation and/or waste, e.g., drill cores, cuttings, or chips, typical of composite and variability samples that support testwork, assays, etc.
- ➢
- In support of a tactical geometallurgical programme (including in situ, direct, and ex situ above):
- Process samples are extracted from a moving stream in the process plant. This can be particulate and solid material extracted from a conveyor belt (e.g., run-of-mill feed, etc.) or pipes (e.g., slurries, process water, etc.).
- In-line sensor-based measurements collected from moving streams (e.g., belts, pipes, froth product/flotation stations). This includes a variety of analytical technology methods such as Raman and infra-red spectroscopy, XRF, and camera-based image analysis).
2.4. Sample Representativity
2.4.1. Concepts of Representativity
- Effective domain definition, which may change with time as more drillholes and samples become available.
- Spatial distribution–that there are enough samples within a given domain with appropriate 3D coverage.
- For grade-based samples (e.g., recovery), they cover the distribution of primary grades from low to high grade and around the cut-off.
- Sample results display an appropriate Coefficient Of Variation (COV) (<20%).
- Samples results are not dominated by extreme values, or if present, such values can be explained (they may indicate real variability).
- Data are fit-for-purpose based on an appropriate QAQC programme.
2.4.2. Number of Samples
2.5. Key Considerations During Geometallurgical Sampling Programmes
2.5.1. Introduction
2.5.2. Mineralisation Complexity
2.5.3. Domaining
2.5.4. Types of Samples
2.5.5. Sample Selection–Physical Considerations
2.5.6. Sample Selection–Automated Selection
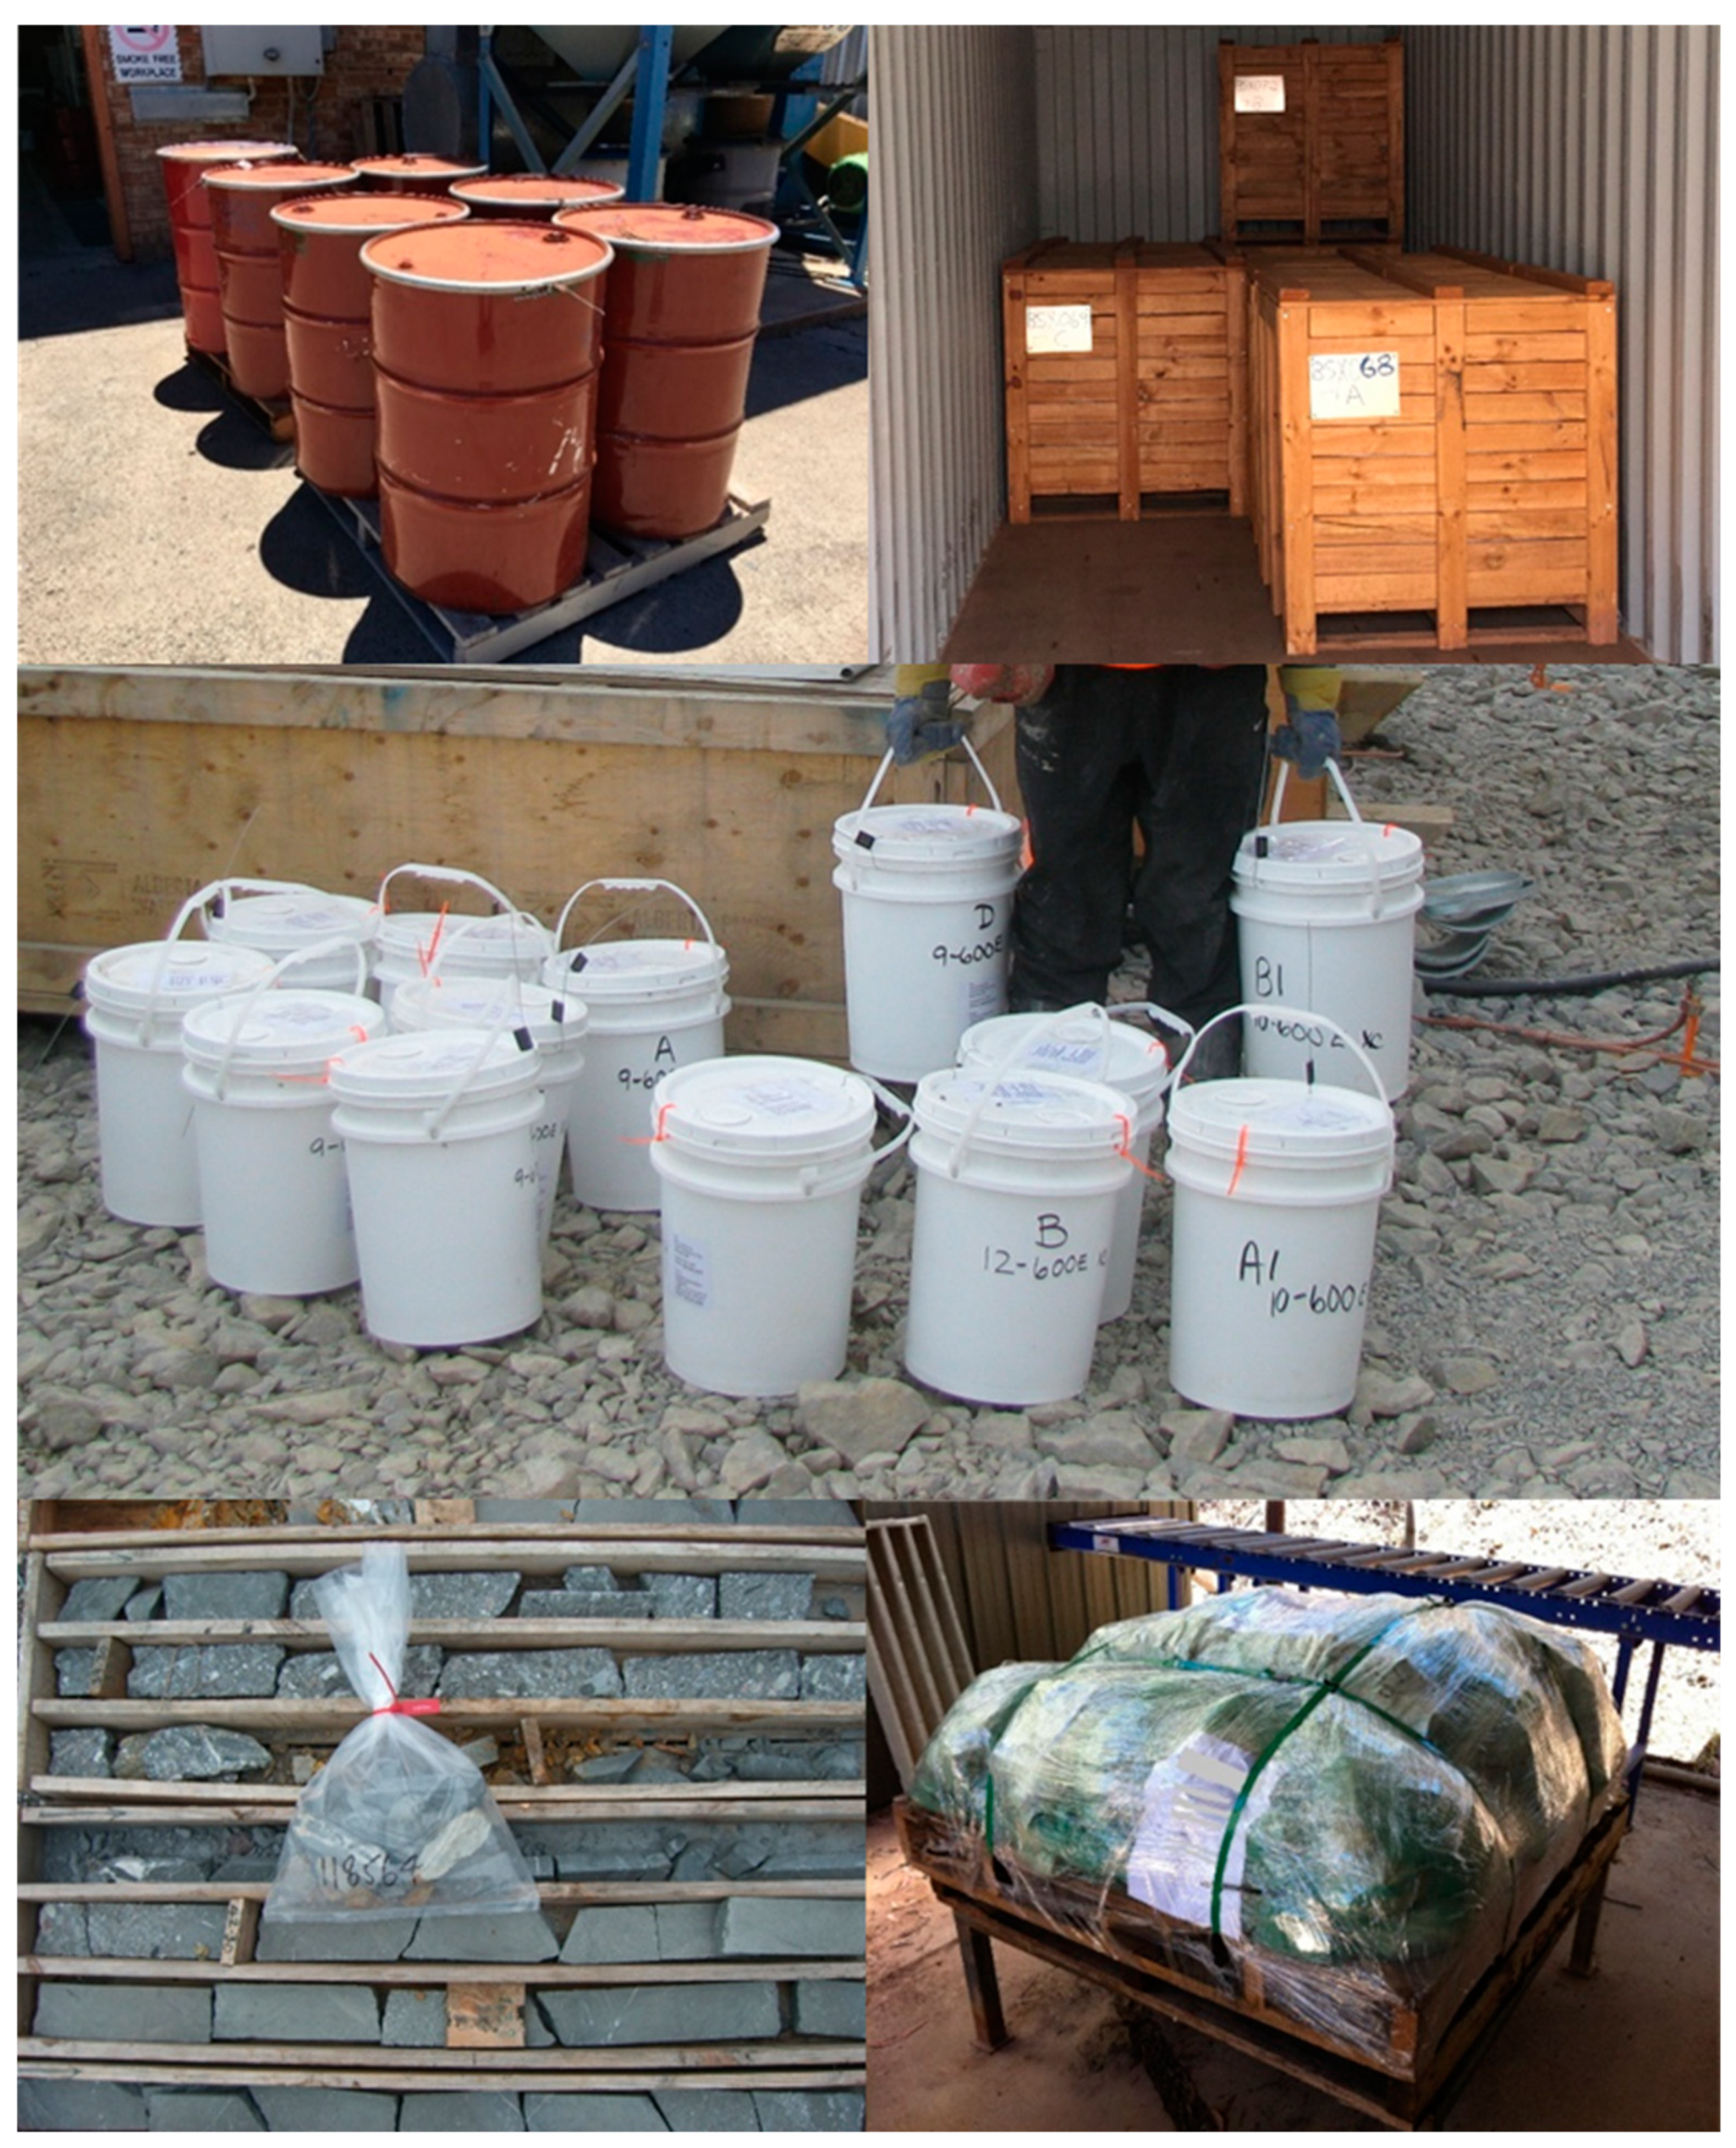
2.5.7. Sample Integrity
2.5.8. Quality Assurance-Quality Control
2.5.9. Other Considerations
2.5.10. Building Deposit Knowledge for Geometallurgical Programmes
3. Reporting with International Codes
4. Beatons Creek Case Study
4.1. Project Background
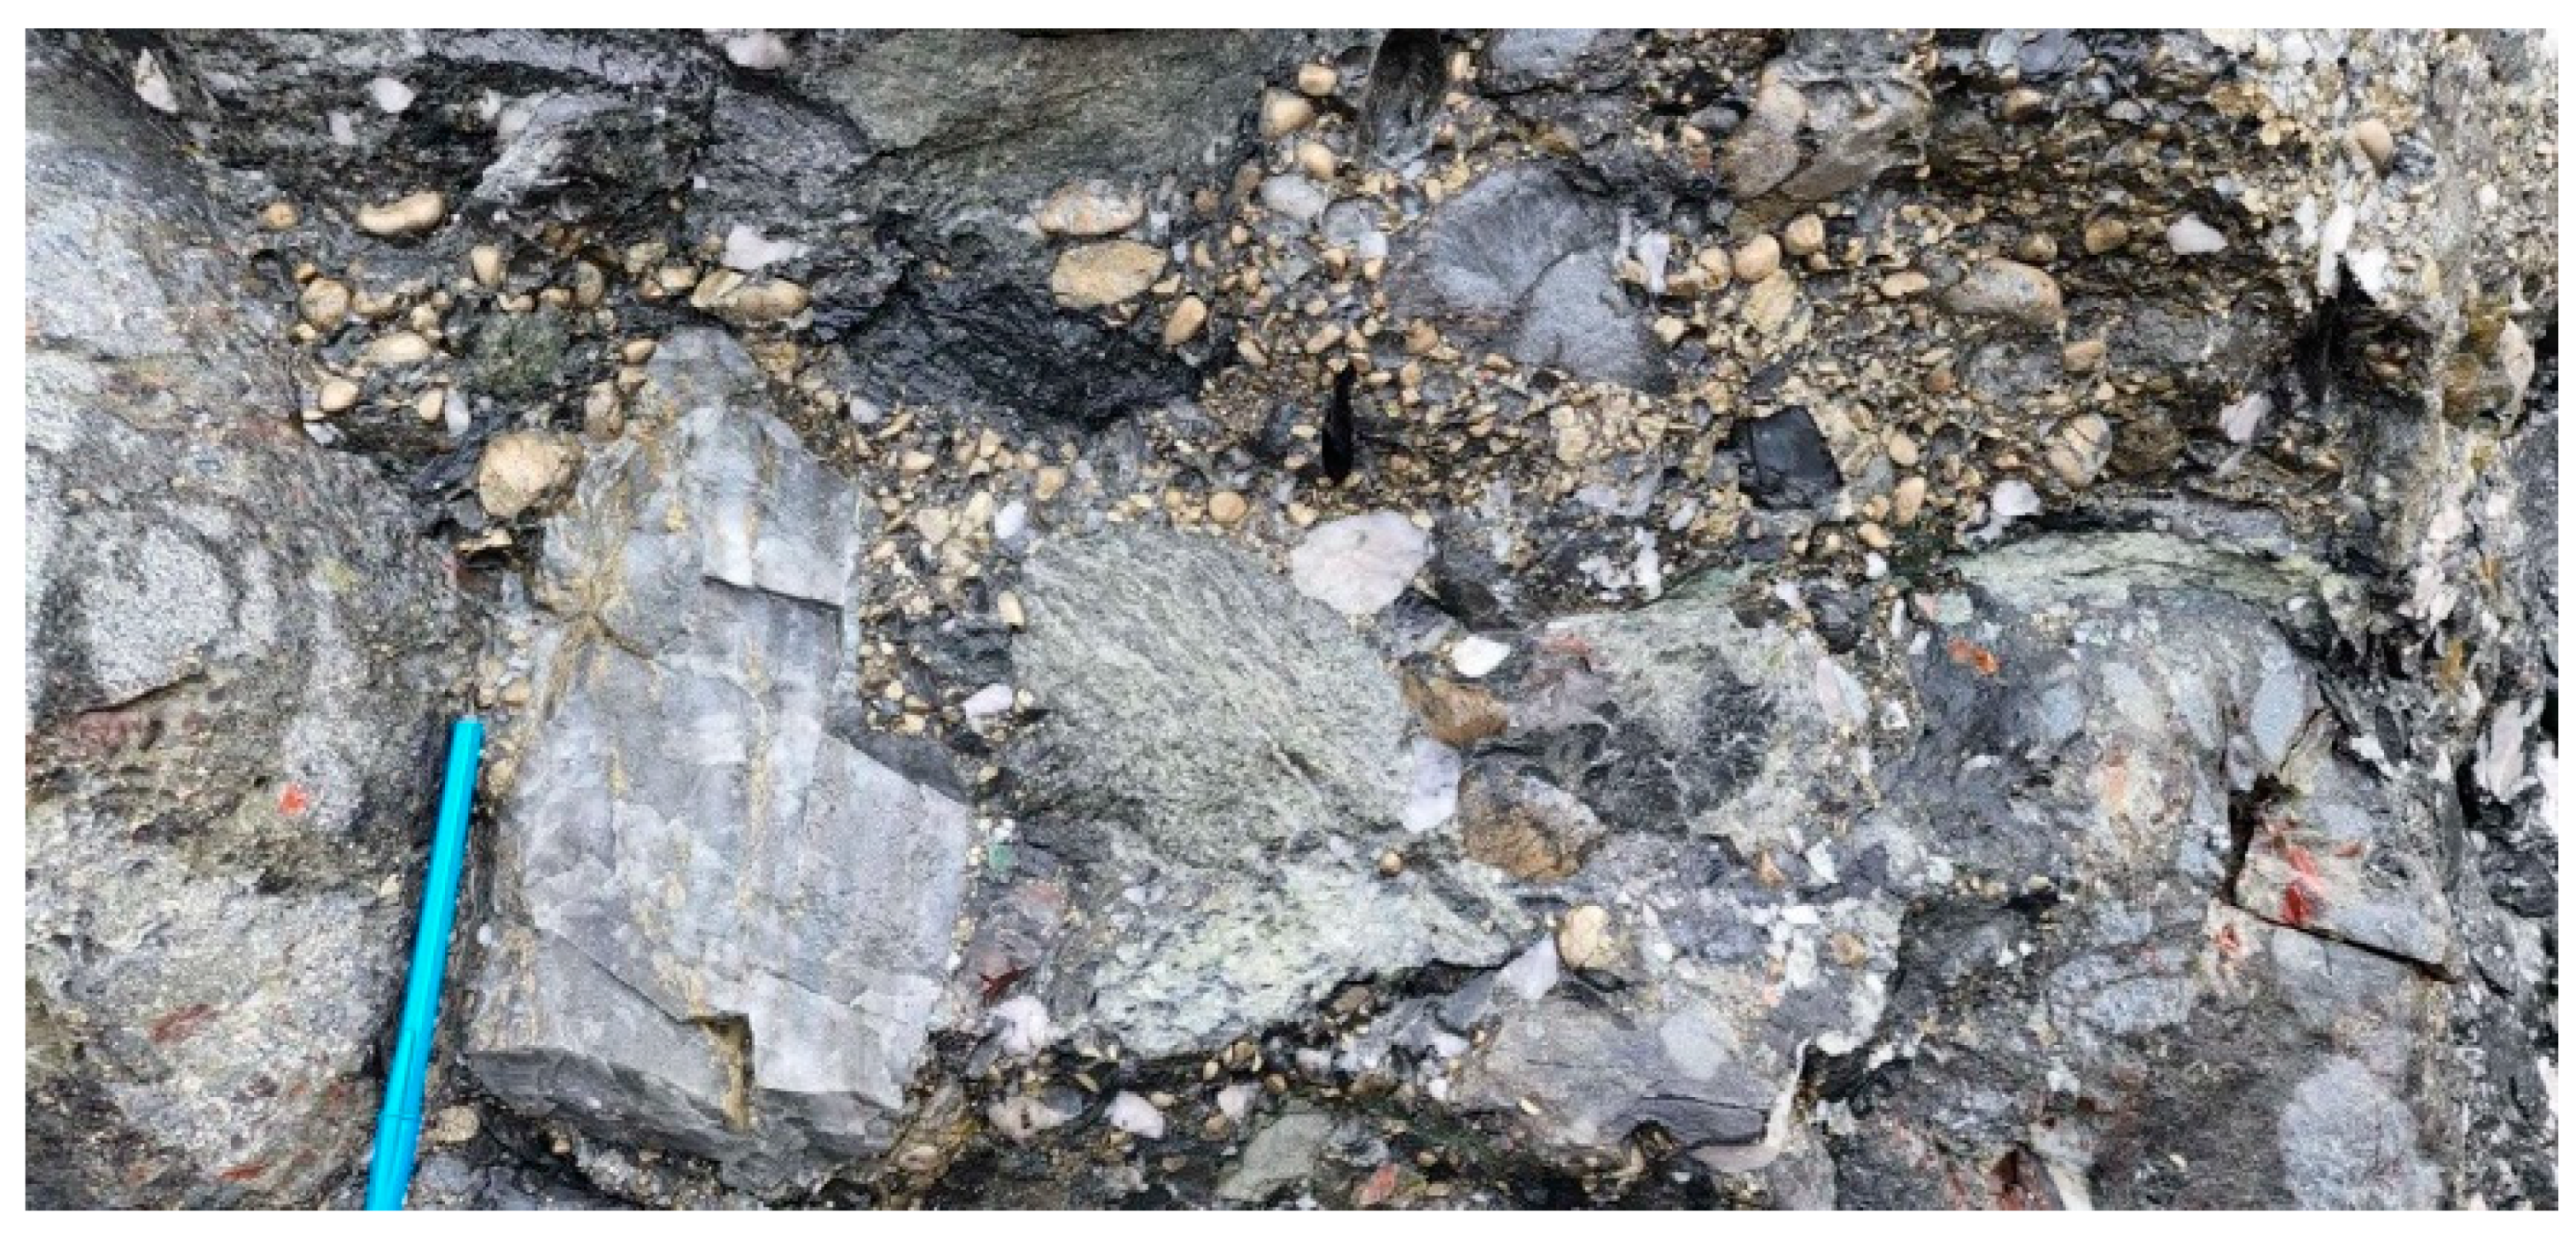
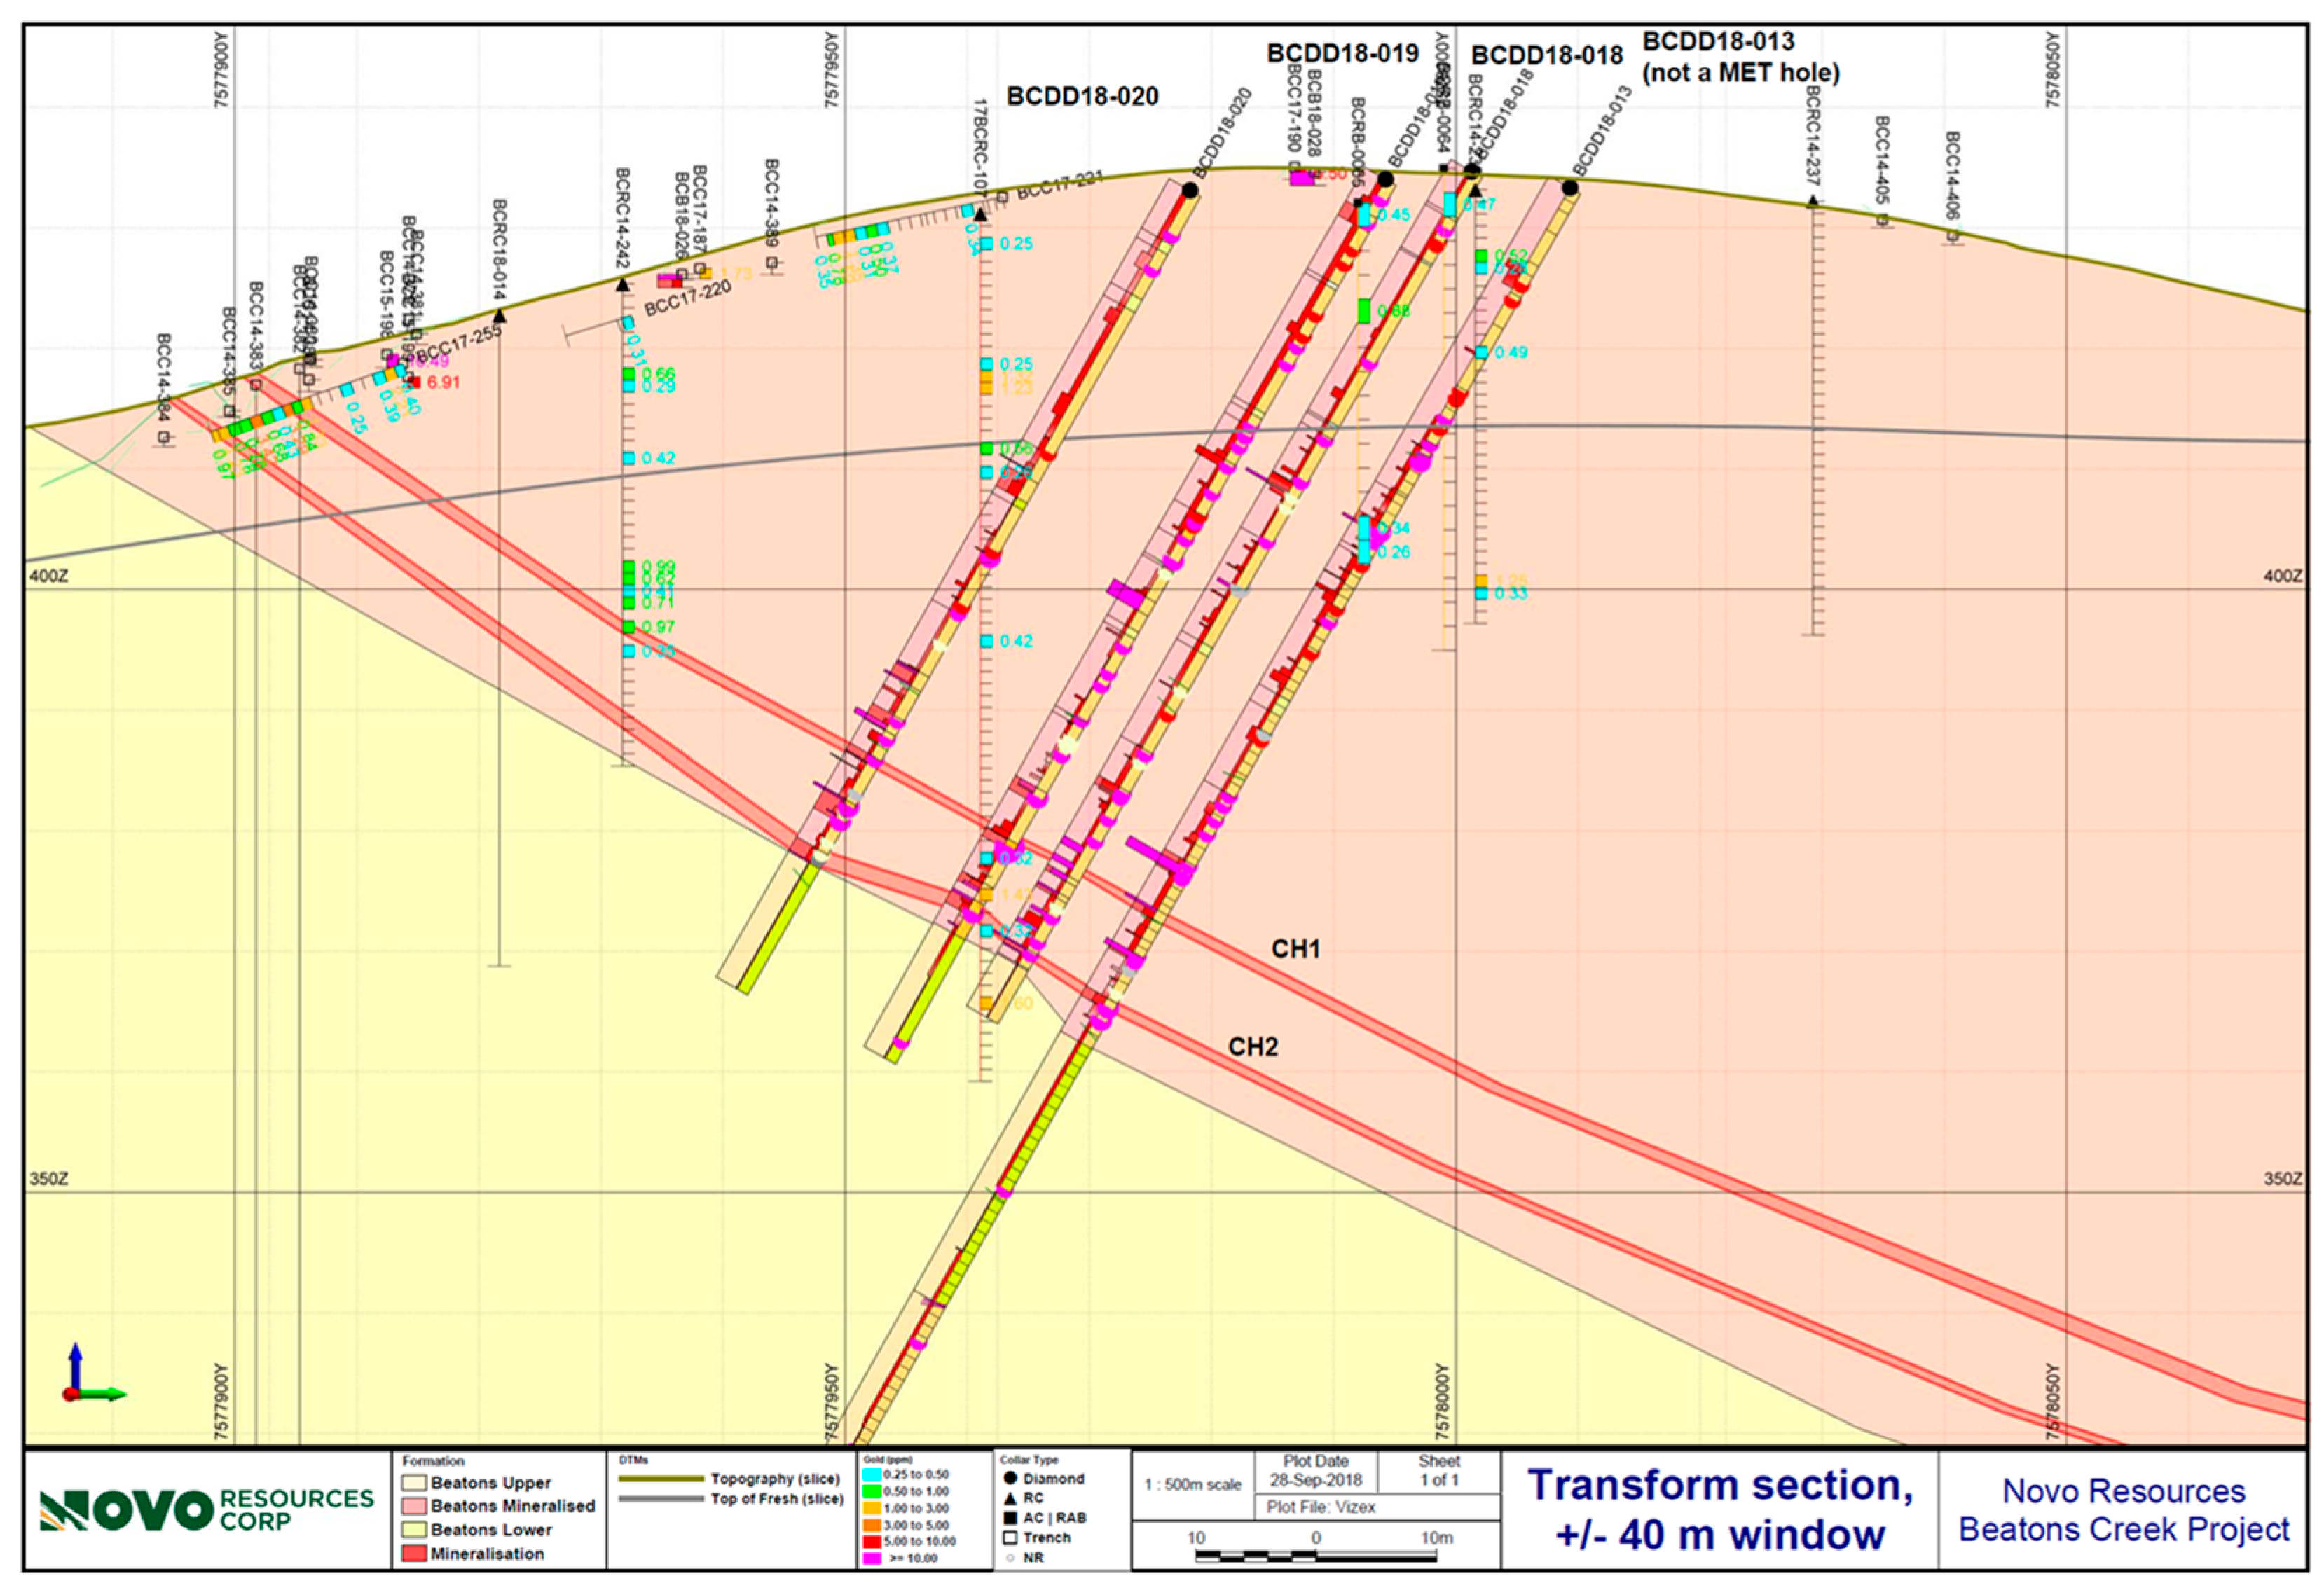
4.2. Geology and Mineralisation
4.3. Mineralogy and Gold Deportment
4.4. Previous Work at Beatons Creek
4.5. Programme Design
4.5.1. Rationale
4.5.2. Sample Interval Selection
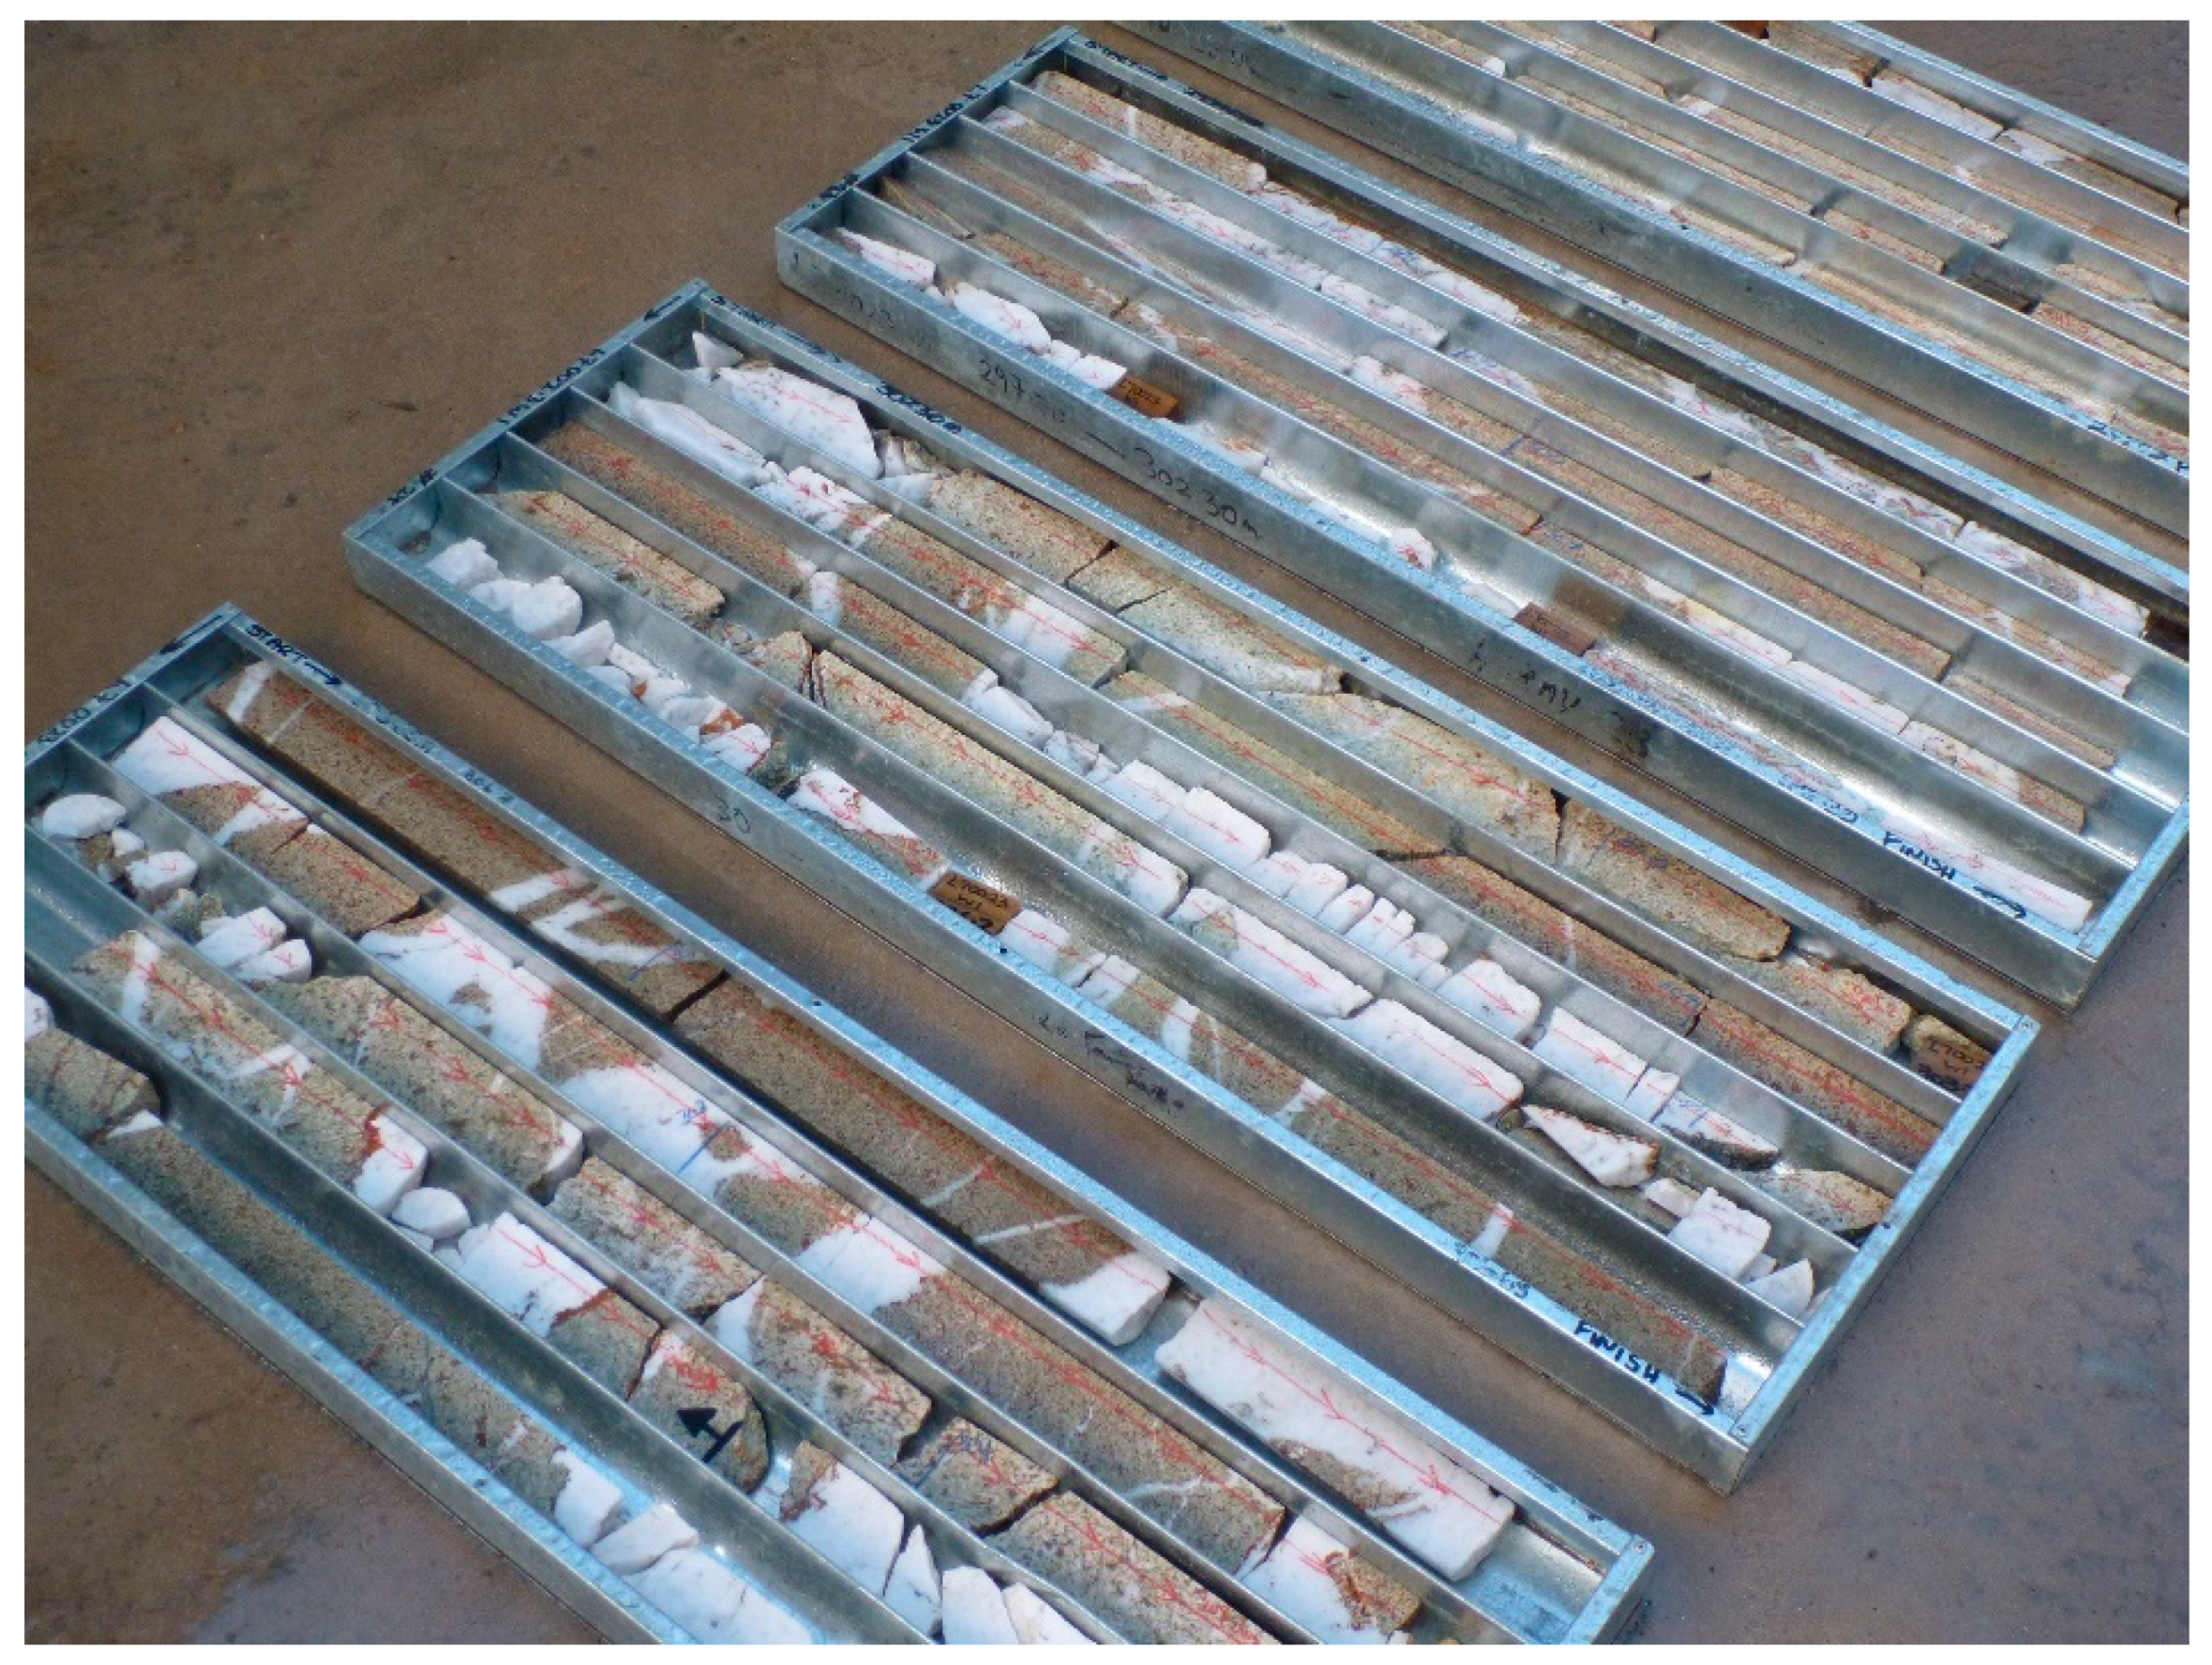
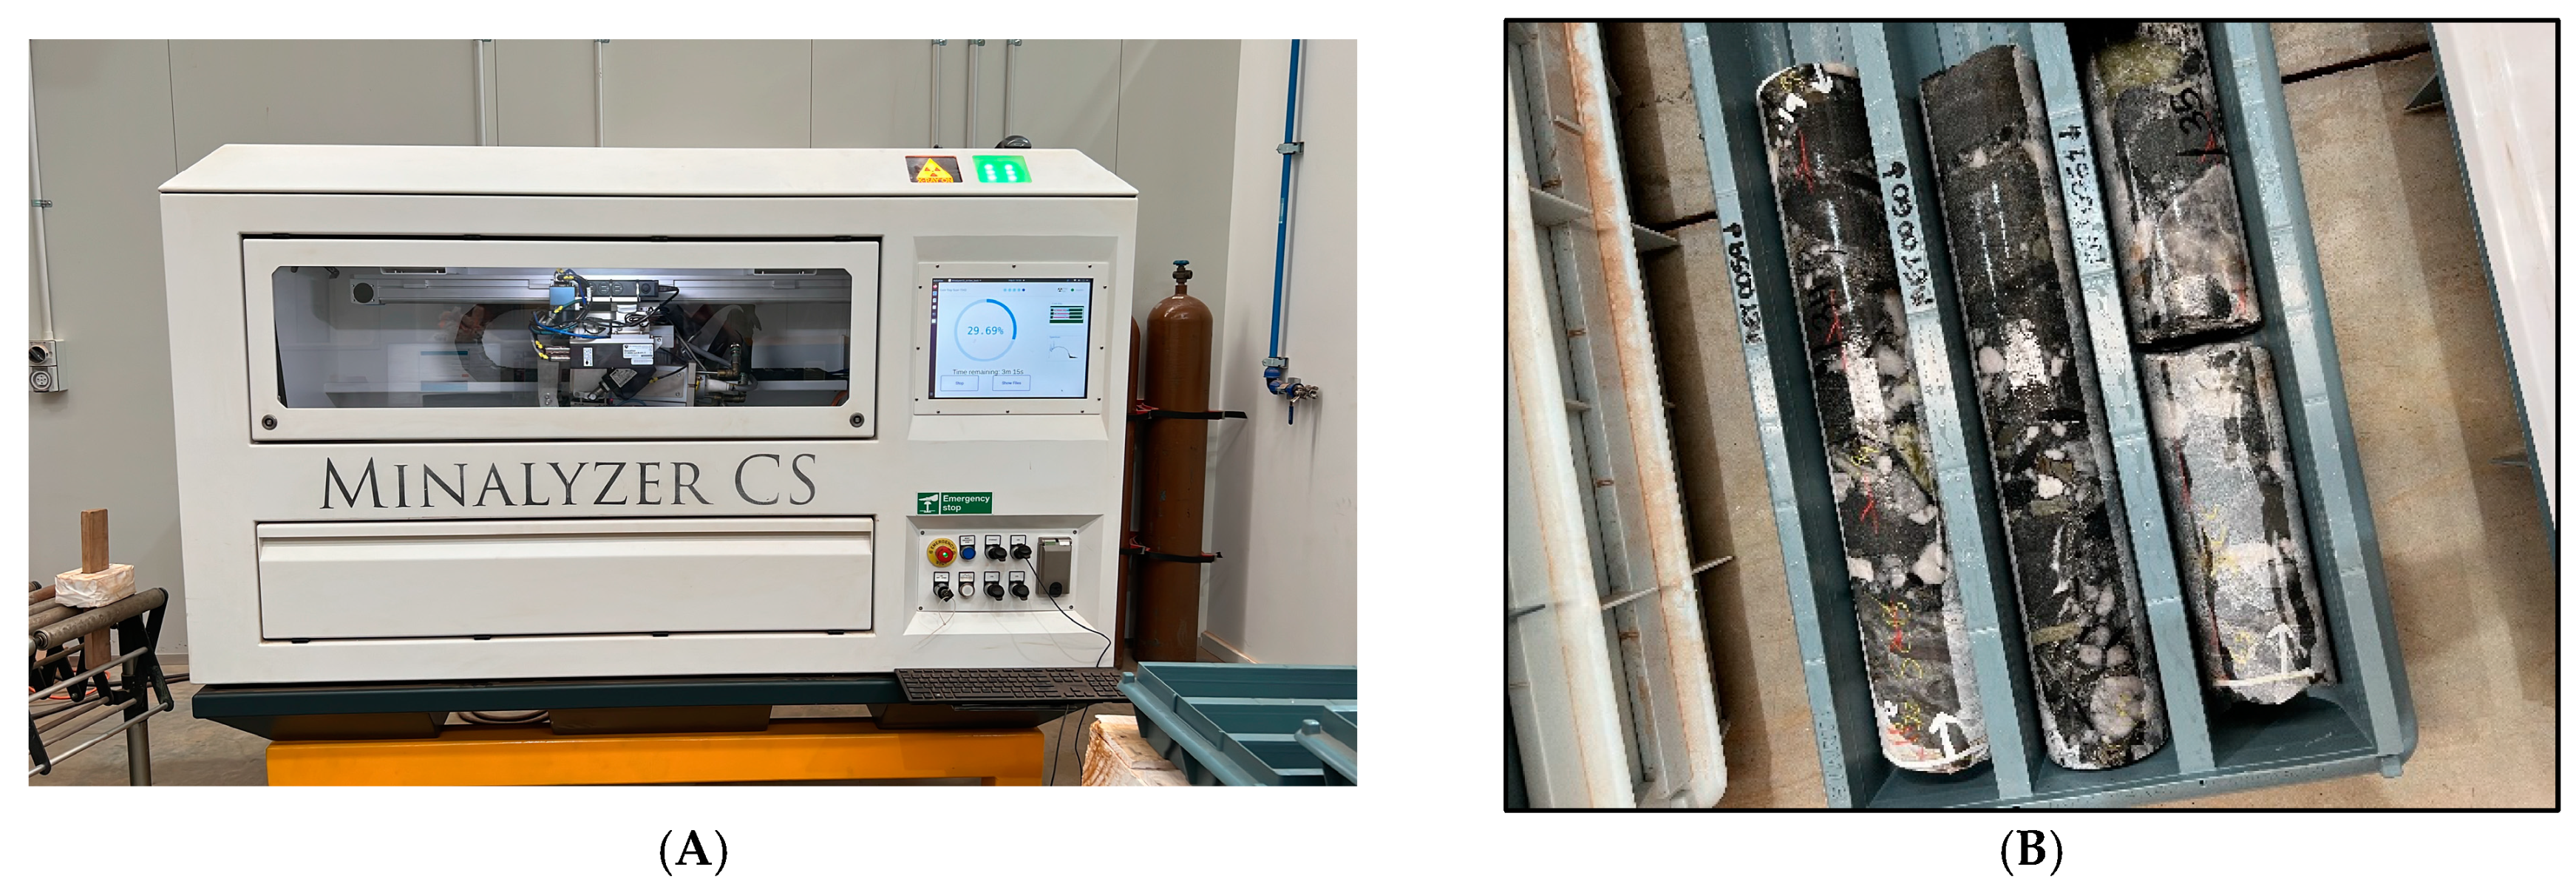
4.6. Core Logging and Scanning
4.7. Metallurgical Testwork Protocol
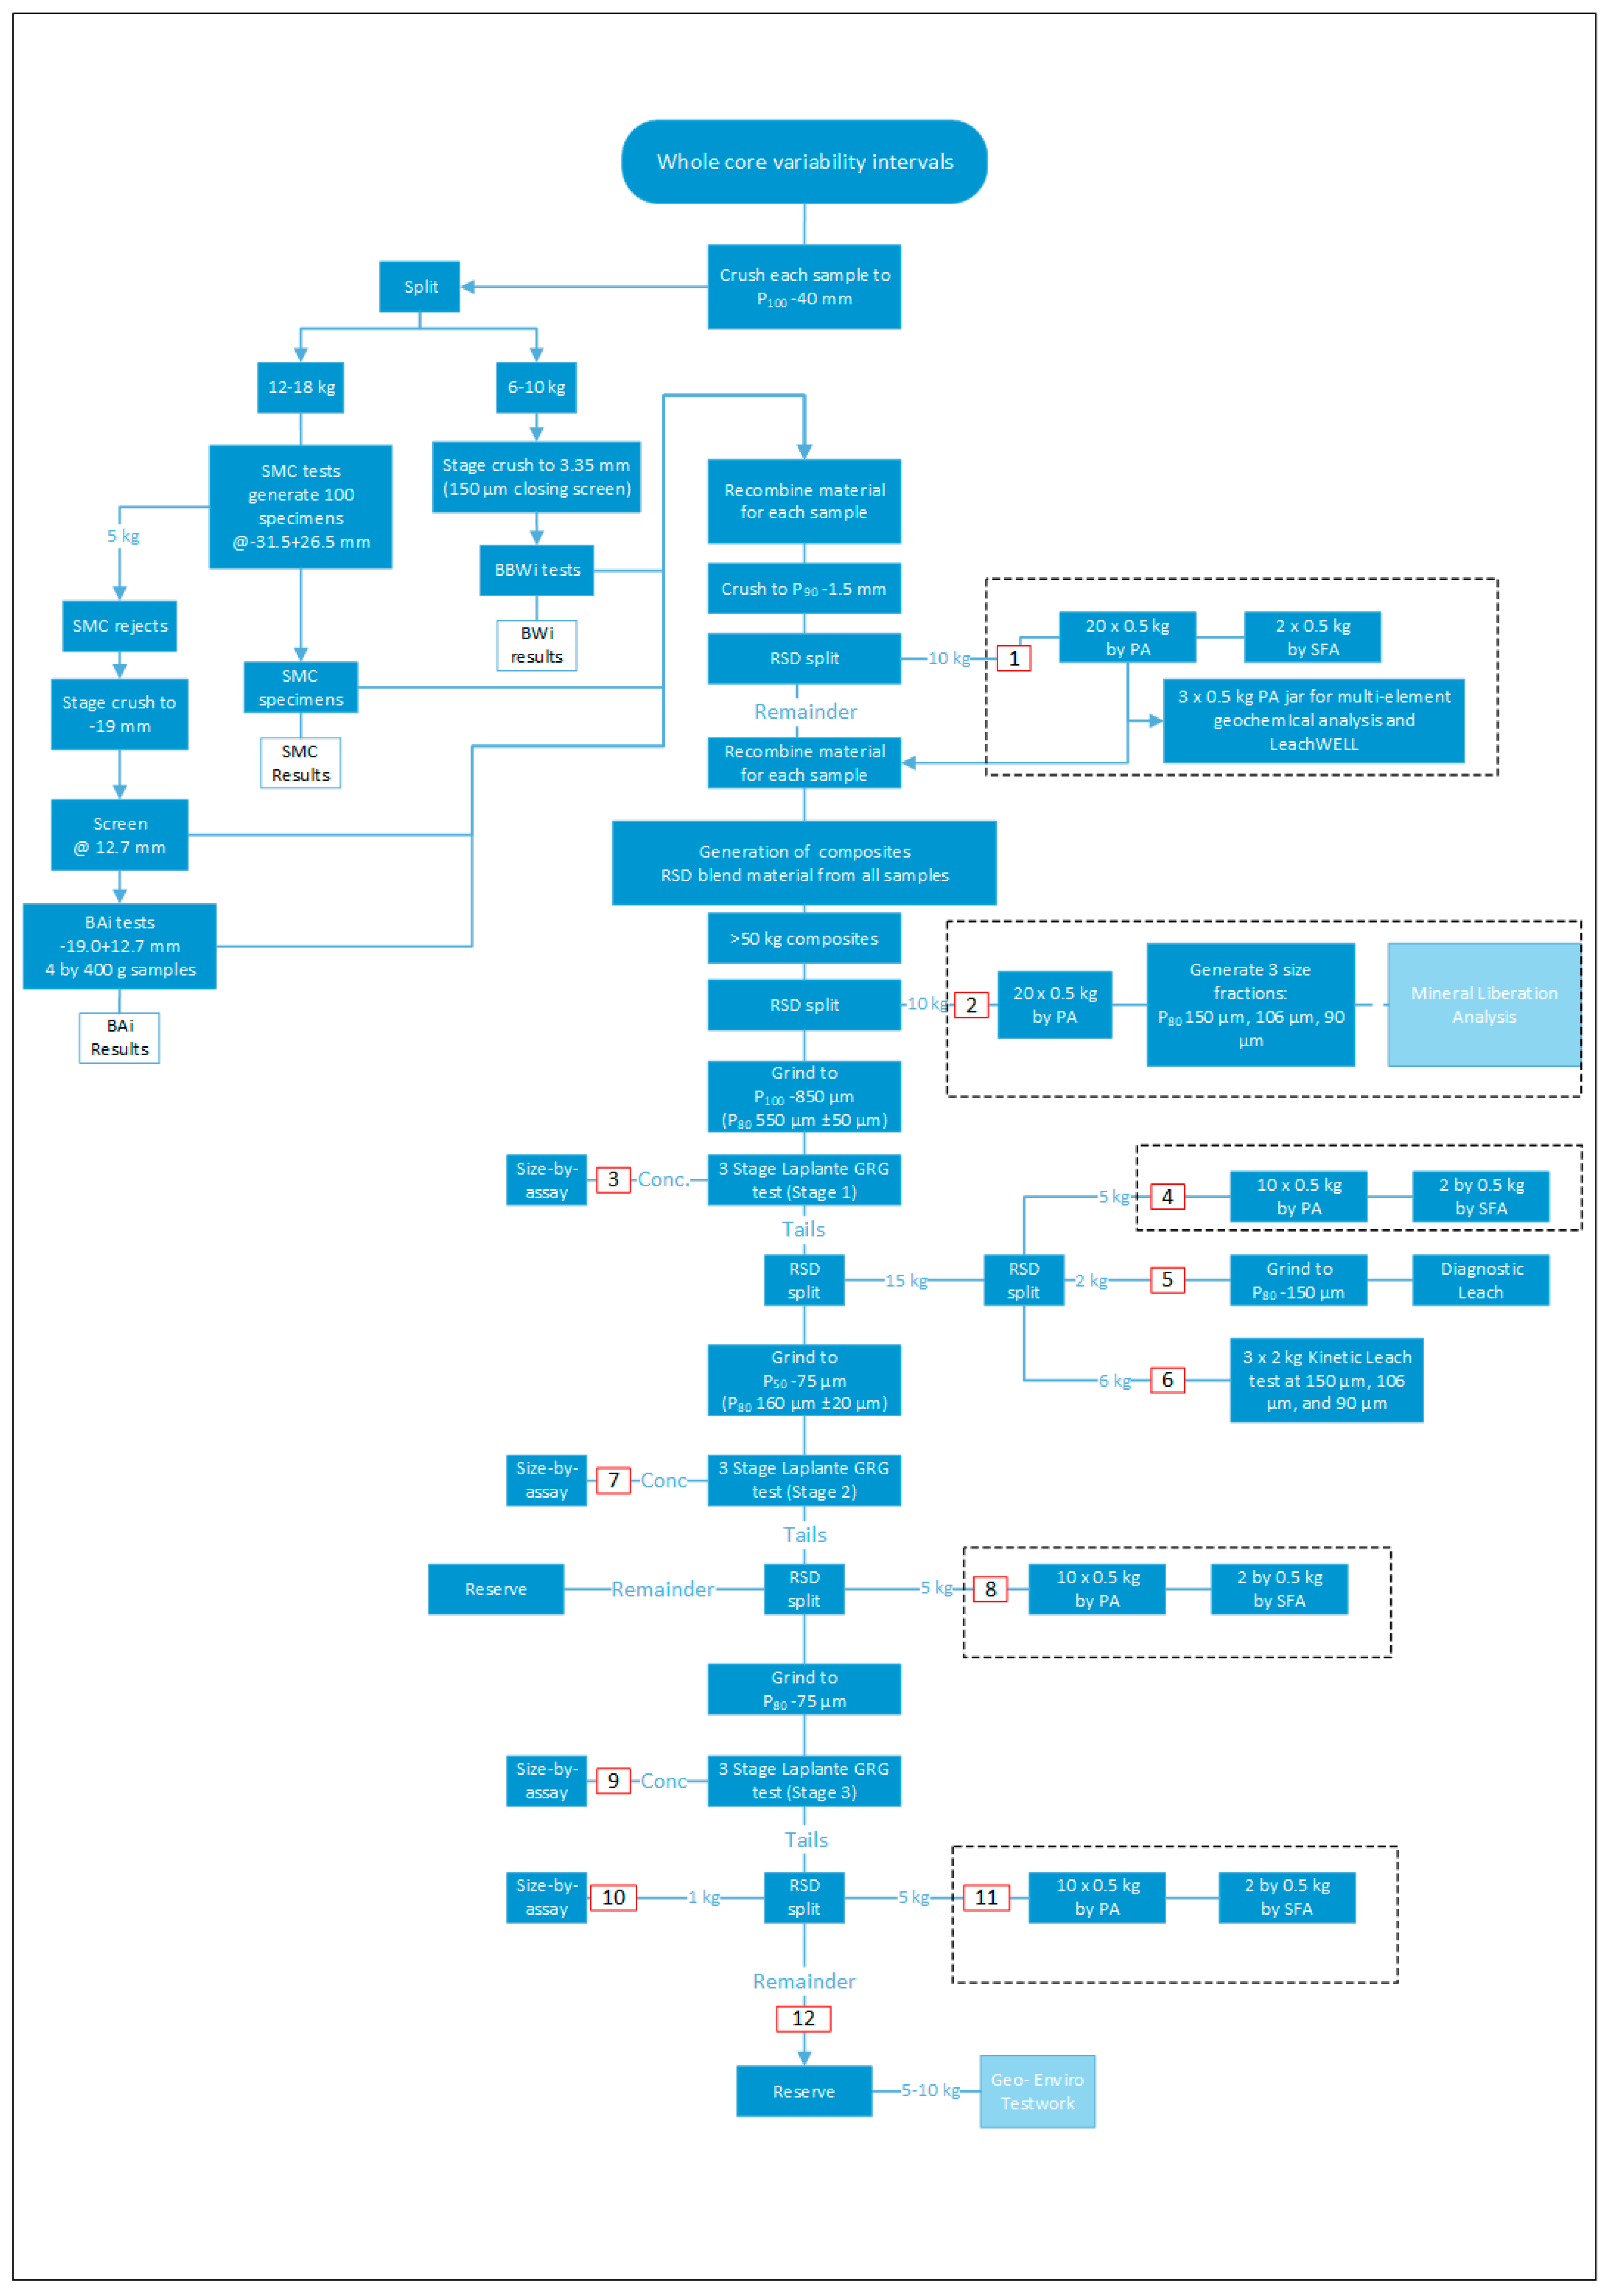
- Sample preparation and comminution testwork on the individual variability samples which included:
- o
- Stage crushing to a P100 of 40 mm
- o
- Splitting 6 kg to 9 kg and stage crushing to 3.35 mm for BWI.
- o
- Splitting 12 kg to 18 kg for SMC testing and selecting 100 specimens for SMC Tests
- o
- Splitting off 5 kg from the SMC Test rejects and stage crushing to 19 mm for BAI.
- o
- Recombination of all the comminution testwork samples, stage crushing to 1.5 mm, RSD splitting off 10 kg for PA (Figure 11—[1]). From this 10 kg, twenty 0.5 kg splits were made for PA. Subsequently, two were subjected to SFA. In some cases, a 1 kg LW assay with tails FA was undertaken as a grade check and gold recovery proxy. One was subjected to a multi-element (53 elements) geochemical assay. The remaining 7.5–8.5 kg was returned to the original sample for compositing.
- Generation of two composites from the six variability samples from each of Grants Hill and South Hill (Table 8), which aimed to produce sample masses of >50 kg in support of the GRG testwork.
- Mixing and RSD splitting 10 kg from each composite for PA and size by assay (Figure 11—[2]). Note that 5 kg was split and returned to the feed for gravity testwork;
- RSD splitting of 15 kg of the first stage GRG test tails (Figure 11—[4–6]):
- o
- 5 kg for PA and SFA
- o
- 2 kg for diagnostic leach at a P80 of 150 µm
- o
- 6 kg for three (2 kg) kinetic leach tests at P80 grind sizes of 105 µm, 106 µm, and 90 µm
- RSD splitting of 5 kg of the second stage GRG test tails for PA and SFA (Figure 11—[8]);
- RSD splitting of 5 kg of the third stage GRG test tails for PA and SFA (Figure 11—[10 and 11]);
- RSD splitting of 5–10 kg of the third stage GRG test tails for geochemical/environmental testwork; and
- Retain the remaining tails.
4.8. Quality Assurance/Quality Control
4.8.1. Generic QAQC Activity
4.8.2. Assay Sub-Sampling Quality
4.9. Testwork Results
4.9.1. Summary of Testwork Outputs
4.9.2. Comminution
4.9.3. Metallurgical Recovery
4.9.4. Core Scanning Outputs
4.9.5. Other Outputs
4.9.6. Trial Mining and Processing
4.10. Assessing Representativity
5. Conclusions
5.1. General
5.2. Beatons Creek
6. Recommendations
- Early implementation of geometallurgy must include strong collaboration between geologists, mining engineers, metallurgists/mineral process engineers, and environmental scientists to scope the most appropriate data outputs.
- The programme scope document will cover all relevant considerations (refer to Section 2.1, Section 2.2, Section 2.3, Section 2.4 and Section 2.5) and context of public reporting (refer to Section 3). This should include activities across required outcomes, budget definition, project schedule, sampling and testwork design, testwork protocols including QAQC, database design, management and validation, reporting, etc.
- High-quality primary samples are critical to testwork programmes. All samples should be collected within the framework of TOS. The preferred sample type for geometallurgical programmes is diamond drill core. Half or whole drill cores can be used. Dedicated drill holes solely for geometallurgical application are both unlikely and will lack spatial representativity. Therefore, the sharing of holes across the mine value chain is critical to maximising in situ, direct and ex situ measurements to support predictive modelling.
- Scanning of drill core has become more important to ensure that a range of continuous down-hole data are collected. Various technologies are now available, allowing core scanning data to be generated quickly and at a reasonable cost.
- QAQC documentation, implementation, and monitoring must be rigorous, particularly where comminution testwork precedes head grade determination for resource estimation and metallurgical recovery testwork. If whole core use is deemed applicable, this should be justified and effectively logged and scanned prior to destruction.
Author Contributions
Funding
Data Availability Statement
Acknowledgments
Conflicts of Interest
References
- Eggert, R.G. Trends in mineral economics: Editorial retrospective 1989–2006. Res. Policy 2008, 33, 1–3. [Google Scholar]
- ICMM. Available online: https://www.icmm.com/en-gb/our-principles (accessed on 24 March 2025).
- McKay, N.; Vann, J.; Ware, W.; Morley, C.S.; Hodkiewicz, P. Strategic versus tactical geometallurgy—A systematic process to add and sustain resource value. In Proceedings of the International Geometallurgy Conference, Australasian Institute of Mining and Metallurgy, Melbourne, Australia, 15–16 June 2016; pp. 29–36. [Google Scholar]
- Dominy, S.C.; O’Connor, L.; Parbhakar-Fox, A.; Glass, H.J.; Purevgerel, P. Geometallurgy—A route to more resilient operations. Minerals 2018, 8, 560. [Google Scholar] [CrossRef]
- Michaux, S.; O’Connor, L. How to Set Up and Develop a Geometallurgical Programme; Geological Survey of Finland (GTK): Espoo, Finland, 2020; p. 245. Available online: https://www.researchgate.net/profile/Simon-Michaux-2/publication/341459317_How_to_set_up_and_Develop_a_Geometallurgical_Program_FINAL_v6/links/5ec28fb1299bf1c09ac4e7b5/How-to-set-up-and-Develop-a-Geometallurgical-Program-FINAL-v6.pdf (accessed on 24 March 2025).
- Tusa, L.; Frenzel, M.; Pereira, L.; Thiele, S.; Tolosana-Delgado, R.; Gutzmer, J. Geometallurgy—Future directions. SEG Discov. 2025, 160, 27–39. [Google Scholar]
- Boisvert, J.B.; Rossi, M.E.; Ehrig, K.; Deutsch, C.V. Geometallurgical modelling at Olympic Dam mine, South Australia. Math. Geosci. 2013, 45, 901–925. [Google Scholar] [CrossRef]
- Banisi, S.; Belec, S.; Duchesne, C.; Bazin, C. Application of geometallurgical modelling to mine planning in the copper-molybdenum industry. Mins. Eng. 2018, 122, 130–141. [Google Scholar] [CrossRef]
- Ortiz, J.M.; Avalos, A.; Riquelme, A.I.; Leuangthong, O.; Madani, N.; Frenzel, M. Uncertainty and value: Optimising geometallurgical performance along the mining value chain. Elements 2023, 19, 377–383. [Google Scholar] [CrossRef]
- JORC. Australasian Code for Reporting of Exploration Results, Mineral Resources and Ore Reserves—The JORC Code; Joint Ore Reserves Committee of the Australasian Institute of Mining and Metallurgy, Australian Institute of Geoscientists and Minerals Council of Australia: Melbourne, Australia, 2012; p. 44. Available online: https://www.jorc.org/docs/JORC_code_2012.pdf (accessed on 24 March 2025).
- PERC. Pan-European Standard for the Public Reporting of Exploration Results, Mineral Resources and Mineral Reserves; Pan-European Reserves and Resources Reporting Committee (PERC): Brussels, Belgium, 2021; p. 98. Available online: https://percstandard.org/wp-content/uploads/2021/09/PERC_REPORTING_STANDARD_2021_RELEASE_01Oct21_full.pdf (accessed on 24 March 2025).
- CIM. Definition Standards for Mineral Resources and Mineral Reserves; CIM: Montreal, QC, Canada, 2014; p. 9. Available online: https://mrmr.cim.org/media/1128/cim-definition-standards_2014.pdf (accessed on 24 March 2025).
- NI 43-101; National Instrument 43-101 Standards of Disclosure for Mineral Projects. Ontario Securities Commission: Montreal, QC, Canada, 2011; p. 44. Available online: https://mrmr.cim.org/media/1017/national–instrument-43-101.pdf (accessed on 24 March 2025).
- Hanks, J.; Barratt, D. Sampling a mineral deposit for metallurgical testing and the design of comminution and mineral separation processes. In Mineral Processing Plant Design, Practice and Control; Society for Mining, Metallurgy and Exploration: Littleton, CO, USA, 2002; pp. 99–116. [Google Scholar]
- McCarthy, P.L. Managing technical risk for mine feasibility studies. In Proceedings of the Mining Risk Management Conference, Sydney, Australia, 9–12 September 2003; Australasian Institute of Mining and Metallurgy: Melbourne, Australia, 2003; pp. 21–27. [Google Scholar]
- King, P. Orebody Sampling and Metallurgical Testwork. In SME Mining Engineering Handbook; SME: Denver, CO, USA, 2011; pp. 193–202. [Google Scholar]
- Rendu, J.-M. Risk Management in Evaluating Mineral Deposits; Society for Mining, Metallurgy and Exploration: Littleton, CO, USA, 2017; p. 310. [Google Scholar]
- Dominy, S.C.; O’Connor, L.; Glass, H.J.; Purevgerel, S.; Xie, Y. Towards representative metallurgical sampling and recovery testwork programmes. Minerals 2018, 8, 193. [Google Scholar] [CrossRef]
- Dominy, S.C.; O’Connor, L.; Purevgerel, S. Importance of representative metallurgical sampling and testwork programmes to reduce project risk-a gold case study. Min. Technol. 2019, 128, 230–245. [Google Scholar] [CrossRef]
- Chalastara, K.; Cai, A.; Anson, J.; Proulx, E.-M. Implementing a testwork program for a metallurgical plant. In Proceedings of the Conference of Metallurgists, Halifax, NS, Canada, 19–22 August 2024; Springer: Cham, Switzerland, 2024; pp. 859–864. [Google Scholar] [CrossRef]
- Lipton, I.; Greenhill, P.; Torres, L.; Nimmo, M. Applying geometallurgical principals for metallurgical sample selection. In Proceedings of the International Mineral Processing Conference, Washington, DC, USA, 29 September–3 October 2024; Society for Mining, Metallurgy and Exploration: Englewood, NJ, USA, 2024; p. 14. [Google Scholar]
- Gy, P.M. Sampling of Particulate Materials: Theory and Practice; Elsevier: Amsterdam, The Netherlands, 1982; p. 431. [Google Scholar]
- Pitard, F.F. Theory of Sampling and Sampling Practice; CRC Press: Boca Raton, FL, USA, 2019; p. 694. [Google Scholar]
- Esbensen, K.H. Introduction to the Theory and Practice of Sampling; IM Publications Open: Chichester, UK, 2020; p. 324. [Google Scholar]
- Carrasco, P.C. Nugget effect–artificial or natural? In Proceedings of the Fourth World Conference on Sampling and Blending, Cape Town, South Africa, 21–23 October 2009; Southern African Institute of Mining and Metallurgy: Johannesburg, South Africa, 2009; pp. 211–217. [Google Scholar]
- Dominy, S.C. Predicting the unpredictable—Evaluating high-nugget effect gold deposits. In Mineral Resource and Mineralization Reserve Estimation—The AusIMM Guide to Good Practice, Monograph 23; Australasian Institute of Mining and Metallurgy: Melbourne, Australia, 2014; pp. 659–678. [Google Scholar]
- Dehaine, Q.; Esbensen, K.H. Multivariate methods of improved geometallurgical sampling. TOS Forum 2022, 11, 411–417. [Google Scholar] [CrossRef]
- Lynch, A. Comminution Handbook; Spectrum Series #21; The Australasian Institute of Mining and Metallurgy: Melbourne, Australia, 2015; p. 324. [Google Scholar]
- DS3077; Representative Sampling–Horizontal Standard. Danish Standards Foundation: Copenhagen, Denmark, 2024; p. 94. Available online: https://webstore.ansi.org/standards/ds/ds30772024 (accessed on 24 March 2025).
- Laplante, A.R.; Spiller, D.E. Bench-scale and pilot plant test work for gravity concentration circuit design. In Mineral Processing Plant Design, Practice and Control; Society for Mining, Metallurgy and Exploration: Englewood, NJ, USA, 2002; pp. 160–175. [Google Scholar]
- Runge, K.C. Laboratory flotation testing—An essential tool for ore characterisation. In Flotation Plant Optimisation; Spectrum Series #16; Australasian Institute of Mining and Metallurgy: Melbourne, Australia, 2010; pp. 155–174. [Google Scholar]
- Keeney, L.; Nguyen, K. The use of EQUOtip as a hardness domaining tool. In Proceedings of the International Mineral Processing Congress, Santiago, Chile, 20–24 October 2014; Gecamin: Santiago, Chile, 2014; pp. 128–138. [Google Scholar]
- Bueno, M.d.P.; Almeida, T.; Lara, L.; Powell, M. The Geopyora Index: A new instrument for assessing comminution and rock strength properties. In Proceedings of the International Mineral Processing Conference, Washington, DC, USA, 29 September–3 October 2024; Society for Mining, Metallurgy and Exploration: Englewood, NJ, USA, 2024; pp. 1525–1530. [Google Scholar]
- Lund, C.; Lamberg, P.; Lindberg, T. Development of a geometallurgical framework to quantify mineral textures for process prediction. Mins. Eng. 2015, 82, 61–77. [Google Scholar] [CrossRef]
- Johnson, C.L.; Browning. D.A.; Pendock, N.E. Hyperspectral imaging applications to geometallurgy: Utilizing blasthole mineralogy to predict Au-Cu recovery and throughput at the Phoenix mine, Nevada. Econ. Geol. 2019, 114, 1481–1494. [Google Scholar] [CrossRef]
- Hunt, J.; Kojovic, T.; Berry, R.J. Estimating comminution indices from ore mineralogy, chemistry and drill core logging. In Proceedings of the International Geometallurgy Conference, Perth, Australia, 12–14 August 2013; Australasian Institute of Mining and Metallurgy: Melbourne, Australia, 2013; pp. 173–176. [Google Scholar]
- Butcher, A.R.; Dehaine, Q.; Menzies, A.H.; Michaux, S.P. Characterisation of ore properties for geometallurgy. Elements 2023, 19, 352–358. [Google Scholar] [CrossRef]
- Ehrig, K.; Pitard, F.F. Sampling the supergiant Olympic Dam iron-oxide Cu-U-Au-Ag deposit, South Australia. In Proceedings of the World Conference on Sampling and Blending, Perth, Australia, 9–11 May 2017; Australasian Institute of Mining and Metallurgy: Melbourne, Australia, 2017; pp. 21–27. [Google Scholar]
- Ehrig, K.; Liebezeit, V.; Macmillan, E. Metallurgical QAQC–who needs it? In The Olympic Dam experience. In Proceedings of the Metallurgical Plant Design and Operating Strategies, Perth, Australia, 11–12 September 2017; Australasian Institute of Mining and Metallurgy: Melbourne, Australia, 2017; pp. 31–44. [Google Scholar]
- Siddiqui, M.U.; Erwin, K.; Khan, S.; Chandramohan, R.; Meinke, C. An efficient sample selection methodology for a geometallurgy study utilizing statistical analysis techniques. Min. Metall. Explor. 2024, 41, 2193–2201. [Google Scholar] [CrossRef]
- Lyman, G.J.; Bourgeois, F.S. Sampling, corporate governance and risk analysis. In We Are Metallurgists Not Magicians: Landmark Papers by Practicing Metallurgists; Australasian Institute of Mining and Metallurgy: Melbourne, Australia, 2017; pp. 349–354. [Google Scholar]
- GMG. Available online: https://gmggroup.org/geometallurgy-sample-representativity/ (accessed on 24 March 2025).
- Dominy, S.C.; van Roij, A.; Graham, J.C. Sampling of high-nugget conglomerates from the Western Australian Pilbara: Bulk sampling at the Beatons Creek gold project, Nullagine. TOS Forum 2022, 11, 255–277. [Google Scholar] [CrossRef]
- Gill, D.E.; Corthesy, R.; Leite, M.H. Determining the minimum number of specimens for laboratory testing of rock properties. Eng. Geol. 2005, 78, 29–51. [Google Scholar] [CrossRef]
- Barton, I.; Caro, C.; Robertson, J. Ore types: What they are, how they are made and their uses. Min. Metall. Explor. 2019, 40, 2153–2160. [Google Scholar] [CrossRef]
- Annels, A.E.; Dominy, S.C. Core recovery and quality: Important factors in mineral resource evaluation. App. Earth Sci. 2003, 112, 305–312. [Google Scholar] [CrossRef]
- Carvalho, D.B.; Cuchierato, G.; Chieregati, A.C. Drill core storage: Orientation regarding international best practices. Coring Mag. 2020, 12, 60–64. Available online: https://issuu.com/coringmagazine/docs/issue_12_-_issuu (accessed on 24 March 2025).
- ISO 9001. Available online: https://www.iso.org/standard/62085.html (accessed on 31 March 2025).
- ISO 17025. Available online: https://www.iso.org/standard/66912.html (accessed on 31 March 2025).
- Morgan, S.; Bradshaw, D.J.; Schwarz, S. Julius Kruttschnitt Mineral Separation Index–small-scale test to characterise the flotation response of an ore type. In Proceedings of the Mill Operators Conference, Hobart, Australia, 29–31 October 2012; Australasian Institute of Mining and Metallurgy: Melbourne, Australia, 2012; pp. 159–162. [Google Scholar]
- Windle, S.J.; Kojovic, T.; Sullivan, J. Use of modified Comminution Index to predict Bond Work Index and SMC A*b at the Antamina mine, Peru. In Proceedings of the International Geometallurgy Conference, Perth, Australia, 15–16 June 2016; Australasian Institute of Mining and Metallurgy: Melbourne, Australia, 2016; pp. 153–1160. [Google Scholar]
- Arthursson, A. Minalyze. In New Discovery Program Industry Consultation and Knowledge Transfer Workshop; Geological Survey of Queensland: Mount Isa, Australia; The University of Queensland: Brisbane, Australia, 2018; p. 45. Available online: https://smi.uq.edu.au/files/43635/Dec18KTW_Minalyze_GSQ_Workshop.pdf (accessed on 24 March 2025).
- Arthursson, M.; Tod, A.; Dellar, E.; Lundstrom, A. Digitalizing the mining industry–3D scanning of core trays to produce volumetric bulk densities. In Proceedings of the 3rd Australian Exploration Geosciences Conference: Geosciences for a Sustainable World, Brisbane, Australia, 15–20 September 2021; p. 5. [Google Scholar]
- Harris, A.C.; Finn, D.J.; MacCorquodale, F.T.A.; Ravella, M.; Clarke, W.J.; Krneta, S.; Battig, E.; Maguire, S. Empowering geologists in the exploration process-maximizing data used from enabling scanning technology. SEG Discov. 2024, 136, 17–31. [Google Scholar] [CrossRef]
- De La Rosa, R.; Tolosana-Delgado, R.; Kirsch, M.; Gloaguen, R. Automated multi-scale and multivariate geological logging from drill core hyperspectral data. Remote Sens. 2022, 14, 2676. [Google Scholar] [CrossRef]
- Tercier, A.; Vasileva, E.; Alvarez-Llamas, C.; Fabre, C.; Hermelin, S. High-resolution high-speed LIBS microscopy. Spectroscopy 2023, 38, 34–40. [Google Scholar] [CrossRef]
- JORC. Draft Code and Guidance of the Australasian Code for Reporting of Exploration Results, Mineral Resources and Ore Reserves—The JORC Code; Joint Ore Reserves Committee of the Australasian Institute of Mining and Metallurgy, Australian Institute of Geoscientists and Minerals Council of Australia: Melbourne, Australia, 2024; p. 100. [Google Scholar]
- CIM. Mineral Exploration Best Practice Guidelines; CIM: Montreal, QC, Canada, 2018; p. 16. Available online: https://mrmr.cim.org/media/1080/cim-mineral-exploration-best-practice-guidelines-november-23-2018.pdf (accessed on 24 March 2025).
- CIM. Leading Practice Guidelines for Mineral Processing; CIM: Montreal, QC, Canada, 2022; p. 28. Available online: https://mrmr.cim.org/media/1159/cim-leading-practice-guidelines-for-mineral-processing-2022.pdf (accessed on 24 March 2025).
- Novo. Mineral Resource Update: Beatons Creek Gold Project, Nullagine, Western Australia; NI 43-101 Technical Report; Novo Resources Corp.: Vancouver, BC, Canada, 2022; p. 210. Available online: https://www.sedarplus.ca/csa-party/records/profile.html?id=e282f6bdbe8f2e0d9570718b0e194f4c (accessed on 24 March 2025).
- Calidus. 2024. Available online: https://cdn-api.markitdigital.com/apiman-gateway/ASX/asx-research/1.0/file/2924-02817235-6A1211525 (accessed on 24 March 2025).
- Gough, P.C. A Petrographic Study and Genesis Model of the Auriferous Conglomerates at Beatons Creek, Nullagine, WA. Master’s Thesis, Camborne School of Mines, Penryn, UK, 2014; p. 95. [Google Scholar]
- Galindo, S.; Monecke, T.; Kocher, S.; Westman, E. Update on Gold Conglomerates at Beatons Creek, Australia; Unpublished PowerPoint presentation on research by the Colorado School of Mines to Novo Resources Corp.; Colorado School of Mines: Golden, CO, USA, 2023; p. 21. [Google Scholar]
- Dominy, S.C.; Graham, J.C.; Glacken, I.M. Evaluation of coarse gold-bearing conglomerate mineralisation at Beatons Creek, Pilbara, Western Australia: Sampling for resource development and grade control. Minerals 2024, 14, 337. [Google Scholar] [CrossRef]
- Dominy, S.C.; Graham, J.C.; Esbensen, K.H.; Purevgerel, S. Application of PhotonAssay™ to coarse-gold mineralization: The importance of rig to assay optimization. Sampl. Sci. Technol. 2024, 1, 2–30. [Google Scholar] [CrossRef]
- Arrowsmith, V.; Parker, B.; Dominy, S.C. Beatons Creek Gold Project: Metallurgical Testwork Report; Unpublished Report; Novo Resources Corp.: Perth, Australia, 2020; p. 82. [Google Scholar]
- Laplante, A.R.; Staunton, W.P. Gravity recovery of gold—An overview of recent developments. In Proceedings of the Annual Canadian Mineral Processors Conference 2005, Ottawa, ON, Canada, 18–20 January 2005; Canadian Institute of Mining: Montreal, QC, Canada, 2005; pp. 51–64. [Google Scholar]
- Ison, J. Beatons Creek Fresh Project—Metallurgical Testwork Report: Phase 2; Unpublished Interim Report; Novo Resources Corp.: Perth, Australia, 2022; p. 47. [Google Scholar]


| Location | Site/Field | Laboratory | ||||
|---|---|---|---|---|---|---|
| Node | Planning | Collection | Transport | Preparation | Testwork (2) | Assaying |
| Activity | Scope Characterise Design Implement QA protocols QC KPIs Staff training | Observe Select/collect Bag and tag QAQC Integrity/security Chain of custody | Integrity/security Chain of custody | Equipment operation Equipment clean QAQC Integrity/security | Equipment operation Equipment clean QAQC Integrity/security | Equipment operation Equipment clean QAQC Integrity/security |
| Sampling error (where appropriate) (1) | FSE, GSE IDE, IEE, IWE | IPE | FSE, GSE IDE, IEE, IWE, IPE | FSE, GSE IDE, IEE, IWE, IPE | IPE, AE | |
| Dominant effect on results (where appropriate) | Precision Bias | Bias | Precision Bias | Precision Bias | Bias | |
| Project Stage | Low Heterogeneity | High Heterogeneity | ||||
|---|---|---|---|---|---|---|
| Metallurgical Composites | Geometallurgical Variability | Bulk Samples | Metallurgical Composites | Geometallurgical Variability | Bulk Samples | |
| Scoping | 2–5 | 2–5 | N | 5–15 | 5–10 | N |
| PFS | 10 | 5–15 | N | 20 | 15–30 | (Y) |
| FS | 10 | 15–30 | (Y) | 20 | >30 | Y |
| Total at FS | >25 | >30 | (Y) | >50 | >50 | Y |
| Metallurgical factors or assumptions | 1 | The metallurgical process proposed and the appropriateness of that process to the style of mineralisation |
| 2 | Whether the metallurgical process is well-tested technology or novel in nature | |
| 3 | The nature, amount, and representativeness of metallurgical test work undertaken, the nature of the metallurgical domaining applied, and the corresponding metallurgical recovery factors applied | |
| 4 | Any assumptions or allowances made for deleterious elements | |
| 5 | The existence of any bulk sample or pilot scale test work and the degree to which such samples are considered representative of the orebody as a whole | |
| 6 | For minerals that are defined by a specification, has the ore reserve estimation been based on the appropriate mineralogy to meet the specifications? |
| Sample Preparation, Analyses, and Security | (a) | Sample preparation methods and quality control measures employed before dispatch of samples to an analytical or testing laboratory, the method or process of sample splitting and reduction, and the security measures taken to ensure the validity and integrity of samples taken |
| (b) | Relevant information regarding sample preparation, assaying, and analytical procedures used, the name and location of the analytical or testing laboratories, the relationship of the laboratory to the issuer, and whether the laboratories are certified by any standards association, and the particulars of any certification | |
| (c) | A summary of the nature, extent, and results of quality control procedures employed and quality assurance actions taken or recommended to provide adequate confidence in the data collection and processing | |
| (d) | The author’s opinion [Qualified Person] on the adequacy of sample preparation, security, and analytical procedures |
| Mineral processing and metallurgical testing | (a) | Nature and extent of the testing and analytical procedures, and provide a summary of the relevant results |
| (b) | Basis for any assumptions or predictions regarding recovery estimates | |
| (c) | The extent known, the degree to which the test samples are representative of the various types and styles of mineralisation, and the mineral deposit as a whole | |
| (d) | The extent known, any processing factors or deleterious elements that could have a significant effect on potential economic extraction |
| Hole ID | Location | Reef | From (m) | To (m) | True Reef Width (m) |
|---|---|---|---|---|---|
| BCDD18-018 | SH | CH1 | 64.80 | 65.50 | 0.70 |
| BCDD18-018 | SH | CH2 | 75.50 | 75.26 | 0.76 |
| BCDD18-019 | SH | CH1 | 58.50 | 59.30 | 0.80 |
| BCDD18-019 | SH | CH2 | 69.24 | 70.60 | 1.36 |
| BCDD18-020 | SH | CH1 | 51.20 | 51.80 | 0.60 |
| BCDD18-020 | SH | CH2 | 61.95 | 62.90 | 0.95 |
| BCDD18-021 | GH | M1 | 35.00 | 36.25 | 1.25 |
| BCDD18-021 | GH | M2 | 43.57 | 45.25 | 1.68 |
| BCDD18-022 | GH | M1 | 47.05 | 48.10 | 1.05 |
| BCDD18-022 | GH | M2 | 59.73 | 61.13 | 1.40 |
| BCDD18-023 | GH | M1 | 51.41 | 51.98 | 0.57 |
| BCDD18-023 | GH | M2 | 65.12 | 66.09 | 0.97 |
| Hole ID | Location | Reef | Reef Width (m) | Selected Reef Width (m) | FW Dilution (m) | HW Dilution (m) | Diluted Reef Width (m) | Mass Inc. Dilution (kg) | MET Sample ID |
|---|---|---|---|---|---|---|---|---|---|
| BCDD18-018 | SH | CH1 | 0.70 | 1.00 | 0.10 | 0.15 | 1.25 | 17.8 | BCMET18-018-CH1 |
| BCDD18-018 | SH | CH2 | 0.76 | 1.00 | 0.10 | 0.15 | 1.25 | 18.5 | BCMET18-018-CH2 |
| BCDD18-019 | SH | CH1 | 0.80 | 1.00 | 0.10 | 0.15 | 1.25 | 23.9 | BCMET18-019-CH1 |
| BCDD18-019 | SH | CH2 | 1.36 | 1.36 | 0.10 | 0.15 | 1.61 | 22.8 | BCMET18-019-CH2 |
| BCDD18-020 | SH | CH1 | 0.60 | 1.00 | 0.10 | 0.15 | 1.25 | 18.4 | BCMET18-020-CH1 |
| BCDD18-020 | SH | CH2 | 0.95 | 1.00 | 0.10 | 0.15 | 1.25 | 17.9 | BCMET18-020-CH2 |
| BCDD18-021 | GH | M1 | 1.25 | 1.25 | 0.10 | 0.15 | 1.50 | 21.3 | BCMET18-021-M1 |
| BCDD18-021 | GH | M2 | 1.68 | 1.68 | 0.10 | 0.15 | 1.93 | 27.2 | BCMET18-021-M2 |
| BCDD18-022 | GH | M1 | 1.05 | 1.05 | 0.10 | 0.15 | 1.30 | 17.0 | BCMET18-022-M1 |
| BCDD18-022 | GH | M2 | 1.40 | 1.40 | 0.10 | 0.15 | 1.65 | 25.5 | BCMET18-022-M2 |
| BCDD18-023 | GH | M1 | 0.57 | 1.00 | 0.10 | 0.15 | 1.25 | 17.5 | BCMET18-023-M1 |
| BCDD18-023 | GH | M2 | 0.97 | 1.00 | 0.10 | 0.15 | 1.25 | 18.5 | BCMET18-023-M2 |
| Total | - | - | 12.1 | - | - | - | 16.7 | 246.3 | - |
| BCMET Composite ID | BCMET Interval ID | Mass |
| BCMET18-COMP-CH1 | BCMET18-018-CH1 | 17.83 |
| BCMET18-019-CH1 | 23.86 | |
| BCMET18-020-CH1 | 18.35 | |
| Total mass | 60.04 | |
| BCMET18-COMP-CH2 | BCMET18-018-CH2 | 18.46 |
| BCMET18-019-CH2 | 22.82 | |
| BCMET18-020-CH2 | 17.91 | |
| Total mass | 59.19 | |
| BCMET18-COMP-M1 | BCMET18-021-M1 | 21.33 |
| BCMET18-022-M1 | 16.95 | |
| BCMET18-023-M1 | 17.51 | |
| Total mass | 55.79 | |
| BCMET18-COMP-M2 | BCMET18-021-M2 | 27.21 |
| BCMET18-022-M2 | 25.54 | |
| BCMET18-023-M2 | 18.47 | |
| Total mass | 71.22 |
| Location | Activity | QAQC Actions |
|---|---|---|
| Site | Drilling and core logging | Novo QA documentation inc. core handling/logging and transportation. Instigation of the COC. Review/supervision by QPs |
| Mineralogical laboratory | Minalyze CS scanning | Laboratory QA documentation. Review/supervision by QPs |
| Metallurgical laboratory | Comminution testwork | Laboratory QA documentation and specific unit hygiene/cleaning to avoid contamination. Review/supervision by QPs |
| Assay laboratory | PhotonAssay™ | Laboratory and Novo QC actions. Review/supervision by QPs |
| Metallurgical laboratory | Recovery testwork | Laboratory and Novo QC actions across equipment hygiene/cleaning and assaying. Review/supervision by QPs |
| QA Action | Stage | Action | Rate | NVO_KPI |
|---|---|---|---|---|
| Novo Site Activities | ||||
| Core sample collection and integrity; chain-of-custody | Sample collection and receipt | Novo | All | Comply with SOP |
| Core logging | Core logging and photography | Novo | All | Comply with SOP |
| Testwork Activities | ||||
| Laboratory arrival checks | Check the integrity of the core on arrival at the scanning and metallurgical laboratories | Lab | All | Comply with SOP |
| Blank (Assay and GRG process) | 1 kg crushed blank inserted post recombination from comminution and pre-crush 1x full 50 kg blank through the entire GRG process | Lab | 1 in 5 1 | <0.1 g/t Au |
| Barren flush (comminution) | 5 kg flush through all comminution testwork equipment | Lab | 1 in 1 flush Assay 1 in 1; 2 kg LW | <0.5% gold loss |
| Barren flush (GRG) | 5 kg flush through all GRG testwork equipment | Lab | 1 in 1 flush Assay 1 in 1; 2 kg LW | <0.5% gold loss |
| Visual inspection | Inspection of all comminution and GRG equipment. | Lab | All | Written sign-off of for each test by supervising metallurgist |
| Insertion of CRMs | All assays of head, tails and concentrates. | Lab | 1 in 5 | Precision: <5%; Bias <2.5%; >3SD <0.3%; >2SD <5%. |
| Stage | Approx. Lot Max. Mass | Assay Mass | Comminution State (est. P90) | Calc. FSE Range | Actual Duplicate Precision |
|---|---|---|---|---|---|
| Variability head | 27 kg | 10 kg | 1.5 mm | ±4%–15% | ±28% |
| Composite head | 62 kg | 10 kg | 1.5 mm | ±10%–20% | ±37% |
| Post GRG stage 1 | 47 kg | 5 kg | 650 µm | ±8%–11% | <±10% |
| Post GRG stage 2 | 42 kg | 5 kg | 160 µm | <±5% | <±5% |
| Post GRG stage 3 | 37 kg | 5 kg | 75 µm | <±5% | <±5% |
| Data Type | Outputs | Primary Sample Type | Composite Type |
|---|---|---|---|
| Geological (core logging and Minalyze scan) | Lithology, alteration, mineralogy, inc. photographs | Whole core | Variability |
| Geotechnical (core logging and Minalyze scan) | TCR, SCR, RQD, bulk density, fracture mapping | Whole core | Variability |
| Mineralogy | Reflected light microscopy, automated mineralogy | Core filets | Variability |
| Geochemical | Au head (PA) Au head (LW + tail FA) Au head (SFA) 26 elements (pXRF) 53 elements (ICP) | Crushed core | Variability |
| Metallurgical–comminution | BAI, BWI and SMC | Crushed core | Variability |
| Metallurgical–recovery | GRG and Leach | Crushed core | Variability composite |
| Geoenvironmental | 53 elements inc. As, S, Hg and Ni (ICP) | Testwork tailings | Variability composite |
| BCMET Composite ID | BCMET Interval ID | Grade (g/t Au) |
|---|---|---|
| BCMET18-COMP-CH1 | BCMET18-018-CH1 | 0.38 |
| BCMET18-019-CH1 | 1.38 | |
| BCMET18-020-CH1 | 0.58 | |
| Composite grade | 0.84 [0.70] | |
| BCMET18-COMP-CH2 | BCMET18-018-CH2 | 3.85 |
| BCMET18-019-CH2 | 0.51 | |
| BCMET18-020-CH2 | 0.15 | |
| Composite grade | 1.44 [1.23] | |
| BCMET18-COMP-M1 | BCMET18-021-M1 | 1.25 |
| BCMET18-022-M1 | 1.07 | |
| BCMET18-023-M1 | 14.62 | |
| Composite grade | 5.39 [5.60] | |
| BCMET18-COMP-M2 | BCMET18-021-M2 | 5.24 |
| BCMET18-022-M2 | 6.23 | |
| BCMET18-023-M2 | 2.36 | |
| Composite grade | 4.85 [4.65] |
| Test | Range | Mean Value | 85th Percentile | Number Tests | COV |
|---|---|---|---|---|---|
| BWI (kWh/t) | 17.8–20.2 | 18.8 | 19.5 | 20 | 4% |
| BAI | 0.177–0.341 | 0.240 | 0.245 | 20 | 16% |
| SMC (A*b) | 38.0–56.6 | 49.8 | 47.4 | 20 | 10% |
| Key parameter | Comment | (1) Key Error(s) | Risk Rating | |
|---|---|---|---|---|
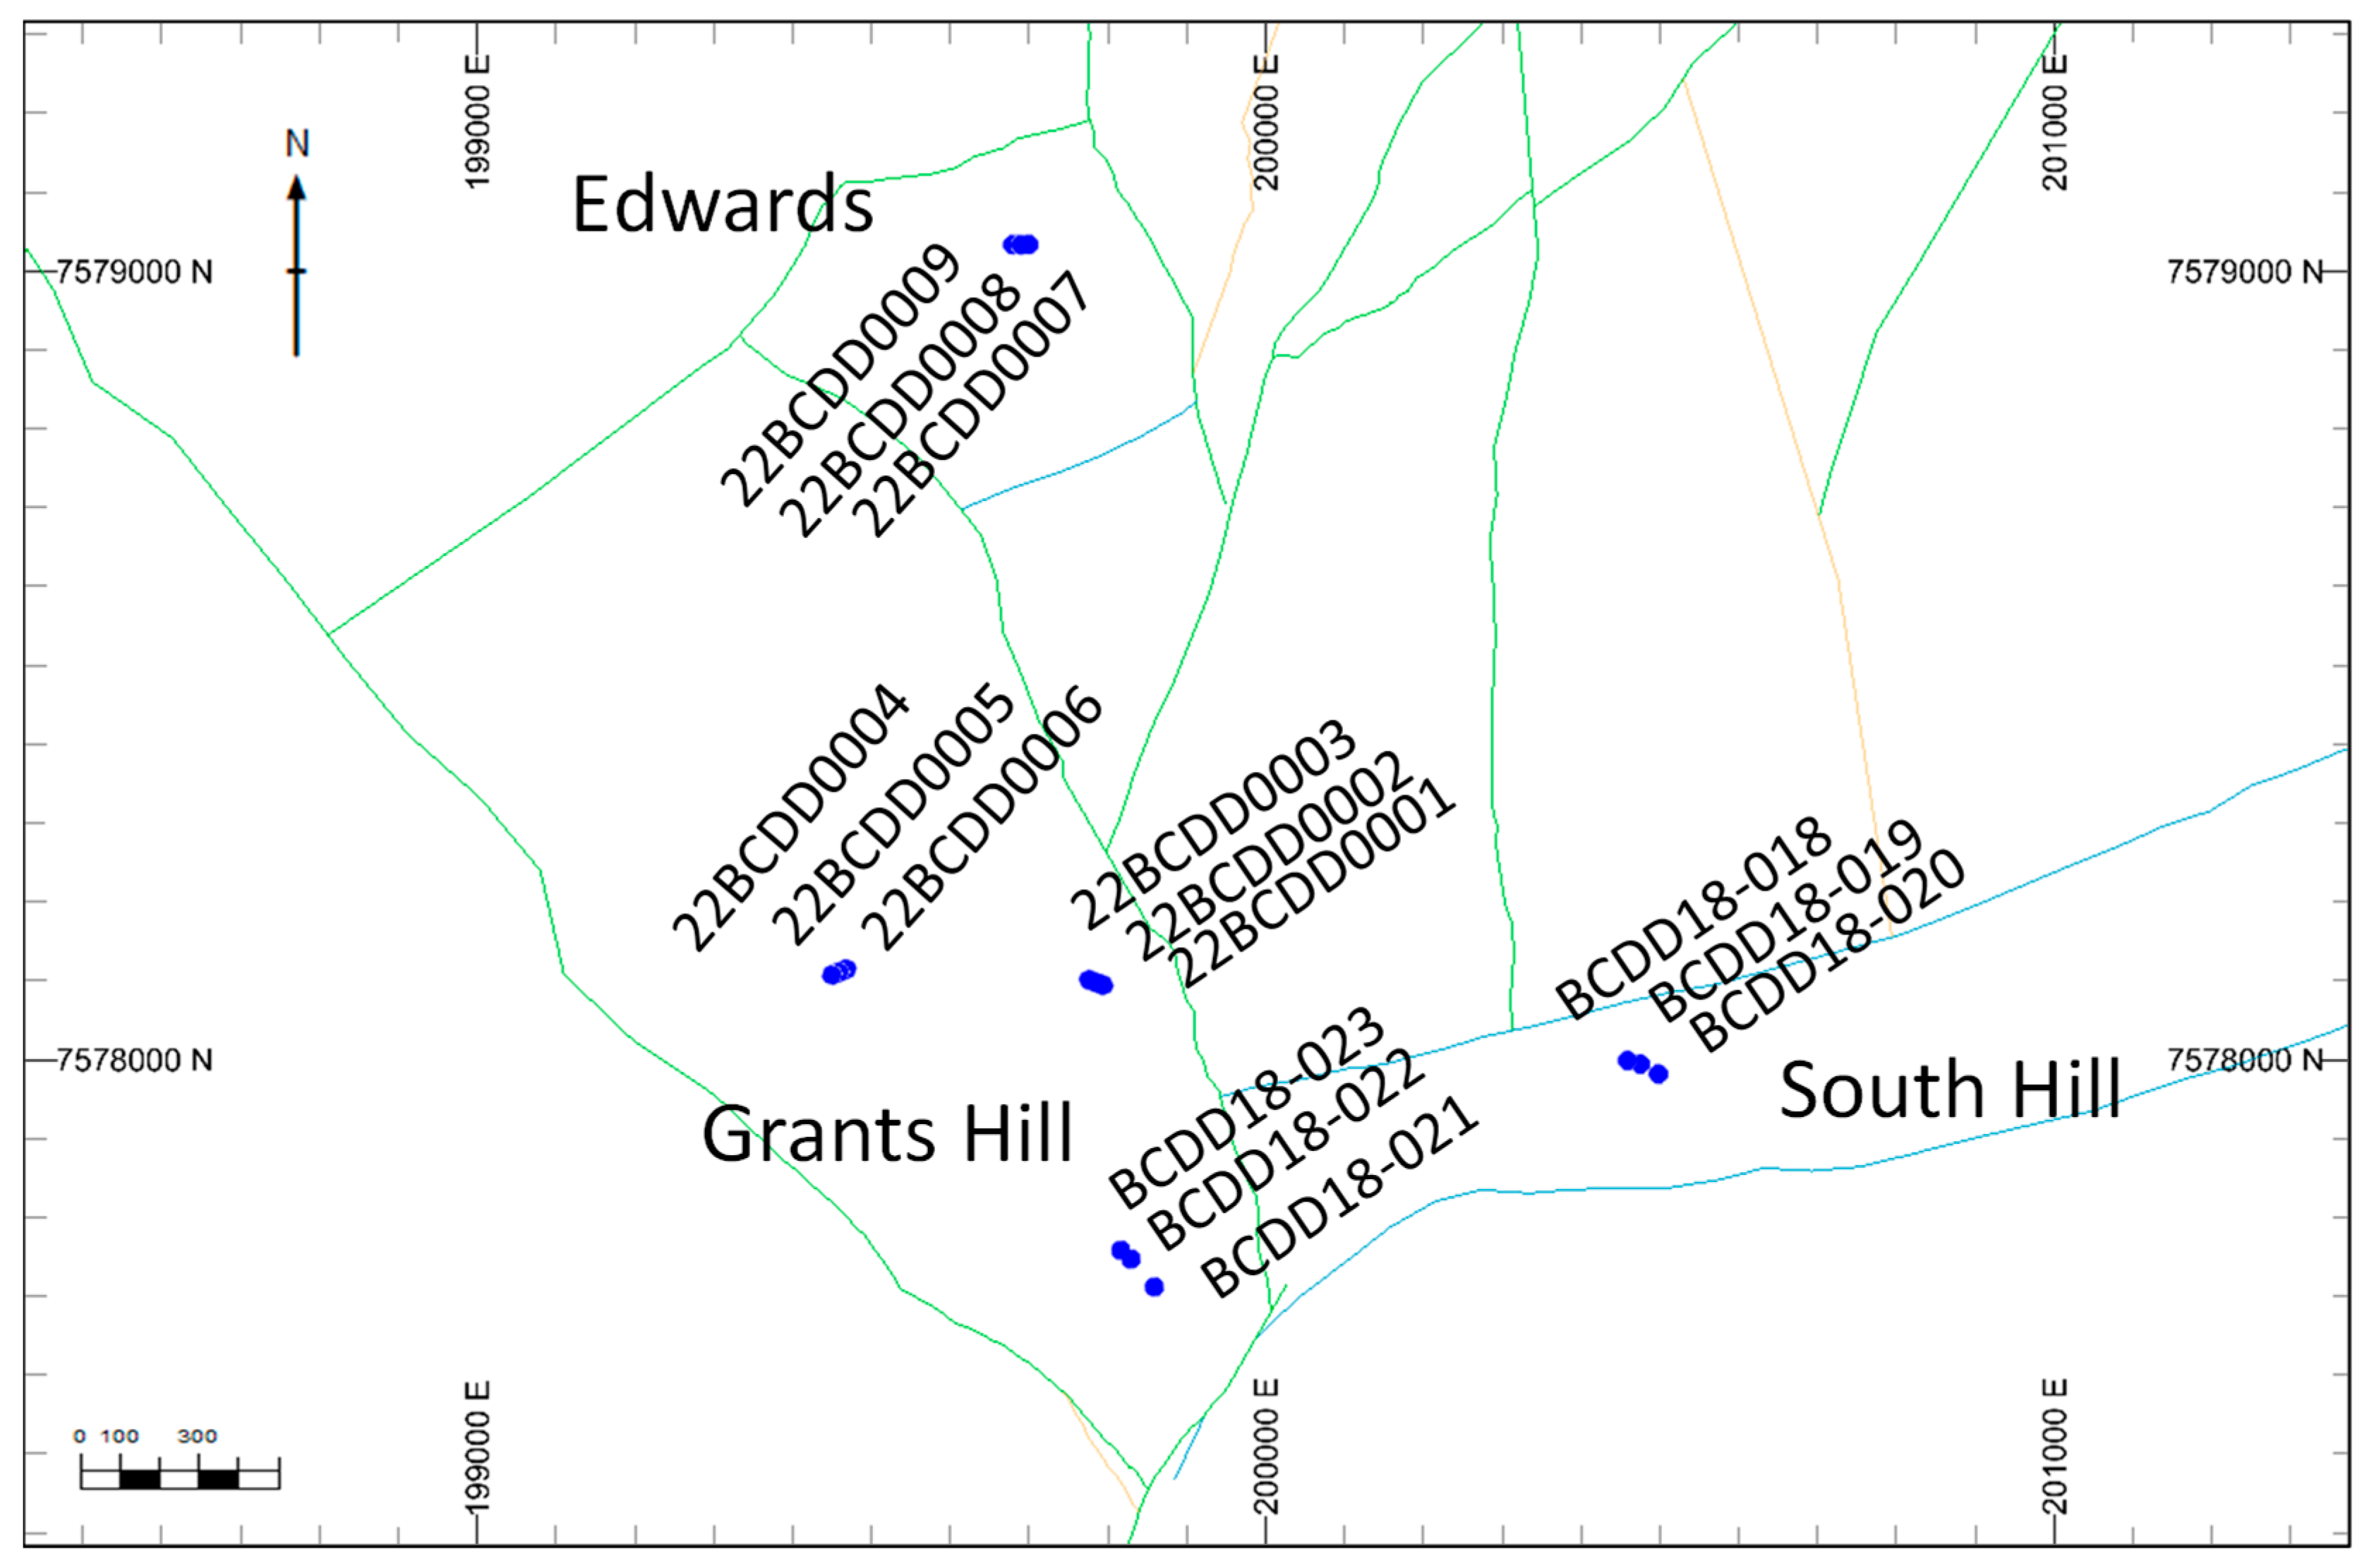
| 1 | Spatial distribution and number of samples | Fifteen core holes were drilled as five sets of three close-spaced holes. Key “economic” areas within the pit shell were covered, including Grants Hill, South Hill, and Edwards. The fifteen holes provided 34 reef intersections across the M0-M3 and CH1-2 reefs. Twenty-one intersections represented the dominant M1 (12) and M2 (9) reefs. | GNE | Low-mod |
| 2 | Sample mass | Whole PQ core was selected, providing a total core mass for testwork of 718 kg (2018: 246 kg and 2022: 472 kg). Head, comminution, and geochemical analysis were undertaken on individual intervals. Gravity and leach testwork were undertaken on c. 50 kg variability composites made up from intersections from the same reef (e.g., M1, M2, etc.). | GNE | Mod |
| 3 | Representation of geology, mineralogy, and grade | All 34 intersections geologically represented the conglomerates as observed in other core and surface exposures in and around the pits (inc. trial mining bench). Fresh material was dominated by the variable presence of pyrite. The head grades of the 34 intersections ranged from 0.1 g/t to 10.5 g/t Au, representing 80% of the global grade distribution. And included low-grade mineralisation (0.5–0.8 g/t Au); mineralisation indicator grade (0.5 g/t Au); operating (2021–2022) cut-off grade (0.8 g/t Au); run-of-mine range grade (1–2 g/t Au); and high-grade (>5 g/t Au). | GNE | Low-mod |
| 4 | Degree of domaining | Focus on key M1 and M2 reefs, also including M0 and M3 together with CH1 and CH2. No further domaining was undertaken. | GNE | Low-mod |
| 5 | Sample quality, collection (rig), selection, and handling | Protocols were set up and supervision undertaken to ensure the integrity of all samples. The TCR and SCR of all cores were high, indicating excellent quality with minimal fragmentation and fines loss. No breaches of protocols were recorded. | IDE, IEE, IPE | Low |
| 6 | Transport and security | Protocols were set up and supervision undertaken to ensure the integrity of all samples. A COC was enacted. No breaches of protocols were recorded. | IPE | Low |
| 7 | Preparation | Procedures were set up and supervision undertaken to ensure the integrity of all samples. All sample splitting was undertaken by RSD or riffle splitter. Equipment hygiene between tests was maintained throughout the programme. No breaches of protocols were recorded. | FSE, GSE, IDE, IEE, IPE | Low |
| 8 | Testwork (QAQC) | QA procedures and QC were set up and supervision undertaken to ensure the integrity of all samples. No breaches of protocols or QC KPIs were recorded. | IPE | Low |
| 9 | Assay (QAQC) | QA procedures were set up and supervision undertaken to ensure the integrity of all samples. No breaches of protocols or QC KPIs were recorded. | AE | Low |
| 10 | Verification Validation | Laboratory spreadsheet calculations, reports, and certificates were checked against the database. CP/QP visits to drill sites, core farms, and laboratories were undertaken. A 38,200 t batch of fresh M2 reef (within pit shell) was processed through the Golden Eagle plant. All metrics across throughput, total recovery, gravity recovery, and SAG specific energy were within expectation. All protocols/procedures were adhered to and QC within given KPIs. | - | Low |
| Sample representivity [1]–[4] | Low-mod | |||
| Testwork quality [5]–[9] | Low | |||
| Fit-for-purpose rating [1]–[10] | Low-mod | |||
Disclaimer/Publisher’s Note: The statements, opinions and data contained in all publications are solely those of the individual author(s) and contributor(s) and not of MDPI and/or the editor(s). MDPI and/or the editor(s) disclaim responsibility for any injury to people or property resulting from any ideas, methods, instructions or products referred to in the content. |
© 2025 by the authors. Licensee MDPI, Basel, Switzerland. This article is an open access article distributed under the terms and conditions of the Creative Commons Attribution (CC BY) license (https://creativecommons.org/licenses/by/4.0/).
Share and Cite
Dominy, S.C.; Glass, H.J. Geometallurgical Sampling and Testwork for Gold Mineralisation: General Considerations and a Case Study. Minerals 2025, 15, 370. https://doi.org/10.3390/min15040370
Dominy SC, Glass HJ. Geometallurgical Sampling and Testwork for Gold Mineralisation: General Considerations and a Case Study. Minerals. 2025; 15(4):370. https://doi.org/10.3390/min15040370
Chicago/Turabian StyleDominy, Simon C., and Hylke J. Glass. 2025. "Geometallurgical Sampling and Testwork for Gold Mineralisation: General Considerations and a Case Study" Minerals 15, no. 4: 370. https://doi.org/10.3390/min15040370
APA StyleDominy, S. C., & Glass, H. J. (2025). Geometallurgical Sampling and Testwork for Gold Mineralisation: General Considerations and a Case Study. Minerals, 15(4), 370. https://doi.org/10.3390/min15040370