
Determining the Mechanical Properties of Shale Constituent Minerals Using Nanoindentation and a TESCAN Integrated Mineral Analyzer (TIMA)


Abstract
:
1. Introduction
2. Material and Method
2.1. Sample Material and Preparation
2.2. Nanoindentation
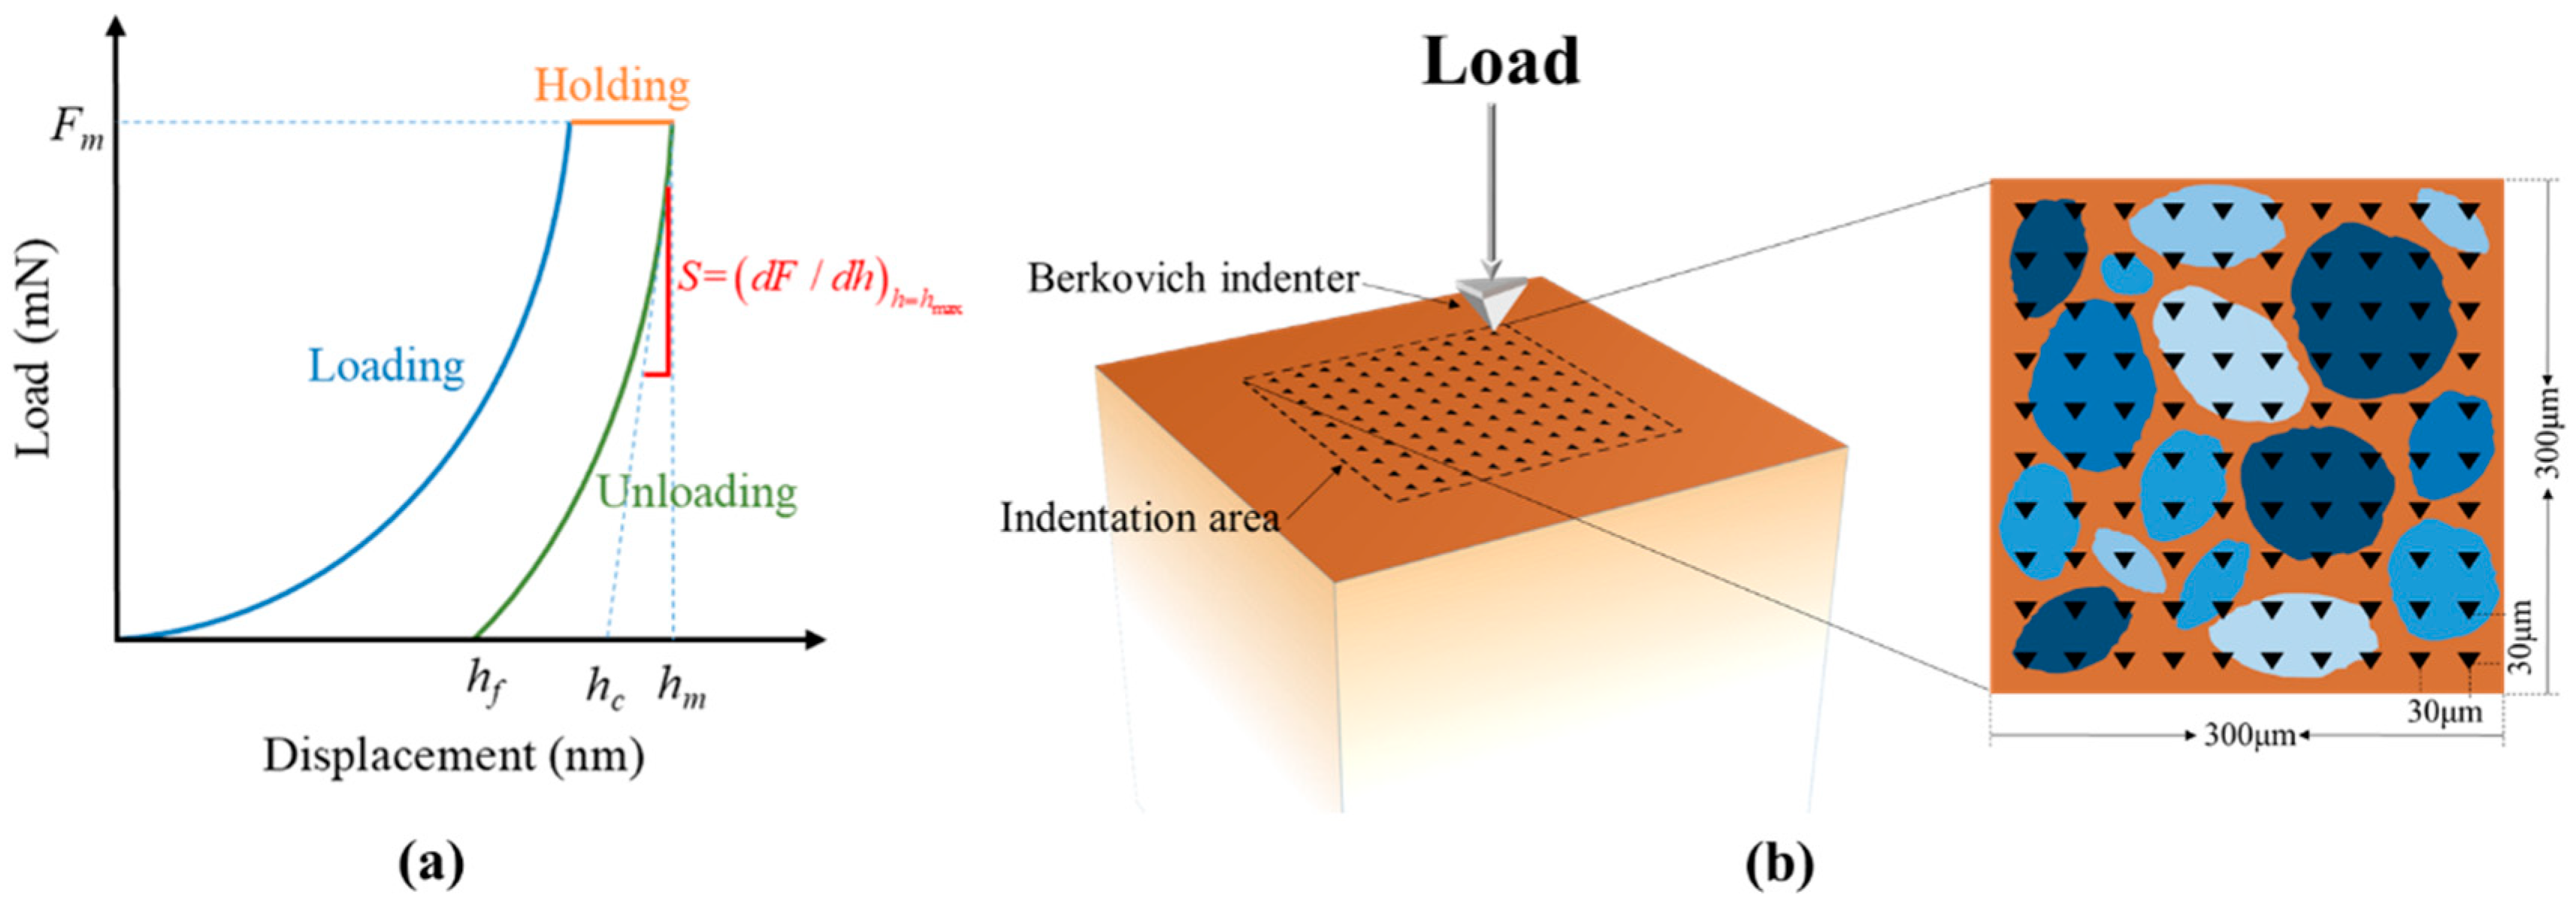
2.2.1. Nanoindentation Theory
2.2.2. Determination of the Representative Elementary Area (REA)
2.2.3. Nanoindentation Design
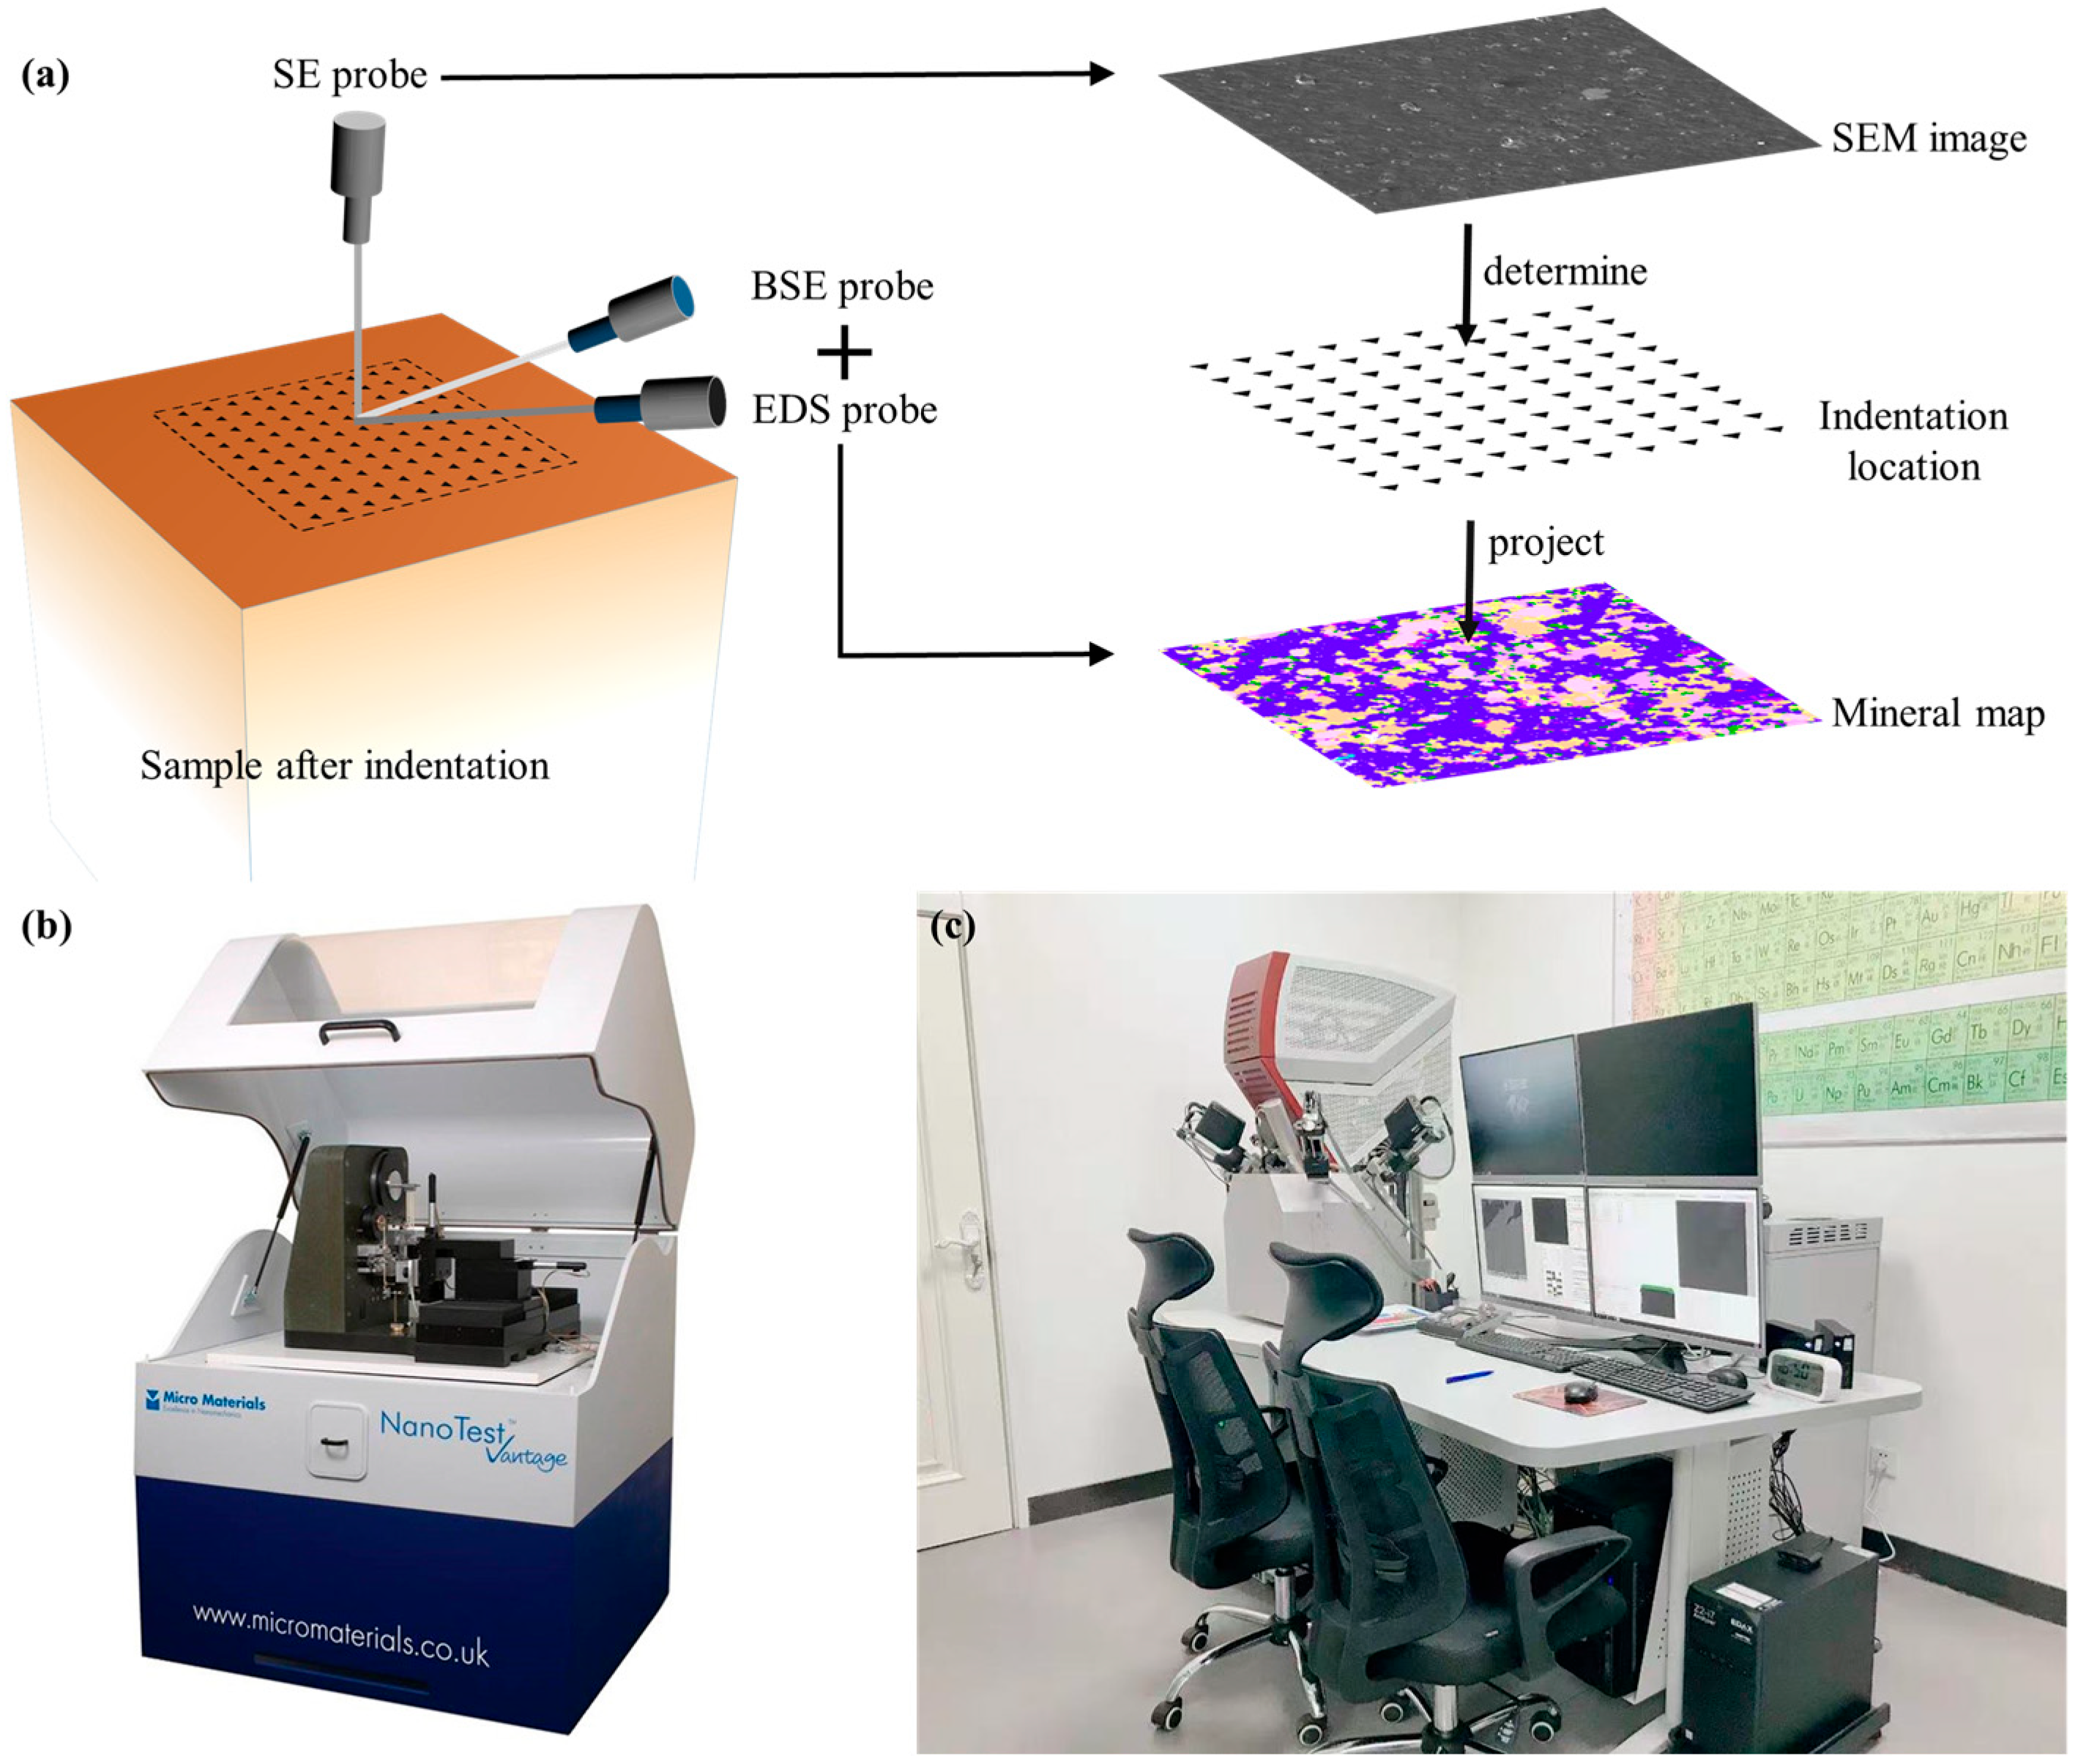
2.3. SEM Observation and TIMA
3. Result and Discussion
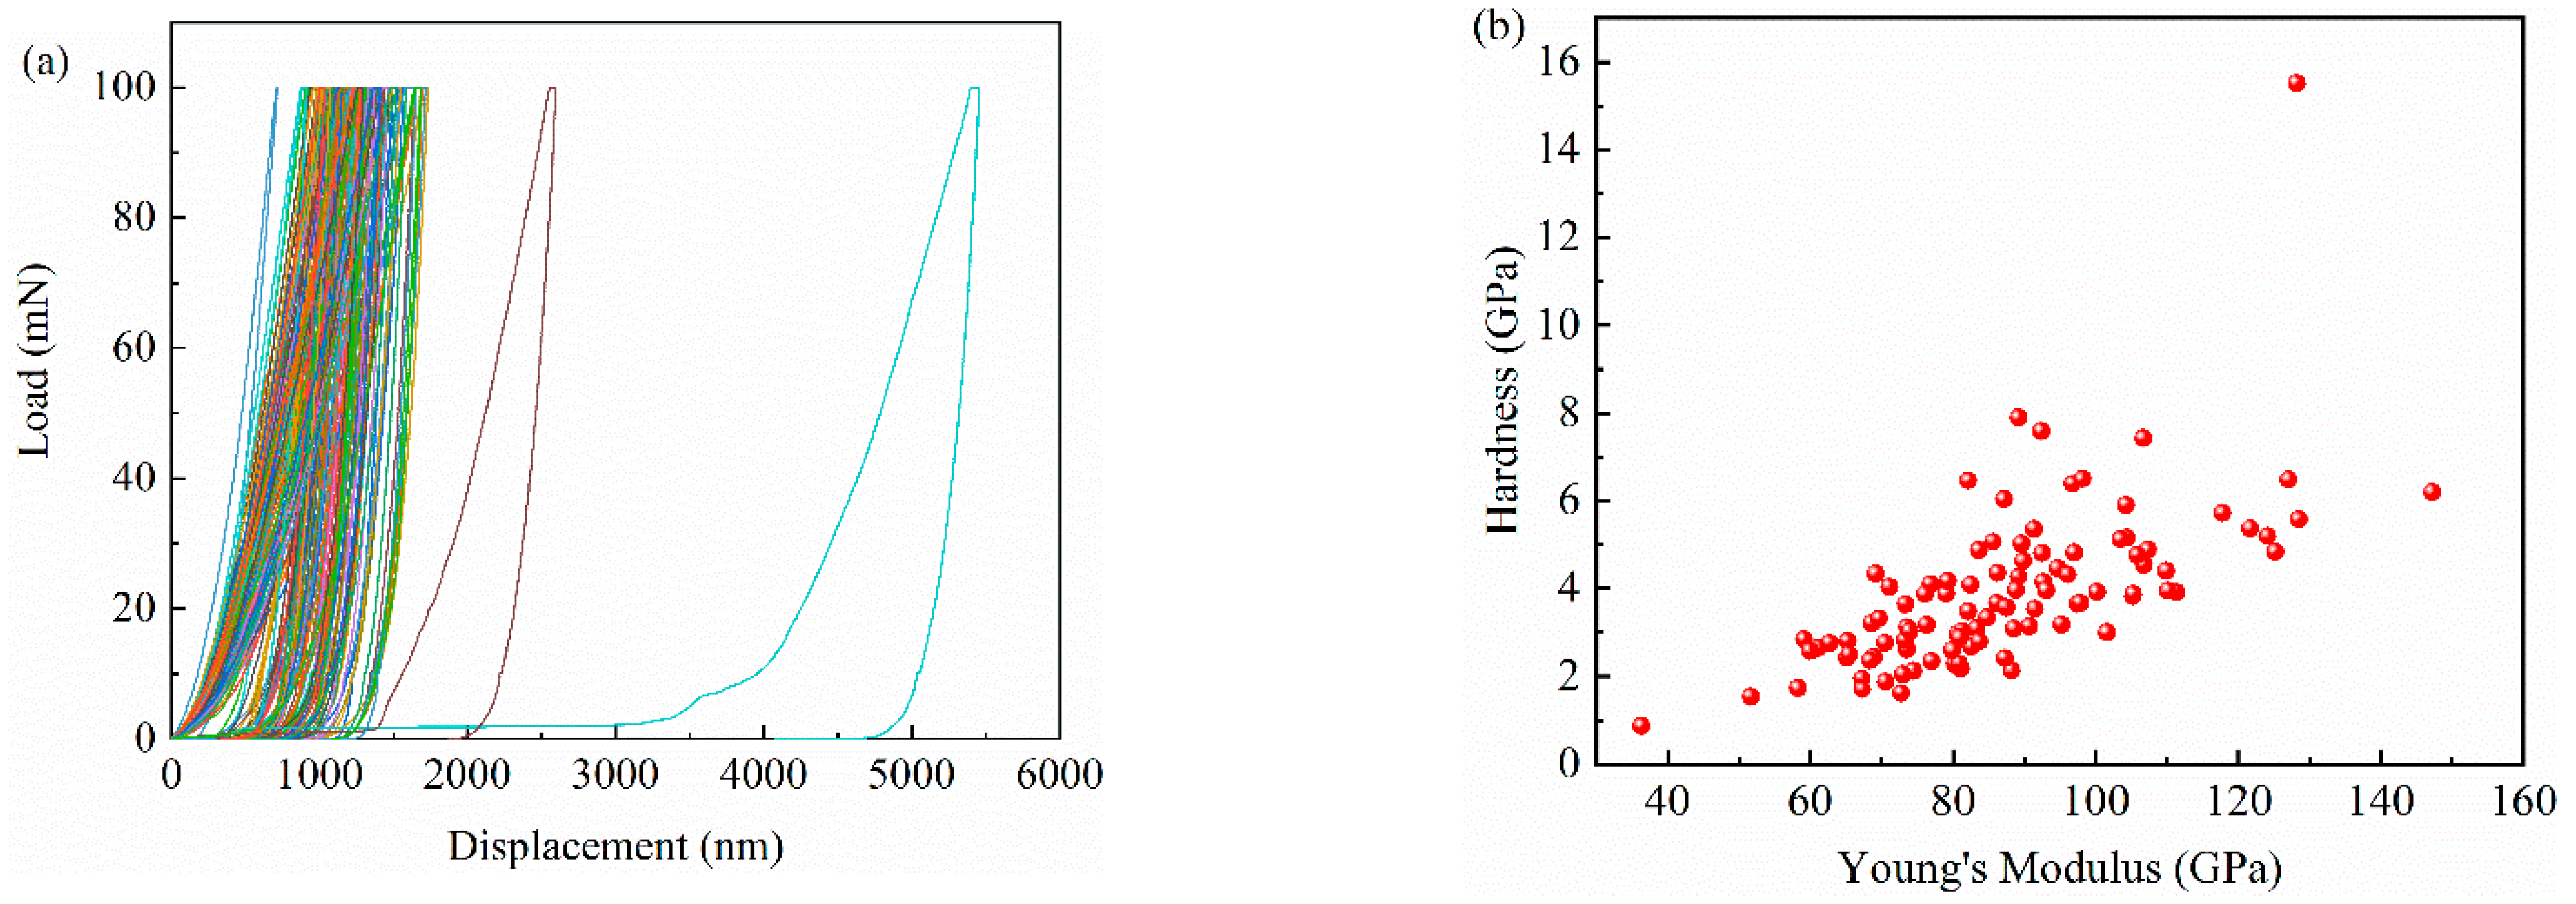
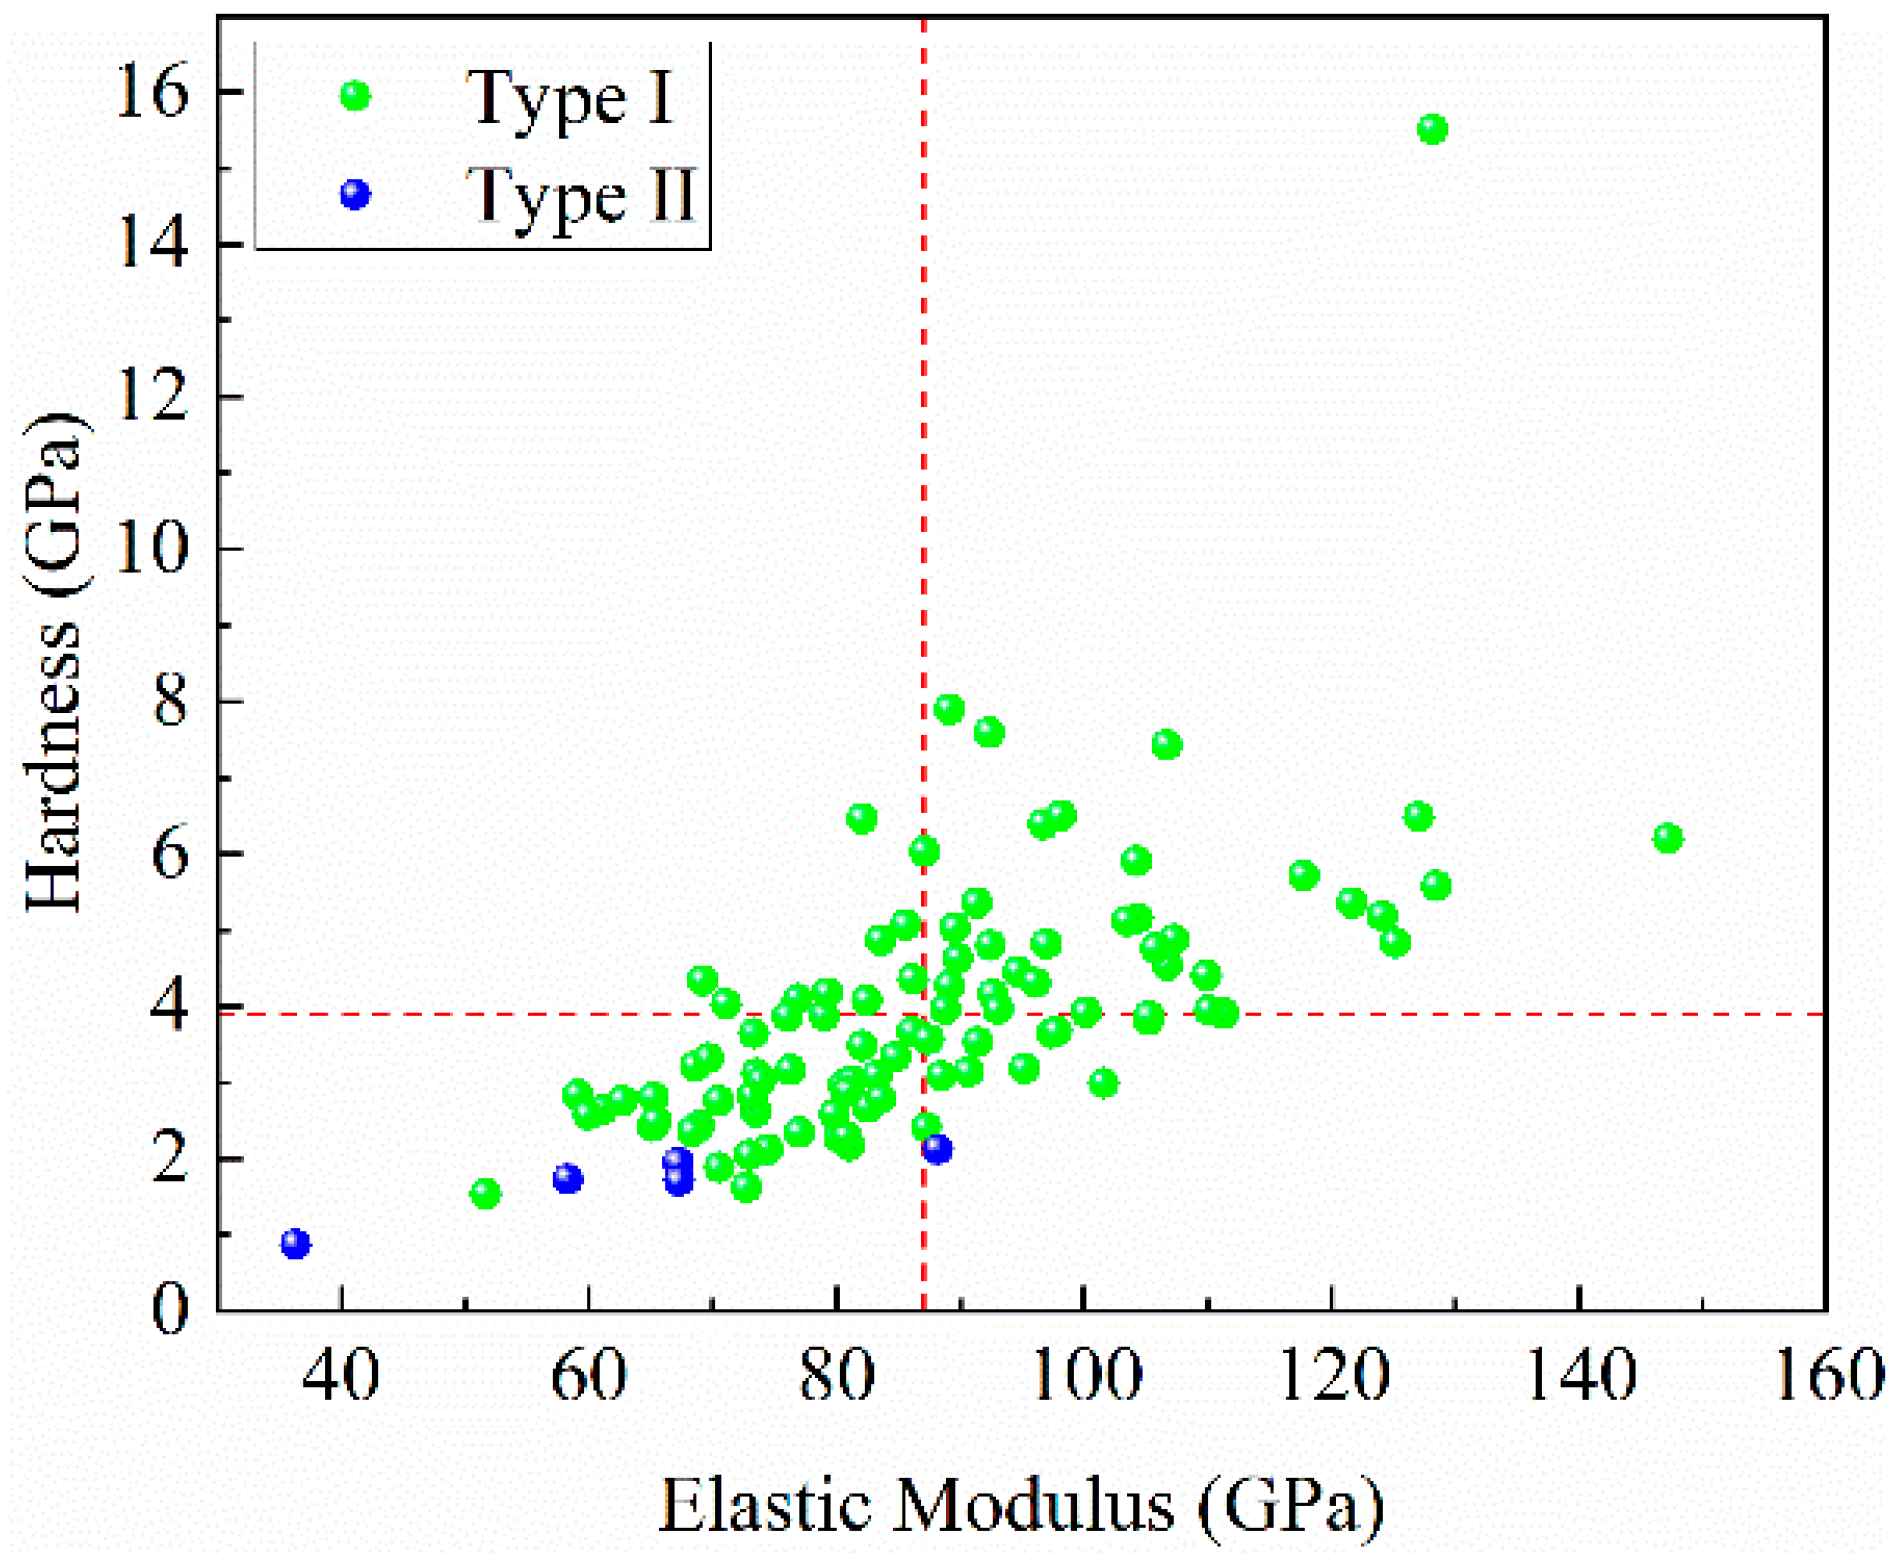
3.1. Micromechanical Result
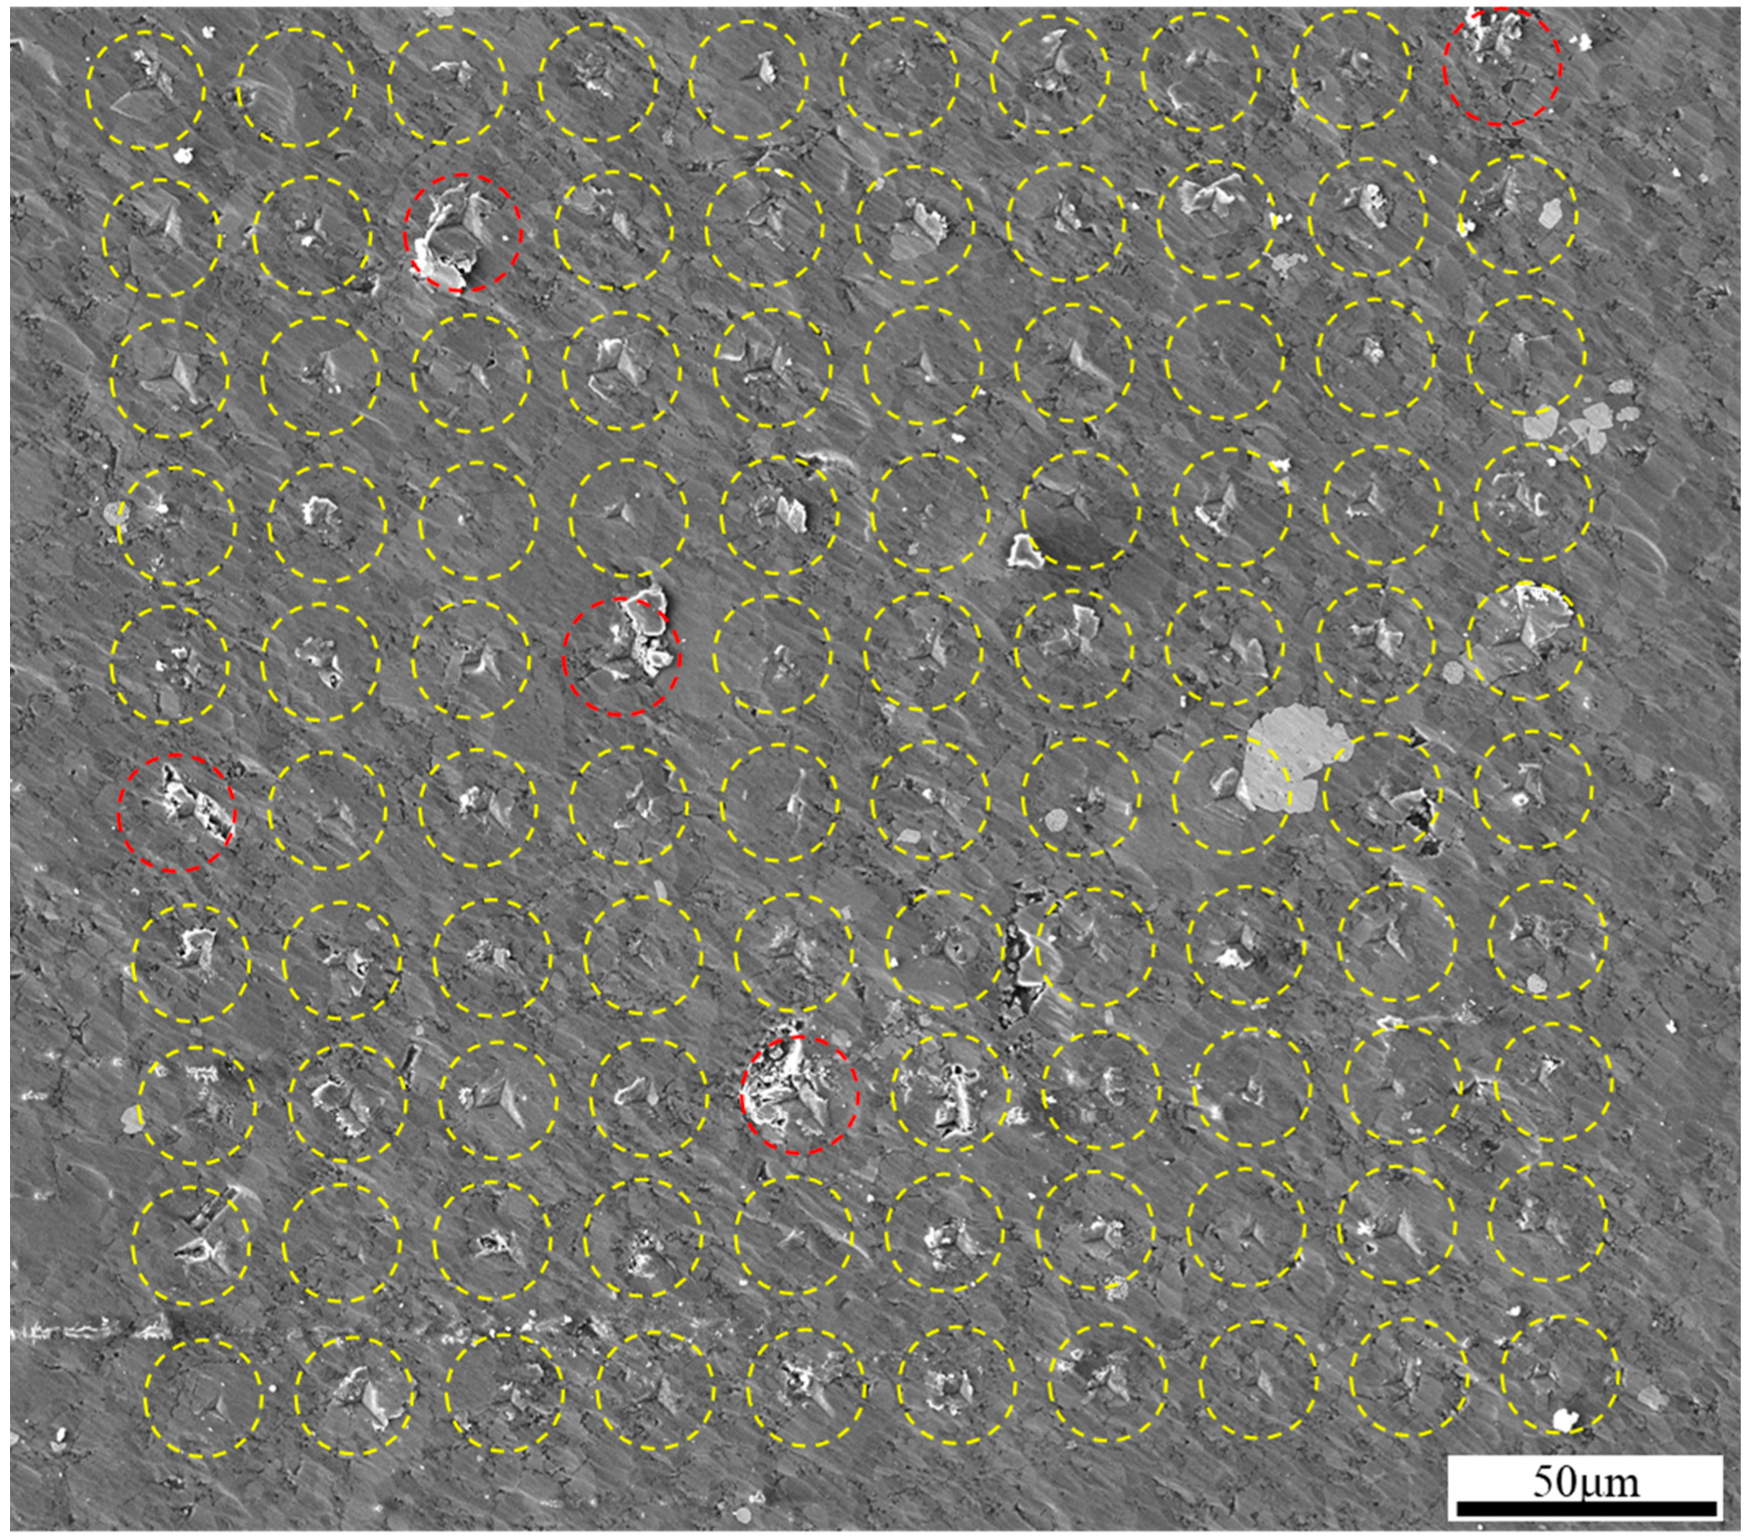
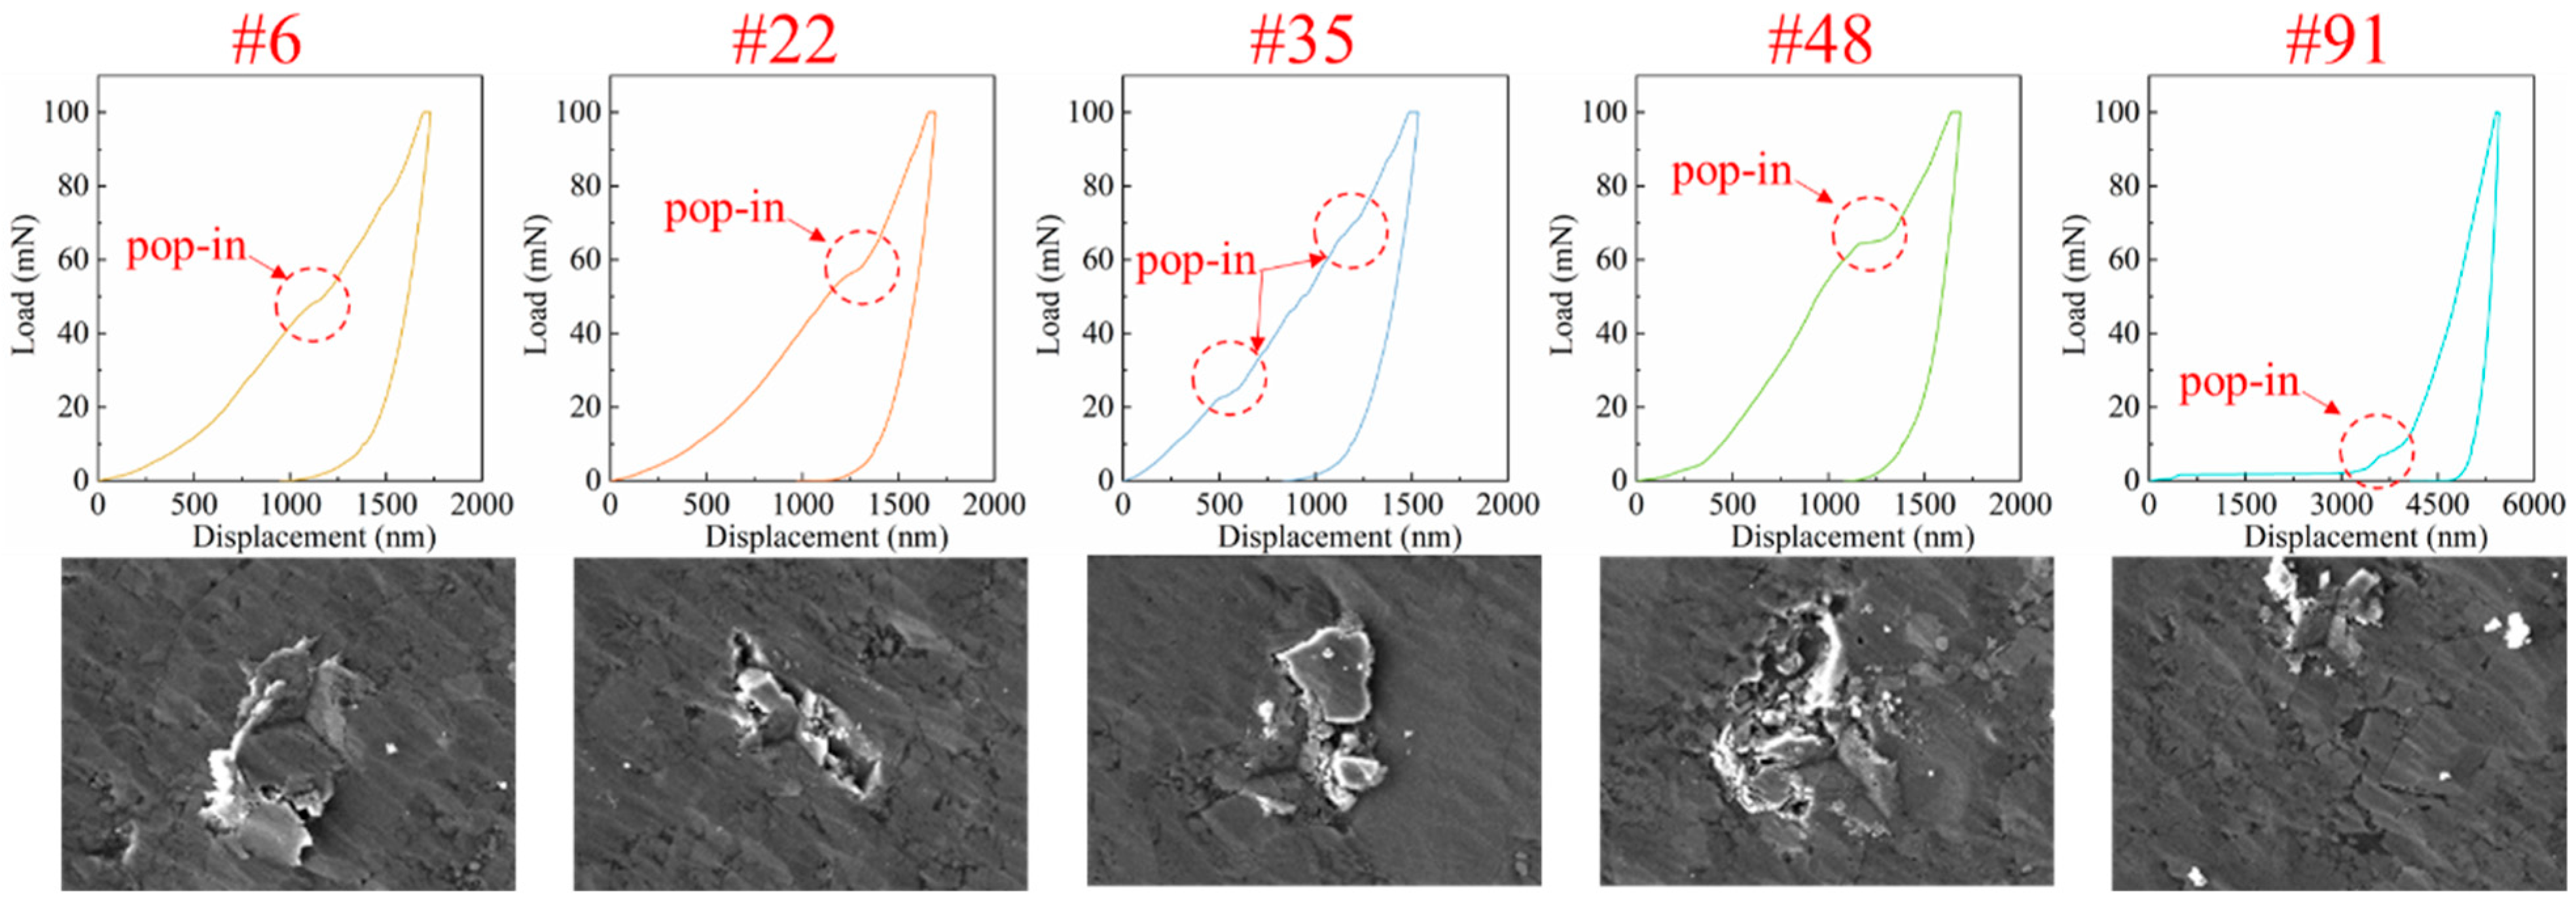
3.2. Micromorphology of the Indentation Area
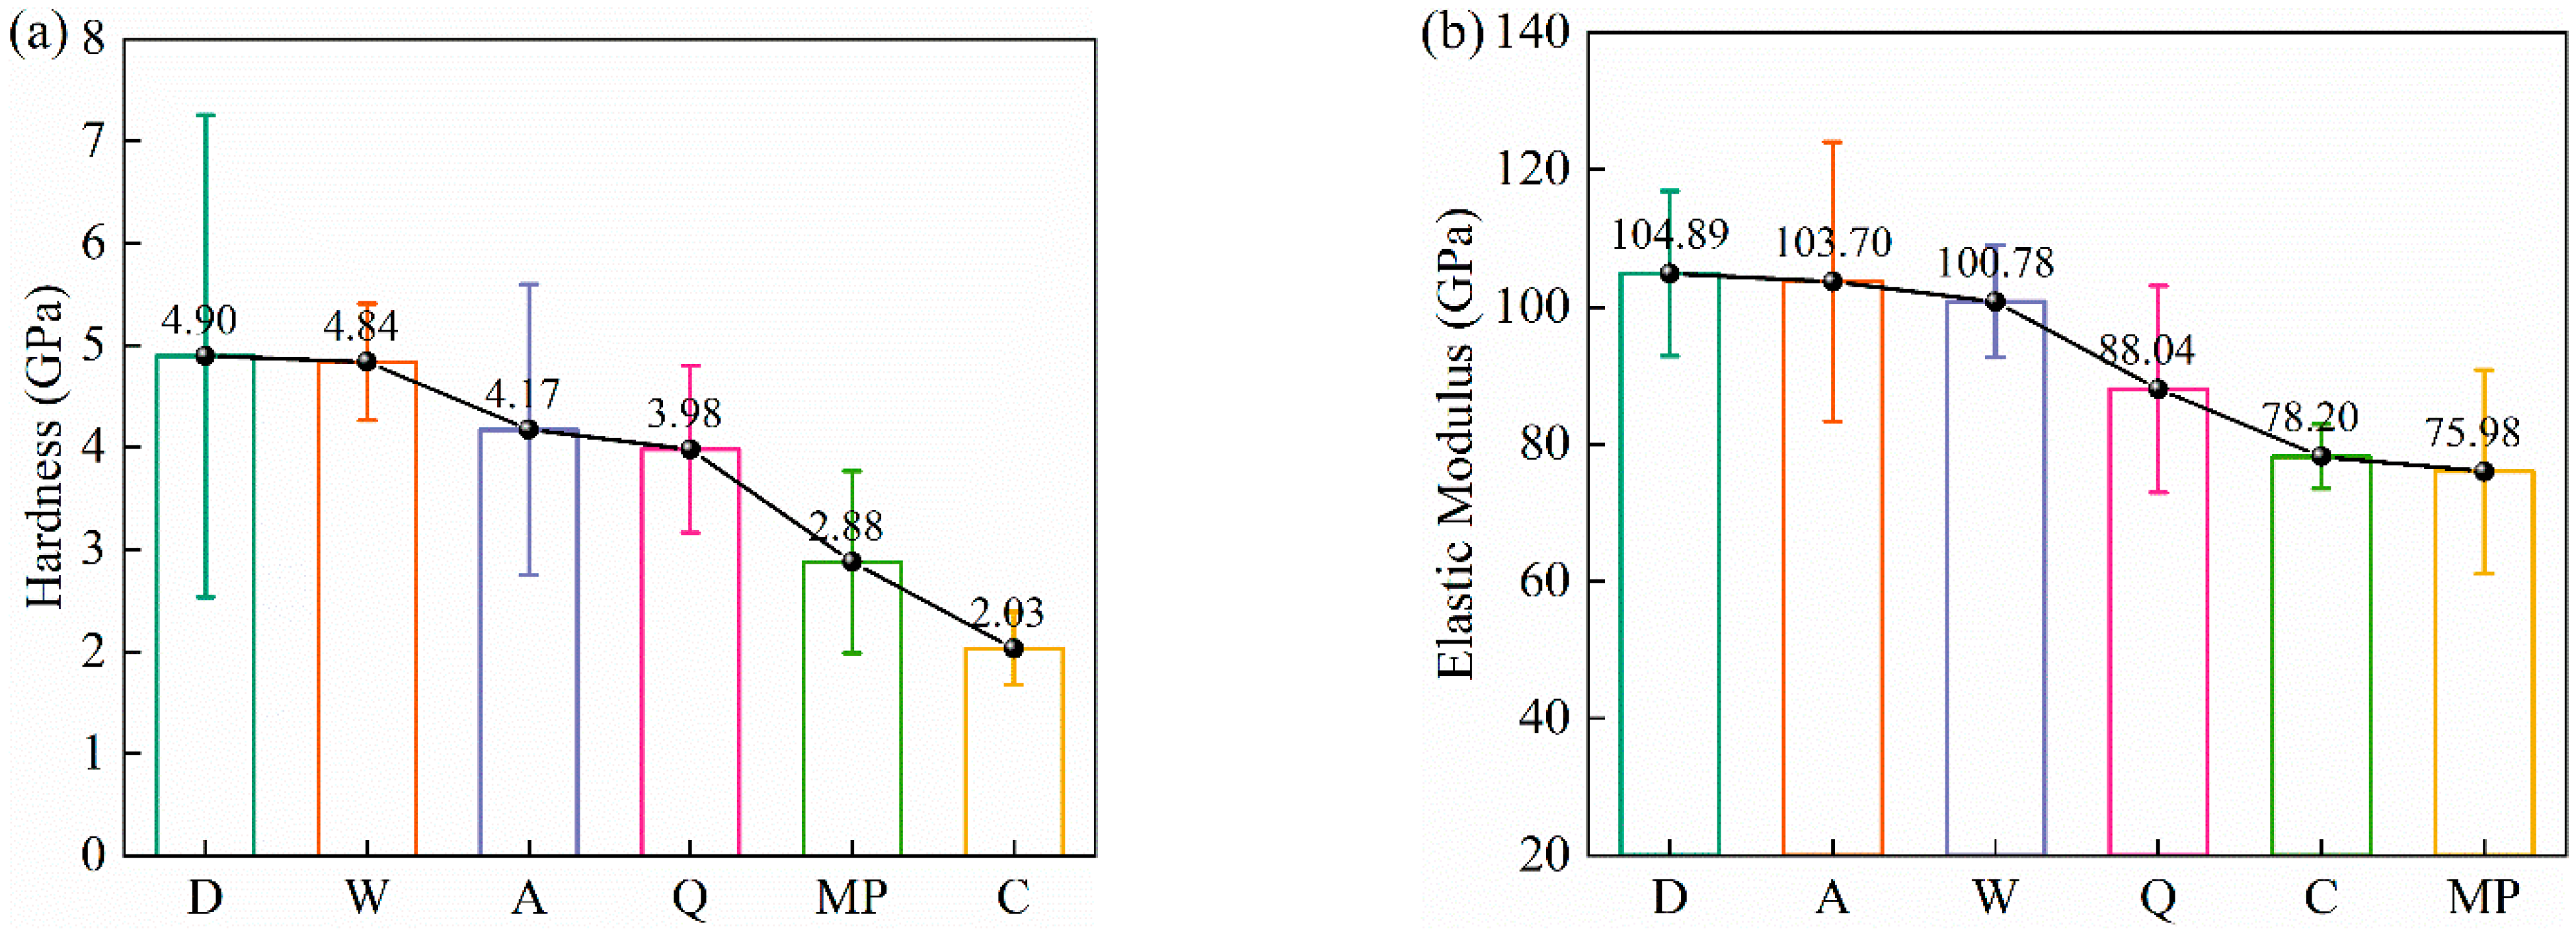
3.3. The Mechanical Properties of Shale Constituent Mineral
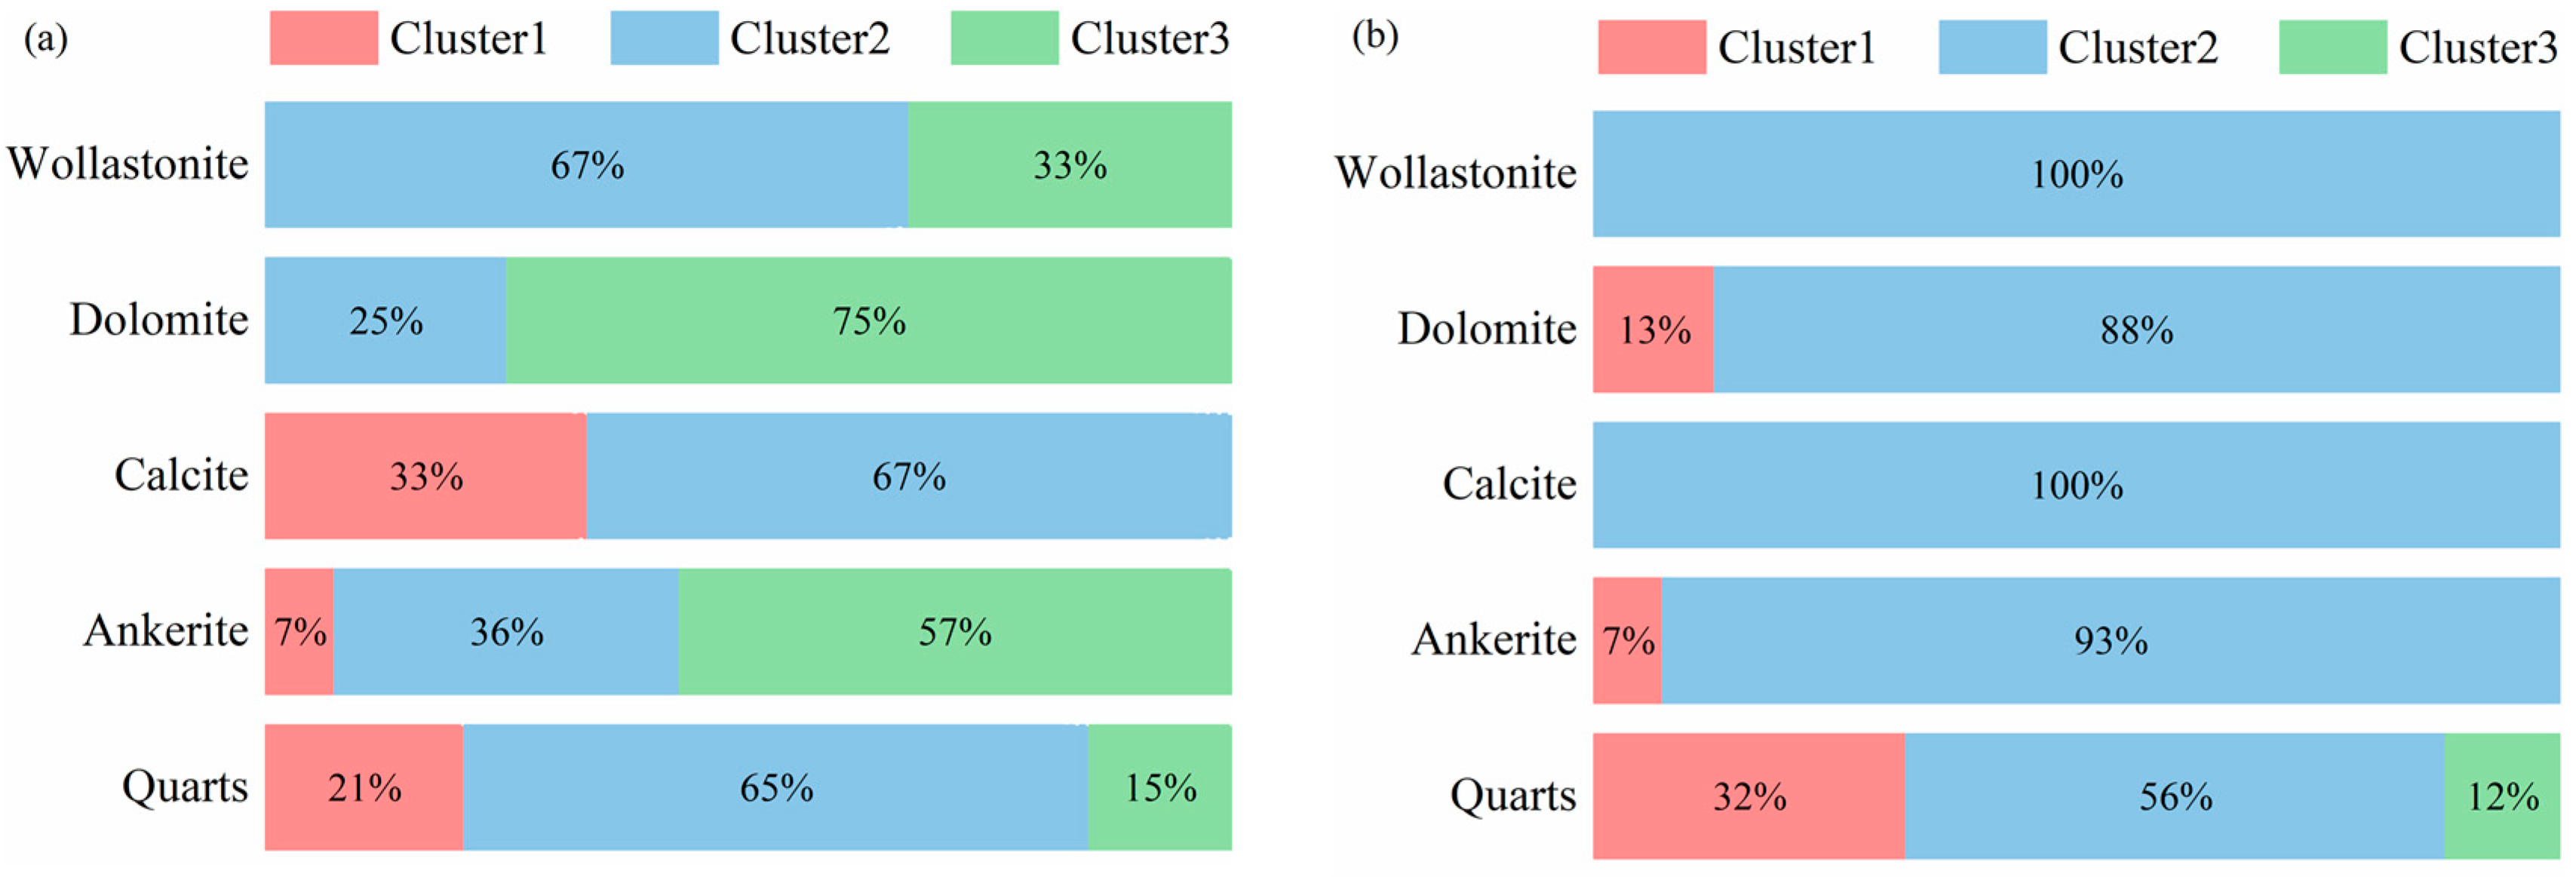
3.4. Clustering Analysis of the Nanoindentation Data Set
3.5. Influence of Micromechanical Properties on Macroscopic Failure Form of Shale
4. Conclusions
- The mechanical properties of 5 independent mineral phases (quartz, ankerite, calcite, dolomite, wollastonite) and a mixed phase (indentation located at the junction of mineral grains) were detected. The order of the hardness of these five mineral phases is dolomite (4.90 ± 2.33 GPa) > wollastonite (4.84 ± 0.54 GPa) > ankerite (4.17 ± 1.37 GPa) > quartz (3.98 ± 0.67 GPa) > calcite (2.03 ± 0.29 GPa), and the order of the elastic modulus is dolomite (104.89 ± 11.25 GPa) > ankerite (103.70 ± 19.62 GPa) > wollastonite (100.78 ± 6.66 GPa) > quartz (88.04 ± 14.58 GPa) > calcite (78.20 ± 3.85 GPa).
- The pop-in phenomenon is caused by local fracture damage on the sample surface, and the mechanical properties of the location where the pop-in occurs are relatively weak.
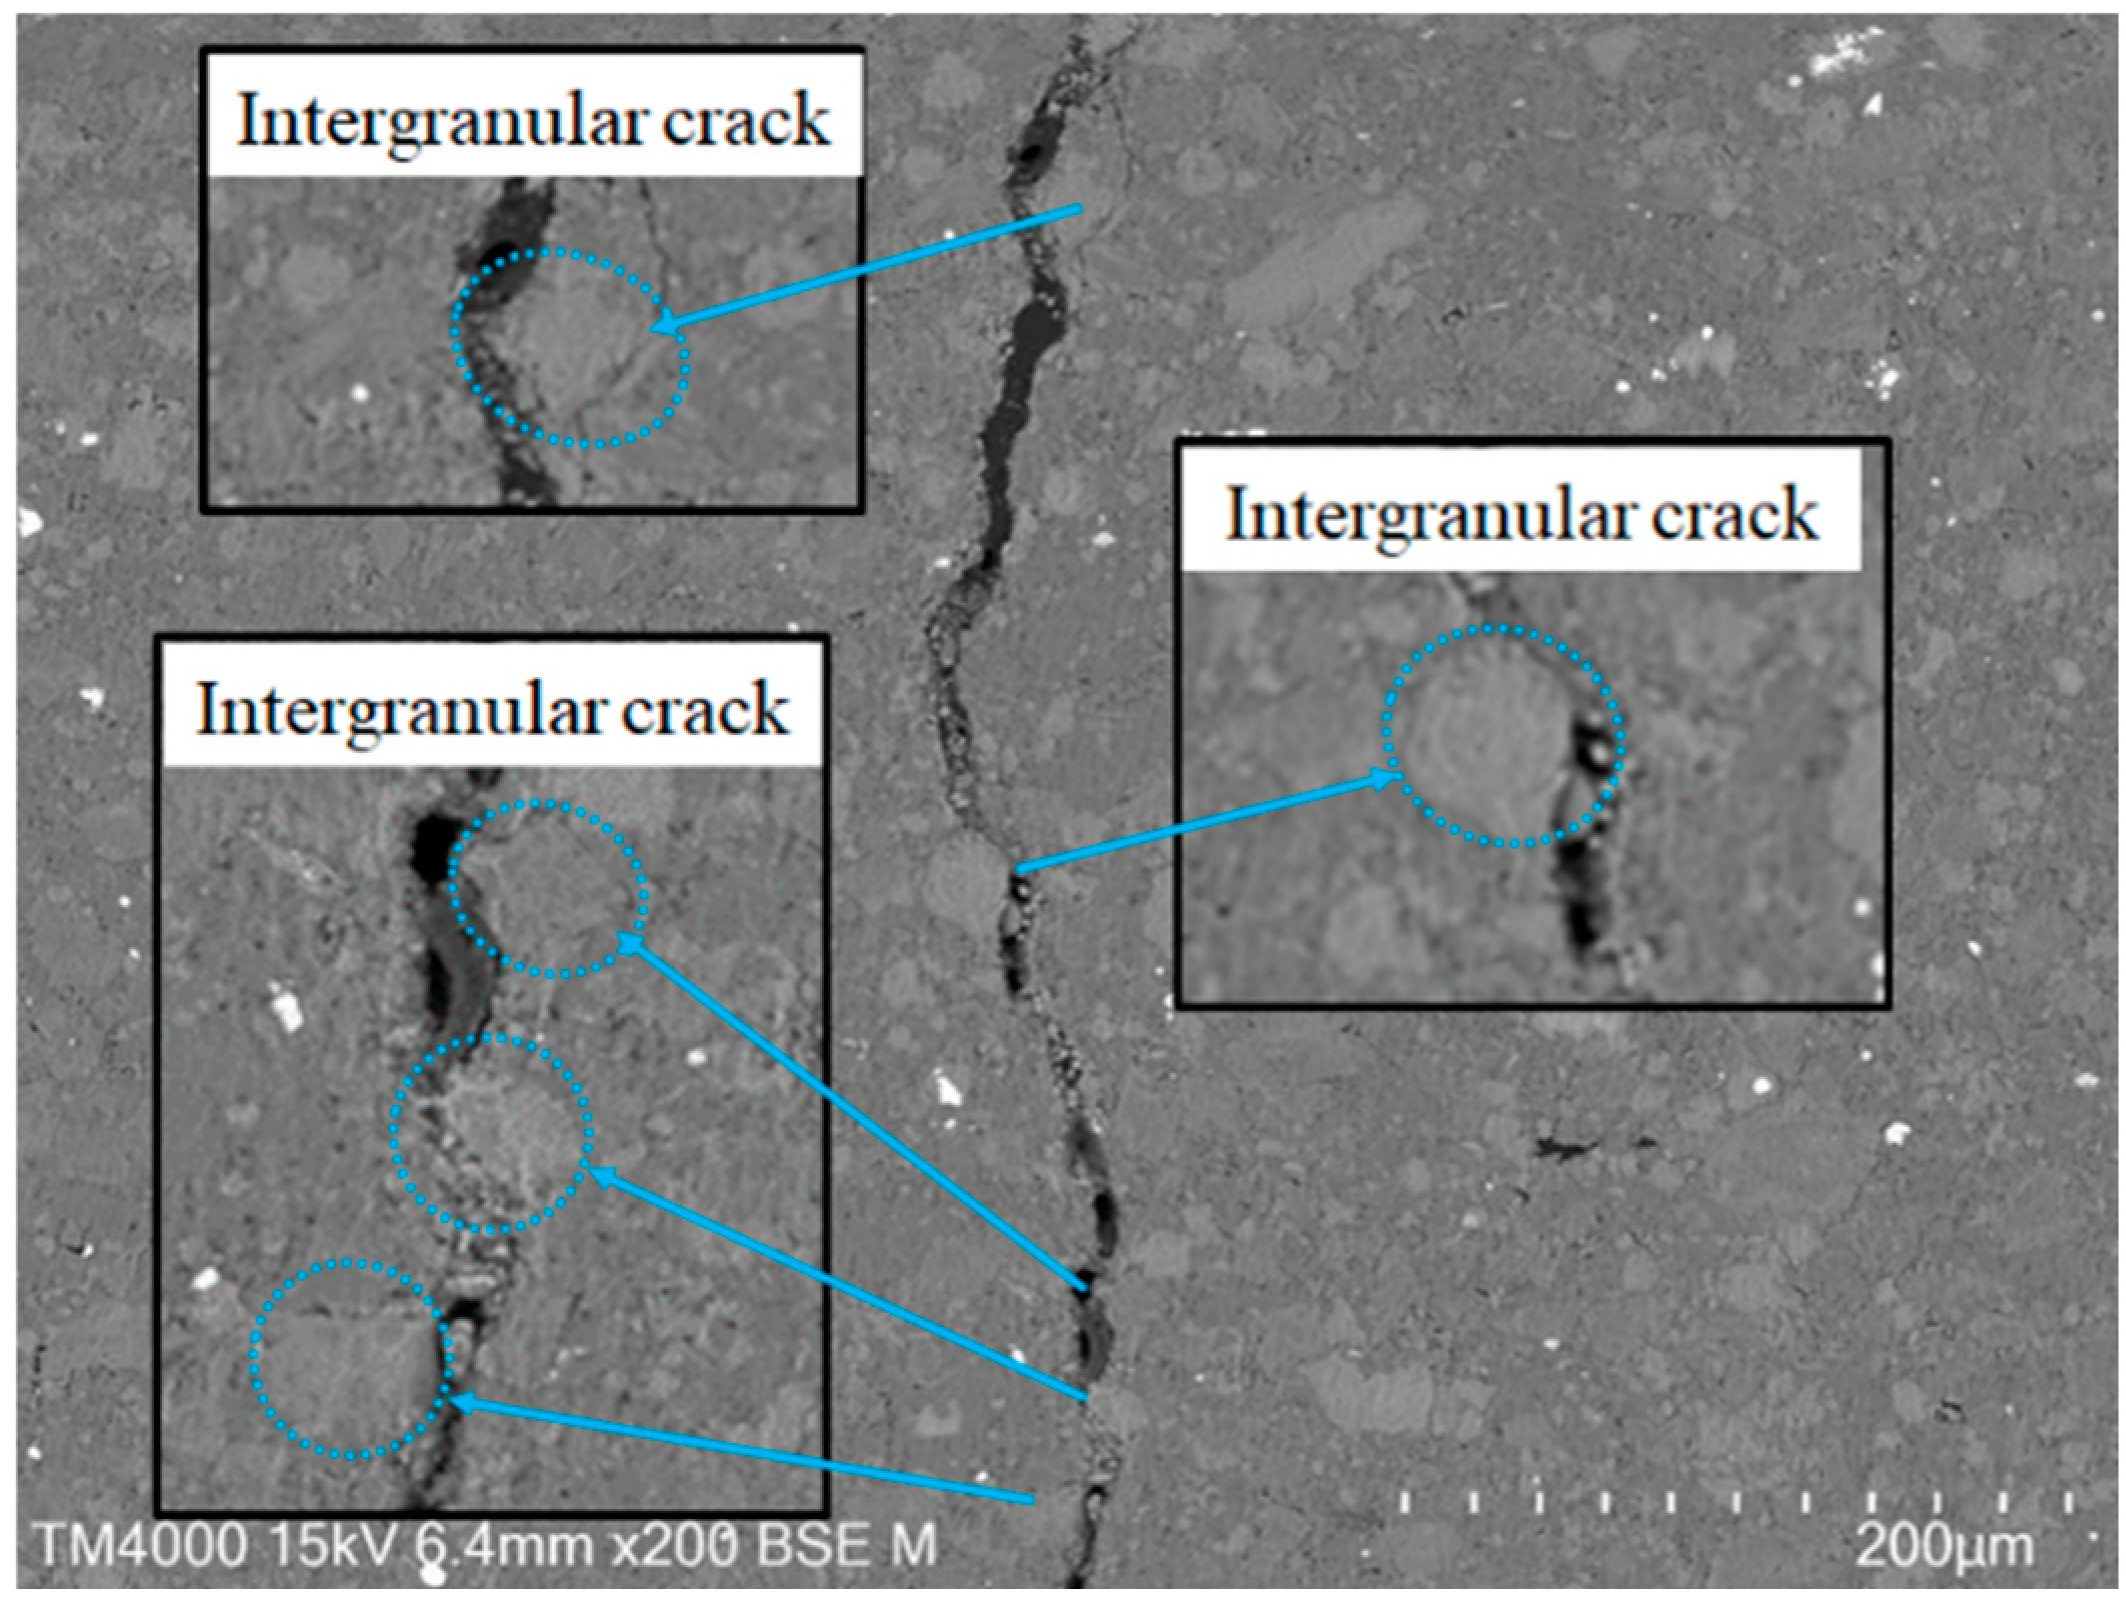
- The mechanical properties of the shale mineral grain junctions are weaker than those inside the grains, and the mineral grain junctions are more prone to fracture damage. When shale is subjected to external loading, microcracks always tend to sprout at the junction of mineral grains and propagate along the boundary of mineral grains to become macroscopic cracks, i.e., so-called intergranular failure.
Author Contributions
Funding
Data Availability Statement
Acknowledgments
Conflicts of Interest
References
- Kasyap, S.S.; Senetakis, K. Characterization of two types of shale rocks from Guizhou China through micro-indentation, statistical and machine-learning tools. J. Pet. Sci. Eng. 2022, 208, 109304. [Google Scholar] [CrossRef]
- Soeder, D.J. The successful development of gas and oil resources from shales in North America. J. Pet. Sci. Eng. 2018, 163, 399–420. [Google Scholar] [CrossRef]
- Castro-Alvarez, F.; Marsters, P.; Ponce de León Barido, D.; Kammen, D.M. Sustainability lessons from shale development in the United States for Mexico and other emerging unconventional oil and gas developers. Renew. Sustain. Energy Rev. 2018, 82, 1320–1332. [Google Scholar] [CrossRef]
- Prpich, G.; Coulon, F.; Anthony, E.J. Review of the scientific evidence to support environmental risk assessment of shale gas development in the UK. Sci. Total Environ. 2016, 563–564, 731–740. [Google Scholar] [CrossRef]
- McMahon, T.P.; Larson, T.E.; Zhang, T.; Shuster, M. Geologic characteristics, exploration and production progress of shale oil and gas in the United States: An overview. Pet. Explor. Dev. 2024, 51, 925–948. [Google Scholar] [CrossRef]
- Wang, L.; Guo, Y.; Zhou, J.; Yang, H.; Yang, C.; Xiao, J. Rock mechanical characteristics of deep marine shale in southern China, a case study in Dingshan block. J. Pet. Sci. Eng. 2021, 204, 108699. [Google Scholar] [CrossRef]
- Katende, A.; O’Connell, L.; Rich, A.; Rutqvist, J.; Radonjic, M. A comprehensive review of proppant embedment in shale reservoirs: Experimentation, modeling and future prospects. J. Nat. Gas Sci. Eng. 2021, 95, 104143. [Google Scholar] [CrossRef]
- Zhang, X.; Lu, Y.; Tang, J.; Zhou, Z.; Liao, Y. Experimental study on fracture initiation and propagation in shale using supercritical carbon dioxide fracturing. Fuel 2017, 190, 370–378. [Google Scholar] [CrossRef]
- Bryson, L.S.; Mahmoodabadi, M.; Gomez-Gutierrez, I.C. Mechanical Behavior of Weathered Compacted Shales. Geotechnol. Geol. Eng. 2024, 42, 1993–2009. [Google Scholar] [CrossRef]
- Jin, Z.; Li, W.; Jin, C.; Hambleton, J.; Cusatis, G. Anisotropic elastic, strength, and fracture properties of Marcellus shale. Int. J. Rock Mech. Min. Sci. 2018, 109, 124–137. [Google Scholar] [CrossRef]
- Fjær, E.; Nes, O.-M. The Impact of Heterogeneity on the Anisotropic Strength of an Outcrop Shale. Rock Mech. Rock Eng. 2014, 47, 1603–1611. [Google Scholar] [CrossRef]
- Li, H.; Lai, B.; Liu, H.-H.; Zhang, J.; Georgi, D. Experimental Investigation on Brazilian Tensile Strength of Organic-Rich Gas Shale. SPE J. 2016, 22, 148–161. [Google Scholar] [CrossRef]
- Lu, Y.; Xu, Z.; Li, H.; Tang, J.; Chen, X. The influences of super-critical CO2 saturation on tensile characteristics and failure modes of shales. Energy 2021, 221, 119824. [Google Scholar] [CrossRef]
- Xu, Z.; Lu, Y.; Tang, J.; Xiao, J.; Li, H.; Jia, Y.; Chen, X.; Cheng, Q. The mode I fracture toughness alternation and crack propagation behavior evolution due to long-term Sc-CO2 saturation. Eng. Fract. Mech. 2022, 263, 108259. [Google Scholar] [CrossRef]
- Liu, Y.; Liu, A.; Liu, S.; Kang, Y. Nano-scale mechanical properties of constituent minerals in shales investigated by combined nanoindentation statistical analyses and SEM-EDS-XRD techniques. Int. J. Rock Mech. Min. Sci. 2022, 159, 105187. [Google Scholar] [CrossRef]
- Wu, Y.; Li, Y.; Luo, S.; Lu, M.; Zhou, N.; Wang, D.; Zhang, G. Multiscale elastic anisotropy of a shale characterized by cross-scale big data nanoindentation. Int. J. Rock Mech. Min. Sci. 2020, 134, 104458. [Google Scholar] [CrossRef]
- Ma, Z.; Pathegama Gamage, R.; Zhang, C. Application of nanoindentation technology in rocks: A review. Geomech. Geophys. Geo-Energy Geo-Resour. 2020, 6, 60. [Google Scholar] [CrossRef]
- Oliver, W.C.; Pharr, G.M. An improved technique for determining hardness and elastic modulus using load and displacement sensing indentation experiments. J. Mater. Res. 1992, 7, 1564–1583. [Google Scholar] [CrossRef]
- Cao, Z.; Zhang, X. Nanoindentation creep of plasma-enhanced chemical vapor deposited silicon oxide thin films. Scr. Mater. 2007, 56, 249–252. [Google Scholar] [CrossRef]
- Wang, Y.; Zhang, J.; Wu, K.; Liu, G.; Kiener, D.; Sun, J. Nanoindentation creep behavior of Cu–Zr metallic glass films. Mater. Res. Lett. 2018, 6, 22–28. [Google Scholar] [CrossRef]
- Liu, Y.; Liu, Q.; Feng, G.; Lyu, Q.; Liu, S.; Wang, Y.; Tang, X. Upscaling mechanical properties of shale obtained by nanoindentation to macroscale using accurate grain-based modeling (AGBM). Energy 2025, 314, 134126. [Google Scholar] [CrossRef]
- Liu, Y.; Liu, Q.; Wu, Z.; Liu, S.; Kang, Y.; Tang, X. Cross-scale mechanical softening of Marcellus shale induced by CO2-water–rock interactions using nanoindentation and accurate grain-based modeling. Undergr. Space 2024, 19, 26–46. [Google Scholar] [CrossRef]
- Liu, Y.; Zhang, G.; Qiao, J.; Tang, X. Micromechanical testing and property upscaling of planetary rocks: A critical review. Int. J. Min. Sci. Technol. 2024, 34, 1217–1241. [Google Scholar] [CrossRef]
- Rahman, M.J.; Lebedev, M.; Mondol, N.H. Nanoscale mechanical properties of organic-rich Draupne caprock shale using nano-indentation method, offshore Norway. Int. J. Greenh. Gas Control 2024, 132, 104073. [Google Scholar] [CrossRef]
- Liu, M.; Xu, Z. Micromechanical characterization of microwave dielectric ceramic BaO–Sm2O3–5TiO2 by indentation and scratch methods. J. Adv. Ceram. 2023, 12, 1136–1165. [Google Scholar]
- Liu, M.; Xu, Z.; Fu, R. Micromechanical and microstructure characterization of BaO-Sm2O3–5TiO2 ceramic with addition of Al2O3. Ceram. Int. 2022, 48, 992–1005. [Google Scholar] [CrossRef]
- Kang, R.; Kong, X.; Liu, M.; Zhang, M.; Qiao, W. Influence of graphene oxide on mechanical behavior of polypropylene fibers reinforced cement-based composites from a macro-to-micro perspective. Constr. Build. Mater. 2025, 472, 140902. [Google Scholar] [CrossRef]
- Ulm, F.-J.; Abousleiman, Y. The nanogranular nature of shale. Acta Geotechnol. 2006, 1, 77–88. [Google Scholar] [CrossRef]
- Liu, K.; Ostadhassan, M.; Bubach, B. Applications of nano-indentation methods to estimate nanoscale mechanical properties of shale reservoir rocks. J. Nat. Gas Sci. Eng. 2016, 35, 1310–1319. [Google Scholar] [CrossRef]
- Lu, Y.; Cheng, Q.; Tang, J.; Liu, W.; Li, H.; Liu, J.; Xu, Z.; Tian, R.; Sun, X. Differences in micromechanical properties of shales from different depositional environment: A case study of Longmaxi marine shale and Yanchang continental shale using nanoindentation. J. Nat. Gas Sci. Eng. 2022, 107, 104727. [Google Scholar] [CrossRef]
- Liu, A.; Liu, S.; Liu, Y.; Liu, B.; Liu, T. Characterizing mechanical heterogeneity of coal at nano-to-micro scale using combined nanoindentation and FESEM-EDS. Int. J. Coal Geol. 2022, 261, 104081. [Google Scholar] [CrossRef]
- Zhang, Y.; Lebedev, M.; Al-Yaseri, A.; Yu, H.; Xu, X.; Sarmadivaleh, M.; Barifcani, A.; Iglauer, S. Nanoscale rock mechanical property changes in heterogeneous coal after water adsorption. Fuel 2018, 218, 23–32. [Google Scholar] [CrossRef]
- Sun, C.; Li, G.; Elgharib Gomah, M.; Xu, J.; Rong, H. Meso-scale mechanical properties of mudstone investigated by nanoindentation. Eng. Fract. Mech. 2020, 238, 107245. [Google Scholar] [CrossRef]
- Li, Y.; Luo, S.; Lu, M.; Wu, Y.; Zhou, N.; Wang, D.; Lu, Y.; Zhang, G. Cross-scale characterization of sandstones via statistical nanoindentation: Evaluation of data analytics and upscaling models. Int. J. Rock Mech. Min. Sci. 2021, 142, 104738. [Google Scholar] [CrossRef]
- Ma, Z.; Zhang, C.; Pathegama Gamage, R.; Zhang, G. Uncovering the creep deformation mechanism of rock-forming minerals using nanoindentation. Int. J. Min. Sci. Technol. 2022, 32, 283–294. [Google Scholar] [CrossRef]
- Liu, K.; Ostadhassan, M.; Bubach, B.; Ling, K.; Tokhmechi, B.; Robert, D. Statistical grid nanoindentation analysis to estimate macro-mechanical properties of the Bakken Shale. J. Nat. Gas Sci. Eng. 2018, 53, 181–190. [Google Scholar] [CrossRef]
- Li, C.; Ostadhassan, M.; Abarghani, A.; Fogden, A.; Kong, L. Multi-scale evaluation of mechanical properties of the Bakken shale. J. Mater. Sci. 2018, 54, 2133–2151. [Google Scholar] [CrossRef]
- Vranjes-Wessely, S.; Misch, D.; Kiener, D.; Cordill, M.; Frese, N.; Beyer, A.; Horsfield, B.; Wang, C.; Sachsenhofer, R. High-speed nanoindentation mapping of organic matter-rich rocks: A critical evaluation by correlative imaging and machine learning data analysis. Int. J. Coal Geol. 2021, 247, 103847. [Google Scholar] [CrossRef]
- Li, C.; Wang, D.; Kong, L. Mechanical response of the Middle Bakken rocks under triaxial compressive test and nanoindentation. Int. J. Rock Mech. Min. Sci. 2021, 139, 104660. [Google Scholar] [CrossRef]
- Yang, C.; Xiong, Y.; Wang, J.; Li, Y.; Jiang, W. Mechanical characterization of shale matrix minerals using phase-positioned nanoindentation and nano-dynamic mechanical analysis. Int. J. Coal Geol. 2020, 229, 103571. [Google Scholar] [CrossRef]
- Shi, X.; Jiang, S.; Wang, Z.; Bai, B.; Xiao, D.; Tang, M. Application of nanoindentation technology for characterizing the mechanical properties of shale before and after supercritical CO2 fluid treatment. J. CO2 Util. 2020, 37, 158–172. [Google Scholar] [CrossRef]
- Du, J.; Whittle, A.J.; Hu, L.; Divoux, T.; Meegoda, J.N. Characterization of meso-scale mechanical properties of Longmaxi shale using grid microindentation experiments. J. Rock Mech. Geotechnol. Eng. 2021, 13, 555–567. [Google Scholar] [CrossRef]
- Hrstka, T.; Gottlieb, P.; Skála, R.; Breiter, K.; Motl, D. Automated mineralogy and petrology—Applications of TESCAN Integrated Mineral Analyzer (TIMA). J. Geosci. 2018, 63, 47–63. [Google Scholar] [CrossRef]
- Li, Y.; Tang, G.-Q.; Liu, Y.; He, S.; Chen, B.; Li, Q.-L.; Li, X.-H. Revisiting apatite SIMS oxygen isotope analysis and Qinghu-AP reference material. Chem. Geol. 2021, 582, 120445. [Google Scholar] [CrossRef]
- Wang, X.-J.; Chen, L.-H.; Hanyu, T.; Zhong, Y.; Shi, J.-H.; Liu, X.-W.; Kawabata, H.; Zeng, G.; Xie, L.-W. Magnesium isotopic fractionation during basalt differentiation as recorded by evolved magmas. Earth Planet. Sci. Lett. 2021, 565, 116954. [Google Scholar] [CrossRef]
- Du, D.-H.; Wang, X.-L.; Wang, S.; Miller, C.F.; Xu, X.; Chen, X.; Zhang, F.-F. Deciphering Cryptic Multi-Stage Crystal-Melt Separation during Construction of the Tonglu Volcanic–Plutonic Complex, SE China. J. Petrol. 2022, 63, egab098. [Google Scholar] [CrossRef]
- Pharr, G.M.; Oliver, W.C.; Brotzen, F.R. On the generality of the relationship among contact stiffness, contact area, and elastic modulus during indentation. J. Mater. Res. 2011, 7, 61. [Google Scholar] [CrossRef]
- Klaver, J.; Desbois, G.; Urai, J.L.; Littke, R. BIB-SEM study of the pore space morphology in early mature Posidonia Shale from the Hils area, Germany. Int. J. Coal Geol. 2012, 103, 12–25. [Google Scholar] [CrossRef]
- Shi, X.; He, Z.; Long, S.; Peng, Y.; Li, D.; Jiang, S. Loading rate effect on the mechanical behavior of brittle longmaxi shale in nanoindentation. Int. J. Hydrogen Energy 2019, 44, 6481–6490. [Google Scholar] [CrossRef]
- ISO 14577-1:2015; Metallic Materials—Instrumented Indentation Test for Hardness and Materials Parameters—Part 1: Test Method. ISO: Geneva, Switzerland, 2015.
- Liu, K.; Ostadhassan, M. Microstructural and geomechanical analysis of Bakken shale at nanoscale. J. Pet. Sci. Eng. 2017, 153, 133–144. [Google Scholar] [CrossRef]
- Schuh, C.A.; Nieh, T.G.; Kawamura, Y. Rate Dependence of Serrated Flow During Nanoindentation of a Bulk Metallic Glass. J. Mater. Res. 2002, 17, 16. [Google Scholar] [CrossRef]
- Mavko, G.; Dvorkin, J.; Mukerji, T. The Rock Physics Handbook: Tools for Seismic Analysis of Porous Media, 2nd ed.; Cambridge University Press: Cambridge, UK, 2009. [Google Scholar]
- Lu, Y.; Li, Y.; Wu, Y.; Luo, S.; Jin, Y.; Zhang, G. Characterization of Shale Softening by Large Volume-Based Nanoindentation. Rock Mech. Rock Eng. 2020, 53, 1393–1409. [Google Scholar] [CrossRef]
- Kumar, V.; Sondergeld, C.H.; Rai, C.S. Nano to Macro Mechanical Characterization of Shale. In Proceedings of the SPE Annual Technical Conference and Exhibition, San Antonio, TX, USA, 8–10 October 2012. SPE-159804-MS. [Google Scholar]
- Zhao, J.; Zhang, D.; Wu, T.; Tang, H.; Xuan, Q.; Jiang, Z.; Dai, C. Multiscale Approach for Mechanical Characterization of Organic-Rich Shale and Its Application. Int. J. Geomech. 2019, 19, 04018180. [Google Scholar] [CrossRef]
- Zhu, W.; Hughes, J.J.; Bicanic, N.; Pearce, C.J. Nanoindentation mapping of mechanical properties of cement paste and natural rocks. Mater. Charact. 2007, 58, 1189–1198. [Google Scholar] [CrossRef]
- Chen, C.-C.; Lin, C.-C.; Liu, L.-G.; Sinogeikin, S.V.; Bass, J.D. Elasticity of single-crystal calcite and rhodochrosite by Brillouin spectroscopy. Am. Mineral. 2001, 86, 1525–1529. [Google Scholar] [CrossRef]
- Xu, Z.; Yuktanan, N.; Liu, M.; Gu, T.; Shi, M. Characterization of microstructures and micromechanical properties of Ti6Al4V powders. Powder Technol. 2024, 448, 120352. [Google Scholar] [CrossRef]
- Hartigan, J.A.; Wong, M.A. Algorithm AS136: A k-means clustering algorithm. J. R. Stat. Soc. 1979, 28, 100–108. [Google Scholar]


| Content (%) | |
|---|---|
| Quartz | 58.94 |
| Ankerite | 15.45 |
| Calcite | 9.33 |
| Dolomite | 7.46 |
| Clay | 3.14 |
| Wollastonite | 2.45 |
| Anorthite | 1.91 |
| Others | 1.32 |
| Reference | Elastic Modulus (GPa) | Method | ||
|---|---|---|---|---|
| Quartz | Calcite | Dolomite | ||
| This study | 88.04 | 78.2 | 104.89 | Nanoindentation |
| [53] | 77–96 | 74–83 | 116 | Acoustic Methods |
| [40] | 94–143 | 67–84 | 97–155 | Nanoindentation |
| [54] | 92.2 | 53 ± 6 | - | Nanoindentation |
| [55] | 98–100 | 78–88 | - | Nanoindentation |
| [56] | 87.2 | 55.7 | - | Nanoindentation |
| [57] | 101 | - | - | Nanoindentation |
| [15] | 77.4 | - | - | Nanoindentation |
| [58] | - | 76.1 | - | Acoustic Methods |
| [58] | - | 86 | - | Brillouin spectroscopy |
| Parameter | Mineral | |||||
|---|---|---|---|---|---|---|
| Quartz | Calcite | Dolomite | Wollastonite | Ankerite | MP | |
| H/E | 0.0452 | 0.0260 | 0.0467 | 0.0480 | 0.0402 | 0.0379 |
| (H/E)2 | 0.0020 | 0.0007 | 0.0022 | 0.0023 | 0.0016 | 0.0014 |
| H2/2E (GPa) | 0.0900 | 0.0263 | 0.1145 | 0.1162 | 0.0838 | 0.0546 |
| H3/E2 (GPa) | 0.0081 | 0.0014 | 0.0107 | 0.0112 | 0.0067 | 0.0041 |
Disclaimer/Publisher’s Note: The statements, opinions and data contained in all publications are solely those of the individual author(s) and contributor(s) and not of MDPI and/or the editor(s). MDPI and/or the editor(s) disclaim responsibility for any injury to people or property resulting from any ideas, methods, instructions or products referred to in the content. |
© 2025 by the authors. Licensee MDPI, Basel, Switzerland. This article is an open access article distributed under the terms and conditions of the Creative Commons Attribution (CC BY) license (https://creativecommons.org/licenses/by/4.0/).
Share and Cite
Xiao, Y.; Cheng, Q.; Tang, J.; Cai, S. Determining the Mechanical Properties of Shale Constituent Minerals Using Nanoindentation and a TESCAN Integrated Mineral Analyzer (TIMA). Minerals 2025, 15, 412. https://doi.org/10.3390/min15040412
Xiao Y, Cheng Q, Tang J, Cai S. Determining the Mechanical Properties of Shale Constituent Minerals Using Nanoindentation and a TESCAN Integrated Mineral Analyzer (TIMA). Minerals. 2025; 15(4):412. https://doi.org/10.3390/min15040412
Chicago/Turabian StyleXiao, Yongjun, Qi Cheng, Jiren Tang, and Shengyao Cai. 2025. "Determining the Mechanical Properties of Shale Constituent Minerals Using Nanoindentation and a TESCAN Integrated Mineral Analyzer (TIMA)" Minerals 15, no. 4: 412. https://doi.org/10.3390/min15040412
APA StyleXiao, Y., Cheng, Q., Tang, J., & Cai, S. (2025). Determining the Mechanical Properties of Shale Constituent Minerals Using Nanoindentation and a TESCAN Integrated Mineral Analyzer (TIMA). Minerals, 15(4), 412. https://doi.org/10.3390/min15040412