Article

Cyclic Changes in Sea Level and Sequence Stratigraphy During the Latest Pliensbachian–Early Toarcian (Early Jurassic) in the Southern Qiangtang Basin (Eastern Tethys): Geochemical and Mineralogical Perspectives

1
Chinese Academy of Geological Sciences, Beijing 100044, China
2
Geology Department, Faculty of Science, Minia University, Minia 61519, Egypt
3
School of Geoscience and Technology, Southwest Petroleum University, Chengdu 610500, China
4
Department of Geology, Faculty of Earth Sciences, Geography and Astronomy, University of Vienna, 1090 Vienna, Austria
*
Authors to whom correspondence should be addressed.
Minerals 2025, 15(5), 440; https://doi.org/10.3390/min15050440
Submission received: 24 March 2025 / Revised: 18 April 2025 / Accepted: 23 April 2025 / Published: 24 April 2025
(This article belongs to the Section Mineral Geochemistry and Geochronology)

Abstract

:
The Pliensbachian–Toarcian boundary and early Toarcian events indicate significant environmental and oceanographic instabilities attributed to the emplacement of the Karoo–Ferrar large igneous province and subsequent greenhouse gas emissions. These geologic processes influenced carbon cycle perturbations and global warming, consistent with phases of a sea level rise. This study presents a high-resolution dataset of total organic carbon (TOC) and bulk rock geochemistry and mineralogy from a complete upper Pliensbachian–Toarcian interval of the Quse Formation at the Qixiangcuo section in the Southern Qiangtang Basin. The Qixiangcuo section consists of carbonate and siliciclastic organic carbon-poor sediments deposited in a shallow-shelf setting in the eastern Tethys Ocean. Chemostratigraphic data, including Ti, Zr, U, Ca, Mn, and Sr and their ratios normalized to Al, record characteristic changes linked to sea level evolution and resulting depositional sequences. Trends in these geochemical data allow for the subdivision of the Quse Formation into nine complete third-order transgressive–regressive sequences, referred to as Pliensbachian sequences PSQ1 and PSQ2, Toarcian sequences TSQ1 to TSQ7, and one incomplete sequence. Elemental proxies indicative of terrigenous detrital input and sediment grain size along with a mineralogical composition of quartz, plagioclase, and clay minerals exhibit similar trends. Increased values of these proxies suggest a sea level fall and the deposition of regressive systems tract (RST) sediments, with peak values indicating a maximum regressive surface (MRS), and vice versa for transgressive systems tract (TST) sediments and the maximum flooding surface (MFS). On the contrary, rising trends in calcite content and carbonate-bound elements indicate phases of a relative sea level transgression, reaching maximum values at the MFS, while declining trends mark a sea level regression. The Sr/Ca ratio exhibited inverse patterns to the carbonate proxies, in part, with rising values indicating a sea level fall and vice versa.

1. Introduction

The early Jurassic (late Pliensbachian–Toarcian) was marked by environmental and paleoceanographic perturbations [1]. These changes were driven by the emplacement of large igneous provinces, such as the Karoo–Ferrar, associated with the breakup of Gondwana and simultaneous greenhouse gas emissions [1,2,3]. These geologic processes had profound impacts on both terrestrial and marine ecosystems, such as global warming and disruptions in the carbon cycle [4,5,6], accelerated hydrological cycles and intensified weathering conditions [7,8,9,10], faunal extinctions and turnovers among benthic organisms [11,12], and high-amplitude sea level cycles [9,13,14,15]. The late Pliensbachian to early Toarcian provides evidence for two events, the Pliensbachian–Toarcian boundary event and the early Toarcian Jenkyns event, both marked by global negative carbon isotope excursions recorded in marine and lacustrine sedimentary archives [4,5,6,16,17].
Sea level changes are crucial for understanding the dynamics of oceanic anoxic events (OAEs), as they influence basin configurations, sedimentary depositional patterns, and the distribution of biotic communities [18]. Cyclical patterns of transgression–regression events can be interpreted to reflect changes in major geological processes such as tectonic activity (i.e., tectono-eustasy), waxing and waning of continental ice caps (i.e., glacio-eustasy), and/or fluctuations in groundwater storage (i.e., aquifer-eustasy) [19,20,21]. These sea level variations can be reconstructed from geological archives using proxies such as sediment facies and lithostratigraphy, geochemical analyses, mineralogical composition, and paleontological data. Recent investigations in elemental geochemical proxy data and their implications for reconstructing sea level changes and sequence stratigraphy are rapidly growing [15,22,23,24,25,26,27,28,29,30,31,32,33,34]. These studies include changes in the bulk geochemical composition of elements such as Si, Al, Ti, K, Zr, Fe, U, Mn, Ca, and Sr.
This study focuses on the lower Jurassic (upper Pliensbachian–Toarcian) strata of the Quse Formation in the Qixiangcuo section, which is located in the Southern Qiangtang Basin within the eastern Tethys region (Figure 1). The study involves the analysis of total organic carbon (TOC), mineralogical composition, and inorganic bulk rock geochemistry. Previous studies in the Southern Qiangtang Basin have predominantly examined carbon cycle perturbations, paleocenographic conditions, and continental weathering dynamics [10,35]. However, there is a notable lack of investigations into relative sea level fluctuations and sequence stratigraphic interpretations from the upper Pliensbachian–Toarcian interval. To date, this has been limited to one study by Mansour et al. [15], which addressed the lower Toarcian organic carbon-rich oil shales of the Quse Formation in the Northern Qiangtang Basin (Bilong Co area) based on palynology and bulk geochemical data.
The current study forms an integral part of a focused project investigating the stratigraphic succession of the upper Pliensbachian–Toarcian Qixiangcuo section in the Southern Qiangtang Basin (Figure 1). The research involves a high-resolution sampling strategy throughout the Qixiangcuo section to elucidate the evolution of sea level cycles and establish a robust sequence stratigraphic framework. This is achieved through detailed analyses of bulk rock elemental and mineralogical data and TOC content. Additionally, the results of this study are compared with data from the Toarcian strata of the Quse Formation in the Northern Qiangtang Basin. By comparing datasets from the Southern and Northern Qiangtang terranes, this study enhances our understanding of the evolution and regional variations in sea level cycles during the late Pliensbachian to early Toarcian.
Figure 1. (A) Regional map of the Tibetan Plateau showing the location of the Qiangtang Basin and adjacent structural orogenic belts and bounding suture zones [36]. ATF: Altyn Tagh Fault; NQB: Northern Qiangtang Basin; SQB: Southern Qiangtang Basin; AKMS: Aylmaqin–Kunlun–Mutztagh suture; IYS: Indus–Yalu suture; BNS: Bangong–Nujiang suture; GLS: Ganzi–Litang suture. The orange solid circle represents the Bilong Co area. (B) Major structural features and location of the current study Qixiangcuo section as well as the Sewa and Suobucha sections in the Southern Qiantang Basin [37].
Minerals 15 00440 g001

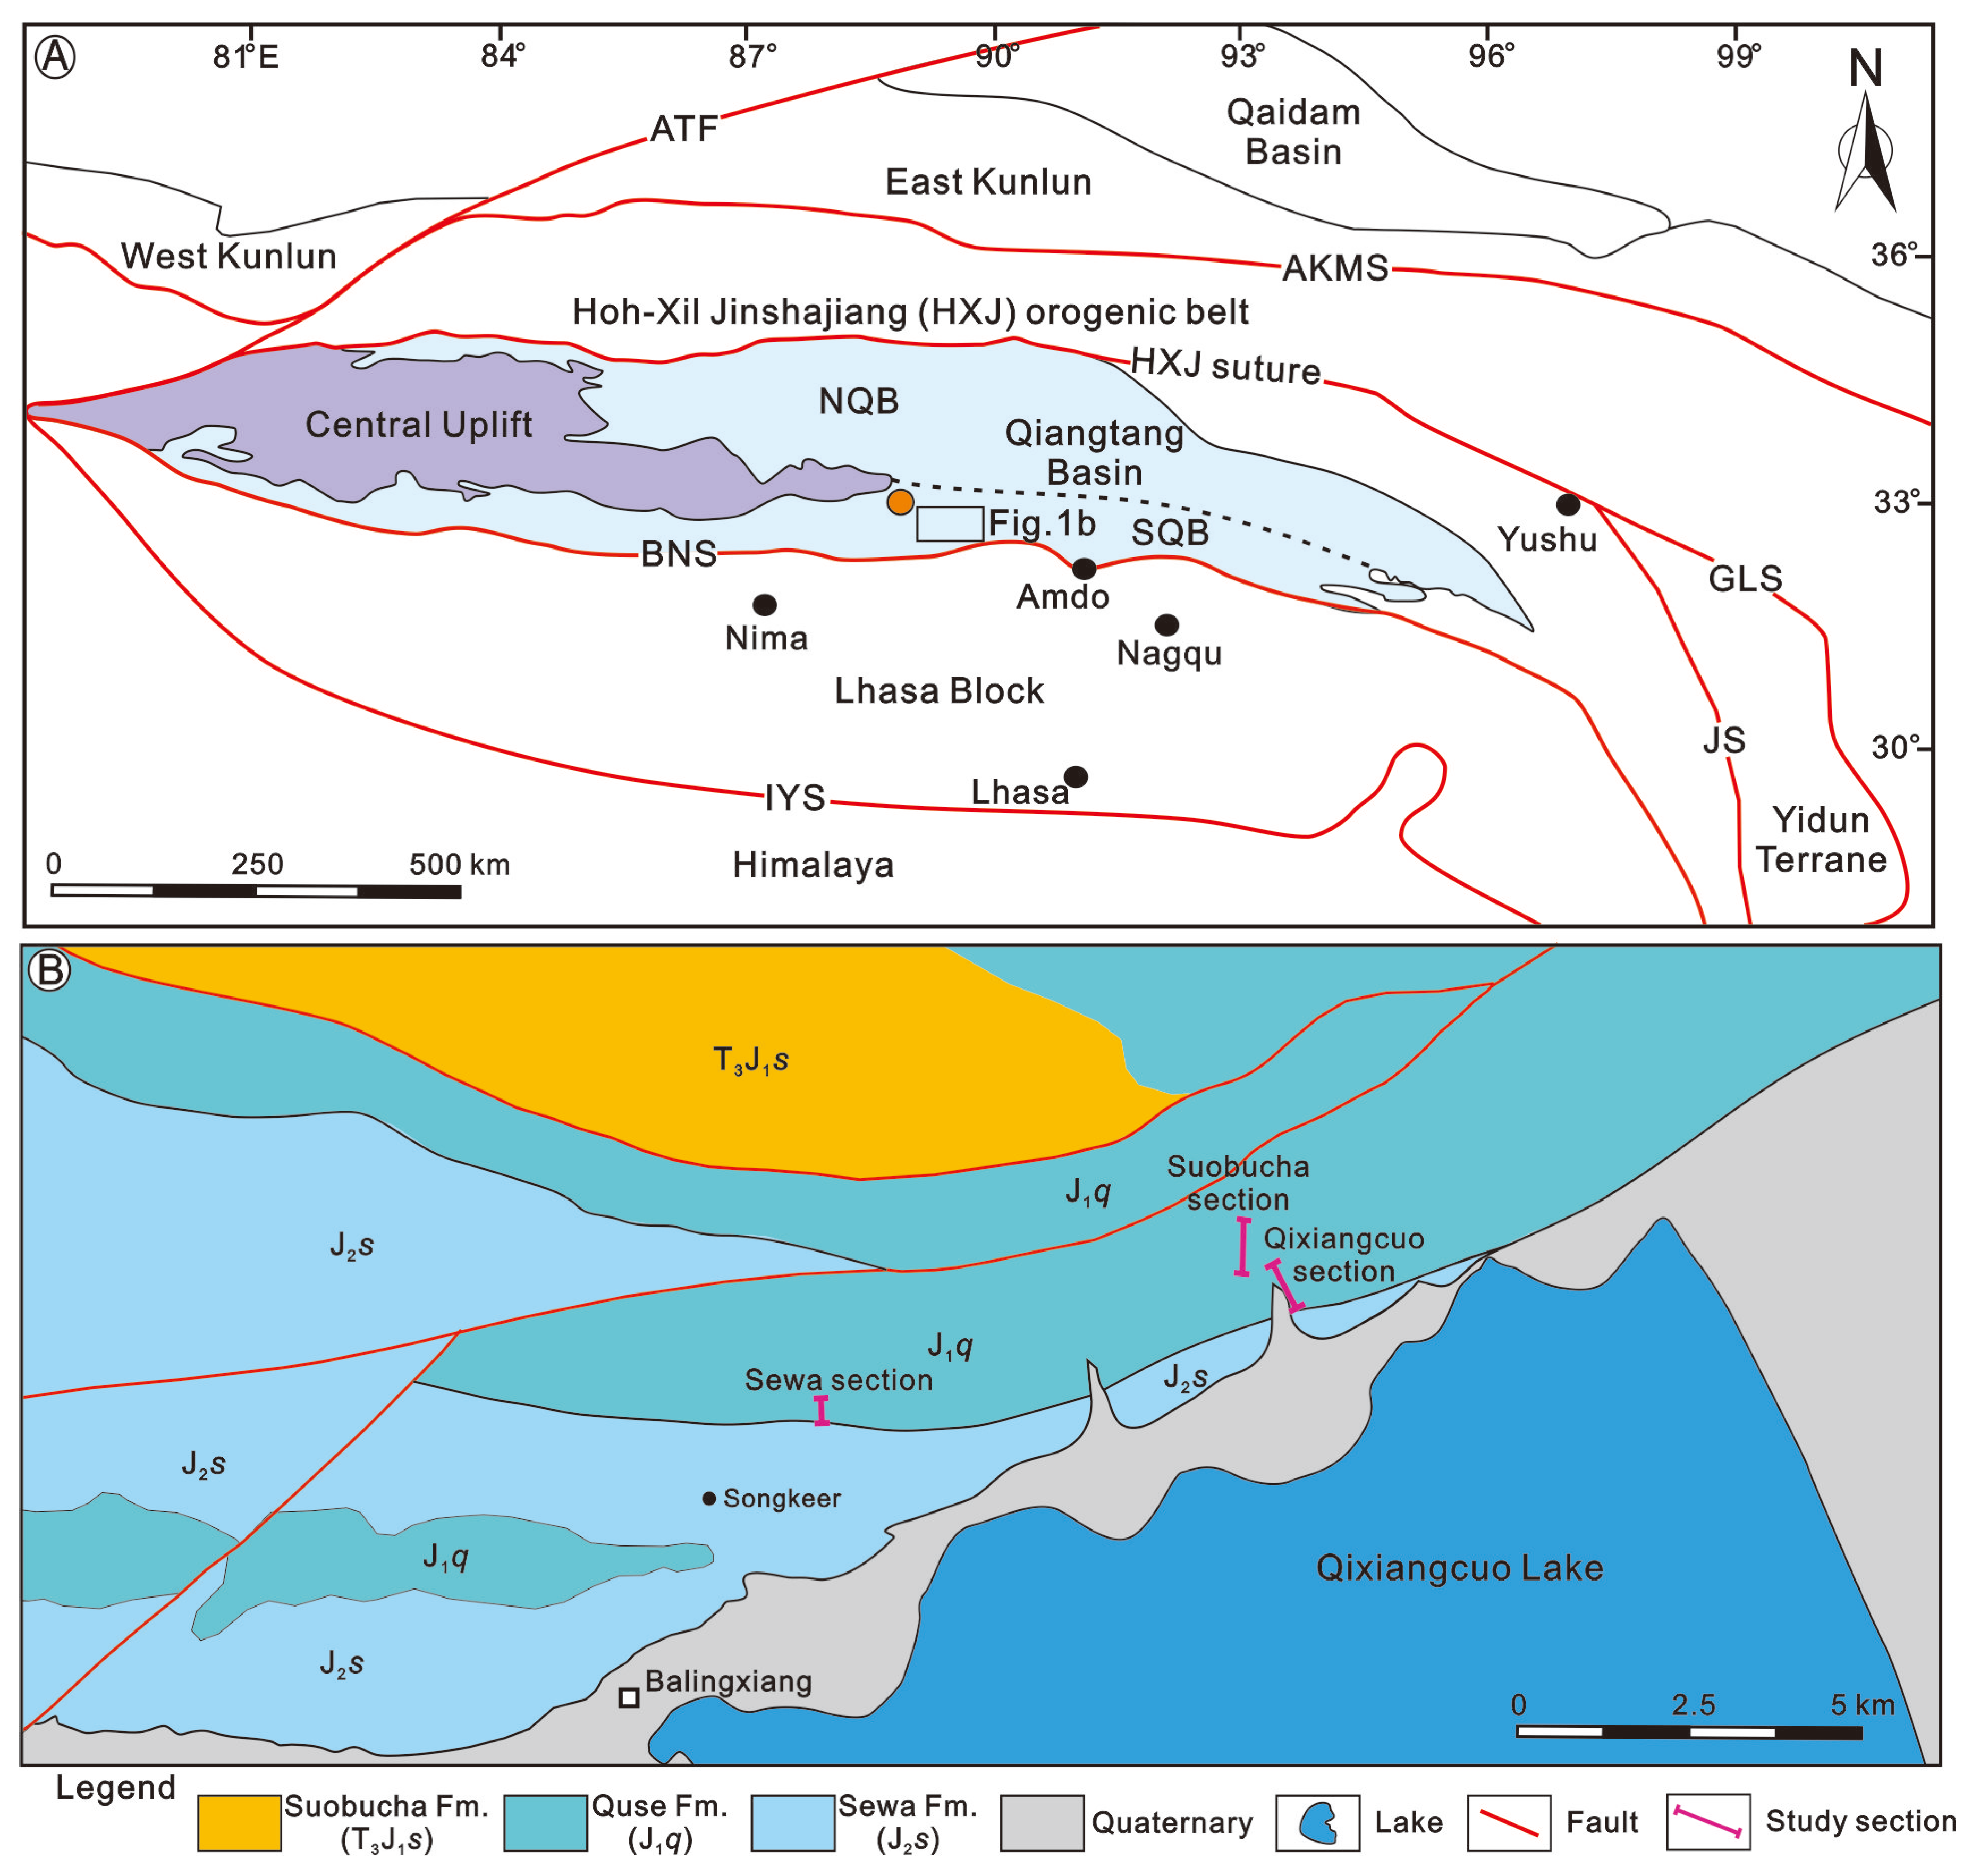
2. Regional Geologic and Stratigraphic Evolution

The Qiangtang Basin is considered a transitional tectonic domain within the Eastern Gondwana supercontinent. During the early Permian, tectonic shortening resulted in the fragmentation of the Qiangtang Basin into the Northern and Southern Qiangtang terranes via the Longmu Co–Shuanghu suture zone, which is located in the central part of the basin [38]. This suture zone formed during the convergence and collision between Gondwana and Pan-Cathaysia [38]. This was followed by the rapid separation and drifting of the Qiangtang Basin from Gondwana during the late Permian [39,40]. In the early Triassic, further northward drifting and collision occurred between the Hoh Xil–Songpan block and the Qiangtaing Basin, resulting in the development of a syn-tectonic foreland basin and a thrust-fold belt [41]. During the late Triassic, the Qiangtang Basin experienced basin inversion and subsidence due to complex intracontinental rifting and the rapid expansion of the Bangong–Nujiang Ocean [42]. This tectonic evolution continued into the early Jurassic, further spurring significant changes in the paleogeography of the basin and the formation of a hemipelagic open shelf sea in the Southern Qiangtang Basin [6]. Contemporaneously, the Northern Qiangtang Basin represented a lacustrine environment [40]. During the early Jurassic, the Southern Qiangtang Basin was part of the northeastern Tethys margin.
The studied Qixiangcuo section is located in the Southern Qiangtang Basin, which is delineated by several key geological units such as the Bangong–Nujiang suture zone and the Lhasa Blocks to the south, and the Longmu Co–Shuanghu suture zone, the Central Uplift, and the Northern Qiangtang Basin to the north (Figure 1). The northwestern margin of the Southern Qiangtang Basin is marked by the Jinsha suture zone. These sutures and geological boundaries outline the extent of the Southern Qiangtang Basin within the broader tectonic framework of the region.
In the Southern Qiangtang Basin, such as the Suobucha area, a thick succession of siliciclastic and carbonate rocks was deposited from the upper Paleozoic (Permian) to the Cenozoic (Figure 1). The studied Qixiangcuo section is located in the Suobucha area (Figure 1). The Qixiangcuo section is situated close to the Lower Jurassic Sewa [35] and Suobucha sections [10]. The predominant lithology of the Qixiangcuo section belongs to the Jurassic Quse Formation (Figure 1 and Figure 2). The Lower Jurassic strata of the Quse Formation are characterized by bioclastic and micritic limestones, organic carbon-poor mudstones, and marlstones deposited in a shallow marine environment (Figure 2). The lithologic composition of the Quse Formation in the Qixiangcuo section reflects a comparable stratigraphic composition to sediments recovered from the Sewa and Suobucha sections. However, the Toarcian strata of the Quse Formation in the Bilong Co area are dominated by thick intervals of oil shales, organic carbon-rich mudstones, and calcareous mudstones [6,7]. The stratigraphic composition of the Qixiangcuo section comprises bioclastic limestones at the interval from 0–48 m, transitioning to white, dark- to light-gray micritic limestones at the interval from 48.1–83 m (Figure 2). The upper interval is characterized by alternating layers of dark gray and yellow organic carbon-poor mudstones and marlstones (Figure 2).
Within the Suobucha area, the Quse Formation has yielded some invertebrate mollusc fossils, including bivalves and ammonites. Biostratigraphic analysis of the adjacent Suobucha section revealed an ammonite assemblage of Cleviceras, Eleganticeras, and Harpoceras groups within Lower Jurassic strata of the Quse Formation [43]. These ammonite fossil species were used to indicate an early Toarcian age for the interval of the Quse Formation in the Suobucha area, which was further supported by a record of a strong negative carbon isotope excursion (CIE) [10]. Similar records of the former ammonite groups alongside the bivalves of the Bosistra group as well as a negative CIE were also reported from the Sewa area, to the west of Suobucha (Figure 1), in the Southern Qiangtang Basin [35].
Within the Qixiangcuo section, the Bosistra and Harpoceras groups were documented in the studied interval of the Quse Formation at a height of 80–90 m, suggesting an early Toarcian age of the mudstone and marlstone strata [44]. Additionally, strata at the uppermost part of the Qixiangcuo section (at ca. 128 m) yielded the age-diagnostic ammonite species Stephanoceras sp. (Figure 2) [44], which infers a Middle Jurassic age, with its first occurrence marking the Bajocian in Western Europe [45]. Age constraints of the Quse Formation can further be elucidated from biostratigraphic data from the adjoining Sewa and Suobucha sections [35,36,43]. Zhao et al. [43] established a robust ammonoid biostratigraphic scheme for the Suobucha section. The presence of the ammonoids Eleganticeras sp., Harpoceras sp., and Cleviceras sp. in the Suobucha section aligns with their first occurrence in the H. exaratum subzone [43]. The age-diagnostic ammonite species Harpoceras falciferum is commonly used to infer an early Toarcian age in Western Europe [1,46]. The falciferum zone can be discriminated into H. exaratum and H. falciferum subzones [46]. The correlation between the recovered marker ammonoids of Harpoceras and Bosistra in the Quse Formation of the Qixiangcuo section can be correlated with contemporaneous lower Toarcian strata in the Suobucha area, thereby providing evidence for the early Toarcian age of the mudstone and marlstone interval in the studied succession.
Figure 2. Lithostratigraphic chart (A) and representative field photographs (BG) of the Quse Formation in the Qixiangcuo section, Southern Qiangtang Basin. (A) Lithostratigraphic column of the Qixiangcuo section with sample positions in corresponding field photographs (represented by the letters D across G) and recovered ammonite fossils in the study area [44] and those recorded from coeval strata in the adjacent Sewa and Suobucha sections [35,36,43]. The black squares indicate the locations of marker ammonoid fossils found from in the Suobucha and Sewa areas. (B) Google Earth image of the Qixiangcuo section in the Southern Qiangtang Basin. (C) Panorama field photograph of the study section, illustrating some positions of fieldwork sampling exaggerated in photographs D–G and the points at which the samples were collected. (DG) Field photographs of representative outcrop strata with their lithofacies changes and related samples. f? = fault. Aa.-Baj. = Aalenian–Bajocian.
Minerals 15 00440 g002

3. Material and Methods

In this study, a high-resolution fieldwork sampling was carried out from the Qixiangcuo section within the Suobucha area at coordinates 32°31′32.2″ N and 89°56′36.5″ E. A total of 199 fresh rock samples were collected from the Quse Formation at a short stratigraphic spacing (0.2–2 m) and a total thickness of 129.5 m, spanning from the upper Pliensbachian to the Toarcian (Figure 2). Prior to analysis, weathered surfaces were removed to clear the samples and minimize sedimentary rock alterations due to weathering processes. Subsequently, all rock samples underwent crushing and powdering to ensure representative sample material for comprehensive geochemical analyses.

3.1. Whole-Rock Geochemistry

For whole-rock geochemical composition, a total of eighty-three rock samples were measured for major and trace elements using an 8900 Inductively Coupled Plasma–Mass Spectrometry device (ICP-MS Aligent, Santa Clara, CA, USA) at the Institute of Geology and Geophysics, Chinese Academy of Sciences. Each powdered sample (40 mg) was first weighed into 15 mL PTFE bombs and digested in a mixture of 0.5 mL of 8 mol/L HNO3 and 1 mL of 28 mol/L HF acids. The PTFE bomb of each sample was sealed, transferred to a steel jacket, and heated at 190 °C for 24 h. The bomb was then placed on a hot plate for further heating at 150 °C to eliminate the solutions and dry the powdered fractions. HNO3 acid (2 mL of 8 mol/L) was added to the bomb and transferred to the steel jacket for heating at 150 °C for 5 h. Furthermore, the previous step was repeated by further additions of HNO3 acid (5 mL of 3.2 mol/L). The solution of each sample was then transferred to a PET bottle and diluted in a 2% HNO3 solution. Analytical precision and quality assurance were monitored using USGS BHVO-2 and NRCG GSR-3 standard reference materials [47]. The analytical precision of the measured values was better than 5%. The elemental geochemical data suggest distinct behaviors within each sedimentological group, providing valuable insights for tracking paleoenvironmental and sea level changes [23,24,27,28,34].

3.2. Total Organic Carbon (TOC) Analysis

Within the Qixiangcuo section, 199 rock samples underwent total organic carbon (TOC) analysis. Prior to analysis, about 100 mg of each powdered sample was digested in concentrated HCl (34%) for 10 h to eliminate the inorganic carbon present in the sediments. The mixture was subsequently rinsed with distilled water to remove any remnants of HCl. The powdered fraction was then dried at 60 °C for 4 h. The TOC content of all samples was measured using a LECO CS-200 carbon–sulfur analyzer (LECO Corporation, St. Joseph, Michigan, USA) at 1200 °C. The analytical precision was better than ±0.1 wt.%. The TOC analysis was carried out at the Exploration and Development Research Institute, PetroChina Huabei Oilfield Company.

3.3. Whole-Rock Mineralogy

Within the Qixiangcuo section, a total of 34 rock samples were analyzed for their bulk-rock mineralogical composition. These samples were chosen based on the cyclical changes observed in the lithological composition, as well as the fluctuations in major and trace element concentrations throughout the studied succession of the Quse Formation. Before analysis, all samples were crushed into small particles of 200 mesh. An aliquot of 5 g of each sample was analyzed using the back pressure method in a Rijaku SmartLab9 X-ray diffractometer. Because each type of mineral shows a specific XRD pattern, the mineral peak intensity was correlated with the bulk mineral composition, which was used to calculate the mineral content. The bulk mineralogical composition analysis was performed at the SGS–CSTC Standards Technical Services Co., Ltd., Beijing, China.

4. Results

Stratigraphic variations in the TOC content and the bulk geochemical composition of major and trace elements, including Si, Al, Ca, Ti, Zr, Mn, U, and Sr, were recorded (Figure 3, Figure 4 and Figure 5). All samples from the Qixiangcuo section exhibited an overall TOC content below 0.5 wt.% (Figure 3). The lowest TOC values (0.2–0.03 wt.%, average 0.1 wt.%) occurred within the upper Pliensbachian bioclastic limestone interval (0–36 m). A slightly higher TOC content, ranging from 0.3 to 0.1 wt.% (average 0.2 wt.%), was recorded within the lower Toarcian micritic limestone interval. The highest values of TOC (0.45–0.09 wt.%, average 0.2 wt.%) were documented within the lower Toarcian mudstone–marlstone interval (81.5–126 m) (Figure 3).
Here, the results of the elemental concentrations and their ratios used to reconstruct the third-order transgressive–regressive sequences, such as Zr, Ti, U, Mn, Ca, Sr, Si, and Al, are presented and discussed (Figure 4 and Figure 5). Within the Qixiangcuo section, elements such as Zr, Ti, and U showed typically similar patterns across the stratigraphic succession (Figure 4). The concentrations of Zr, Ti, and U were in the range of 148.6–8.9 ppm (average 95.2 ppm), 0.44–0.03 wt.% (average 0.9 wt.%), 2.6–0.4 ppm (average 1.7 ppm), respectively. These elements showed successive cyclic fluctuations, with the highest concentrations typically found within the mudstone/marlstone intervals (Figure 4). The lowest values of Zr, Ti, and U occurred within the upper Pliensbachian–lowermost Toarcian bioclastic and micritic limestone intervals (Figure 4). The Zr/Al and Ti/Al ratios also exhibited slightly similar trends throughout the Qixiangcuo section. The Zr/Al and Ti/Al ratios were in the range of 19.7–12.9 (averaging 14.5) and 0.062–0.038 (averaging 0.048), respectively, within the bioclastic limestone of the upper Pliensbachian, with a clear long-term falling trend toward the lowest values around the Pliensbachian–Toarcian boundary transition. Successive cyclic changes in the Zr/Al (15.9–13.3, averaging 14.4) and Ti/Al ratios (0.048–0.041, averaging 0.043) were evident within the lower Toarcian mudstone/marlstone interval, mirroring the trends seen in Zr, Ti, and U but with lower amplitudes (Figure 4).
The CaCO3 (calculated from CaO) and Mn contents, along with the Mn/Al ratios, showed considerable variability throughout the Qixiangcuo section. The carbonate content showed slightly similar trends to the Mn/Al ratio and Mn content. In the lower Quse Formation, the bioclastic and micritic limestones showed a slight decreasing trend in the CaCO3 content, in contrast to a significant decline in the Mn and Mn/Al values (Figure 5), which were in the range of 91.3–62.8 wt.% (averaging 74.7 wt.%), 0.1–0.03 wt.% (averaging 0.05 wt.%), and 0.08–0.01 (averaging 0.03), respectively. The highest carbonate content and Mn/Al ratios were observed within the bioclastic limestone interval (0–48 m) (Figure 5). The lower Toarcian mudstone/marlstone interval showed the lowest values for both the carbonate content and Mn/Al ratios, with values ranging from 73–5.3 wt.% (averaging 22.2 wt.%) and 0.05–0.01 (averaging 0.013), respectively (Figure 5). Throughout the Quse Formation, the highest Mn content was found within the mudstone/marlstone interval, with values ranging from 0.17–0.05 wt.% (averaging 0.09 wt.%). The Sr/Ca ratio generally showed opposite trends to the carbonate content across most parts of the studied succession (Figure 5). In the bioclastic/micritic limestone interval, the Sr/Ca ratios showed a gradual decrease from 65.2 to 38.2 (Figure 5). This was followed by highly variable Sr/Ca ratios ranging from 82.5–33.9 (averaging 52.9), with cyclical alternations that corresponded to the lithological changes between the mudstone and marlstone intervals. Based on the stratigraphic variations in the elemental geochemical composition, the upper Pliensbachian–Toarcian Qixiangcuo section can be subdivided into nine third-order transgressive–regressive sequences and one incomplete sequence (Figure 5). The geochemical composition of elements Si, Al, Ca, Ti, Zr, Mn, U, and Sr are shown in Table 1.
The bulk-rock mineralogical composition of the Quse Formation samples provides insights into the sea level and environmental evolution that occurred during deposition. The bulk mineralogical composition of quartz, plagioclase, K-feldspar, dolomite, calcite, and clay minerals is shown in Table 2. At the upper Pliensbachian interval, the samples showed a relatively high content of calcite, ranging from 90.2–69 wt.% (Figure 6). This was followed by a significant decline in calcite within the Toarcian mudstone/marlstone strata, varying from 50–8.8 wt.% (averaging 25.8 wt.%), before rising again to 72.2 wt.% at the topmost layer of the succession (Figure 6, Table 2). On the contrary, the contents of quartz and clay minerals exhibited patterns that were typically opposite patterns to that of calcite (Figure 6). The quartz content increased substantially from the carbonate-dominated (9.0–3.5 wt.%, averaging 5.9 wt.%) to the mudstone-dominated facies (43.1–11.2 wt.%, averaging 27 wt.%) (Figure 6). The clay minerals content was low in the micritic and bioclastic limestones, with values ranging from 13.8–1.9 wt.% (7.8 wt.% on average), compared to moderate abundances in the mudstone/marlstone interval, where the values ranged from 51.8 to 0.8 wt.% (34.1 wt.% on average). Plagioclase had generally low values in the micritic/bioclastic limestones (3.1–2.4 wt.%, averaging 2.7 wt.%), in contrast to slightly higher values in the mudstone/marlstone interval (8.5–2.4 wt.%, averaging 5.8 wt.%) (Figure 6). Dolomite was reported from the lower and upper carbonate-dominated layers, with values in the range of 32.4–0.6 wt.% (7.7% on average). The K-feldspar content occurred in trace amounts.

5. Discussion

5.1. Sequence Stratigraphic Development and Model Used

The sequence stratigraphic architecture and cyclicity of sedimentary rock records are mainly driven by the interplay between autogenic and allogenic processes [48]. Several key factors influence sea level cyclicity, including regional-scale tectonic activities and plate movements, low- to high-amplitude eustatic sea level fluctuations, and climate evolution over short- to long-term timescales [48,49,50,51,52]. Additionally, factors such as terrigenous sediment supply, wind energy regimes, sedimentation rates, sediment compaction and loading rates, authigenic sedimentological processes, and basin subsidence/uplift significantly impact sequence stratigraphic evolution [15,53,54]. Therefore, the development of sea level cycles and sequence stratigraphy is intricately linked to these processes.
Sequence stratigraphic models include depositional, genetic, and transgressive–regressive sequence models [55,56]. This study employed the transgressive–regressive sequence stratigraphic model, which defines stratigraphic bounding surfaces and systems tracts relative to transgressive–regressive sea level cycles. The transgressive–regressive model comprises two main systems tracts: the transgressive system tract (TST), which forms under deeper accommodation space during the highest sea/lake levels and is bounded at the top by a maximum flooding surface [57,58]; and following the TST, there is a facies shift toward shallower or more terrigenous sediments, representing the regressive system tract (RST). The RST is bounded at its upper part by subaerial erosional unconformities or their correlative conformities, referred to as the maximum regressive surface [57]. The RST usually includes sediments deposited during the highstand and the early stage of the lowstand phases sea level fluctuations [56].
Subaerial unconformity surfaces can be developed in diverse environmental settings, including downstream fluvial systems [50], through fluvial incision [59], or during falling stage of sea levels that expose carbonate platforms [56]. The maximum regressive surface (MRS) marks the termination of a transgressive–regressive sequence cycle and serves as the boundary for each stratigraphic sequence. It represents the most prominent break in sea level cycles and sedimentation, indicating a shift from a sea level fall to rise [55]. The maximum flooding surface (MFS) marks the transition from a sea level transgression to regression, as well as the peak landward extent of shoreline invasion [51]. While both the MFS and MRS can be identified based on facies changes, palynological data, electrical logging data, and/or outcrop sections, detecting the MRS can be particularly challenging in deeper-water facies environments [55].
The resolution of sea level cyclicity and the reconstruction of stratigraphic sequences depend largely on the acquisition and types of data acquired. In this study, we applied a high-resolution geochemical approach to reconstruct sea level cycles and establish a sequence stratigraphic framework for the upper Pliensbachian–Toarcian shallow marine shelf deposits of the Quse Formation at the Qixiangcuo section [10,35,40,60]. For the Qixiangcuo section, we employed the third-order transgressive–regressive sequence stratigraphic model and its subdivision into the TST and RST and bounding surfaces.

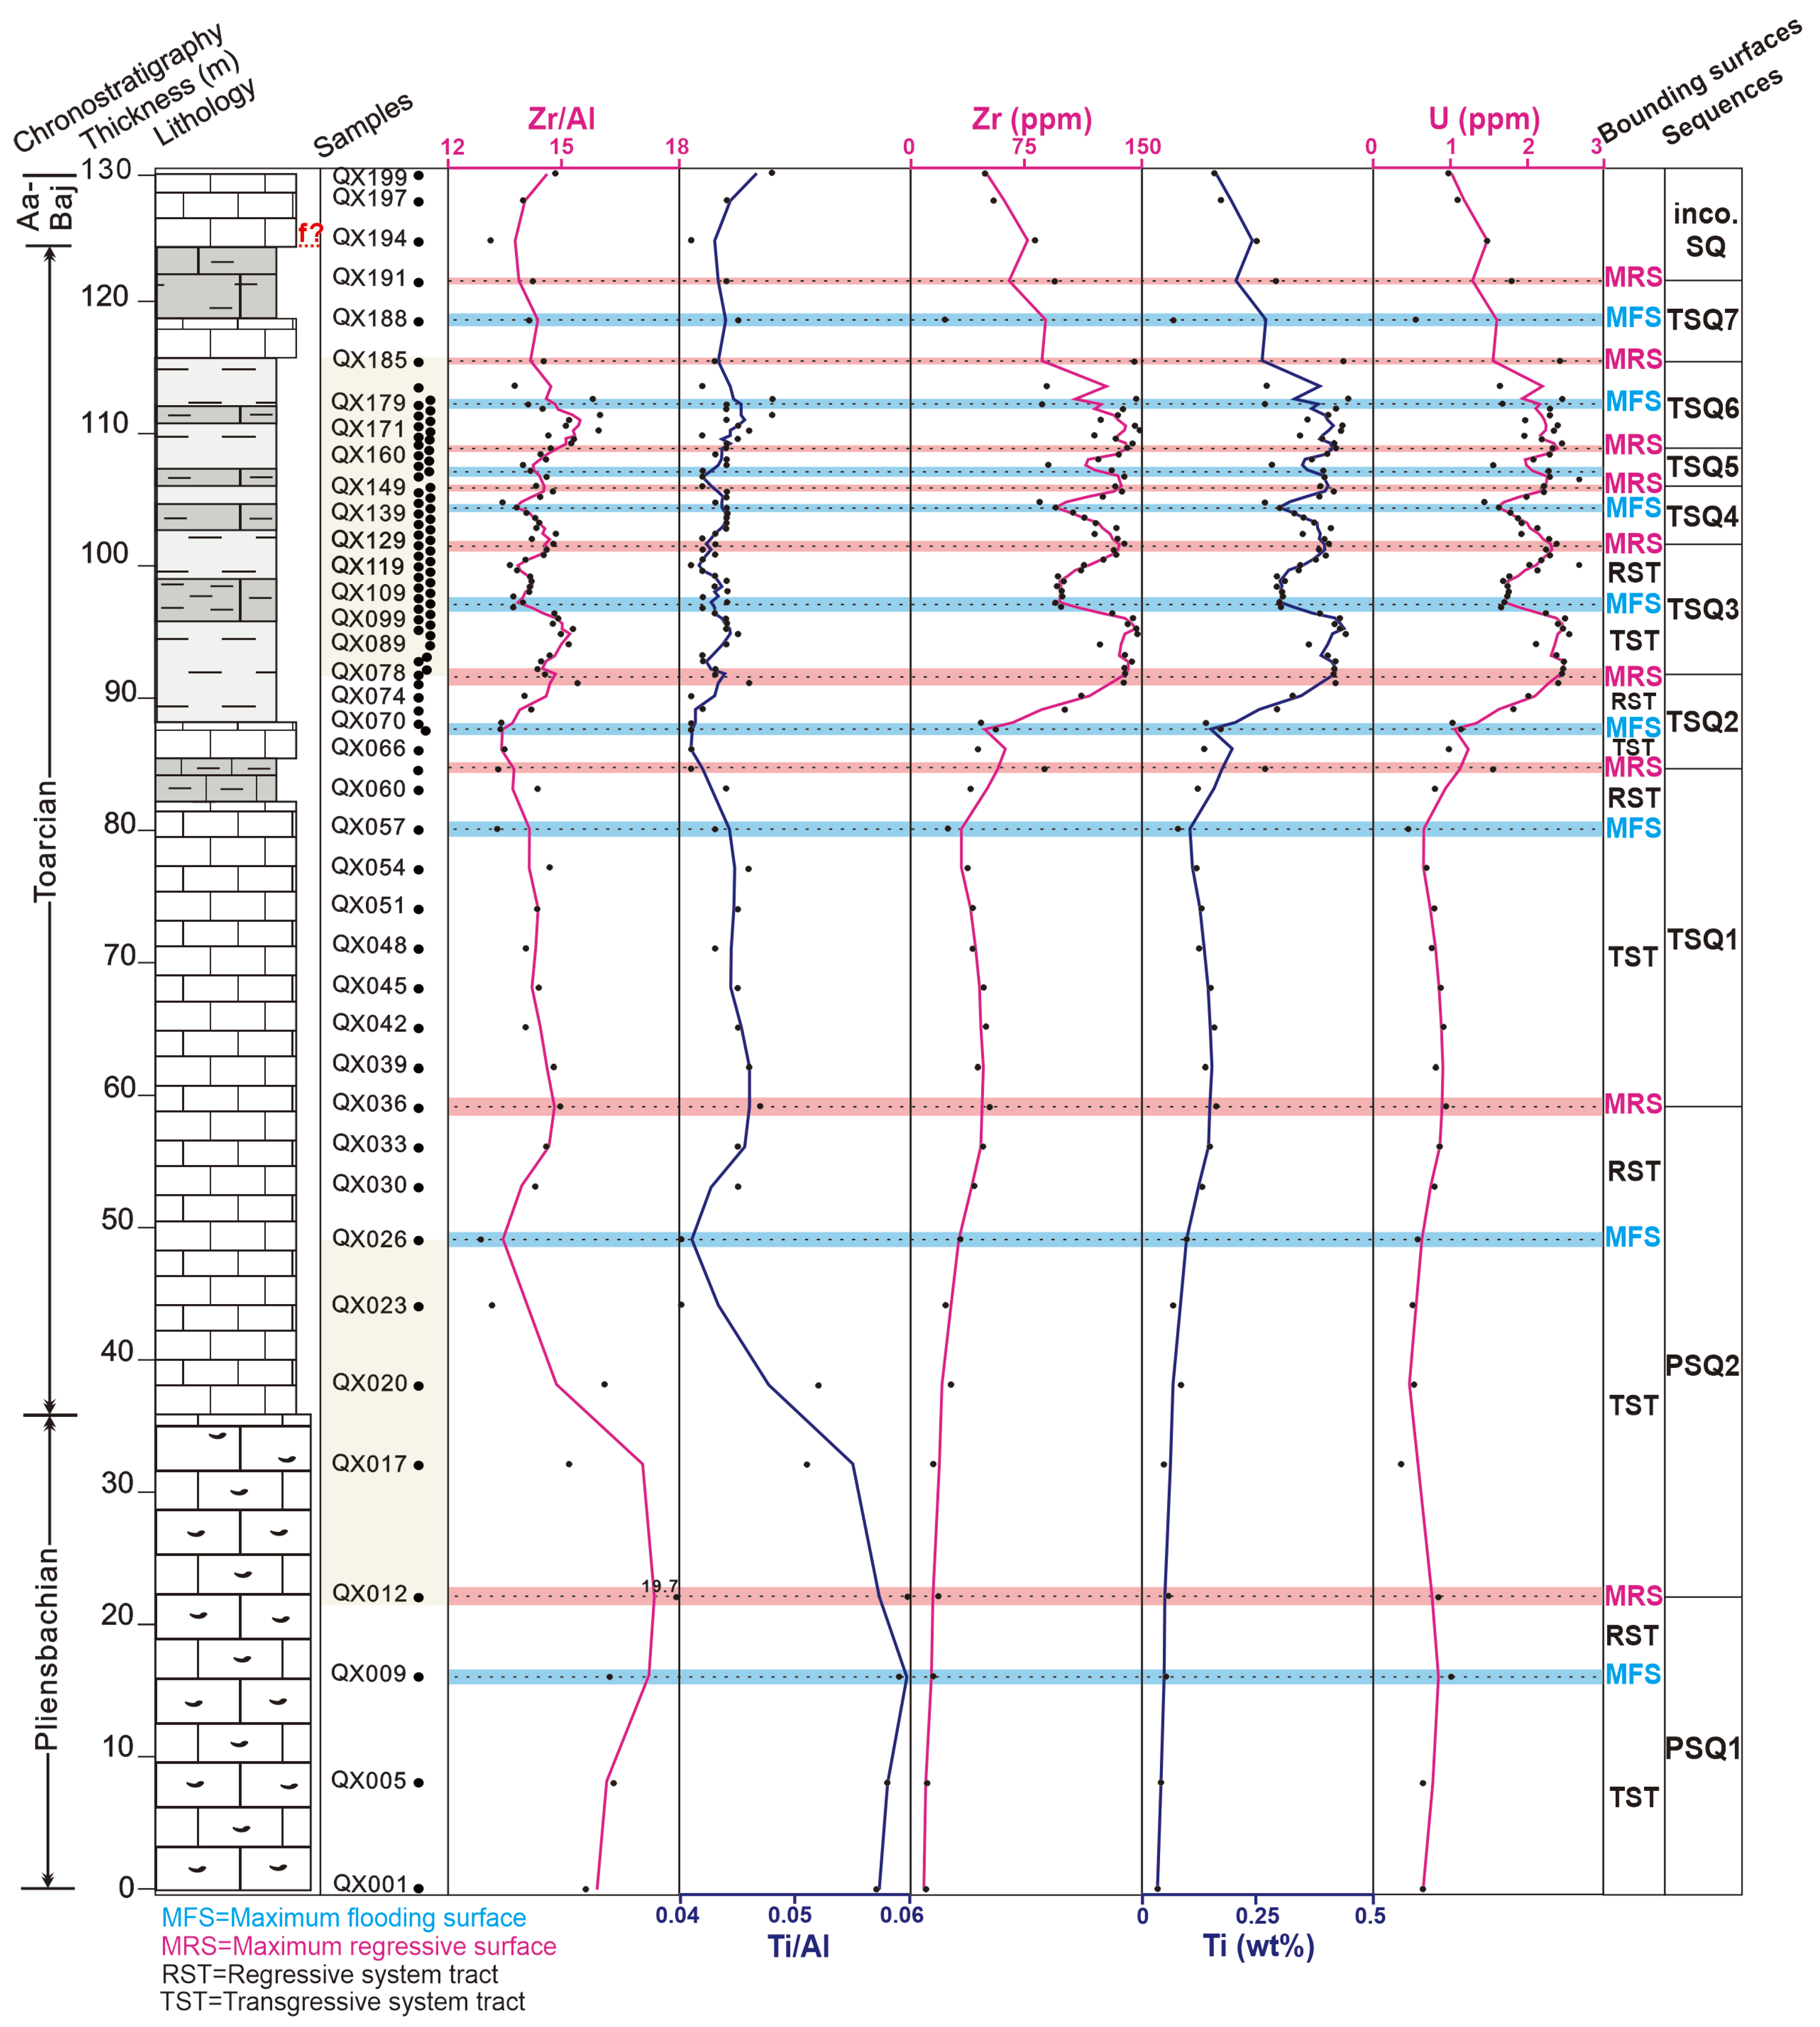
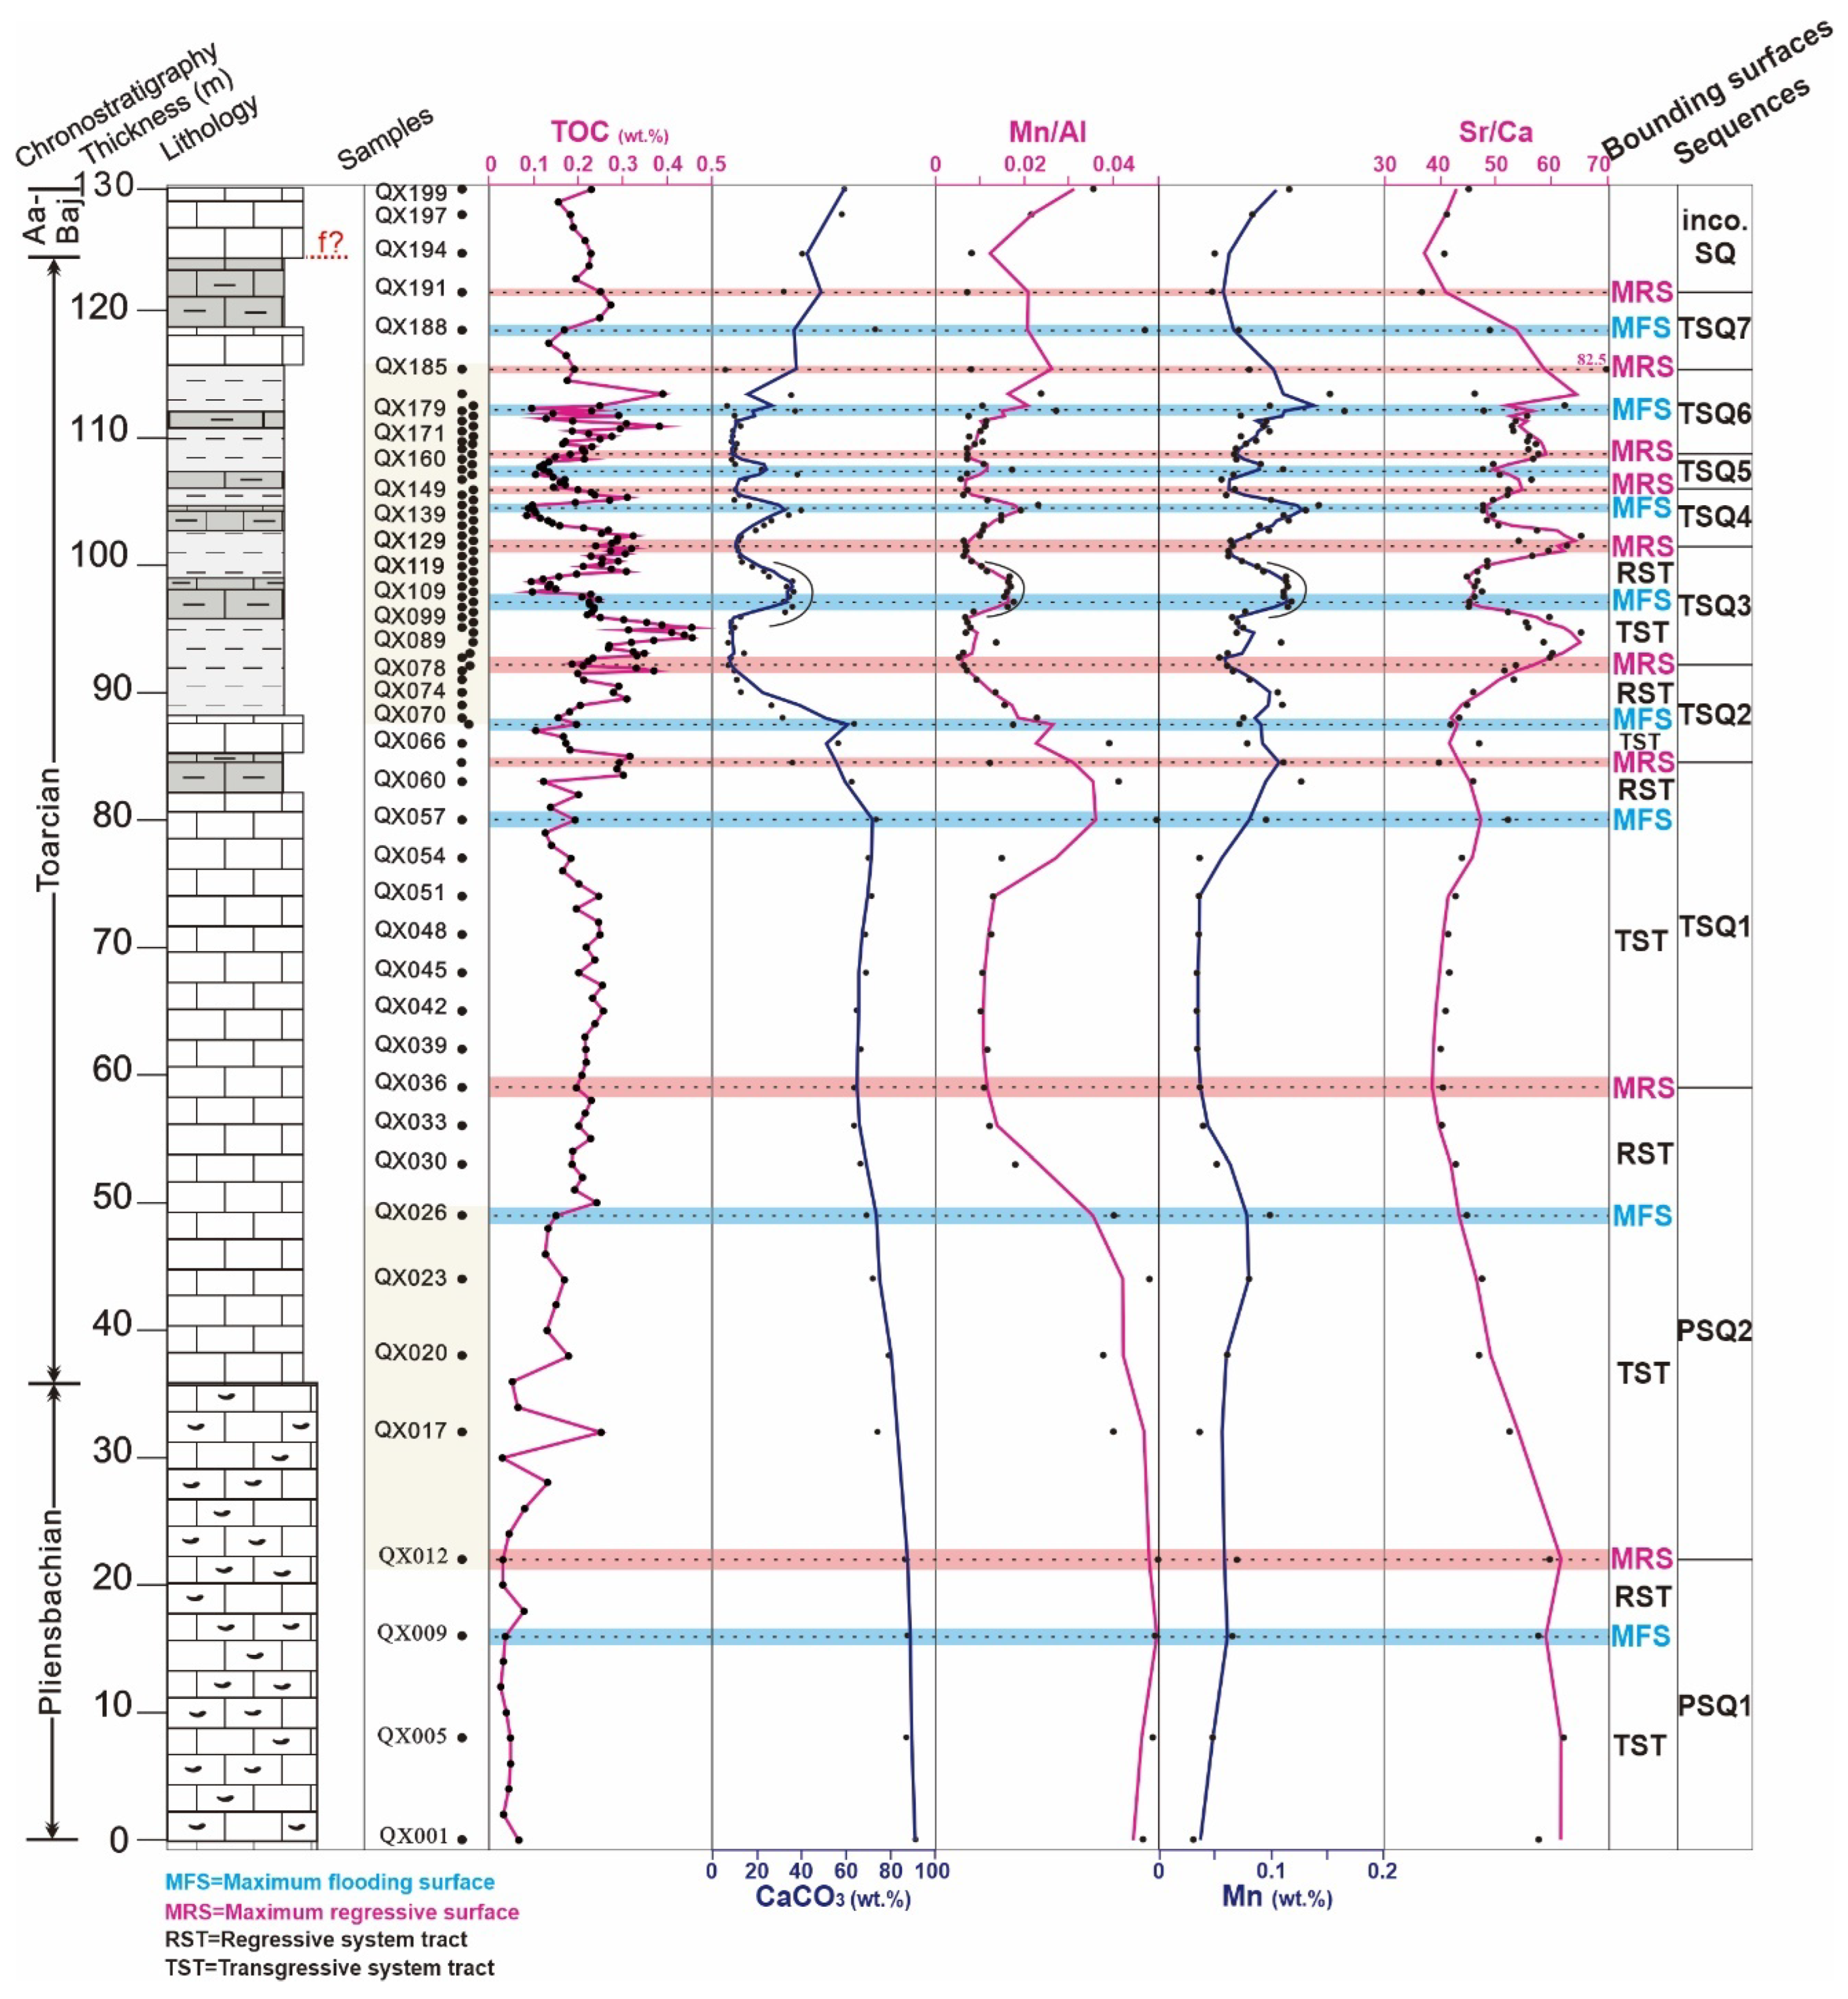
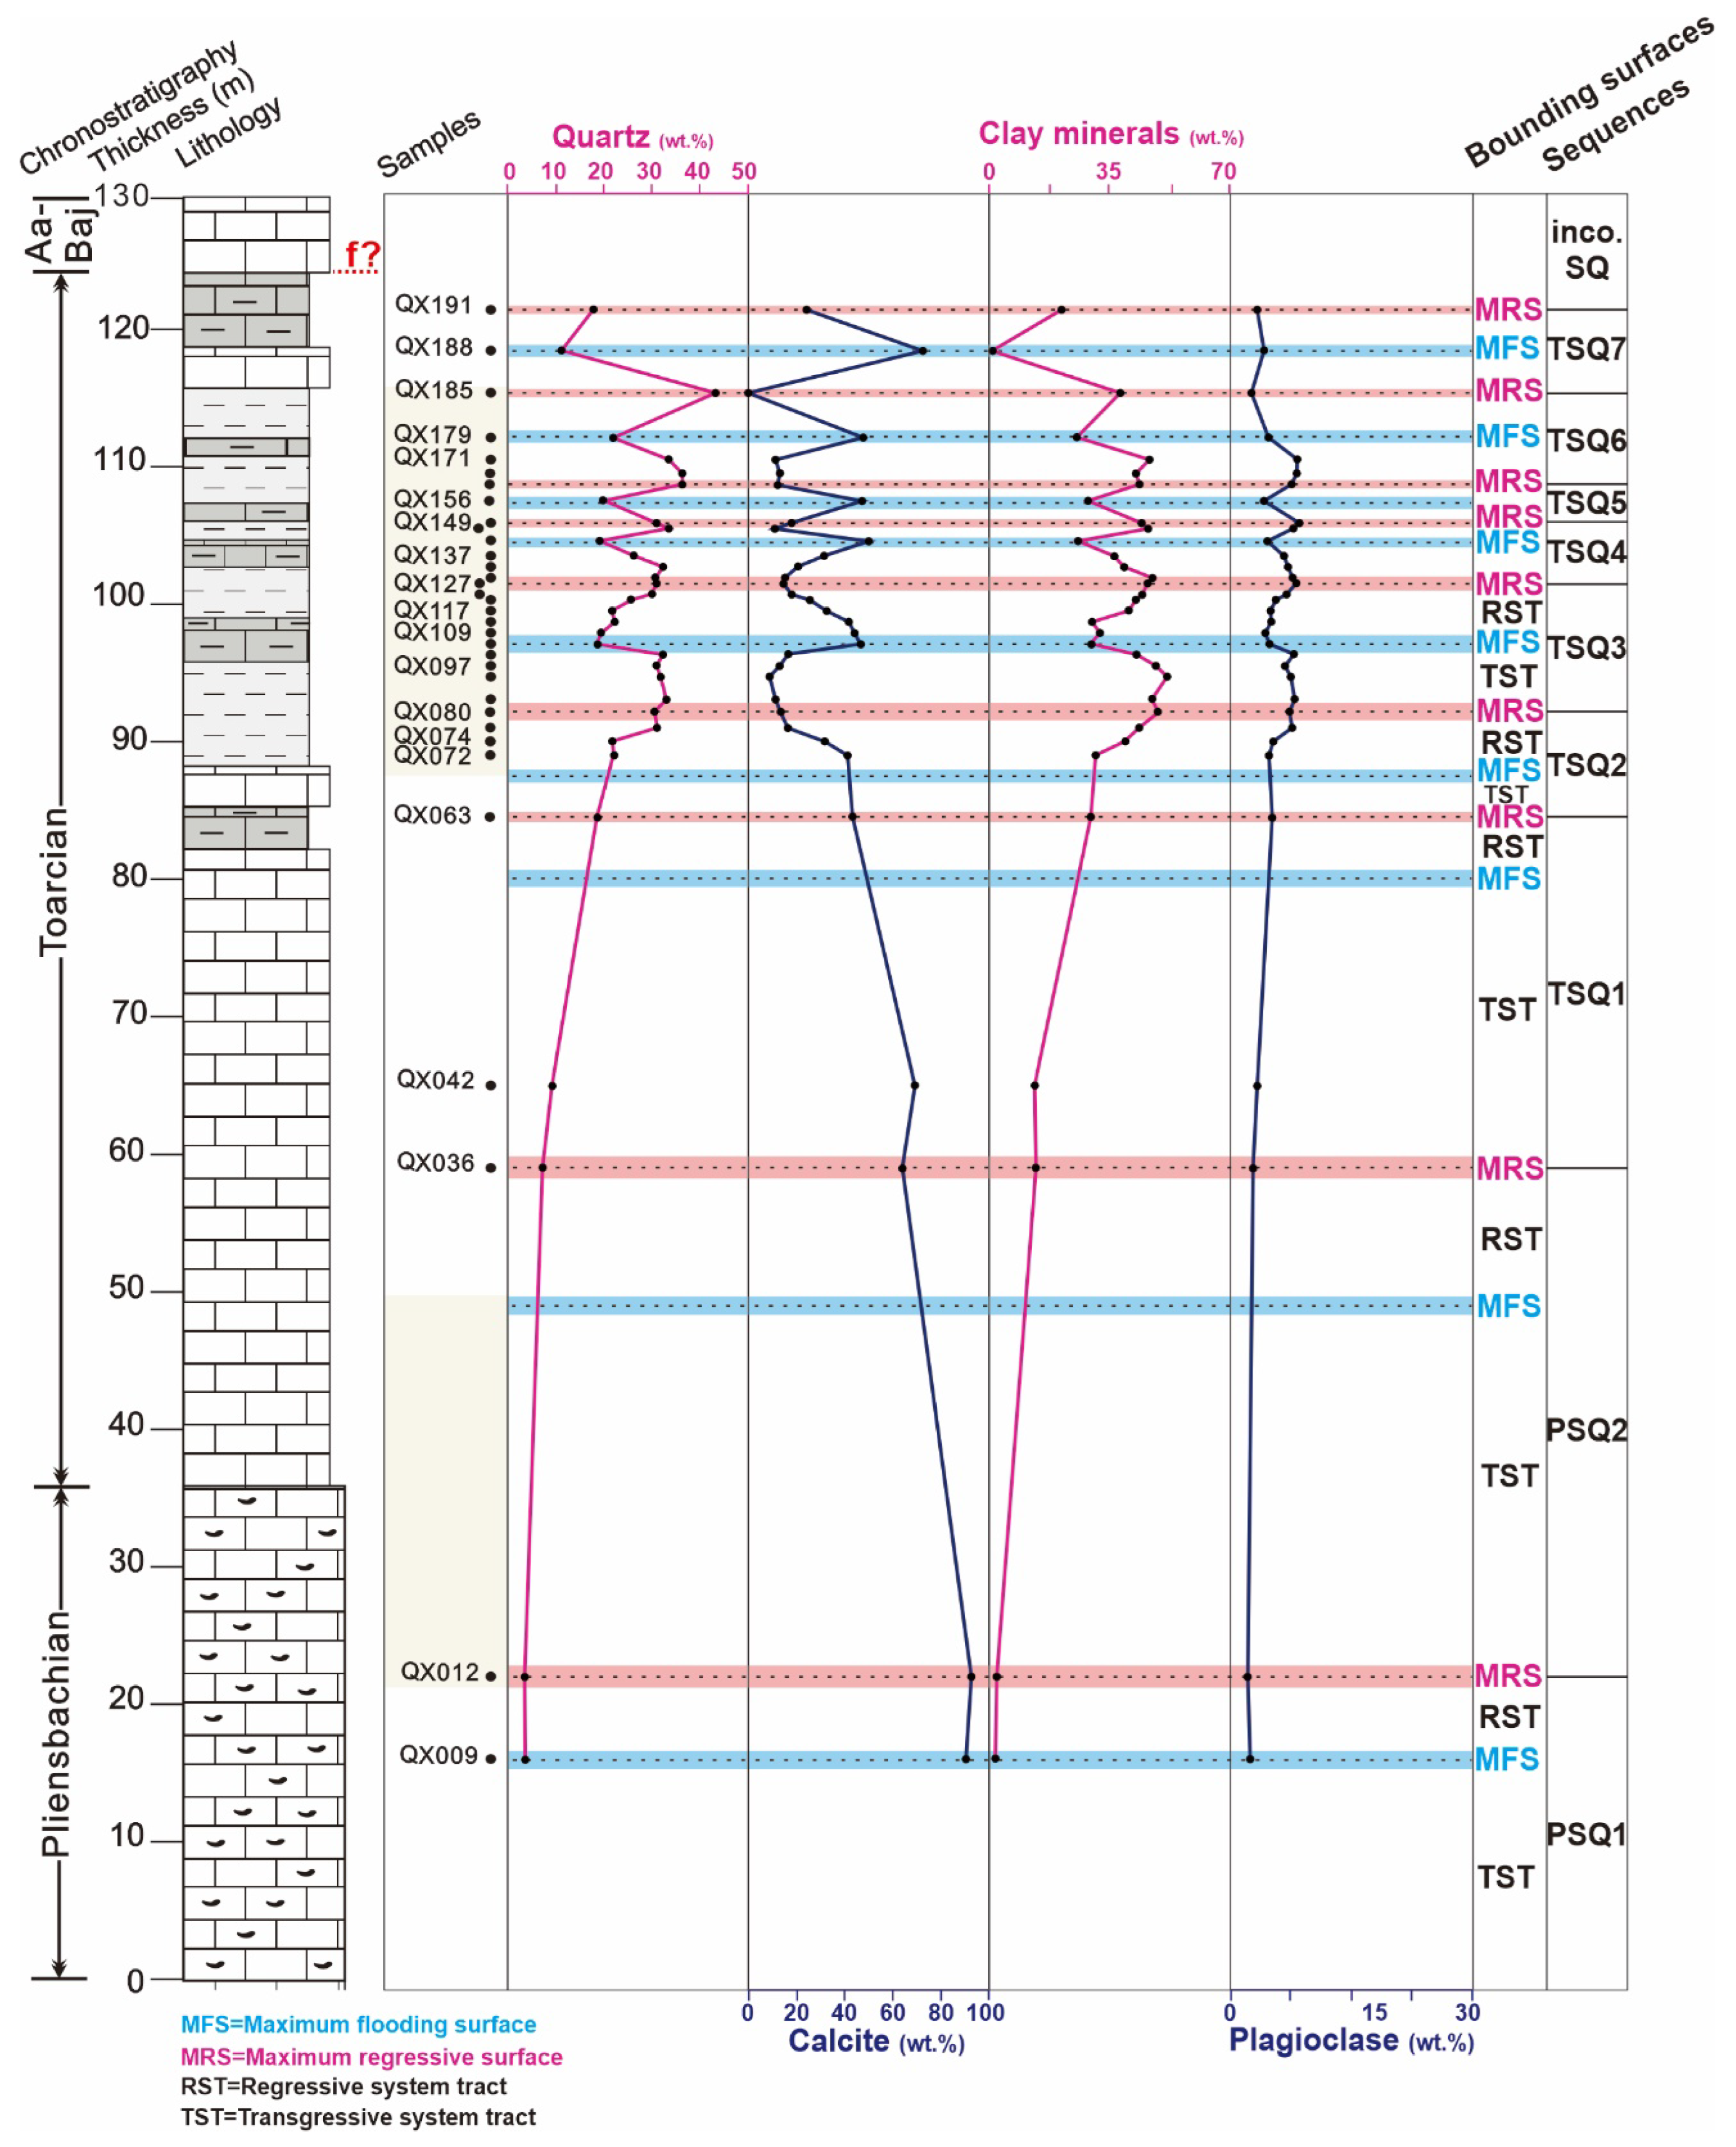
5.2. Chemostratigraphic Expression of System Tracts and Bounding Surfaces

Elemental concentrations normalized to Al, in an attempt to estimate their enrichment relative to the average shale, can lead to spurious correlations between unrelated variables [61]. This issue is particularly pronounced when the coefficient of variation of Al differs significantly from that of the normalized element concentration [34]. Therefore, it is recommended to use both the relative abundances of raw element profiles and their normalized profiles to Al when comparing trends, especially in sequence stratigraphic reconstructions and bounding surfaces (Figure 4 and Figure 5). Relying solely on ratios normalized to Al may potentially obscure meaningful patterns in the dataset. Previous studies have instead employed trace element normalization to Ti as proxies for authigenic enrichments [62].
Several studies have applied the chemostratigraphic approach to reconstruct transgressive–regressive systems tracts and bounding surfaces worldwide [15,22,23,24,25,26,27,28,29,30,31,32,33,34]. In marine environments, strontium (Sr), an alkaline element, shows complex geochemical behaviors influenced by seawater chemistry and biological processes [63]. It is found in elevated concentrations in pelagic–hemipelagic carbonate sediments during phases of sea level lowstands and can serve as a proxy for reconstructing sea level changes relative to the Ca concentration [22,31]. The Sr/Ca ratio has been widely used in sea level and sequence stratigraphy studies, where high Sr/Ca ratios indicate a relative sea level fall and vice versa (Figure 5) [15,22,24,28,33]. Additionally, the highest values of Sr/Ca ratios in a stratigraphic sequence can indicate the MRS.
In shallow-shelf environments, the carbonate content can serve as a sensitive proxy for short-term sea level changes. Elevated carbonate values can be indicative of a phase of sea level highstand. In the siliciclastic–carbonate alternations found in shallow-shelf sedimentary records in northern Egypt, Mansour et al. [32] demonstrated a typical example of increasing carbonate content correlating with higher relative abundances of gonyaulacoid dinoflagellate cyst forms. This trend indicates a TST that reaches maximum values where the MFS is identified. Similarly, the carbonate-rich Sewa Formation in the Bilong Co area of the Northern Qiangtang Basin showed cyclic changes in its carbonate content, with a long-term increase in carbonate values reflecting sea level transgressions [15].
Manganese (Mn) is a highly insoluble element under well-oxygenated conditions, typically occurring in marine sediments as oxyhydroxides, and it is often found in association with carbonate and detrital fractions, as well as labile organic matter [64]. Mn solubility increases under oxygen-deprived conditions, leading to higher concentrations in anoxic bottom and pore waters [24]. The Mn content in pelagic carbonates is also influenced by the rate of terrigenous sediment influx. However, Mn levels are susceptible to diagenetic alterations, and anomalous Mn values may indicate the presence of a diagenetic Mn pump, which should be considered [24]. In sedimentary sequences, increasing trends in the Mn content and Mn/Al ratios typically characterize sediments deposited during the TST, with peaks in Mn and Mn/Al marking the MFS or sea level highstands [31]. Conversely, sediments of the RST usually show declining Mn contents and Mn/Al ratios, with minima occurring at the MRS [28,65]. However, caution should be considered when using Mn and Mn/Al ratios to reconstruct sea level variations, as the interpretation can be complicated by the diverse sources of Mn entering the basin.
Aluminum (Al) is typically associated with aluminosilicate clay mineral particles, whereas the variations in zirconium (Zr) and titanium (Ti) are the result of concentrations in heavy minerals, such as silt- and sand-sized detrital zircon particles [66], Ti-bearing heavy minerals such as ilmenite, pyroxene, titanite, augite, and rutile, as well as aluminosilicate minerals [67]. The stratigraphic variations in Zr and Ti, along with their detrital elemental ratios normalized to Al, serve as indicators of changes in grain size, current energy, relative sea level fluctuations, and variations in terrigenous detrital input from source areas [34,67,68]. In sequence stratigraphic reconstructions, increasing abundances of Zr and Ti, as well as higher ratios of Zr/Al and Ti/Al, indicate strata deposited during phases of sea level regression and/or lowstands [31]. Conversely, decreasing values characterize sediments deposited during phases of sea level rises and transgressions [25,26,29]. Uranium (U) is another important element primarily used to interpret paleoredox conditions, with stratigraphic variations in U concentrations also linked to sea level fluctuations [67]. An increase in the U concentration under well-oxygenated conditions signifies a phase of a relative sea level fall, whereas a decrease occurs during phases of a sea level rise. Recently, Mansour et al. [15] correlated U trends with Sr/Ca ratios, which typically showed opposite trends compared to Mn and carbonate contents. The lowest U values were consistent with the MFS, while the highest values were indicative of the MRS.

5.3. Sea Level Change and Sequence Stratigraphy of the Quse Formation

Within the Qixiangcuo section, stratigraphic variations in the geochemical data of terrigenous (Ti, Zr, U, and Al, Figure 4) and carbonate proxies (Ca, Sr, and Mn, Figure 5) have led to the subdivision of the upper Pliensbachian–Toarcian interval of the Quse Formation into nine complete third-order transgressive–regressive sequences and one incomplete sequence. The upper Pliensbachian interval is discriminated into two third-order sequences (PSQ1 and PSQ2), while the Toarcian interval comprises seven sequences (TSQ1 to TSQ7), and one incomplete sequence was deposited during the Bajocian (Figure 4, Figure 5 and Figure 6). In the Qixiangcuo section, the Ti, Zr, and U profiles exhibit similar patterns, indicating a coupled relationship among these parameters, which is driven by the response of terrigenous detrital supply to sea level changes (Figure 4). Additionally, the Ti/Al and Zr/Al ratios follow slightly similar trends, suggesting their association with sediment grain size and terrigenous supply [68]. This relationship is further supported by strong linear correlations observed between Ti and Zr (r = 0.998), Ti and U (r = 0.98), and Zr and U (r = 0.99) (Figure 7). Conversely, there is a moderate correlation between the U and TOC contents (r = 0.44, Figure 7) and a strong negative correlation between the U and carbonate contents (r = −0.97, Figure 7). These correlations indicate that the U content primarily reflects changes in terrigenous detrital input in response to sea level variations rather than being controlled by marine organic matter and redox conditions [67]. This suggests that U is a reliable proxy for tracing changes in sea level and sequence stratigraphic reconstructions. However, caution should be taken when using the U concentration as a proxy for tracing sea level changes and sequence stratigraphic reconstructions due to its complex geochemical behavior. Detrital minerals such as clay minerals, quartz, feldspar, and plagioclase are controlled by the weathering processes of parent rocks that erode and transport into a range of depositional environments [69]. These minerals form a major component of both marine and terrestrial sedimentary rocks. Generally, the calcite distribution in the Quse Formation is inversely correlated with the quartz, clay minerals, plagioclase, and feldspar contents (Figure 6, Table 2).
The TST sediments of the stratigraphic sequences in the Quse Formation are characterized by a long-term decline toward minimum values of the Ti, Zr, and U concentrations and/or their ratios Ti/Al and Zr/Al (Figure 4). Such decreasing trends are prominent in most stratigraphic sequences of the Toarcian interval. For example, the TST sediments of TSQ1 show gradual declines in Ti/Al (from 0.047 to 0.043), Zr/Al (from 14.9 to 13.3), Zr (from 50.2 ppm to 24.0 ppm), Ti (from 0.16 wt.% to 0.08 wt.%), and U (from 1 ppm to 0.5 ppm) (Figure 4). The lowest values in these terrigenous detrital proxies are used to identify the maximum landward invasion of the shoreline, marking the MFS. Similar patterns are observed in the TST sediments of TSQ2, TSQ4, and TSQ7 and to some extent in TSQ3, TSQ5, and TSQ6, where decreasing trends in terrigenous detrital elements are consistent [34]. However, the TST sediments of PSQ1 and PSQ2 exhibit stable and/or increasing values of Ti, Zr, and U (Figure 4). This behavior can be attributed to the predominance of carbonate deposition over terrigenous detrital input, as indicated by the pronounced carbonate values (average 74.4 wt.%).
Furthermore, the TST sediments are dominated by decreasing trends in quartz, clay minerals, and plagioclase contents, with the lowest values characterizing the MFS (Figure 6). For example, the TST sediments of TSQ3 show a decline in quartz (from 32.7 wt.% to 18.7 wt.%), clay minerals (from 51.8 wt.% to 29.9 wt.%), and plagioclase (from 7.8 wt.% to 4.9 wt.%) (Figure 6, Table 2). Similar patterns are also observed within the TST sediments of TSQ4, TSQ5, TSQ6, and TSQ7, where the lowest values mark the MFS of these sequences (Figure 6). In contrast, the calcite content shows a typically opposite pattern to phyllosilicate minerals. Within the TST sediments of TSQ3, the calcite content increases from 8.8 wt.% to 46.3 wt.%, indicating a phase of a sea level rise, with the highest value marking the MFS. Similarly, the TST sediments of the stratigraphic sequences TSQ4, TSQ5, TSQ6, and TSQ7 exhibit increasing trends in the calcite content, reaching maximum values at the MFS (Figure 6, Table 2).
In the Qixiangcuo section, the Mn and Mn/Al profiles show trends that are slightly similar to those of the carbonate content, whereas the Sr/Ca ratio exhibits opposite trends across most parts of the studied interval. This observation aligns with a strong positive correlation between Mn/Al and the carbonate content (r = 0.77, Figure 8), suggesting a coupled relationship primarily controlled by changes in terrigenous detrital supply, rates of carbonate production, and sea level fluctuations. The lack of correlations between the Mn and carbonate contents (r = −0.22) and Al (r = 0.20) indicates the complex behavior of Mn sources, which include contributions from oxyhydroxides. Hydrothermal sources, such as submarine volcanism and mid-ocean ridge hydrothermal events, also play a significant role in the Mn supply to marine environments [28,70].
The TST sediments of the Quse Formation are identified based on notable increases in the carbonate content, Mn concentrations, and Mn/Al ratios, contrasted with decreasing trends in Sr/Ca ratios. A typical example is seen in the TST deposits of TSQ3, where significant rises in the carbonate content (from 6.5 wt.% to 35.8 wt.%), Mn (from 0.05 wt.% to 0.12 wt.%), and Mn/Al ratios (from 0.005 to 0.02) are observed, alongside substantial declines in Sr/Ca ratios (from 71.6 to 44.4) (Figure 5). These highest values of Mn, Mn/Al, and carbonate content, compared to the lowest Sr/Ca ratios, indicate the farthest landward invasion of the shoreline, thus identifying the MFS of TSQ3 (Figure 5). Similar pronounced increasing trends in these marine proxies are reported within the Quse Formation, characterizing the TST deposits of PSQ1, PSQ2, TSQ1, TSQ4, TSQ5, and TSQ6 and to some extent TSQ2 and TSQ7 (Figure 5). Although the Sr/Ca ratios generally display a declining pattern across most TST deposits, in a few instances, they show an increasing trend, likely controlled by the availability and distribution of Sr in pelagic carbonates, such as in the upper Pliensbachian bioclastic limestones [22,23,28,33]. For example, the TST deposits show a gradual increasing trend toward the highest Sr/Ca ratios in TSQ1 (Figure 5).
Within the Qixiangcuo section, the RST sediments of the transgressive–regressive sequences developed in the Quse Formation display a long-term rise toward maximum values in terrigenous detrital proxies, such as the Ti, Zr, and U concentrations, as well as their Ti/Al and Zr/Al ratios (Figure 4). Pronounced increasing trends in these elements are consistently observed across several stratigraphic sequences within the studied interval. For example, the RST sediments of PSQ2 illustrate significant increases in the Ti/Al (from 0.038 to 0.047) and Zr/Al ratios (from 12.9 to 14.9), accompanied by gradual rises in Zr (from 31.9 ppm to 50.2 ppm), Ti (from 0.09 wt.% to 0.16 wt.%), and U (from 0.6 ppm to 1 ppm) (Figure 4, Table 1). Similarly, strong increasing trends in terrigenous detrital proxies are evident in the RST deposits of TSQ2, where Ti increases from 0.13 wt.% to 0.42 wt.%, Zr from 55.2 ppm to 139.4 ppm, and U from 1.2 ppm to 2.5 ppm, along with Ti/Al increasing from 0.041 to 0.046 and Zr/Al from 13.2 to 15.4 (Figure 4, Table 1). These trends suggest phases of a sea level fall [15,25,26,29,32,34]. The highest concentrations of these terrigenous detrital proxies are used to identify the maximum basinward shift in the shoreline, marking the MRS of a full sea level cycle. For example, the highest values in terrigenous detrital proxies in PSQ1, PSQ2, TSQ1, TSQ3, TSQ4, and TSQ5 are used to pinpoint the MRSs and thus the sequence boundaries. Furthermore, the RST sediments are characterized by significant increases in quartz, clay minerals, and plagioclase contents, with the highest values consistent with the MRS (Figure 6). The RST sediments of TSQ3 provide a typical example, with increasing values of quartz from 18.7 wt.% to 30.6 wt.%, clay minerals from 29.9 wt.% to 46.9 wt.%, and plagioclase from 4.9 wt.% to 8.3 wt.%. The highest values of these minerals in TSQ3 are consistent with a phase of a sea level fall toward the MRS (Figure 6). Similar patterns are observed within the RST sediments of TSQ4, TSQ5, TSQ6, and TSQ7, where the lowest values imply the MRS of these sequences (Figure 6). Conversely, the calcite content generally decreases in the RST sediments, with the lowest values characterizing the MRS. A typical example is observed within the RST sediments of TSQ4, where the calcite content declines from 50 wt.% to 11.3 wt.%. This decreasing calcite content is further recorded in the RST sediments of TSQ3, TSQ5, TSQ6, and TSQ7 (Figure 6).
The RST sediments of the Quse Formation are characterized by remarkable decreases in Mn concentrations, Mn/Al ratios, and carbonate contents, compared to notable increases in Sr/Ca ratios. A typical example is observed in the RST deposits of TSQ3, where pronounced declining trends are seen in the carbonate content (from 35.8 wt.% to 4.1 wt.%), Mn concentration (from 0.12 wt.% to 0.07 wt.%), and Mn/Al ratios (from 0.02 to 0.007), as opposed to marked increases in Sr/Ca ratios (from 44.4 to 66.0) (Figure 5). The lowest values of the carbonate content, Mn, and Mn/Al ratios, juxtaposed with the highest Sr/Ca ratios, are interpreted as indicative of a phase of a sea level fall toward the farthest basinward shift in the shoreline, thus identifying the MFS of TSQ3 (Figure 5). Further evidence of decreasing marine elemental proxies is observed during the deposition of RST sediments in PSQ1, PSQ2, TSQ1, TSQ2, TSQ4, TSQ5, TSQ6, and TSQ7 (Figure 5).
Recently, Haq [52] conducted a detailed re-evaluation of Jurassic sea level changes and associated third-order stratigraphic sequences, based on accurate chronostratigraphic data. In the Qixiangcuo section, the sequence stratigraphic framework and carbon isotope excursion events of the Quse Formation alongside the global sea level curve are shown (Figure 9). Although bulk carbonate carbon isotope (δ13Ccarb) data are influenced by various factors, such as terrestrial input, organic matter, seawater dissolved inorganic carbon, and diagenesis, they can still provide insights into the paleo-seawater isotope signature and serve as a proxy for sea level changes [24,28,32]. Specifically, positive δ13Ccarb trends may indicate phases of a relative sea level rise and vice versa [24,32]. Since the upper Pliensbachian–Toarcian δ13Ccarb profile of the Quse Formation precisely correlates with coeval sedimentary successions worldwide [44], it offers a reliable chemostratigraphic tool for sea level and sequence stratigraphic correlations, particularly given the scarcity of ammonoid fossils in the Qixiangcuo section. For the Quse Formation sequences, the upper Pliensbachian sequences PSQ1 and PSQ2 may correspond with the uppermost Pliensbachian sequences JPl16 and JPl17 of Haq [52], respectively. The Toarcian sequence stratigraphy in the global sea level chart is subdivided into ten third-order sequences [52]. Among these, sequences JTo1 to JTo7 can be correlated with TSQ1 to TSQ7 of the Quse Formation in the study area. This correlation is supported by the presence of age-diagnostic ammonites, including Harpoceras sp., Eleganticeras sp., and Cleviceras sp., which are indicative of an early Toarcian age. These ammonoids are synchronous with the early Toarcian ammonite zones Harpoceras falciferum and Harpoceras bifrons of the Jurassic chronostratigraphic chart [52]. However, the long-term global sea level rise contrasts the δ13Ccarb curve of the Quse Formation, which shows significant negative excursions during the early Toarcian (Figure 9). In the Northern Qiangtang Basin, the oil shales of the Quse Formation in the Bilong Co section, which were deposited during the T-OAE, are further subdivided into two third-order transgressive–regressive sequences (QuSQ1 and QuSQ2), bounded by a fault surface at their upper boundary [15].
Paleogeographic conditions played a prominent role in the development of the transgressive–regressive sequences of the Quse Formation in the Southern Qiangtang Basin. However, the Triassic–early Jurassic paleogeography in Tibet is poorly constrained. During the late Triassic, the Southern Qiangtang Basin underwent a tectonic inversion and subsidence, driven by complex intracontinental rifting [42]. This was followed by a great expansion of the Bangong–Nujiang Ocean (≥4000 km in width) that took place between the Southern Qiangtang Basin and the Lhasa Block [42,71]. At this time, the Qiangtang Basin and Lhasa Block were located close to 10° S, drifting rapidly toward northern latitudes. During the early Jurassic, the Southern Qiangtang Basin and the Amdo microcontinent were separated by back-arc rifting, leading to significant changes in the paleogeography of the Qiangtang Basin and the development of the Dongqiao–Amdo open-shelf seaway [6,72,73]. High-pressure metamorphic and arc-related magmatic rocks provide evidence that the lithosphere of the Bangong–Nujiang Ocean subducted northward during the early Jurassic (around 190 Ma) [72,74]. This resulted in intense structural deformation and subsidence of the Southern Qiangtang Basin, likely controlling the cyclic changes in sea level and deposition of the proposed stratigraphic sequences.

6. Conclusions

A high-resolution sampling from the upper Pliensbachian–Toarcian strata of the Quse Formation in the Qixiangcuo section of the Southern Qiangtang Basin was conducted to assess the TOC content and bulk geochemical and mineralogical composition. The stratigraphic variations in the bulk-rock elemental and mineralogical composition provided detailed insights into the chemostratigraphic expression in response to sea level fluctuations and sequence stratigraphy. Based on specific terrigenous and marine elements, such as Al, Zr, Ti, U, Ca, Sr, and Mn and their ratios, and the mineralogical composition, the studied interval of the Quse Formation is subdivided into nine complete third-order transgressive–regressive sequences and one incomplete sequence. The upper Pliensbachian interval encompasses two sequences (PSQ1 and PSQ2), while the Toarcian interval includes seven sequences (TSQ1 to TSQ7). Terrigenous detrital proxies, such as Zr, Zr/Al, Ti, Ti/Al, and U, exhibited slightly similar patterns, with relative increases together with an increase in quartz and plagioclase, indicating phases of a relative sea level fall and the deposition of RST sediments, while their highest values within a complete cycle were used to identify the MRS. This is evident in higher-resolution sequences, such as TSQ3 to TSQ7. Conversely, declining trends in these proxies marked a relative sea level rise and the deposition of TST sediments, with their lowest values indicating the MFS. Marine elemental proxies, such as the carbonate content, Mn concentration, and Mn/Al ratio, exhibited specific increasing trends, indicative of phases of a relative sea level rise and TST sediments, contrasting with Sr/Ca, which showed an inverse pattern. Decreasing values of the carbonate content, Mn concentration, and Mn/Al ratio versus increasing Sr/Ca ratios characterized phases of a relative sea level fall and RST sediments. MFSs across most stratigraphic sequences were identified based on maximal increases in the carbonate content, Mn concentration, and Mn/Al ratio juxtaposed with minimal values of terrigenous detrital proxies.

Author Contributions

Conceptualization, C.J. and A.M.; methodology, C.J., Y.C. and Z.W.; software, A.M.; validation, C.J., A.M. and M.W.; formal analysis, A.M.; investigation, C.J., A.M. and M.W.; resources, C.J., Y.C. and M.W.; data curation, C.J.; writing—original draft preparation, C.J. and A.M.; writing—review and editing, C.J., A.M., Y.C., Z.W. and M.W.; visualization, C.J.; supervision, C.J.; project administration, C.J., Y.C. and Z.W.; funding acquisition, C.J., A.M. and M.W. All authors have read and agreed to the published version of the manuscript.

Funding

The authors declare the financial support received to conduct this research project, authorship, and publications. This work was funded by the Key Research and Development Program (XZ202403ZY0040), the Central Government Guided Local Scientific and Technological Development funding project (XZ202401YD0006), the National Natural Science Foundation of China (grant nos. U24A20597 and W2433105), the Deep Earth Probe and Mineral Resources Exploration—National Science and Technology Major Project (grant no. 2024ZD1001005), and the China Geological Survey (DD20230024 and DD20230315). MW acknowledges support by UNESCO IGCP 710 and the Austrian Academy of Sciences, International Programs. Open Access Funding by the University of Vienna.

Data Availability Statement

The data presented in this study are available in the text in Table 1 and Table 2.

Conflicts of Interest

The authors declare no conflict of interest.

References

  1. Jenkyns, H.C. The early Toarcian (Jurassic) Anoxic event: Stratigraphic, sedimentary, and geochemical evidence. Am. J. Sci. 1988, 288, 101–151. [Google Scholar] [CrossRef]
  2. Pálfy, J.; Smith, P.L. Synchrony between Early Jurassic extinction, oceanic anoxic event, and the Karoo-Ferrar flood basalt volcanism. Geology 2000, 28, 747–750. [Google Scholar] [CrossRef]
  3. Svensen, H.H.; Planke, S.; Chevallier, L.; Malthe-Sørenssen, A.; Corfu, F.; Jamtveit, B. Hydrothermal venting of greenhouse gases triggering Early Jurassic global warming. Earth Planet. Sci. Lett. 2007, 256, 554–566. [Google Scholar] [CrossRef]
  4. Remírez, M.N.; Algeo, T.J. Carbon-cycle changes during the Toarcian (Early Jurassic) and implications for regional versus global drivers of the Toarcian oceanic anoxic event. Earth-Sci. Rev. 2020, 209, 103283. [Google Scholar] [CrossRef]
  5. Kemp, D.B.; Suan, G.; Fantasia, A.; Jin, S.; Chen, W. Global organic carbon burial during the Toarcian oceanic anoxic event: Pattern and controls. Earth-Sci. Rev. 2022, 231, 104086. [Google Scholar] [CrossRef]
  6. Xia, G.Q.; Mansour, A. Paleoenvironmental changes during the early Toarcian Oceanic Anoxic Event: Insights into organic carbon distribution and controlling mechanisms in the eastern Tethys. J. Asian. Earth Sci. 2022, 237, 105344. [Google Scholar] [CrossRef]
  7. Fu, X.; Wang, J.; Zeng, S.; Feng, X.; Wang, D.; Song, C. Continental weathering and palaeoclimatic changes through the onset of the Early Toarcian oceanic anoxic event in the Qiangtang Basin, eastern Tethys. Palaeogeogr. Palaeoclimatol. Palaeoecol. 2017, 487, 241–250. [Google Scholar] [CrossRef]
  8. Kemp, D.B.; Selby, D.; Izumi, K. Direct coupling between carbon release and weathering during the Toarcian oceanic anoxic event. Geology 2020, 48, 976–980. [Google Scholar] [CrossRef]
  9. Ruebsam, W.; Al-Husseini, M. Calibrating the Early Toarcian (Early Jurassic) with stratigraphic black holes (SBH). Gondwana Res. 2020, 82, 317–336. [Google Scholar] [CrossRef]
  10. Nie, Y.; Fu, X.G.; Liang, J.T.; Wei, H.Y.; Chen, Z.A.; Lin, F.; Zeng, S.Q.; Wu, Y.H.; Zou, Y.; Mansour, A. The Toarcian Oceanic Anoxic Event in a shelf environment (Eastern Tethys): Implications for weathering and redox conditions. Sediment. Geol. 2023, 455, 106476. [Google Scholar] [CrossRef]
  11. Mattioli, E.; Pittet, B.; Suan, G.; Mailliot, S. Calcareous nannoplankton changes across the early Toarcian oceanic anoxic event in the western Tethys. Paleoceanography 2008, 23, PA3208. [Google Scholar] [CrossRef]
  12. Caruthers, A.H.; Smith, P.L.; Gröcke, D.R. The Pliensbachian–Toarcian (Early Jurassic) extinction, a global multi-phased event. Palaeogeogr. Palaeoclimatol. Palaeoecol. 2013, 386, 104–118. [Google Scholar] [CrossRef]
  13. Röhl, H.J.; Schmidt-Röhl, A.; Oschmann, W.; Frimmel, A.; Schwark, L. The Posidonia Shale (Lower Toarcian) of SW-Germany: An oxygen-depleted ecosystem controlled by sea level and palaeoclimate. Palaeogeogr. Palaeoclimatol. Palaeoecol. 2001, 165, 27–52. [Google Scholar] [CrossRef]
  14. Ruebsam, W.; Mayer, B.; Schwark, L. Cryosphere carbon dynamics control early Toarcian global warming and sea level evolution. Glob. Planet. Change 2019, 172, 440–453. [Google Scholar] [CrossRef]
  15. Mansour, A.; Xia, G.; Fu, X.; Wang, J. Sea level changes and sequence stratigraphy of the lower-middle Jurassic Quse and Sewa formations in the Qiangtang Basin, central Tibet: Geochemical and palynological perspectives. Intr. Geol. Rev. 2023, 65, 2879–2899. [Google Scholar] [CrossRef]
  16. Hesselbo, S.P.; Jenkyns, H.C.; Duarte, L.V.; Oliveira, L.C.V. Carbon-isotope record of the Early Jurassic (Toarcian) Oceanic Anoxic Event from fossil wood and marine carbonate (Lusitanian Basin, Portugal). Earth Planet. Sci. Lett. 2007, 253, 455–470. [Google Scholar] [CrossRef]
  17. Xu, W.; Ruhl, M.; Jenkyns, H.C.; Hesselbo, S.P.; Riding, J.B.; Selby, D.; Naafs, B.D.A.; Weijers, J.W.H.; Pancost, R.D.; Tegelaar, E.W.; et al. Carbon sequestration in an expanded lake system during the Toarcian oceanic anoxic event. Nat. Geosci. 2017, 10, 129–134. [Google Scholar] [CrossRef]
  18. Hay, W.W.; DeConto, R.M.; de Boer, P.L.; Flögel, S.; Song, Y.; Stepashko, A. Possible solutions to several enigmas of Cretaceous climate. Inter. J. Earth Sci. 2019, 108, 587–620. [Google Scholar] [CrossRef]
  19. Gurnis, M. Phanerozoic marine inundation of continents driven by dynamic topography above subducting slabs. Nature 1993, 364, 589–593. [Google Scholar] [CrossRef]
  20. Spasojevic, S.; Gurnis, M. Sea level and vertical motion of continents from dynamic Earth models since the Late Cretaceous. Am. Assoc. Pet. Geol. Bull. 2012, 9611, 2037–2064. [Google Scholar] [CrossRef]
  21. Sames, B.; Wagreich, M.; Wendler, J.E.; Haq, B.U.; Conrad, C.P.; Melinte-Dobrinescu, M.C.; Hu, X.; Wendler, I.; Wolfgring, E.; Yilmaz, I.Ö.; et al. Review: Short-term sea-level changes in a greenhouse world—A view from the Cretaceous. Palaeogeogr. Palaeoclimatol. Palaeoecol. 2016, 441, 393–411. [Google Scholar] [CrossRef]
  22. Li, L.; Keller, G.; Adatte, T.; Stinnesbeck, W. Late Cretaceous sea level changes in Tunisia: A multidisciplinary approach. J. Geol. Soc. Lond. 2000, 157, 447–458. [Google Scholar] [CrossRef]
  23. Jarvis, I.; Murphy, A.M.; Gale, A.S. Geochemistry of pelagic and hemipelagic carbonates: Criteria for identifying systems tracts and sea-level change. J. Geol. Soci. Lond. 2001, 158, 685–696. [Google Scholar] [CrossRef]
  24. Jarvis, I.; Mabrouk, A.; Moody, R.T.J.; Murphy, A.M.; Sandman, R.I. Applications of carbon isotope and elemental (Sr/Ca, Mn) chemostratigraphy to sequence analysis: Sea-level change and the global correlation of pelagic carbonates. In Geology of East Libya; Salem, M.J., El-Hawat, A.S., Eds.; Earth Science Society of Libya: Tripoli, Libya, 2008; pp. 369–396. [Google Scholar]
  25. Ver Straeten, C.A.; Brett, C.E.; Sageman, B.B. Mudrock sequence stratigraphy: A multi-proxy (sedimentological, paleobiological and geochemical) approach, Devonian Appalachian Basin. Palaeogeogr. Palaeoclimatol. Palaeoecol. 2011, 304, 54–73. [Google Scholar] [CrossRef]
  26. Ratcliffe, K.T.; Wright, A.M.; Spain, D.R. Unconventional methods for unconventional plays: Using elemental data to understand shale resource plays. Pet. Explor. Soc. Aust. News Res. 2012, 117, 50–54. [Google Scholar]
  27. Sano, J.L.; Ratcliffe, K.T.; Spain, D.R. Chemostratigraphy of the Haynesville Shale. In Geology of the Hanyesville Gas Shale in East Texas and West Louisiana, U.S.A.; Hammes, U., Gales, J., Eds.; American Association of Petroleum Geologists Memoir: Tulsa, OK, USA, 2013; Volume 105, pp. 137–154. [Google Scholar]
  28. Le Callonnec, L.; Renard, M.; De Rafélis, M.; Minoletti, F.; Beltran, C.; Du Chene, R.J. Evolution of the trace element contents (Sr and Mn) of hemipelagic carbonates from the Zumaia Paleocene section (Gipuzkoa, Spain): Implications for the knowledge of seawater chemistry during the Selandian. Bull. Société Géologique France 2014, 185, 413–435. [Google Scholar] [CrossRef]
  29. Turner, B.W.; Tréanton, J.A.; Slatt, R.M. The use of chemostratigraphy to refine ambiguous sequence stratigraphic correlations in marine mudrocks. An example from the Woodford Shale, Oklahoma, USA. J. Geol. Soc. 2016, 173, 854–868. [Google Scholar] [CrossRef]
  30. Harris, N.B.; McMillan, J.M.; Knapp, L.J.; Mastalerz, M. Organic matter accumulation in the Upper Devonian Duvernay Formation, Western Canada Sedimentary Basin, from sequence stratigraphic analysis and geochemical proxies. Sediment. Geol. 2018, 376, 185–203. [Google Scholar] [CrossRef]
  31. Wagreich, M.; Koukal, V. The pelagic archive of short-term sea-level change in the Cretaceous: A review of proxies linked to orbital forcing. In Cretaceous Climate Events and Short-Term Sea-Level Changes; Geological Society, Special Publications: London, UK, 2019; p. 498. [Google Scholar] [CrossRef]
  32. Mansour, A.; Gentzis, T.; Wagreich, M.; Tahoun, S.S.; Elewa, A.M.T. Short-term sea level changes of the upper cretaceous carbonates: Calibration between palynomorphs composition, inorganic geochemistry and stable isotopes. Minerals 2020, 10, 1099. [Google Scholar] [CrossRef]
  33. Mansour, A.; Wagreich, M.; Ahmed, M.S.; Tahoun, S.S.; Gentzis, T. Short-term Sea-Level changes and sequence stratigraphy of the mid-cretaceous Kharita Formation reservoirs in Egypt: Insights from geochemical and palynological data. ACS Omega 2022, 7, 27573–27586. [Google Scholar] [CrossRef]
  34. LaGrange, M.T.; Konhauser, K.O.; Catuneanu, O.; Harris, B.S.; Playter, T.L.; Gingras, M.K. Sequence stratigraphy in organic-rich marine mudstone successions using chemostratigraphic datasets. Earth-Sci. Rev. 2020, 203, 103137. [Google Scholar] [CrossRef]
  35. Fu, X.; Wang, J.; Wen, H.; Song, C.; Wang, Z.; Zeng, S.; Feng, X.; Wei, H. A Toarcian Ocean Anoxic Event record from an open-ocean setting in the eastern Tethys: Implications for global climatic change and regional environmental perturbation. Sci. China Earth Sci. 2021, 64, 1860–1872. [Google Scholar] [CrossRef]
  36. Ma, A.; Hu, X.; Garzanti, E.; Boudagher-Fadel, M.; Xue, W.; Han, Z.; Wang, P. Paleogeographic and tectonic evolution of Mesozoic Qiangtang basins (Tibet). Tectonophysics 2023, 862, 229957. [Google Scholar] [CrossRef]
  37. Wang, Y.S.; Zhang, S.Q.; Xie, Y.H.; Li, C.Z.; Yu, X.W.; Zheng, C.Z.; Feng, D.C.; Wang, Z.; Duan, J.X.; Sun, Z.G.; et al. 1:250000 Regional Geological Survey Report of the People’s Republic of China (Angdarco Sheet); Publishing House of China University of Geosciences: Beijing, China, 2012. [Google Scholar]
  38. Li, C. The Longmucuo-Shuanghu-Lancangjiang Plate suture and the north boundary of distribution of the Gondwana facies of the Permo-Carboniferous System in northern Xizang, China. J. Change Coll. Geol. 1987, 17, 155–166. [Google Scholar]
  39. Song, P.P.; Ding, L.; Li, Z.Y.; Lippert, P.C.; Yue, Y.H. An early bird from Gondwana: Paleomagnetism of Lower Permian lavas from northern Qiangtang (Tibet) and the geography of the Paleo-Tethys. Earth Planet. Sci. Lett. 2017, 475, 119–133. [Google Scholar] [CrossRef]
  40. Wang, J.; Fu, X.; Wei, H.; Zheng, B.; Wang, Z.; Shen, L.; Mansour, A. An overview of the Qiangtang Basin: Geology, hydrocarbon resources and the role of the Tethyan evolution. J. Asian Earth Sci. 2024, 266, 106128. [Google Scholar] [CrossRef]
  41. Fang, X.; Song, C.; Yan, M.; Zan, J.; Liu, C.; Sha, J.; Zhang, W.; Zeng, Y.; Wu, S.; Zhang, D. Mesozoic litho- and magneto-stratigraphic evidence from the central Tibetan Plateau for megamonsoon evolution and potential evaporites. Gondwana Res. 2016, 37, 110–129. [Google Scholar] [CrossRef]
  42. Wang, J.; Fu, X.G.; Wei, H.Y.; Shen, L.J.; Wang, Z.; Li, K.Z. Late Triassic basin inversion of the Qiangtang Basin in northern Tibet: Implications for the closure of the Paleo-Tethys and expansion of the Neo-Tethys. J. Asian Earth Sci. 2022, 227, 105–119. [Google Scholar] [CrossRef]
  43. Zhao, Z.Z.; Li, Y.T.; Ye, H.F.; Zhang, Y.W. Stratum in the Qianhai-Xizang Plateau; Science Press: Beijing, China, 2001; pp. 234–235, (In Chinese with English abstract). [Google Scholar]
  44. Ji, C.; Chen, Y.; Wu, Z.; Wang, Q.; Shen, H.; Chen, C.; Xia, G.; Ahmed, M.S.; Ruebsam, W.; Mansour, A. High-resolution record of Pliensbachian-Toarcian and early Toarcian carbon isotope events in the eastern Tethys. Palaeogeogr. Palaeoclimatol. Palaeoecol. 2025, 662, 112766. [Google Scholar] [CrossRef]
  45. Chandler, R.B.; Whicher, J.; Grulke, W.; Cowap, A. The Middle Jurassic stephanoceratid ammonite Kumatostephanus from Dorset and Somerset, UK, and its evolution. Geobios 2013, 46, 285–297. [Google Scholar] [CrossRef]
  46. Howarth, M.K. The Ammonite Family Hildoceratidae in the Lower Jurassic of Britain. Part 2. In Monograph of the Palaeontographical Society; Palaeontographical Society: London, UK, 1992; Volume 146, pp. 107–200. [Google Scholar]
  47. Jochum, K.P.; Willbold, M.; Raczek, I.; Stoll, B.; Herwig, K. Chemical characterization of the USGS reference glasses GSA-1G, GSC-1G, GSD-1G, GSE-1G, BCR-2G, BHVO-2G and BIR-1G using EPMA, ID-TIMS, ID-ICP-MS and LA-ICP-MS. Geostand. Geoanal. Res. 2005, 29, 285–302. [Google Scholar] [CrossRef]
  48. Catuneanu, O. Sequence stratigraphy in the context of the ‘modeling revolution’. Mar. Pet. Geol. 2020, 116, 104309. [Google Scholar] [CrossRef]
  49. Vail, P.R.; Mitchum, R.M., Jr.; Thompson, S., III. Seismic stratigraphy and global changes of sea-level, Part 3: Relative changes of sea-level from coastal onlap. In Seismic Stratigraphy—Applications to Hydrocarbon Exploration; Payton, C.E., Ed.; American Association of Petroleum Geologists Memoir: Tulsa, OK, USA, 1977; Volume 26, pp. 63–81. [Google Scholar]
  50. Posamentier, H.W.; Vail, P.R. Eustatic controls on clastic deposition. II. Sequence and systems tract models. In Sea Level Changes: An Integrated Approach; Wilgus, C.K., Hastings, B.S., Kendall, C.G.S.C., Posamentier, H.W., Ross, C.A., VanWagoner, J.C., Eds.; The Society for Sedimentary Geology (SEPM), Special Publication: Tulsa, OK, USA, 1988; Volume 42, pp. 125–154. [Google Scholar]
  51. Posamentier, H.W.; Allen, G.P. Siliciclastic sequence stratigraphy: Concepts and applications. SEPM Con. Sedimentol. Paleontol. 1999, 7, 210. [Google Scholar]
  52. Haq, B.U. Jurassic Sea-Level Variations: A Reappraisal. Geol. Soc. Amer. Today 2018, 28, 4–10. [Google Scholar] [CrossRef]
  53. Catuneanu, O.; Zecchin, M. High-resolution sequence stratigraphy of clastic shelves II: Controls on sequence development. Mar. Petrol. Geol. 2013, 39, 26–38. [Google Scholar] [CrossRef]
  54. Csato, I.; Catuneanu, O.; Granjeon, D. Millennial-scale sequence stratigraphy: Numerical simulation with Dionisos. J. Sediment. Res. 2014, 84, 394–406. [Google Scholar] [CrossRef]
  55. Catuneanu, O. Sequence stratigraphy of clastic systems: Concepts, merits, and pitfalls. J. Afr. Earth Sci. 2002, 351, 1–43. [Google Scholar] [CrossRef]
  56. Catuneanu, O.; Galloway, W.E.; Kendall, C.G.S.C.; Miall, A.D.; Posamentier, H.W.; Strasser, A.; Tucker, M.E. Sequence stratigraphy: Methodology and nomenclature. Newsl. Stratigr. 2011, 44, 173–245. [Google Scholar] [CrossRef]
  57. Johnson, J.G.; Murphy, M.A. Time-rock model for Siluro-Devonian continental shelf, western United States. Geol. Soc. Am. Bull. 1984, 95, 13492. [Google Scholar] [CrossRef]
  58. Embry, A.F.; Johannessen, E.P. T-R sequence stratigraphy, facies analysis and reservoir distribution in the uppermost Triassic-Lower Jurassic succession, western Sverdrup Basin, Arctic Canada. In Arctic Geology and Petroleum Potential; Vorren, T.O., Bergsager, E., Dahl-Stamnes, O.A., Holter, E., Johansen, B., Lie, E., Lund, T.B., Eds.; Elsevier: Amsterdam, The Netherlands, 1992; Volume 2, pp. 121–146. [Google Scholar]
  59. Galloway, W.E. Accommodation and the sequence stratigraphic paradigm: Reservoir. Can. Soc. Pet. Geol. 2004, 315, 9–10. [Google Scholar]
  60. Wang, J.; Tan, F.W.; Wang, X.L.; Du, B.W.; Chen, M. The sedimentary and tectonic characteristics of Qiangtang Basin in the Early Jurassic in northern Xizang (Tibet). Acta Sedimentol. Sin. 2004, 22, 198–205, (In Chinese with English abstract). [Google Scholar]
  61. Van der Weijden, C.H. Pitfalls of normalization of marine geochemical data using a common divisor. Mar. Geol. 2002, 184, 167–187. [Google Scholar] [CrossRef]
  62. Reinhard, C.T.; Planavsky, N.J.; Robbins, L.J.; Partin, C.A.; Gill, B.C.; Lalonde, S.V.; Bekker, A.; Konhauser, K.O.; Lyons, T.W. Proterozoic ocean redox and biogeochemical stasis. Proc. Natl. Acad. Sci. USA 2013, 110, 5357–5362. [Google Scholar] [CrossRef] [PubMed]
  63. Schlanger, S.O. Strontium storage and release during deposition and diagenesis of marine carbonates release to sea-level variations. In Physical and Chemical Weathering in Geochemical Cycles; Lerman, A., Meybeck, M., Eds.; Kluwer Academic: Dordrecht, The Netherlands, 1988; pp. 323–339. [Google Scholar]
  64. Calvert, S.; Bustin, R.; Ingall, E. Influence of water column anoxia and sediment supply on the burial and preservation of organic carbon in marine shales. Geochim. Cosmochim. Acta 1996, 60, 1577–1593. [Google Scholar] [CrossRef]
  65. Renard, M.; Rafélis, M.D.; Emmanuel, L.; Beltran, C.; Moullade, M.; Tronchetti, G. Fluctuations of sea-water chemistry during Gargasian (Middle Aptian) time. Data from trace element content (Mg, Sr, Mn, Fe) in hemipelagic carbonates from La Marcouline Quarry (Cassis, SE France). Carnets Géol. 2007, 3, 1–28. [Google Scholar] [CrossRef]
  66. Ratcliffe, K.T.; Wright, A.M.; Hallsworth, C.; Morton, A.; Zaitlin, B.A.; Potocki, D.; Wray, D. An example of alternative correlation techniques in a low-accommodation setting, nonmarine hydrocarbon system: The (Lower Cretaceous) Mannville Basal Quartz succession of southern Alberta. Am. Assoc. Pet. Geol. Bull. 2004, 88, 1419–1432. [Google Scholar] [CrossRef]
  67. Calvert, S.E.; Pedersen, T.F. Elemental proxies for palaeoclimatic and palaeoceanographic variability in marine sediments: Interpretation and application. In Proxies in Late Cenozoic Paleoceanography, Developments in Marine Geology; Hillaire, C., de Vernal, A., Eds.; Elsevier: Amsterdam, The Netherlands, 2007; pp. 568–637. [Google Scholar]
  68. Taylor, S.R.; McLennan, S.M. The Continental Crust: Its Composition and Evolution; Blackwell Scientific Publications: Oxford, UK, 1985; pp. 1–311. [Google Scholar]
  69. Perry, C.; Taylor, K. Environmental Sedimentology; Blackwell: Oxford, UK, 2007; p. 441. [Google Scholar]
  70. Thomson, J.; Higgs, N.C.; Jarvis, I.; Hydes, D.J.; Colley, S.; Wilson, T.R.S. The behaviour of manganese in Atlantic carbonate sediments. Geochim. Cosmochim. Acta 1986, 50, 1807–1818. [Google Scholar] [CrossRef]
  71. Hu, X.; Ma, A.; Xue, W.; Garzanti, E.; Cao, Y.; Li, S.-M.; Sun, G.; Lai, W. Exploring a lost ocean in the Tibetan Plateau: Birth, growth, and demise of the Bangong-Nujiang Ocean. Earth-Sci. Rev. 2022, 229, 104031. [Google Scholar] [CrossRef]
  72. Guynn, J.; Kapp, P.; Pullen, A.; Heizler, M.; Gehrels, G.; Ding, L. Tibetan basement rocks near Amdo reveal “missing” Mesozoic tectonism along the Bangong suture, central Tibet. Geology 2006, 34, 505–508. [Google Scholar] [CrossRef]
  73. Zhang, X.R.; Shi, R.D.; Huang, Q.S.; Liu, D.L.; Gong, X.H.; Chen, S.S.; Wu, K.; Yi, G.D.; Sun, Y.L.; Ding, L. Early Jurassic high-pressure metamorphism of the Amdo terrane, Tibet: Constraints from zircon U–Pb geochronology of mafic granulites. Gondwana Res. 2014, 26, 975–985. [Google Scholar] [CrossRef]
  74. Wang, B.-D.; Wang, L.-Q.; Chung, S.-L.; Chen, J.-L.; Yin, F.-G.; Liu, H.; Li, X.-B.; Chen, L.-K. Evolution of the Bangong–Nujiang Tethyan ocean: Insights from the geochronology and geochemistry of mafic rocks within ophiolites. Lithos 2016, 245, 18–33. [Google Scholar] [CrossRef]
Figure 3. Stratigraphic chart illustrating the geochemical composition of TOC and carbon isotopes of bulk carbonates of the Pliensbachian–Toarcian Quse Formation in the Qixiangcuo section. Light yellow highlights show intervals corresponding to the Pliensbachian–Toarcian boundary and early Toarcian carbon isotope curve [44]. f? = fault. Aa.-Baj. = Aalenian–Bajocian.
Minerals 15 00440 g003
Figure 4. Stratigraphic distribution of the geochemical composition of terrigenous detrital proxy data, including Ti, Zr, and U, as well as their Al-normalized ratios used to reconstruct the sequence stratigraphic framework within the upper Pliensbachian–Toarcian Quse Formation in the Qixiangcuo section. Colored solid lines of geochemical proxies smoothed using a 3-point moving average. Light yellow highlights show intervals corresponding to the Pliensbachian–Toarcian boundary and early Toarcian carbon isotope excursion events. For lithology, the reader can refer to the legend of Figure 2. Abbreviations: inco. SQ = incomplete sequence. f? = fault. Aa.-Baj. = Aalenian–Bajocian.
Minerals 15 00440 g004
Figure 5. Stratigraphic distribution chart showing the lithology, chronostratigraphy, and geochemical composition of TOC, carbonate content, and Mn and Sr elements and their ratios used to reconstruct the sequence stratigraphic framework of the Pliensbachian–Toarcian Quse Formation in the Qixiangcuo section. Except for TOC, the colored solid lines of the carbonate content and other elements were smoothed using a 3-point moving average. Light yellow highlights (to the left column of samples) show intervals corresponding to the Pliensbachian–Toarcian boundary and early Toarcian events [44]. For lithology, the reader can refer to the legend of Figure 2. Abbreviations: inco. SQ = incomplete sequence. f? = fault. Aa.-Baj. = Aalenian–Bajocian.
Minerals 15 00440 g005
Figure 6. Stratigraphic distribution of the mineralogical composition, including quartz, calcite, clay minerals, and plagioclase used to reconstruct the sequence stratigraphic framework within the upper Pliensbachian–Toarcian Quse Formation in the Qixiangcuo section. Light yellow highlights show intervals corresponding to the Pliensbachian–Toarcian boundary and early Toarcian carbon isotope excursion events. For lithology, the reader can refer to the legend of Figure 2. Abbreviations: inco. SQ = incomplete sequence. f? = fault. Aa.-Baj. = Aalenian–Bajocian.
Minerals 15 00440 g006
Figure 7. Cross-plots between U concentrations versus Ti (A), Zr (B), TOC content (C), and carbonate content (D) for the upper Pliensbachian–Toarcian samples from the Quse Formation in the Qixiangcuo section. These plots are used to examine the relationship between the U concentration and terrigenous material, organic matter, and carbonate contents, helping to elucidate the sources of U in the sediments of the studied succession.
Minerals 15 00440 g007
Figure 8. Cross-plots between the Mn/Al ratio and carbonate content (A) and Mn versus Al concentrations (B) for the upper Pliensbachian–Toarcian samples from the Quse Formation in the Qixiangcuo section. These plots are used to examine the relationship between the Mn and marine carbonate contents and the terrestrial-derived Al concentration to detect Mn sources in the sediments of the studied succession.
Minerals 15 00440 g008
Figure 9. Sequence stratigraphic framework (this study) and carbon isotope curve [44] of the upper Pliensbachian–Toarcian Quse Formation in the Qixiangcuo section and correlation to global sea level curve and third-order sequences of Haq [52]. Dashed lines of the Quse Formation sequences indicate the possible correlation with the global sequences. Abbreviations: inco. SQ = incomplete sequence. Aa.-Baj. = Aalenian–Bajocian.
Minerals 15 00440 g009
Table 1. The geochemical composition of major and trace elements and ratios used to delineate the third-order transgressive–regressive sequences of the Quse Formation within the Southern Qiangtang Basin.
SamplesTOCSiO2Al2O3CaCO3TiTi/AlZrZr/AlUSr/CaMnMn/Al
wt.%wt.%wt.%wt.%wt.%ppmppmwt.%
QX1990.1624.086.1459.130.160.04848.0014.770.9944.210.1150.035
QX1970.1924.077.3957.830.170.04454.5513.951.1039.380.0840.021
QX1940.2232.8611.5539.350.250.04179.9813.091.4938.900.0500.008
QX1910.2732.5912.4031.880.290.04493.1914.201.8133.900.0480.007
QX1880.1416.252.8772.960.070.04521.4214.080.5749.000.0710.047
QX1850.1855.4618.905.330.430.043144.7314.472.4482.510.0810.008
QX1830.2537.1312.1335.190.270.04288.1313.721.6443.840.1510.024
QX1810.2453.7817.477.460.440.048145.5415.742.4765.630.0980.011
QX1790.2937.6611.4436.850.270.04485.1314.071.6846.500.1650.027
QX1770.1952.9518.019.920.420.044137.5714.432.2957.300.0730.008
QX1750.3854.3715.9210.440.400.048134.2515.942.3054.630.0960.011
QX1730.1955.0515.3812.340.360.044123.1815.131.9853.950.0940.012
QX1710.2854.0518.278.670.430.045145.7315.072.3954.260.0990.010
QX1690.1755.2017.648.220.430.046148.5615.922.3657.870.0730.008
QX1670.2356.1815.4810.590.340.042119.4614.581.9757.230.0870.011
QX1660.2255.2416.549.390.390.045133.3415.242.2059.160.0770.009
QX1640.1953.4317.959.270.410.044144.2515.182.4557.410.0690.007
QX1620.2254.4518.128.530.420.044140.5714.662.3359.670.0680.007
QX1600.1353.4217.7310.100.400.043135.2414.412.3158.720.0690.007
QX1580.1345.3615.7821.460.370.044121.3614.532.0849.790.0910.011
QX1560.1236.4112.1037.990.280.04489.2513.931.5747.440.1100.017
QX1540.1748.9017.4814.560.390.042130.5014.112.2951.120.0670.007
QX1520.1852.7117.949.970.390.042138.0914.542.2958.140.0570.006
QX1490.2051.2417.5911.810.390.042132.8114.272.2152.920.0680.007
QX1470.2454.1417.609.180.410.044136.8914.702.2252.650.0600.006
QX1450.2750.0416.3716.060.380.044124.5714.382.0049.660.1000.012
QX1430.1035.6911.7539.310.260.04383.0613.361.4447.430.1430.023
QX1410.1138.5812.8933.820.300.04494.1213.791.6347.540.1310.019
QX1390.0943.6014.1425.920.330.044105.0514.041.7949.660.1110.015
QX1370.1444.6514.9422.740.350.044112.6214.251.8848.450.1150.015
QX1350.1647.7415.8319.550.370.044120.1014.341.9450.820.0900.011
QX1330.2750.6717.5813.010.410.044132.9314.292.1459.560.0980.010
QX1310.3355.9715.2511.690.350.043119.3614.791.9471.610.0800.010
QX1290.2951.9717.9010.330.390.042134.2214.172.2855.180.0640.007
QX1270.2551.6117.7410.930.400.043138.2014.722.3865.980.0650.007
QX1250.2851.6317.1411.960.380.042131.8014.532.2661.900.0620.007
QX1230.2350.6117.3712.520.400.043132.9514.472.3058.470.0620.007
QX1210.2946.4116.8717.540.380.042124.7413.972.1848.280.0740.008
QX1190.2243.8915.6722.620.340.041112.5913.582.0248.420.0880.011
QX1170.3142.6815.2124.800.340.042110.8113.772.1346.000.0930.012
QX1150.1636.7712.7835.790.290.04395.6514.141.7743.760.1130.017
QX1130.1037.7613.1933.560.310.04498.7914.161.7146.210.1140.016
QX1110.1436.4712.7536.310.290.04395.3214.121.7645.550.1150.017
QX1090.1036.9313.1034.540.300.04497.6514.091.7747.150.1110.016
QX1070.2139.3713.6031.600.310.04298.6313.701.7445.420.1120.015
QX1050.2336.7912.6535.790.300.04493.4013.951.7044.350.1180.018
QX1030.2438.9013.4532.460.300.04297.3413.681.6744.420.1150.016
QX1010.2452.6616.7812.270.380.043130.9914.752.2653.130.0770.009
QX0990.2654.0218.367.980.430.044144.2914.852.5162.260.0650.007
QX0970.3652.7118.099.450.420.044140.5714.682.3956.900.0700.007
QX0950.4553.8418.168.260.430.044146.3615.222.4757.630.0760.008
QX0930.4154.3718.736.880.440.045147.7914.912.5571.610.0690.007
QX0890.3353.5615.2914.020.360.044122.5615.142.1160.880.1090.013
QX0850.3554.8017.988.030.400.042139.2014.632.3862.890.0610.006
QX0830.2454.9918.746.480.420.042143.0714.422.4962.290.0540.005
QX0800.2253.2118.419.480.420.043139.4214.312.4654.750.0610.006
QX0780.3751.8018.0810.630.420.043138.8714.512.4552.170.0660.007
QX0760.2151.5016.9912.120.420.046137.9815.352.4054.090.0810.009
QX0740.2841.6214.8725.910.330.041109.9413.972.0145.160.1050.013
QX0720.2138.0413.3331.040.290.04299.9314.171.8443.750.1100.016
QX0700.1618.476.3863.850.140.04145.1313.361.0342.130.0760.022
QX0690.2023.607.8256.250.170.04155.1613.331.1540.290.0720.017
QX0660.1820.566.1562.300.130.04143.7113.430.9946.730.1270.039
QX0630.2936.7212.2835.280.270.04186.4713.301.5437.650.0790.012
QX0600.1317.325.1169.030.120.04438.6814.300.8145.330.1120.041
QX0570.2015.363.4273.870.080.04324.0413.280.4653.080.0950.053
QX0540.1915.514.7271.370.120.04636.5314.620.7042.700.0370.015
QX0510.2516.505.3268.420.130.04540.3114.320.7941.300.0360.013
QX0480.2516.555.3768.720.120.04339.8714.030.7639.860.0360.013
QX0450.2118.186.1664.510.150.04546.7414.340.8840.090.0340.010
QX0420.2619.476.4962.770.150.04548.1214.010.9139.200.0350.010
QX0390.2217.155.5368.790.140.04643.1014.730.8238.150.0340.012
QX0360.2018.466.3763.380.160.04750.2214.900.9538.740.0370.011
QX0330.2117.276.1166.090.150.04546.9814.530.8638.300.0390.012
QX0300.1917.035.4268.810.130.04540.8714.250.8041.380.0520.018
QX0260.1615.674.6971.740.090.03831.8812.850.5945.470.0990.040
QX0230.1712.443.1979.000.070.04022.1413.120.5247.310.0810.048
QX0200.1816.633.0773.890.080.05226.0516.030.5346.760.0610.038
QX0170.256.331.7687.830.050.05114.0815.120.3653.260.0370.040
QX0120.047.001.6787.140.050.06217.4319.720.8662.280.0700.080
QX0090.046.691.6286.610.050.05913.8916.201.0159.740.0650.076
QX0050.054.931.2491.270.040.05810.6916.280.6665.170.0480.073
QX0010.055.981.0890.420.030.0578.9015.570.6659.840.0310.054
Table 2. The bulk mineralogical composition used to reconstruct the third-order transgressive–regressive sequences of the Pliensbachian–Toarcian succession of the Quse Formation within the Southern Qiangtang Basin.
SamplesQuartzPlagioclaseCalciteClay MinerlasK-FeldsparDolomite
wt.%wt.%wt.%wt.%ppmwt.%
QX19117.73.425.220.90.432.4
QX18811.24.172.20.8-11.7
QX18543.12.7-37.60.715.9
QX17921.94.747.025.50.20.7
QX17133.48.211.746.10.6-
QX16636.08.212.742.5-0.6
QX16236.17.612.143.50.7-
QX15619.74.147.328.60.3-
QX14930.78.517.542.60.7-
QX14733.47.911.346.20.60.6
QX14319.34.850.025.60.3-
QX13726.16.731.235.60.4-
QX13332.17.420.739.30.5-
QX12930.67.714.846.9--
QX12730.68.314.845.60.7-
QX12330.17.217.944.40.4-
QX12125.65.625.742.50.6-
QX11721.55.032.940.30.3-
QX11322.25.042.430.00.4-
QX10919.54.344.231.70.3-
QX10518.74.946.329.90.2-
QX10132.37.816.942.60.4-
QX09730.87.012.948.70.6-
QX09331.67.38.851.80.5-
QX08532.77.811.647.20.7-
QX08030.17.313.148.90.6-
QX07630.77.716.844.30.5-
QX07421.65.432.539.30.30.9
QX07221.94.941.330.81.1-
QX06318.75.043.529.60.13.1
QX0429.03.169.013.6-5.3
QX0367.32.764.513.80.211.5
QX0123.52.492.21.9--
QX0093.82.590.22.0-1.5
Disclaimer/Publisher’s Note: The statements, opinions and data contained in all publications are solely those of the individual author(s) and contributor(s) and not of MDPI and/or the editor(s). MDPI and/or the editor(s) disclaim responsibility for any injury to people or property resulting from any ideas, methods, instructions or products referred to in the content.

