Abstract
The 1.1 Ga Mesoproterozoic Midcontinent rift hosts the Eagle, Eagle East, and Tamarack Ni-Cu-PGE deposits and Embayment Prospect. These deposits are hosted by ultramafic igneous rocks and have some of the highest Ni-Cu grades on Earth. We use new bulk-rock data and published datasets (bulk-rock, mineral chemistry, and isotopic analyses) to examine major, minor, and trace element trends of both Midcontinent rift-related alkaline and tholeiitic intrusions. In addition, we compare the geochemical data to local kimberlite-hosted lower-crustal xenoliths and local igneous (Archean) and sedimentary (Paleoproterozoic) country rocks. We found the peridotite magma compositions dominantly consist of primitive mantle compositions with varying abundances of subduction-related components, alkaline-transitional melts, and local country rock contaminates (e.g., Baraga and Animikie Basin sediments). The subduction-related components are interpreted to be derived from previous Archean and Paleoproterozoic subduction events and likely hosted within the sub-continental lithospheric mantle. Importantly, these subduction-related components are also interpreted to have acted as oxidizing agents within the melt, stabilizing sulfate (+2 FMQ (fayalite–magnetite–quartz) to FMQ) while inhibiting sulfide crystallization as the magma ascended through ~50 km of the Superior craton. This study largely corroborates the previous findings with respect to the contribution of local country rock contamination to the Eagle–Tamarack peridotite host rocks, which is estimated to be minimal (<5%). However, the incorporation of <5% reductive pelitic siltstone contamination results in strong shifts in the oxygen fugacity of the peridotite melt, from +2 FMQ to slightly below FMQ, as determined from spinel Fe3+/∑Fe ratios. This shift in oxygen fugacity resulted in the transition from total sulfate (+2 FMQ) to sulfate + sulfide (<+2 FMQ to FMQ) to total sulfide (<FMQ). This shift in oxygen fugacity is a key contributor to the formation of Ni-Cu-PGE-rich massive sulfides within the Eagle peridotite. This study presents an expanded geochemical interpretation for the exploration of Midcontinent rift-related Ni-Cu-PGE deposits to include peridotites with subduction-like signatures and contaminated via <5% reductive sedimentary country rocks.
1. Introduction
Magmatic Ni-Cu-PGE deposits form when immiscible sulfide droplets derived from magma that has become oversaturated in sulfur coalesce and crystalize as sulfides within silicate magma [1]. Magma-mixing and crustal contamination of primitive mantle-derived melts are two processes that are hypothesized to be required in order to enrich magma in economic concentrations of Ni-Cu-PGEs and achieve S-saturation (e.g., [2,3,4,5]). Geochemically fingerprinting the exact crustal contaminate(s) responsible for S-saturation and reconstructing the magma-mixing history of the host rocks is complicated due to commonly overlapping processes, similar compositions of crustal contaminates, and overprinting (e.g., re-equilibration of sulfur isotopes). Additionally, the great distances the parental magma travels from the mantle source through the sub-continental lithospheric mantle (SCLM) into lower-, middle-, and upper-crustal rocks adds complexity due to an increased list of possible contaminates as well as a lack of empirical evidence. The more accurate the reconstruction of magmatic history, the greater the probability for the discovery of new ore bodies. This study of the Eagle, Eagle East, and Tamarack peridotite-hosted Ni-Cu-PGE deposits of the Midcontinent rift (MCR) examines and integrates new bulk-rock geochemistry (Eagle–Eagle East peridotite host rocks) with previously published bulk-rock geochemistry, mineral chemistry, and isotopes (Eagle and Tamarack peridotite host rocks) to quantify the mantle and crustal contributions and conditions required to form these ore deposits in order to generate a comprehensive reconstruction of the source, magma-mixing, and contamination histories for these intrusions within the context of the pre-, syn-, and post-rift environments.
2. Regional Geological Background and Deposit Geology
2.1. Geological Setting
The geological setting of the southern Lake Superior region in this paper focuses on three major Precambrian episodes: (1) Late-Archean subduction, (2) Paleoproterozoic subduction, and (3) the Initiation (>1109–1110 Ma)- to Early (~1110–1106 Ma)- Magmatic Stages of the Mesoproterozoic MCR [6]) (Figure 1).
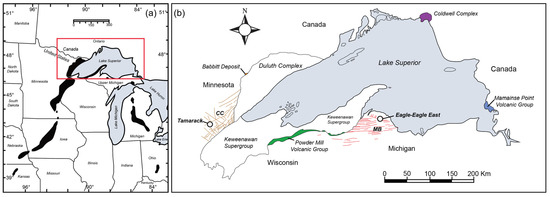
Figure 1.
(a) Regional map of the Midcontinent Rift gravity anomaly (black shapes; figure modified after [7]) and (b) generalized geology of the Midcontinent Rift in the Lake Superior region. Extrusive and intrusive units referenced throughout this paper are highlighted and labeled (MB = Marquette–Baraga dike swarm: red, and CC = Carlton County dike swarm: orange; figure modified after [6].
During the Late Archean, beginning ~2690 Ma, a micro-continent collided with an island-arc terrane along the southern margin of the Superior Craton [8]. A north-dipping subduction zone formed under the Superior Craton along the ~1200 km long Great Lakes Tectonic Zone [9], known by some as the Minnesotan Orogen (e.g., [10]). Subduction ceased around 2600 Ma, marking the last episode in the assembly of the Superior Craton [11].
The second Precambrian episode is the Paleoproterozoic Penokean Orogeny (~2300 to 2200 Ma), which began with the formation of a south-dipping subduction zone along the southern margin of the Superior Craton. The subsequent collision between the volcanic arc and Superior Craton resulted in northward-dipping subduction ranging from ~1900 to 1860 Ma [12]. This collisional boundary is represented today along the Niagara Fault Zone in Michigan and Wisconsin, and the Malmo Discontinuity in Minnesota (sub-parallel and ~30–60 km to the south of the Great Lakes Tectonic Zone [13]) (Figure 2).
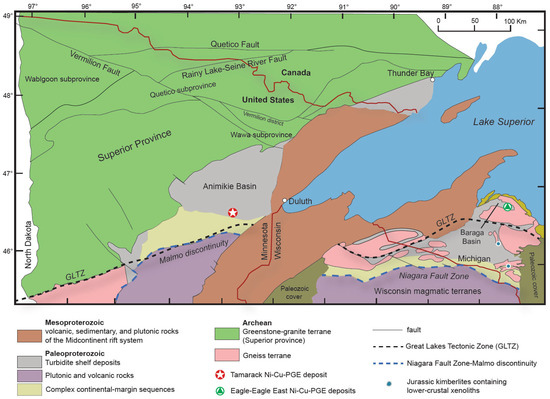
Figure 2.
Simplified geological map of the Lake Superior region, highlighting the proximity of the Eagle–Eagle East and Tamarack Ni-Cu-PGE deposits to the Great Lakes Tectonic Zone (GLTZ; black dashed line), Niagara Fault Zone–Malmo Discontinuity (blue dashed line), in addition to the location of Jurassic kimberlite pipes containing lower-crustal xenoliths [14]; figure modified after [8].
The third Precambrian episode is the Mesoproterozoic MCR, where large volumes of magma (estimated at 1.5–2 million km3 of basalt [15,16]) were emplaced over the relatively short timeframe of ~30 million years [17]. The associated magmatism resulted in the formation of a large igneous province (LIP) [18,19]. The Initiation Stage of the MCR (>1109–1110 Ma, [6]) was the impact of a mantle plume, possibly 1000–2000 km in diameter [20], accompanied by crustal doming.
Alkaline magmatism characterizes the earliest magmatic episode of the MCR (older than 1111 ± 1.5 Ma [21]), with the extrusion of the reversely polarized Lower Siemens Creek Volcanics of the Powder Mill Group, central Upper Michigan. The Lower Siemens Creek Volcanics consists of basalt and picrite [22]. The reversely polarized alkaline dikes (known locally as copper-depleted dikes) cut across the Paleoproterozoic Baraga Group and Animikie Group (known locally as the Esko dike/intrusion of the Carlton County dike swarm) Basins and are compositionally similar to the Lower Siemens Creek Volcanics and dated to 1109 ± 14 Ma [23]. Alkaline magmatic episodes also occur later throughout this Early Stage, with the 1108 ± 1.0 Ma [24] emplacement of the Coldwell Complex, Ontario, the largest alkaline complex in North America [25]. Schulz and Nicholson [26] interpreted these earliest MCR alkaline magmas to represent extremely deep (≥120 km) low-degree partial melts (~1–3%).
The upper member of the Powder Mill Group, the upper Siemens Creek Volcanics, is transitional in composition [22] and represents the earliest known transition of the MCR from alkaline to tholeiitic magmatism. It is older than the overlying 1107.3 ± 1.6 Ma Kallander Creek Volcanics [27]. Basaltic flows that are compositionally similar to the upper Siemens Creek Volcanics are also found within the earliest flows of the Mamainse Point, Ontario [22,28]. Schulz and Nicholson [26] interpreted the upper Siemens Creek transitional basalts to represent melts derived from shallower (≤90 km) higher-degree partial melts (>10%) [29]. Faure et al. [30] interpreted this rapid transition from extremely deep, low-degree partial alkaline melts to higher-degree, shallower tholeiitic melts as reflecting magmatic source development under pre-rift cratonic lithospheres of varying thicknesses.
The reversely and normally polarized Kallander Creek Volcanics represent the earliest known tholeiitic flow within the MCR (1107.3 ± 1.6 Ma) [27]. The tholeiitic Eagle peridotite (e.g., [31]), and likely also the adjacent Eagle East peridotite (Figure 3a,b), emplaced within the Paleoproterozoic Baraga Basin of the Marquette Range Supergroup [32] within a similar timeframe to the Kallander Creek Volcanics, with an age of 1107.2 ± 5.7 Ma [31]. The tholeiitic peridotite host rocks in the Tamarack Ni-Cu-PGE deposit are similar in age (1105.6 ± 1.2 Ma) [33] (Figure 2) to the Eagle deposit, and also emplaced within sediments of the Paleoproterozoic Marquette Range Supergroup (Animikie Basin, Northeast Minnesota) (Figure 2). In this study, the rationale to collectively examine the geochemistry of the MCR-related alkaline, transitional, and tholeiitic rocks and associated Ni-Cu-PGE deposits (i.e., Eagle, Eagle East, and Tamarack) is based on overlapping ages (within analytical uncertainty) amongst all intrusions and emplacements along the same paleosuture zones (e.g., Great Lakes Tectonic Zone, and Niagara Fault Zone–Malmo Discontinuity).
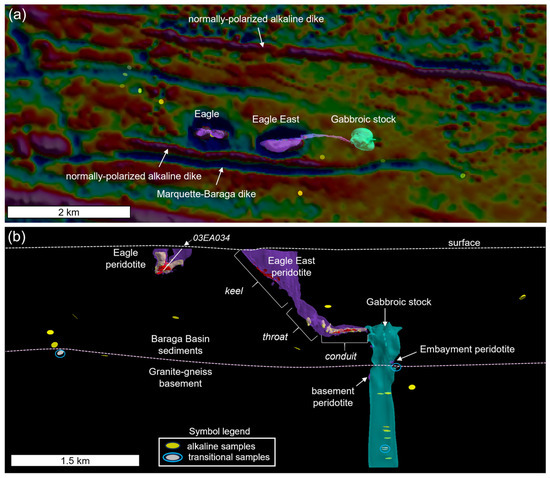
Figure 3.
(a) Planview map of the first vertical derivative of the Baraga Basin aeromagnetic survey (semi-transparent) with the intrusion labels. Sample locations from this study of alkaline–pyroxenite (yellow discs) and transitional gabbro–pyroxenite (white discs) are shown, and (b) the long section looking north at the Eagle and Eagle East peridotite, which contains semi-massive (yellow) and massive sulfide (red) bodies with morphological zones labeled; includes the gabbroic stock, Embayment peridotite, and basement peridotite models. The approximate positions of the current surface and granite–gneiss basement are also shown. Transitional gabbro–pyroxenite samples are highlighted by light blue circles.
2.2. Eagle and Eagle East Deposits, and Embayment Prospect Geology
This section provides a geological summary of the Eagle, Eagle East, Embayment, and associated lithologies; full petrographic descriptions of each lithology are provided in Supplement S1. The Eagle and Eagle East Ni-Cu-PGE deposits are hosted within the Baraga Basin. The Baraga Basin is delineated by aeromagnetic data to be a northwest-southeast-trending arcuate-shaped feature, bordered by Late-Archean granitic–gneiss [8,34] (Figure 2). The Paleoproterozoic sediments that fill the basin belong to the Baraga Group of the Marquette Range Supergroup [32]. Kennecott geologists divided the Baraga Group into the following units (from oldest to youngest): Goodrich quartzite, lower slate, upper greywacke, and lower and upper Fossum Creek slates [31]. Variable amounts (<5% modal abundance) of disseminated sedimentary and hydrothermal veinlet-hosted pyrite and pyrrhotite occur throughout the Baraga Group and Archean units.
The Eagle and Eagle East peridotite plutons are two of the most prominent features on the aeromagnetic map and define two strong positive magnetic anomalies, striking east–west, surrounded by reversely polarized halos, ~500 m apart (Figure 3a). These magnetic anomalies were the focus of exploration efforts dating back to 1977 [35,36], especially after elevated Cu, Pt, and Pd concentrations were found in the only peridotite outcrop in the area [34,37], now the location of the underground mine portal. East–west trending normally polarized alkaline dikes and reversely polarized tholeiitic Marquette–Baraga dikes flank the Eagle and Eagle East plutons to the north and south (Figure 3a). Alkaline gabbro-to-pyroxenite dikes (unknown polarity) have been intercepted across the Baraga Basin (Figure 3a,b).
The Eagle intrusion has a dike/tube-like geometry [5] that hosts sulfide mineralization typically consisting of pyrrhotite, chalcopyrite, and pentlandite with minor pyrite and cubanite [38]. The high-grade mineralized zones occur in three morphologically distinct portions of the Eagle deposit: (1) semi-massive sulfide in the western subvertical limb, (2) semi-massive sulfide in the gently dipping eastern limb, and (3) massive sulfide within a central subvertical deposit (e.g., [31]) (Figure 3b). Additionally, disseminated mineralization forms a halo of variable thickness (~0.5–3 m) around the high-grade mineralization.
The Eagle East deposit can also be divided into three main zones: (1) upper keel, (2) throat, and (3) subhorizontal conduit (Figure 3b). The upper keel, mostly consisting of feldspathic peridotite, contains minor massive sulfide accumulations along the base of the keel, in addition to minor disseminated sulfides throughout the interior. The subhorizontal conduit and throat (connection between the keel and subhorizontal conduit; Figure 3b) are dominated by fine-grained peridotite that hosts high-grade semi-massive and massive sulfide mineralization (Figure 4b,c) as well as mineralized peridotite (>10% sulfide modal abundance) that are currently being mined. A basal peridotite lithology below the massive sulfides (gradational contact), in both Eagle and Eagle East, is separated in this study based on elevated Ti-P-REE concentrations compared to the conduit peridotites above and along the margins of the massive sulfides (Figure 4a). Further details regarding the geochemistry of the basal peridotite are presented in the Results Section.
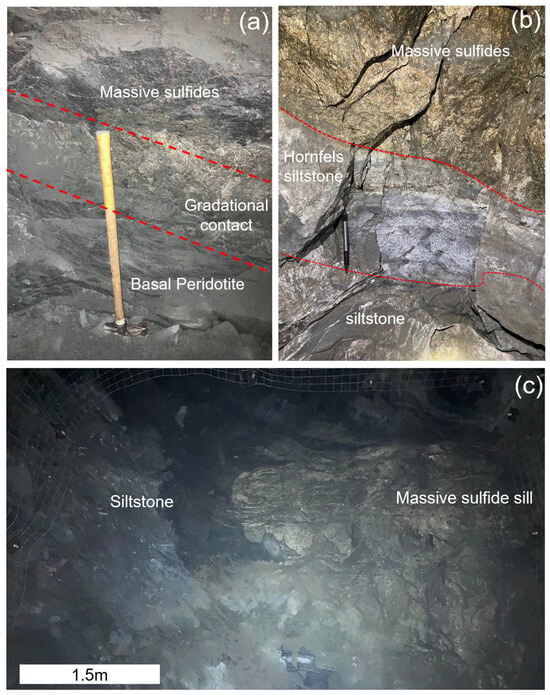
Figure 4.
Underground photographs of the Eagle East deposit: (a) −490 level, gradational contact (highlighted by red dashed lines) between the base of the massive sulfides and fine-grained basal peridotite lithology within the conduit (rock hammer for scale); (b) −515 level, massive sulfide contact with Baraga Basin sediments with a 36 cm thick contact metamorphosed zone of hornfels (outlined by red dashed lines: pen for scale); (c) −515 level, drift face of a massive sulfide sill intruded into Baraga Basin sediments (dark-gray color).
Deeper intrusions exist within the Baraga Basin that are not visible using aeromagnetic surveys but have been identified by drilling. The most prominent deep intrusion is the eastern gabbroic stock that occurs along strike with the Eagle and Eagle East deposits (Figure 3b). The top of the intrusion is truncated at the lower elevation of the Eagle East subhorizontal conduit and extends to a depth of at least ~2600 m (deepest drill intercept). A U-Pb age for this unit was found to be 1103.4 ± 1.2 Ma [39,40].
Along the eastern edge of the gabbroic stock, just above the elevation of the Goodrich quartzite basement, is a localized occurrence of peridotite that contains semi-massive and massive sulfides, informally known by Lundin exploration geologists as the embayment peridotite (Figure 3b). Transitional gabbro-to-pyroxenite samples have also been identified just below the Embayment peridotite, in addition to ~2 km depth (from surface) along the southern margin of the gabbroic stock, and ~1.3 km to the northwest of the Eagle deposit (Figure 3a,b).
2.3. Tamarack Deposit Geology
The Tamarack Intrusive Complex is hosted within the Paleoproterozoic Animikie Basin, Northeast Minnesota. The Animikie Basin consists of sulfide-bearing slates and metagraywackes of the Upper Thomson Formation, equivalent in composition and age to the Paleoproterozoic Baraga Basin, Michigan (Figure 2). The Tamarack aeromagnetic anomaly is relatively large (~13 km in length and 1–4 km in width) and divided the into two parts: (1) the “Bowl” to the south and (2) the “dike” to the north [41]. The “Bowl” section consists of upper oxide-rich gabbronorite and underlying peridotite-to-feldspathic peridotite intrusions [33] (Figure 5).
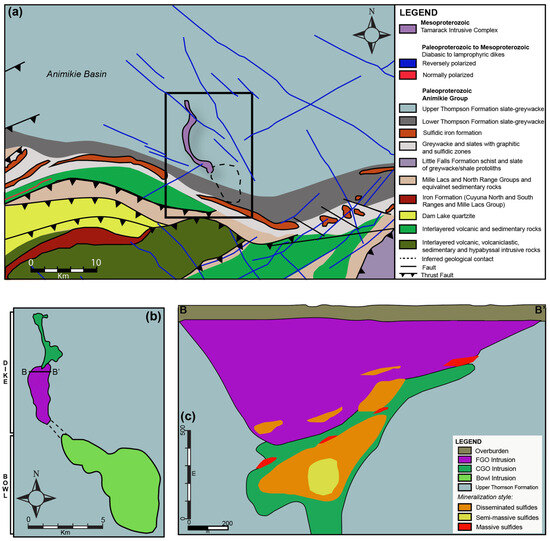
Figure 5.
(a) Planview regional geology map of the area surrounding the Tamarack Intrusive Complex (TIC), Minnesota, after [42]; (b) planview geological map of the “Bowl” and “dike” portions of the TIC; and (c) cross-section (B–B’) showing a transect of the central portion of the TIC dike after [41].
The “dike” portion consists of two broad units: (1) coarse-grained peridotite/feldspathic peridotite/melatroctolite (known as the CGO) and (2) fine-grained peridotite/feldspathic peridotite/melagabbro (known as the FGO). In the cross-section, the dike has a funnel-shaped morphology, with an intrusive contact between the overlying FGO and underlying narrower CGO. A “hybrid” texture, characterized by bimodal fine-to-medium-grained olivine populations, is sometimes observed along the CGO/FGO intrusive contact, and was separated into a distinct unit (known as the CGO/FGO) by [41]. In general, the center of the CGO contains semi-massive sulfides, surrounded by a halo of disseminated sulfides, and discontinuous lenses of massive sulfides. The overlying FGO primarily contains disseminated sulfides along the lower-sections of the intrusion, and massive sulfides lenses along the FGO-CGO contact with the sedimentary country rocks (Figure 5). Both the Eagle, Eagle East, and Tamarack semi-massive and massive sulfide deposits are relatively small in size (<10 million tonnes) but contain some of the highest Ni-Cu grades on Earth (Figure 6).
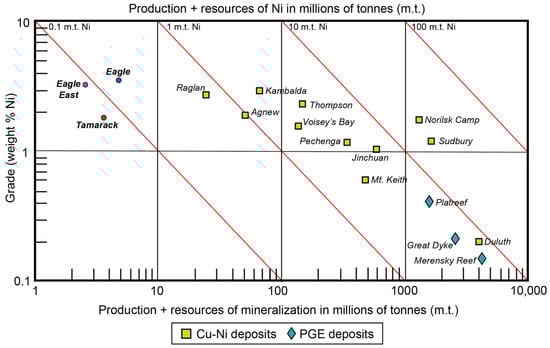
Figure 6.
Ni grade (wt%) vs. production + resources of mineralization (millions of tonnes) of the Eagle [43], Eagle East [44], Tamarack [45], and other major Cu-Ni and PGE deposits worldwide [1].
3. Materials and Methods
A full description of the materials and methods (bulk-rock, mineral chemistry, isotopes) used in this study and published datasets are presented in Supplement S2. The bulk-rock major and trace element data (n = 263) of this study are provided in Supplement S3 (also includes a subset of Eagle and Baraga Basin samples analyzed for B, Be, and Li, and sulfate concentrations). Quality assurance and quality control (QA/QC) of the bulk-rock dataset were evaluated using procedural internal reference standards and core sample duplicates (Supplement S4).
4. Results
4.1. Bulk-Rock Geochemistry
Supplement S5 presents the median major, minor, and trace element concentrations of the alkaline gabbro–pyroxenite, transitional gabbro–pyroxenite (both from this study), and peridotite from the Eagle East (conduit and basal units), and Embayment intrusions (the results are from this study, with the exception of Eagle peridotite major and minor elements from [31]). Median compositions of Tamarack CGO, FGO, and CGO/FGO peridotites from [41] are also presented for comparison. All data were recalculated as volatile-free and filtered for samples containing <1 wt% S (identical low S-filter used for the Tamarack dataset) [41]. Possible element mobility during hydrothermal alteration (e.g., low-temperature serpentinization) was tested by determining the Spearman’s rank correlation coefficients (ρ; equation in Supplement S6) between each element and the chemical index of alteration [46]. Based on this test, only CaO in the alkaline gabbro–pyroxenite and Ba within the Tamarack FGO samples was found to significantly correlate (−0.9) with the chemical index of alteration (Supplement S5). Additionally, in order to mitigate the effects crystal accumulation (e.g., orthocumulate and mesocumulate) can have on trace element ratios, samples with <0.5 ppm Th were also excluded following the method of [47].
4.1.1. Alkaline, Transitional, and Tholeiitic Divisions
The samples from this study can be divided into three broad categories, 1. alkaline, 2. transitional, and 3. tholeiitic, using the immobile minor and trace element ratio plots after [48] (Zr/P2O5 vs. Nb/Y) (Figure 7a) and [49] (Nb/Y vs. Zr/Ti) (Figure 7b). The Lower Siemens Creek Volcanic sample plots within the alkaline field, whereas the upper Siemens Creek Volcanics sample plots near or along this discrimination line and were classified as transitional in this study.
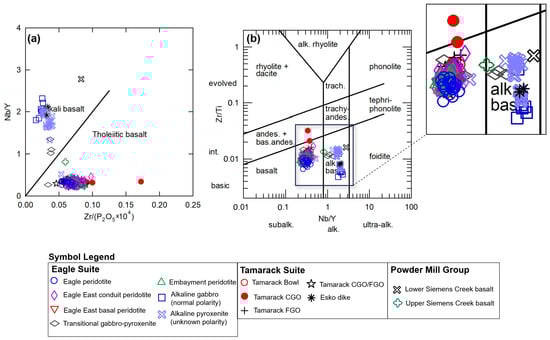
Figure 7.
(a) Zr/P2O5 vs. Nb/Y diagram after [48], (b) Nb/Y vs. Zr/Ti diagram after [49]; zoomed-in area on the sample cluster provided to the right of the diagram. Analytical error (1σ) is smaller than the symbol size (see Supplement S4).
4.1.2. Trace Elements
The La/Sm vs. Gd/Yb plot after [50], normalized to primitive mantle values after [51], shows the majority of alkaline and Eagle–Eagle East tholeiitic samples have (Gd/Yb)PM ratios > 2 (Figure 8a). In contrast, the Tamarack peridotite samples and the majority of transitional samples have (Gd/Yb)PM ratios < 2. Overall, relatively low (La/Sm)PM ratios (~1–2) occur within the Eagle–Eagle East peridotites compared to the relatively high La/Sm ratios (~2.3–3) of the Tamarack peridotites, which appear within the alkaline and transitional sample range.
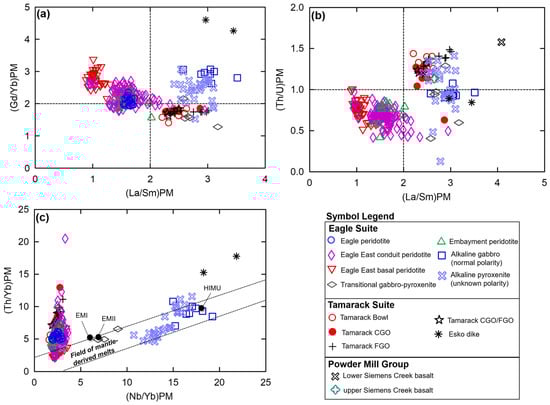
Figure 8.
(a) La/Sm vs. Gd/Yb plot after [50], normalized to primitive mantle values after [51], for the LSCV, USCV [22], alkaline, transitional pyroxenite–gabbro (this study), Eagle peridotite [31], Eagle East, Embayment peridotites (this study), Esko gabbro dike [23], and Tamarack peridotite suites [41]; (b) La/Sm vs. Th/U plot after [52], normalized to primitive mantle values after [51], and (c) Nb/Yb vs. Th/Yb diagram after [53], normalized to primitive mantle values after [51], with EMI, EMII, and HIMU reservoir end-member compositions after [54]. Analytical error (1σ) is smaller than the symbol size (see Supplement S4).
The plot of (La/Sm)PM vs. (Th/U)PM after [52] results in an overall division between the Eagle and Tamarack tholeiitic suites, where Tamarack peridotites have relatively high (Th/U)PM ratios (>1) similar to the majority of alkaline and transitional samples ((Th/U)PM ratios (~1–1.5); further analysis of this overlap is presented in Section 5.4), whereas Eagle peridotites have relatively low (Th/U)PM ratios (<1; Figure 8b). Using the (Nb/Yb)PM vs. (Th/Yb)PM diagram after [53] (Figure 8c) shows the alkaline samples possess the highest (Nb/Yb)PM ratios (>10), clustering near the high-µ reservoir composition, after [54]. A positive linear array occurs between the transitional samples near enriched mantle I and II compositions after [54] and the alkaline samples along the “field of mantle-derived melts” after [53]. The tholeiitic Eagle and Tamarack suite samples have the lowest (Nb/Yb)PM values (<5) and form a steep array from the “field of mantle-derived melts” toward increasing (Th/Yb)PM values.
Plotting (Nb/Yb)PM vs. Ni and Cu produces three major populations: Figure 9a. low Ni-Cu, high Nb/Yb normally polarized alkaline gabbro, and a subset of unknown-polarity alkaline gabbro–pyroxenite samples; Figure 9b. intermediate Ni, Cu, and Nb/Yb transitional gabbro–pyroxenite and a subset of unknown-polarity alkaline gabbro-pyroxenite samples; and Figure 9c. overall higher Ni-Cu and low-Nb/Yb tholeiitic Eagle, Eagle East, and Tamarack peridotites (Figure 9). Two transitional gabbro–pyroxenite samples occur within the higher Ni-Cu tholeiitic array. Plotting (Nb/Yb)PM vs. S shows greater variability, as expected based on the high volatility of S within magma (e.g., [55]), within the transitional and unknown-polarity alkaline gabbro–pyroxenite samples. The transitional and alkaline gabbro–pyroxenite samples display a similar range of S values (~0.1 to 1 wt%) to that of the tholeiitic samples (a further discussion of sulfur is presented in Section 5.4).
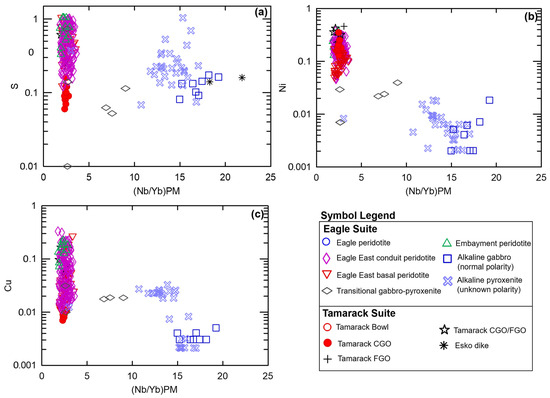
Figure 9.
Nb/Yb (normalized to primitive mantle values after [51] vs. log S, Ni, Cu (wt%) of the normally polarized alkaline gabbro (this study), alkaline pyroxenite (unknown polarity; this study), Embayment peridotite, Eagle East conduit peridotite, Eagle East basal peridotite (this study), and Tamarack CGO, FGO, CGO/FGO hybrid, and Bowl peridotite [41]. Analytical error (1σ) is smaller than the symbol size (see Supplement S4).
4.1.3. Multi-Element Diagrams
The normally polarized alkaline Eagle, Esko, and Lower Siemens Creek Volcanic samples share similar multi-element patterns, normalized to primitive mantle after [51] with consistently high LILE/HFSE patterns and strong enrichment in LREEs (Figure 10a,b). The normally polarized alkaline samples of the Eagle suite have the greatest Cs-enrichment (~300–2000 × PM) and highest relative positive Ba anomaly (200× PM). Positive Nb-Ta anomalies characterize all alkaline samples. The Lower Siemens Creek Volcanic sample has P and Ti troughs relative to the Esko and Eagle alkaline samples.
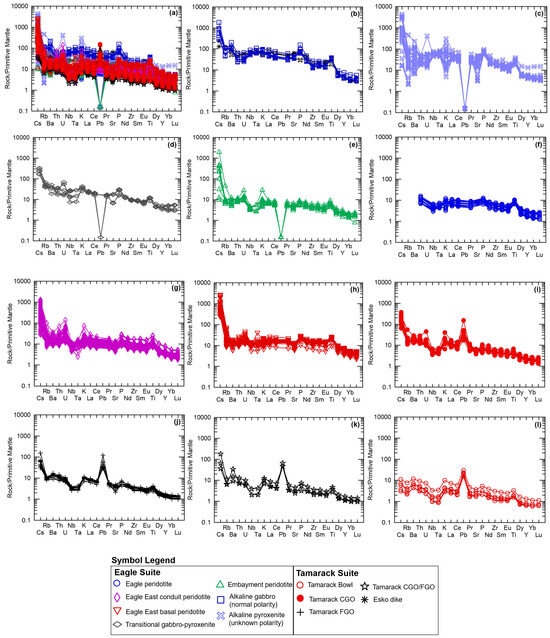
Figure 10.
Primitive mantle-normalized spider diagrams after [51] of the (a) entire alkaline-transitional and Eagle–Tamarack peridotite suites; (b) Lower Siemens Creek Volcanics [22], Esko gabbro dike [23], and normally polarized alkaline gabbro (this study); (c) alkaline pyroxenite (unknown polarity; this study); (d) upper Siemens Creek Volcanics [22] and transitional gabbro–pyroxenite (this study); (e) Embayment peridotite; (f) Eagle peridotite; (g) Eagle East conduit peridotite; (h) Eagle East basal peridotite (this study); (i) Tamarack CGO; (j) FGO; (k) CGO/FGO hybrid; and (l) Bowl peridotite [41]. Analytical error (1σ) is smaller than the symbol size (see Supplement S4).
The alkaline pyroxenite dike samples (unknown polarity) also display overall high LILE/HFSE patterns, with a wide range of LILE values, with both relative positive and negative anomalies in Cs, Rb, Ba, and Sr concentrations represented (Figure 10c). Similar variability also occurs in some of the HFSE (e.g., Th, U, Eu) and K. Negative Pb anomaly (<1/PM) occurs in all alkaline pyroxenite dike samples. The overall HFSE pattern is consistent with the normally polarized Eagle, Esko, and Lower Siemens Creek Volcanic alkaline samples (Figure 10b,c).
Compared to the alkaline suites, the transitional samples have flatter LILE/HFSE patterns with Cs, Rb, and Ba enrichment in the range of 30–300× PM (Figure 10d). Positive Nb-Ta anomalies characterize all but one sample (EM108318A), which has a negative Nb-Ta anomaly. All transitional samples have strong negative Pb anomalies (<1/PM). The overall HFSE pattern is similar to the alkaline suite.
The tholeiitic Embayment peridotites have an overall shallower LILE/HFSE pattern compared to the alkaline and transitional samples (Figure 10e). However, some samples have equally enriched Cs (up to 2000× PM), Rb (up to 100× PM), and Ba (up to 200× PM) concentrations, whereas with the majority of Embayment samples have ~10× PM LILE enrichments. Similar variability also occurs in Th, U, K, Sr, and LREEs with an enriched population (20–200× PM) and a less-enriched population (10–20× PM; Figure 10e). All samples have positive Nb-Ta anomalies and negative Pb anomalies (Figure 10e).
The tholeiitic Eagle and Eagle East peridotite samples share an overall similar pattern to the tholeiitic Embayment peridotites (Figure 10f,g). Minor differences are found in the higher K (up to 30× PM) and U (up to 200× PM) concentrations of the Eagle East peridotites, in addition to the overall greater LREE, MREE, and HREE values of the Eagle and Eagle East peridotites relative to the Embayment suite. The Eagle East basal peridotite also shares a similar pattern to the Eagle–Eagle East peridotites, but with overall higher LREE, MREE, and HREE concentrations (Figure 10h). Additionally, the Eagle East basal peridotite has flat-to-slightly positive Nb-Ta anomalies, with one sample with a strong positive Nb-Ta anomaly.
The Tamarack peridotites have an overall similar pattern to the tholeiitic Eagle peridotite suites with steep LILE/HFSE patterns and strong Nb-Ta anomalies (Figure 10i–l). Differences between the Tamarack suites can be seen in the steeper LILE/HFSE pattern of the Tamarack CGO, FGO, and CGO/FGO hybrid samples due to lower HFSE concentrations. The steepest LILE/HFSE pattern is observed in the CGO samples with LILE concentrations ranging in the range of ~10–400× PM, in addition to overall enriched Th, U, K, and LREEs. In contrast, the Bowl peridotites have the flattest pattern with LILE concentrations in the range of 2–10× PM and LREE and HFSE concentrations ranging from 4 to <1× PM. All the Tamarack peridotites have strong Pb spikes (~50–100× PM).
4.1.4. Boron, Beryllium, and Lithium Concentrations
Overall, Eagle semi-massive sulfide-rich peridotite samples (n = 60) contain elevated concentrations of B, ranging from below detection to 220 ppm, with an average value of 92 ppm (Supplement S3). No correlation between B and the chemical index of alteration was found (ρ = −0.4; Supplement S5), indicating B-enrichment is not related to hydrothermal alteration. The B concentrations of these Eagle semi-massive sulfide samples fall within the range (10 to 300 ppm) of altered oceanic crust within subduction zones (e.g., [50]). In contrast, most Eagle massive sulfides (n = 29) have B values below detection, with above-detection values in the range of 20–30 ppm B. The Baraga Basin sediments (n = 88) range from below detection to 50 ppm, with an average value of 12 ppm B (Figure 11a).
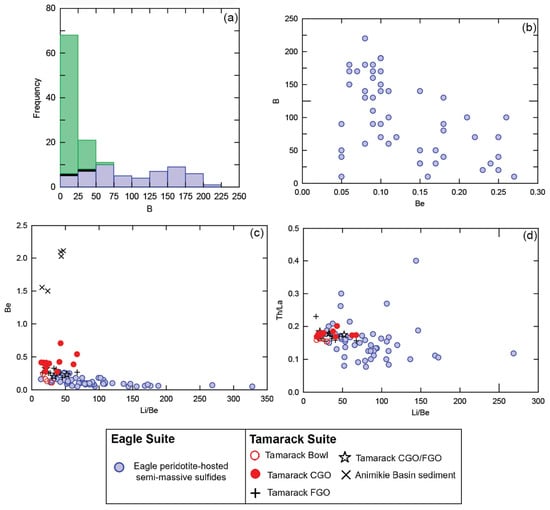
Figure 11.
(a) Histogram of boron concentration (ppm) for Eagle massive sulfides (black), semi-massive sulfides (blue), and Baraga Basin sediments (green); (b) bivariate plot Be vs. B (all in ppm) of Eagle semi-massive sulfide samples; (c) bivariate plot Be vs. Li/Be (all in ppm) of Eagle semi-massive sulfide samples, TIC units (Bowl, CGO, FGO, CGO/FGO), and Animikie basin sediments; and (d) Li/Be vs. Th/La ratios (all in ppm) of Eagle semi-massive sulfides and TIC units (Bowl, CGO, FGO, CGO/FGO). Analytical error (1σ) is smaller than the symbol size (see Supplement S4).
Elevated Li and Be concentrations and high B/Be and Li/Be ratios (Figure 11c) also occur within the Eagle semi-massive sulfide samples (with no correlation with the chemical index of alteration; Supplement S5). Enriched concentrations of Be and Li also occur within the altered oceanic crust in subduction-related rocks (e.g., [56,57]). No published B analyses are known for Tamarack peridotites; however, Li and Be have been analyzed [41] and not found to correlate with the chemical index of alteration (Supplement S5). The Li/Be ratios for the Tamarack intrusive units are lower than the Eagle semi-massive samples, but still elevated relative to rift-related basalts (Li/Be > 10) (Figure 11c).
4.1.5. Sulfate
Sampling for sulfate is a relatively uncommon practice in magmatic Ni-Cu-PGE systems; however, a small subset (only 12 samples in total) of Eagle peridotite, semi-massive sulfides, massive sulfides, and Baraga Basin sediments were assayed for sulfate concentrations (Figure 12). This dataset was examined in order more fully understand the speciation of sulfur within these rock types. The sulfate concentrations within the peridotite (n = 4) range from below detection (>100 ppm) to 200 ppm within one sample. The semi-massive sulfide samples (n = 3) range from 200 to 300 ppm sulfate. The massive sulfide samples (n = 3) contain the most elevated sulfate concentrations, ranging from 700 to 4600 ppm. The Baraga Basin siltstone samples (n = 2) contain below detection concentrations (>100 ppm sulfate).
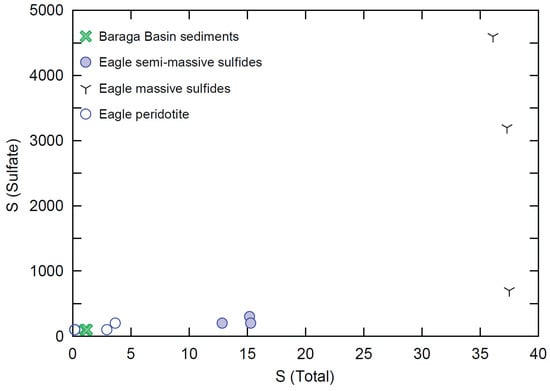
Figure 12.
Total sulfur wt% vs. sulfate wt% for Eagle peridotite, semi-massive sulfides, massive sulfides, and Baraga Basin siltstone samples. The lower limit of detection for both methods is 0.01%. Analytical error (1σ) is smaller than the symbol size (see Supplement S4).
4.2. Mineral Chemistry, Thermobarometry, and Oxygen Fugacity (fO2) Estimates
A summary of the mineral chemistry, thermobarometry, and oxygen fugacity results are presented in Supplement S7. The thermobarometry–oxybarometry dataset (olivine–liquid thermometry, orthopyroxene–liquid thermobarometry, clinopyroxene–liquid thermobarometry, and spinel Fe3+/∑Fe oxygen fugacity barometry) is provided in Supplement S8.
Oxygen Fugacity (fO2) Estimates
The Fe3+/∑Fe (Fe3+/(Fe3+ + Fe2+) ratios of primary magmatic spinel grains (see Supplement S7; Figure S3c) can be used as an oxybarometer that reflects the oxidation state of the melt at the time of crystallization (e.g., [58]). The oxygen fugacity (fO2) conditions of the Eagle peridotite melt are estimated using spinel Fe3+/∑Fe ratios from [31]; drillhole 03EA034; Figure 13. The Eagle spinel Fe3+/∑Fe ratios, determined using electron microprobe analysis (EMPA), are converted to oxygen fugacity estimates after [59] expressed this as a deviation from the fayolite–magnetite–quartz (FMQ) buffer in log units using the method outlined in [60]. The Eagle spinel Fe3+/∑Fe ratios range from 0.28 to 0.52, equivalent to ~FMQ to +2 FMQ, respectively. The 03EA034 downhole profile results in Fe3+/∑Fe ratios ranging between 0.4 and 0.5 (~+1 FMQ to +2 FMQ) in the upper and middle sections of the drillhole (32.09–165.15 m). A sharp trough occurs at 183.15 m (Fe3+/∑Fe ratio = 0.28; ~FMQ). The lowest section of the drillhole consists of a broad downhole decrease in Fe3+/∑Fe ratios from 0.37 (~+1 FMQ; 196 m) to 0.28 (~FMQ; 222.15 m).
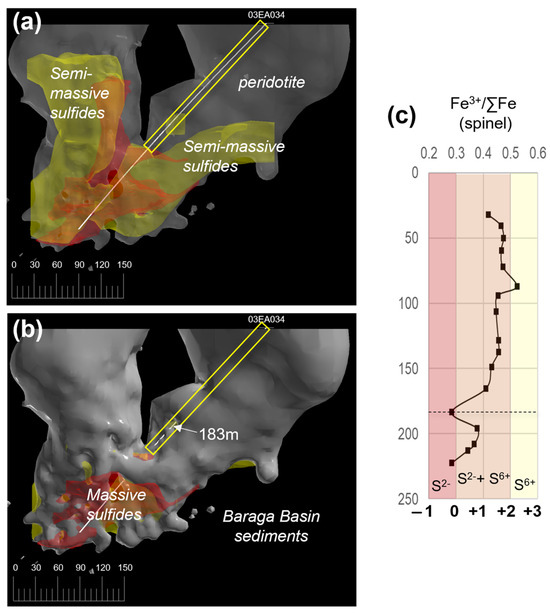
Figure 13.
(a) Three-dimensional model (looking north) of the Eagle peridotite (semi-transparent gray), semi-massive sulfides (yellow), and massive sulfide (red) ore bodies. The path of drillhole 03EA034 is shown as a white line. The section sampled by [31] is highlighted by a yellow box. (b) Same 3-D model as depicted above; however, the peridotite model is opaque to show the lower section of drillhole 03EA034 is in contact with the Baraga Basin sediments (black surrounding area). The 183 m depth in the drillhole is marked with a white arrow. (c) 03EA034 downhole Fe3+/∑Fe ratios of spinel [31], with oxygen fugacity estimates (relative to FMQ) from this study; the 183 m depth is marked by a dashed black line.
5. Discussion
Three ingredients are necessary to form a magmatic Ni-Cu-PGE deposit: 1. magma, 2. ore metals (Ni-Cu-PGEs), and 3. sulfur (e.g., [61]). The first-order process that governs ore metal and sulfur concentrations in a magma is the mantle source and degree of partial melting (e.g., [7,62]). Higher degrees of partial melting (e.g., high-Mg tholeiitic magmas) result in the greater dissolution of sulfide within the source thereby increasing the S-Ni-Cu-PGE concentrations within the derivative melts (e.g., [63,64]). Higher oxygen fugacity (FMQ > 2) conditions, potentially driven by the incorporation of oxidized alkaline and subduction-related components within the upwelling source or during interactions within the SCLM (e.g., [65,66,67]), stabilizes sulfur as sulfate, which significantly increases the dissolved S content in the melt (sulfate has up to ~10× greater solubility compared to sulfide; e.g., [68]). Secondary processes, such as magma-mixing (e.g., [69,70]), have also been proposed as a potential mechanism that can further add sulfur and ore metals to magma as it ascends into the crust. In order for the ascending magma to crystalize sulfides (i.e., achieve sulfide saturation), the solubility of S must be reduced (FMQ < 2) and/or crustal sulfur added to the melt via the assimilation of S-bearing crustal contaminates (e.g., [4,71]). The incorporation of reductive S-bearing country rocks provides an ideal mechanism to achieve both of these conditions and has been interpreted as the final ingredient needed in a number of Ni-Cu-PGE deposits (e.g., Norilsk [1], Duluth Complex [72]). Therefore, the following discussion characterizes primary host magma petrogenesis, including source magma contributions and crustal contamination signatures of the Eagle, Eagle East, and Tamarack peridotites. All elements used to make these assessments were found to not significantly correlate with the chemical index of alteration (Supplement S5), and therefore represent primary magmatic processes.
5.1. Primary Magma
Source Characteristics
A determination of the primary alkaline and tholeiitic magma source characteristics will allow us to compare the initial conditions during partial melting and provide insights into the first-order S-Ni-Cu-PGE endowment of the magmas (e.g., [61]). The alkaline gabbro was derived from a source with a composition between the enriched mantle II and high-µ end-members. In contrast, the tholeiitic suite has a confined range of Nb/Yb values, indicative of a single source, near the enriched mantle I composition. The transitional gabbro–pyroxenite samples plot in between the alkaline and tholeiitic source reservoirs, near the enriched mantle II reservoir. The steep array toward increasing Th/Yb values on the Pearce [53] diagram within the tholeiitic suite is indicative of increasing degrees of crustal contamination (Figure 8c). All three end-members (enriched mantles I-II, and high-µ) have been interpreted as having formed from mantle sources that have incorporated subduction-related components (e.g., [73,74]), therefore highlighting the importance of SCLM contributions to the formation of these Mid-Continent Rift ultramafic-mafic magmas.
High (Gd/Yb)PM ratios of >2 found within the alkaline gabbro–pyroxenites [75] suggest source melts within the garnet stability field (≥90 km; e.g., [76]; Figure 8a). The tholeiitic Eagle, Eagle East, and Embayment peridotites have (Gd/Yb)PM ratios of >2 and <2, suggesting the source of the intruding magmas within both the garnet and spinel stability fields. The tholeiitic Tamarack peridotites may have been sourced only within the spinel stability field (<90 km; e.g., [76]) based on (Gd/Yb)PM ratios of less than 2 (Figure 8a). The majority of transitional samples, local to the Eagle deposit, have (Gd/Yb)PM ratios < 2, suggesting magmas formed within the spinel stability field. Therefore, the alkaline and tholeiitic magmas of the Initiation-to-Early stages of the MCR would have likely been sourced from a mantle plume located either below or within a thick SCLM (depth ranging from ~100 to ~50 km) underplating the Superior Craton (e.g., [6]).
5.2. Mantle and Crustal Contributions to Ore Deposit Host Magmas
The mantle–crustal source evolution of ultramafic-to-mafic rocks within the MCR can be divided into three broad episodes: 1. Initiation Stage (1115–1110 Ma): enriched plume melts; 2. Early-to-Main Stage (1110–1094 Ma): enriched plume melts + SCLM; and 3. Late Stage (1094–1086 Ma): enriched plume melts + depleted asthenospheric mantle (e.g., [6,22]). The SCLM beneath the Superior Craton is estimated to have been enriched (ɛNd (1100) ~ −8 to −10) via Archean and Paleoproterozoic subduction-related components (e.g., [77]). Interaction with the SCLM has previously been proposed for the Tamarack peridotites based on the presence of a strong Nb-Ta anomaly (e.g., [41]). The Eagle peridotite-enriched mantle source has been interpreted as being derived directly from the rising plume containing recycled Archean and Paleoproterozoic subduction components based on ɣOs vs. ɛNd isotopic mixing models (e.g., [78]). Additionally, relatively small degrees of local country rock contamination (<5% country rock-bulk contamination) is estimated within Eagle, Eagle East, and Tamarack host rocks based on S, O, and Re-Os isotopic analysis (e.g., [78,79]).
Building on these previous studies, we evaluated a number of possible contaminates, ranging from the lower-to-upper crust, in addition to magma mixing with alkaline-to-transitional magma, as potential contributors to the Embayment, Eagle, Eagle East, and Tamarack peridotites. By combining bulk-rock, mineral chemistry, and statistical analyses (polytopic vector analysis), we determined that six compositions (described in the following sections), added to a primitive mantle starting composition [51], can reconstruct the multi-element patterns of the Eagle and Tamarack peridotite suites without considering magma source rock characteristics or alteration.
5.3. Subduction-Related Contributions to Primary Magma
5.3.1. SCLM-Hosted Amphibolite Slab Component
The possibility of source enrichment within the SCLM was first assessed by examining the bulk-rock and isotopic systematics of local kimberlite-hosted lower-crustal xenoliths of [14]. One of the xenolith amphibolite samples (sample id: S69-111 of [14]) has similar Th/Ta (~5), Sm/Nd (~0.25), and La/Sm (~3) ratios to the bulk of Embayment, Eagle, and Eagle East peridotite samples. This amphibolite sample also has similarly high Th/U (~4), and Pb/Ce (~0.2) ratios, with lower Cu/Y (~0.001) ratios to those of the Tamarack CGO peridotites (Figure 14).
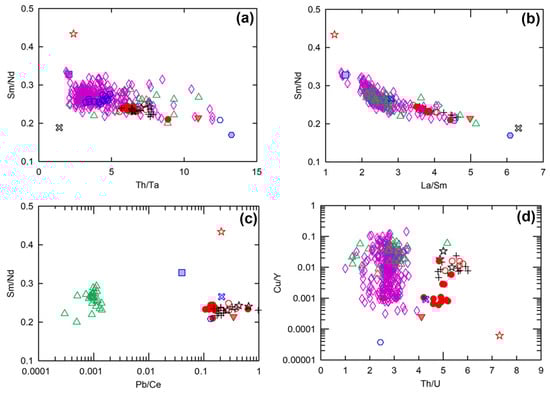
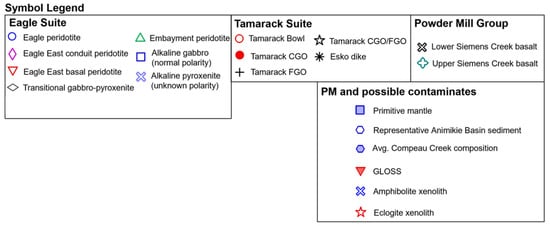
Figure 14.
(a) Th/Ta vs. Sm/Nd, (b) La/Sm vs. Sm/Nd, (c) Pb/Ce vs. Sm/Nd, and (d) Th/U vs. Cu/Y for the Eagle, Eagle East, Embayment peridotites (this study); TIC peridotites, representative of the Animikie Basin sediment sample [41]; average Compeau Creek composition [80]; amphibolite and eclogite kimberlite-hosted lower-crustal xenolith samples [14]; and primitive mantle [51]. Analytical error (1σ) is smaller than the symbol size (see Supplement S4).
The 206Pb/204Pb and 207Pb/204Pb isotopic ratios are also almost identical to the Eagle massive sulfide cluster of analyses [81]. The amphibolite sample is also one of the closest xenolith samples to the Tamarack massive sulfide array, which has comparatively lower 206Pb/204Pb and 207Pb/204Pb ratios (Figure 15a). The amphibolite sample also has similar 143Nd/144Nd and 147Sm/144Nd ratios to the Eagle peridotite suite, but is offset from the strong linear array of the Eagle peridotite samples (Figure 15b). Simple binary magma–magma 143Nd/144Nd and 147Sm/144Nd mixing models between magma from 100% melting of amphibolite indicates mixtures in the range of ~ 20–40% are possible for Tamarack samples and ~15–45% of amphibolite components within Eagle samples. Additionally, using multi-element mixing models, adding 100% amphibolite magma (in the range of ~5–25%) to a primitive mantle [51] base-magma composition successfully reconstructed the Eagle and Tamarack CGO and FGO peridotites samples examined in this study (see Section 5.5).
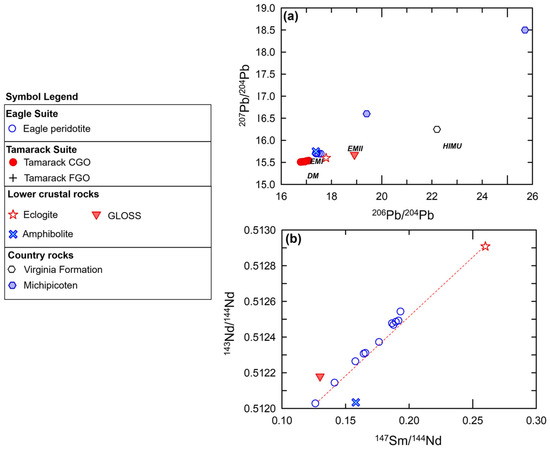
Figure 15.
(a) Whole-rock Pb206/Pb204 vs. Pb207/Pb204 isotopic ratios from country rock-hosted massive sulfides from Eagle and Tamarack [81] plotted with mantle compositions: HIMU (High-µ), DM (Depleted MORB mantle), EMI (enriched mantle 1), and EMII (enriched mantle 2) after [82], and kimberlite-hosted lower-crustal xenolith samples from [14]. GLOSS composition from [83]. The Archean country rocks are represented by the Michipicoten greenstone belt samples after [84]. The local sedimentary country rocks are represented by the Virginia Formation sample after [85]. (b) 147Sm/144Nd vs. 143Nd/144Nd plot for the Eagle peridotite [78], kimberlite-hosted lower-crustal xenolith samples from [14], GLOSS after [83].
5.3.2. SCLM-Hosted Eclogite Slab Component
Mixing of magma from another lower-crustal xenolith, eclogite sample (sample id: S10–11; ref. [14]) was evaluated. The eclogite is characterized by higher Sm/Nd (~0.4) and Th/U (~7) ratios relative to the Eagle–Tamarack peridotites and lower Th/La (~1.5) than the eclogite and most of the Eagle and Tamarack samples. The high Pb/Ce ratio (~0.2) of the eclogite sample is similar only to the Tamarack peridotite samples. Some examples of the possible mixing of magma derived from 100% melting of eclogite with Eagle–Tamarack mantle peridotite can be observed in peridotite sample arrays toward this low La/Sm, Th/Ta and high Sm/Nd eclogite end-member, compared to the higher La/Sm, Th/Ta and lower Sm/Nd ratios of country rock samples (Figure 14).
The Eagle peridotite bulk-rock and mineral samples (pyroxene, plagioclase) form a strong linear array of 143Nd/144Nd vs. 147Sm/144Nd between the eclogite and Eagle samples (Figure 16b). The eclogite samples have the highest 143Nd/144Nd and 147Sm/144Nd ratios of the xenolith suite, consistent with the derivation from a depleted mantle source. The Eagle peridotite samples plot in between enriched mantle I and depleted mantle end-members. Simple Nd-Sm isotope magma–magma-mixing modeling results in between ~20 and 60% eclogite magma mixed with components within Eagle peridotites. Similar mixing proportions of eclogite within Eagle peridotite were also found using 206Pb/204Pb and 207Pb/204Pb isotopic ratios (Figure 15a). Zartman et al. [14] found the clinopyroxene compositions of the eclogite xenolith samples used in our mixing analysis had ophiolitic affinities. Therefore, the magma-mixing between eclogite magma and the Eagle and Tamarack peridotite magmas are interpreted to have formed within a subduction zone preserved within the SCLM or incorporated within the upwelling mantle plume beneath the Superior Craton.
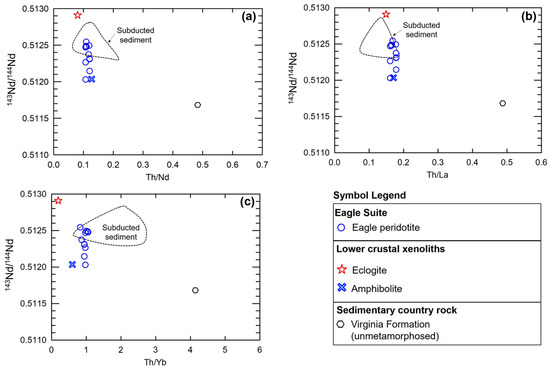
Figure 16.
(a) Th/Nd, (b) Th/La, and (c) Th/Yb vs. 143Nd/144Nd for the Eagle peridotite [78], kimberlite-hosted lower-crustal xenolith samples from [14], and subducted sediments after [86]; unmetamorphosed Virginia Formation after [72]. The 2σ error for all isotopic and elemental ratios is less than the size of the symbols used.
5.3.3. SCLM-Hosted Subducted Sediment Component
We find the best multi-element pattern reconstruction for the most primitive sample in the peridotite suite (Bowl sample 38/700.25) is achieved using 95% primitive mantle and 5% subducted sediments after [83]. Using the subducted sediment composition provides a reconstruction of the Th-Nb-Ta-U-K-P spikes, which cannot be replicated using local igneous or sedimentary country rock samples. The subducted sediment composition has high Th/Ta and La/Sm ratios, similar to the higher-range Eagle and Tamarack peridotite samples. Both subducted sediments and the Eagle–Tamarack peridotites also share similarly low Sm/Nd and mid-range Th/U values.
Subducted sediment compositions after [86] most closely match the 143Nd/144Nd isotopic ratios of the Eagle peridotite samples (Figure 16a–c). The low (~0.1–0.2) Th/La and Th/Nd ratios of subducted sediments also provide a source for LILE- and LREE-enrichment while maintaining the mantle-like Th/La and Th/Nd ratios found within the majority of Eagle and Tamarack peridotite samples. In comparison, Baraga and Animikie sediments and Archean granite–gneiss country rock samples have elevated (~0.15–0.4) Th/La and Th/Nd ratios (Supplement S9). Therefore, extensive incorporation of these local contaminates would result in too much of an increase in the Th/La and Th/Nd ratios of the peridotite.
5.3.4. Key Subduction-Related Tracers (B, Be, Li, and Sulfate)
We interpret the primary sources of B, Be, and Li within the Eagle peridotites to have been derived from fluids dehydrated from SCLM-hosted B-Be-Li-enriched eclogite and amphibolite slabs (208 ppm B [87]), 0.26–0.64 ppm Be [88] and 17–27 ppm Li [14], based on similarly enriched concentrations. Subducted sediments (~50 ppm B [89]) may have also contributed minor concentrations of B to the Eagle peridotite. Two factors preclude the local igneous and sedimentary country rocks from contributing significant quantities of B, Be, and Li to the Eagle peridotite: 1. insufficient concentrations (e.g., average B concentration of 12 ppm found within the local Baraga Basin sediments, and an estimated 9.2 ppm for Archean rocks of the Superior Craton; [90]), and 2. insufficient mixing proportions estimated within the Eagle peridotites (<5% Baraga Basin sediments, and 0% Archean country rocks). Although the Eagle–Eagle East and Tamarack peridotites underwent moderate-to-intense serpentinization, the effects on B, Be, and Li concentrations were found to be insignificant using the chemical index of alteration as a proxy for low-temperature hydrothermal alteration (e.g., serpentinization). Additionally, previous studies determined the S, O, Nd, and Os isotopic signatures of the Eagle and Tamarack peridotites are found to reflect mantle, and mantle–local country rock mixing [78,79], as opposed to signatures related to hydrothermal alteration (e.g., via Paleoproterozoic brines, e.g., [91]). Therefore, no evidence of post-magmatic hydrothermal alteration/low-temperature serpentinization is found to have significantly altered the composition of the peridotites.
Sulfate within the semi-massive and massive sulfides of the Eagle peridotite is also interpreted to have been primarily sourced from the eclogite- and amphibolite-rich SCLM components. Local igneous and sedimentary country rocks can be ruled out as potential contributors to the Eagle sulfate budget based again on insufficient concentrations (found to be below detection within all Baraga Basin sediment samples of this study, and estimated to be in the range of ~0.1–0.4 ppm within Paleoproterozoic sediments (e.g., [92])), and even lower concentrations within Archean rocks (e.g., [93]), which would require much higher mixing proportions than what is observed in the Eagle host rocks. The preservation of S, Re, and Os isotopic signatures within Eagle sulfide samples that reflect mantle and mantle–local country rock mixing (e.g., Re-Os isochrons are found to be in agreement with the ages obtained via U-Pb and Sm-Nd systems) [78], supports the preservation of magmatic sulfate as opposed to hydrothermal-related sulfate.
5.4. Alkaline–Transitional Magma-Mixing
Magma-mixing occurred between the alkaline Lower Siemens Creek and transitional upper Siemens Creek magma compositions and Eagle, Eagle East, Embayment, and Tamarack peridotites based on crystal (olivine, orthopyroxene)–liquid equilibrium (KD) modeling (Supplement S8). From these crystal–liquid equilibria calculations, magma–magma-mixing occurred at high-temperatures (in the range of ~1200–1300 °C) and pressures of ~1 GPa or approximately a depth of 30 km within the mid-crust. Lower- and upper-Siemens Creek components in the range of ~2–5% added to a primitive mantle composition (in addition to the other components discussed below) are found to be necessary in order to reconstruct the LREE patterns of Eagle and Tamarack peridotites.
The transfer of S-Ni-Cu-PGEs from low-degree alkaline melts to higher-degree tholeiitic Eagle, Eagle East, and Tamarack melts is interpreted as a possibility based on the presence of intermediate alkaline (unknown polarity) and transitional gabbro-to-pyroxenite samples on (Nb/Yb)PM vs. S, Ni, and Cu plots (Figure 9). The alkaline (unknown polarity) gabbro-to-pyroxenite intrusions could have also provided a significant source of S (some samples have S concentrations as high as ~1 wt%) to the tholeiitic melts. Additionally, localized sulfide mineralization (semi-massive-to-massive sulfide accumulations) identified within transitional gabbro samples may represent a preserved snap-shot of the transfer of sulfide cargos. This transfer of ore metals and sulfur from alkaline to tholeiitic melts maybe have been mediated by magmatic volatiles, similar to the models proposed by [69,70].
5.5. Crustal Contamination
The Archean basement-hosted peridotite sample EM108393A along the western margin of the gabbroic stock (Figure 3a) provides an example of the peridotite prior to interaction (e.g., melt-bulk assimilation) with the Baraga Basin sediments and a means to differentiate Baraga Basin contamination signatures from those of local Archean country rocks and possibly even deeper contaminates within the primary melts. The mixture that best fits the primitive mantle normalized patterns of the basement-hosted peridotite is 71% primitive mantle, 20% eclogite, 5% subducted sediment, 2% upper Siemens Creek Volcanic, and <5% average Archean country rock (Supplement S10).
The contribution of shallow Paleoproterozoic Baraga Basin country rock contamination (via bulk assimilation) to this primary melt composition was also evaluated using the peridotite samples from Eagle drillhole 03EA034, which transects the intrusion interior and margin (Figure 13; Supplement S11). The incorporation of sedimentary country rock contamination (<5%) is modeled to occur within the downhole section (183.15–199.81 m; DX19-DX33; Figure 17). The Tamarack FGO and CGO samples along the margin of the dike in contact with the Animikie sediments (samples 58/388, 58/399, and 58/465.3) (Figure 18) were also found to contain <5% sedimentary country rock. In contrast to the Eagle peridotite, the Tamarack peridotites are found to contain greater alkaline-transitional and subducted sediment components, which may explain the strong overlap between Tamarack peridotites and alkaline-transitional samples observed on the La/Sm vs. Th/U plot (Figure 8b).
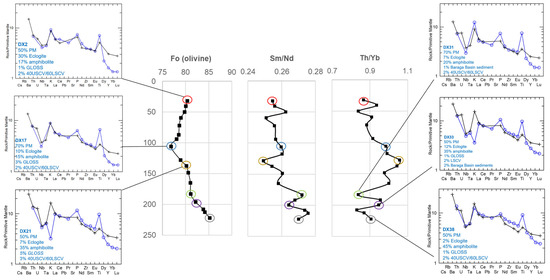
Figure 17.
Center: 03EA034 downhole plots of olivine-core forsterite (fo) content (mol %), Sm/Nd, and Th/Yb ratios with multi-element patterns for select samples presented to the left and right. The sample ID and mixing proportions of the multi-element mixing analysis are presented within each diagram. Analytical error (1σ) is smaller than the symbol size (see Supplement S4).
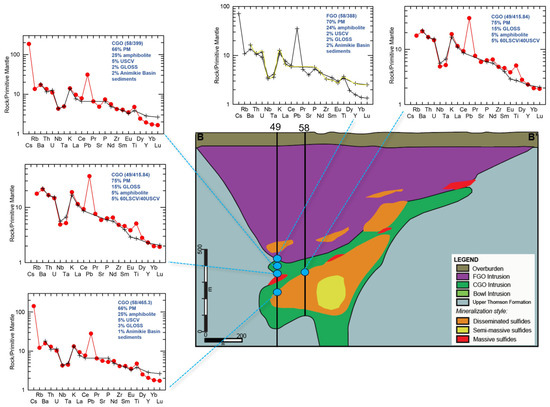
Figure 18.
Multi-element mixing analysis results for the Tamarack CGO and FGO dike samples from drillholes 49 and 58 (sample locations represented by blue circles). Analytical error (1σ) is smaller than the symbol size [41].
5.6. Magma-Mixing and Crustal Contamination Effects on Oxygen Fugacity
The relationship between mixing proportions, as determined from multi-element mixing analysis, associated with magma evolution and mineral deposition can be analyzed by integrating the bulk-rock major and minor elements, and spinel Fe3+/∑Fe ratios in Eagle drillhole 03EA034 (Figure 19). The overall downhole trends observed within drillhole 03EA034 can be divided into three main sections with reference to the 183 m sulfide-rich horizon: 1. above (32–165 m), 2. within (183 m sulfide-rich horizon), and 3. below (196–222 m). The first section (above the sulfide-rich horizon) is characterized by increasing-to-relatively consistent Ni (~0.1–0.4 wt%), Cu (~0.02–0.3 wt%), and S (~0.2–2 wt%) concentrations, consistent spinel Fe3+/∑Fe ratios (~0.4 to 0.5), overall decreasing eclogite proportions (from ~30% to 2%), overall increasing amphibolite (~15–45%) and subducted sediments (~1–5%) proportions, relatively consistent alkaline-transitional proportions (~2–3%), and zero Baraga Basin sediment proportions. Within the 183 m sulfide-rich zone (~1.4 wt% Ni, ~0.9 wt% Cu, ~7 wt% S), sharp troughs are observed in spinel Fe3+/∑Fe ratio (0.28), amphibolite (~20%), subducted sediment (0%), and alkaline-transitional (~2%) proportions, with a slight increase in eclogite (~7%) proportions. A sharp spike is observed in Baraga Basin sediments proportions, which increases to ~1% within the 183 m sulfide-rich horizon. The downhole plot below the sulfide-rich horizon consists of a decrease in Ni (~0.4–0.7 wt%), Cu (~0.2–0.4 wt%), and S (~3–1.6 wt%) concentrations, spinel Fe3+/∑Fe ratios increase (0.37) with a return toward decreasing values (0.36–0.28) downhole, an overall decrease in eclogite (~2–12%) and alkaline-transitional (~2–3%) proportions, increasing amphibolite (~20–45%) and subducted sediment (~1%), and increase in Baraga Basin sediment proportions (up to 2% at 199 m), which returns to zero toward the bottom of the hole.
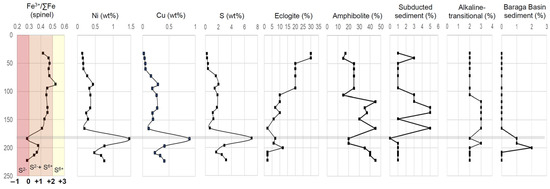
Figure 19.
Downhole profiles of drillhole 03EA034 of Fe3+/∑Fe ratios of spinel ([31]; with oxygen fugacity estimates (relative to FMQ) this study), Ni, Cu, and S (all in wt%; this study), and the relative proportion (%) of compositions (eclogite, amphibolite, subducted sediment, alkaline-transitional, and Baraga Basin sediments) used to reconstruct the multi-element compositions of Eagle peridotite. Analytical error (1σ) is estimated to be smaller than the symbol size (see Supplement S4).
In summary, we interpret that the incorporation of Baraga Basin sediments within the Eagle peridotite, even a relatively small amount (<5%), caused a shift in the melt redox conditions from +1 to +2 FMQ (within the sulfide + sulfate and sulfate stability fields, respectively) to FMQ (sulfide-only stability field) (e.g., [68,94]), triggering sulfide immiscibility as indicated by the highest concentrations of S-Ni-Cu (183 m sulfide-rich horizon) within this downhole example. Additionally, eclogite, amphibolite, subducted sediments, and alkaline-transitional components may have acted as oxidizing agents within the melt (e.g., [66,67]), resulting in the elevated oxygen fugacity conditions (+1 to +2 FMQ) within the Eagle peridotite above the 183 m sulfide-rich horizon. Further work is needed on these topics, with potential insights being gained by studying other magmatic Ni-Cu-PGE systems; for example, Marfin et al. [95] identified recycled eclogite components, incorporated via subduction-modified SCLM, within Norilsk Ni-Cu-PGE host rocks.
5.7. Geologic Model
This section presents a comprehensive geological model pre-, syn-, and post-rifting of the alkaline and tholeiitic intrusive rocks investigated in this study from source to shallow crust. Our model for the formation of the Eagle–Eagle East and Tamarack Ni-Cu-PGE deposits begins in the Late Archean with the development of the north-dipping subduction zone along the Great Lakes Tectonic Zone (Figure 20a) [8,9]. Another subduction zone during the Paleoproterozoic forms along the Niagara Fault Zone–Malmo Discontinuity, subparallel and to the south of the Great Lakes Tectonic Zone (Figure 20b) [13]. The Archean–Paleoproterozoic oceanic crustal slabs are partially melted and incorporated into the SCLM beneath the Superior Craton over the next ~1500 million years into the Mesoproterozoic (e.g., [77]).
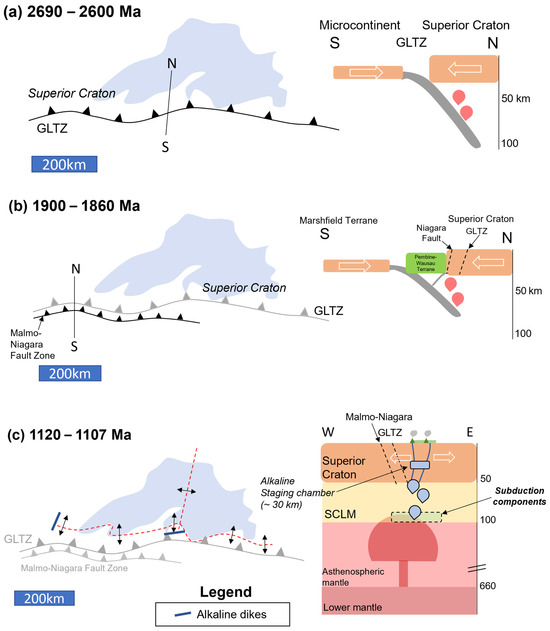
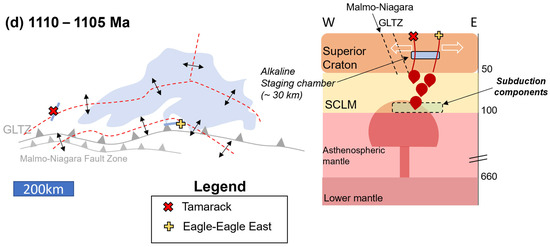
Figure 20.
Tectonomagmatic model (presented in planview and cross-section) for the Lake Superior Region (Lake Superior outline in blue for spatial reference) separated into three episodes: (a) 2690–2600 Ma: formation of the Great Lakes Tectonic Zone (GLTZ) as a north-dipping subduction zone (N-S cross-section: depths in km); (b) 1900–1860 Ma: formation of the Niagara Fault Zone–Malmo Discontinuity (NFZ-MD) during the Penokean Orogeny; (c) 1120–1107 Ma (E-W cross-section): mantle plume impacts the Superior Craton–SCLM (hosting Paleoproterozoic and Archean subduction components), initiating the Midcontinent Rift and forming deep HIMU-like alkaline melts. The alkaline melts stall at ~30 km, forming a staging chamber. (d) 1110–1105 Ma, Early-Magmatic Stage ([6]; E-W cross-section): emplacement of the Eagle–Eagle East (yellow cross), and Tamarack (red X) peridotite magmas within the developing rift (red-dashed lines). Incorporation of Archean and Paleoproterozoic subduction components as the melts form within the SCLM. Magma-mixing between alkaline and tholeiitic melts occurred within a ~30 km staging chamber.
The beginning stages of the MCR are dominated by the emplacement of alkaline magmas derived from depths greater than 90 km within the garnet stability field, analogous to the early stages of the East African Rift (e.g., [96,97]). Alkaline magmatism is expressed in the upper crust as hypabyssal dike swarms and extrusive flows of the Lower- and upper-Siemens Creek volcanics north of the Great Lakes Tectonic Zone in Upper Michigan. The alkaline melts have high-µ source compositions, indicating incorporation of subduction components along the lower portions of the SCLM.
The tholeiitic Eagle primary magma was derived by partial melting along the boundary between the garnet- and spinel-stability fields resulting in enriched mantle I signatures. High-temperature (~1200–1300 °C) alkaline and tholeiitic magma-mixing occurred within the mid-crust (~30 km) producing transitional primary magmas within the spinel stability field. The transfer of S-Ni-Cu-PGEs from low-degree alkaline melts to high-degree tholeiitic melts may have also occurred based on alkaline/transitional gabbro–pyroxenite samples forming an intermediate array between the alkaline and tholeiitic end-members on (Nb/Yb)PM vs. S, Ni, and Cu plots (Figure 9). Additionally, the preservation of small semi-massive to massive sulfide accumulations within transitional gabbro-to-pyroxenite samples may represent preserved evidence of the transfer of sulfide cargoes during magma-mixing.
Eagle primary magma was modified by magma-mixing with eclogite and amphibolite subduction components within the rising mantle plume or SCLM. In contrast to the tholeiitic Eagle primary magma, the Tamarack primary magmas were generated more shallowly within the spinel stability field and incorporated only amphibolite components within the SCLM. The Eagle and Tamarack magmas then ascend into the upper crust and incorporate <5% Baraga and Animikie Basin sediments. Contamination via Baraga Basin sediments (<5%) within the Eagle peridotite is interpreted to have shifted the oxygen fugacity conditions of the melt from FMQ +1 to +2 (sulfate + sulfide stability fields) to slightly below FMQ (sulfide only), triggering sulfide immiscibility and the formation of high-grade massive- and semi-massive sulfide deposits.
6. Conclusions
In the context of the three ingredients necessary to form a magmatic Ni-Cu-PGE deposit (1. magma, 2. ore metals, 3. sulfur), unique mantle source and enrichment characteristics that appear to separate the anomalously high-grade Eagle, Eagle East, and Tamarack peridotite hosted deposits from barren-to-lower-grade Midcontinent Rift-related rocks formed during the Initiation, Main, and Late Stages are summarized below:
1. Magma: The Eagle, Eagle East, and Tamarack peridotites are derived from high-degree tholeiitic partial melting of a rising mantle plume during the Early Stage of the Midcontinent Rift. In comparison, lower-degree partial melting of the mantle plume characterized the Initiation Stage (e.g., alkaline rocks in this study) and Main-to-Late Stages (more evolved intrusive magma compositions) of the Midcontinent Rift. Importantly, Midcontinent Rift-related magmatic Ni-Cu-PGE conduit-type deposits have only been discovered within Early-Stage tholeiitic primitive magmas (e.g., [21]).
2. Ore metals: This study shows that high-degree partial melting (~1500–1560 °C at a depth of ~120 km; [98]) of the mantle plume coupled with an interaction with an enriched SCLM containing Archean and Paleoproterozoic subduction components may have contributed to greater Ni-Cu-PGE concentrations within the Eagle, Eagle East, and Tamarack enriched melts. In comparison, uneconomic Late-Stage Midcontinent Rift rocks are sourced from a comparatively lower-degree partial melting of a thermally collapsed plume containing depleted mantle source signatures (e.g., [6]). Further work is needed in order to link specific SCLM compositions (e.g., eclogite, amphibolite, subducted sediments) to Ni-Cu-PGE-enrichment within the Eagle and Tamarack peridotites. Secondary enrichment of ore metals within the tholeiitic melts, transferred during magma-mixing with alkaline melts, also provides another mechanism to create the anomalously high grades observed within the Eagle, Eagle East, and Tamarack deposits.
3. Sulfur: The enriched SCLM composition during the Early Stage of the Midcontinent Rift would have also likely supplied additional sulfur to the Eagle, Eagle East, and Tamarack melts. As determined from this study, the incorporation of oxidized components (e.g., SCLM components, alkaline melts) within the Eagle, Eagle East, and Tamarack melts may have stabilized sulfur as sulfate (+2 FMQ; e.g., [68]), greatly increasing the solubility of sulfur within the melt and preventing sulfide saturation from occurring deep within the crust (e.g., [68,99,100,101,102,103]). The reduction of the Eagle melt from +2 FMQ (sulfate stability) to slightly below FMQ (sulfide stability) appears to be driven by the incorporation of Baraga and Animikie Basin sediments. Incorporation of reductive country rocks is not a unique process during any stage of the Midcontinent Rift (e.g., Duluth Complex [72], Logan sills [104]); however, the initial speciation of sulfur as sulfate, and major shifts in oxygen fugacity during emplacement, may be unique to Eagle and merits further work on the Eagle, Eagle East, and Tamarack deposits and other Midcontinent Rift-related rocks. Based on the oxygen fugacity estimates and sulfate concentrations presented in this study, another area of future work is the identification of rare but possibly preserved magmatic anhydrite–sulfide assemblages within the Eagle and Tamarack host rocks, similar to those identified within the Siberian Traps (e.g., [105,106]).
The results of this study provide an expanded geochemical interpretation for the exploration of Midcontinent rift-related Ni-Cu-PGE deposits to include Early-Stage ultramafic rocks derived from the high-degree partial melting of an enriched source (e.g., via SCLM subduction components), mixed with alkaline melts, and hosted within sulfur-bearing reductive sediments. This interpretation provides important new insights into the types of basement rocks and/or magmas that are required to potentially upgrade ore metals and sulfur in a melt, in addition to stabilizing sulfur to ensure that the metals can be “carried” to the shallow crust, forming an economic ore body.
Supplementary Materials
The following supporting information can be downloaded at: https://www.mdpi.com/article/10.3390/min15080871/s1, Supplement S1: summary of petrographic descriptions of lithologies examined in this study; Table S1: petrographic summary of rock-types examined in this study; Figure S1: photomicrographs of select samples; Figure S2: QEMSCAN images of Eagle peridotite samples; Supplement S2, summary: of analytical methods from previous studies used in this work; Table S2: analytical techniques and number of samples from the Eagle, Eagle East, and Tamarack deposits used in this study; Supplement S3, Table S3 (spreadsheet): Eagle Mine lithogeochemical dataset; Supplement S4, Table S4 (spreadsheet): summary of accuracy and precision for internal standards and duplicates analyzed in this study; Supplement S5, Table S5: median and correlation coefficient values of the geochemical compositions examined in this study; Supplement S6, summary: Spearman’s rank correlation formula; Supplement S7, summary: of mineral chemistry, thermobarometry, and oxygen fugacity estimates, Figure S3: mineral chemistry diagrams; Supplement S8, Table S6 (spreadsheet): summary of mineral chemistry, thermobarometry, and oxygen fugacity results; Supplement S9, Table S7: bulk-rock compositions used for multi-element mixing models; Supplement S10, summary: Archean basement-hosted peridotite mixing modeling, Figure S4 multi-element mixing diagram; Supplement S11, Table S8: multi-element mixing modeling results for the Eagle peridotite. Refs. [107,108,109,110,111,112,113,114,115,116,117] are cited in the Supplementary Materials.
Author Contributions
Conceptualization, R.N., C.D., and E.E.; methodology, R.N., C.D., and E.E.; software, R.N. and C.D.; validation, R.N. and C.D.; formal analysis, R.N. and C.D.; investigation, R.N. and C.D.; resources, R.N., C.D., and E.E.; data curation, R.N. and C.D.; writing—original draft preparation, R.N.; writing—review and editing, C.D.; visualization, R.N.; supervision, C.D. All authors have read and agreed to the published version of the manuscript.
Funding
This research received no external funding.
Data Availability Statement
The original contributions presented in this study are included in this article and the Supplementary Materials. Further inquiries should be directed to the corresponding authors.
Acknowledgments
We thank Lundin Mining for access and permission to publish the geochemical data presented in this work. The authors are also grateful to the Eagle Mine underground geologists for their time and access. The Eagle, Eagle East and Tamarack exploration geologists who worked on these deposits were pivotal in the collection of the data presented in this paper. Theodore Bornhorst and Peter Lightfoot are thanked for their constructive comments that greatly improved the quality of this work. We would also like to thank four anonymous reviewers for their constructive comments and suggestions which greatly improved the quality of this work.
Conflicts of Interest
The authors declare no conflicts of interest.
References
- Naldrett, A.J. Magmatic Sulfide Deposits: Geology, Geochemistry, and Exploration; Springer: Berlin/Heidelberg, Germany, 2010; 727p. [Google Scholar]
- Campbell, I.H.; Naldrett, A.J. The influence of silicate: Sulfide ratios on the geochemistry of magmatic sulfides. Econ. Geol. 1979, 74, 1503–1506. [Google Scholar] [CrossRef]
- Naldrett, A.J. World-class Ni-Cu-PGE deposits: Key factors in their genesis. Miner. Depos. 1999, 34, 227–240. [Google Scholar] [CrossRef]
- Keays, R.R.; Lightfoot, P.C. Crustal sulfur is required to form magmatic Ni-Cu sulfide deposits: Evidence from chalcophile element signatures of Siberian and Deccan Trap basalts. Miner. Depos. 2010, 45, 241–257. [Google Scholar] [CrossRef]
- Barnes, S.J.; Cruden, A.R.; Arndt, N.; Saumur, B.M. The mineral system approach applied to magmatic Ni-Cu-PGE sulphide deposits. Ore Geol. Rev. 2016, 76, 296–316. [Google Scholar] [CrossRef]
- Miller, J.; Nicholson, S. Geology and Mineral Deposits of the 1.1 Ga Midcontinent Rift in the Lake Superior Region—An Overview in Precambrian Research Center Field Guide 2013; University of Minnesota Duluth: Duluth, MN, USA, 2013; 50p. [Google Scholar]
- Naldrett, A.J. A Model for the Ni-Cu-PGE Ores of the Noril’sk Region and Its Application to Other Areas of Flood Basalt. Econ. Geol. 1992, 87, 1945–1962. [Google Scholar] [CrossRef]
- Sims, P.K.; Day, W.C. The Great Lakes Tectonic Zone-Revisited; U.S. Geological Survey: Michigan, WI, USA, 1993; p. 20.
- Gibbs, A.K.; Payne, B.; Setzer, T.; Brown, L.D.; Oliver, J.E.; Kaufman, S. Seismic-reflection study of Precambrian crust of central Minnesota. Geol. Soc. Am. Bull. 1984, 95, 280–294. [Google Scholar] [CrossRef]
- Wyman, D.A.; Hollings, P.; Conceicao, R.V. Geochemistry and radiogenic isotope characteristics of xenoliths in Archean diamondiferous lamprophyres: Implications for the Superior Province cratonic keel. Lithos 2015, 233, 111–130. [Google Scholar] [CrossRef]
- Sims, P.K. Great Lakes Tectonic Zone in Marquette Area, Michigan-Implications for Archean Tectonics in North-Central United States; Sims, P.K., Carter, L.M.H., Eds.; U.S. Geological Survey Bulletin 1904, Contributions to Precambrian Geology of Lake Superior Region; U.S. Geological Survey: Denver, CO, USA, 1991; p. 28.
- Schulz, K.J.; Cannon, W.F. The Penokean orogeny in the Lake Superior region. Precambrian Res. 2007, 157, 4–15. [Google Scholar] [CrossRef]
- Southwick, D.L.; Morey, G.B. Tectonic Imbrication and Foredeep Development in the Penokean Orogen, East-Central Minnesota-An Interpretation Based on Regional Geophysics and the Results of Test-Drilling; U.S. Geological Survey Bulletin 1904-C; U.S. Geological Survey: Denver, CO, USA, 1991; pp. 1–17.
- Zartman, R.E.; Kempton, P.D.; Paces, J.B.; Downes, H.; Williams, I.S.; Dobosi, G.; Futa, K. Lower-Crustal Xenoliths from Jurassic Kimberlite Diatremes, Upper Michigan (USA): Evidence for Proterozoic Orogenesis and Plume Magmatism in the Lower Crust of the Southern Superior Province. J. Petrol. 2013, 54, 575–608. [Google Scholar] [CrossRef]
- Hutchinson, D.R.; White, R.S.; Cannon, W.F.; Schulz, K.J. Keweenaw hot spot: Geophysical evidence for 1.1 Ga mantle plume beneath the Midcontinent Rift System. J. Geophys. Res. 1990, 95, 10869–10884. [Google Scholar] [CrossRef]
- Cannon, W.F. The Midcontinent rift in the Lake Superior region with emphasis on its geodynamic evolution. Tectonophysics 1992, 213, 41–48. [Google Scholar] [CrossRef]
- Wold, R.J.; Hinze, W.J. Geology and tectonics of the Lake Superior basin. Geol. Soc. Am. Mem. 1982, 156, 280. [Google Scholar]
- Ernst, R.E.; Bell, K. Large igneous provinces (LIPs) and carbonatites. Mineral. Petrol. 2010, 98, 55–76. [Google Scholar] [CrossRef]
- Stein, C.A.; Kley, J.; Stein, S.; Hindle, D.; Keller, G.R. North America’s Midcontinent Rift: When rift met LIP. Geosphere 2015, 11, 1607–1616. [Google Scholar] [CrossRef]
- Campbell, I.H. Identification of ancient mantle plumes. In Mantle Plumes: Their Identification Through Time; Ernst, R.E., Buchan, K.I., Eds.; Geological Society of America Special Paper: Boulder, CO, USA, 2001; Volume 352, pp. 5–21. [Google Scholar]
- Woodruff, L.G.; Schulz, K.J.; Nicholson, S.W.; Dicken, C.L. Mineral deposits of the Mesoproterozoic Midcontinent Rift system in the Lake Superior region—A space and time classification. Ore Geol. Rev. 2020, 126, 103716. [Google Scholar] [CrossRef]
- Nicholson, S.W.; Shirey, S.B.; Schulz, K.J.; Green, J.C. Rift-wide correlation of 1.1 Ga Midcontinent rift system basalts: Implications for multiple mantle sources during rift development. Can. J. Earth Sci. 1997, 34, 504–520. [Google Scholar] [CrossRef]
- Johnson, T.A. Petrology and Geochemistry of the Mafic and Ultramafic Dikes and Intrusions in Aitkin, Pine, and Carlton Counties, Minnesota. Master’s Thesis, Colorado School of Mines, Golden, CO, USA, 2015. [Google Scholar]
- Heaman, L.M.; Machado, N. Timing and origin of Midcontinent Rift alkaline magmatism, North America: Evidence from the Coldwell Complex. Contrib. Mineral. Petrol. 1992, 110, 289–303. [Google Scholar] [CrossRef]
- Walker, E.; Sutcliffe, R.; Shaw, C.; Shore, G.; Penczak, R. Precambrian Geology of the Coldwell Alkalic Complex; Ontario Geological Survey 1993, Open File Report 5868; Ministry of Northern Development and Mines, Mines and Minerals Division: Sudbury, ON, Canada, 1993; pp. 1–30.
- Schulz, K.J.; Nicholson, S.W. The geochemistry of the Siemens Creek Formation and the nature of early Midcontinent Rift basaltic magmatism in the western Lake Superior region. In Proceedings of the Institute on Lake Superior Geology Proceedings, 62nd Annual Meeting, Part 1—Proceedings and Abstracts, Duluth, MN, USA, 4–8 May 2016; pp. 133–134. [Google Scholar]
- Davis, D.W.; Green, J.C.; Manson, M. Geochronology of the 1.1 Ga North American Mid-Continent Rift. Can. J. Earth Sci. 1997, 34, 476–488. [Google Scholar] [CrossRef]
- Klewin, K.W.; Berg, J.H. Petrology of the Keweenawan Mamainse Point lavas, Ontario: Petrogenesis and continental drift evolution. J. Geophys. Res. 1991, 96, 457–474. [Google Scholar] [CrossRef]
- Walter, M.J. Melting of Garnet Peridotite and the Origin of Komatiite and Depleted Lithosphere. J. Petrol. 1998, 39, 29–60. [Google Scholar] [CrossRef]
- Faure, S.; Godey, S.; Fallara, F.; Trepanier, S. Seismic architecture of the Archean North American mantle and its relationship to diamondiferous kimberlite fields. Econ. Geol. 2011, 106, 223–240. [Google Scholar] [CrossRef]
- Ding, X.; Li, C.; Ripley, E.M.; Rossell, D.; Kamo, S. The Eagle and East Eagle sulfide ore-bearing mafic-ultramafic intrusions in the Midcontinent Rift System, upper Michigan: Geochronology and petrologic evolution. G3 Geochem. Geophys. Geosyst. 2010, 11. [Google Scholar] [CrossRef]
- Van Schmus, W.R.; Bickford, M.E.; Zietz, I. Early and middle Proterozoic provinces in the central United States. In Proterozoic Lithosphere Evolution; Kroner, A., Ed.; Geodynamic Series 1987; American Geophysical Union: Washington, DC, USA, 1987; Volume 17, pp. 43–68. [Google Scholar]
- Goldner, B.D. Igneous Petrology of the Ni-Cu-PGE Mineralized Tamarack Intrusion, Aitkin and Carlton Counties, Minnesota. Master’s Thesis, University of Minnesota, Duluth, MN, USA, 2011. [Google Scholar]
- Cannon, W.F. Map Showing Precambrian Geology in Parts of the Baraga, Dead River, and Clark Creek Basins, Marquette and Baraga Counties, Michigan 1977; U.S. Geological Survey: Denver, CO, USA, 1977.
- Klasner, J.S.; Snider, D.W.; Cannon, W.F.; Slack, J.F. The Yellow Dog Peridotite and A Possible Buried Igneous Complex of Lower Keweenawan Age in The Northern Peninsula of Michigan 1977; USGS Reports-Open File Series; U.S. Geological Survey: Denver, CO, USA, 1977.
- Morris, W.J. Geochemistry and origin of the Yellow Dog Plains Peridotite, Marquette County. Master’s Thesis, Michigan State University, East Lansing, MI, USA, 1977. [Google Scholar]
- Bornhorst, T.J.; Baxter, D.A. Reconnaissance Evaluation of Platinum-Group Elements in Selected Precambrian Rocks of the Western Upper Peninsula, Michigan; Michigan Department of Natural Resources Geological Survey Division: Lansing, MI, USA, 1990; Volume 90–92, pp. 1–9.
- Ding, X.; Ripley, E.M.; Li, C. PGE geochemistry of the Eagle Ni-Cu-(PGE) deposit, Upper Michigan: Constraints on ore genesis in a dynamic magma conduit. Miner. Depos. 2012, 47, 89–104. [Google Scholar] [CrossRef]
- Rupp, K. Petrogenesis of the Eagle East Gabbro in Marquette County, Michigan. Master’s Thesis, Western Michigan University, Kalamazoo, MI, USA, 2019. [Google Scholar]
- Thakurta, J.; Rupp, K.; Haag, B. Episodic Nature of Magmatic Ascent in a Dynamic Conduit System: Evidence From a Late Gabbroic Intrusion Associated with the Eagle Ni-Cu Sulfide Deposit in Northern Michigan, USA. Econ. Geol. 2022, 117, 1105–1130. [Google Scholar] [CrossRef]
- Taranovic, V.; Ripley, E.M.; Li, C.; Rossell, D. Petrogenesis of the Ni-Cu-PGE sulfide-bearing Tamarack Intrusive Complex, Midcontinent Rift System, Minnesota. Lithos 2015, 212–215, 16–31. [Google Scholar] [CrossRef]
- Jirsa, M.A.; Boerboom, T.J.; Chandler, V.W.; Mossler, J.H.; Runkel, A.; Setterholm, C.; Dale, R. S-21 Geologic Map of Minnesota-Bedrock Geology. Minnesota Geological Survey 2011, Retrieved from the University of Minnesota Digital Conservancy. Available online: https://hdl.handle.net/11299/101466 (accessed on 20 February 2023).
- Owen, M.L.; Meyer, L.H.I. NI 43-101 Technical report on the Eagle Mine, Upper Peninsula of Michigan, USA. In Proceedings of the Report for Lundin Mining Corporation 2013, Toronto, ON, Canada, 26 July 2013; pp. 1–241. [Google Scholar]
- Greenway, G. Mineral Resource and Reserve Estimate (Eagle East)—Internal Report. Lundin Mining, 8 September 2020. [Google Scholar]
- Talon Metals Corp. NI-43-101 Technical Report Preliminary Economic Assessment (PEA) of the Tamarack North Project-Tamarack, Minnesota 2018. Document Number: G02420-PA-RPT-007-02, pp. 1–332. Available online: https://talonmetals.com/wp-content/uploads/2020/08/Talon-Tamarack-PEA-Final.pdf (accessed on 12 January 2022).
- Nesbitt, H.W.; Young, G.M. Prediction of some weathering trends of plutonic and volcanic rocks based on thermodynamic and kinetic considerations. Geochim. Cosmochim. Acta 1984, 48, 1523–1534. [Google Scholar] [CrossRef]
- Barnes, S.J. Lithogeochemistry in exploration for intrusion-hosted magmatic Ni-Cu-Co deposits. Geochem. Explor. Environ. Anal. 2023, 23, geochem2022-025. [Google Scholar] [CrossRef]
- Floyd, P.A.; Winchester, J.A. Magma type and tectonic setting discrimination using immobile elements. Earth Planet. Sci. Lett. 1975, 27, 211–218. [Google Scholar] [CrossRef]
- Pearce, J.A. A User’s Guide to Basalt Discrimination Diagrams. In Trace Element Geochemistry of Volcanic Rocks: Applications for Massive Sulphide Exploration; Wyman, D.A., Ed.; Short Course Notes; Geological Association of Canada: St. John’s, NL, Canada, 1996; Volume 12, pp. 79–113. [Google Scholar]
- Lightfoot, P.C.; Naldrett, A.J.; Gorbachev, N.S.; Doherty, W.; Fedorenko, V.A. Geochemistry of the Siberian Trap of the Noril’sk area USSR with implications for the relative contributions of crust and mantle to flood basalt magmatism. Contrib. Mineral. Petrol. 1990, 104, 631–644. [Google Scholar] [CrossRef]
- Sun, S.S.; McDonough, W.F. Chemical and isotopic systematics of oceanic basalts: Implications for mantle composition and processes. Geol. Soc. Lond. Spec. Publ. 1989, 42, 313–345. [Google Scholar] [CrossRef]
- Naldrett, A.J.; Fedorenko, V.A.; Lightfoot, P.C.; Kunilov, V.E.; Gorbachev, N.S.; Doherty, W.; Johan, J. Ni-Cu-PGE deposits of the Noril’sk region Siberia: Their formation in conduits for flood basalt volcanism. Trans.-Inst. Min. Metall. 1995, 104, B18–B36. [Google Scholar]
- Pearce, J.A. Geochemical fingerprinting of oceanic basalts with applications to ophiolite classification and the search for Archean oceanic crust. Lithos 2008, 100, 14–48. [Google Scholar] [CrossRef]
- Condie, K.C. Mantle Plumes and Their Record in Earth History; Cambridge University Press: Cambridge, UK, 2001; p. 306. [Google Scholar]
- Larocque, A.C.L.; Stimac, J.A.; Keith, J.D.; Huminicki, M.A.E. Evidence for open behavior in immiscible Fe-S-O liquids in silicate magmas: Implications for contributions of metals and sulfur to ore-forming fluids. Can. Mineral. 2000, 38, 1233–1249. [Google Scholar] [CrossRef]
- Morris, J.D. Subduction, volcanism, and change in the Earth. Carnegie Inst. Wash. Year Book 1989, 88, 111–123. [Google Scholar]
- Dostal, J.; Dupuy, C.; Dudoignon, P. Distribution of boron, lithium and beryllium in ocean island basalts from French Polynesia: Implications for the B/Be and Li/Be ratios as tracers of subducted components. Mineral. Mag. 1996, 60, 563–580. [Google Scholar] [CrossRef]
- Wood, B.J.; Virgo, D. Upper mantle oxidation state: Ferric iron contents of Iherzolite spinels by 57Fe Mössbauer spectroscopy and resultant oxygen fugacities. Geochim. Cosmochim. Acta 1989, 53, 1277–1291. [Google Scholar] [CrossRef]
- Wood, B.J.; Bryndzia, L.T.; Johnson, K.E. Mantle oxidation state and its relationship to tectonic environment and fluid speciation. Science 1990, 248, 337–345. [Google Scholar] [CrossRef]
- Benard, A.; Klimm, K.; Woodland, A.B.; Arculus, R.J.; Wilke, M.; Botcharnikov, R.E.; Shimizu, N.; Nebel, O.; Rivard, C.; Ionov, D.A. Oxidising agents in sub-arc mantle melts link slab devolatilisation and arc magmas. Nat. Commun. 2018, 9, 3500. [Google Scholar] [CrossRef]
- Arndt, N.; Lesher, C.M.; Czamanske, G.K. Mantle-derived magmas and magmatic Ni-Cu-(PGE) deposits. Econ. Geol. 2005, 5–24. [Google Scholar] [CrossRef]
- Lesher, C.M.; Campbell, I.H. Geochemical and fluid dynamic modeling of compositional variations in Archean komatiite-hosted nickel sulfide ores in Western Australia. Econ. Geol. 1993, 88, 804–816. [Google Scholar] [CrossRef]
- Barnes, S.J.; Mungall, J.E.; Maier, W.D. Platinum group elements in mantle melts and mantle samples. Lithos 2015, 232, 395–417. [Google Scholar] [CrossRef]
- Wendlandt, R.F. Sulfide saturation of basalt and andesite melts at high pressures and temperatures. Am. Mineral. 1982, 67, 877–885. [Google Scholar]
- Keays, R.R. The role of komatiitic and picritic magmatism and S-saturation in the formation of ore deposits. Lithos 1995, 34, 1–18. [Google Scholar] [CrossRef]
- Sisson, T.W. Native gold in a Hawaiian alkalic magma. Econ. Geol. 2003, 98, 643–648. [Google Scholar] [CrossRef]
- Hong, L.; Xu, Y.; Zhang, L.; Liu, Z.; Xia, X.; Kuang, Y. Oxidized Late Mesozoic subcontinental lithospheric mantle beneath the eastern North China Craton: A clue to understanding cratonic destruction. Gondwana Res. 2020, 81, 230–239. [Google Scholar] [CrossRef]
- Jugo, P.J.; Luth, R.W.; Richards, J.P. An experimental study of sulfur content in basaltic melts associated with immiscible sulfide or sulfate liquids at 1300 °C and 1.0 GPa. J. Petrol. 2005, 46, 783–798. [Google Scholar] [CrossRef]
- Maughan, D.T.; Keith, J.D.; Christiansen, E.H.; Pulsipher, T.; Hattori, K.; Evan, N.J. Contributions from mafic alkaline magmas to the Bingham porphyry Cu-Au-Mo deposit, Utah, USA. Miner. Depos. 2002, 37, 14–37. [Google Scholar] [CrossRef]
- Chong, J.; Fiorentini, M.L.; Holwell, D.A.; Moroni, M.; Blanks, D.E.; Dering, G.M.; Davis, A.; Ferrari, E. Magmatic cannibalization of a Permo-Triassic Ni-Cu-PGE-(Au-Te) system during the breakup of Pangea- Implications for craton margin metal and volatile transfer in the lower crust. Lithos 2021, 388–389, 106079. [Google Scholar] [CrossRef]
- Ripley, E.M.; Li, C. Sulfide Saturation in Mafic Magmas: Is External Sulfur Required for Magmatic Ni-Cu-(PGE) Ore Genesis? Econ. Geol. 2013, 108, 45–58. [Google Scholar] [CrossRef]
- Ripley, E.M.; Lambert, D.D.; Frick, L.R. Re-Os, Sm-Nd, and Pb isotopic constraints on mantle and crustal contributions to magmatic sulfide mineralization in the Duluth Complex. Geochim. Cosmochim. Acta 1998, 62, 3349–3365. [Google Scholar] [CrossRef]
- Hofmann, A.W.; White, W.M. Mantle plumes from ancient oceanic crust. Earth Planet. Sci. Lett. 1982, 57, 421–436. [Google Scholar] [CrossRef]
- Zindler, A.; Hart, S.R. Chemical geodynamics. Annu. Rev. Earth Planet. Sci. 1986, 14, 493–571. [Google Scholar] [CrossRef]
- Hauri, E.H.; Hart, S.R. Correction to Constraints on melt migration from mantle plumes: A trace element study of peridotite xenoliths from Savai’i, Western Samoa. J. Geophys. Res. 1995, 100, 2003. [Google Scholar] [CrossRef]
- Wang, K.; Plank, T.; Walker, J.D.; Smith, E.I. A mantle melting profile across the Basin and Range, SW USA. J. Geophys. Res. 2002, 107, 1–21. [Google Scholar] [CrossRef]
- Shirey, S.B. Re-Os isotopic compositions of Midcontinent rift system picrites: Implications for plume-lithosphere interaction and enriched mantle sources. Can. J. Earth Sci. 1997, 34, 489–503. [Google Scholar] [CrossRef]
- Ding, X.; Ripley, E.M.; Shirey, S.B.; Li, C. Os, Nd, O and S isotope constraints on country rock contamination in the conduit-related Eagle Cu-Ni-(PGE) deposit, Midcontinent Rift System, Upper Michigan. Geochim. Cosmochim. Acta 2012, 89, 10–30. [Google Scholar] [CrossRef]
- Taranovic, V.; Ripley, E.M.; Li, C.; Shirey, S.B. S, O, and Re-Os Isotope Studies of the Tamarack Igneous Complex: Melt-Rock Interaction During the Early Stage of Midcontinent Rift Development. Econ. Geol. 2018, 113, 1161–1179. [Google Scholar] [CrossRef]
- Gair, J.E.; Thaden, R.E. Geology of the Marquette and Sands Quadrangles Marquette County, Michigan; U.S. Geological Survey Professional Paper 1968; U.S. Geological Survey: Washington, DC, USA, 1968; Volume 397, pp. 1–77.
- Smith, J.M.; Ripley, E.M.; Li, C.; Shirey, S.B.; Benson, E.K. Magmatic origin for the massive sulfide ores in the sedimentary country rocks of mafic-ultramafic intrusions in the Midcontinent Rift System. Miner. Depos. 2022, 57, 1189–1210. [Google Scholar] [CrossRef]
- Hofmann, A.W. Sampling Mantle Heterogeneity through Oceanic Basalts: Isotopes and Trace Elements. In Treatise on Geochemistry; Holland, H.D., Turekian, K.T., Eds.; Pergamon: Oxford, UK, 2007; pp. 1–44. [Google Scholar] [CrossRef]
- Plank, T.; Langmuir, C.H. The chemical composition of subducting sediment and its consequences for the crust and mantle. Chem. Geol. 1998, 145, 325–394. [Google Scholar] [CrossRef]
- Shirey, S.B.; Klewin, K.W.; Berg, J.H.; Carlson, R.W. Temporal changes in the sources of flood basalts: Isotopic and trace element evidence from the 1100 Ma old Keweenawan Mamainse Point Formation, Ontario, Canada. Geochim. Cosmochim. Acta 1994, 58, 4475–4490. [Google Scholar] [CrossRef]
- Hemming, S.R.; McLennan, S.M.; Hanson, G.N. Geochemical and Nb/Pb Isotopic Evidence for the Provenance of the Early Proterozoic Virginia Formation, Minnesota: Implications for the Tectonic Setting of the Animikie Basin. J. Geol. 1995, 103, 147–168. [Google Scholar] [CrossRef]
- Class, C.; Miller, D.M.; Goldstein, S.L.; Langmuir, C.H. Distinguishing melt and fluid subduction components in Umnak Volcanics, Aleutian Arc. Geochem. Geophys. Geosystems 2000, 1. [Google Scholar] [CrossRef]
- Rosner, M.; Erzinger, J.; Franz, G.; Trumbull, R.B. Slab-derived boron isotope signatures in arc volcanic rocks from the Central Andes and evidence for boron isotope fractionation during progressive slab dehydration. Geochem. Geophys. Geosyst. 2003, 4. [Google Scholar] [CrossRef]
- Brenan, J.M.; Ryerson, F.J.; Shaw, H.F. The role of aqueous fluids in the slab-to-mantle transfer of boron, beryllium, and lithium during subduction: Experiments and models. Geochim. Cosmochim. Acta 1998, 62, 3337–3347. [Google Scholar] [CrossRef]
- Nakano, T.; Nakamura, E. Boron isotope geochemistry of metasedimentary rocks and tourmalines in a subduction zone metamorphic suite. Phys. Earth Planet. Inter. 2001, 127, 233–252. [Google Scholar] [CrossRef]
- Shaw, D.M.; Cramer, J.J.; Higgins, M.D.; Truscott, M.G. Composition of the Canadian Precambrian Shield and the continental crust of the Earth. Geol. Soc. Lond. Spec. Publ. 1986, 24, 275–282. [Google Scholar] [CrossRef]
- Bodden, T.J.; Bornhorst, T.J.; Begue, F.; Deering, C. Sources of Hydrothermal Fluids Inferred from Oxygen and Carbon Isotope Composition of Calcite, Keweenaw Peninsula Native Copper District, Michigan, USA. Minerals 2022, 12, 474. [Google Scholar] [CrossRef]
- Kah, L.C.; Lyons, T.W.; Frank, T.D. Low marine sulphate and protracted oxygenation of the Proterozoic biosphere. Nature 2004, 431, 834–838. [Google Scholar] [CrossRef]
- Crowe, S.A.; Paris, G.; Katsev, S.; Jones, C.-A.; Kim, S.-T.; Zerkle, A.L.; Nomosatryo, S.; Fowle, D.A.; Adkins, J.F.; Sessions, A.L.; et al. Sulfate was a trace constituent of Archean seawater. Science 2014, 7, 735–739. [Google Scholar] [CrossRef]
- Li, Y.; Vocadlo, L.; Edgington, A.; Brodholt, J.P. Equation of state for CO and CO2 fluids and their application on decarbonation reactions at high pressure and temperature. Chem. Geol. 2021, 559, 119918. [Google Scholar] [CrossRef]
- Marfin, A.E.; Bizimis, M.; Lightfoot, P.C.; Yogodzinski, G.; Ivanov, A.; Brzozowski, M.; Latyshev, A.; Radomskaya, T. Constraints on the source of Siberian Trap magmas from Mo isotope evidence. Geochim. Cosmochim. Acta 2024, 375, 106–122. [Google Scholar] [CrossRef]
- Menzies, M. Alkaline rocks and their inclusions: A window on the Earth’s interior. Geol. Soc. Lond. Spec. Publ. 1987, 30, 15–27. [Google Scholar] [CrossRef]
- Kampunzu, A.B.; Lubala, R.T. (Eds.) Magmatism in Extensional Settings, the Phanerozoic African Plate; Springer: Berlin/Heidelberg, Germany, 1991; pp. 1–639. [Google Scholar]
- White, R.S. Mantle temperature and lithospheric thinning beneath the Midcontinent rift system: Evidence from magmatism and subsidence. Can. J. Earth Sci. 1997, 34, 464–475. [Google Scholar] [CrossRef]
- Jugo, P.J.; Wilke, M.; Botcharnikov, R.E. Sulfur K-edge XANES analysis of natural and synthetic basaltic glasses: Implications for S speciation and S content as a function of oxygen fugacity. Geochim. Cosmochim. Acta 2010, 69, 497–503. [Google Scholar] [CrossRef]
- Carroll, M.R.; Rutherford, M.J. Sulfide and sulfate saturation in hydrous silicate melts. J. Geophys. Res. 1985, 90, 601–612. [Google Scholar] [CrossRef]
- Carroll, M.R.; Rutherford, M.J. The stability of igneous anhydrite: Experimental results and implications for S behavior in the 1982 El Chichón trachyandesite and other evolved magmas. J. Petrol. 1987, 28, 781–801. [Google Scholar] [CrossRef]
- Luhr, J.F. Experimental phase relations of water-saturated and sulfur-saturated arc magmas and the 1982 eruptions of El Chichon volcano. J. Petrol. 1990, 31, 1071–1114. [Google Scholar] [CrossRef]
- Jugo, P.J. Sulfur content at sulfide saturation in oxidized magmas. Geology 2009, 37, 415–418. [Google Scholar] [CrossRef]
- Cundari, R.M.; Hollings, P.; Smyk, M.C.; Scott, J.F.; Campbell, D.A. Project Unit 11–007. Whole Rock and Isotope Data from the Midcontinent Rift: Implications for Crustal Contamination History. Ontario Geologic Survey 2011, OFR 6280, 18/1-18/10. Available online: https://prd-0420-geoontario-0000-blob-cge0eud7azhvfsf7.z01.azurefd.net/lrc-geology-documents/publication/MRD308-REV/MRD308-REV_readme.pdf (accessed on 20 March 2023).
- Li, C.; Ripley, E.M.; Naldrett, A.J.; Schmitt, A.K.; Moore, C.H. Magmatic anhydrite-sulfide assemblages in the plumbing system of the Siberian Traps. Geology 2010, 37, 259–262. [Google Scholar] [CrossRef]
- Mulcahy, C. Emplacement and Crystallization Histories of Cu-Ni-PGE Sulfide-Mineralized Peridotites in the Eagle and Eagle East Intrusions. Master’s Thesis, University of Minnesota-Duluth, Duluth, MN, USA, 2018. [Google Scholar]
- Dunlop, M. The Eagle Ni-Cu-PGE Magmatic Sulfide Deposit and Surrounding Mafic Dikes and Intrusions in the Baraga Basin, Upper Michigan: Relationships, Petrogenesis, and Implications for Magmatic Sulfide Exploration. Master’s Thesis, Indiana University, Bloomington, IN, USA, 2013. [Google Scholar]
- Rollinson, H.R. Using Geochemical Data: Evaluation, Presentation, Interpretation; Longman Scientific and Technical; Wiley: New York, NY, USA, 1993; 352p. [Google Scholar]
- Morimoto, N.; Fabries, J.; Ferguson, A.K.; Ginzburg, I.V.; Ross, M.; Seifert, F.A.; Zussman, J. Nomenclature of pyroxene. Am. Mineral. 1988, 73, 1123–1133. [Google Scholar]
- Barnes, S.J.; Roeder, P.L. The Range of Spinel Compositions in Terrestrial Mafic and Ultramafic Rocks. J. Petrol. 2001, 42, 2279–2302. [Google Scholar] [CrossRef]
- Rhodes, J.M.; Dungan, M.A.; Blanchard, D.P.; Long, P.E. Magma mixing at mid-ocean ridges: Evidence form basalts drilled near 22°N on the mid-Atlantic ridge. Tectonophysics 1979, 55, 35–61. [Google Scholar] [CrossRef]
- Putirka, K.; Perfit, M.; Ryerson, F.J.; Jackson, M.G. Ambient and excess mantle temperatures, olivine thermometry, and active vs. passive upwelling. Chem. Geol. 2007, 241, 177–206. [Google Scholar] [CrossRef]
- Putirka, K. Thermometers and Barometers for Volcanic Systems. In Minerals, Inclusions and Volcanic Processes: Reviews in Mineralogy and Geochemistry; Putirka, K., Tepley, F., Eds.; Mineralogical Society of America: Chantilly, VA, USA, 2008; Volume 69, pp. 61–120. [Google Scholar]
- Putirka, K.; Johnson, M.; Kinzler, R.; Walker, D. Thermobarometry of mafic igneous rocks based on clinopyroxene-liquid equilibria, 0–30 kbar. Contrib. Mineral. Petrol. 1996, 123, 92–108. [Google Scholar] [CrossRef]
- Putirka, K.; Ryerson, F.J.; Mikaelian, H. New igneous thermobarometers for mafic and evolved lava compositions, based on clinopyroxene + liquid equilibria. Am. Mineral. 2003, 88, 1542–1554. [Google Scholar] [CrossRef]
- Barnes, S.J.; Yao, Z.-S.; Mao, Y.-J.; Jesus, A.P.; Yang, S.; Taranovic, V.; Maier, W.D. Nickel in olivine as an exploration indicator for magmatic Ni-Cu sulfide deposits: A data review and re-evaluation. Am. Mineral. 2023, 108, 1–17. [Google Scholar] [CrossRef]
- Dare, S.; Barnes, S.J.; Beaudoin, G.; Meric, J.; Boutroy, E.; Potvin-Doucet, C. Trace elements in magnetite as petrogenetic indicators. Miner. Depos. 2014, 49, 785–796. [Google Scholar] [CrossRef]


Disclaimer/Publisher’s Note: The statements, opinions and data contained in all publications are solely those of the individual author(s) and contributor(s) and not of MDPI and/or the editor(s). MDPI and/or the editor(s) disclaim responsibility for any injury to people or property resulting from any ideas, methods, instructions or products referred to in the content. |
© 2025 by the authors. Licensee MDPI, Basel, Switzerland. This article is an open access article distributed under the terms and conditions of the Creative Commons Attribution (CC BY) license (https://creativecommons.org/licenses/by/4.0/).