Article

Mineralogy and Trace Element Chemistry of Ferberite/Reinite from Tungsten Deposits in Central Rwanda

1
Federal Institute for Geosciences and Natural Resources (BGR), Stilleweg 2, Hannover D-30655, Germany
2
Department of Geology and Mineralogy, Royal Museum for Central Africa (RMCA), Leuvensesteenweg 13, Tervuren B-3080, Belgium
3
Geodynamics and Geofluids Research Group, Department of Earth and Environmental Sciences, Katholieke Universiteit Leuven, Celestijnenlaan 200E, Leuven B-3001, Belgium
*
Author to whom correspondence should be addressed.
Minerals 2013, 3(2), 121-144; https://doi.org/10.3390/min3020121
Submission received: 7 January 2013 / Revised: 7 March 2013 / Accepted: 7 March 2013 / Published: 2 April 2013
(This article belongs to the Special Issue Advances in Economic Minerals)

Abstract

:
Tungsten mineralization in hydrothermal quartz veins from the Nyakabingo, Gifurwe and Bugarama deposits in central Rwanda occurs as the iron-rich endmember of the wolframite solid solution series (ferberite) and in the particular form of reinite, which represents a pseudomorph of ferberite after scheelite. Primary ferberite, reinite and late secondary ferberite are characterized by their trace element chemistry and rare earth element patterns. The replacement of scheelite by ferberite is also documented in the trace element composition. Primary ferberite shows high Mg, Zn, Sc, V, Nb, In and Sn concentrations, but very low Ca, Pb, Sr and Ba contents. Reinite and late secondary ferberite display an uncommon trace element composition containing high concentrations of Ca, Pb, Sr, Ba, As and Ga, but very low levels in Sn, Zr, Hf, In, Ti, Sc, Nb, Ta, Mg and Zn. Late secondary ferberite replacing primary ferberite is characterized by additional enrichments in Bi, Pb, As and Sb. The rare earth element patterns of reinite and secondary ferberite are also similar to hydrothermal scheelite. The formation of the tungsten deposits in central Rwanda is interpreted to be epigenetic in origin, and the hydrothermal mineralizing fluids are related to the intrusion of the G4-granites.

1. Introduction

Tungsten is a metal of high economic importance with unique properties. Major applications for tungsten are in cutting tools in the form of tungsten carbide, in the production of high speed steel, as an alloying component and as filaments in light bulbs. The most important tungsten minerals are the wolframite solid solution series [(Fe,Mn)WO4] and scheelite (CaWO4). In general, the formation of tungsten deposits is related to late-stage, highly evolved, granitic intrusions in orogenic belts. Tungsten is enriched by fractional crystallization in the residual melts and is subsequently concentrated in hydrothermal fluids. Tungsten deposits are generally formed by these fundamental processes, although there are several subdivisions of ore deposit types (including skarn, greisen and hydrothermal veins). Wolframite represents the dominant tungsten mineral in Central Africa (Democratic Republic of the Congo (DRC), Rwanda, Uganda and Burundi) and is generally found in hydrothermal quartz vein deposits.
Along the “tungsten belt” in central Rwanda, tungsten mineralization is hosted by quartz veins and is often present in the particular form of reinite, which represents a pseudomorph of ferberite after scheelite [1,2,3,4,5]. There is still debate on the genesis of these tungsten deposits. Formerly, the tungsten deposits of Rwanda and Uganda were interpreted to be syngenetic in origin. Previous authors stated that tungsten was absorbed by the carbonaceous organic matter of the black shale, followed by formation of metamorphic fluids and remobilization into vein-type deposits [6,7,8,9]. Today, most authors support an epigenetic granite-related hydrothermal deposition of the tungsten minerals in the quartz veins [2,3,5,10,11,12,13], and the anomalous high tungsten content of the carbonaceous shale represents the geochemical haloes around the ore bodies [2,11].
The occurrence of reinite is only reported from a few localities worldwide, for example, from the Cu-W-bearing tourmaline breccia pipe of Ilkwang (Korea) [14], Kimbosan and Sannotake deposits (Japan) [15], Mount Misobo (DRC) [1], Rutsiro area (Rwanda) [1] and several tungsten deposits in the Kigezi district in southwest Uganda (e.g., Ruhizha, Nyamalilo, Kirwa), which belong to the same “tungsten belt” and show very similar geological characteristics to the Rwandan deposits [6,7,8].
The aim of this study is the investigation of the paragenetic sequence and origin of vein-hosted tungsten deposits along the “tungsten belt” in central Rwanda. It is also demonstrated that ferberite in the form of reinite inherited its unusual trace element composition from the former scheelite. The first results on the trace element analysis of wolframite using the laser ablation inductively coupled plasma mass spectrometry (LA-ICP-MS) method are reported here.

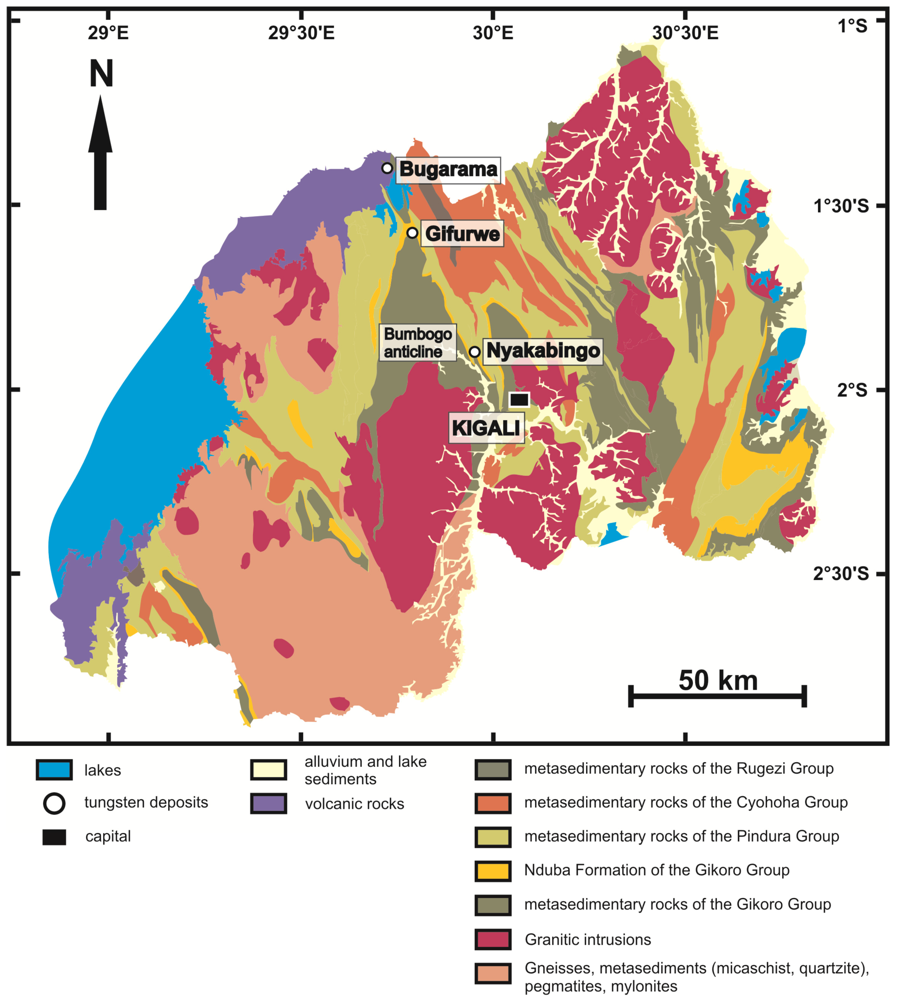
2. Geologic Setting of Tungsten Mineralization

The Kibara belt (or Kibaran belt) of Central Africa is generally portrayed as a single, continuous orogenic belt that trends northeast over approximately 1300 km from the Katanga region in the DRC up to the Ankole region in southwest Uganda. Recent work (see [16] and references therein) illustrated that there is a discontinuity in the traditionally defined Kibara belt [17] by the northwest-trending extension of the Palaeoproterozoic Ubende belt of southwest Tanzania across Lake Tanganyika into the Kivu-Maniema region of the DRC, where it has been mapped as the Palaeoproterozoic “Rusizian” basement [18,19,20]. The northern segment or the Karagwe-Ankole belt (KAB: Rwanda, Burundi, Maniema and Kivu Provinces in the DRC, southern Uganda and western Tanzania) and the southern segment or Kibara belt (KIB: Katanga Province in the DRC) are treated as two separate, but coeval belts [16].
The Palaeo- and Mesoproterozoic metasedimentary rocks of the KAB consist mainly of monotonous siliciclastic pelitic and psammitic sequences, interpreted as shallow-water deposits. The lithostratigraphy of the Akanyaru supergroup in central Rwanda is subdivided into four successive units: from bottom to top, the Gikoro, Pindura, Cyohoha and Rugezi groups (Figure 1; [10,21,22]). The rocks of the KAB were intruded by several generations of S-type granites (e.g., [17]). In the KAB, the main granite generation G1–G3 intruded the Palaeo- and Mesoproterozoic rocks between 1383 ± 17 Ma and 1371 ± 7 Ma (U-Pb sensitive high resolution ion microprobe (SHRIMP) on zircon; [16]). This magmatic event was followed by the intrusion of the G4-granites (or “tin granites”) at 986 ± 10 Ma (U-Pb SHRIMP on zircon; [16]). Cassiterite, columbite-tantalite (coltan) and wolframite mineralizations are related to this G4-granite generation, either forming pegmatites (Sn-Ta-Nb) or hydrothermal quartz veins (W-Sn) [23]. The present study focuses on the mineralogy, paragenesis and mineral chemistry of tungsten mineralization that occurs in the particular form of reinite in central Rwanda along the so-called north-northwest to south-southeast trending “tungsten belt”, more specifically, in the Nyakabingo, Gifurwe and Bugarama mines (Figure 1). The geology and tectonics at the Nyakabingo, Gifurwe and Bugarama deposits were investigated in detail by previous studies [2,3,5,10].
Most tungsten deposits in the “tungsten belt” are located on the flanks of the large Bumbogo anticline [21]. This anticline is composed of Mesoproterozoic rocks, which belong to the Gikoro and Pindura groups of the Akanyaru supergroup (Figure 1; [21,22]). The core of the anticline has been intruded by granites. All metasedimentary rocks have been submitted to a regional low grade metamorphism.
Tungsten mineralization in these deposits is generally related to quartz veins, but minor quantities also occur in the surrounding host rock. Ferberite (iron-rich endmember of the wolframite series) is the major tungsten ore mineral in the quartz veins, which are mainly hosted by alternating sandstones, quartzites and carbonaceous black shales. These rocks form part of the Bumbogo and Shyorongi Formations, which in turn are followed by the prominent quartzite of the Nduba Formation. All these formations belong to the Gikoro group (Figure 1; [5,10,21,24]).
The site of the tungsten vein-type deposits in the “tungsten belt” of Rwanda is controlled both structurally and lithologically. Structurally, the ore bodies are located in the core and along the flanks of large secondary anticlines, which contain numerous higher order folds. All the different fold directions interfere and give the mine areas a complex domal structure [1,2,3,5]. The anticlinal structures and domes acted as preferred intrusion sites for granites and as fluid traps [1,2,3]. The core and the flanks of the folds have been crosscut by numerous faults. Some of these fault zones might have acted as pathways along which the mineralizing fluids ascended. Lithologically, the tungsten mineralization is related to carbonaceous shale, which serves as a reactive horizon causing precipitation of tungsten minerals in this zone. The mineralizing hydrothermal fluids reacted with the pelitic metasedimentary rocks of the Shyorongi Formation [10].
Figure 1. Geological map of Rwanda showing the tungsten deposits of Nyakabingo, Gifurwe and Bugarama (modified after [24]).
Minerals 03 00121 g001
Three types of quartz veins have been observed [5]: (1) small folded bedding-parallel veins, which do not contain tungsten mineralization, (2) thick bedding-parallel quartz veins, which are mineralized in tungsten and (3) crosscutting quartz veins, which also contain tungsten. The width of the veins is generally 10 to 30 cm, but in places, these veins reach 1 m or more [2,25]. The small folded bedding-parallel quartz veins are always hosted by the carbonaceous shales. They are interpreted to have been formed by a crack-seal mechanism, at the onset of a compressional deformation event. Afterwards, these veins have been intensely buckled [5]. The thick W-mineralized bedding-parallel quartz veins are also typically hosted by the carbonaceous shales, where they formed along bedding-parallel parting planes. These veins are interpreted to be related to the intrusion of the G4-granites, which were emplaced in the context of post-collisional relaxation [5,22,23]. Both types of bedding-parallel veins are often crosscut by subvertical veins, which are at a high angle to bedding. The crosscutting W-mineralized veins are interpreted to have formed in a late stage of a deformation event, possibly overlapping in time with the formation of the W-mineralized bedding-parallel veins. The crosscutting quartz veins formed by the opening of pre-existing planar structures (cleavage planes, axial planes, joints), some of which were connected to form important pathways for the mineralizing fluids [5]. After their formation, all quartz veins have been crosscut by numerous faults.
Another characteristic feature of some Central African tungsten deposits along the “tungsten belt” is the presence of tungsten-bearing nodular concretions embedded in the carbonaceous shale [11], which is reported from the Gifurwe [2] deposit in Rwanda and the Ruhizha [6] and the Nyamalilo [7,8] deposits in southwest Uganda. At Gifurwe, such nodules are mainly composed of clay minerals, sericite, quartz, graphite and iron oxides (limonite, hematite) [2]. Sometimes, cavities after pyrite occur inside the concretions, which have often been filled by quartz and tourmaline. These quartz infillings are connected by fractures that crosscut the host rock [2]. Tungsten concentrations range from about 200 ppm to more than 2000 ppm, with an average of approximately 1100 ppm [2]. The concretions are spherical to lenticular in shape, and their diameter ranges from about 1 mm to 4 cm [7], even up to 10 cm [2,6,8].

3. Samples and Methods

3.1. Samples

In this study, ore concentrates from Nyakabingo and Gifurwe mines were investigated. In total, ten ore concentrates from the different tunnels of the Nyakabingo mine and two concentrates from the Gifurwe mine were taken. Ore concentrates represent the saleable product from mining by the upgrading of ore minerals during the beneficiation processes. Individual grains of these concentrates were analyzed for the trace element composition using LA-ICP-MS. A detailed study was performed on two samples of tungsten ore from the Bugarama mine (Bug10SD01 = polished section 1 and Bug10SD02 = polished section 2). These two specimens were analyzed using electron microprobe analysis and LA-ICP-MS. Polished sections were prepared from the concentrates and the ore samples. In a first step, the sample material is mounted in epoxy resin. After hardening of the resin, the specimen is ground and polished with abrasives of successively smaller grain sizes, until a uniformly flat, scratch-free and highly reflective surface is generated.

3.2. Microscopy

A polarizing microscope was used for examination of mineralogical features of reinite/ferberite in polished sections under reflected light.

3.3. Electron Microprobe Analysis

An SX-100 microprobe (Cameca, Gennevilliers, France) was used for non-destructive elemental analyses with a high spatial resolution (about 1 µm) and element mapping of solid samples with polished surfaces. The measurement conditions were set to an acceleration voltage of 20 kV at a beam current of 40 nA. The following elements were analyzed: Mg (Kα), Al (Kα), Si (Kα), Ca (Kα), Mn (Kα), Fe (Kα) and W (Lα). Chromite for Mg, synthetic Y-Al-garnet for Al, rhodonite for Si and Mn, apatite for Ca, magnetite for Fe and tungsten metal for W were used as standards. The detection limits ranged from 65 to 1300 ppm, depending on the lines selected and on the measurement time of single elements.

3.4. Laser Ablation Inductively Coupled Plasma Mass Spectrometry (LA-ICP-MS)

LA-ICP-MS analyses were performed on an ELEMENT-XR (Thermo Fisher Scientific, Dreieich, Germany) high-resolution sector field inductively coupled plasma-mass spectrometer coupled to an UP193-FX (ESI New Wave Research, Huntingdon, UK) laser ablation system with an ATLEX-300-SI (ATL Lasertechnik, Wermelskirchen, Germany) excimer laser.
At each sampling point, eight passes of 50 × 130 µm lines are ablated at 10 Hz with a speed of 5 µm/s. The laser energy is fixed to 65% of 4 mJ for ablation of wolframite and 80% of 4 mJ for the ablation of the reference material, NIST 610. Prior to every analysis, a pre-ablation scan is run to remove any contamination from the sample surface (one pass, 75 × 155 µm, 10 Hz, 15 µm/s). The wash out time after every ablation process takes 80 s. Line scan ablation is favored over spot ablation, resulting in lower detection limits and a more constant signal response at higher intensity levels. Data acquisition by the mass spectrometer takes 358 s. During the first 140 s, the laser beam path is blocked by a shutter to analyze the background signal. The mass spectrometer performs 25 passes over the whole mass range in low (LR) and medium (MR) resolution and is constantly switching between these two resolutions with a switch delay of 1 s.
The following isotopes have been analyzed: 69Ga, 75As, 89Y, 95Mo, 107Ag, 111Cd, 115In, 118Sn, 121Sb, 137Ba, 139La, 140Ce, 141Pr, 146Nd, 147Sm, 153Eu, 157Gd, 159Tb, 163Dy, 165Ho, 166Er, 169Tm, 172Yb, 175Lu, 177Hf, 201Hg, 204Pb, 205Tl, 206Pb, 207Pb, 208Pb, 209Bi and 238U in LR and 12C, 24Mg, 27Al, 29Si, 31P, 32S, 44Ca, 45Sc, 47Ti, 51V, 52Cr, 55Mn, 56Fe, 59Co, 60Ni, 63Cu, 66Zn, 88Sr, 90Zr, 93Nb, 181Ta, 182W and 232Th in MR. For all elements, both secondary electron multiplier (SEM) and Faraday detector are used, depending on the count rate.
Since matrix matched mineral standards with certified element concentrations are not available for wolframite, an external calibration using a non-matrix matched reference material with internal standardization has been applied. The glass NIST SRM 610 (National Institute of Standards and Technology, Gaithersburg, MD, USA) is used as a reference material for which numerous trace element concentrations in the range of 500 ppm are certified [26]. The NIST glasses are often used as calibration materials for micro-analytical trace element measurements, because the concentrations of all trace elements are high enough for precise primary calibration [27].
The NIST SRM 610 reference material is measured repeatedly during a sequence. Tungsten was used as the internal standard. The tungsten concentration of the samples was calculated from the known stoichiometry of wolframite (Fe0.5Mn0.5)WO4 (60.63 wt % W). Due to the small difference in atomic mass between Fe and Mn, only a small error occurs if other members of the wolframite solid solution series are analyzed using this stoichiometry. The concentrations for each element are calculated using the equation given by Longerich et al. [28], and an ablation yield correction is applied using the internal standardization to correct the differences in mass of the different ablated materials [29]. This procedure has proven to provide acceptable analyses for many elements in many sample matrices without matrix matching [30]. Detection limits are calculated for each element on the basis of three times the standard deviation of the background measurement [31].
Data reduction was handled with a software tool, which was implemented in JAVA using the libraries JFreeChart, commons Math and POI [32]. The signals for background and sample measurements are time-resolved, and therefore, selected time intervals are integrated for the blank and sample signals. The net intensities are calculated by subtracting the background intensity from the signal intensity. The median values of the time-resolved signals are used to reduce the effect of outliers. Higher signal intensities caused by mineral inclusions are identified by examination of the time-resolved signal, and these measurements are discarded.

4. Results

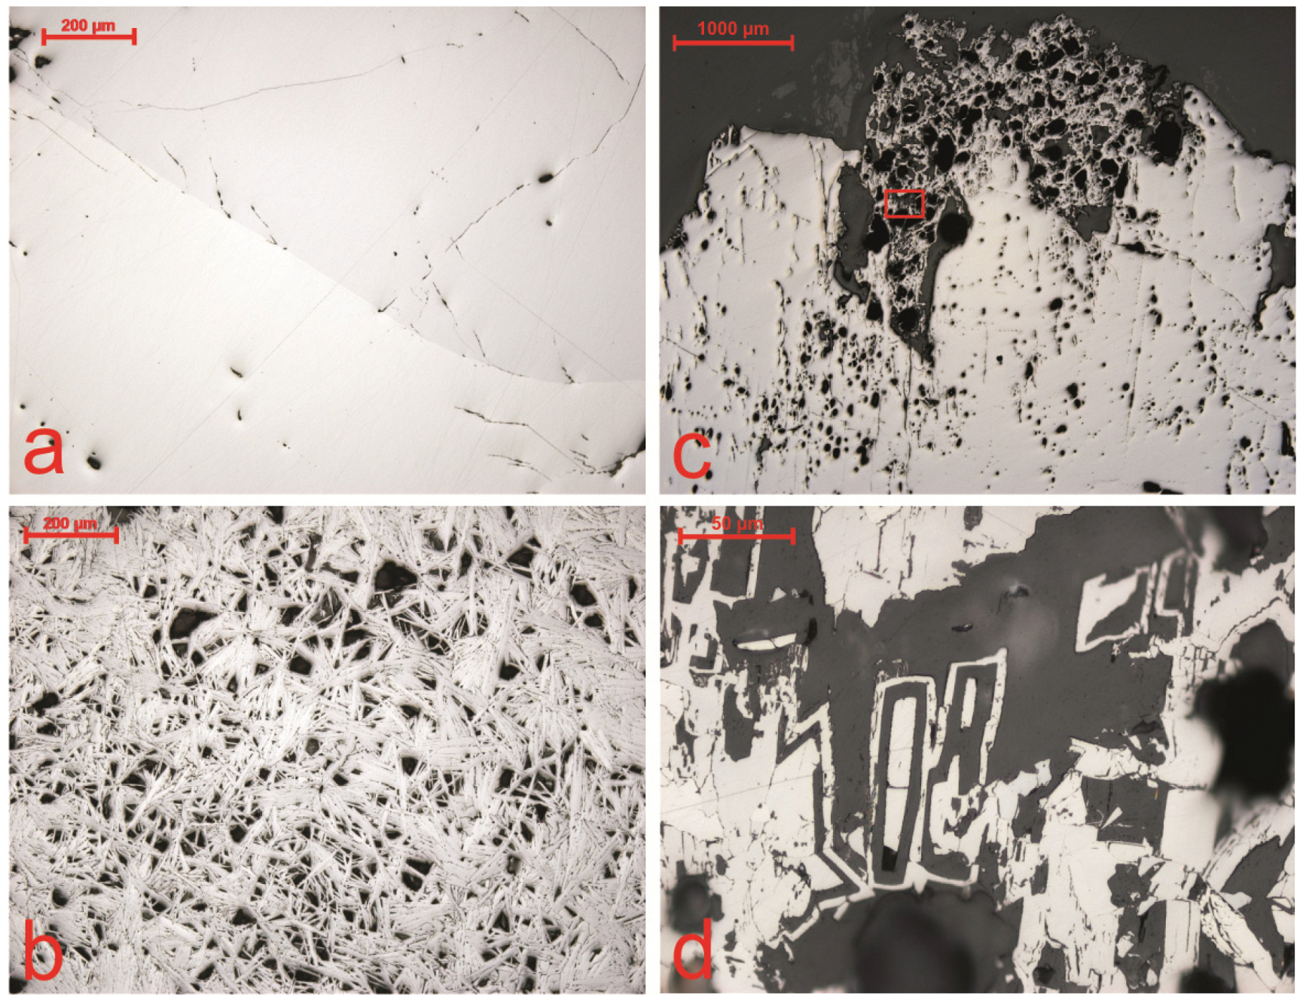
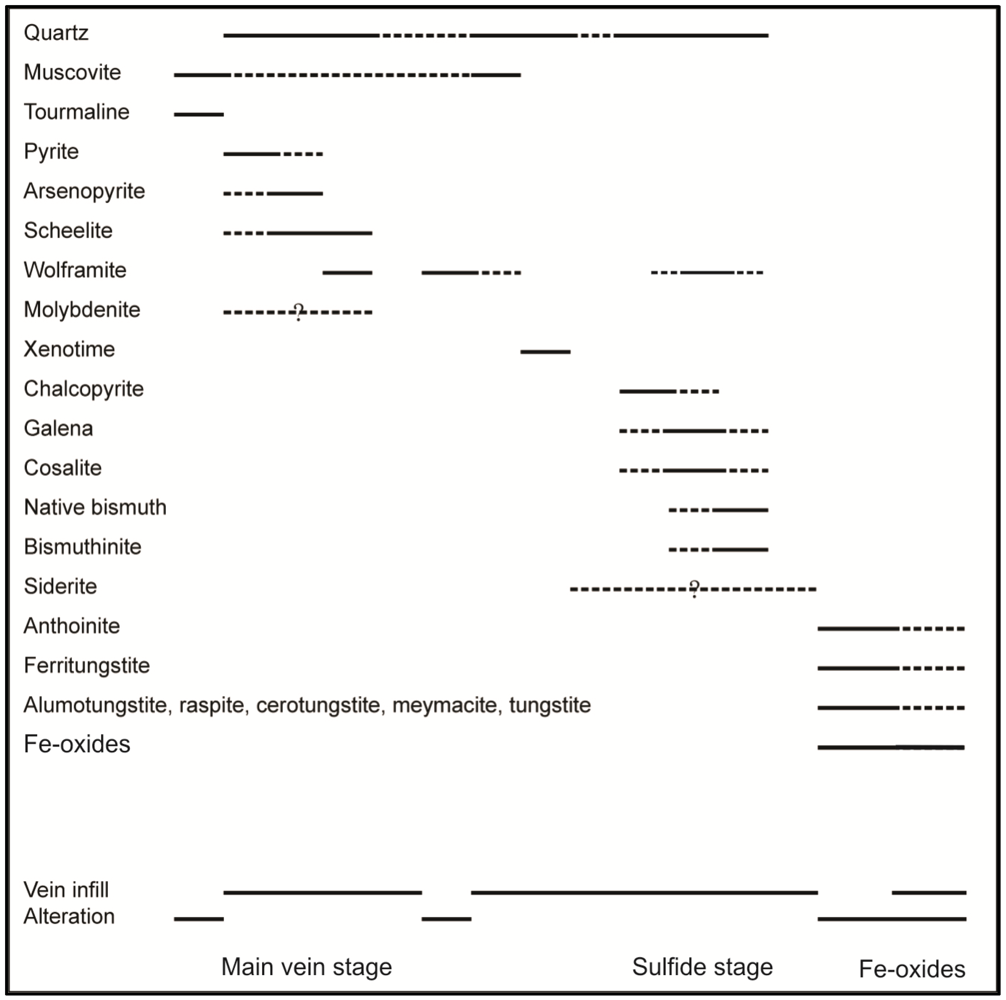
4.1. Microscopy and Mineralogy

Tungsten mineralization along the “tungsten belt” in Rwanda is present in bedding-parallel and crosscutting quartz veins. These veins display the same mineralogy, and different stages have been observed during the evolution of the mineralized quartz veins. First, the contact zone between the veins and the surrounding host rock has been altered by sericitization and tourmalinization, subsequently followed by the formation of large muscovite crystals bordering the veins. Then, the bulk of the quartz veins formed during the main vein stage, together with scheelite, massive ferberite, pyrite, molybdenite and euhedral arsenopyrite. Massive, pristine ferberite occurs as large aggregates in massive quartz veins; in a few cases, euhedral tabular-prismatic crystals are developed, showing shiny cleavage planes with distinct metallic luster (Figure 2a; also termed type-1 in the following sections). Occasionally, massive ferberite occurs next to scheelite crystals. In that case, ferberite contains a large amount of aligned scheelite inclusions. In the absence of large scheelite crystals, only a few small scheelite inclusions sporadically occur in massive ferberite. Massive ferberite also contains small pyrite inclusions, and veins of scheelite have been observed crosscutting large ferberite crystals.
Next, the scheelite crystals were replaced by ferberite, forming pseudomorphs called reinite. Reinite represents a variety of polycrystalline ferberite, which is commonly present as euhedral aggregates still displaying the typical bipyramidal-tetragonal habit of scheelite [2,4]. Because of the porous character of this second type of ferberite, the bipyramidal aggregates are never intact, but the complete imprint of the bipyramid can still be seen on the surrounding quartz crystals. Microscopically, the ferberite aggregates are composed of individual small or even tiny fibrous crystals with dull-metallic luster (also termed type-2 in the following chapters). The polycrystalline ferberite occurs in various textures, including needle-like bundles, tabular prisms oriented almost perpendicular to each other or randomly oriented fibers (Figure 2b; [2,5]). In most cases, the ferberite is more massive at the contact with the surrounding quartz crystals or host rock and becomes more porous towards the center. The alignment of the pores results in a prominent boxwork texture.
Cubic cavities are found in the quartz veins and in the surrounding host rocks. These cavities are now partly filled with Fe-oxides, such as goethite, limonite and secondary hematite [2,12,13]. Sometimes pristine, massive ferberite (type-1) is replaced by skeletal or fibrous ferberite (type-3) crystals with many pores and cavities (Figure 2c,d; also termed type-3 in the following chapters). This kind of ferberite is sometimes accompanied by quartz veins containing xenotime inclusions. Pores are sometimes present in the pristine ferberite, but the development of these pores is not accompanied by the growth of fibrous ferberite. No minerals are present in these pores. The reinite has been fractured and is also filled by an assemblage of quartz, muscovite and xenotime. In addition, a sulfide stage occurred, which is intergrown with quartz. The sulfide minerals include chalcopyrite, galena, which is intergrown with cosalite, and, finally, native bismuth and bismuthinite. Siderite veinlets crosscut the early arsenopyrite and pyrite crystals, but it is unclear if this occurred during the sulfide stage. Remaining scheelite crystals inside the reinite were altered together with some ferberite crystals to different secondary tungstates, like ferritungstite, anthoinite, alumotungstite, cerotungstite, meymacite, raspite and different Fe-oxides [4,8,33,34,35,36,37,38]. Nevertheless, some primary scheelite is still present as small grains enclosed in quartz and in massive ferberite [2,3,5]. Fe-oxides, such as hematite and goethite, precipitated in fractures throughout the veins. The paragenetic sequence of the mineralized quartz veins is illustrated in Figure 3.
Figure 2. Photomicrographs in plane polarized reflected light showing the different ore textures of ferberite and reinite. (a) Large primary ferberite crystal (type-1) showing simple twinning; (b) Reinite (type-2) composed of randomly oriented fibrous ferberite crystals forming a porous aggregate; (c) Replacement of primary ferberite (type-1) by porous secondary ferberite (type-3); The rimmed box indicates the area of view in (d); (d) Secondary ferberite (type-3) is characterized by skeletal growth texture surrounded by empty cavities. The area of this view is indicated by a rimmed box in (c).
Minerals 03 00121 g002
Figure 3. Paragenetic sequence of the W-mineralized quartz veins from tungsten deposits along the “tungsten belt” in central Rwanda (modified after [5]). Clear temporal relationships are marked by solid lines. Uncertain assignments are marked with dashed lines.
Minerals 03 00121 g003

4.2. Trace Elements

In our study, single grains of ferberite/reinite (about 50 single grains per ore concentrate) from Nyakabingo (ten ore concentrates taken from different adits in the mine) and Gifurwe (two ore concentrates taken from the processing plant) were analyzed for their trace element composition using LA-ICP-MS (Table 1, Table 2). In the literature, mostly only the major element compositions of wolframite are reported. There is little information dealing with trace elements in wolframite using electron microprobe analysis, e.g., [39,40,41,42,43,44], or atomic absorption spectroscopy [45]. In comparison to typical hydrothermal wolframite from deposits distributed all over the world (unpublished data [46]), ferberite/reinite from Nyakabingo and Gifurwe show enrichments in Ca, Pb, Sr, Ba, Al, Ga, As, Bi, Sb and Mo (Figure 4). On the contrary, other elements are at comparatively low concentration levels (e.g., Sn, Zr, Hf, In, Ti, Sc, Nb, Ta, V, Mg, Zn and U). These trace element compositions and rare earth element (REE) patterns differ significantly compared to other wolframite deposits worldwide (Figure 4, unpublished data [46]).
A detailed study on the pseudomorphism of ferberite after scheelite was performed on two polished sections (polished section 1 and section 2) from Bugarama using electron microprobe and LA-ICP-MS (20 LA-ICP-MS analyses per polished section; Figure 5). Three different petrographic types of ferberite can be distinguished based on their trace element composition and REE patterns. Type-1 ferberite (XFe ~94%) is characterized by comparatively high concentrations in Mg, Sc, Ti, V and Zn with moderate Nb, In and Sn and low Ga, As, Y, Mo, Ag, Ba, La, Ca, Sr, Th and Pb contents. Type-3 ferberite (XFe ~90%) shows the opposite trend in its trace element distribution compared to type-1 with high concentrations in Ga, As, Y, Ba, La, Lu, Ca, Sr, Th and Pb, moderate Mo, Sc, Ti, V and Nb and low Mg, Zn, In and Sn contents. Type-2 ferberite (XFe ~97%) displays an intermediate trace element composition between type-1 and type-3 ferberites with a characteristic assemblage of Mo, Ga, As, Y, Ba, Ca, Zn, Sr, Th and Pb (Figure 6, Figure 7).
Table 1. Trace element composition of ferberite/reinite from the Gifurwe and Nyakabingo deposits given as the 25th percentile, median, 75th percentile and 90th percentile of 75 analyses on individual grains in ore concentrates from Gifurwe and 500 analyses on individual grains in ore concentrates from Nyakabingo. Additionally, the median values for the analyses of the different ferberite types (type-1, type-2, type-3) from two polished sections (polished section 1 and 2) from the Bugarama deposit are also given. If values are below the detection limit, the detection limit are given as the 80th percentile of all detection limits from the individual analysis per single sample.
ElementGifurwe ( n = 75)Nyakabingo ( n = 500)Bugarama ( n = 40)
type-1 ( n = 14)type-2 ( n = 20)type-3 ( n = 6)
p0.25medianp0.75p0.90p0.25medianp0.75p0.90medianmedianmedian
Ga (ppm)1.413.817.2711.456.1210.6921.8144.03<0.463.1027.34
As (ppm)28.359.298.9131.222.437.579.6157.1<0.6423.486.7
Mo (ppm)4.15.16.99.76.37.89.311.4<1.18.71.4
Ag (ppm)<0.060.110.210.47<0.160.090.230.38<0.18<0.13<0.14
Cd (ppm)<0.28<0.28<0.280.14<0.38<0.380.180.47<0.48<0.28<0.36
In (ppm)<0.03<0.03<0.030.04<0.03<0.03<0.030.052.64<0.03<0.04
Sn (ppm)<1.72<1.72<1.720.90<0.60<0.60<0.60<0.601.29<0.21<0.30
Sb (ppm)<0.120.240.421.01<0.160.150.411.12<0.16<0.161.20
Ba (ppm)11.022.249.173.246.378.6155.8297.5<1.0614.6178.6
Hf (ppm)<0.03<0.030.010.04<0.06<0.060.040.10<0.07<0.040.06
Tl (ppm)0.020.040.060.110.010.030.080.18<0.030.02<0.02
Bi (ppm)<0.030.030.281.53<0.060.150.631.83<0.070.082.35
U (ppm)0.070.140.330.770.130.290.741.940.030.010.21
Mg (ppm)10172332<711233117571210
Al (ppm)18812939753697280619<1149595
Ca (ppm)156230304387168240346507<104275685
Sc (ppm)<0.6<0.6<0.60.5<0.60.51.43.515.5<0.62.1
Ti (ppm)<0.9<0.9<0.92.4<4.80.83.910.764.7<1.731.0
V (ppm)<0.22<0.220.190.49<0.340.330.841.562.6<0.341.18
Cr (ppm)<0.13<0.130.521.01<0.230.431.242.730.240.481.63
Mn (wt %)0.520.881.321.810.830.981.181.441.120.512.02
Fe (wt %)16.8217.5918.4519.8418.3919.0619.9720.7219.519.0419.3
Co (ppm)<0.210.704.5324.14<0.348.5136.7668.90<0.43<0.28<0.50
Cu (ppm)<3.1<3.11.07.1<6.6<6.67.415.6<9.6<5.2<8.0
Zn (ppm)91226127133232747739103
Sr (ppm)2.74.36.18.54.16.910.617.7<0.97.830.2
Zr (ppm)<0.20<0.200.351.48<0.490.602.225.891.060.351.35
Nb (ppm)173258783759901221835188
Ta (ppm)0.220.400.730.880.500.801.181.761.910.131.67
Th (ppm)0.040.150.360.850.070.290.912.5000.473.78
Pb (ppm)405684985877104134<0.423786
Table 2. Rare earth element composition of ferberite/reinite from the Gifurwe and Nyakabingo deposits given as the 25th percentile, median, 75th percentile and 90th percentile of 75 analyses on individual grains in ore concentrates from Gifurwe and 500 analyses on individual grains in ore concentrates from Nyakabingo. Additionally, the median values for the analyses of the different ferberite types (type-1, type-2, type-3) from two polished sections (polished sections 1 and 2) from the Bugarama deposit are also given. If values are below the detection limit, the detection limit are given as the 80th percentile of all detection limits from the individual analysis per single sample.
ElementGifurwe ( n = 75)Nyakabingo ( n = 500)Bugarama ( n = 40)
type-1 ( n = 14)type-2 ( n = 20)type-3 ( n = 6)
p0.25medianp0.75p0.90p0.25medianp0.75p0.90medianmedianmedian
La (ppm)1.683.635.216.953.004.377.009.77<0.023.3411.32
Ce (ppm)4.839.8414.7417.6510.3914.3419.9828.27<0.015.1412.46
Pr (ppm)0.791.492.283.082.002.723.925.24<0.017.6815.50
Nd (ppm)4.117.5912.5217.7510.0015.4722.6931.09<0.0512.5122.61
Sm (ppm)1.082.224.015.432.744.967.7711.46<0.0518.5789.67
Eu (ppm)0.651.351.962.941.362.483.985.54<0.0419.4622.92
Gd (ppm)1.092.574.657.532.636.0510.7017.74<0.1716.32170.08
Tb (ppm)0.260.721.111.770.591.412.464.001.4822.19204.61
Dy (ppm)1.966.2111.6616.994.9011.2622.2134.583.5027.35202.82
Y (ppm)11.2230.3969.81128.0826.5971.37154.04241.764.3221.55126.23
Ho (ppm)0.571.933.275.431.303.146.169.906.9735.51201.95
Er (ppm)3.127.4313.8421.365.8613.3324.4837.8616.3748.13222.91
Tm (ppm)0.931.883.224.171.413.025.217.4141.9553.35256.07
Yb (ppm)12.6520.6528.9140.6415.8327.7943.8360.0998.2157.14264.05
Lu (ppm)2.373.945.446.913.015.116.979.81135.7069.15208.57
Figure 4. Spider diagram showing trace element composition of primary wolframite (worldwide occurrences) and ferberite from the Rwandan reinite deposits (Gifurwe, Nyakabingo, Bugarama). The data of ferberite from the Rwandan reinite deposits are given as median values of single analyses for each sample locality (Gifurwe, Nyakabingo, Bugarama: type-1, type-2, type-3). The data for primary wolframite are given as the median value of single analyses (n = 1094) for 23 sample localities worldwide. Data points below the detection limit are omitted. Please note that the trace element concentrations are displayed on the logarithmic scale. Gifurwe = yellow line and diamonds, Nyakabingo = black line and crosses, Bugarama: type-1 = red line and squares, type-2 = green line and triangles, type-3 = blue line and circles and primary wolframite from different deposits worldwide = gray line and asterisks.
Minerals 03 00121 g004
Figure 5. Backscatter electron images of the two polished sections 1 and 2 from the Bugarama deposit with laser ablation pits (red outlines). (a) Ablation pits 1–5 and 12–20 represent type-1 ferberite, whereas ablation pits 6–11 represent type-3 ferberite (yellow outline) in polished section 1. The two red-rimmed boxes indicate the areas of element mapping using electron microprobe (Figure 8). (b) Ablation pits 1–20 represent analyses of type-2 ferberite in polished section 2.
Minerals 03 00121 g005
Figure 6. Binary plot of Ca and Sr concentrations showing positive correlation. Please note that the element concentrations are displayed on the logarithmic scale. Gifurwe = yellow diamonds, Nyakabingo = black crosses, Bugarama: type-2 = green triangles and type-3 = blue circles; concentrations of type-1 are below the detection limits of both elements.
Minerals 03 00121 g006
Detailed investigation of the contact zone between type-1 and type-3 ferberite was performed by element mapping using electron microprobe analysis on polished section 1 (Figure 5a and Figure 8). The sharp contact is clearly visualized by mapping of the Mg concentration, which is distributed rather homogenously, but at significantly different concentration levels in the two types, with high concentrations in the pristine ferberite (Figure 8c,f). Interestingly, Mn (and as a consequence, Fe showing the opposite trend) displays inhomogeneous distribution in both types. In type-1 ferberite, the highest Mn concentrations, and Mn-rich domains are restricted to the contact zone between the two ferberite types. Type-3 ferberite shows zoning in the Mn concentration and irregular schlieren-like replacement textures with high and low Mn concentration levels. This zoning and the replacement pattern are only visible by element mapping of the Mn distribution (Figure 8b,e).
Figure 7. Binary plot of Y and Mg concentrations showing type-1 ferberite is differing significantly from the other groups characterized by high Mg concentration at comparatively low Y levels. Please note that the element concentrations are displayed on the logarithmic scale. Gifurwe = yellow diamonds, Nyakabingo = black crosses, Bugarama: type-1 = red squares, type-2 = green triangles and type-3 = blue circles.
Minerals 03 00121 g007
Figure 8. Contact zone between type-1 and type-3 ferberite (yellow outline) by backscatter electron images (a,d) and element mapping (b,c,e,f) of the two areas on polished section 1 from Bugarama deposit (marked in Figure 5a) using electron microprobe. The images (a)–(c) are taken from the left square, and (d)–(f) are taken from the right box on Figure 5a. Element mapping shows the distribution of the Mn (b,e) and Mg (c,f) concentrations.
Minerals 03 00121 g008

4.3. Rare Earth Elements

In type-1 ferberite, the light rare earth elements (LREE) are generally below the detection limit, and the REE patterns (normalized to C1-chondrite [47]) are inclining steeply from Tb onwards to Lu (Figure 9). Variable normalized Y concentrations appear, but a significant Y anomaly does not exist (0.75 < Y* < 1.40; Y* calculated after normalization to C1-chondrite following Minerals 03 00121 i001
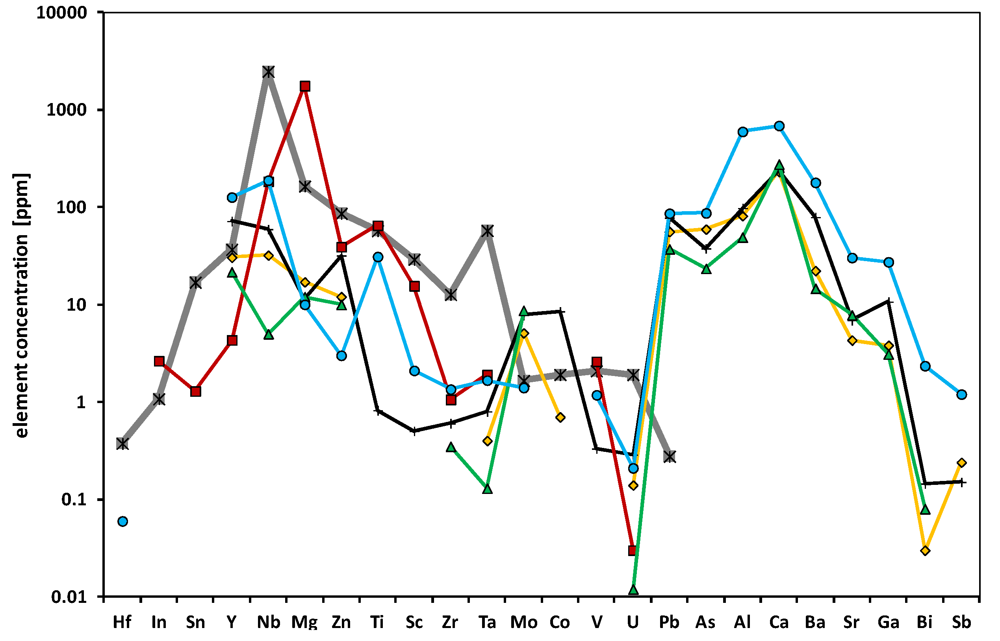
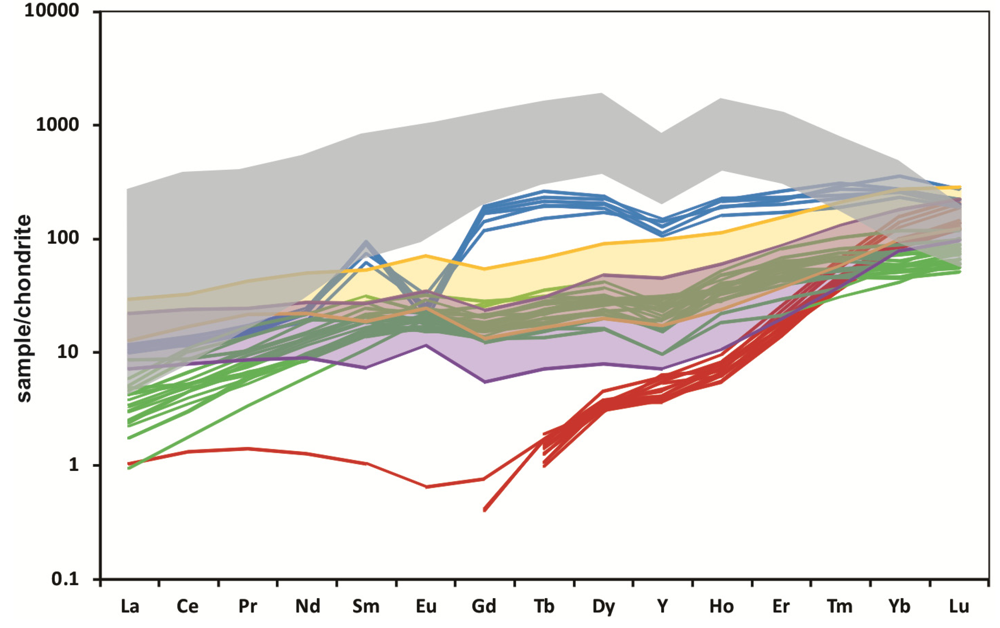
). REE patterns of type-2 ferberite (Figure 9) show a slight, but steady incline from LREE to the heavy rare earth elements (HREE) with variable normalized Eu concentrations, but without significant Eu anomalies (0.73 < Eu* < 1.73; Eu* calculated after normalization to chondrite following Minerals 03 00121 i002). Frequently weak negative Y anomalies appear (0.48 < Y* < 1.06). The REE patterns of type-3 ferberite (Figure 9) incline relatively steeply from the LREE towards the middle rare earth elements (MREE), including strong negative Eu anomalies (0.15 < Eu* < 0.31). The REE patterns form a plateau from the MREE towards HREE with weak negative Y anomalies (0.57 < Y* < 0.80).
Figure 9. Chondrite-normalized rare earth elements (REE) patterns of 40 analyses of ferberite (type-1 = red, type-2 = green, type-3 = blue) from two polished sections (polished section 1 and 2) from the Bugarama deposit and the distribution of chondrite-normalized REE patterns for the 25th and 75th percentile of ferberite analyses in ore concentrates from the Gifurwe (purple) and Nyakabingo (yellow) deposits. For comparison, chondrite-normalized REE patterns of hydrothermal scheelite (grey) are generalized from the data given for hydrothermal scheelite in the literature [48,49]. Please note that the chondrite-normalized data are displayed on the logarithmic scale. The composition of C1 carbonaceous chondrite is taken from McDonough and Sun [47].
Minerals 03 00121 g009

5. Discussion

5.1. Mineralogy

Iron-rich, dark brown to black wolframite, so-called ferberite, is the main tungsten-bearing mineral in quartz veins. Three kinds of ferberite occur: a massive type with metallic luster (type-1), which is composed of large equant crystals, and two porous types, which are composed of small fibrous (type-2) or skeletal crystals (type-3), respectively. The massive ferberite crystals contain scheelite inclusions, but also are crosscut by scheelite veins or occur next to scheelite crystals. These massive ferberite crystals are therefore interpreted to be primary and formed contemporaneously with scheelite.
Wolframite crystallizes in the monoclinic crystal structure and commonly forms tabular crystals, whereas scheelite has tetragonal symmetry and often occurs as bipyramidal crystals. Based on their crystal structure, it can be postulated that the bipyramidal fibrous ferberite aggregates are pseudomorphic after scheelite, so-called reinite [1,4,8,35,37]. Pseudomorphism of ferberite after scheelite is a common feature in Central Africa. It has, for instance, also been observed in the Rutsiro area in western Rwanda, in Maniema (DRC) and in southwestern Uganda [1,4,6,33,34,36]. Scheelite has been replaced by fibrous ferberite, a relationship that can be expressed through the following chemical reaction (1) [50]:
Minerals 03 00121 i003
This reaction could have been induced by different mechanisms: the Ca/Fe ratio of the fluids in contact with the ore minerals, a change in the chloride concentration of the fluid, a lowering of the temperature and a change in pressure; whereas the pH value has a limited effect on the relative stabilities of scheelite and ferberite [50]. During the stage of pseudomorphism of ferberite after scheelite, pyrite crystals in the quartz veins and the surrounding host rock have been altered leaving cubic cavities behind [5]. This process of pyrite alteration could be the source of iron for the replacement reaction (1) causing increased Fe concentration in the fluid and the lowering of the Ca/Fe ratio. The cubic cavities are now partly filled with Fe-oxides [2,12,13].
Since the morphology of the scheelite crystals has been conserved, this replacement reaction occurred from the margin of the crystal to the center. The reaction preferentially started along crystallographic orientations of the former scheelite [2], resulting in the boxwork network inside the pseudomorphs. Given that the molar volume of ferberite (40.38 cm3/mol; [51]) is smaller than that of scheelite (47.05 cm3/mol; [51]), this replacement reaction resulted in the development of pores, enabling the continuation of the reaction.
The primary ferberite is sometimes replaced by a second generation of skeletal and fibrous ferberite displaying abundant pores and cavities. The skeletal texture of this late ferberite may indicate rapid growth from supersaturated and undercooled hydrothermal fluids. This replacement of primary ferberite occurred after the pseudomorphism of scheelite, probably during the late sulfide stage.
The primary ferberite crystals contain few pores, which only occasionally contain secondary tungsten minerals. On the contrary, the fibrous ferberite crystals are very porous, and these pores have in many cases been filled by secondary tungstates. The tungsten minerals, which are present inside the pores, are interpreted as alteration products [2,4,8,37]. Two models are suggested for the formation of these secondary tungstates. In a first model, the recrystallization reaction was incomplete, and as a result, some scheelite was preserved inside the boxwork texture of reinite. Later, scheelite in these pores was altered to secondary tungstates [1,2,8,37]. In a second model, the reaction was complete, resulting in empty pores inside the reinite. In this model, the porous character and the small crystal size of the fibrous ferberite may account for the strong alteration compared to massive ferberite. In both models, alteration may have been caused by hydrothermal [2] or supergene alteration processes [3,8,37]. Recent processes might have removed part of the alteration products, leaving some boxwork cavities in ferberite devoid of secondary tungstates.

5.2. Mineral Chemistry

Wolframite forms a solid solution series between the two endmembers ferberite (Fe2+WO4) and hübnerite (Mn2+WO4) by diadochous substitution of Fe and Mn on the A site. Relatively small cations with ionic radii of less than 0.9 Å (e.g., Mg2+, Sc3+, Zn2+, Co2+, Y3+, REE3+) are preferentially incorporated into the wolframite structure on the A site [52]. Divalent cations with suitable ionic radii, Mg2+ (0.72 Å), Zn2+ (0.74 Å), Co2+ (0.745 Å) and Cd2+ (0.95 Å), are readily substituted for Fe2+ (0.78 Å) and Mn2+ (0.83 Å) into the wolframite lattice by simple substitution (all ionic radii in this paper are taken from Shannon [53]). Tungsten occurs in the hexavalent state (0.6 Å) and is octahedrally coordinated in wolframite; it is frequently substituted by high field strength elements, such as Mo, Nb, Ta, Sn and Ti. Especially Mo readily replaces tungsten by simple substitution, because both occur in the same valence state and exhibit nearly identical ionic radii (0.59 Å for Mo6+). Pentavalent cations, like Nb5+ and Ta5+ (0.64 Å), are commonly incorporated into the wolframite lattice, because wolframite and columbite-tantalite have similar crystal structures. Niobium and Ta are substituted for W into the wolframite lattice by coupled substitution of trivalent cations (e.g., M = Fe3+, Sc3+, In3+, Y3+, REE3+) on the A site (2) [40]:
Minerals 03 00121 i004
Tetravalent cations with small ionic radii, like Ti4+ (0.605 Å) and Sn4+ (0.69 Å), are substituted for tungsten into the wolframite structure by coupled substitution with trivalent cations (3) [40]:
Minerals 03 00121 i005
Substitution is also dependent on the crystal structure. For example, tungstates with the general formula AWO4 (like wolframite and scheelite) crystallize in the scheelite structure (A[8]W[4]O4) if the radius of the cation on the A site is greater than 0.9 Å; whereas the wolframite structure (A[6]W[6]O4) is favored if the radius of the A2+ cation is less than 0.9 Å [54,55]. Generally, large cations, like Ca2+, Sr2+, Pb2+ and Ba2+, are incorporated in the scheelite-type structure, whereas small cations, such as Mg2+, Zn2+ and Ni2+, are preferentially found in the wolframite-type structure [48,52]. The analyses of type-1 ferberite show a trace element composition typical for primary wolframite with enrichments in Mg, Nb, Ti, Zn and Sc and elevated values for Ta, In, Sn and V.
Consequently, incorporation of Ca2+ (1.0 Å), Eu2+ (1.17 Å), Sr2+ (1.18 Å) and Pb2+ (1.19 Å) into the wolframite structure seems unlikely, because of the large differences in ionic radius compared to Fe and Mn. For example, the substitution of Ca for Fe and Mn is also limited, because experiments show solid solution between wolframite and scheelite only occurs at temperatures above 600 °C [56]. Another limiting factor in the wolframite-scheelite solid solution series is the contrast in the two crystal structure types. When comparing the Ca concentrations from analyses on wolframite (covering the whole wolframite solid solution series between ferberite and hübnerite) from all over the world (unpublished data [46]), the Ca concentration is generally low (<100 ppm). The highest Ca concentrations (averages >200 ppm) are found in ferberite from the Rwandan reinite deposits. Ferberite (type-2) from these reinite deposits also shows high concentrations in Ga, As, Pb, Sr, Ba and LREE; especially Ca, Pb, Sr, Y, Ba and LREE are generally characterized by relatively large ionic radii. On the contrary, elements generally characterized by small ionic radii, like Zr, Hf, Nb, Ta, Sn, Ti, Sc and U, show extremely low concentrations. This unusual chemical composition for ferberite is probably inherited from the former scheelite and results from the replacement of scheelite by ferberite; Pb, Sr and LREE have large ionic radii (>0.9 Å) and are preferentially incorporated into the scheelite structure [48,52,54].
The type-3 ferberite formed from a solution, which was also enriched in elements typical for scheelite, like Ca, Sr and Ba; even in higher concentrations than reinite (type-2). It can be concluded that the fluid was generated after pseudomorphism of scheelite. Additionally, type-3 ferberite also shows high concentrations in Pb, Bi, As, Ga and Sb. The enrichment in these elements, especially in Pb and Bi, indicates that this late generation ferberite was probably formed during the sulfide stage contemporaneously with galena and Bi-minerals, like native bismuth and bismuthinite.
As mentioned above, the REE (especially the HREE) readily substitute for Fe and Mn in wolframite and show steeply inclining chondrite-normalized patterns, with HREE predominating over LREE. This is well documented in the REE patterns of primary type-1 ferberite (Figure 9). Contrasting, type-2 ferberite (reinite) displays rather flat REE patterns with just a slight increase towards the HREE; a weak positive Eu anomaly is present, and the Y anomaly is missing (Figure 9). The LREE (La, Ce, Pr, Nd and Eu) are significantly enriched in reinite compared to primary wolframite. The analyses on ore concentrates from the Nyakabingo and Gifurwe mines show a similar pattern to type-2 ferberite, and thus, the major ore mineral in these deposits is reinite (Figure 9). This distinctive pattern is the result of pseudomorphism of ferberite after scheelite, where ferberite partially retains the trace element characteristics of the former scheelite.
The scheelite structure favors large cations with ionic radii greater than 0.9 Å [48,52,54], and the ionic radii of the REE become successively smaller with increasing atomic number, ranging from 1.032 Å for La3+ to 0.861 Å for Lu3+. Europium is a redox-sensitive element, and therefore, Eu anomalies are caused by different oxidation states of the dissolved Eu (Eu2+ vs. Eu3+) in the hydrothermal fluids [57]. A positive Eu anomaly is related to preferential substitution of Eu2+ for Ca2+ in scheelite compared to Eu3+ and the other REE3+. The concentration of Eu2+ will vary independently from the REE3+, whereas Eu3+ will accompany similar changes in the REE3+ [48].
REE patterns of type-3 ferberite incline relatively steeply from the LREE towards the middle rare earth elements (MREE), including strong negative Eu anomalies and weak negative Y anomalies. This pattern is very similar to the REE pattern of primary hydrothermal scheelite, which shows bell-shaped REE patterns enriched in MREE with either positive or negative Eu anomalies and weak Y anomalies [48,49,57,58,59]. This supports the statement that the replacement of the primary ferberite (type-1) by type-3 ferberite occurred after pseudomorphism, and the elemental composition of the fluid was strongly influenced by the former scheelite.

6. Conclusions

Precipitation of tungsten was caused by the interaction of hydrothermal fluids with the carbonaceous shale [13]. The structural setting and the overlap in age between the G4-granites (986 ± 10 Ma; U-Pb SHRIMP age from zircon [16]) and the W-mineralized veins (984.6 ± 2.4 Ma; maximum Ar-Ar age from muscovite [5]) support a primary magmatic origin of the W-mineralizing fluids [5]. These hydrothermal fluids were trapped by the impermeable pelitic sedimentary rocks of the Shyorongi Formation [10], and the carbonaceous material served as a reactive horizon, causing mineralization in this zone by temperature decrease, addition of volatiles and increase in pH value [5]. Fluid inclusion studies show that tungsten precipitated from hydrothermal fluids composed of H2O, CO2, N2, CH4 and NaCl, with moderate salinities ranging from 0.6 to 13.8 wt % NaCl equivalent and temperature and pressure conditions at 500 to 300 °C and 2000 to 400 bars, respectively [5,10,13,25]. The composition of these fluids and stable isotope data indicate that the primary magmatic fluids were strongly modified by interaction with the metasedimentary host rock [5,10,13].
Different stages have been observed during the evolution of the W-mineralized quartz veins. During the main vein stage, the bulk of the quartz veins were formed. Primary, hydrothermal scheelite and primary, massive ferberite formed somewhat later in the evolution of the quartz veins, sometimes in fractures that crosscut the quartz veins.
Next, the primary scheelite crystals recrystallized and were replaced by fine-grained ferberite, forming so-called reinite from Fe-rich, weakly acidic fluid [2]. The iron for the pseudomorphism derived from the alteration of pyrite in the quartz veins and the surrounding host rocks [25]. The different generations of ferberite and the pseudomorphism of scheelite are also well documented in the trace element composition and in the rare earth element patterns of the ferberite minerals. Comparing the trace element data of reinite and ferberite, it is obvious that reinite inherited its uncommon trace element composition to some part from the former primary scheelite.
Detailed investigation of two ore specimens from the Bugarama deposit shows that the tungsten mineralization consists of three generations of ferberite, whereas type-1 represents primary ferberite, and the other two types represent different varieties of secondary ferberite. The massive ferberite (type-1) formed contemporaneously with scheelite during the primary hydrothermal stage. This primary ferberite is characterized by high Mg, Zn, Sc, V, Nb, In and Sn concentrations and steeply inclining REE patterns. Typical reinite (type-2) is composed of fine-grained ferberite, which is replacing scheelite from a Fe-rich fluid in a successive stage. Reinite also shows enrichments in elements typical for scheelite (e.g., Ca, Sr, Ba, etc.) and flat REE patterns. It is also demonstrated that the ore concentrates from the Nyakabingo and Gifurwe deposits are mainly composed of reinite or type-2 ferberite. Type-3 probably represents secondary ferberite, which was altering and replacing the primary ferberite (type-1). The replacement is documented by inhomogeneous Mn distribution and schlieren-like replacement textures in type-3 ferberite, resulting from the infiltration of the Fe-rich, scheelite-replacing fluid. The type-3 ferberite formed from a solution, which was also enriched in elements typical for scheelite (e.g., Ca, Sr, Ba, etc.). Consequently, this solution was enriched in these elements after the replacement of scheelite, and these elements were incorporated in this newly formed, youngest generation of ferberite. This type-3 ferberite probably formed contemporaneously with the late sulfide stage, because this generation of ferberite is also unusually enriched in Bi, Pb, As and Sb. There is a distinct correlation in the occurrence of bismuth minerals and galena with the uncommon trace element composition in this kind of secondary ferberite.
In a later stage, the ferberite pseudomorphs have been fractured and filled by an assemblage of quartz, muscovite and xenotime and by a sulfide stage, which is intergrown with quartz. The remaining scheelite crystals inside reinite together with some ferberite crystals were altered to secondary tungstates. Nevertheless, some primary scheelite is still present as small grains enclosed in quartz [2,3]. Iron-oxides, such as hematite and goethite, precipitated in fractures throughout the veins. As a result of the weathering processes, the secondary tungsten minerals have been leached away, leaving behind a porous boxwork texture.

Acknowledgments

Philip Schütte from BGR is kindly thanked for providing sample material. We want to thank the Rwanda Natural Resources Authority/Geology and Mines Department for permission to publish the geological map of Rwanda. Thanks to the mining companies for giving access to the mines and for the permission to take samples. We gratefully acknowledge three anonymous reviewers for the revision of the manuscript and their constructive comments.

References

  1. Varlamoff, N. Les gisements de tungstène au Congo belge et au Ruanda-Urundi [in French]. Acad. R. Sci. Colon. Cl. Sci. Nat. Méd. Mém. Nouv. Sér. 1958, 8, 1–70. [Google Scholar]
  2. Frisch, W. Die Wolfram-Lagerstätte Gifurwe (Rwanda) und die Genese der zentralafrikanischen Reinit-Lagerstätten [in German]. Jahrb. Geol. Bundesanst. 1975, 118, 119–191. [Google Scholar]
  3. Pohl, W. Zur Geologie der Wolframlagerstätte Bugarama, Rwanda Afrika [in German]. Jahrb. Geol. Bundesanst. 1976, 119, 129–149. [Google Scholar]
  4. Sahama, T.G. The secondary tungsten minerals, a review. Mineral. Rec. 1981, 12, 81–87. [Google Scholar]
  5. De Clercq, F. Metallogenesis of Sn and W Vein-Type Deposits in the Karagwe-Ankole Belt. Ph.D. Thesis, Katholieke Universiteit Leuven, Leuven, Belgium, September 2012. [Google Scholar]
  6. Pargeter, R.C. The Ruhizha ferberite deposit, Kigezi. Rec. Geol. Surv. Uganda 1956, 1954, 27–46. [Google Scholar]
  7. Reedman, A.J. Partly remobilised syngenetic tungsten deposit at Nyamalilo mine. Overseas Geol. Miner. Resour. 1973, 41, 101–106. [Google Scholar]
  8. De Magnée, I.; Aderca, B. Contribution à la connaissance du Tungsten-belt ruandais [in French]. Acad. R. Sci. Colon. Cl. Sci. Nat. Méd. Mém. Nouv. Sér. 1960, 11, 1–56. [Google Scholar]
  9. Cheilletz, A. Stratiform tungsten deposits: A review. Geol. Mijnb. 1988, 67, 293–311. [Google Scholar]
  10. Günther, M.A. Flüssigkeitseinschlüsse und Geologisches Umfeld Zentralafrikanischer Sn-, W- und Au-Lagerstätten (Rwanda und Burundi) [in German]. Ph.D. Thesis, Technical University Braunschweig, Braunschweig, Germany, January 1990. [Google Scholar]
  11. Pohl, W. Metallogeny of the northeastern Kibara belt, Central Africa—Recent perspectives. Ore Geol. Rev. 1994, 9, 105–130. [Google Scholar] [CrossRef]
  12. De Clercq, F. Petrografische, Mineralogische en Geochemische Studie van de Wolfraammineralisaties van Nyakabingo en Gifurwe (Rwanda) [in Dutch]. Master’s Thesis, Katholieke Universiteit Leuven, Leuven, Belgium, June 2007. [Google Scholar]
  13. De Clercq, F.; Muchez, P.; Dewaele, S.; Boyce, A. The tungsten mineralization at Nyakabingo and Gifurwe (Rwanda): Preliminary results. Geol. Belg. 2008, 11, 251–258. [Google Scholar]
  14. Fletcher, C.J.N. The geology, mineralization, and alteration of Ilkwang mine, Republic of Korea: A Cu-W-bearing tourmaline breccias pipe. Econ. Geol. 1977, 72, 753–768. [Google Scholar] [CrossRef]
  15. Van Horn, F.R. Replacement of wolframite by scheelite with observations on the fluorescence of certain tungsten minerals. Am. Mineral. 1930, 15, 461–469. [Google Scholar]
  16. Tack, L.; Wingate, M.T.D.; De Waele, B.; Meert, J.; Belousova, E.; Griffin, B.; Tahon, A.; Fernandez-Alonso, M. The 1375 Ma “Kibaran Event” in Central Africa: Prominent emplacement of bimodal magmatism under extensional regime. Precambrian Res. 2010, 180, 63–84. [Google Scholar] [CrossRef]
  17. Cahen, L.; Snelling, N.J.; Delhal, J.; Vail, J.R.; Bonhomme, N.; Ledent, D. The Geochronology and Evolution of Africa; Clarendon Press: Oxford, UK, 1984. [Google Scholar]
  18. Cahen, L.; Snelling, N.J. The Geochronology of Equatorial Africa; North-Holland Publishing Company: Amsterdam, The Netherlands, 1966. [Google Scholar]
  19. Lepersonne, J. Carte géologique du Zaïre [in French], Département des Mines, République du Zaïre, Royal Museum for Central Africa: Tervuren, Belgium, 1974; 1:2000000.
  20. Lavreau, J. Le Groupe de la Rusizi (Rusizien du Zaïre, Rwanda et Burundi) à la Lumière des Connaissances Actuelles [in French]; Rapport Annuel 1983–1984; Department of Geology and Mineralogy, Royal Museum for Central Africa: Tervuren, Belgium, 1985; pp. 111–119. [Google Scholar]
  21. Baudet, D.; Hanon, M.; Lemonne, E.; Theunissen, K. Lithostratigraphie du domaine sédimentaire de la chaine Kibarienne au Rwanda [in French]. Ann. Soc. Géol. Belg. 1988, 112, 225–246. [Google Scholar]
  22. Fernandez-Alonso, M.; Cutten, H.; De Waele, B.; Tack, L.; Tahon, A.; Baudet, D.; Barritt, S.D. The Mesoproterozoic Karagwe-Ankole Belt (formerly the NE Kibara Belt): The result of prolonged extensional intracratonic basin development punctuated by two short-lived far-field compressional events. Precambrian Res. 2012, 216–219, 63–86. [Google Scholar] [CrossRef]
  23. Dewaele, S.; Henjes-Kunst, F.; Melcher, F.; Sitnikova, S.; Burgess, R.; Gerdes, A.; Fernandez, M.A.; De Clercq, F.; Muchez, P.; Lehmann, B. Late Neoproterozoic overprinting of the cassiterite and columbite-tantalite bearing pegmatites of the Gatumba area, Rwanda (Central Africa). J. Afr. Earth Sci. 2011, 61, 10–26. [Google Scholar] [CrossRef]
  24. Theunissen, K.; Hanon, M.; Fernandez-Alonso, M. Carte Géologique du Rwanda [in French], Service Géologique, Ministère de l’Industrie et de l’Artisanat, République Rwandaise: Tervuren, Belgium, 1991; 1:250000.
  25. Pohl, W.; Günther, M.A. The origin of Kibaran (late Mid-Proterozoic) tin, tungsten and gold quartz vein deposits in Central Africa: a fluid inclusion study. Miner. Depos. 1991, 26, 51–59. [Google Scholar]
  26. Pearce, N.J.G.; Perkins, W.T.; Westgate, J.A.; Gorton, M.P.; Jackson, S.E.; Neal, C.R.; Chenery, S.P. A compilation of new and published major and trace element data for NIST SRM 610 and NIST SRM 612 glass reference materials. Geostand. Newsl. J. Geostand. Geoanal. 1997, 21, 115–144. [Google Scholar] [CrossRef]
  27. Perkins, W.T.; Pearce, N.J.G.; Westgate, J.A. The development of laser ablation ICP-MS and calibration strategies: Examples from the analysis of trace elements in volcanic glass shards and sulfide minerals. Geostand. Newsl. J. Geostand. Geoanal. 1997, 21, 175–190. [Google Scholar] [CrossRef]
  28. Longerich, H.P.; Jackson, S.E.; Günther, D. Laser ablation inductively coupled plasma mass spectrometric transient signal data acquisition and analyte concentration calculation. J. Anal. At. Spectrom. 1996, 11, 899–904. [Google Scholar] [CrossRef]
  29. Liu, Y.; Hu, Z.; Gao, S.; Günther, D.; Xu, J.; Gao, C.; Chen, H. In situ analysis of major and trace elements of anhydrous minerals by LA-ICP-MS without applying an internal standard. Chem. Geol. 2008, 257, 34–43. [Google Scholar] [CrossRef]
  30. Jackson, S.S. Calibration strategies for elemental analysis by LA-ICP-MS. In Laser Ablation ICP-MS in the Earth Sciences: Current Practices and Outstanding Issues, 1st; Sylvester, P., Ed.; Mineralogical Association of Canada: Vancouver, Canada, 2008; Volume 40, pp. 169–188. [Google Scholar]
  31. Heinrich, C.A.; Pettke, T.; Halter, W.E.; Aigner-Torres, M.; Audétat, A.; Günther, D.; Hattendorf, B.; Bleiner, D.; Guillong, M.; Horn, I. Quantitative multi-element analysis of minerals, fluid and melt inclusions by laser-ablation inductively-coupled-plasma mass-spectrometry. Geochim. Cosmochim. Acta 2003, 67, 3473–3496. [Google Scholar] [CrossRef]
  32. Gäbler, H.-E.; Melcher, F.; Graupner, T.; Bahr, A.; Sitnikova, M. A.; Henjes-Kunst, F.; Oberthür, T.; Brätz, H.; Gerdes, A. Speeding up the analytical workflow for Coltan fingerprinting by an integrated Mineral Liberation Analysis/LA-ICP-MS approach. Geostand. Geoanal. Res. 2011, 35, 431–448. [Google Scholar] [CrossRef]
  33. Varlamoff, N. Anthoinite, nouveau tungstate hydraté d’alumine [in French]. Ann. Soc. Géol. Belg. 1947, 70, 153–166. [Google Scholar]
  34. Van Tassel, R. Ferritungstite et meymacite de Meymac, France, et d’Afrique centrale [in French]. Bull. Soc. Belg. Géol. 1961, 70, 376–406. [Google Scholar]
  35. Bertossa, A. Inventaire des minéraux du Rwanda [in French]. Bull. Serv. Géol. Rwanda 1967, 4, 25–45. [Google Scholar]
  36. Von Knorring, O.; Sahama, T.G.; Lehtinen, M. Mpororoite, a new secondary tungsten mineral from Uganda. Bull. Geol. Soc. Finl. 1972, 44, 107–110. [Google Scholar]
  37. Pohl, W. Géologie de la mine de Bugarama et de ses environs (Rwanda, Afrique) [in French]. Bull. Serv. Géol. Rwanda 1975, 8, 13–42. [Google Scholar]
  38. Jedwab, J.; Preat, A. Présence de raspite (PbWO4 MONOCL.) dans l’anthoinite (Al.OH.WO4.H2O TRICL.) de Gifurwe, Rwanda [in French]. Bull. Soc. Belg. Géol. 1979, 88, 185–195. [Google Scholar]
  39. Nakashima, K.; Watanabe, M.; Soeda, A. Regional and local variations in the composition of the wolframite series from SW Japan and possible factors controlling compositional variations. Miner. Depos. 1986, 21, 200–206. [Google Scholar]
  40. Tindle, A.G.; Webb, P.C. Niobian wolframite from Glen Gairn in the Eastern highlands of Scotland: A microprobe investigation. Geochim. Cosmochim. Acta 1989, 53, 1921–1935. [Google Scholar] [CrossRef]
  41. Belkasmi, M.; Cuney, M.; Pollard, P.J.; Bastoul, A. Chemistry of the Ta-Nb-Sn-W oxide minerals from the Yichun rare metal granite (SE China): Genetic implications and comparison with Moroccan and French Hercynian examples. Mineral. Mag. 2000, 64, 507–523. [Google Scholar] [CrossRef]
  42. Ferenc, Š; Uher, P. Magnesian wolframite from hydrothermal quartz veins in the Rochovce granite exocontact, Ochtiná, Western Carpathians, Slovakia. Neues Jahrb. Mineral. Abh. 2007, 183, 165–172. [Google Scholar] [CrossRef]
  43. Barkov, A.Y.; Martin, R.F.; Shi, L.; LeBarge, W.; Fedortchouk, Y. Oscillatory zoning in stanniferous hematite and associated W- and Bi-rich minerals from Canadian Creek, Yukon, Canada. Can. Mineral. 2008, 46, 59–72. [Google Scholar] [CrossRef]
  44. Neiva, A.M.R. Geochemistry of cassiterite and wolframite from tin and tungsten quartz veins in Portugal. Ore Geol. Rev. 2008, 33, 221–238. [Google Scholar] [CrossRef]
  45. Mignardi, S.; Ferrini, V.; Masi, U.; Nabais, L.C.; de Sousa Bernardo, M. Significance of the Major- and Trace-Element Contents of Wolframite from the Deposits of Panasqueira and Vale de Gatas, Portugal. In Proceedings of the Ninth Quadrennial IAGOD Symposium, Beijing, China, 12–18 August 1994; Hagni, R.D., Ed.; Schweizerbart: Stuttgart, Germany, 1998; pp. 475–484.
  46. Goldmann, S. Mineralogical-Geochemical Characterisation of Cassiterite and Wolframite for an Analytical Fingerprint of Ore Concentrates (Provisional Title). Ph.D. Thesis, Leibniz University Hannover, Hannover, Germany.
  47. McDonough, W.; Sun, S.S. The composition of the earth. Chem. Geol. 1995, 120, 223–253. [Google Scholar] [CrossRef]
  48. Ghaderi, M.; Palin, J.M.; Campbell, I.H.; Sylvester, P.J. Rare earth element systematics in scheelite from hydrothermal gold deposits in the Kalgoorlie-Norseman Region, Western Australia. Econ. Geol. 1999, 94, 423–438. [Google Scholar] [CrossRef]
  49. Dostal, J.; Kontak, D.J.; Chatterjee, A.K. Trace element geochemistry of scheelite and rutile from metaturbidite-hosted quartz vein gold deposits, Meguma Terrane, Nova Scotia, Canada: Genetic implications. Mineral. Pet. 2009, 97, 95–109. [Google Scholar] [CrossRef]
  50. Wood, S.A.; Samson, I.M. The hydrothermal geochemistry of tungsten in granitoid environments: I. Relative solubilities of ferberite and scheelite as a function of T, P, pH, and mNaCl. Econ. Geol. 2000, 95, 143–182. [Google Scholar] [CrossRef]
  51. Robie, R.A.; Bethke, P.M; Beardsley, K.K. Selected X-Ray Crystallographic Data, Molar Volumes, and Densities of Minerals and Related Substances; U.S. Geological Survey Bulletin 1248; U.S; Government Printing Office: Washington, DC, USA, 1967. [Google Scholar]
  52. Kuzmin, A.; Purans, J. Local atomic and electronic structure of tungsten ions in AWO4 crystals of scheelite and wolframite types. Radiat. Meas. 2001, 33, 583–586. [Google Scholar] [CrossRef]
  53. Shannon, R.D. Revised effective ionic radii and systematic studies of interatomic distances in halides and chalcogenides. Acta Crystallogr. Sect. A Found. Crystallogr. 1976, 32, 751–767. [Google Scholar] [CrossRef]
  54. Hazen, R.M.; Finger, L.W.; Mariathasan, J.W.E. High-pressure crystal chemistry of scheelite-type tungstates and molybdates. J. Phys. Chem. Solids 1985, 46, 253–263. [Google Scholar] [CrossRef]
  55. Macavei, J.; Schulz, H. The crystal structure of wolframite type tungstates at high pressure. Z. Krist. 1993, 207, 193–208. [Google Scholar] [CrossRef]
  56. Grubb, P.L.C. Solid solution relationships between wolframite and scheelite. Am. Mineral. 1967, 52, 418–426. [Google Scholar]
  57. Roberts, S.; Palmer, M.R.; Waller, L. Sm-Nd and REE characteristics of tourmaline and scheelite from the Björkdal gold deposit, Northern Sweden: evidence of an intrusion-related gold deposit? Econ. Geol. 2006, 101, 1415–1425. [Google Scholar] [CrossRef]
  58. Brugger, J.; Lahaye, Y.; Costa, S.; Lambert, D.; Bateman, R. Inhomogeneous distribution of REE in scheelite and dynamics of Archaean hydrothermal systems (Mt. Charlotte and Drysdale gold deposits, Western Australia). Contrib. Mineral. Petrol. 2000, 139, 251–264. [Google Scholar] [CrossRef]
  59. Uspensky, E.; Brugger, J.; Graeser, S. REE geochemistry systematics of scheelite from the Alps using luminescence spectroscopy: From global regularities to local control. Schweiz. Mineral. Petrogr. Mitt. 1998, 78, 31–54. [Google Scholar]

