Review

The Feedback Control Cycle of Mineral Supply, Increase of Raw Material Efficiency, and Sustainable Development

by
Friedrich-W. Wellmer
1,*,†,‡ and
Christian Hagelüken
2,†
1
Formerly Federal Institute for Geosciences and Natural Resources (BGR), Stilleweg 2, D-30655 Hannover, Germany
2
Umicore AG & Co. KG, Rodenbacher Chaussee 4, D-63457 Hanau-Wolfgang, Germany
*
Author to whom correspondence should be addressed.
These authors contributed equally to this work.
Current Address: Neue Sachlichkeit 32, D-30655 Hannover, Germany
Minerals 2015, 5(4), 815-836; https://doi.org/10.3390/min5040527
Submission received: 24 August 2015 / Revised: 16 November 2015 / Accepted: 20 November 2015 / Published: 27 November 2015
(This article belongs to the Special Issue Sustainability of Mineral Resources)

Abstract

:
Sustainable development with regard to non-renewable resources can best be defined in terms of the inter-generational challenge of the Brundtland commission and the intra-generational challenge worked out in Agenda 21 of the 1992 Rio de Janeiro conference of United Nations Conference on Environment and Development (UNCED). In meeting these challenges, the trilemma of security of supply under conditions of economic viability and environmental sustainability also needs to be addressed in order to achieve sustainable development. To fulfil the natural resources needs of future generations we have three resources at our disposal: (1) the geosphere or primary resources; (2) the technosphere or secondary resources and (3) human ingenuity and creativity driving innovation. Man does not need natural resources as such, only the intrinsic property of a material that enables the fulfilment of a function is required. Any material that can perform the same function more efficiently or cheaply can replace any other material. In our constant drive to secure the supply of efficient raw materials, the feedback control cycle plays an indispensable role by virtue of it reacting to price signals on both the supply and demand sides. The feedback cycle of course goes hand in hand with a continuous learning process. On the supply side, the learning effects are in technology development around primary resources and the increased use of secondary resources; on the demand side with thriftier use of raw materials.

1. Introduction

The principle of inter-generational equity is generally accepted as a starting point for achieving sustainable development with the aim of allowing every future generation the privilege of being as well off as its predecessors [1,2]. In its goals, sustainability is thus a long-term concept, to be kept up over generations, centuries or even millennia, not just decades. True sustainability means “practically forever”, or as long as humans exist [3]. In consequence, we are looking far into the future when investigating a path to sustainable use of non-renewable mineral raw materials.
Generally, “weak” sustainability [2,4] is distinguished from “strong” sustainability [5]. The “weak” sustainability position argues that almost all kinds of natural capital can be substituted by man-made capital, whereas the “strong” sustainability position holds that natural capital and man-made capital are complimentary, meaning that many of the most fundamental services provided by nature cannot be replaced by services produced by humans or man-made systems. Others like Tilton [6] bring forward the argument that the debate over strong and weak sustainability is of questionable practical relevance, at least concerning raw materials, because prices will determine the use of natural resources, as shall be discussed below.
The concept of inter-generational equity is complemented by intra-generational equity, which was defined in Agenda 21 [7] as a triangle of three humanitarian objectives: (1) to conserve the basic needs of life; (2) to enable all people to achieve economic prosperity; and (3) to strive towards social justice. The Rio Declaration at the UN Conference on Environment and Development in Rio de Janeiro in 1992 accepted and agreed to these three universal goals. All three objectives initially were assigned the same priority. These are global objectives that every generation of politicians is expected to strive for in order to realize a balanced growth for mankind. The precondition for achieving this noble goal is the availability of natural resources for everybody over a long time, practically forever. Natural resources comprise those from the geosphere, i.e., the primary resources, and those from the technosphere or secondary resources. Technosphere is defined as the artificial world created by man, such as surface and subsurface constructions, machines, consumer products or waste dumps.
Mankind has always depended on the use of energy and mineral resources for its technological and cultural evolution [8]. As far back as the Bronze Age, metal was used for tool-making, but the large-scale exploitation of non-renewable energy resources only emerged much later with the invention of the steam engine at the beginning of the 18th century and the Industrial Revolution. Up to that time, the dominant energy and raw material for heating, smelting and shipbuilding was wood, a renewable biomass. Due to the technological development and increased demand of energy, it was replaced first by coal and subsequently by other fossil fuels. Maintaining today’s standard of living in both industrialized and developing nations depends widely on the use of non-renewable energy and mineral resources.
Consequently, to achieve the above defined goal of intra-generational equity, access to and security of supply of mineral and energy resources has to be ensured. Therefore, the intra-generational triangle of goals of Agenda 21 has to be combined with another set of goals, the one of raw materials supply: security of supply under the conditions of economic viability and environmental sustainability. As to the long-term challenge of inter-generational equity, its attainment depends on the security of supply of natural resources just as much as that of intra-generational equity. In fact, security of raw material supply, along with innovation fueled by human ingenuity in finding solutions [9], is central to attaining both intra-generational equity in the short term and inter-generational equity in the long (Figure 1.)
Concerning energy, the World Energy Council (WEC) considers these three goals of raw material supply as shown in Figure 1B above a “world energy trilemma”, “entailing complex interwoven links between public and private actors, governments and regulators, economic and social factors, national resources, environmental concerns, and individual behavior” [10]. The WEC has developed an Energy Trilemma Index that captures and aggregates country-level data to outline the relative energy performances and contextual attributes of almost 130 countries. The trilemma aspect is valid for every raw material.
Figure 1. Combination of the triangle of intra-generational equity of the Rio Declaration 1992 (A) with the triangle of raw material supply (B) to achieve inter-generational equity.
Minerals 05 00527 g001

2. Understanding the Functioning of the Raw Materials World
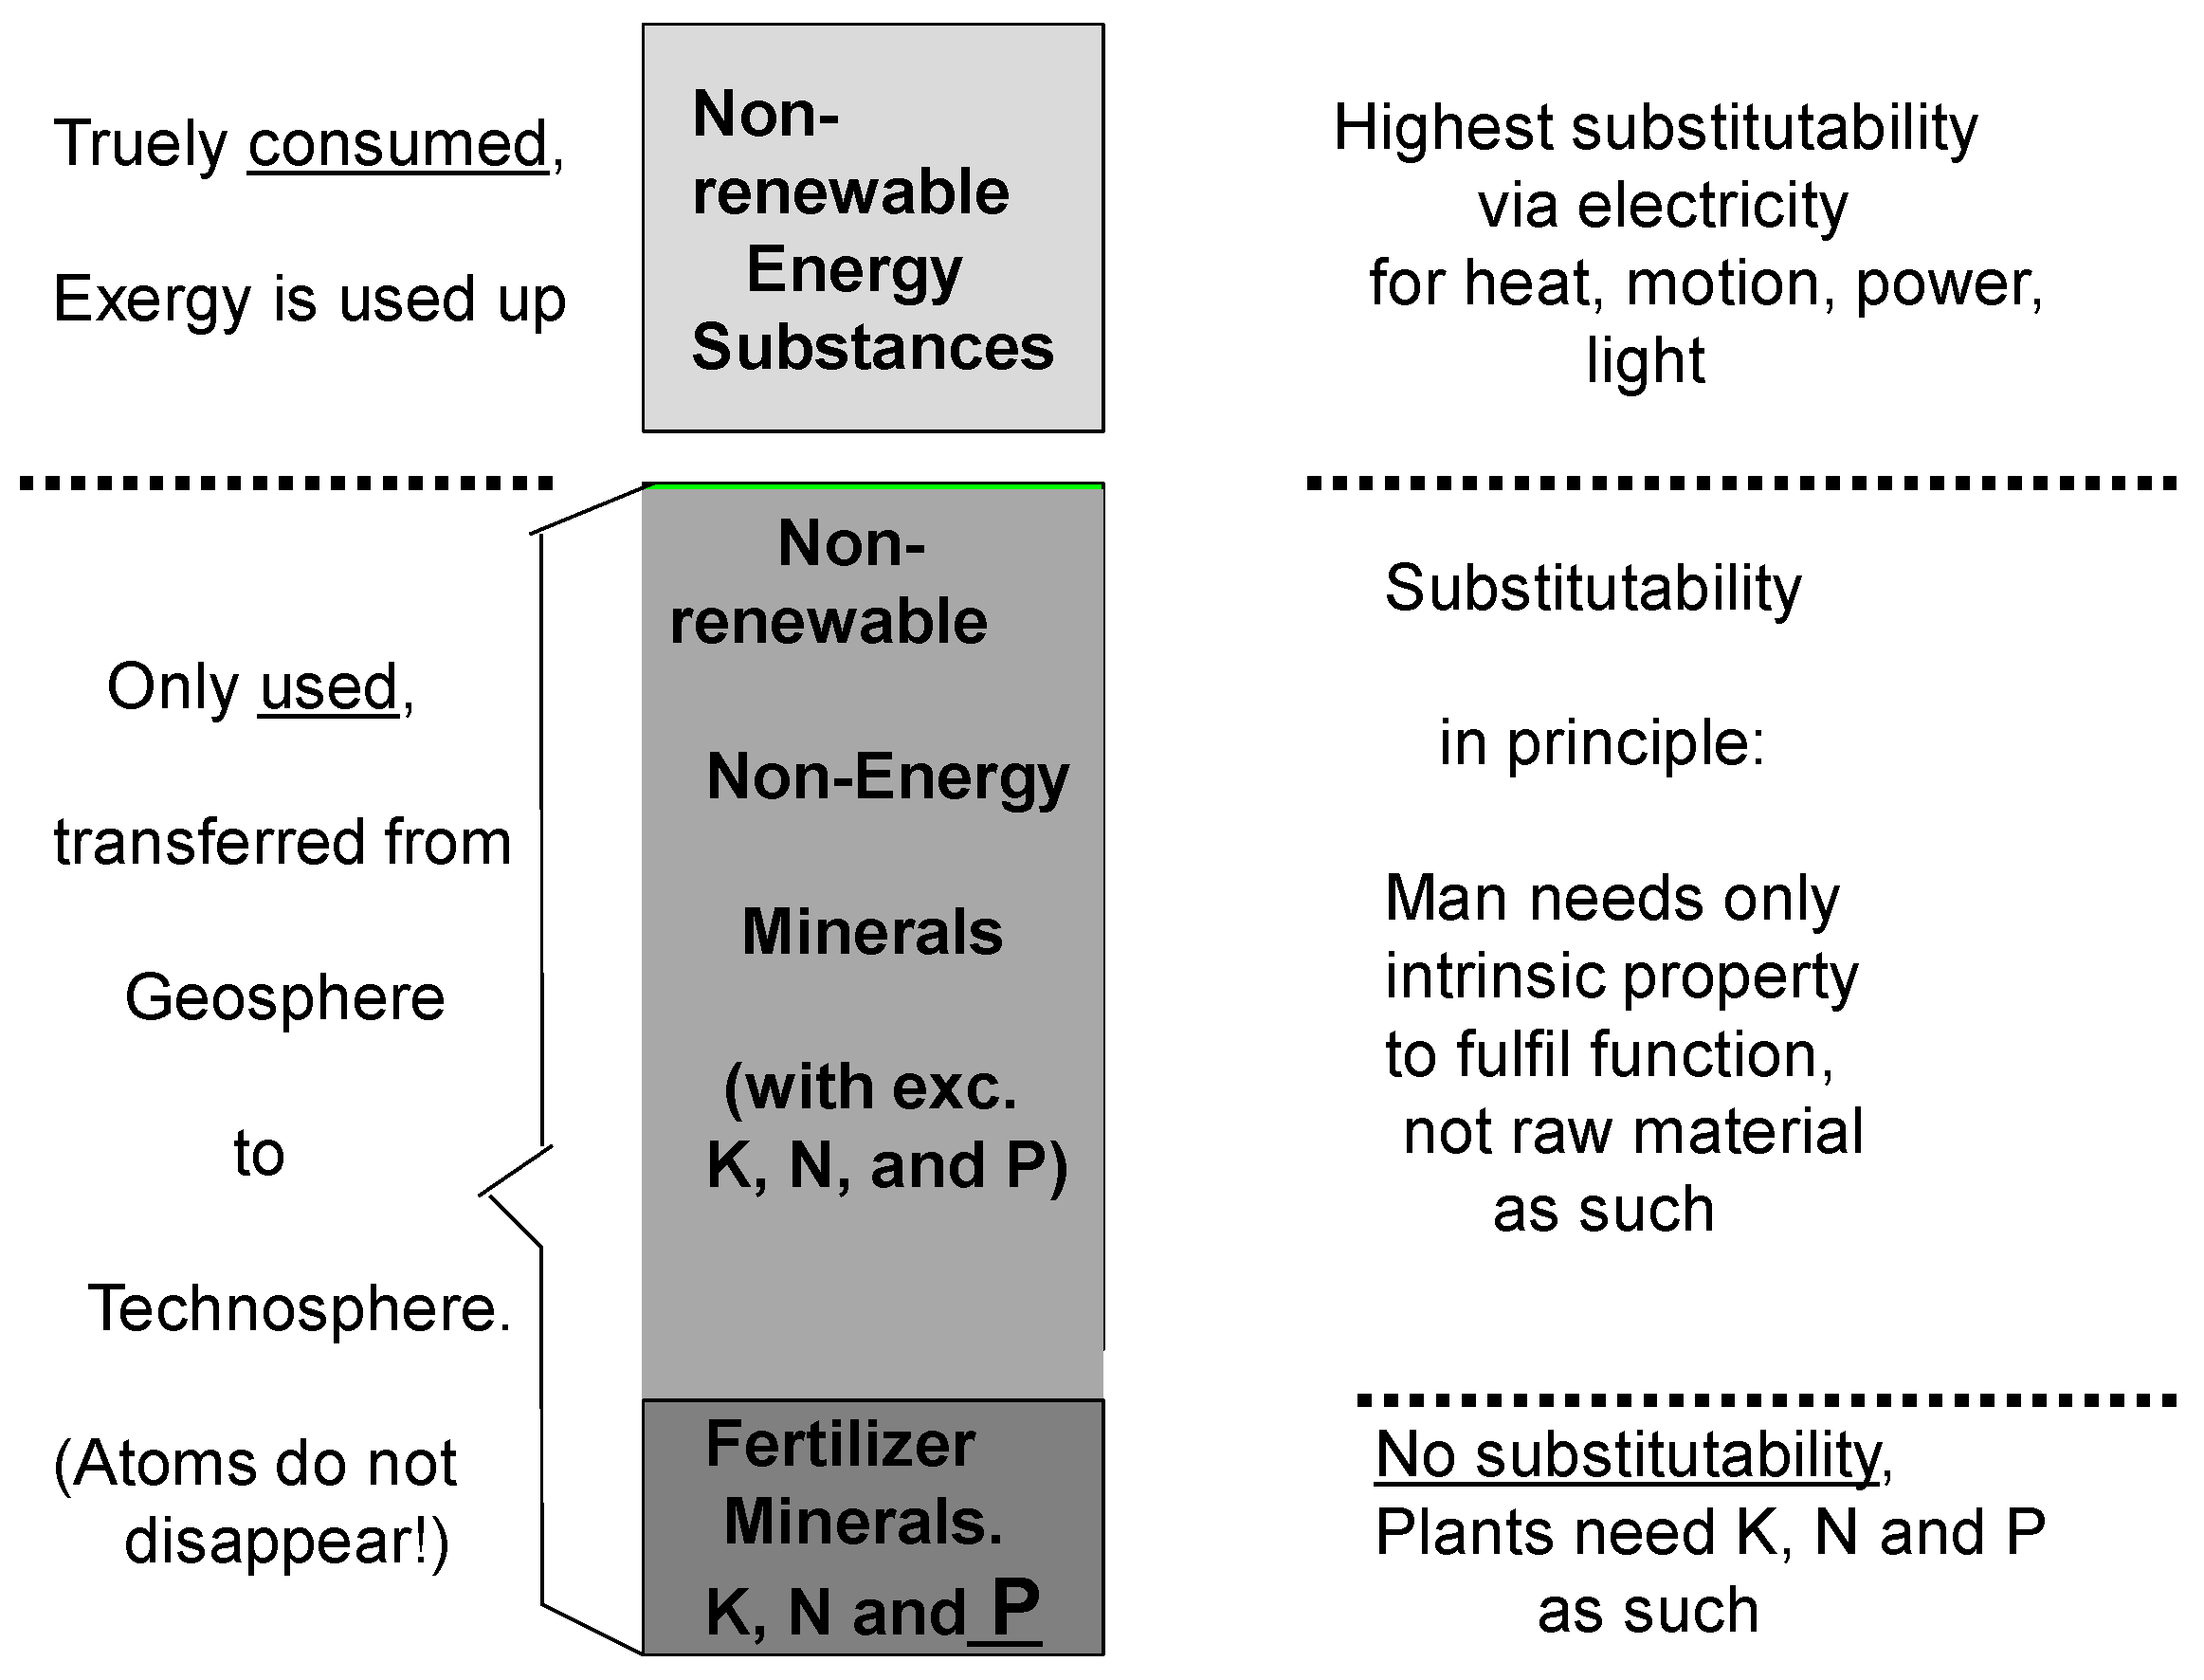
Mankind generally does not need raw materials as such but only their intrinsic property to fulfil a function, which offers a broad field for creative substitutions for the functions of raw materials (Figure 2). There are only three exceptions to this rule: nitrogen, potassium, and phosphorus, all used as fertilizers in agriculture, which the plants need as such and which cannot be substituted. All three elements are as essential for our life as water or air. For potassium and nitrogen there does not exist a problem, because seawater or air, respectively, provide an inexhaustible source for both. This does not apply to phosphorus. Fortunately, the ratio of reserves to annual mine production of phosphorus is about 300 providing ample time for man's creativity to find a solution for a closed-cycle phosphorus system [11,12].
Figure 2. Classification of natural resources according to their recyclability and substitutability.
Minerals 05 00527 g002
The normal case, however, is that functions need to be fulfilled irrespective of the kind of raw material used. Thus, taking copper as an example, the electrical conductivity of copper is the main function intrinsic to its material properties. However, other commodities can perform this function just as well, often in conjunction with fundamentally different technologies. Or to further use this example, copper wires in telecommunication had until recently been extensively used for transmitting information via electric pulses, but have now been largely replaced by glass fiber cables made of silica which is virtually inexhaustible. Another method of information transfer that does no longer depend on copper wire or glass fiber is wireless transmission using directional antennae or satellites. Therefore, a distinction needs to be made between material substitution in the narrow sense (glass fiber vs. copper) and functional substitution [13]. Every technical solution has its own raw material profile. In the field of photography, not so long ago silver was needed for the function of capturing images, but today digital cameras with completely different raw material requirements have largely replaced the use of film. In the printing industry, lead was formerly indispensable as type metal but has since been replaced by offset or computer printing.
We are in fact in the position to choose alternative solutions to functions applying three resource domains:
All the resources from the geosphere, i.e., primary resources.
All the resources from the technosphere, i.e., secondary resources, reusable by recycling.
In addition, last but not least, the most important resource: human ingenuity and creativity [9].
As a matter of fact, human creativity inspired the use of raw materials for tool making right from our beginnings and sustained the relentless improvement of artifacts. Therefore, we can say that the use of raw materials is the product of man’s ingenuity. When in the Stone Age man discovered that sharp cutting tools can be made from volcanic glass fragments, obsidian became a sought after raw material. A lively trade developed already in the Stone Age over relatively long distances in the Mediterranean area, from the Lipari Islands to Malta or from the island of Milos to Crete for example. More recently, when the German chemist Justus von Liebig (1803–1873) discovered that potassium was essential for plant growth, potassium salt, which was formerly rejected as useless waste by German salt miners, became a valuable commodity as potash fertilizer [14]. The potash mining industry started in Germany in 1861 in the town of Staßfurt, soon after Liebig’s discovery.
As to primary and secondary resources: The availability of secondary resources is determined by the number and composition of products and infrastructure placed into the technosphere and their respective lifetime as well as their collection and recycling efficiency. However, the secondary resources in the technosphere are in principle known and need no further exploration, contrary to the resources of the geosphere. In the geosphere, three categories of resources have to be distinguished: reserves, resources in a narrow sense, and the geopotential [15]. Reserves are known and can be exploited economically; resources in a narrow sense are known, but uneconomic at present or the feasibility of their economic recovery has not been proven. They need higher prices or new technologies to become economic. The geopotential comprises so far unknown reserves and resources that may one day be discovered by exploration activities. Such speculative potential implies that for primary resources, not only the production costs have to be taken into account, but also the finding costs. These uncertainties underline in principle the higher resource efficiency of secondary resources.
Resource efficiency also requires that exploration is not pursued too far into the future, only just as far as the planning horizon of mining companies requires. Because exploration costs are a front-end load in the exploitation of primary resources, it does not make economic sense to leave reserves “in the ground for future generations”, if they are economically exploitable now. In a market economy there has always been and likely will be for a long time a balance between mined reserves and newly found reserves discovered by exploration [15].
Leaving reserves in the ground touches the concept of user costs or Hotelling rent [6]. User costs are opportunity costs and equal the present value of the lost future profits through not mining. Tilton [6] discusses the concept and concludes that user costs are for the most part insignificant in practice. Mine managers normally will not reduce profitable production on the speculation with regard to raw materials prices and technological developments that the presumed increase in future profits, properly discounted, will make up for the loss caused by not exploiting the natural resource now.

3. Increasing Raw Materials Efficiency to Achieve Inter- and Intra-Generational Fairness

The feedback control cycle of mineral supply is an efficient mechanism to increase raw materials efficiency in the interest of inter- and intra-generational fairness. Before dealing with the feedback control cycle, some principles of raw materials efficiency and the mineral resources economy shall be explained.

3.1. Raw Materials Efficiency—Achieving More with Less

Since in a market economy raw materials are not free and have a price, it makes sense to use raw materials as efficiently as possible to minimize costs. This efficiency is measured by the money value of the raw materials needed to achieve the solution for a function.
In the political domain resource efficiency is, however, mostly measured by the indicator raw materials productivity: the ratio of total raw materials consumption to the gross national product. Hence, raw material productivity can be increased either by reducing raw material input for the same value-added, or by increasing value-added from the same material input. The indicator is used for example in the German Federal Government’s National Sustainable Development Strategy “Perspectives for Germany” [16]. The aim is to double raw material productivity by 2020 (compared with the 1994 baseline). In 2012, the indicator stood at 149.2. This summary indicator has been criticized, since all raw materials are given equal weight without any raw material value hierarchy being factored in. Considerable leverage can result from the use of e.g., electronic metals in only small quantities in modern measuring and control technology, making the use of energy resources more efficient, a good example of man’s creativity achieving optimal results [17]. Other examples would be: Additional use of precious metals catalysts in the chemical industry can reduce the amount of energy required for the synthesis of products, or the reduction of abrasive wear and the concomitant increase in the lifetime of tools by additional carbide coating. This means: for statistical models, one has to be aware of system boundaries and find appropriate ways of comparing and weighting resources against one another. If a system boundary is set too narrow, around a single industry segment for example, an increased use of resources in this segment could be misconstrued as a decrease of resource efficiency in spite of an overall macroeconomic benefit. Furthermore, a methodology needs to be developed with which savings in one resource category (e.g., energy) could be evaluated against increased use of other raw materials (e.g., metals) to enable such savings [18].
An illustrative practical example for achieving more with less is the efficient use of fertilizers in Germany (Figure 3). In the mid-nineteen-seventies farmers in Germany and other industrialized countries learned to work with better doses of fertilizers without loss of output. Nowadays there are technologies to prepare detailed soil maps using fast geophysical surveying technologies. These, combined with GPS technology and computers mounted on tractors, achieve an optimum on fertilizer use by continuously monitoring the quantities of fertilizers dispensed (precision farming) [19].
Figure 3. Input of the fertilizer elements potassium and phosphate per unit area in (ha) in Germany between 1949 and 2000 [20] (No data between 1990 and 1993).
Minerals 05 00527 g003
In the interest of resource efficiency and human well-being, both resource use and environmental impact have to be decoupled from the growth of gross national product. In other words, we have to consider not subsystems but the total system of man’s world [21] as shown by the graph in Figure 4, based on the findings of the decoupling working group of the International Resource Panel of United Nations Environment Programme (UNEP) [22].
Figure 4. Decoupling of raw materials use from the growth of the economy and the environmental impact. Adapted from [22].
Minerals 05 00527 g004

3.2. Replacing Primary Raw Materials by Secondary Ones

Another important element for increasing raw materials efficiency is to use secondary material as much as possible. Since we have only one earth and the earth has limits and exploration for new deposits is expensive, it makes sense to use raw materials, once they have been discovered and mined, with care and to the maximum extent, i.e., to strive for longevity, repair and reuse of products and finally to recycle as much as possible. Possible savings in exploration costs for example for gold in Australia are about 5% of the value of the mined gold [23]. In an extreme case, the replacement costs for oil are even estimated at about 17 US$/barrel which would equate to nearly 30% of the present value of 60 US$/barrel [24], although recycling of course does not exist for fossil fuels. Moreover, every mining activity is connected with a certain environmental impact which can be more or less avoided by using secondary materials.
The useable part of fossil energy, the exergy, is well and truly consumed (Figure 2). In the case of minerals as primary resources this is not the case. They are merely transferred from the geosphere to the technosphere, where they are available as secondary resources for recycling. “Atoms do not get lost”. This is especially true for metals [25]. There is, however, an optimum of recycling, if we consider energy as the most precious natural resource and want to minimize the environmental impact by either producing from primary or secondary sources. This optimum will be explained with Figure 5 and through a related thought experiment [26].
Figure 5. Energy requirements for producing metals from a mixture of primary raw materials and of secondary raw materials [27]. (a): The energy requirements for producing metal either from primary or secondary raw materials; (b): The energy requirements for producing metal from a mixture of primary and secondary materials (Point A serves in both graphs as a reference point for comparison).
Minerals 05 00527 g005aMinerals 05 00527 g005b
We group the available primary and secondary materials into numerous small increments and rank them according to energy requirements to produce marketable metal. In Figure 5a the energy requirement for primary resources is shown as a steadily increasing solid line. To the left the increments with the least energy requirements are high grade deposits, close to surface, coarse grained which do not require much energy for grinding and beneficiation etc. To the right are relatively low grade deposits and/or ores from deep mines and/or deposits with complex mineralogy with high beneficiation costs. If we do such a ranking with increments of secondary material, we have on the left side pure metal scrap and on the right side highly complex scraps or material with highly dispersed metals such as platinum group metals in sludges from galvanic processes. The more complex or dispersed a material becomes the higher the cost of recycling in terms of energy required. The very steep increase on the right illustrates the extreme case of metal dissipation. Examples are zinc in sun cream, metals in paint pigments, rust disseminated from wheels, railway lines or—in former times—lead disseminated by cars burning leaded petrol. Although the metal atoms are not lost physically it would require “infinite” amounts of energy to recover these metals again for functional reuse. To some extent, this is comparable to the natural distribution of metals in the earth crust. No one would dream of mining ordinary rocks because the extraction of trace amounts of metal would run up against the steep energy boundary as at low grades the energy requirements for mining, beneficiation and smelting increase exponentially [28]. Not surprisingly, mining is confined to ore deposits of economic grade.
Recycling of complex materials usually requires more energy than less complex ones, but there are exemptions. In certain products/components, several metals can be recovered simultaneously if they fit thermodynamically in metallurgical processes (see Section 4.3). For example, printed circuit boards or mobile phones (after removal of the battery) are highly complex, containing sometimes more than 40 elements. However, many of the metals are compatible with state-of-the-art integrated smelting-refining processes which can use the contained copper as an ideal collector of the contained precious metals as well as selenium, tellurium, arsenic or antimony, to be subsequently separated and purified. Even the primary slag from such processes can be retreated in special smelting processes for further extraction of lead, tin, bismuth, indium or nickel. Making use of modern copper or lead metallurgy to recover even traces of metals enhances energy efficiency. Furthermore, the plastic components of electronic devices are combustible and the contained energy can be fully utilized in the smelting process. For example, the organic resins in typical circuit boards deliver more energy than is needed for their smelting. By blending the boards with ceramic based automotive catalysts the excess energy is usable to smelt the ceramic structures. At the same time, the copper in the boards can be utilized to collect the PGMs contained in the catalytic converters [29].
If we compare in Figure 5a the energy requirements for primary materials with those of secondary materials, we can draw the following conclusions:
(l)
The production of secondary metals always requires less energy than the production of primary ones (Table 1), in the extreme case of aluminum only 5% compared with material from the primary process route. The energy savings are even higher for recycling of gold, platinum or palladium from jewelry or coins. Therefore, pure scrap is always the preferred raw material. In the case of aluminum, for example, the share of production from secondary sources increased from 17% in 1960 to 30% in 2009 and is expected to increase to 37% in 2020 [30]. The limit of use of secondary material is its availability, controlled by the lifetime of products and the collection and recycling efficiency that will be discussed later with the example of electronic scrap.
Table 1. Energy savings by recycling pure secondary material [30,31].
MetalEnergy Savings
Steel74%
Aluminum95%
Copper85%
Lead65%
The same applies to other metals as over time increasing supply of metal from secondary sources inevitably leads to a build-up of stocks in the technosphere. This is shown in Figure 6 for platinum.
Figure 6. Supply of platinum from primary and secondary sources [32,33]. With permission of DERA/BGR. Dark grey: primary supply; light grey: secondary supply.
Minerals 05 00527 g006
(2)
The curve of energy requirement for secondary material intersects the one for primary material, unless there are favorite conditions as outlined above. This has the consequence that there is an optimum for mixing secondary with primary material. This optimum is shown principally in Figure 5b, in this case about 70% secondary material with 30% primary material.
A final comment concerning Figure 5a: It can be expected that the intersection of the energy requirement lines for primary and secondary materials will move to the right in future, i.e., in future years the optimum will be obtained with more secondary and less primary materials. It can be envisioned that the energy requirement line for secondary material is unlikely to change very much in future, but the line for primary material will move up, because deposits deeper and more difficult to beneficiate will have to be mined and one day lower grade deposits as well. Such increasing energy demand, however, can at least partly be met by improved energy efficiency in mining. A study done 2007 in the US mining industry (excluding oil and gas) concluded that the saving potential was 53% [34].
When stating that the energy requirement line for secondary material is unlikely to change very much in future, this does not mean that the secondary “deposit” will not change in its composition. Quite on the contrary. The cycles of market penetration become shorter and shorter and the products themselves more and more complex. This can be seen in the electronics industry in particular where the composition of the waste streams is constantly changing, for consumer goods especially [35]. In addition, miniaturization, the more efficient use of materials (driven by cost pressure) and other innovations in achieving desired functionalities can lead to declining metal contents in products. Au, Ag, Pd contents, for example, decreased significantly in PC motherboards over the last 10 years [36].

4. The Feedback Control Cycle of Mineral Supply to Increase Raw Materials Efficiency

4.1. Introduction to the Feedback Control Cycle

Mineral supply is controlled by a feedback mechanism [35]. When there is a shortage of a commodity in a market economy, prices will rise triggering this mechanism (Figure 7). The expectation of high financial returns will encourage inventiveness and creativity in the quest for new solutions. On the supply side, for primary resources the appropriate response is to cut losses in the mining process, to lower the cut-off grade, to improve recoveries in the beneficiation and smelting processes, to expand existing production facilities, and to discover and bring into production new deposits. For secondary resources, the key to increasing the supply lies in improving recycling rates by better collection efficiency and technology, reprocessing lower grade scrap that becomes economic because of increased prices, and reducing downgrading to optimize the usefulness of secondary materials. On the demand side, implementation of new and more efficient processes, development of substitution technologies, material savings, and the invention of entirely new technologies that fulfil the same function without the need of using the scarce and suddenly more expensive material, are effective reactions to a price rise.
Figure 7. The feedback control cycle of mineral supply [35].
Minerals 05 00527 g007
It has to be pointed out that for the functioning of the feedback control cycle of mineral supply, it is irrelevant if there is an actual physical shortage or a perceived shortage, a “hype”. Relevant for the functioning of the feedback control cycle is only the price signal. If the market believes there is or will be shortage, real or not, and prices rise consequently, the promise of financial rewards generates in short order incentives to find creative solutions in increased supply or diminishing demand, or both. This pattern is an outflow of the theorem of Thomas and Thomas [37]: If a situation is believed to be real, the consequences are real. People believe there is or will be a shortage and start hoarding, creating a shortage. This effect of a perceived shortage has been described for tantalum at the end of the 1970s/beginning of the 1980s [35] and for oil in the early 1970s [6].
In cases where a metal use does not address fundamental needs in the stricter sense, price peaks of a metal can also lead to a (temporary) decrease in sales of a product (if this is highly influenced by the metal price).This is often the case with gold or platinum used in jewelry, and is an example of further tightening the screw on the demand side of the feedback loop. Here jewelry, which can be recycled quickly and with relative ease, would act as a kind of buffer, encouraging the use of precious metals for needs that are more fundamental instead.
The basis for the applicability of the feedback control cycle of mineral supply is twofold:
(a)
A market economy system in which shortages result in price signals, meaning price rises produce incentives to find new solutions, first to alleviate and then to end the shortage.
(b)
Human creativity and ingenuity, the most important resource for finding solutions [9]. It is widely acknowledged that scientific curiosity is an important driver to find new solutions for raw material problems. Experience, however, shows that the price incentive, as an indicator of an urgent need, is a much stronger motivator for finding a solution to a concrete problem quickly because it promises financial rewards for those who are first to be successful in the quest for new ideas.
We will show how essential this feedback control cycle is to continuously improve resource efficiency and thereby support efforts to reach the goals of inter- and intra-generational fairness. To comprehend the mode of operation and the effectiveness of the feedback control cycle of mineral supply, one has to visualize the wide spectrum of opportunities available. The number of opportunities increases exponentially with the number of elements used because man learned very early to use combinations of elements. The first innovation of the Bronze Age that followed the Copper Age was combining first copper with arsenic, then with tin to produce bronze, an alloy which was harder than its two components individually and could be used for tool making. In the Bronze Age and the following Iron Age, alloys were invented mostly by trial and error. In the famous tomb near the city of Xi’an of the Chinese emperor Ch’in, who founded the first dynasty to rule a unified China in 221 BC, bronze weapons were found containing up to 15 different metals. The surface of swords and arrow heads was coated with a chromium alloy to provide extra hardness and durability [38,39]. To give modern examples, in a frequently quoted study of 2008 of the US National Research Council the example is given based on information from the company Intel that in the eighties of last century a chip needed 12 elements, in the nineties 16 elements, today it may take more than 60 [40]. Achzet et al. (2011) [41] show the development of energy technologies during the last 300 years with the diversification of the elements needed. With the beginning of the industrial revolution, the number of elements employed increases exponentially, with the number of possible combinations becoming even greater (Figure 8).
Figure 8. Development of energy technologies during the last 300 years [41] with permission of A. Reller.
Minerals 05 00527 g008

4.2. Learning Effects Triggered by the Feedback Control Cycle

The feedback control cycle of mineral supply has its roots in the cobweb theorem of Kaldor (1934) [42] and Ezekiel (1938) [43] which explains the hog cycle in agriculture.
In the graph of the cobweb theorem in Figure 9 supply and demand curves are plotted as functions of price vs. quantity. The higher the price of a commodity the larger the supply and smaller the demand. The two curves intersect at point S1, i.e., demand and supply are in balance. Let us assume the market believes there is a shortage of a commodity. The price rises from P1 to P2. At price P2 the quantity a2 can be produced, e.g., new mines come on stream. However, because of the higher price, sooner or later demand will decrease, the price now falls from P2 to P3, and only a smaller quantity a3 can be produced economically, and so on. This shows that supply and demand counteract.
Figure 9. The cobweb theorem of Ezekiel [43], case 3 “the case of convergent fluctuation”, from [35] with permission of Springer.
Minerals 05 00527 g009
In the minerals field the number of oscillations and amplitude after the first two oscillations are reduced for the following reasons:
(1)
There are no seasons and no growing cycles as in agriculture with the consequence of cyclicity.
(2)
Reactions cover a wide time range. Direct substitution can start immediately if the alternative material can be readily bought on the market. If there are reserve capacities in mines and smelters, these can also be mobilized quickly. In addition, metals might be produced from intermediates on stock from metallurgical processes which at higher prices become attractive to treat, or it becomes economically viable to recycle manufacturing scraps which at lower prices had been discarded or stocked. Next are probably material savings as soon as new ideas develop. Then follow investments in new mines which are on the shelf and can readily be brought into production, reworking of tailing ponds or new smelting facilities for primary and secondary material as well as technological substitution.
(3)
Substitution often is irreversible.
(4)
Investments in mines are very capital-intensive. Once investments have been made, mines attempt to stay in production as long as possible, producing even at a loss for a certain length of time.
The consequence is that only the first two oscillations are observed, mostly followed by two weaker oscillations, for example for cobalt (Figure 10) or for tantalum [35]. It has to be pointed out that the amplitude of the first oscillation is always by far the largest and increased due to speculation and also to hypes. How small changes in production and consumption can cause major price changes was shown by Kesler with the example of sulfur [44]. Sometimes overproduction by new mines is not reduced for years and prices fall to a level lower than prior to the price rise. This could be observed in the case of molybdenum in the early 1980s [45].
This is a pendulum swinging from demand dominated to supply dominated situations but prima facie without learning effects. These learning effects come into the system, however, by the above described feedback control cycle of mineral supply and are constantly triggered by it. The learning effects increase the raw materials efficiency, especially with the increased use of secondary resources and on the demand side with thriftier use of raw materials. This will be illustrated with three cases.
Figure 10. Cobalt: mean annual prices in US$/lb. and consumption in Western World by main uses (from [15] with permission from Schweizerbart).
Minerals 05 00527 g010
The first case is of permanent magnets [46]. In 1977, a study was done in Germany examining the criticality of raw materials [47]. Cobalt was considered critical and strategic because substitutes were thought to be unavailable and cobalt hardly recyclable. This, however, was a static supposition that did not take into account dynamic developments and learning effects as shown by the cobalt crisis in 1978. It was triggered by the Shaba conflict in the Democratic Republic of Congo (formerly Zaire), the main country of cobalt supply. Cobalt prices spiked due to disruption caused by political upheaval. (Figure 10). In areas of application where cobalt used to be considered strategic because substitutes were thought to be unavailable and cobalt hardly recyclable, new technological solutions were found using ferrites which had been available since the 1950s even though with lower magnetic performance (Figure 11). Most of these substitutions were irreversible and took away a significant market share of cobalt. Whereas before the crisis 30% of the cobalt supply went into the making of permanent magnets, after the crisis the share of cobalt for this application fell to only 10% and stayed there for the coming years, i.e., a 20-percentage point of market share was lost forever (Figure 10).
Figure 11. Development of permanent magnets, modified from [48]. The y-axis is the magnet performance, expressed as stored energy (BH)max, measured in units of megagauss-oersted (MGOe).
Minerals 05 00527 g011
The second example of learning effects due to the feedback control cycle is rhenium and its application in turbine blades [49]. Because of a perceived shortage, the company General Electric developed a few years ago new super alloys containing less rhenium but with the same properties and quality as the then current alloys.
The last example shall be the development of the rare earth market. China with then more than 95% of the world production cut its export quota in 2009 by 12% and in 2010 by 40%. The prices for rare earths skyrocketed, in the extreme case of dysprosium by a factor of 100 (comparison peak 2011 with plateau 2002/2003). It took about two years for the market to settle down and for prices to return to normal. This was partly due to distortions by speculative demand, as well as to slightly increased production outside of China, but mainly to substitution effects. In permanent magnets, which formerly generously used 6% to 8% of dysprosium, now the same effect is achieved with only 2% or even less [50]. In lighting, LEDs and energy saving lamps that use phosphorus with yttrium and the heavy rare earth elements europium and terbium replace more and more normal electric bulbs. Per luminous flux unit lumen, such LEDs use up to 15 to 20 times less of these elements [51,52]. Finally, yet importantly, there is always the possibility of functional substitution [13]: By replacing permanent magnets in synchronous motors with induction motors, for example, or by employing ferrite motors which do not need rare earth elements.

4.3. Limits of Market Forces within the Feedback Control Cycle of Mineral Supply

We have outlined above that the most effective way to increase raw material efficiency is to use raw materials thriftier and to increase recycling rates. It always makes sense to employ just so much material as is necessary to achieve the required result. However, under the constraint of the feedback control cycle there always are barriers for increasing recycling indefinitely. In Section 3.2, it has been shown that for highly complex or dispersed material energy input to recover “all” metals contained increases exponentially beyond an optimum. There are other barriers, especially with electronic scrap and consumer goods. Electronic scrap in its entirety is a huge secondary deposit and many electronic products have much higher grades than primary deposits (Table 2). However, this deposit can only be exploited successfully if enough of the used consumer goods can be collected and delivered to sites with suitable metallurgical recovery processes. There lies the problem, however. The specific metal value of a single device is very low: a single mobile phone, for example, is currently worth less than 1 €/phone. Phones recycled in 2010 contained about 250 mg Ag, 24 mg Au, 9 mg Pd and 9 g Cu on average [53]. At these grades, there is hardly any economic incentive for individual users of mobile phones to bring them to a recycling plant. Since then, grades have decreased even further, especially those of Pd and Ag. Nevertheless, in total about 20% of palladium and cobalt mine production go into short-lived consumer goods such as mobile phones, PCs and laptops. For gold and silver 4% of primary production is used for such consumer products. Unfortunately, this potentially rich urban resource is much more scattered than a primary deposit and it needs specific frame conditions and incentives to collect millions of end-of-life products into a useful secondary deposit, an “urban mine”.
Table 2. “Urban Mining” [36,53].
Secondary MaterialGrade GoldGrade Platinum Group Elements (PGE)
PC circuit boards *≈100–200 g/t Au≈30–80 g/t Pd
Mobile phones (without batteries)≈200–300 g/t Au≈50–100 g/t Pd
Monolithic car catalysts-≈2000 g/t PGE
* grades decreasing over the last years.
Another barrier is low grades in products. There is, for example, hardly any economic incentive to recycle indium from indium-tin-oxide (ITO) in TV screens as concentrations are significantly lower than can be won from primary zinc ores as a byproduct in concentrates.
The European Commission recently published a new list of raw materials which it considers critical for the EU, the so-called EU-20 list [54]. It is of interest to compare the metals and semi-metals of this list with the achieved recycling rates of the International Resource Panel of the UNEP (Table 3) [55]. These are global end-of-life functional recycling rates. Functional recycling is recycling in which the physical and chemical properties that made the material desirable in the first place are retained.
Table 3. Recycling rates of metals (or semi-metals) from the EU-20 list [54,55].
Metals of the EU-20 List [54]Recycling Rates According to UNEP [55]
antimony1%–10%
beryllium<1%
cobalt>50%
gallium<1%
germanium<1%
indium<1%
magnesium>25%–50%
niobium (columbium)>50%
platinum>50%
palladium>50%
rhodium>50%
ruthenium>10%–25%
iridium>25%–50%
osmium<1%
heavy rare earths elements<1%
light rare earths elements<1%
tungsten>10%–25%
chromium>50%
These recycling rates apply for the average of all use segments but significant differences can occur. This is specifically valid for the precious metals. For example, about 90% of the gold is used for jewelry, coins and investment ingots, and here—due to gold’s high value—losses are minimal, which leads to the overall very high recycling rate of gold. However, gold recycling rates from electric and electronic appliances (responsible for about 10% of gold mine production) are only in the magnitude of 15% [55] caused by poor collection and inappropriate pre-treatment (see above and Section 4.4).
From Table 3 it becomes obvious that electronic metals especially and semi-metals like indium, germanium and gallium and the rare earths elements used in many high-tech applications as in permanent magnets have very low recycling rates. The reasons become obvious looking at the “metal wheel” of Reuter (Figure 12) [56,57].
The “metal wheel” summarizes the standard technologies for metallurgical treatment of metal associations, involving iron, manganese, chromium, aluminum, magnesium, titanium, tin, nickel, copper, lead and zinc. The concentric rings show the interconnectivity between the main metals as carrier metals and the co- and by-product metals: the inner ring shows the carrier metals, which are the bulk metals in present-day use, the three outer rings show the impurities and minor metals present in the ores of the bulk metals with which they are associated. The two middle rings show those elements that are or can be recovered to maximize economic benefits and minimize environmental impact. The outermost ring contains the elements lost to process residues and emissions. It becomes obvious that elements like indium, gallium or germanium all occur as co-elements in Ring II that have no, or limited, own production infrastructure. This means that specific processes and production infrastructure has to be developed for such elements with low recycling rates (Table 3), a problem addressed in the new German research programme “Economic-strategic raw materials for the high-tech position of Germany” [58]. Man creates “deposits“ in the technosphere, available for “urban mining” that are far more complex than nature-created deposits in the geosphere and combine elements that do not normally occur together in nature.
Figure 12. The metal wheel. Ring I: Co-elements with considerable own production infrastructure. Valuable to highly valuable, some used in high tech applications; Ring II: Co-elements that have no, or limited, own production infrastructure. Mostly highly valuable, high-tech metals, e.g., essential in electronics; Ring III: Co-elements that end up in residues or as emissions. Costly to recover because of waste management or end-of-pipe measures. (From [56,57] with permission of A.M. Reuter).
Minerals 05 00527 g012
Typical examples are lithium, tantalum, or rare earth elements that occur in nature in pegmatites (tantalum, lithium), in carbonatites, in iron ore deposits or special clays (rare earth elements, lithium), or in brines (lithium). In man-made “urban” deposits they appear in combination with other high technology metals like indium, germanium or gallium that occur in nature jointly and exclusively in base metal deposits. Lithium-ion-batteries contain cobalt. In nature, cobalt is not associated with lithium deposits but with nickel deposits. Certain thin film solar panels contain the component CIGS/CIS (copper-indium/gallium selenide = Cu(In,Ga)Se2) on a thin film of molybdenum. Molybdenum occurs together with copper in porphyry copper deposits. After mining, it is metallurgically separated from copper during beneficiation and goes mainly into steel making. Indium occurs with zinc in volcanogenic massive sulfide deposits, whereas gallium occurs in bauxite deposits, lateritic weathering products, and the raw material for the production of aluminum.
This does not mean that the feedback control cycle is not functioning for such low grade “deposits” as indium in TV screens or difficult to process “deposits”. It only requires a drastic real or perceived shortage of the element of interest causing a large price peak. The tantalum price peak at the end of the seventies/beginning of the eighties of last century may serve as an example [35]. At that time, the world experienced a perceived shortage of tantalum, necessary for capacitors required in every electronic circuit. This presumed scarcity created a very pronounced price peak. On the supply side reaction was quick: At that time about 50% of tantalum came from the mining of columbite-tantalite ores (Coltan) in Australia and Africa and about 50% from tin slags in Malaysia and Thailand. During periods of unattractive prices many of these tin slags were too low grade to be processed for tantalum. They were used for landfill to build roads and houses on. In the tantalum boom these slags were uncovered as readily available tantalum source and taken up again and reprocessed, thereby using unconventional ways of “mining” on shopping or recreational properties.
This example shows, however, that the price peak mechanism of the feedback control cycle is not always the optimal route to achieve resource efficiency. In the example above, tailings’ loss was considerable as not all the buildings could be uprooted to get at the landfill and tantalum remained buried and was thus lost forever.
Another example is the phosphorus cycle [59], where possible final losses can occur on two counts:
(1)
Iron ores mostly contain some phosphorus. During the smelting process this phosphorus reports to the slag phase. If the slag is used in the production of cement and then goes into concrete it is functionally lost forever.
(2)
Sewage sludge contains phosphorus often in significant amounts. So far, it is uneconomic to reprocess the sewage sludge for making fertilizer. Only in the production of phosphoric acid or elementary phosphorus might the recovery from sludge be economic. If sewage sludge is not deposited or burned separately, it is diluted with other waste in the incinerator process and probably lost forever.

4.4. Possible Actions for Optimizing the Feedback Control Cycle of Mineral Supply

The goal has to be that the feedback control cycle of mineral supply functions under market economy conditions and constantly increases raw materials efficiency. Although the market economy is the most efficient system to optimize economic returns, in some cases it is not the optimal system for increasing resource efficiency. What measures can be taken to lower the obstacles to using secondary material?
Certain measures could be:
(1)
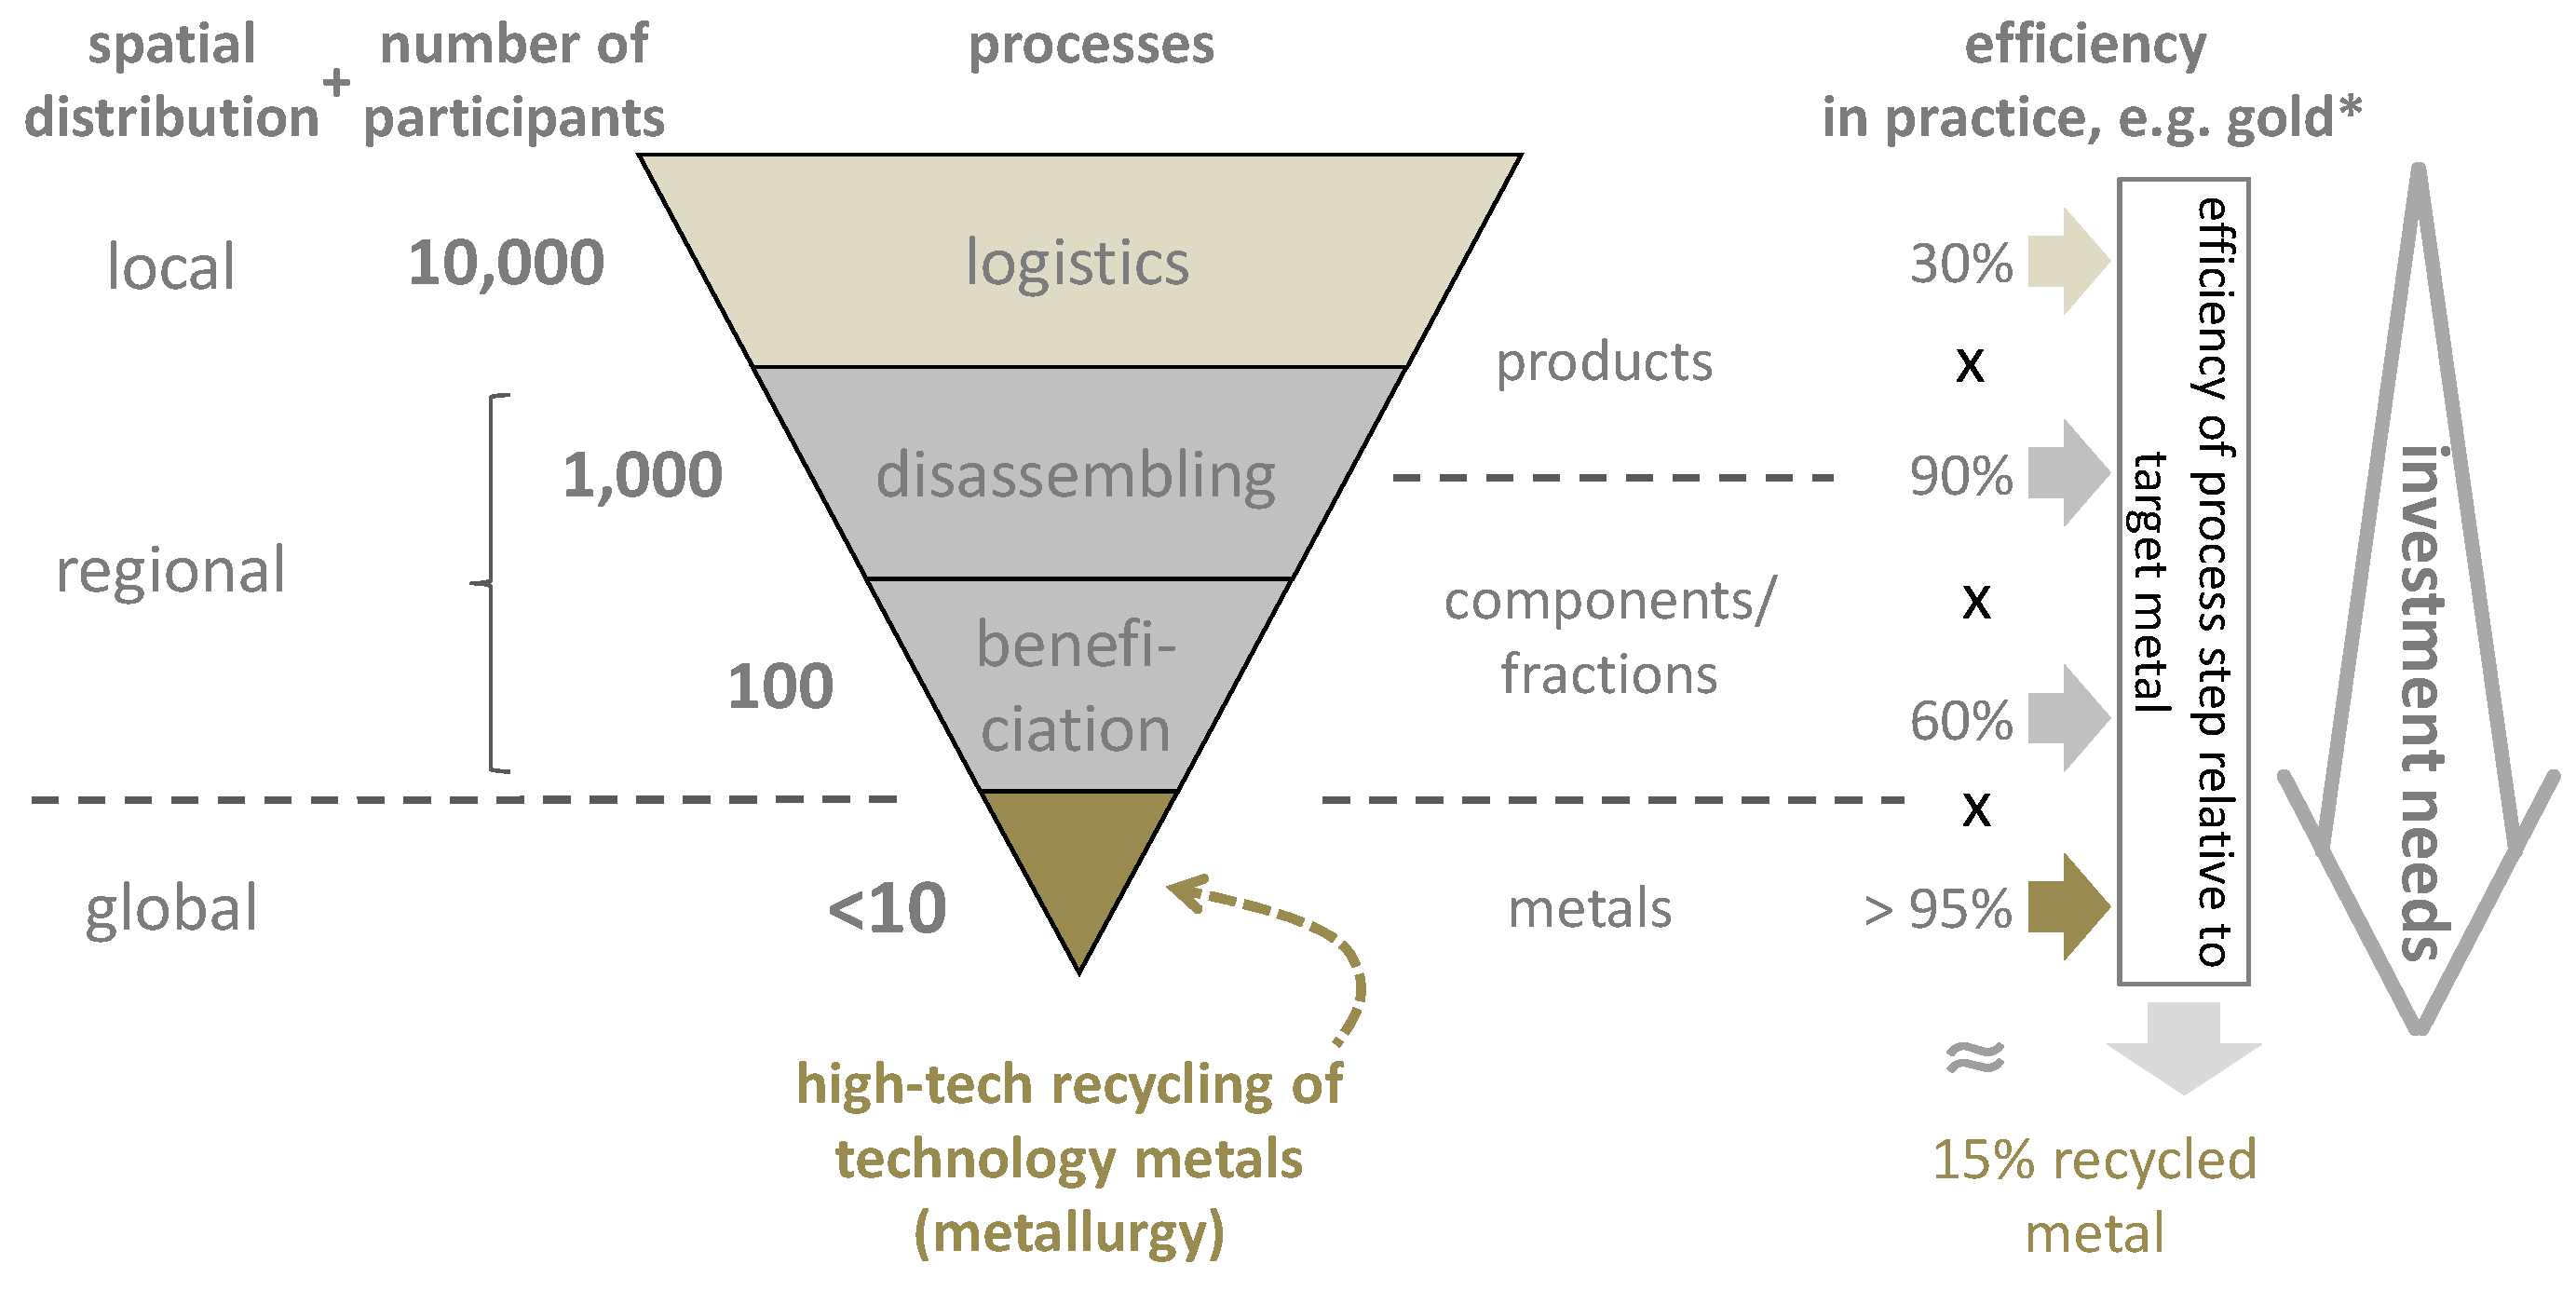
Tackle the political challenge to build up efficient national and international recycling systems. Figure 13 shows the process chain with the number of actors for consumer goods—in this case printed circuit boards. It also shows an assumed efficiency for each stage of the process chain. The overall efficiency is the total product of the efficiencies at each stage. It is evident that in the first collection stage the efficiency is by far the lowest. It is, therefore, mainly at this stage that significant gains in recycling efficiency can be achieved. In France, for instance, mobile phones are collected for recycling even in laundry shops.
Figure 13. Process chain of recycling for consumer goods: technology metals from printed circuit boards [60].
Minerals 05 00527 g013
The numbers in Figure 13 are taken from Germany and Europe, and are typical for the recycling of gold from consumer electronics in these countries: only 30% of the relevant old consumer goods are collected through official channels, while the remaining is either not collected (lost into household waste streams) or escapes proper recycling due to dubious/illegal exports to Western Africa or Asia. In the preparation and beneficiation stage 40% of the gold reports to a “wrong” fraction (steel, plastics, dusts) from where gold is not recovered. The effective recycling rate is the product of the efficiencies at each step. In addition, the waste stream specific establishment of well-adjusted and managed interactions between these steps is crucial for an overall optimization of the system with regard to resource efficiency.
(2)
Prevent dilution of waste streams, but concentrate as much by selective treatment and/or deposition. An example is the separate burning of sewage sludge in mono-incinerators for direct reprocessing or separate deposition. Residues can be stockpiled until economic circumstances would allow the exploitation of such secondary “phosphate deposits”. The present Federal German government’s programme includes plans for such action [61,62].
(3)
Foster the transparency of waste flows and the use of technically and environmentally superior recycling processes all along the recycling chains. The secure channeling of certain waste flows to such well-supervised facilities can bring a significant overall improvement in metals recycling. This is specifically relevant for complex waste streams such as end-of-life electronics or spent batteries, which contain a mix of valuable and hazardous materials. Here, the establishment of auditable treatment standards and mandatory certification schemes for recycling processes will create level playing field conditions for facilities using best available technologies. Without stringent quality requirements for recycling often only a few valuable and easily recoverable base and precious metals are recovered while other critical metals are lost. At the same time, by avoiding the costs for proper treatment of hazardous waste, environmental and social costs are externalized. Such a ruthless economic optimization is today the main driver for sub-standard recycling and illegal or dubious exports of scrap to some developing or transition countries that lack technologically advanced plants to recover a wider range of metals under environmentally sound conditions.
Resource efficiency can further be increased by facilitating trade in by-products, waste and end-of-life products and by channeling these to certified high-quality recycling plants, whether inside Europe or imported into Europe [63].
(4)
Support research and development as described above, taking the new German research programme “Economic-strategic raw materials for the high-tech position of Germany” as a model [58].

5. Conclusions

The principle of inter-generational equity is generally accepted as a base for achieving sustainable development: a path allowing every future generation the option of being as well off as its predecessors. To complement the universal goal of inter-generational equity there is the aspect of intra-generational equity encompassing three humanitarian challenges: (1) to conserve the basic needs of life; (2) to enable all people to achieve economic prosperity; and (3) to strive towards social justice.
The three essential goals of intra-generational equity and the aims of inter-generational equity are impossible to achieve without solving the trilemma of security of supply of natural resources under the conditions of economic viability and environmental sustainability.
For securing the supply of natural resources, not only do the primary resources of the geosphere play a crucial role but also the secondary resources of the technosphere—“atoms do not get lost”. Man generally does not need raw materials as such but only their intrinsic property to fulfil a function. He is in fact in the position to choose alternative solutions to functions applying three resource domains: (a) all the resources from the geosphere (i.e., primary resources); (b) all the resources from the technosphere (i.e., secondary resources), reusable by recycling and (c) last but not least, the most important resource: human ingenuity and creativity.
Since in a market economy raw materials are not free and have a price, it makes sense to use raw materials as efficiently as possible to minimize costs. This efficiency is measured by the money value of the raw materials needed to achieve the solution for a function. The final goal of resource efficiency must be to decouple the growth of gross national product and environmental impacts from the use of natural resources by dealing not with subsystems but by taking the world in its totality and the hierarchy of natural resources into account.
An important element for increasing raw materials efficiency is to use secondary material as much as possible. The processing of pure secondary material always needs significantly less energy than the treatment of primary material. The more complex or dispersed a material becomes the more energy intensive the recycling process will be. Extreme cases are metal dissipation comparable to sparse metal distribution in the earth’s crust. Although the metal atoms are not lost physically, it would require “infinite” amounts of energy to recover dissipated metals for functional reuse. Therefore, there is an optimum of recycling compared to the energy required for mining, beneficiation and smelting of primary resources.
Mineral supply is controlled by a feedback mechanism. When there is a shortage of a commodity in a market economy, prices will rise, triggering reactions. The expectation of high financial returns will encourage inventiveness and creativity in the quest for new solutions. On the supply side, for primary resources the appropriate response is to cut losses in the mining process, to lower the cut-off grade, to improve recoveries in the beneficiation and smelting processes, to expand existing production facilities, and to discover and bring into production new deposits. For secondary resources, the key to increasing the supply lies in improving recycling rates by better collection efficiency and technology, reprocessing lower grade scrap that becomes economic because of increased prices, and reducing downgrading to optimize the usefulness of secondary materials. On the demand side, implementation of new and more efficient processes, development of substitution technologies, material savings, and the invention of entirely new technical solutions that fulfil the same function without the need of using the scarce and suddenly more expensive material, are effective reactions to a price rise. The reaction to price rises on the supply side (more supply) and demand side (less demand) will lead to a balance again.
For the functioning of the feedback control cycle of mineral supply, it is irrelevant if there is an actual physical shortage or a perceived shortage, a “hype”. Relevant for the functioning of the feedback control cycle is only the price signal. If the market believes there is or will be shortage, real or not, and prices rise consequently, the promise of financial rewards generates in short order incentives to find creative solutions in increased supply or diminishing demand, or both.
The feedback control cycle continuously improves resource efficiency by learning effects and by expanding the range of elements in the periodic table that have useful applications, thereby supporting efforts to reach the dual goals of inter- and intra-generational fairness. The number of opportunities increases exponentially with the number of elements used. If prices increase, the learning effects mainly are on the supply side with increased use of secondary resources and on the demand side with thriftier use of raw materials.
In some cases, however, the price peak mechanism of the feedback control cycle under market economy conditions is not the optimal route achieving resource efficiency. Examples are the low recycling rates for many electronic items when the value of a single item is too low to be an incentive for the user to recycle. Here, political measures, like building up of efficient national and international recycling systems, prohibiting dilution of waste streams, preventing exports of scrap, and supporting research and development, are necessary.

Acknowledgments

The authors thank Bela Bognar for reading the manuscript and making numerous suggestions for improvements, three anonymous reviewers for their helpful comments and Franz Binot, Ute Ehmann, Tobias Kracke and Georg Wellmer for helping with the figures.

Author Contributions

Both authors contributed equally to this publication.

Conflicts of Interest

The authors declare no conflict of interest.

References

  1. Brundtland, G.H. Our Common Future—Report of the World Commission on Environment and Development; Oxford University Press: Oxford, UK, 1987. [Google Scholar]
  2. Solow, R. An almost practical step towards sustainability. Resour. Policy 1993, 19, 162–172. [Google Scholar] [CrossRef]
  3. Ernst, W.G. Global equity and sustainable earth resource consumption requires super-efficient extraction-conservation-recycling and ubiquitous, inexpensive energy. Int. Geol. Rev. 2002, 44, 1072–1091. [Google Scholar] [CrossRef]
  4. Hartwick, J.M. Intergenerational Equity and the Investing of Rents from Exhaustible Resources. Am. Econ. Rev. 1977, 67, 972–974. [Google Scholar]
  5. Ayres, R.U. On the practical limits of substitution. Ecol. Econ. 2007, 61, 115–128. [Google Scholar] [CrossRef]
  6. Tilton, J.E. On Borrowed Time: Assessing the Threat of Mineral Depletion; Resources for the Future: Washington, DC, USA, 2003; p. 30. [Google Scholar]
  7. United Nations. Agenda 21. In Proceedings of the UN Conference on Environment and Development, Rio de Janeiro, Brazil, 3–14 June 1992; Available online: https://sustainabledevelopment.un.org/content/documents/Agenda21.pdf (accessed on 10 July 2015).
  8. Wellmer, F.-W.; Steinbach, V. Is a road to sustainable use of non-renewable mineral raw materials possible? In Proceedings of the 5th International Conference on SDIMI 2011 Sustainable Development in the Minerals Industry, Aix-la-Chapelle, Germany, 14–17 June 2011; pp. 517–534.
  9. McKelvey, V.E. Mineral resource estimate and public policy. Am. Sci. 1973, 60, 32–40. [Google Scholar]
  10. Wyman, O. World Energy Trilemma, World Energy Council, 2015. Available online: https://www.worldenergy.org/work-programme/strategic-insight/assessment-of-energy-climate-change-policy/ (accessed on 22 May 2015).
  11. Jasinski, S.M. Phosphate Rock. In US Geological Survey Mineral Commodity Summaries; US Geological Survey: Washington, DC, USA, 2014; pp. 118–119. [Google Scholar]
  12. Scholz, R.; Wellmer, F.-W. Approaching a dynamic View on the Availability of Mineral Resources: What we may learn from the Case of Phosphorus? Glob. Environ. Chang. 2013, 23, 11–27. [Google Scholar] [CrossRef]
  13. Schebek, L.; Becker, B.F. Substitution von Rohstoffen—Rahmenbedingungen und Umsetzung. In Strategische Rohstoffe—Risikovorsorge; Kausch, P., Bertau, M., Gutzmer, J., Matschullat, J., Eds.; Springer Spektrum Verlag: Berlin, Germany; Heidelberg, Germany, 2014; pp. 3–12. [Google Scholar]
  14. Thimm, U. Reformator der Welternährung. idw—Informationsdienst Wissenschaft. 16 April 1998. Available online: https://idw-online.de/de/news4377 (accessed on 17 April 2015).
  15. Wellmer, F.-W. Reserves and resources of the geosphere, terms so often misunderstood. Is the life index of reserves of natural resources a guide to the future? Z. Dtsch. Ges. Geowiss. 2008, 159, 575–590. [Google Scholar]
  16. Statistisches Bundesamt. Nachhaltige Entwicklung in Deutschland—Indikatorenbericht 2014. Available online: http://www.destatis.de/DE/Publikationen/Thematisch/UmweltoekonomischeGesamtrechnungen/Umweltindikatoren/IndikatorenPDF_0230001.pdf?__blob=publicationFile (accessed on 21 August 2015).
  17. Wagner, M.; Wellmer, F.-W. A hierarchy of natural resources with respect to sustainable development—A basis for a natural resources efficiency indicator. In Mining, Society and a Sustainable World; Richard, J.P., Ed.; Springer: Heidelberg, Germany; Dordrecht, The Netherlands, 2009; pp. 91–121. [Google Scholar]
  18. Hagelüken, C. Metallische Werkstoffe im Kontext von Ressourceneffizienz und Kreislaufwirtschaft. In Proceedings of the i-WING 2015, Dresden, Germany, 28 April 2015. (In German)
  19. Rickmann, D.; Luvall, J.C.; Shaw, J.; Mask, P.; Kissel, D.; Sullivan, D. Precision Agriculture—Changing the Face of Farming. Geotimes 2003, 48, 28–31. [Google Scholar]
  20. Bührer, W. 50 Jahre Düngemittelstatistik in Deutschland; Wirtschaft und Statistik May 2001; Statistisches Bundesamt: Wiesbaden, Germany, 2001; pp. S367–S371. (In German)
  21. Simonis, U.E. Resource Decoupling and Impact Decoupling—Central Elements of a Global Ecological U-Turn, Paper 5. In Proceedings of the 5th Freiberg Innovation Symposium, Freiberg, Germany, 25–26 March 2015.
  22. International Resource Panel UNEP. Decoupling Natural Resources Use and Environmental Impacts from Economic Growth. Available online: http://www.unep.org/resourcepanel/decoupling/files/pdf/Decoupling_Report_English.pdf (accessed on 28 April 2015).
  23. Australia’s Gold Industry—The Exploration Challenge. Available online: http://www.minerals.org.au/resources/gold/the_exploration_challenge/ (accessed on 21 April 2015).
  24. Ernst & Young. US Oil and Gas Reserves Study 2014. Available online: http://www.ey.com/Publication/vwLUAssets/EY-US-Oil-and-Gas-reserves-study-2014/$FILE/EY-US-Oil-and-Gas-reserves-study-2014.pdf (accessed on 28 April 2015).
  25. Carencotte, F.; Geldron, A.; Villeneuve, J.; Gaboriau, H. Économie circulaire et recyclage des métaux. Géosciences 2012, 15, 64–71. (In French) [Google Scholar]
  26. Steinbach, V.; Wellmer, F.-W. Consumption and Use of non-Renewable Mineral and Energy Raw Materials from an Economic Geology Point of View. Sustainability 2010, 2, 1408–1430. [Google Scholar] [CrossRef]
  27. Wellmer, F.W.; Becker-Platen, J.D. World natural resources policy—Focusing on mineral resources. In Our Fragile World—Challenges and Opportunities for Sustainable Development; Encyclopedia for Life Support Systems Publishers: Oxford, UK, 2001; Volume 1, pp. 183–207. [Google Scholar]
  28. Skinner, B.J. A Second Iron Age Ahead. Am. Sci. 1976, 64, 258–269. [Google Scholar]
  29. Hagelüken, C. Recycling of (critical) metals. In Critical Metals Handbook; Gunn, G., Ed.; American Geophysical Union: Washington, DC, USA, 2014; pp. 41–69. [Google Scholar]
  30. Gerber, J. Strategy towards the red list from a business perspective. In Proceedings of the ETH Workshop on Scarce Raw Materials, Davos, Switzerland, 1–2 September 2007.
  31. European Aluminium Association. Environmental Profile Report for the European Aluminium Industry—Life Cycle Inventory Data for Aluminium Production and Transformation Processes in Europe; European Aluminium Association: Brussels, Belgium, 2008. [Google Scholar]
  32. Johnson Matthey. PGM Market Report November 2014—Forecast of Platinum Supply & Demand in 2014; Johnson Matthey: London, UK, 2014; p. 32. [Google Scholar]
  33. DERA Rohstoffinformation. Rohstoffrisikobewertung–Platingruppenmetalle–Platin, Palladium, Rhodium; DERA Rohstoffinformation: Hannover, Germany, 2015; p. 155. (In German) [Google Scholar]
  34. BCS. Incorporated: 2007—Mining Industry Energy Bandwith Study—US Department of Energy-Industrial Technology Program. Washington, DC, USA. Available online: http://energy.gov/sites/prod/files/2013/11/f4/mining_bandwidth.pdf (accessed on 1 October 2015).
  35. Wellmer, F.-W.; Dalheimer, M. The Feedback Control Cycle as Regulator of past and future Mineral Supply. Miner. Depos. 2012, 47, 713–729. [Google Scholar] [CrossRef]
  36. Van Kerckhoven, T. Optimizing (precious) metals recovery out of electronic scrap. In Proceedings of the Electronics Recycling Asia 2014, Singapore, 13 November 2014.
  37. Thomas, W.I.; Thomas, D.S. The Child in America: Behavior Problems and Programs; Alfred A. Knopf: New York, NY, USA, 1928. [Google Scholar]
  38. Capon, E. Qin Shihuang—Terracotta Warriors and Horses. Catalogue to the “Exhibition of the Terracotta Figures of Warriors and Horses of the Qin Dynasty of China”; International Cultural Corporation of Australia: Sydney, Australia, 1982. [Google Scholar]
  39. Raymond, R. Out of the Fiery Furnace—The Impact of Metals on the History of Mankind; Macmillan: Melbourne, Australia, 1984. [Google Scholar]
  40. National Research Council (NRC), Committee on Critical Mineral Impacts on the US Economy. Minerals, Critical Minerals, and the US Economy; The National Academy Press: Washington, DC, USA, 2008. [Google Scholar]
  41. Achzet, B.; Reller, A.; Zepf, V.; Rennie, C.; Ashfield, M.; Simmons, J. Materials Critical to the Energy Industry: An Introduction (Report for the BP Energy Sustainability Challenge). Universität Augsburg, 2011. Available online: http://www.physik.uni-augsburg.de/lehrstuehle/rst/downloads/Materials_Handbook_Rev_2012.pdf (accessed on 28 October 2014).
  42. Kaldor, N. A Classificatory Note on the Determinateness of Equilibrium. Rev. Econ. Stud. 1934, 1, 122–136. [Google Scholar] [CrossRef]
  43. Ezekiel, M. The cobweb theorem. Q. J. Econ. 1938, 52, 255–280. [Google Scholar] [CrossRef]
  44. Kesler, S.E. Mineral Resources, Economics and the Environment; Macmillan: New York, NY, USA, 1994; p. 106. [Google Scholar]
  45. Wellmer, F.-W.; Becker-Platen, J.D. Sustainable development and the exploitation of mineral and energy resources: A review. Int. J. Earth Sci. 2002, 91, 723–745. [Google Scholar]
  46. Wellmer, F.-W.; Dalheimer, M. Trends und Perspektiven der Rohstoffversorgung Deutschlands im 21. Jahrhundert. In Rohstoffwirtschaft im Prozess der Transformation; Slaby, D., Brezinski, H., Eds.; Freiberger Forschungshefte: Freiberg, Germany, 1999; Volume 5, pp. 11–52. (In German) [Google Scholar]
  47. Bundesanstalt für Geowissenschaften und Rohstoffe; Deutsches Institut für Wirtschaftsforschung; Institut zur Erforschung Technologischer Entwicklungslinien. Ausfallrisiko bei 31 Rohstoffen; Bundesanstalt für Geowissenschaften und Rohstoffe: Berlin, Germany; Deutsches Institut für Wirtschaftsforschung: Hamburg, Germany; Institut zur Erforschung Technologischer Entwicklungslinien: Hannover, Germany, 1997. (In German) [Google Scholar]
  48. Minowa, T. Rare Earth Magnets: Conservation of Energy and the Environment. Resour. Geol. 2008, 58, 414–422. [Google Scholar] [CrossRef]
  49. Duclos, S.; Otto, J.; Konitzer, D. Design in an era of constrained resources. Mech. Eng. 2010, 132, 36–40. [Google Scholar]
  50. Elsner, H. Zur aktuellen Entwicklung bei Seltenen Erden für die Automatisierungstechnik, Quest-Trendmagazin. 23 July 2012. Available online: http://www.quest-trendmagazin.de/ressourcen/seltene-erden/Interview-BGR.html (accessed on 21 April 2015). (In German)
  51. BGR-Newsletter. Mineralische Rohstoffe—Nachfrage nach Schweren Seltenen Erden bricht ein. 25 December 2014. Available online: http://www.bgr.bund.de/SharedDocs/Newsletter/DE/2014/newsletter-2014–06.html?view=renderNewsletterHtml&nn=1544598 (accessed on 21 April 2015). (In German)
  52. Kingsnorth, D. The Global Green Economy: Opportunities & Threats for the Rare Earths Industry, Paper 5. In Proceedings of the Freiberg Innovation Symposium, Freiberg, Germany, 25–26 March 2015.
  53. Hagelüken, C. Die Bedeutung des Recyclings für die Verfügbarkeit von Strategischen Metallen. In Proceedings of the WING-Conference, Session 3—Strategic Raw Materials, Substitution, Chemistry, Berlin, Germany, 5 October 2011. (In German)
  54. European Commission (EC). Critical Raw Materials for the EU (Report of the Ad-Hoc-Working Group on Defining Critical Raw Materials), Brussels, 2010. Available online: http://ec.europa.eu/enterprise/policies/raw-materials/files/docs/report-b_en.pdf (accessed on 26 June 2014).
  55. United Nations Environment Programme (UNEP). Recycling Rates of Metals—A Status Report. A Report of the Working Group on the Global Metal Flows to the International Resource Panel; Graedel, T.E., Allwood, J., Birat, J.P., Reck, B.K., Sibley, S.F., Sonnemann, G., Buchert, M., Hagelüken, C., Eds.; UNEP: Paris, France, 2011. [Google Scholar]
  56. Reuter, M.A.; Boin, U.M.J.; van Schaik, A.; Verhoef, E.V.; Heiskanen, K.; Yang, Y.; Georgalli, G. The Metrics of Material and Metal Ecology, Harmonizing the Resource, Technology and Environmental Cycles; Elsevier: Amsterdam, The Netherlands, 2005. [Google Scholar]
  57. Verhoef, E.V.; Gerard, P.J.; Reuter, M.A. Process knowledge, system dynamics and metal ecology. J. Ind. Ecol. 2004, 8, 23–43. [Google Scholar] [CrossRef]
  58. BMBF (Bundesministerium für Bildung und Forschung). Raw Materials of Strategic Economic Importance for High-Tech Made in Germany—BMBF Research and Development Programme for New Raw Materials Technologies; BMBF: Bonn, Germany, 2013; p. 52. [Google Scholar]
  59. Scholz, R.W.; Wellmer, F.-W. Losses and use efficiency along the phosphorus cycle: Definitions, notions, and significance for sustainable management. In Proceedings of the Conference Losses and Efficiency, Stuttgart, Germany, 28 October 2014.
  60. Hagelüken, C. Technologiemetalle—Systemische Voraussetzungen entlang der Recyclingkette. In Strategische Rohstoffe—Risikovorsorge; Kausch, P., Bertau, M., Gutzmer, J., Matschullat, J., Eds.; Springer Spektrum Verlag: Berlin, Germany; Heidelberg, Germany, 2014; pp. S161–S172. (In German) [Google Scholar]
  61. CDU, CSU, SPD. Deutschlands Zukunft Gestalten-Koalitionsvertrag 18. Legislaturperiode. 17 December 2013. Available online: http://www.bundesregierung.de/Content/DE/_Anlagen/2013/2013-12-17-koalitionsvertrag.pdf;jsessionid=FD08C83649DF66AF04E8FDA4C3733613.s1t2?__blob=publicationFile&v=2 (accessed on 28 April 2015). (In German)
  62. BMU (Bundesministerium für Umwelt, Naturschutz, Bau und Reaktorsicherheit). Deutsches Ressourceneffizienzprogramm ProgRess—Programm zur Nachhaltigen Nutzung und zum Schutz der Natürlichen Ressourcen. Available online: http://www.bmub.bund.de/fileadmin/Daten_BMU/Pools/Broschueren/progress_broschuere_de_bf.pdf (accessed on 28 April 2015). (In German)
  63. Eurometaux. Eurometaux’s Proposed Measures to Ensure an Effective EU Circular Economy; Position Paper; Eurometaux: Bruxelles, Belgium, 2015. [Google Scholar]

