1. Introduction
Materials with different surface features can reflect the sun’s radiation. The reflectance property depends on the physical and chemical states of the material, and can be visualized in the form of spectral reflectance curves (or reflectance spectra) as a function of wavelength. Differences in reflectance spectra can be used to classify or distinguish different materials [
1,
2,
3,
4,
5,
6,
7]. The development of Hyper-spectral imaging (or imaging spectroscopy) integrates the power of digital imaging and spectroscopy. Every pixel in the image contains a continuous spectrum, and can be used to characterize the materials with great precision and detail.
Hyper-spectral imaging has been widely used in geological mapping [
8,
9,
10,
11], ore exploration [
12,
13,
14], nature conservation [
15,
16,
17,
18], and food or drink quality analysis [
19,
20]. Recent studies have also used this technology to conveniently and economically examine ancient documents and archaeological artifacts [
21,
22,
23]. Whether this technology can be used in gem identification and separation is not yet understood. Unfortunately, though many spectra of different gems have been reported by previous studies [
24,
25,
26,
27,
28], most of them cannot be used in reflectance hyper-spectral imaging analysis.
Turquoise—hydrous phosphate of aluminum and copper, Cu(Al,Fe3+)6(PO4)4(OH)8·4H2O—is of gemmological interest, with a brilliant history of several thousand years. It was deeply loved by the Chinese, and by people from various countries. As early as in ancient Egypt, ancient Mexico, and ancient Persia, turquoise was considered to be mysterious, and was used in talismans and burial objects. It was used by the Egyptians to carve gods to guard treasure. The Indians think that wearing a turquoise decoration can ward off evil spirits and get gods’ blessings. In Tibet, it is used in ornaments—it was used for the first Tibetan king’s crown, and as shrine offerings.
China is rich in gem-quality turquoise resources, including north-west Hubei Province. In this study, we determined the reflectance spectra (350–2500 nm) of four types of turquoise samples (porcelain, hard turquoise, soft turquoise, and loose turquoise) sourced from Shiyan city, Hubei province using an ASDTM TerraSpec spectrometer, and used a HySpexTM imager to obtain the hyper-spectral image (1000–2500 nm) of the turquoise samples, in an attempt to understand their spectral features and to evaluate the capability of hyper-spectral imaging in turquoise identification and separation.
2. Materials and Methods
2.1. Samples
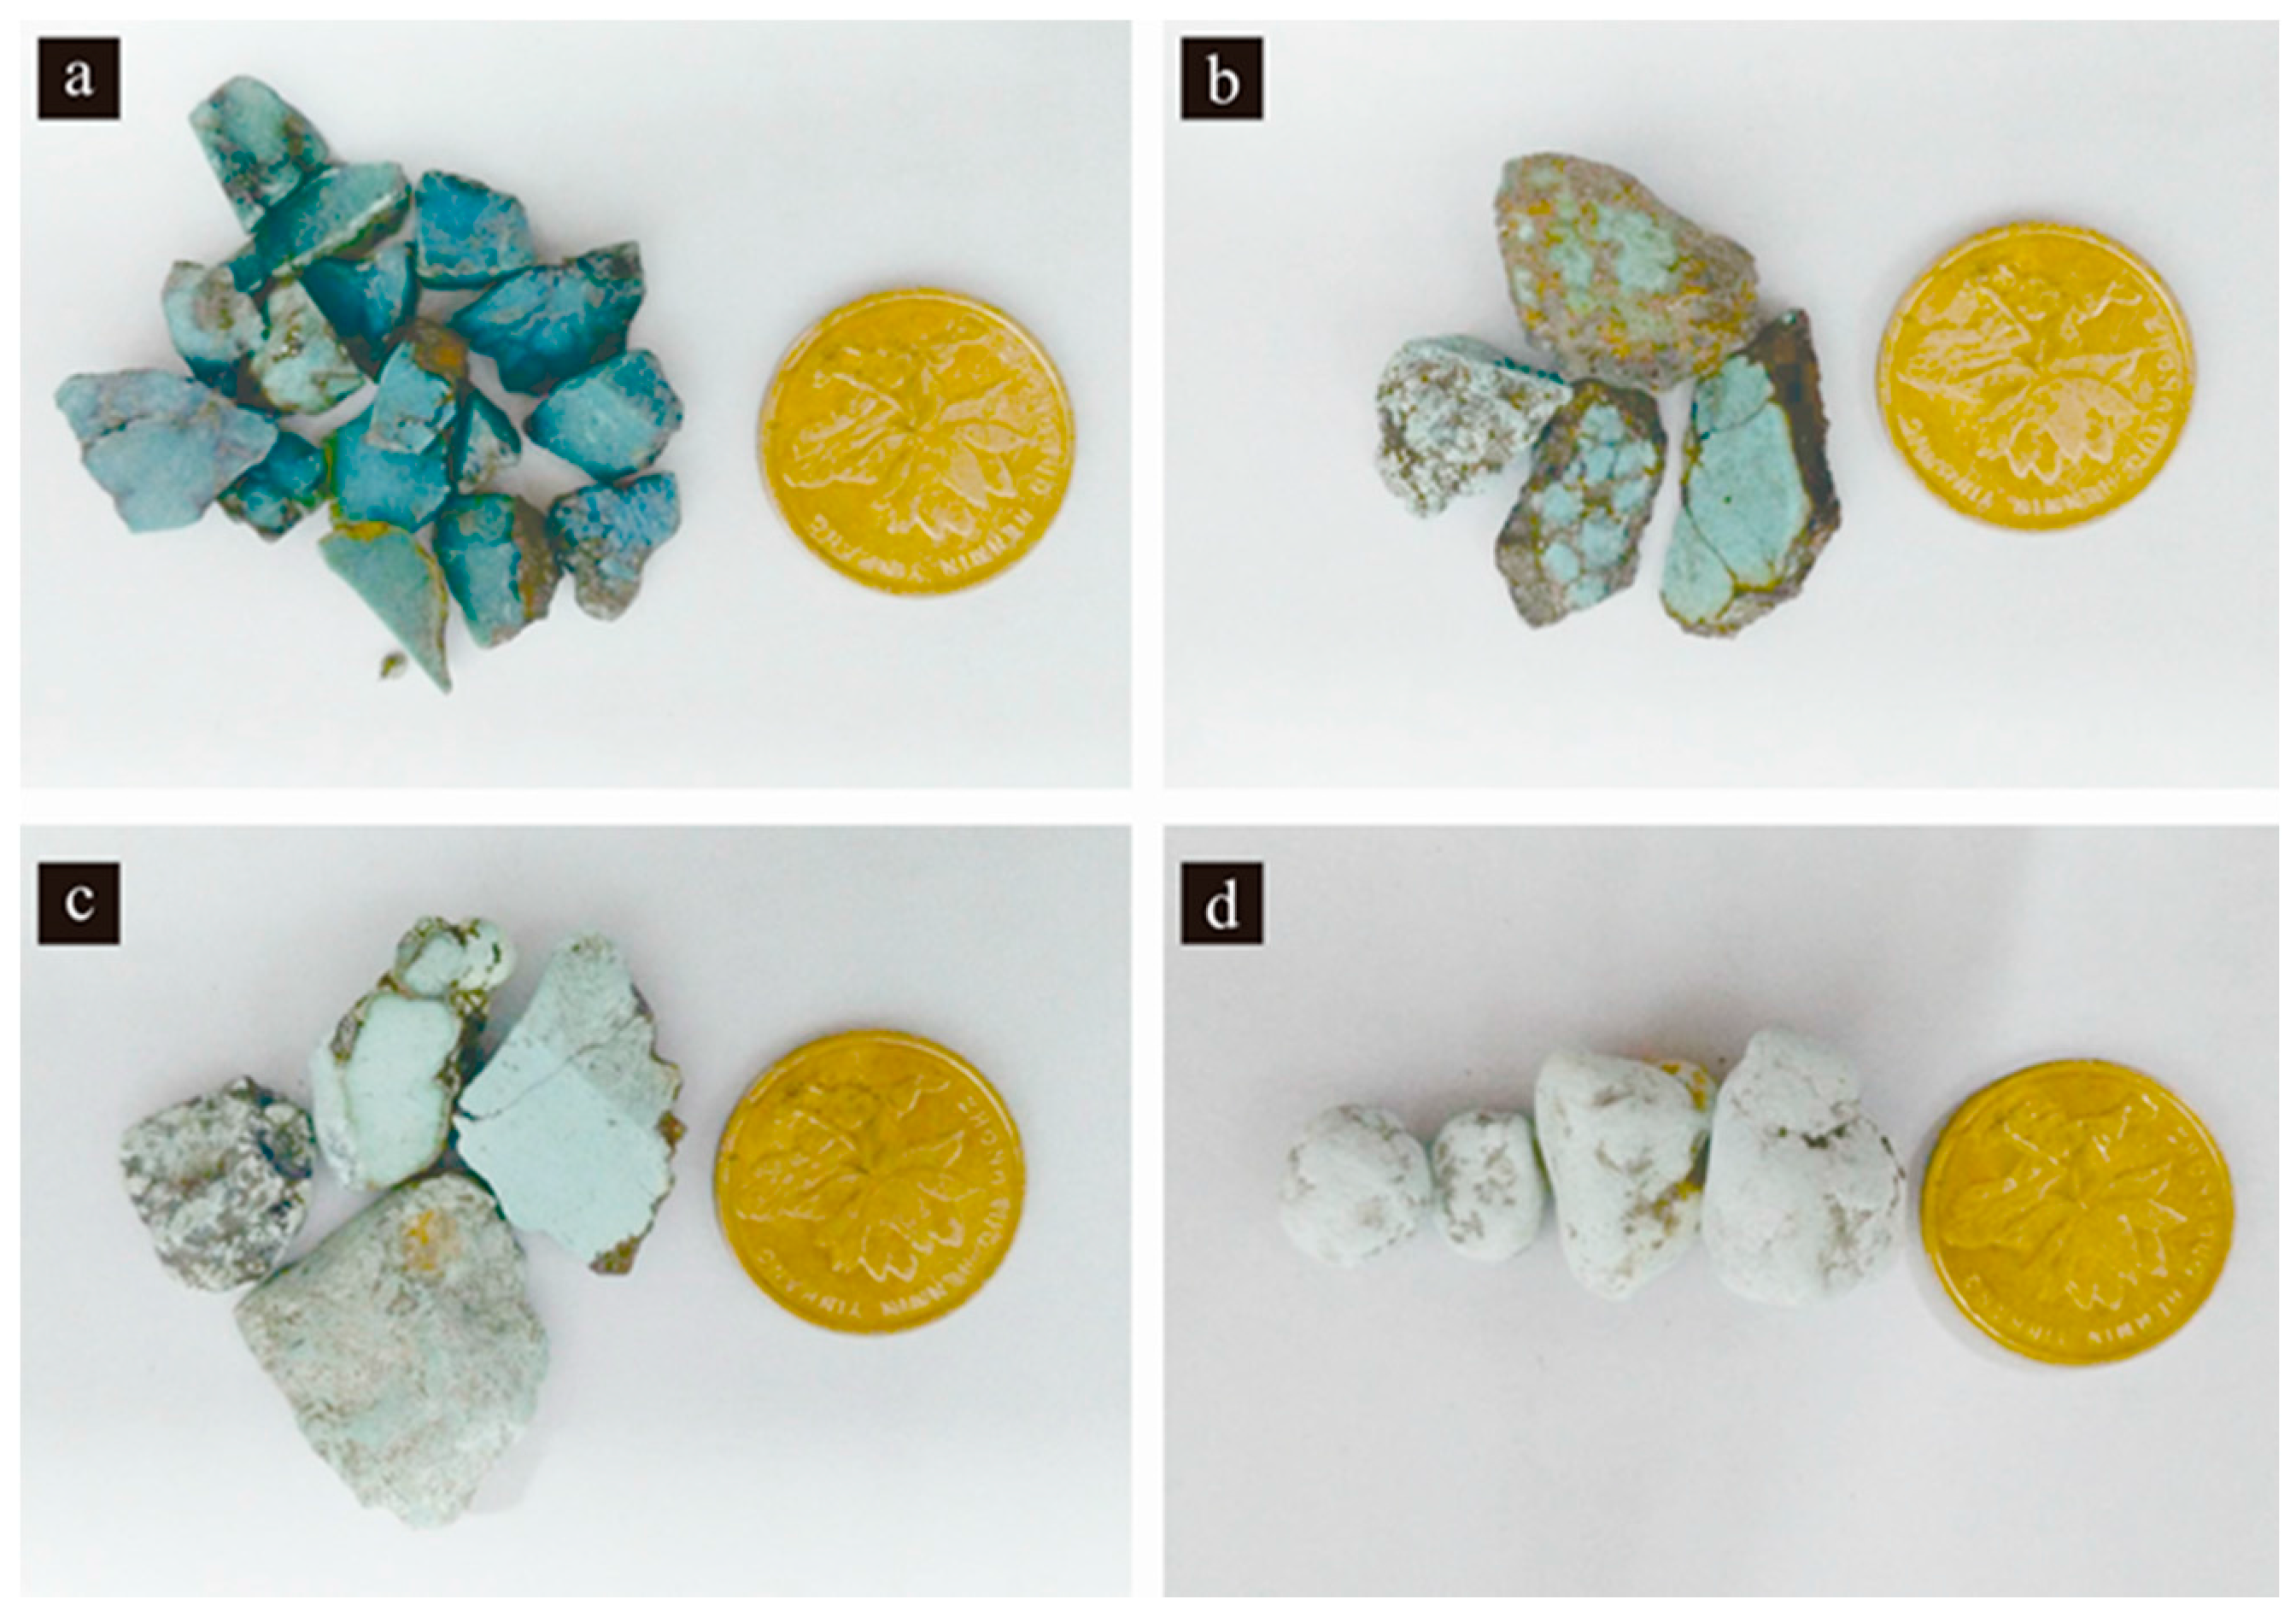
The turquoise samples used in this study (
Figure 1) are divided based on density and hardness. They are porcelain (high hardness and density), hard turquoise (medium hardness and density), soft turquoise (medium to low hardness and density), and loose turquoise (low hardness and density).
Porcelain is dark blue to dark green, has a delicate texture with Mohs hardness between 5.5 and 6, and grain size ranging from 1 to 4 mm.
Hard turquoise is blue-green to sea foam with relatively high density. The Mohs hardness of the sample is 4.5–5.5, and the grain size is from 3 to 5 mm.
Soft turquoise is light blue with relatively low density. The Mohs hardness is below 4.5, and the grain size is from 5 to 6 mm.
Loose turquoise is light grey and soft, with earthly luster and dull with grain size between 4 and 5 mm. It marks paper in much the same way as graphite.
2.2. Instruments
Spectrum measurement experiments of four turquoise samples were carried out using an ASDTM TerraSpec spectrometer (Analytical Spectral Devices Inc., Boulder, CO, USA), for which the spectral range is 350–2500 nm, and the spectral resolutions are 3 nm at 700 nm and 6 nm at 1400 nm and 2100 nm. The sampling intervals for the instrument are 1.4 nm between 350 nm and 1000 nm, and 2 nm between 1000 nm and 2500 nm. The signal-to-noise values are 9500 DN at 700 nm, 5000 DN at 1400 nm, and 800 DN at 2100 nm.
The hyper-spectral images of the turquoise samples were acquired using a HySpex
TM hyper-spectral imager (HySpex
TM SWIR-320m-e, NEO, Skedsmo, Norway). The spectral range of the instrument is from 1000 nm to 2500 nm at a spectral sampling interval of 6 nm. The instrument can also provide images showing a textural map of minerals with a spatial resolution of ~0.75 mm. Detailed technical specifications of the HySpex
TM SWIR-320m-e imager are given in
Table 1.
3. Experiments
3.1. Spectral Measurement
The ASDTM spectrometer was set up following the guidelines described in the Labspec4 user manual. An accessory light source (halogen lamp) was employed to measure the spectrum without sunlight. The ASDTM instrument was connected to a laptop and manipulated using the RS3 software package (Analytical Spectral Devices Inc., Boulder, CO, USA). Before the experiment, a white reference was introduced to optimize and calibrate the instrument. The reflectance of the white reference was automatically set to 1 by the RS3 software. Since the turquoise samples are usually in small particles, a black plastic plate with a coarse surface was used to make turquoise particles flat. During the experiment, the detector was closed to the turquoise particle level.
Five spectra were recorded by the RS3 software in one measurement to monitor any variation during the measurement. After the experiment, a repeat measurement of the white reference was conducted to check whether a significant change of the standard spectrum occurred during the experiment. The spectra of four turquoise samples were exported using RS3 software, then saved as ASCII files with ViewSpecPro software (Analytical Spectral Devices Inc., Boulder, CO, USA). The ASCII files were converted to a spreadsheet file with Excel
TM 2007, then plotted with CorelDRAW
TM X5. The name list of the spectral files and related turquoise samples are given in
Table 2.
3.2. Hyper-Spectral Image Scanning
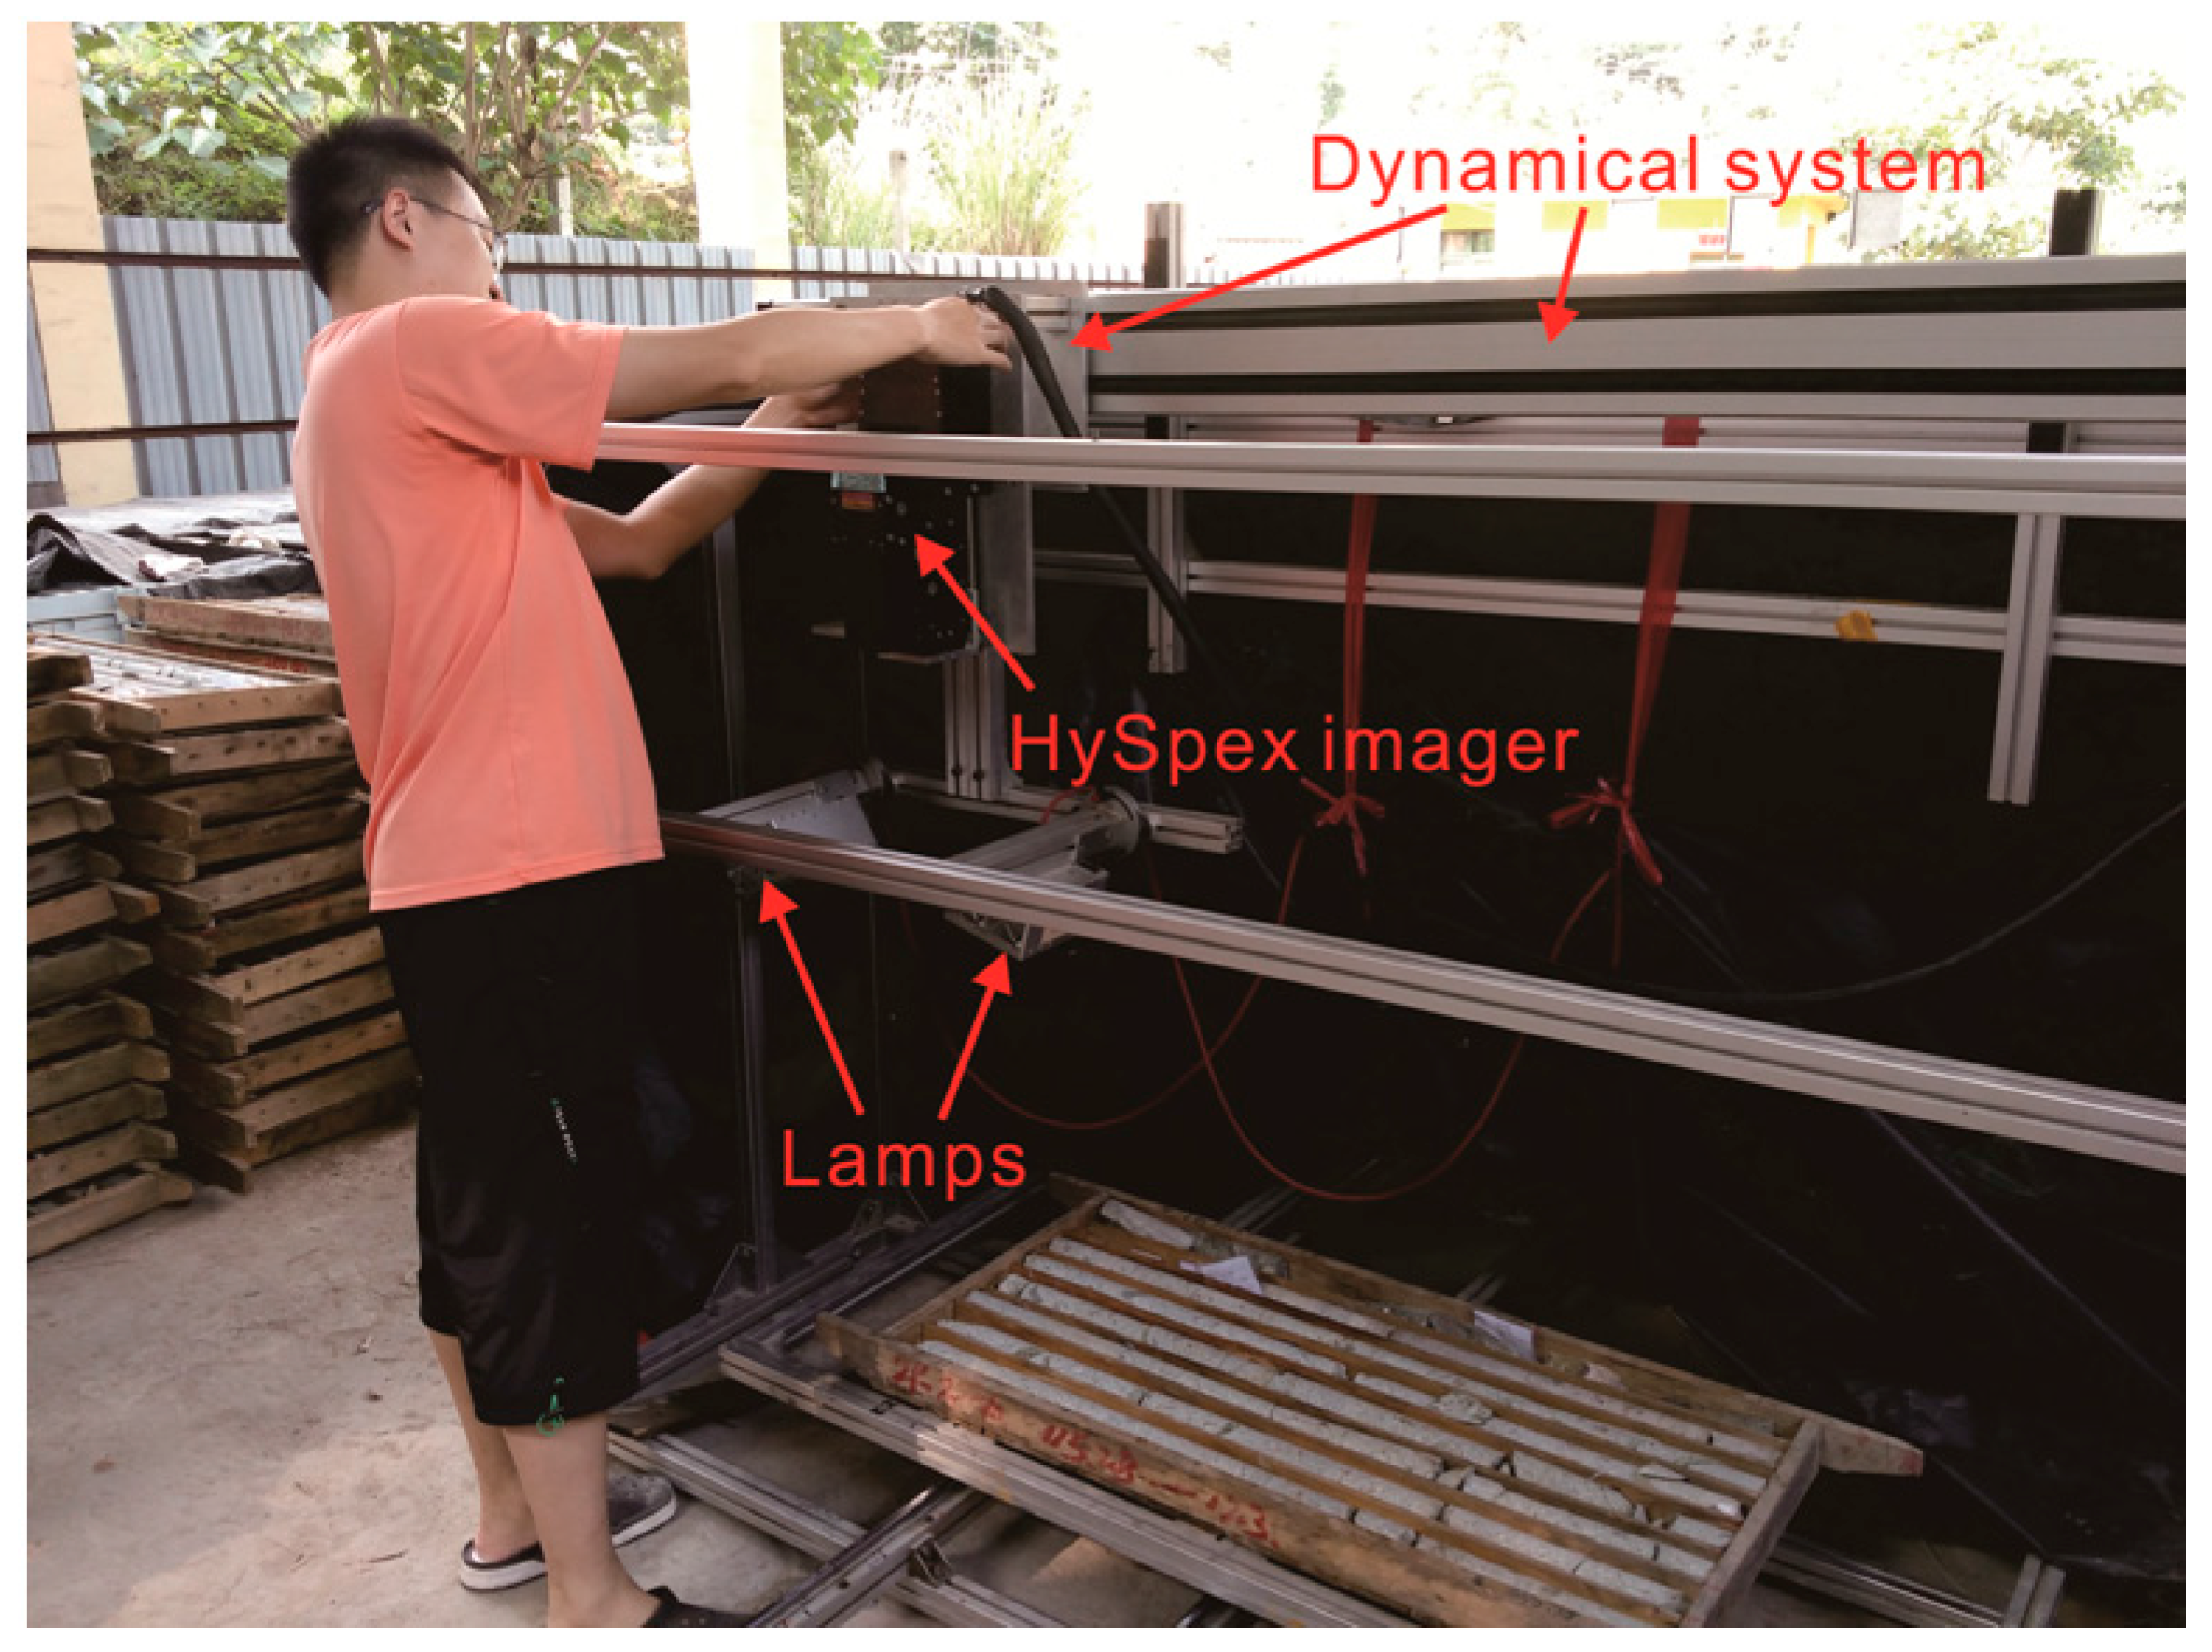
The HySpex
TM imaging spectrometer was deployed onto a dynamical system (
Figure 2) so that it could be controlled to move in a straight line. Two 150 Watt halogen lamps were also fixed onto the dynamical system to provide a light supply (
Figure 2). The imaging spectrometer and the dynamical system were connected to a computer so that it could be manipulated using the HySpex
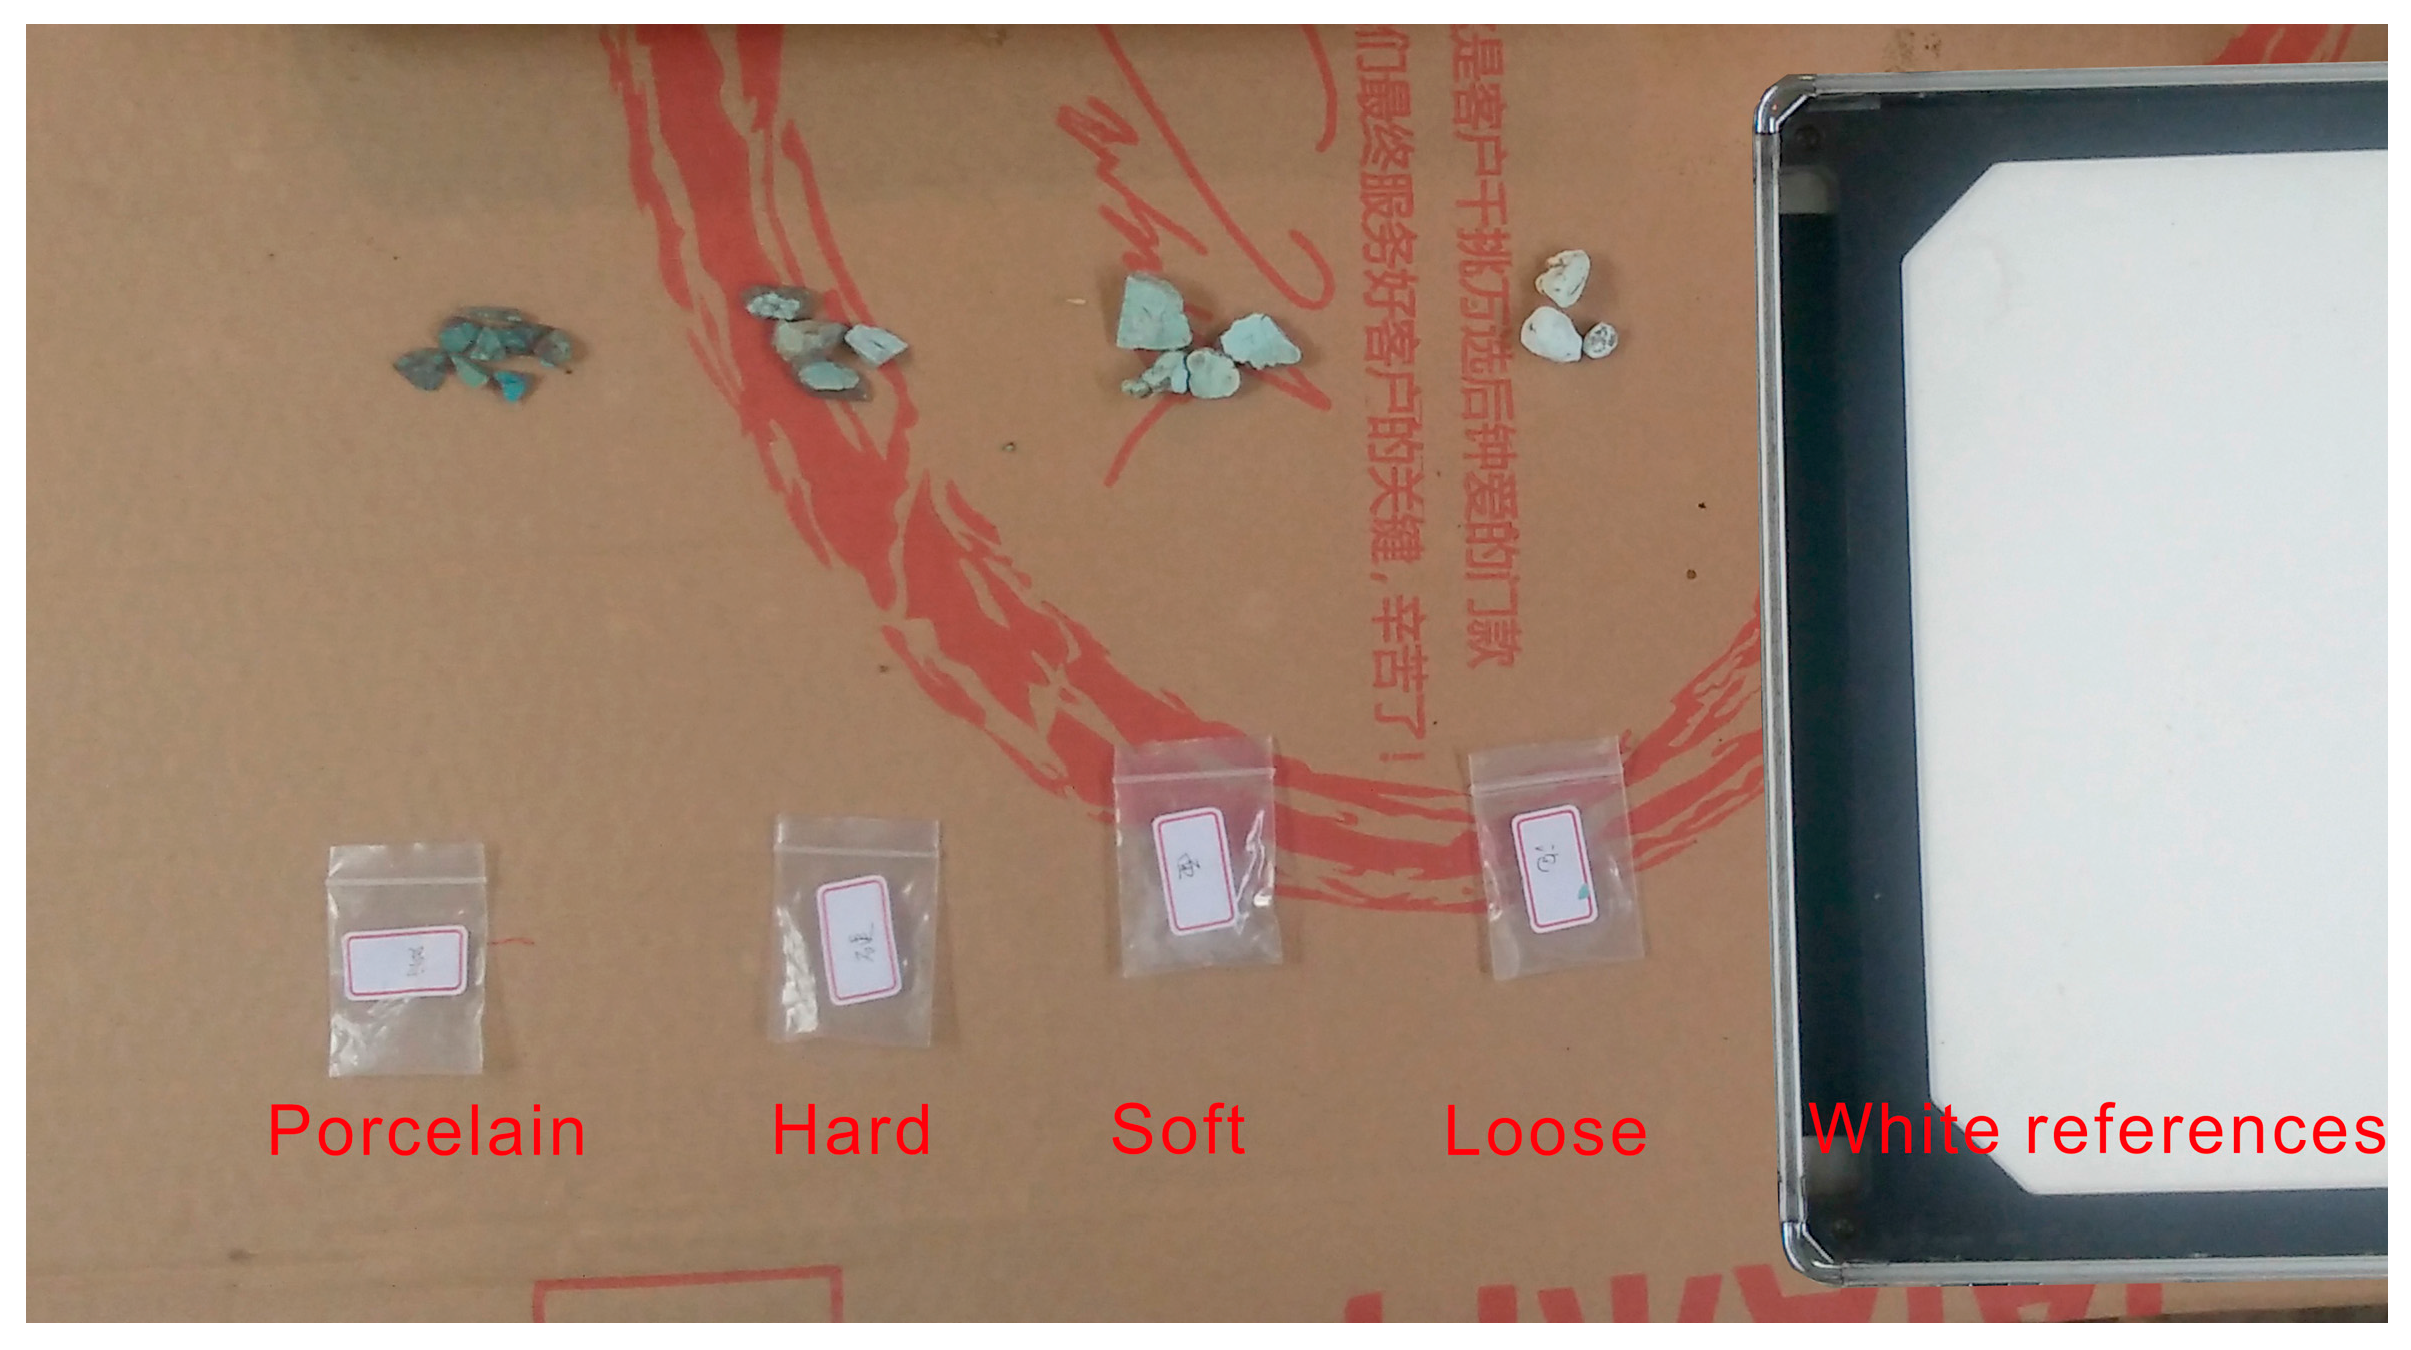
TM Ground software (NEO, Skedsmo, Norway). Before scanning, the four types of turquoise samples were placed onto a paper plate, as shown in
Figure 3. A white reference was also placed on the plate for further reflectance calibration (
Figure 3). The raw DN image containing the four samples was recorded by the HySpex
TM Ground software and converted to reflectance hyper-spectral image using an empirical method provided by the ENVI software (Exelis Inc., Tysons Corner, VA, USA).
4. Results
4.1. Spectra
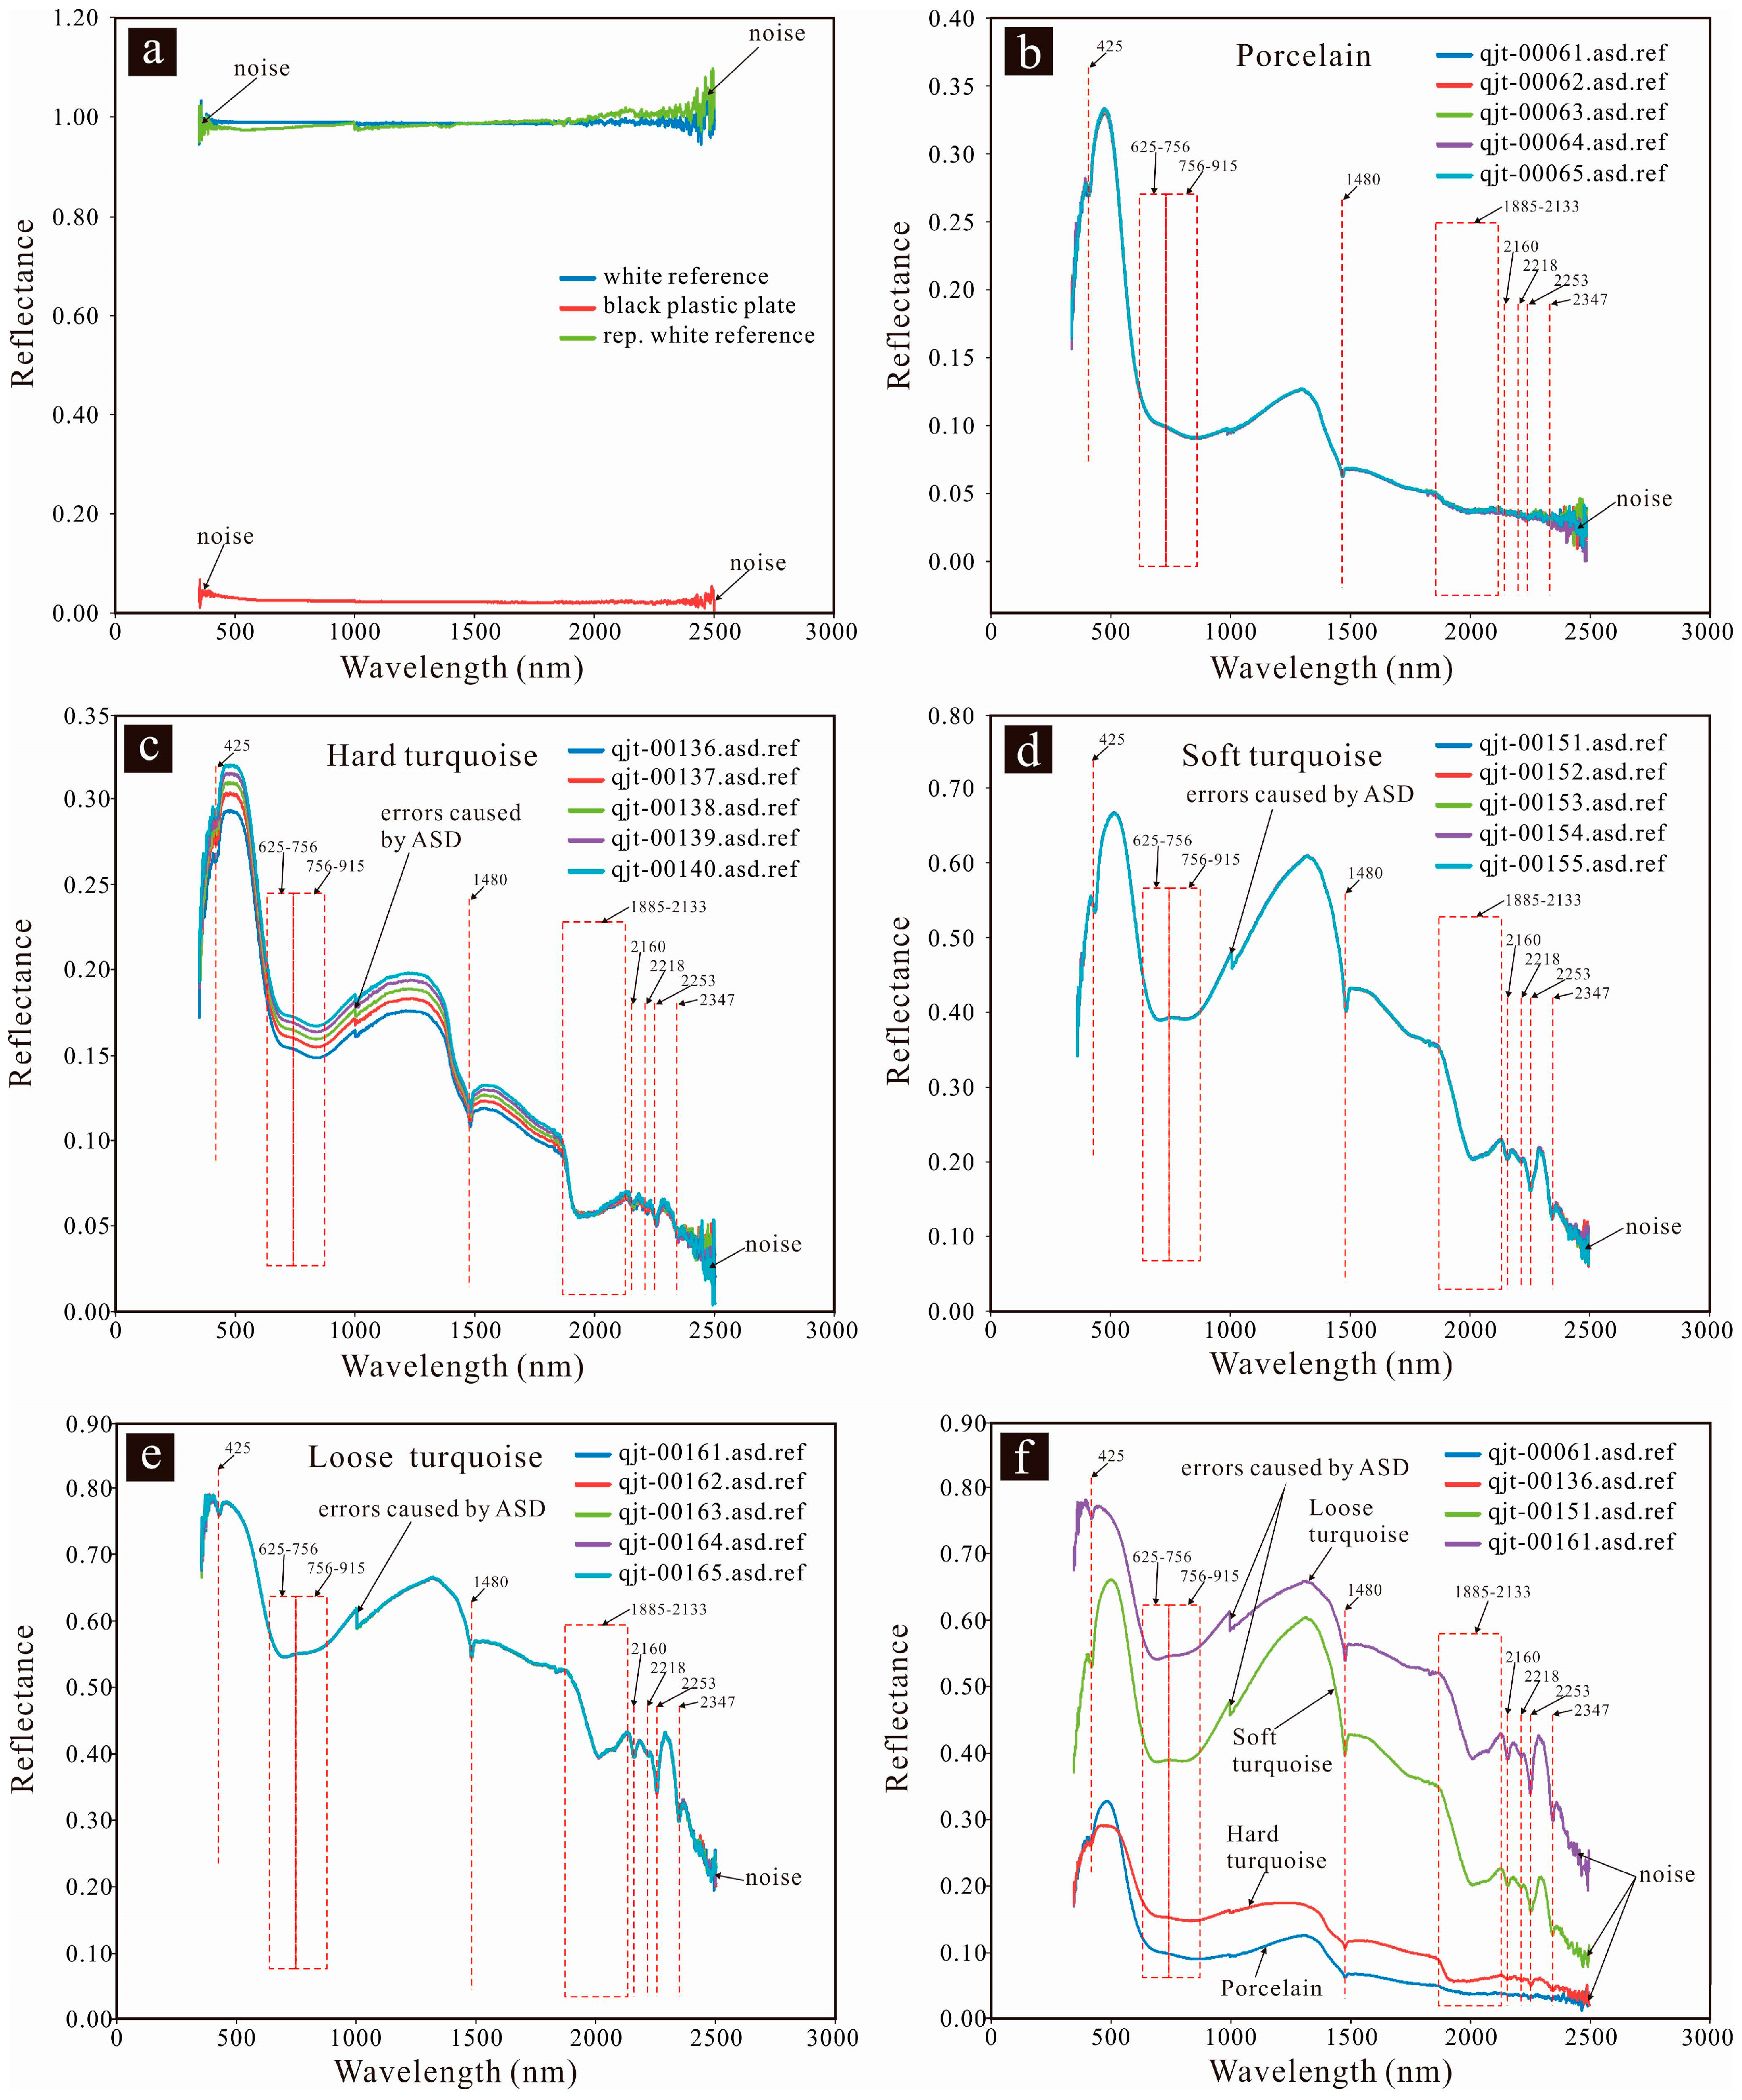
The spectral results measured by the ASD
TM spectrometer are shown in
Figure 4. As shown in
Figure 4a, the white reference has reflectance values equal to 1. The black plastic plate has low reflectance values, generally below 0.025. The reflectance spectrum of the black plastic plate is flat without any absorption feature. Such low reflectance values and the flat spectrum suggest that influence from the black plastic plate during spectral measurements of the turquoise samples can be neglected. The repeated measurement of the white reference after the experiment also showed reflectance values equal to 1, suggesting that no significant change occurred during the experiment. In
Figure 4a, it is also noted that the spectra of the white reference have large signal noise between 350 nm and 390 nm and between 2400 nm and 2500 nm. This signal noise in the above two wavelength intervals may be mistaken for absorption features, and should be treated with great caution.
Figure 4b–e display the spectra of four types of turquoise samples. Five spectra were recorded for each sample. The five spectra have the same shape, suggesting that no variation of absorption features occurred during the measurement. The abrupt negative shift of the reflectance values at 1000 nm are not absorption features, but errors caused by different sensors in the ASD
TM TerraSpec spectrometer.
A comparison of the four turquoise samples is shown in
Figure 4f. It is clear that all turquoise samples show several absorption features, including six narrow absorption peaks at 425 nm, 1480 nm, 2160 nm, 2218 nm, 2253 nm, and 2347 nm, and three wide peaks between 625–756 nm, 756–915 nm, and 1885–2133 nm. Additionally, it is noted that the strengths of reflectance and absorption increase with decreasing turquoise hardness (
Figure 4f). For example, the hardest porcelain sample generally showed the lowest reflectance values and weak absorption features, while the softest loose turquoise sample had the highest reflectance values with apparent absorption features.
4.2. Hyper-Spectral Image
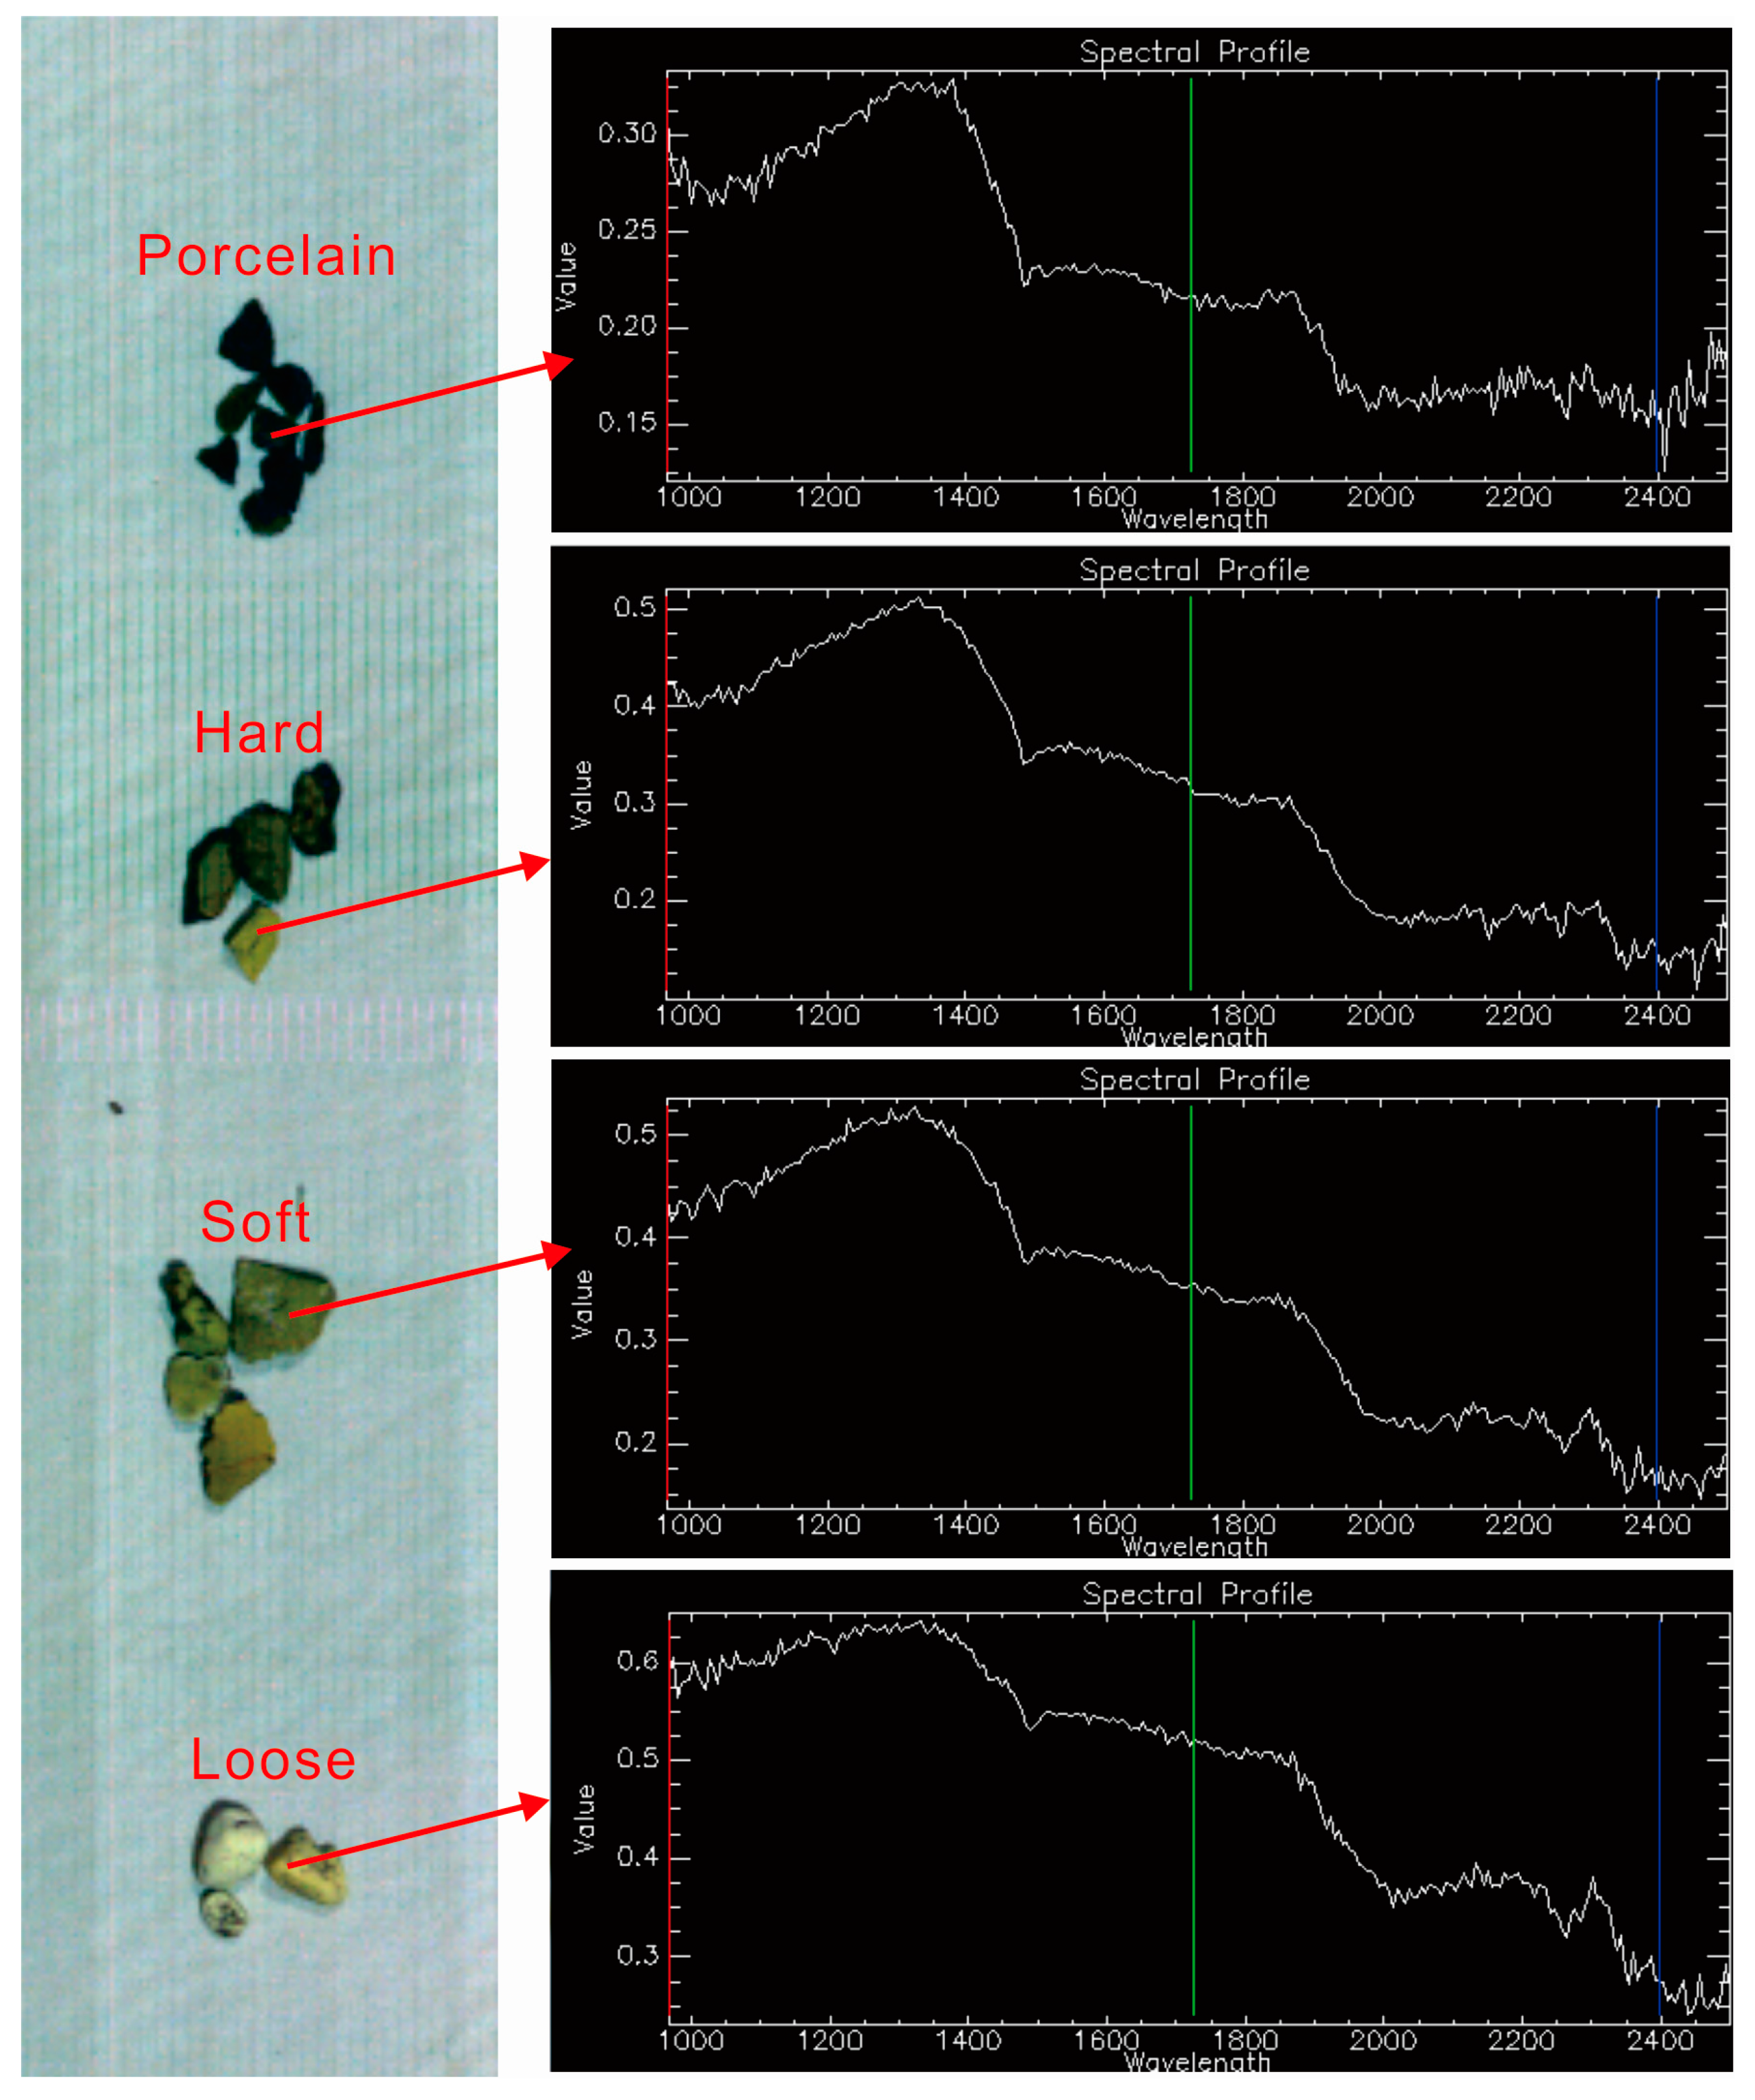
The false color composite of the short-wave infrared hyper-spectral image of four types of turquoise samples with typical spectra acquired from the hyper-spectral image are shown in
Figure 5. The spectra determined by the HySpex
TM imager are similar to those measured by the ASD
TM spectrometer (
Figure 4). Narrow absorption peaks at 1480 nm, 2253 nm, and 2347 nm, and a wide peak between 1885 and 2133 nm were observed, while peaks at 2160 nm and 2218 nm were sheltered by signal noise between 2000 nm and 2500 nm.
5. Discussion
5.1. Absorption Mechanism
Although the chemical composition of turquoise has been studied previously [
30], and a formula has been proposed for this mineral (Cu(Al,Fe
3+)
6(PO
4)
4(OH)
8·4H
2O), the relationships between radicals in the turquoise molecule and absorptions at different wavelengths are still vague.
To investigate the absorption mechanism, we determined the spectra of some chemical compounds, including NaH
2PO
4·2H
2O, Na
4P
2O
7·10H
2O, FeSO
4·7H
2O, CuSO
4·5H
2O, and NaOH, and several rock minerals, such as hematite, limonite, illite, kaolinite, muscovite, and montmorillonite. The spectra of the above chemical compounds and minerals are shown in
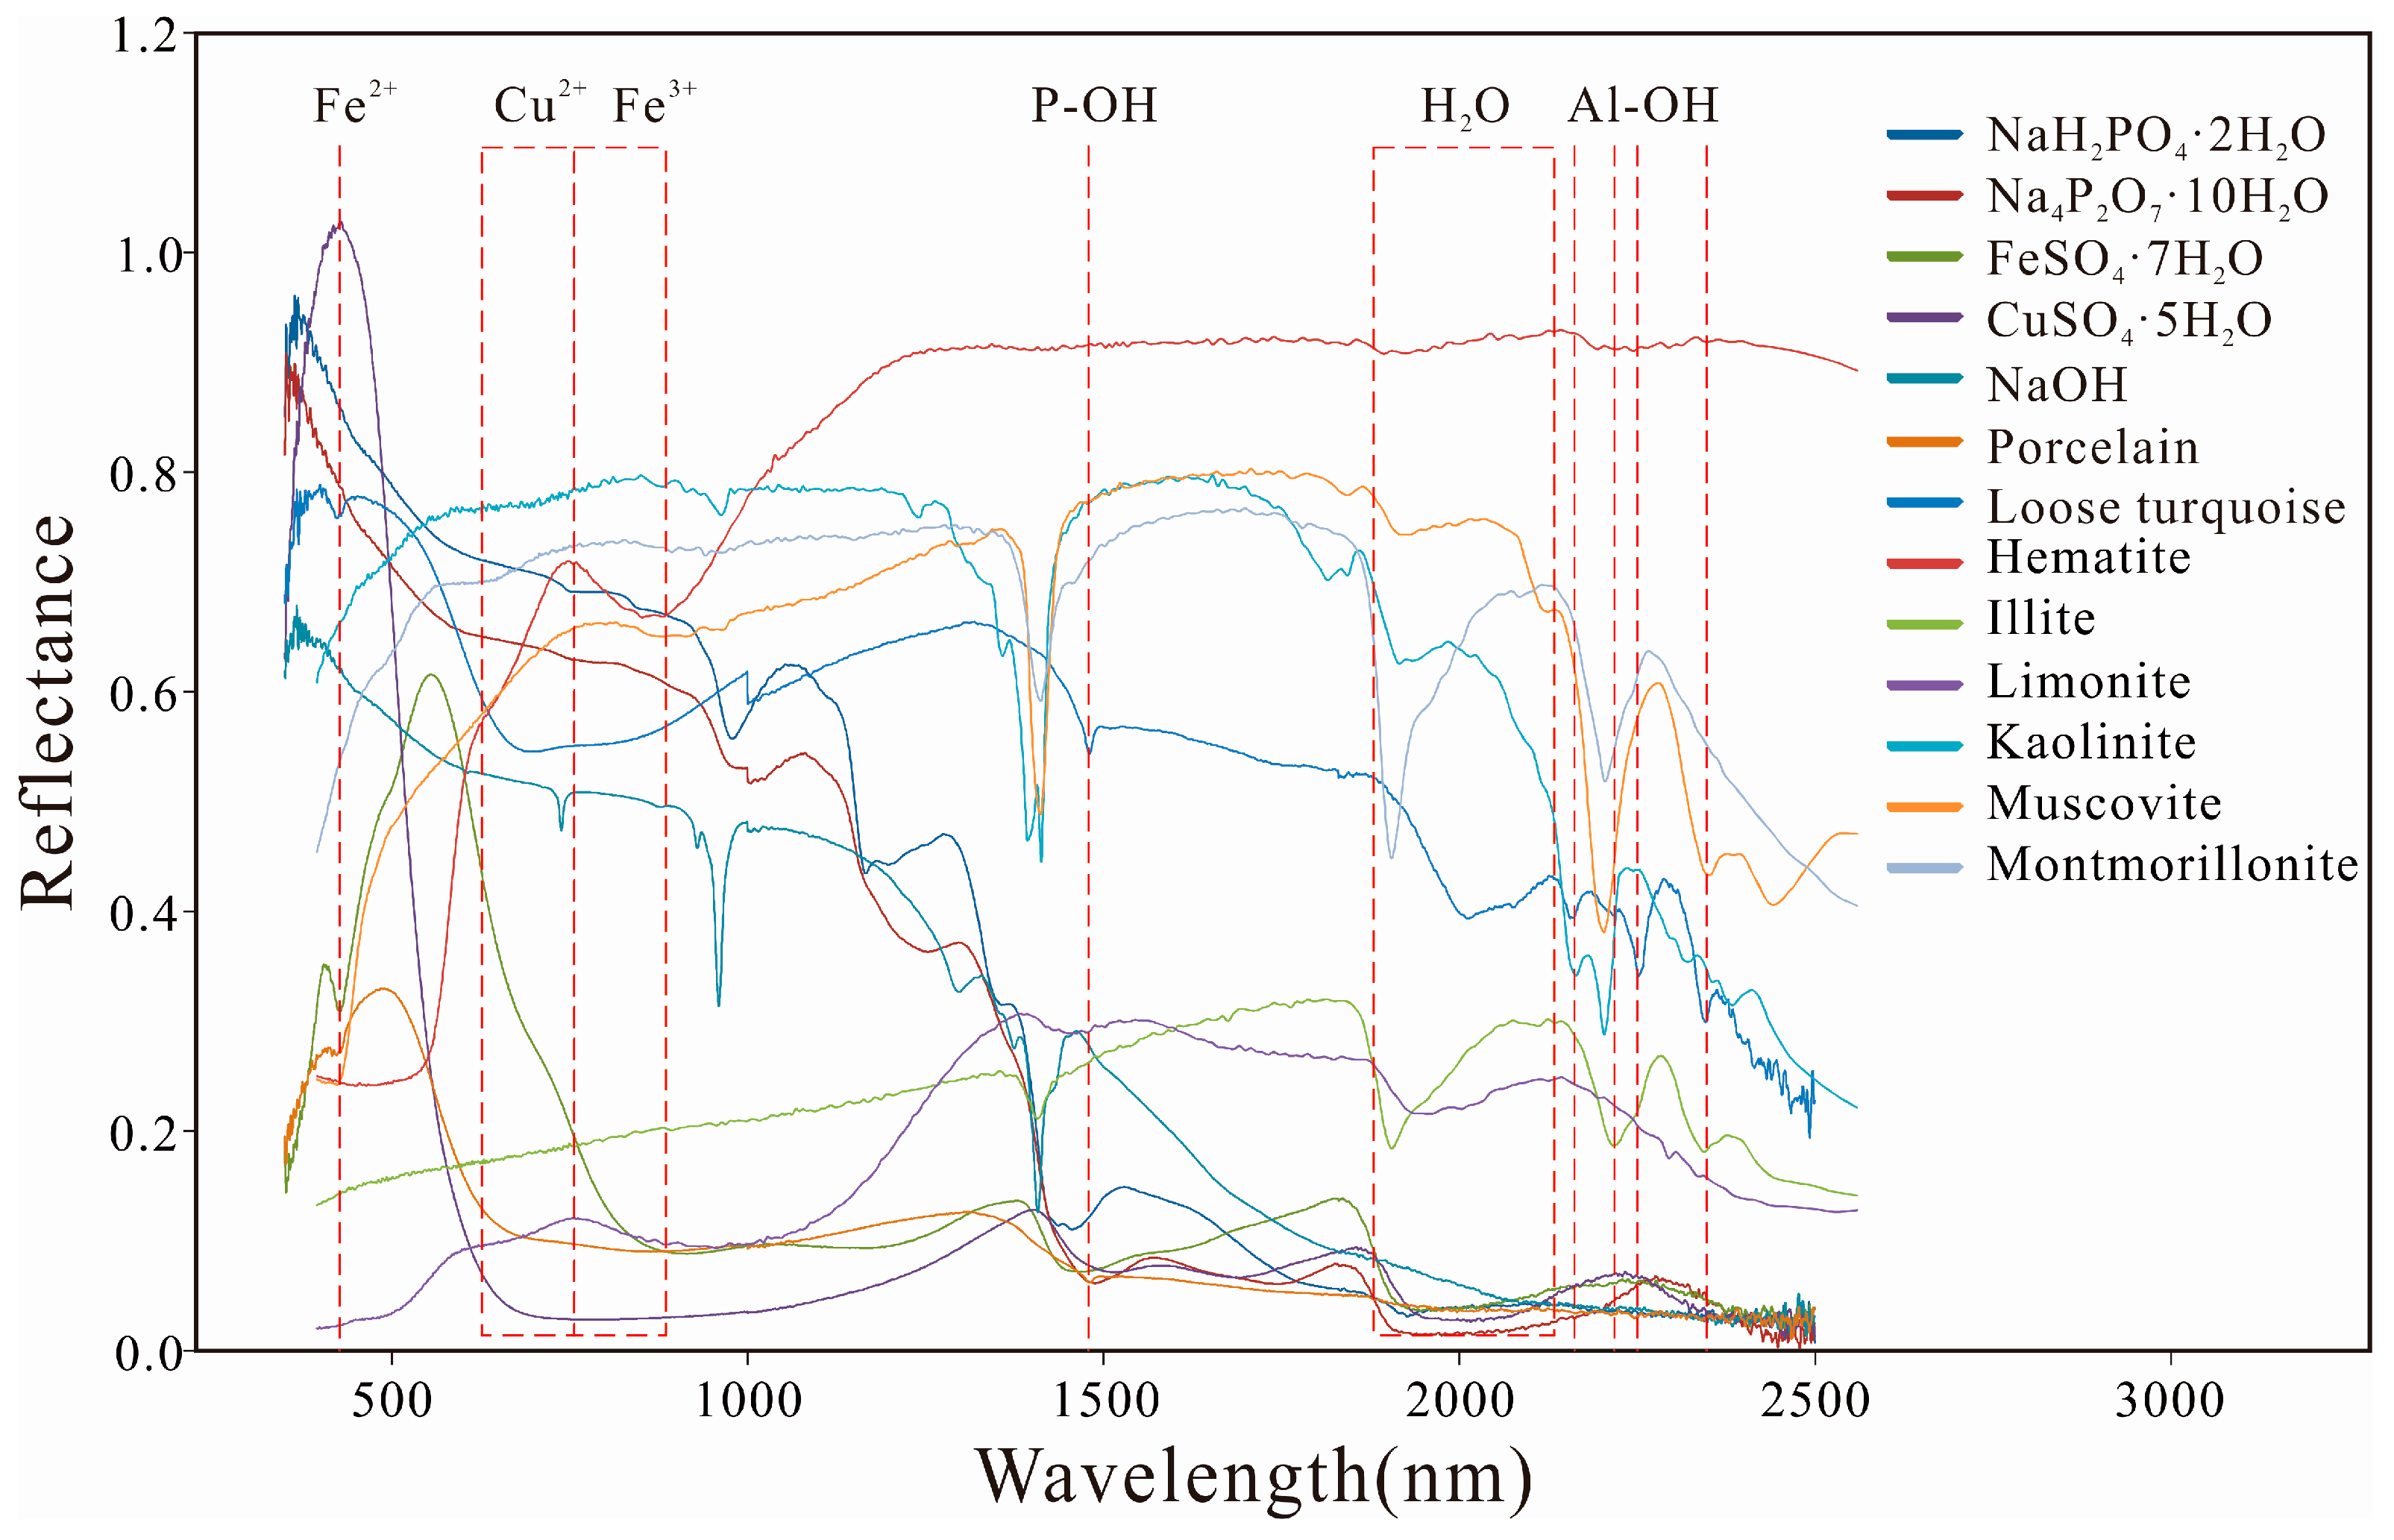
Figure 6 with the spectra of porcelain and loose turquoise.
As displayed in
Figure 6, the absorption peaks of turquoise at 2160 nm, 2218 nm, 2253 nm, and 2347 nm are also observed on the spectra of clay minerals, such as illite, limonite, kaolinite, muscovite, and montmorillonite. These absorptions are usually related to the vibration of Al-OH [
31]. The absorption peak at 425 nm can be found on the spectrum of FeSO
4·7H
2O, and is probably related to ferrous ion. The first two wide peaks between 625 nm and 756 nm and between 756 nm and 915 nm also exist on the spectra of CuSO
4·5H
2O and hematite, suggesting that they are associated with copper ion and ferric ion, respectively. The third wide peak between 1885 nm and 2133 nm occurs in the spectra of FeSO
4·7H
2O, CuSO
4·5H
2O, NaH
2PO
4·2H
2O, and limonite, indicating that this peak is related to crystal water. It is interesting that the absorption peak of turquoise at 1480 nm is identical to that of Na
4P
2O
7·10H
2O and close to the absorption at 1470 nm of NaH
2PO
4·2H
2O, which may be induced by the vibration of P-OH.
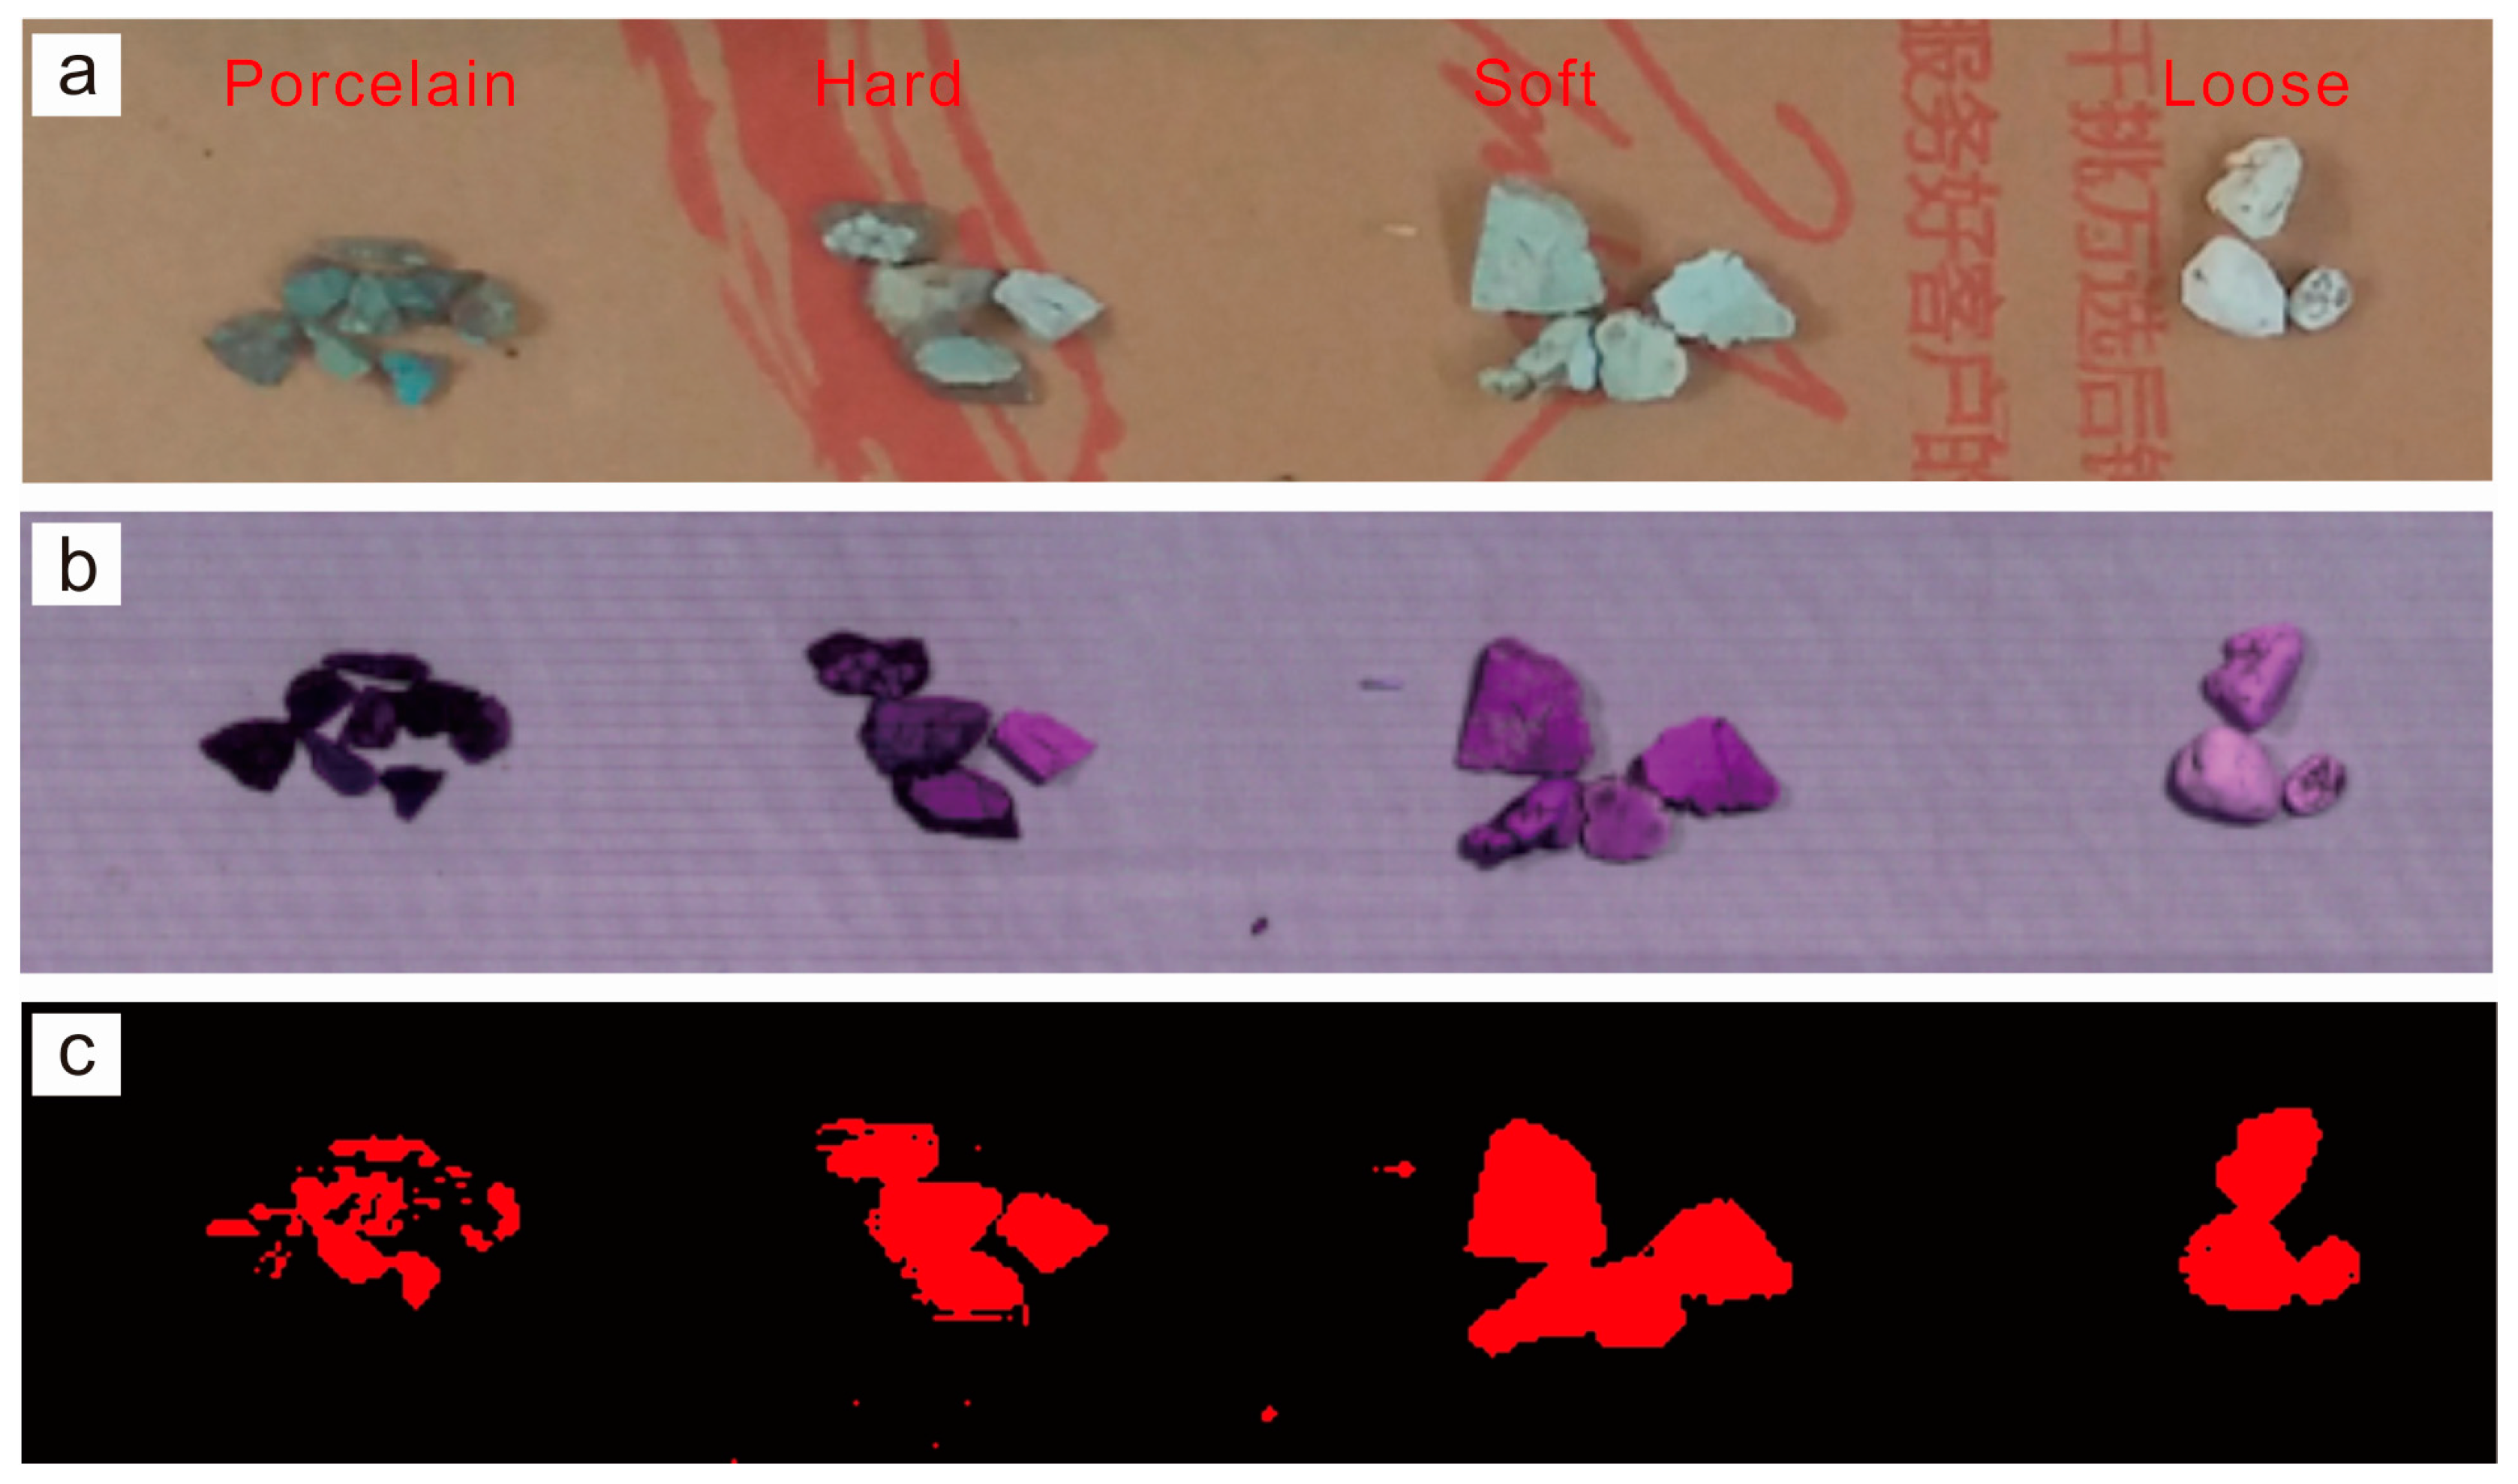
5.2. Mapping Turquoise Samples Using Hyper-Spectral Image
Several methods and algorithms to identify minerals based on imaging spectroscopy have been proposed by many previous studies. We take the Spectral Angle Mapper (SAM) method as an example of turquoise identification and mapping using hyper-spectral images. This algorithm calculates the similarity between the image and reference spectra by treating them as vectors in
n-dimensional space and calculating the corresponding angle between them (Equation (1)). With respect to Equation (1), n
b is the number of bands, t
i is the reflectance of band i of the image spectrum, and r
i is the reflectance of band i of the reference spectrum.
In this study, the computation of the spectral angle was carried out using ENVI 5.0 software. We took the hard turquoise spectrum obtained from the hyper-spectral image as the reference spectrum, and set the maximum spectral angle to 0.165 (rad) to do spectral angle mapping of all turquoise samples. As shown in
Figure 7, all turquoise samples were successfully recognized. Additionally, as a great amount of turquoise samples can be rapidly scanned (100 fps) by the imager at one time, the hyper-spectral image may serve as a convenient and fast tool for turquoise identification and selection, especially for batch determination.
6. Conclusions
The reflectance characteristics of four types of turquoise samples, including porcelain, hard, soft, and loose turquoises were investigated using an ASDTM spectrometer. Six narrow absorption peaks at 425 nm, 1480 nm, 2160 nm, 2218 nm, 2253 nm, and 2347 nm, and three wide peaks between 625–756 nm, 756–915 nm, and 1885–2133 nm were observed. The reflectance and absorption intensities of turquoise increase with decreasing hardness.
Comparison among absorption features of chemical compounds, rock minerals, and turquoise suggests that the absorption features of turquoise are probably related to Al-OH, P-OH, ferrous ion, ferric ion, copper ion, and crystal water.
Turquoise samples in the hyper-spectral image were successfully recognized using spectral angle mapper, suggesting that hyper-spectral image may be used for convenient and rapid turquoise identification and selection.
Acknowledgments
This study was financially supported by National Natural Foundation of China (Nos. 41502037 and 41601008) and the Youth Foundation of Beijing Research Institute of Uranium Geology (Nos. DD1405-A and YQJ1601). Thanks are also due to the editors for their editorial handing and anonymous reviewers for their comments and suggestions.
Author Contributions
Jun-Ting Qiu measured reflectance spectra and wrote the experiment part. Hui Qi provided the turquoise samples and wrote the sample description part. The introduction part was written by Jun-Ting Qiu and Hui Qi. The result, discussion, and conclusion parts were written by Jun-Ting Qiu, and modified by Ji-Lin Duan. The experiment procedure were recorded and photographed by Hui Qi, and monitored by Ji-Lin Duan.
Conflicts of Interest
The authors declare no conflict of interest.
References
- Cloutis, E.A. Hyperspectral geological remote sensing: Evaluation of analytical techniques. Int. J. Remote Sens. 1996, 17, 2215–2242. [Google Scholar] [CrossRef]
- Dwivedi, R.S. Soil resources mapping: A remote sensing perspective. Remote Sens. Rev. 2001, 20, 89–122. [Google Scholar] [CrossRef]
- Slonecker, E.T.; Jennings, D.B.; Garofalo, D. Remote sensing of impervious surfaces: A review. Remote Sens. Rev. 2001, 20, 227–255. [Google Scholar] [CrossRef]
- Maathuis, B.H.P.; van Genderen, J.L. A review of satellite and airborne sensors for remote sensing based detection of minefields and landmines. Int. J. Remote Sens. 2004, 25, 5201–5245. [Google Scholar] [CrossRef]
- Congalton, R.G. Remote Sensing: An Overview. GISci. Remote Sens. 2010, 47, 443–459. [Google Scholar] [CrossRef]
- Ghiyamat, A.; Shafri, H.Z.M. A review on hyperspectral remote sensing for homogeneous and heterogeneous forest biodiversity assessment. Int. J. Remote Sens. 2010, 31, 1837–1856. [Google Scholar] [CrossRef] [Green Version]
- Dietz, A.J.; Kuenzer, C.; Gessner, U.; Dech, S. Remote sensing of snow—A review of available methods. Int. J. Remote Sens. 2012, 33, 4094–4134. [Google Scholar] [CrossRef]
- Chabrillat, S.; Pinet, P.C.; Ceuleneer, G.; Johnson, P.E.; Mustard, J.F. Ronda peridotite massif: Methodology for its geological mapping and lithological discrimination from airborne hyperspectral data. Int. J. Remote Sens. 2000, 21, 2363–2388. [Google Scholar] [CrossRef]
- Chen, Q.; Yin, Z.; Qi, L.; Xiong, Y. Turquoise from Zhushan county, Hubei province, China. Gems Gemol. 2012, 48, 198–204. [Google Scholar] [CrossRef]
- Harris, J.R.; McGregor, R.; Budkewitsch, P. Geological analysis of hyperspectral data over southwest Baffin Island: Methods for producing spectral maps that relate to variations in surface lithologies. Can. J. Remote Sens. 2010, 36, 412–435. [Google Scholar] [CrossRef]
- Slavinski, H.; Morris, B.; Ugalde, H.; Spicer, B.; Skulski, T.; Rogers, N. Integration of lithological, geophysical, and remote sensing information: A basis for remote predictive geological mapping of the Baie Verte Peninsula, Newfoundland. Can. J. Remote Sens. 2010, 36, 99–118. [Google Scholar] [CrossRef]
- Babu, P.S.; Majumdar, T.J.; Bhattacharya, A.K. Study of spectral signatures for exploration of Bauxite ore deposits in Panchpatmali, India. Geocarto Int. 2015, 30, 545–559. [Google Scholar] [CrossRef]
- Boesche, N.K.; Rogass, C.; Lubitz, C.; Brell, M.; Herrmann, S.; Mielke, C.; Tonn, S.; Appelt, O.; Altenberger, U.; Kaufmann, H. Hyperspectral REE (Rare Earth Element) Mapping of Outcrops—Applications for Neodymium Detection. Remote Sens. 2015, 7, 5160–5186. [Google Scholar] [CrossRef]
- Qiu, J.-T.; Zhang, C.; Hu, X. Integration of Concentration-Area Fractal Modeling and Spectral Angle Mapper for Ferric Iron Alteration Mapping and Uranium Exploration in the Xiemisitan Area, NW China. Remote Sens. 2015, 7, 13878–13894. [Google Scholar] [CrossRef]
- Zhang, B.; Wu, D.; Zhang, L.; Jiao, Q.; Li, Q. Application of hyperspectral remote sensing for environment monitoring in mining areas. Environ. Earth Sci. 2012, 65, 649–658. [Google Scholar] [CrossRef]
- Lugassi, R.; Chudnovsky, A.; Zaady, E.; Dvash, L.; Goldshleger, N. Estimating Pasture Quality of Fresh Vegetation Based on Spectral Slope of Mixed Data of Dry and Fresh Vegetation—Method Development. Remote Sens. 2015, 7, 8045–8066. [Google Scholar] [CrossRef]
- Pas, I.; Rodrigues, A.; Gonalves, S.; Costa, P.M.; Gonalves, I.; Pereira, L.S.; Cunha, M. Predicting Grapevine Water Status Based on Hyperspectral Reflectance Vegetation Indices. Remote Sens. 2015, 7, 16460–16479. [Google Scholar]
- Qiu, J.-T.; Li, P.-J.; Yu, Z.-F.; Li, P. Petrology and Spectroscopy Studies on Danxia Geoheritage in Southeast Sichuan Area, China: Implications for Danxia Surveying and Monitoring. Geoheritage 2015, 7, 307–318. [Google Scholar] [CrossRef]
- Dale, L.M.; Thewis, A.; Boudry, C.; Rotar, I.; Dardenne, P.; Baeten, V.; Pierna, J.A.F. Hyperspectral Imaging Applications in Agriculture and Agro-Food Product Quality and Safety Control: A Review. Appl. Spectrosc. Rev. 2013, 48, 142–159. [Google Scholar] [CrossRef]
- Kandpal, L.M.; Lee, H.; Kim, M.S.; Mo, C.; Cho, B.-K. Hyperspectral Reflectance Imaging Technique for Visualization of Moisture Distribution in Cooked Chicken Breast. Sensors 2013, 13, 13289–13300. [Google Scholar] [CrossRef] [PubMed]
- Attasa, M.; Cloutis, E.; Collins, C.; Goltz, D.; Majzels, C.; Mansfield, J.R.; Mantsch, H.H. Near-infrared spectroscopic imaging in art conservation: Investigation of drawing constituents. J. Cult. Herit. 2003, 4, 127–136. [Google Scholar] [CrossRef]
- Cavalli, R.M.; Colosi, F.; Palombo, A.; Pignatti, S.; Poscolieri, M. Remote hyperspectral imagery as a support to archaeological prospection. J. Cult. Herit. 2007, 8, 272–283. [Google Scholar] [CrossRef]
- Goltz, D.; Attas, M.; Young, G.; Cloutis, E.; Bedynski, M. Assessing stains on historical documents using hyperspectral imaging. J. Cult. Herit. 2010, 11, 19–26. [Google Scholar] [CrossRef]
- Wang, F. A Gemological Study of Turquoise in China. Gems Gemol. 1986, 22, 35–37. [Google Scholar]
- Fritsch, E.; McClure, S.F.; Ostrooumov, M.; Andres, Y.; Moses, T.; Koivula, J.I.; Kammerling, R.C. The Identification of Zachery-Treated Turquoise. Gems Gemol. 1999, 35, 4–16. [Google Scholar] [CrossRef]
- Choudhary, G. A New Type of Composite Turquoise. Gems Gemol. 2010, 46, 106–113. [Google Scholar] [CrossRef]
- Choudhary, G.; Gem Testing Laboratory. Turquoise-Rock Crystal Composite. Gems Gemol. 2013, 49, 2. [Google Scholar]
- Han, W.; Lu, T.; Dai, H.; Su, J.; Dai, H. Impregnated and Dyed Turquoise. Gems Gemol. 2015, 51, 3. [Google Scholar]
- HySpex Cameras. Available online: http://www.hyspex.no/products/disc/swir-320m-e.php (accessed on 26 December 2016).
- Chen, X.; Warner, T.A.; Campagna, D.J. Integrating visible, near-infrared and short-wave infrared hyperspectral and multispectral thermal imagery for geological mapping at Cuprite, Nevada: A rule-based system. Int. J. Remote Sens. 2010, 31, 1733–1752. [Google Scholar] [CrossRef]
- Clark, R.N.; Swayze, G.A.; Wise, R.; Livo, K.E.; Hoefen, T.M.; Kokaly, R.F.; Sutley, S.J. USGS Digital Spectral Library Splib05a; USGS Open File Report 03-395; U.S. Geological Survey: Reston, VA, USA, 2003.
© 2016 by the authors; licensee MDPI, Basel, Switzerland. This article is an open access article distributed under the terms and conditions of the Creative Commons Attribution (CC-BY) license (http://creativecommons.org/licenses/by/4.0/).


