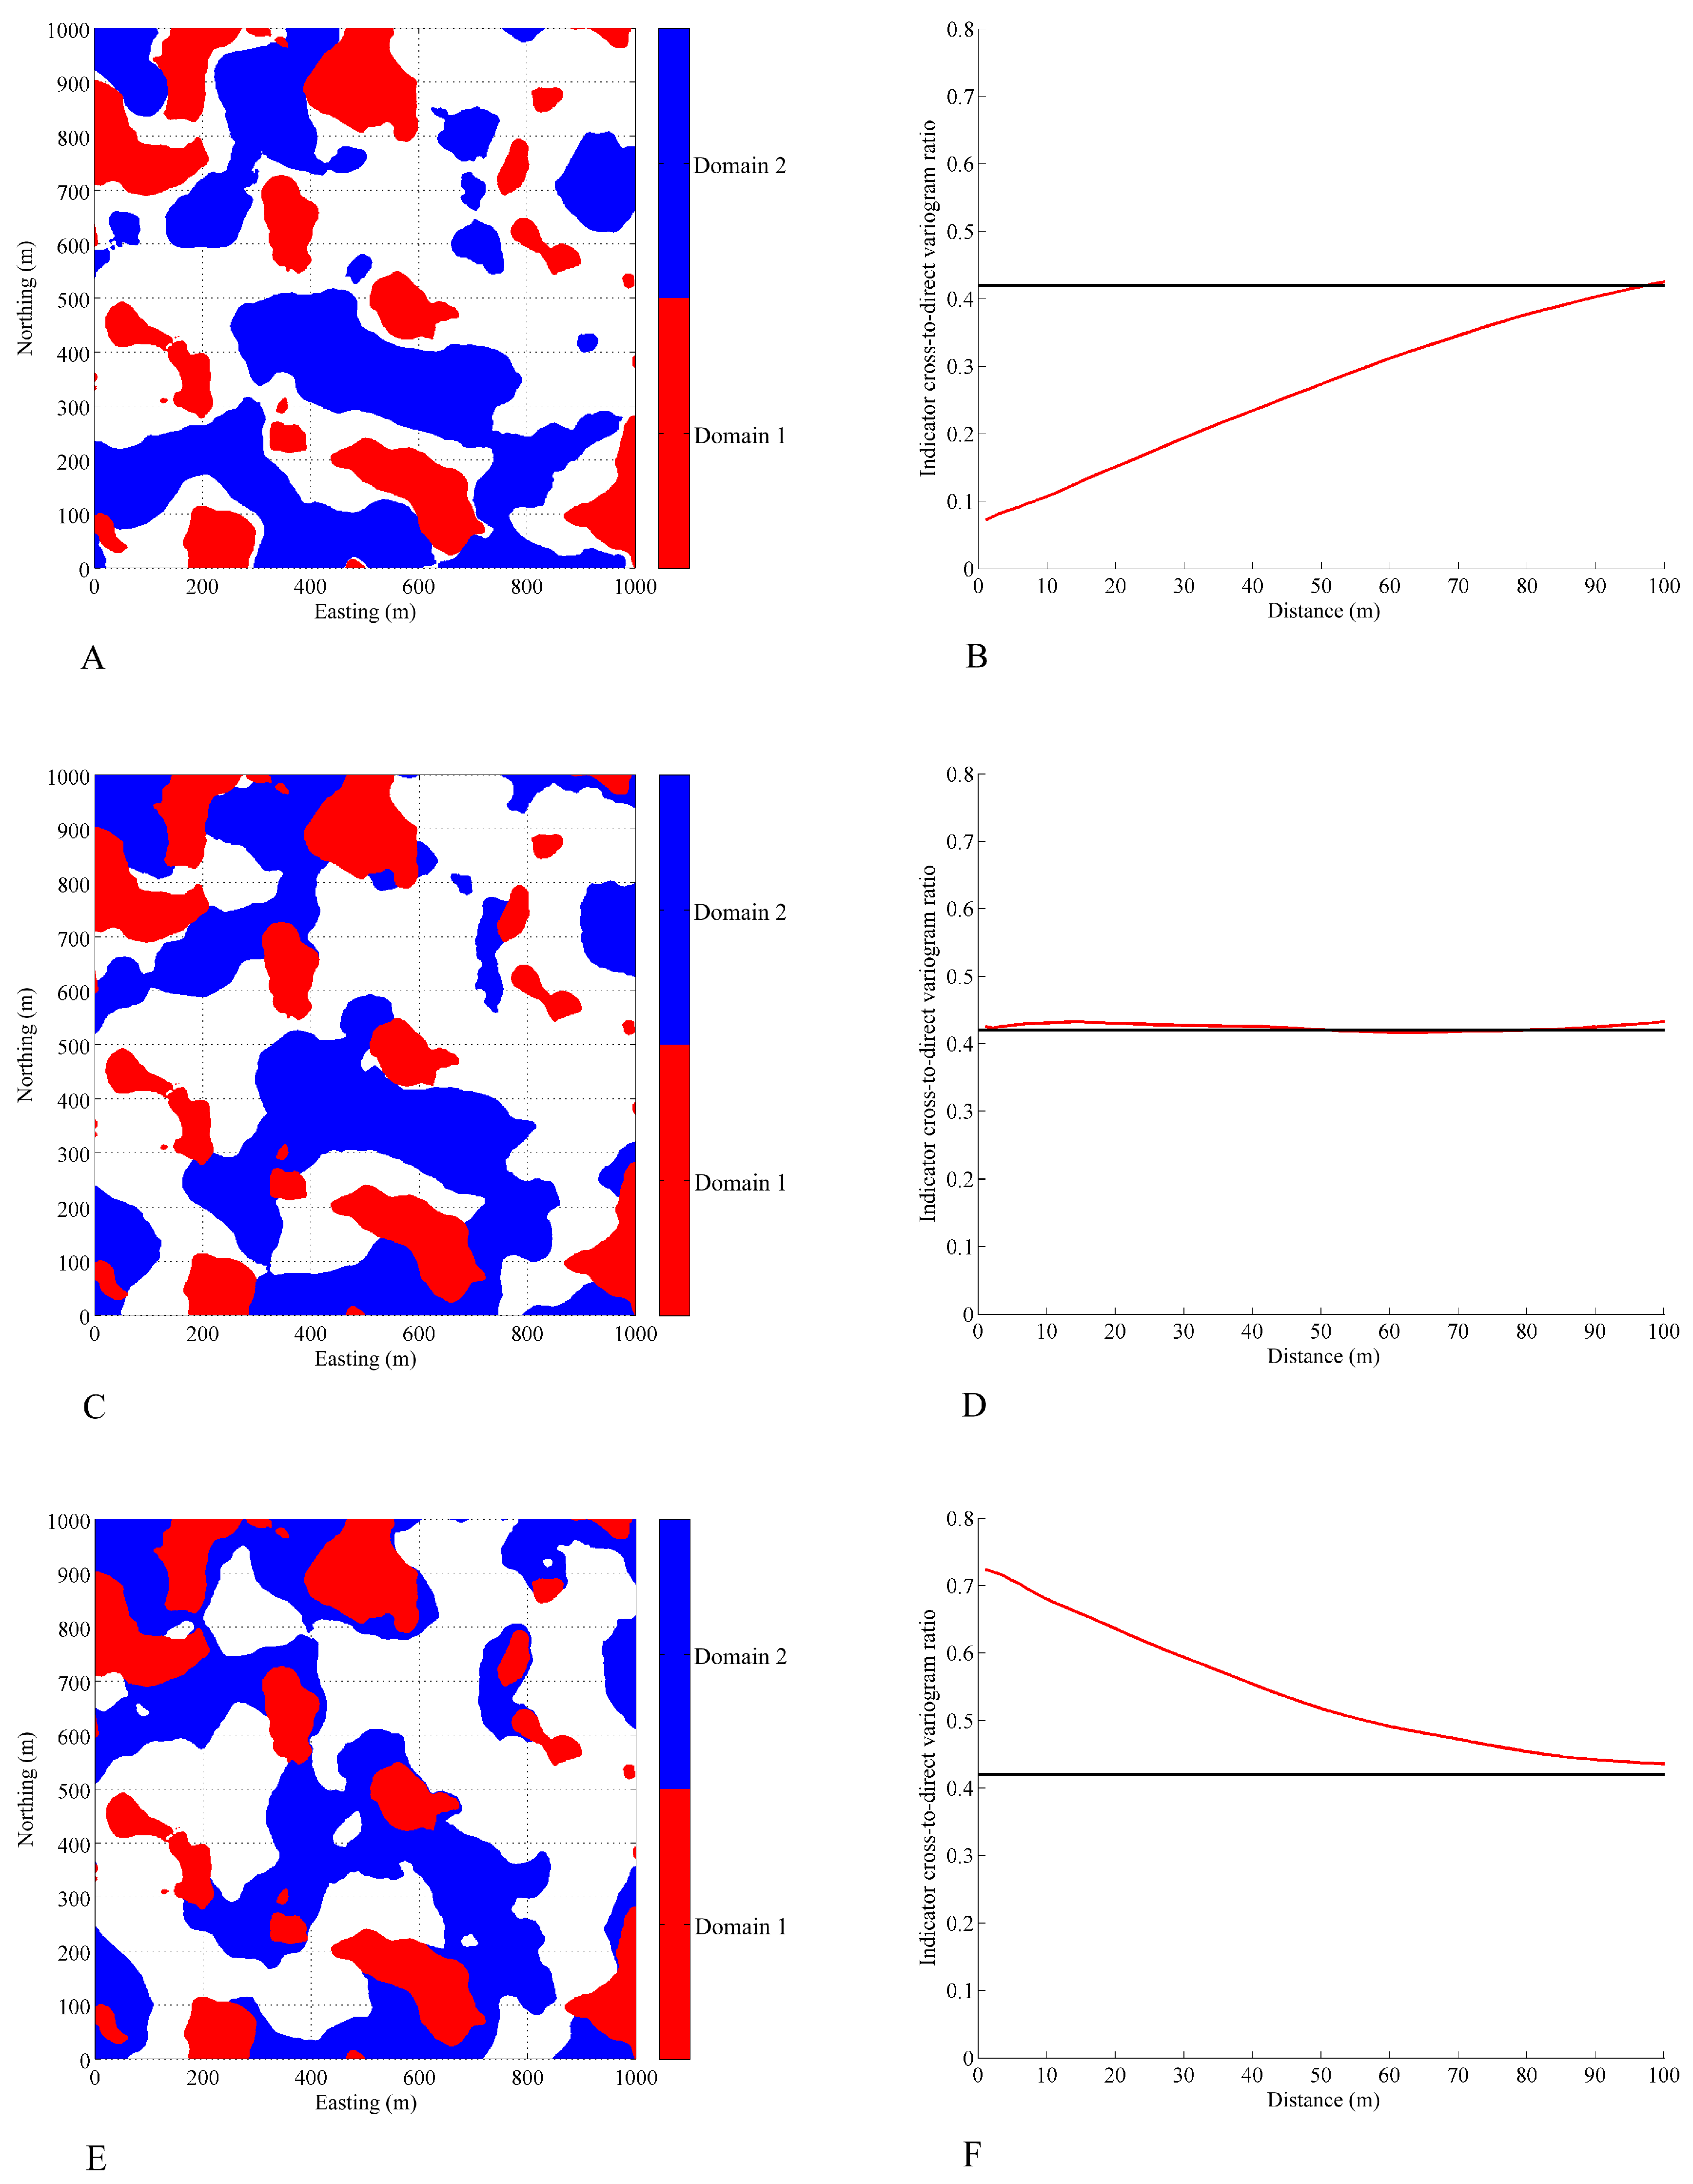
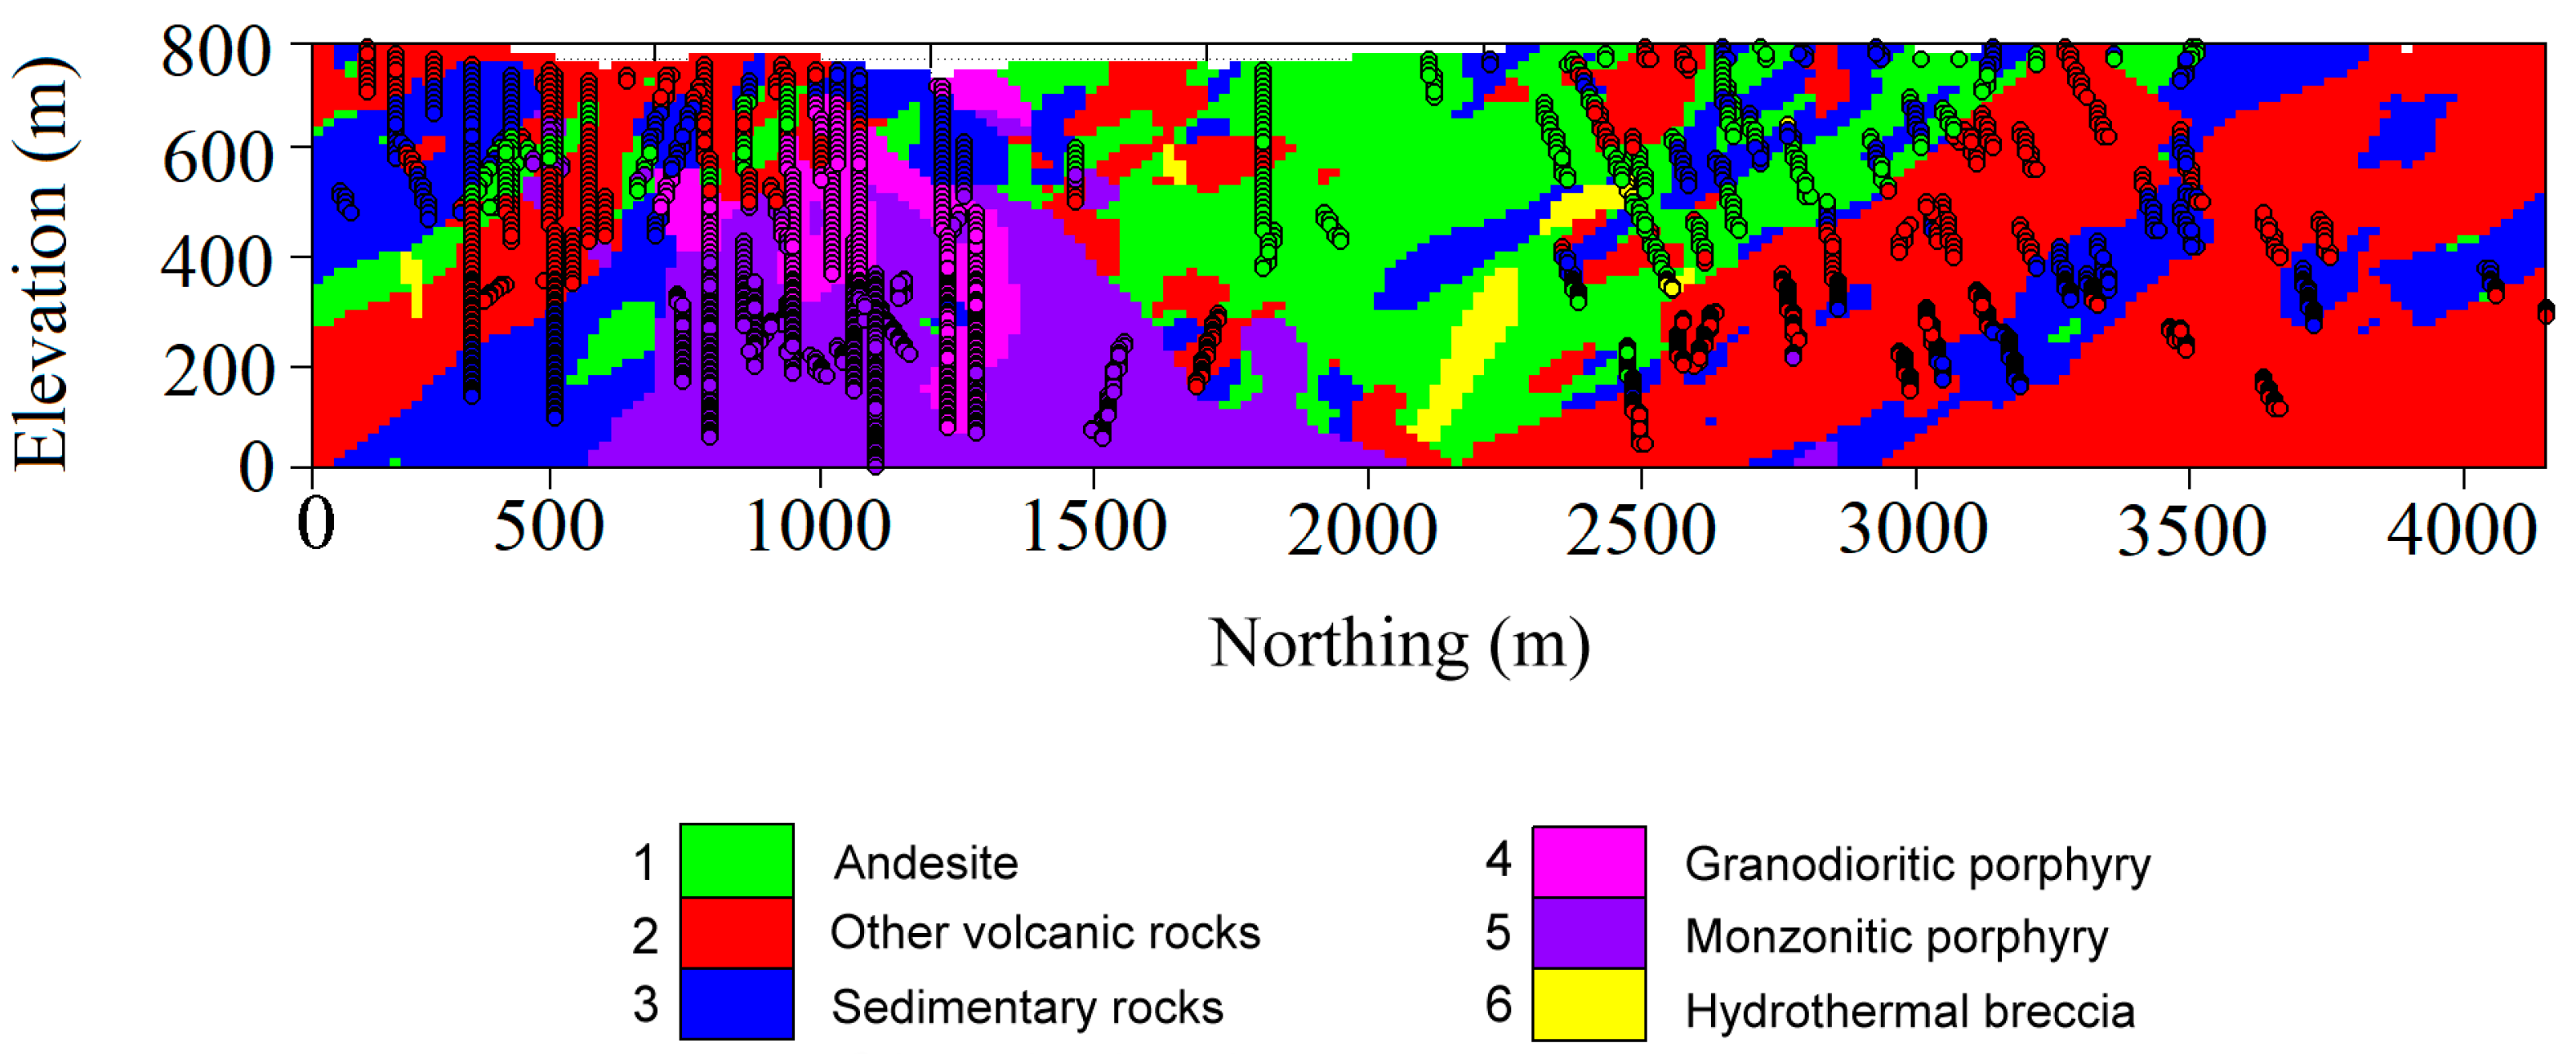
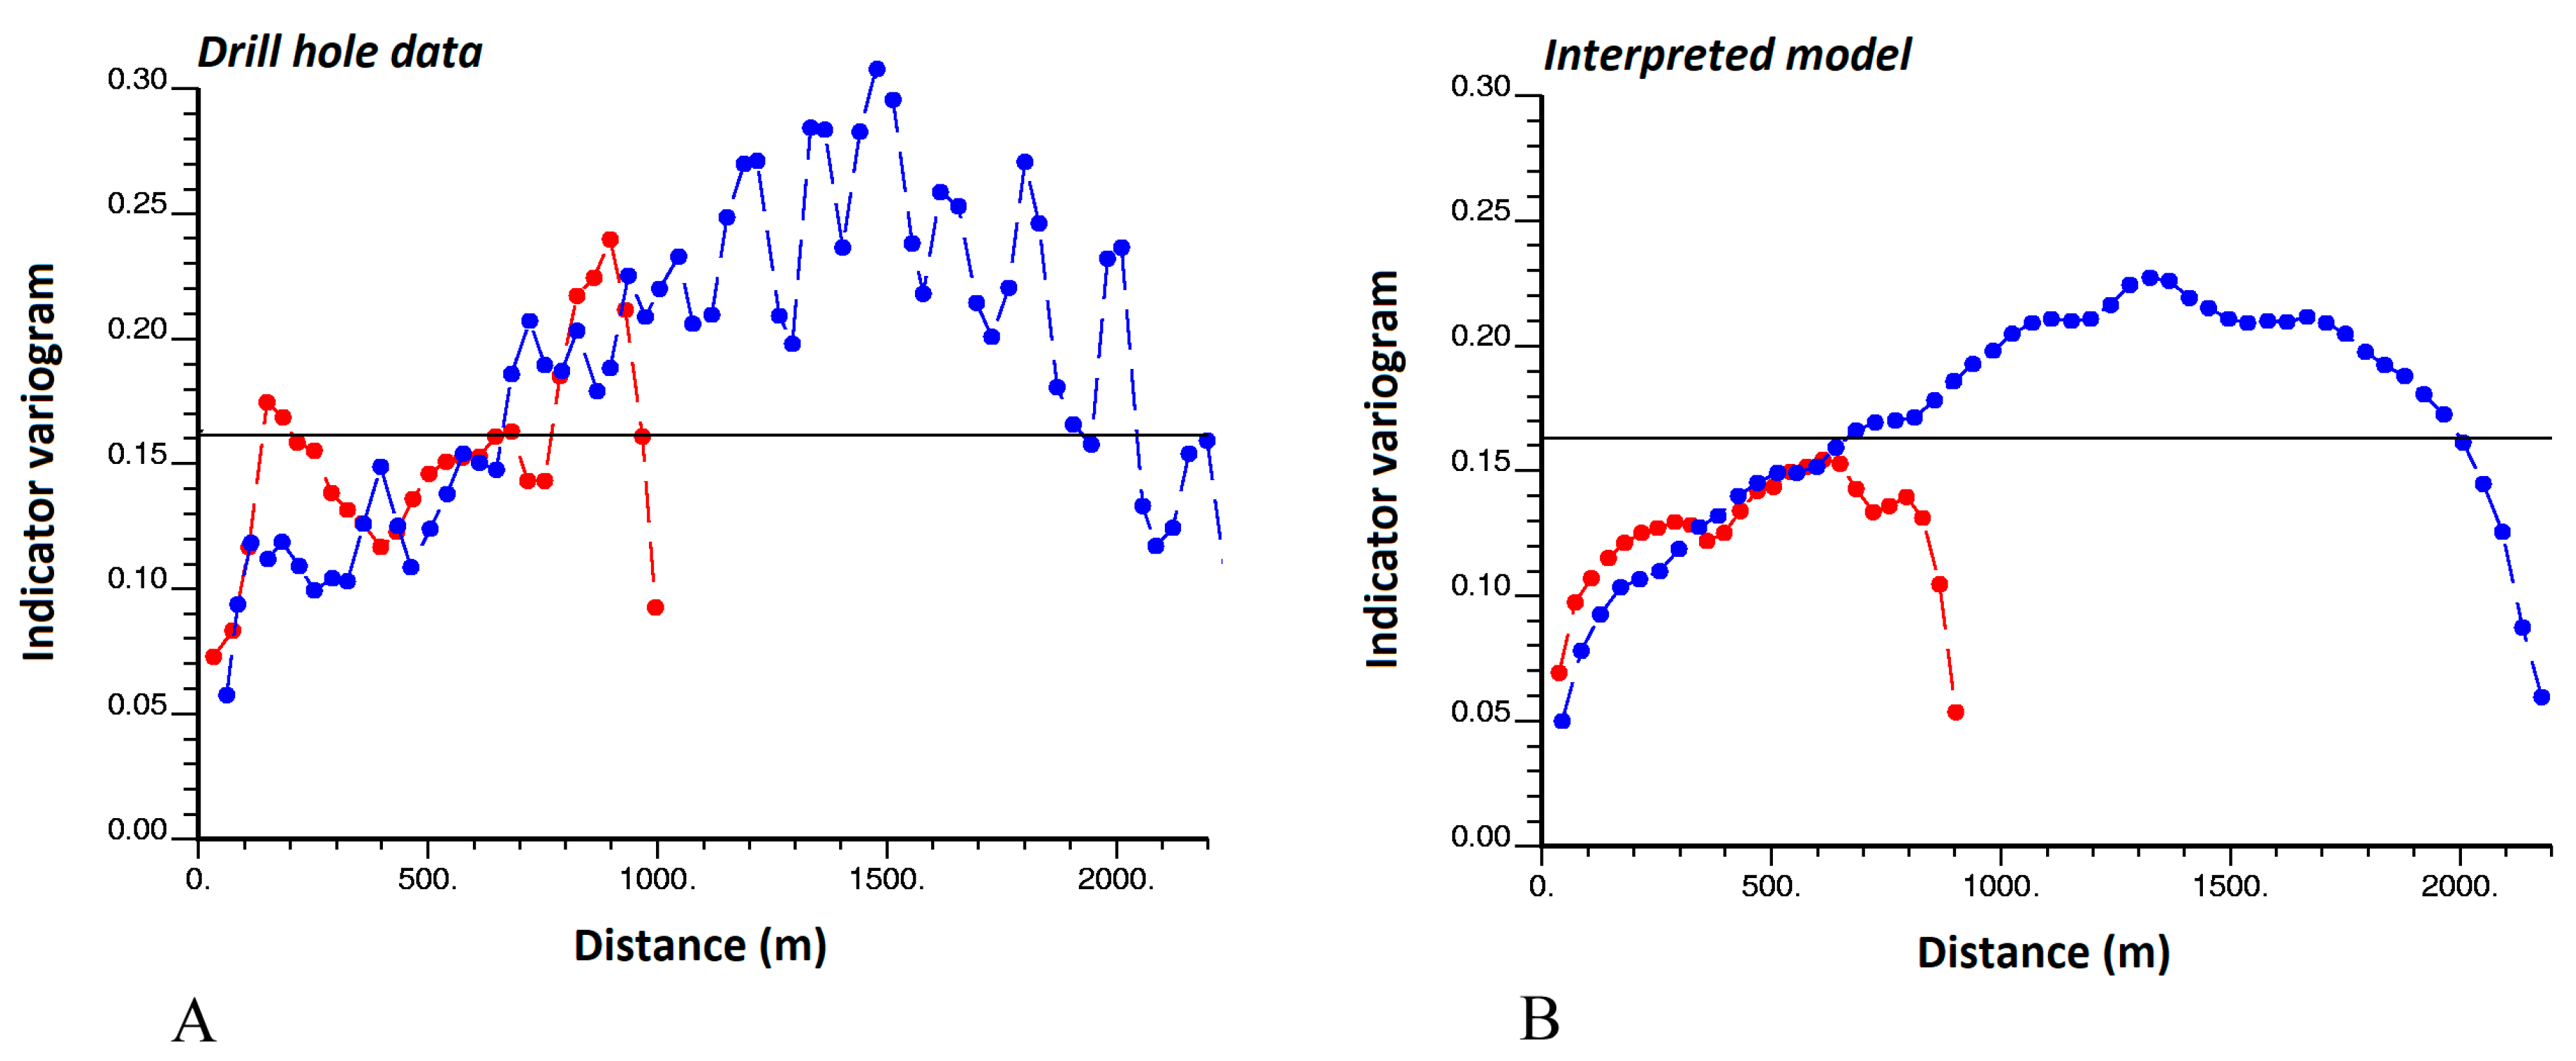
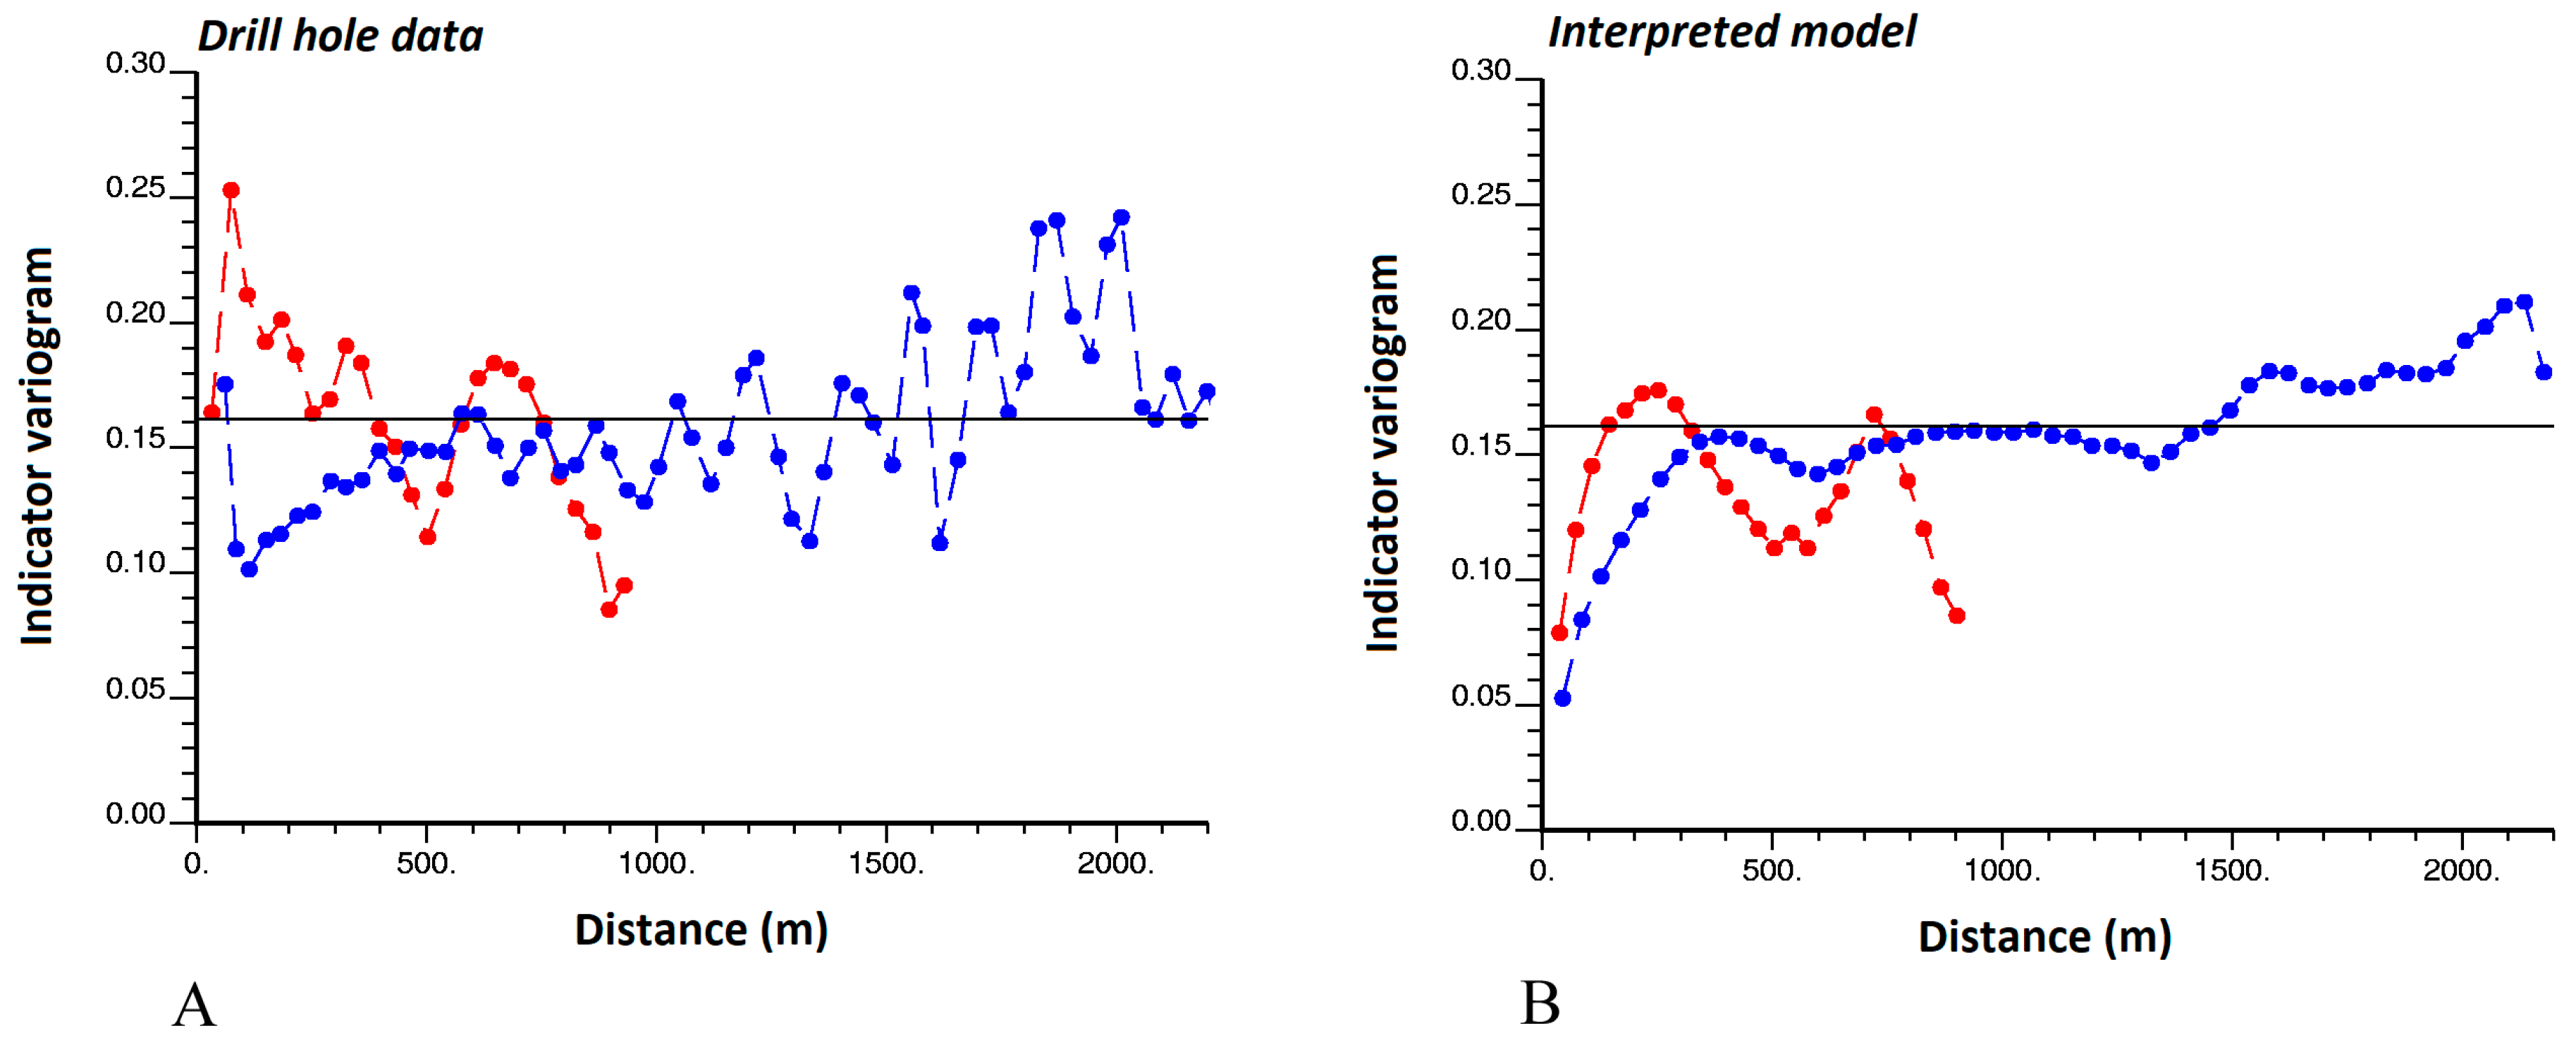
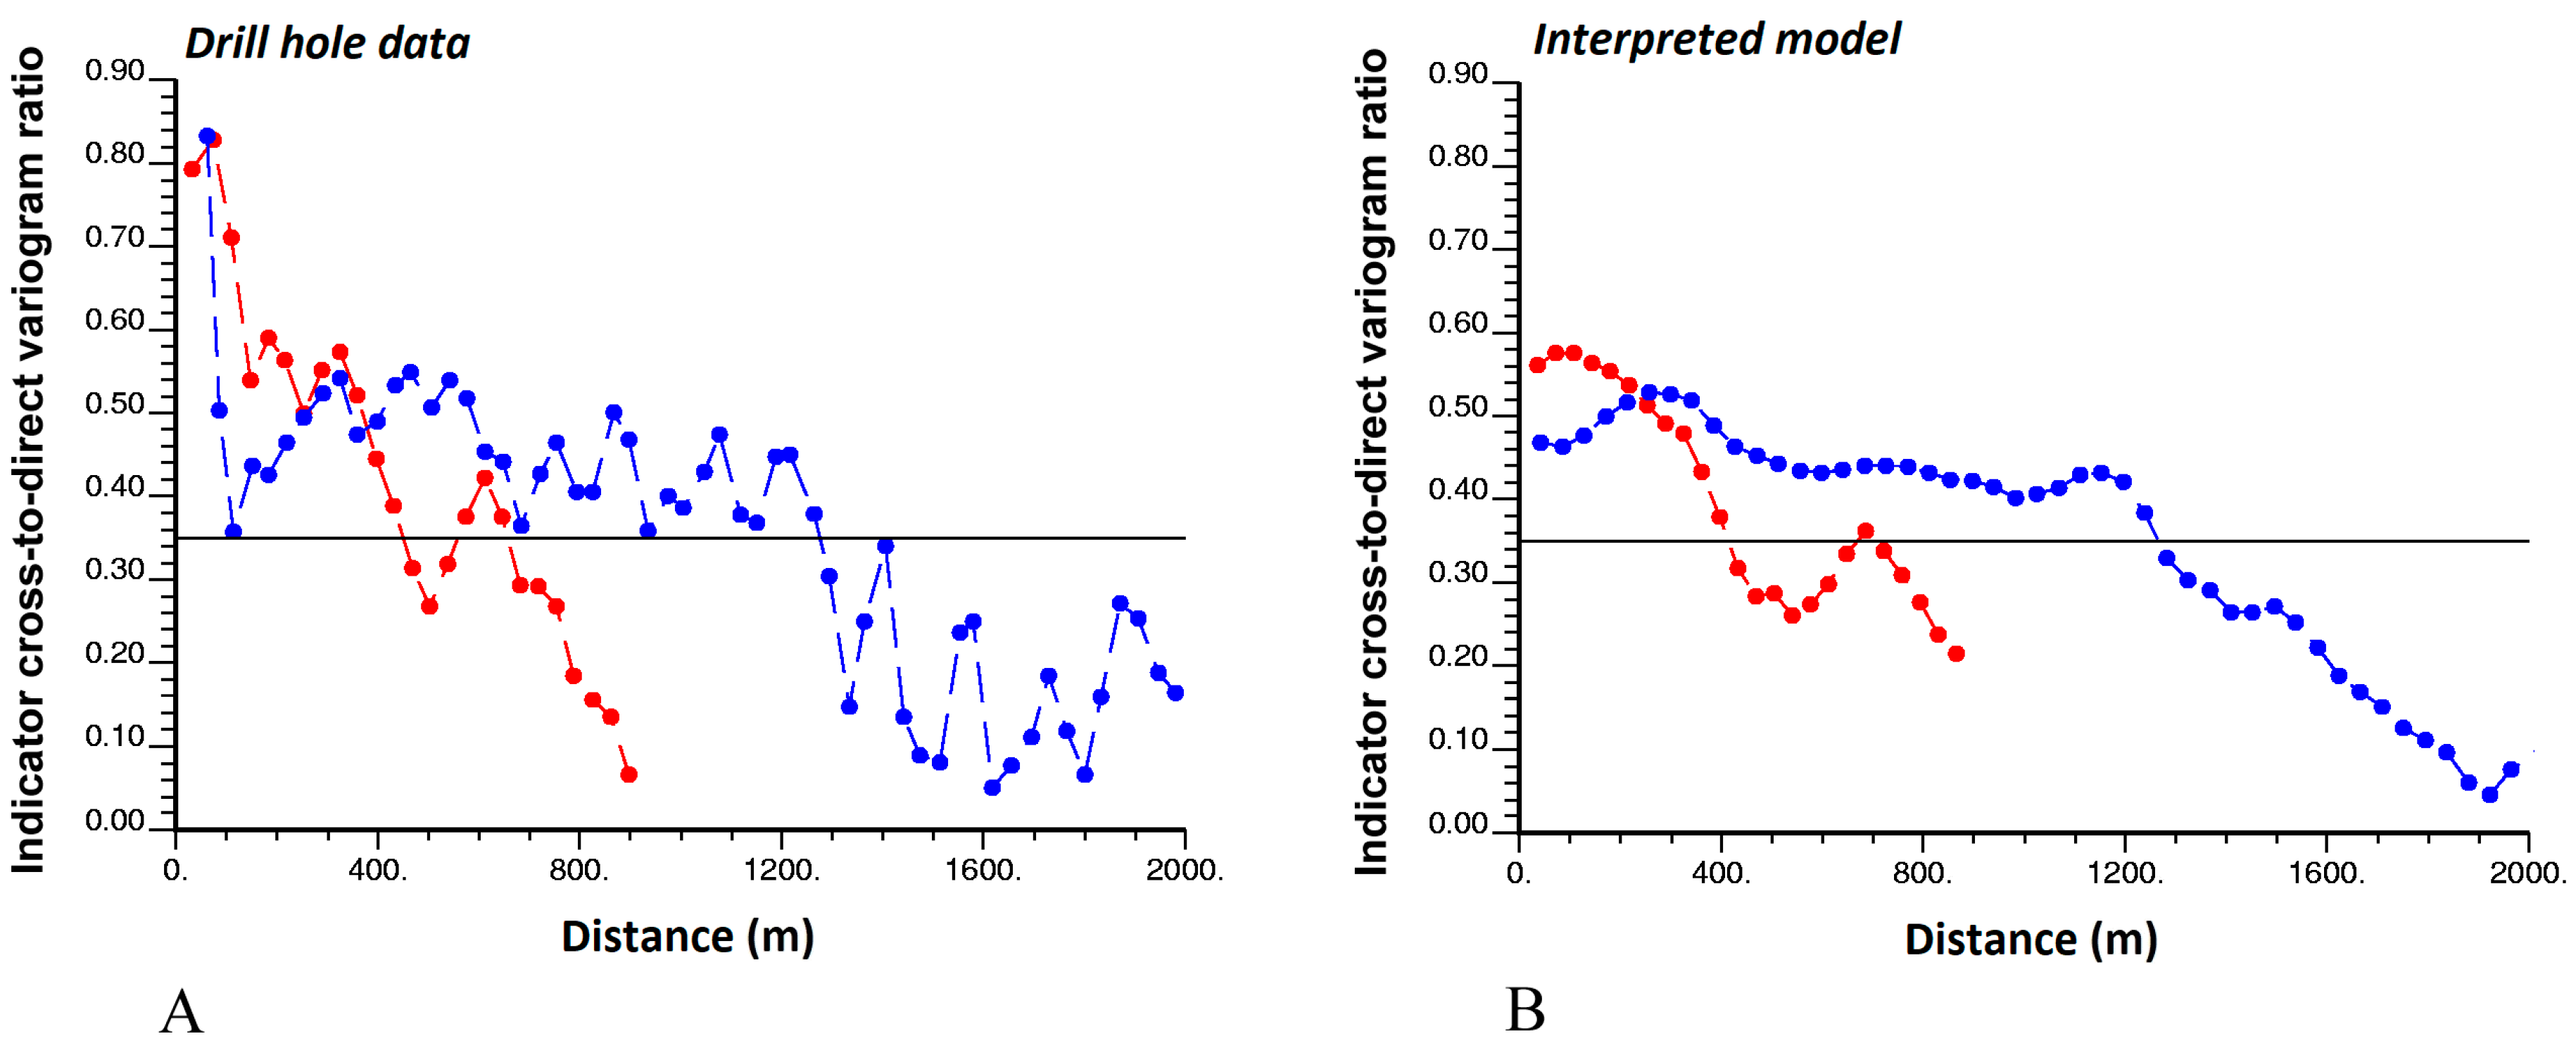
Indicator Variograms as an Aid for Geological Interpretation and Modeling of Ore Deposits


Abstract
Share and Cite
Maleki, M.; Emery, X.; Mery, N. Indicator Variograms as an Aid for Geological Interpretation and Modeling of Ore Deposits. Minerals 2017, 7, 241. https://doi.org/10.3390/min7120241
Maleki M, Emery X, Mery N. Indicator Variograms as an Aid for Geological Interpretation and Modeling of Ore Deposits. Minerals. 2017; 7(12):241. https://doi.org/10.3390/min7120241
Chicago/Turabian StyleMaleki, Mohammad, Xavier Emery, and Nadia Mery. 2017. "Indicator Variograms as an Aid for Geological Interpretation and Modeling of Ore Deposits" Minerals 7, no. 12: 241. https://doi.org/10.3390/min7120241
APA StyleMaleki, M., Emery, X., & Mery, N. (2017). Indicator Variograms as an Aid for Geological Interpretation and Modeling of Ore Deposits. Minerals, 7(12), 241. https://doi.org/10.3390/min7120241