Figure 1.
Bathymetric map of (A) showing the locations of Wocan-1 and Wocan-2 hydrothermal sites and the sampling stations in the ridge flank; (B) The enlarged map of A showing the sampling stations in Wocan-1 and Wocan-2 hydrothermal field.
Figure 1.
Bathymetric map of (A) showing the locations of Wocan-1 and Wocan-2 hydrothermal sites and the sampling stations in the ridge flank; (B) The enlarged map of A showing the sampling stations in Wocan-1 and Wocan-2 hydrothermal field.
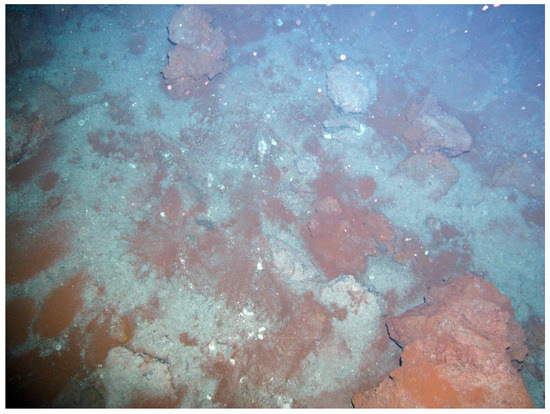
Figure 2.
Fe-oxyhydroxide deposits in the Wocan-1 hydrothermal site (station 28I-TVG08).
Figure 2.
Fe-oxyhydroxide deposits in the Wocan-1 hydrothermal site (station 28I-TVG08).
Figure 3.
XRD patterns of the bulk sediment from the station 28I-TVG10 (Wocan-2 site). Abbreviations, G: goethite; Gy: gypsum; B: Barite; Sp: sphalerite; Cpy: chalcopyrite; Py: pyrite. The 2θ values are enclosed in the bracket, whereas, the first values are the d values.
Figure 3.
XRD patterns of the bulk sediment from the station 28I-TVG10 (Wocan-2 site). Abbreviations, G: goethite; Gy: gypsum; B: Barite; Sp: sphalerite; Cpy: chalcopyrite; Py: pyrite. The 2θ values are enclosed in the bracket, whereas, the first values are the d values.
Figure 4.
XRD patterns of the bulk sediment from station 28II-TVG05 (Wocan-2 site). Abbreviations, G: goethite; Sp: sphalerite; Py: pyrite; C: calcite; M: Manganosite. The 2θ values are enclosed in the bracket, whereas, the first values are the d values.
Figure 4.
XRD patterns of the bulk sediment from station 28II-TVG05 (Wocan-2 site). Abbreviations, G: goethite; Sp: sphalerite; Py: pyrite; C: calcite; M: Manganosite. The 2θ values are enclosed in the bracket, whereas, the first values are the d values.
Figure 5.
XRD patterns of the bulk sediment from station 28II-TVG13 (ridge flank). Abbreviations, C: calcite; V: vermiculite. The 2θ values are enclosed in the bracket, whereas, the first values are the d values.
Figure 5.
XRD patterns of the bulk sediment from station 28II-TVG13 (ridge flank). Abbreviations, C: calcite; V: vermiculite. The 2θ values are enclosed in the bracket, whereas, the first values are the d values.
Figure 6.
Representative SEM photomicrographs (secondary Electron Images (SEI) and EDS spectra on the morphology of Fe-Si-Mn oxyhydroxide (A) Angular Fe-Si-oxyhydroxide separate from the Wocan-1 samples (station 28I-TVG07). (B) Mn-enriched sub-angular Fe-oxyhydroxide separate from the Wocan-2 samples (station 28II-TVG05). (C) Micro-botryoidal morphology of typical Fe-oxyhydroxides separate from Wocan-2 samples (station 28I-TVG10). (D) Sub-rounded and botryoidal Mn-enriched oxyhydroxides from the ridge flanks (station 28I-TVG13). The cross sign represents the analyzed spot.
Figure 7.
Photomicrographs of separated grains of Fe-oxyhydroxides. (A) A representative of reddish-brownish (type-1) and yellowish (type-2) angular to subangular Fe-oxyhydroxide separate. (B) Subangular to angular Si and S bearing phases in Fe-oxyhydroxide fragments. (C) Typical partially altered pyrite into secondary Fe-oxyhydroxide at station 28I-TVG10. (D) Typical sub-rounded reddish-brownish oxyhydroxide grains rich in Mn concentration at the Wocan-2 site (station 28I-TVG05), the emerald greenish-dark color suggests manganosite. Abbreviations, py: pyrite; Fe-ox: Fe-oxyhydroxides: Si: silica; S: sulfur.
Figure 8.
(A) Concentrations of the minor element (wt. %) in Fe-oxyhydroxide of Wocan-1 and type-1 Fe-oxyhydroxide of Wocan-2. (B) Average concentrations of the minor element in Wocan-1 Fe-oxyhydroxides and type-1 Fe-oxyhydroxides of Wocan-2 (n = 20).
Figure 8.
(A) Concentrations of the minor element (wt. %) in Fe-oxyhydroxide of Wocan-1 and type-1 Fe-oxyhydroxide of Wocan-2. (B) Average concentrations of the minor element in Wocan-1 Fe-oxyhydroxides and type-1 Fe-oxyhydroxides of Wocan-2 (n = 20).
Figure 9.
Ratios of Fe/Ti vs. Al/(Al + Fe + Mn) for Wocan-1 and Wocan-2 Fe-oxyhydroxides. The Al/(Al + Fe + Mn) values of some type-2 Fe-oxyhydroxide of Wocan-2 site are >0.40, an indications of detrital dilution of hydrothermal components [
37].
Figure 9.
Ratios of Fe/Ti vs. Al/(Al + Fe + Mn) for Wocan-1 and Wocan-2 Fe-oxyhydroxides. The Al/(Al + Fe + Mn) values of some type-2 Fe-oxyhydroxide of Wocan-2 site are >0.40, an indications of detrital dilution of hydrothermal components [
37].
Figure 10.
Mn-Fe-(Co + Ni + Cu) × 10 ternary diagram of Fe-oxyhydroxide deposits of: Wocan-1 and Wocan-2 type-1 Fe-oxyhydroxides. A indicates secondary sulfide oxidation origin after [
14], B indicates diagenetic origin after [
38].
Figure 10.
Mn-Fe-(Co + Ni + Cu) × 10 ternary diagram of Fe-oxyhydroxide deposits of: Wocan-1 and Wocan-2 type-1 Fe-oxyhydroxides. A indicates secondary sulfide oxidation origin after [
14], B indicates diagenetic origin after [
38].
Figure 11.
Schematic diagram showing the secondary oxidation of pre-existing sulfides in the Wocan hydrothermal site, modified after [
14].
Figure 11.
Schematic diagram showing the secondary oxidation of pre-existing sulfides in the Wocan hydrothermal site, modified after [
14].
Figure 12.
(
A–
D) The relationship between transition metals (Zn vs. Cu; Zn vs. Pb; Pb vs. As and Cu vs. Fe) of the Fe-oxyhydroxide deposits of the Wocan-1 and Wocan-2 (type-1). See
Supplementary Materials for regression statistics.
Figure 12.
(
A–
D) The relationship between transition metals (Zn vs. Cu; Zn vs. Pb; Pb vs. As and Cu vs. Fe) of the Fe-oxyhydroxide deposits of the Wocan-1 and Wocan-2 (type-1). See
Supplementary Materials for regression statistics.
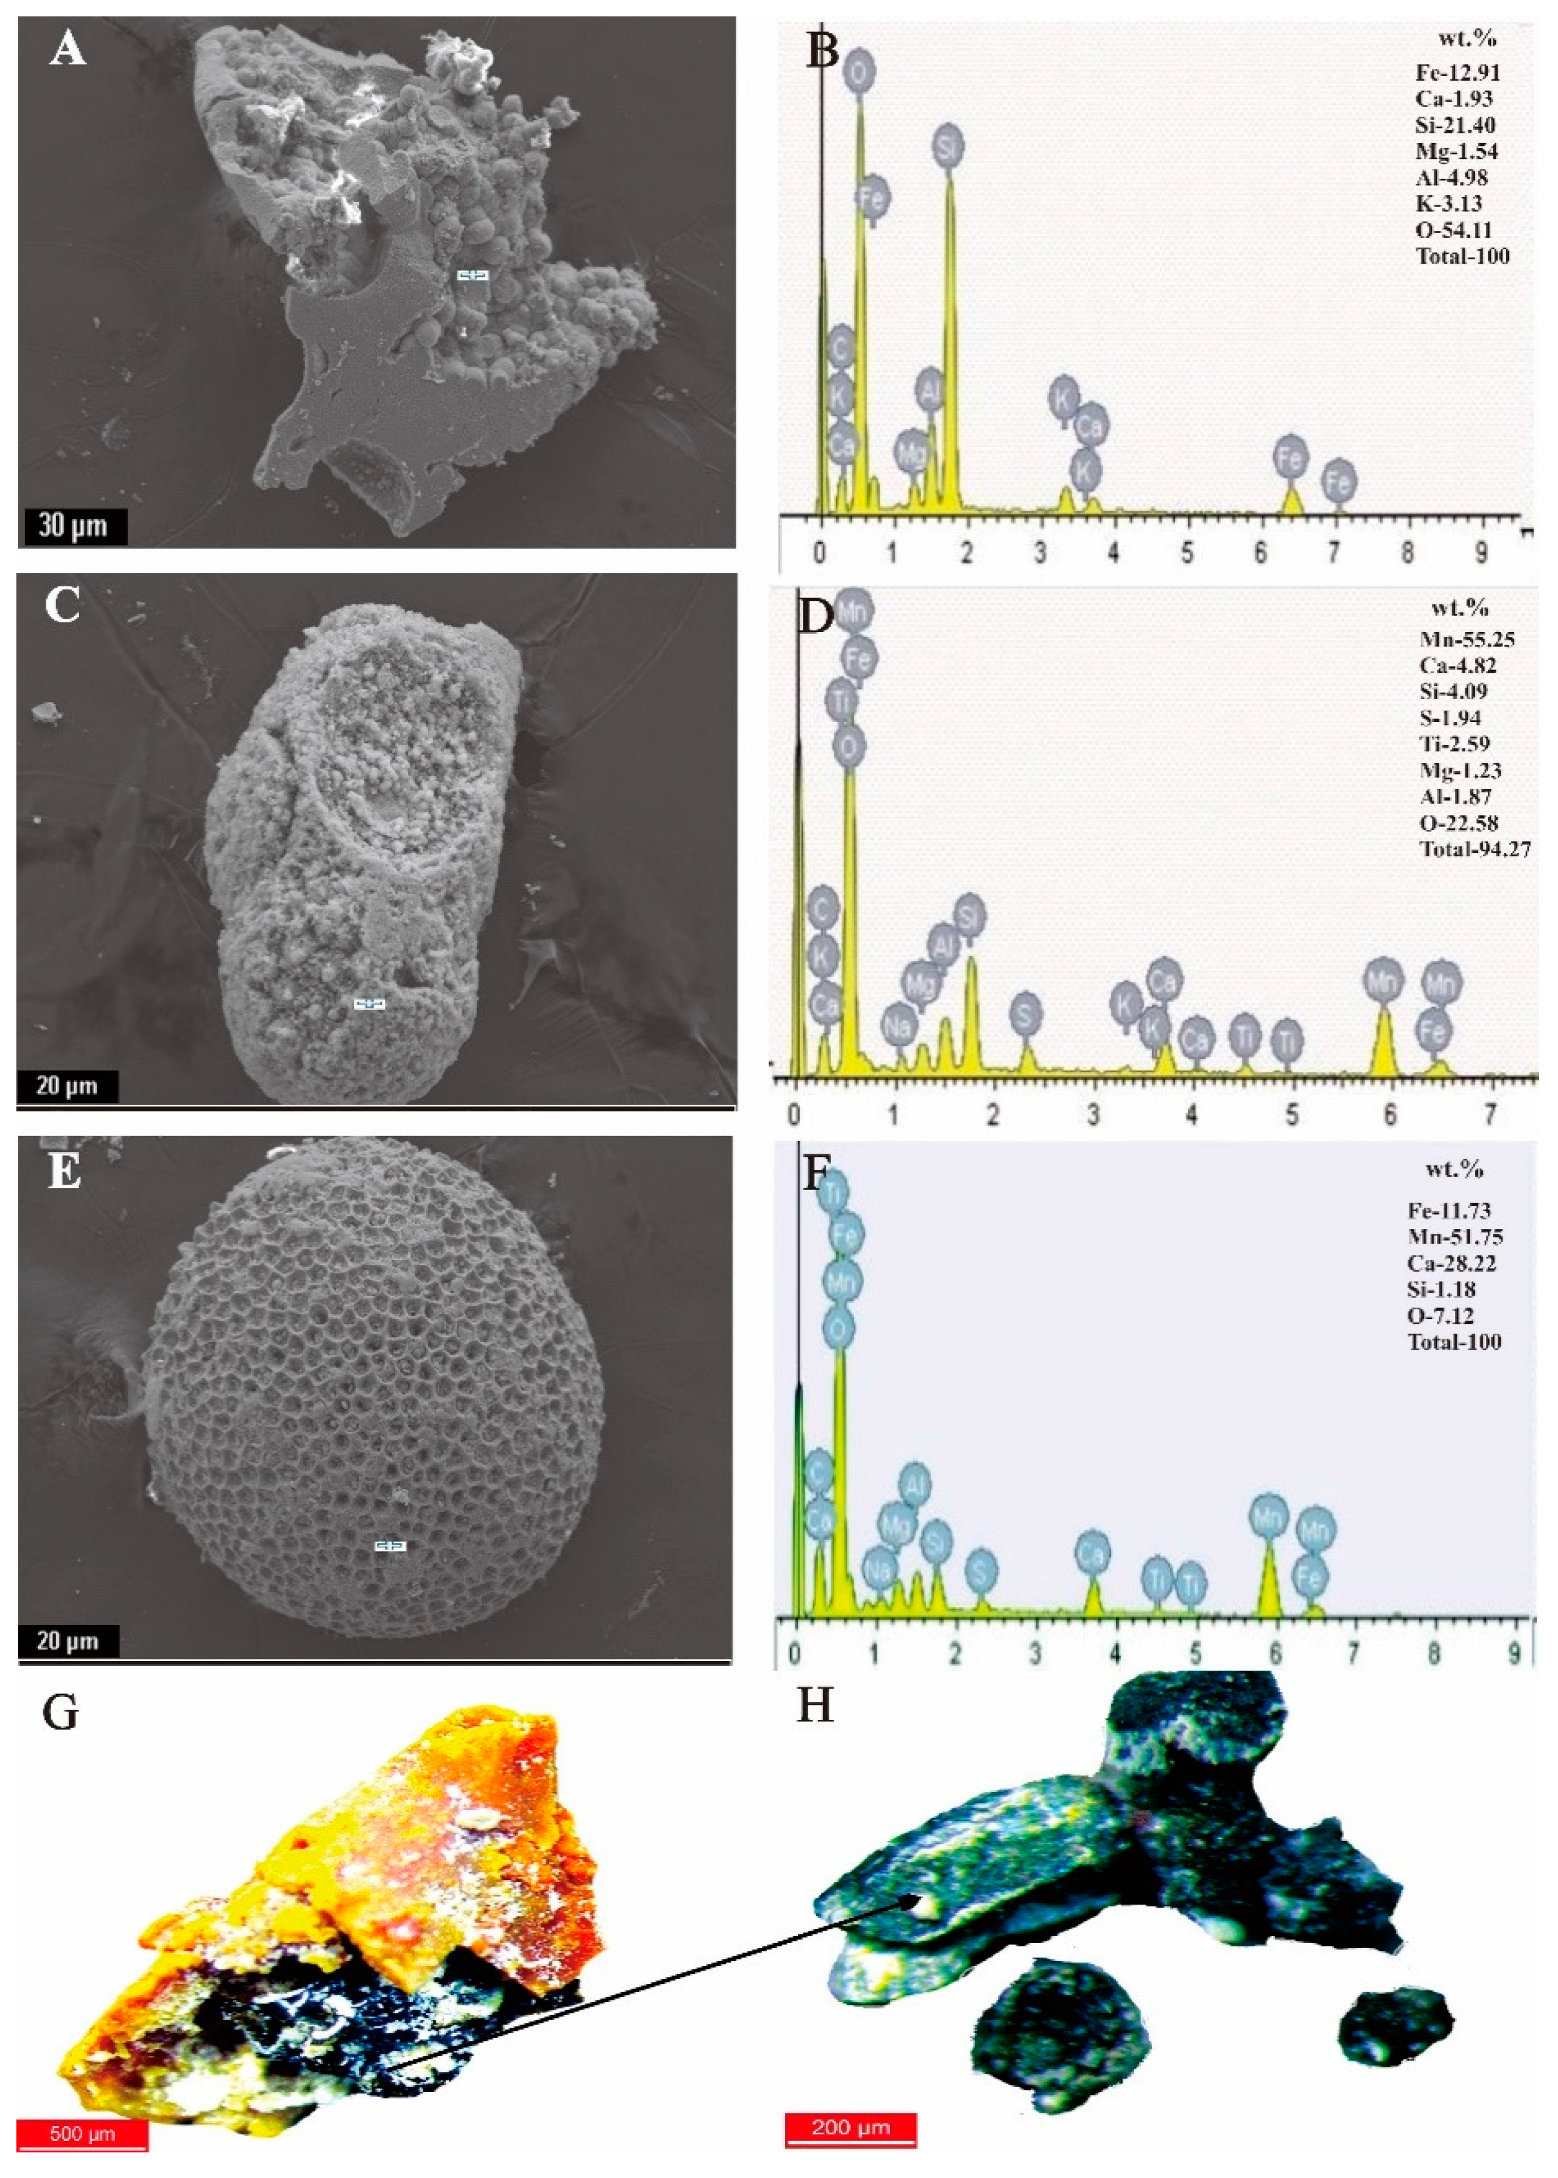
Figure 13.
SEM photomicrographs and EDS spectra of (A–F) typical diagenetic alterations on the oxyhydroxides of the ridge flanks (G,H). An optical photomicrograph of typical biogenic influence on Mn oxyhydroxide precipitates. The SEM photomicrograph of G–H is shown in A and C, while the EDS spectra are in B and D. The cross sign represent analyzed spot.
Table 1.
The sampling information of studied bulk samples.
Table 1.
The sampling information of studied bulk samples.
| Site | Station | Longitude (E) | Latitude (N) | Depth (m) |
|---|
| Wocan-1 | 28I-TVG07 | 60°31.534′ | 6°21.796′ | 2989 |
| 28I-TVG08 | 60°31.635′ | 6°21.756′ | 2973 |
| Wocan-2 | 28I-TVG10 | 60°30.372′ | 6°21.866′ | 3104 |
| 28II-TVG05 | 60°30.226′ | 6°22.534′ | 3105 |
| Ridge Flank | 28I-TVG13 | 60°13.190′ | 6°35.675′ | 3254 |
| 28I-TVG12 | 60°13.550′ | 6°30.462′ | 2009 |
Table 2.
Relative abundance of Fe-oxyhydroxide separates from ~250–260 grain counts at the six stations.
Table 2.
Relative abundance of Fe-oxyhydroxide separates from ~250–260 grain counts at the six stations.
| Grain Counts | 28I-TVG07 | 28I-TVG08 | 28I-TVG10 | 28II-TVG05 | 28I-TVG13 | 28I-TVG12 |
|---|
| Fe-oxyhydroxide grains | 132 | 139 | 176 | 119 | 29 | 13 |
| Non-Fe-oxyhydroxide grains | 122 | 118 | 87 | 132 | 219 | 233 |
| Total grain counts | 254 | 257 | 263 | 251 | 248 | 246 |
| % Fe-oxyhydroxide | 51.97 | 54.09 | 66.92 | 47.41 | 11.69 | 5.28 |
Table 3.
Electron Probe Micro-analysis (wt. %) for Fe-Si-Mn oxyhydroxides from Wocan-1 site.
Table 3.
Electron Probe Micro-analysis (wt. %) for Fe-Si-Mn oxyhydroxides from Wocan-1 site.
| Element | SiO2 | SO3 | FeO | MnO | TiO2 | Al2O3 | Al/(Al + Fe + Mn) | Fe/Mn | | | |
|---|
| Min | 6.85 | 0.04 | 63.10 | Bdl | 0.02 | 0.04 | 0.0004 | 659.19 | | | |
| Max | 16.31 | 0.26 | 70.93 | 0.11 | 0.08 | 2.30 | 0.02 | 4,642.62 | | | |
| Av | 11.82 | 0.10 | 67.47 | 0.06 | 0.06 | 0.31 | 0.003 | 2,486.05 | | | |
| STD-EV | ±3.06 | ±0.08 | ±2.76 | ±0.05 | ±0.02 | ±0.67 | ±0.01 | ±66.06 | | | |
| n = 11 | CuO | CoO | NiO | BaO | SrO | As2O5 | ZnO | PbO | Total | H2O+ (calc) | Cu + Co + Zn + Ni |
| Min | 0.50 | Bdl | 0.03 | 0.02 | Bdl | Bdl | 0.41 | 0.06 | 71.11 | 28.89 | 0.79 |
| Max | 1.38 | Bdl | 0.08 | 0.11 | 0.05 | 0.15 | 0.92 | 0.19 | 93.35 | 6.65 | 1.78 |
| Av | 0.82 | Bdl | 0.05 | 0.05 | 0.02 | 0.06 | 0.64 | 0.10 | 81.72 | 18.28 | 1.19 |
| STDEV | ±0.26 | - | ±0.02 | ±0.04 | ±0.02 | ±0.04 | ±0.17 | ±0.04 | ±7.37 | - | ±0.31 |
Table 4.
Electron Probe Micro-analysis (wt. %) of type-1 Fe-Si-Mn oxyhydroxides from Wocan-2 site.
Table 4.
Electron Probe Micro-analysis (wt. %) of type-1 Fe-Si-Mn oxyhydroxides from Wocan-2 site.
| Element | SiO2 | SO3 | FeO | MnO | TiO2 | Al2O3 | Al/(Al + Fe + Mn) | Fe/Mn | | | |
|---|
| Min | 8.40 | 0.08 | 63.44 | Bdl | 0.03 | Bdl | 0.0002 | 1062 | | | |
| Max | 15.19 | 0.65 | 70.91 | 0.07 | 0.09 | 1.96 | 0.02 | 35,080 | | | |
| Av | 12.63 | 0.24 | 66.57 | 0.03 | 0.07 | 0.35 | 0.0036 | 9,557 | | | |
| STD-EV | ±2.07 | ±0.19 | ±2.63 | ±0.03 | ±0.03 | ±0.61 | ±0.006 | ±25.59 | | | |
| n = 9 | CuO | CoO | NiO | BaO | SrO | As2O5 | ZnO | PbO | Total | H2O+ (calc) | Cu + Co + Zn + Ni |
| Min | 0.52 | Bdl | Bdl | Bdl | Bdl | Bdl | 0.40 | 0.02 | 77.14 | 22.86 | 0.80 |
| Max | 1.41 | Bdl | 0.06 | 0.04 | 0.03 | 0.09 | 1.31 | 0.10 | 84.64 | 15.36 | 1.85 |
| Av | 0.89 | Bdl | 0.04 | 0.02 | 0.02 | 0.04 | 0.64 | 0.05 | 81.54 | 18.46 | 1.23 |
| STD-EV | ±0.26 | | ±0.04 | ±0.01 | ±0.01 | ±0.03 | ±0.28 | ±0.04 | ±2.59 | - | ±0.36 |
Table 5.
Electron Probe Micro-analysis (wt. %) for type-2 Fe-Si-Mn oxyhydroxides from Wocan-2 site.
Table 5.
Electron Probe Micro-analysis (wt. %) for type-2 Fe-Si-Mn oxyhydroxides from Wocan-2 site.
| Element | SiO2 | SO3 | FeO | MnO | TiO2 | Al2O3 | Al/(Al + Fe + Mn) | Fe/Mn | | | |
|---|
| Min | 34.78 | Bdl | 8.60 | 0.07 | 0.09 | 0.07 | 0.003 | 25.81 | | | |
| Max | 49.96 | Bdl | 26.61 | 0.35 | 5.46 | 19.08 | 0.577 | 37.66 | | | |
| Av | 46.97 | - | 14.28 | 0.18 | 3.09 | 11.36 | 0.404 | 90.38 | | | |
| STD-EV | ±4.24 | - | ±4.30 | ±0.07 | ±2.13 | ±7.32 | ±0.20 | ±13.94 | | | |
| n = 21 | CuO | CoO | NiO | BaO | SrO | AS2O5 | ZnO | PbO | Total | H2O+ (calc) | Cu + Co + Zn + Ni |
| Min | Bdl | Bdl | Bdl | Bdl | Bdl | Bdl | Bdl | Bdl | 61.55 | 38.45 | Bdl |
| Max | Bdl | Bdl | Bdl | Bdl | Bdl | Bdl | Bdl | Bdl | 87.91 | 12.09 | Bdl |
| Av | - | - | - | - | - | - | - | - | 75.87 | 24.13 | - |
| STD-EV | - | - | - | - | - | - | - | - | ±10.49 | - | - |
Table 6.
Electron Probe Micro-analysis (wt. %) for typical Si-enriched grains from the ridge flanks.
Table 6.
Electron Probe Micro-analysis (wt. %) for typical Si-enriched grains from the ridge flanks.
| Element | SiO2 | SO3 | FeO | MnO | TiO2 | Al2O3 | Fe/Mn | | | |
|---|
| Min | 81.09 | Bdl | 0.02 | 4.04 | 0.03 | 0.03 | 0.004 | | | |
| Max | 93.79 | Bdl | 0.09 | 5.11 | 0.08 | 0.58 | 0.022 | | | |
| Av | 89.08 | - | 0.05 | 4.75 | 0.05 | 0.43 | 0.011 | | | |
| STD-EV | ±6.42 | - | ±0.04 | ±0.54 | 0.03 | ±0.28 | ±0.01 | | | |
| n = 3 | CuO | CoO | NiO | BaO | SrO | AS2O5 | ZnO | PbO | Total | Cu + Co + Zn + Ni |
| Min | Bdl | Bdl | Bdl | Bdl | Bdl | Bdl | Bdl | Bdl | 86.83 | Bdl |
| Max | Bdl | Bdl | Bdl | 0.05 | Bdl | Bdl | Bdl | Bdl | 98.03 | Bdl |
| Av | - | - | - | - | - | - | - | - | 94.28 | - |
| STD-EV | - | - | - | - | - | - | - | - | ±5.70 | - |


