Article

Theoretical Modeling of Defects, Dopants, and Diffusion in the Mineral Ilmenite

by
Navaratnarajah Kuganathan
1,2,*,
Ratnasothy Srikaran
3,
Paul C. M. Fossati
4 and
Alexander Chroneos
1,2
1
Department of Materials, Imperial College London, London SW7 2AZ, UK
2
Faculty of Engineering, Environment and Computing, Coventry University, Priory Street, Coventry CV1 5FB, UK
3
Department of Chemistry, University of Jaffna, Sir. Pon Ramanathan Road, Thirunelvely, Jaffna 40000, Sri Lanka
4
DEN–Service de Corrosion et du Comportement des Matériaux dans leur Environnement (SCCME), CEA Saclay, Université Paris Saclay, F-91191 Gif-sur-Yvette, France
*
Author to whom correspondence should be addressed.
Minerals 2019, 9(10), 610; https://doi.org/10.3390/min9100610
Submission received: 11 September 2019 / Revised: 2 October 2019 / Accepted: 2 October 2019 / Published: 4 October 2019

Abstract

:
The iron titanium oxide ilmenite (FeTiO3) is a technologically and economically important mineral in the industrial preparation of titanium-based pigments and spintronic devices. In this study, atomistic simulation techniques based on classical pair potentials are used to examine the energetics of the intrinsic and extrinsic defects and diffusion of Fe2+ ions in FeTiO3. It is calculated that the cation anti-site (Fe‒Ti) cluster is the most dominant defect, suggesting that a small amount of cations exchange their positions, forming a disordered structure. The formation of Fe Frenkel is highly endoergic and calculated to be the second most stable defect process. The Fe2+ ions migrate in the ab plane with the activation energy of 0.52 eV, inferring fast ion diffusion. Mn2+ and Ge4+ ions are found to be the prominent isovalent dopants at the Fe and Ti site, respectively. The formation of additional Fe2+ ions and O vacancies was considered by substituting trivalent dopants (Al3+, Mn3+, Ga3+, Sc3+, In3+, Yb3+, Y3+, Ga3+, and La3+) at the Ti site. Though Ga3+ is found to be the candidate dopant, its solution enthalpy is >3 eV, suggesting that the formation is not significant at operating temperatures.

Graphical Abstract

1. Introduction

Ilmenite (FeTiO3), also termed mannaccanite, is a naturally occurring mineral existing in many parts of the world, including India and Sri Lanka [1,2,3]. Most ilmenite is formed during magmatic cooling and it gets concentrated via the process known as magmatic segregation [4]. Ilmenite is commonly present in igneous rock and it is very resistant to weathering. Ilmenite is the primary source of titanium, the metal used to prepare a vast array of alloys which are used to manufacture aircraft parts, sporting equipment artificial joints for humans, etc. [5]. Economically, ilmenite is a very important mineral because it is the main feedstock in the production of titanium pigments in metal industries [6].
The chemical composition of beach sand found in different places in Sri Lanka was extracted by Ismail et al. [2] and approximately 70–80% w/w ilmenite was present in the sand. In a different study conducted by Herath et al. [7], the extracted ilmenite consisted of metal oxides such as TiO2 (53.61%), FeO (20.67%), Fe2O3 (20.95%), MnO (0.95%), MgO (0.92%), Al2O3 (0.54%), SiO2 (0.38%), CaO (0.05%), and Cr2O3 (0.05%). The extraction of Ti and Fe from ilmenite has been reported in order to apply those metals in industries [8,9]. Electron microscopic studies on ilmenite by Rao et al. [10] indicate that the weathering/oxidation process can introduce trace amounts of oxides, including MnO, MgO, ZnO, and Al2O3, in FeTiO3. Modification of this material by physical and chemical processes has been well-studied and -documented [11,12,13,14].
Computational modeling techniques using different functionals have been applied to reproduce the electronic, magnetic, optical, and mechanical properties of ilmenite [15,16,17,18,19]. Ribeiro et al. [19] studied the formation of neutral oxygen vacancies in FeTiO3 and concluded that electronic and magnetic properties can be controlled by tuning oxygen vacancies. Calculating the properties of defect-free ilmenite is important in high-precision magnetic measurement which uses a new switching sensing principle [20,21]. Although examining the properties of defect-free ilmenite is important, the theoretical prediction of crystallographic defects, diffusion, and dopants is also important for the future application of this material. Many physicochemical properties, such as diffusion, electronic conduction, and crystal deformation, in minerals are mainly governed by point defects. Understanding the key processes related to diffusion and dopants would be useful to extrapolate experimental data.
To the best of our knowledge, no theoretical work has been reported on the defects, diffusion, and dopants in ilmenite. In previous studies [22,23,24,25,26,27,28,29], defects have been modeled in a variety of ionic oxide materials using different simulation methods. This work uses classical simulation techniques to examine the energetics of intrinsic defects; Fe-ion diffusion; and solutions of RO (R = Ni, Zn, Co, Mn, Ca, Sr, and Ba), R2O3 (R = Al, Mn, Ga, Sc, In, Yb, Y, Gd, and La), and RO2 (R = Si, Ge, Sn, Zr, and Ce) in FeTiO3. Density functional theory (DFT) calculations were used to analyze the electronic structures of doped-FeTiO3 configurations.

2. Computational Methods

The classical simulation code GULP (General Utility Lattice Program) [30,31] was used to model intrinsic defects, self-diffusion, and dopants. Ionic interactions were considered in the form of Coulombic attraction (long range), Pauli repulsion, and van der Waals attraction (short range). Full geometry optimization (both positions and cell) was performed in each case using the Broyden–Fletcher–Goldfarb–Shanno (BFGS) algorithm [31]. Defect calculations are based on the Mott–Littleton approach [32], as implemented in the GULP code. The activation energy of the migrating ion is defined as the energy difference between the initial configuration energy and the energy of the saddle point configuration. This defect process is assumed to take place under constant pressure in a similar fashion as the isobaric defect processes (for formation and/or migration) discussed, e.g., in the superionic conductor β-PbF2 [33]. There will be an overestimation in the calculated enthalpies as the current model assumes that ions are spherical with full charge.
Spin-polarized density functional theory (DFT) calculations, as implemented in the VASP (Vienna Ab initio Simulation Package) code [34,35], were carried out to examine the electronic properties of un-doped and doped FeTiO3. Here, we consider only the most energetically favorable dopants identified in this study. A 2 × 2 × 1 supercell consisting of 120 atoms was used to model doped structures. A plane wave basis set with a cut-off of 500 eV and a 2 × 2 × 4 Monkhorst–Pack k-point grid [36] were used in all calculations. Exchange correlation was modeled using the generalized gradient approximation (GGA) parameterized by Perdew, Burke, and Ernzerhof (PBE) [37]. Structural relaxations were performed using the conjugate gradient algorithm [38]. Forces on the atoms calculated using the Hellman–Feynman theorem, including Pulay corrections, were less than 0.001 eV/Å in all optimized configurations. In this study, dispersion was included in the form of a pair-wise force field, as described by Grimme et al. [39], in the VASP code.

3. Results

3.1. Crystal Structure of FeTiO3

FeTiO3 exhibits a rhombohedral structure composed of alternative octahedral FeO6 and TiO6 layers along the [001] direction which share their edges (refer to Figure 1). Its experimentally-determined lattice parameters (a = b = 5.0870 Å, c = 14.0420 Å, α = 90°, β = 90°, and γ = 120°) were reported by Morosin et al. [40]. In order to validate the pair-wise potentials used in the classical simulation (refer to Table S1) and projector augmented wave (PAW) potentials used in the DFT simulation, geometry optimization of FeTiO3 under constant pressure was carried out using both methods. There is a good agreement between the calculated and experimental values, as reported in Table 1.

3.2. Energetics of Intrinsic Defects

Here, we report the results of a systematic examination of intrinsic defects that can be observed in FeTiO3 using the classical potential simulation. Point defects such as vacancies and interstitials (refer to Figure 2) were first created and their energies calculated. In order to calculate the Schottky and Frenkel energies, point defects were combined, as shown in Equations (1)–(8), using Kröger–Vink notation [41]. Calculated defect energies are reported in Table 2.
It was calculated that the lowest energy defect process is the Fe‒Ti anti-site defect (0.55 eV/defect). This indicates that a small concentration of cation mixing (Fe‒Ti) can be observed. A variety of materials with this defect have been identified experimentally and theoretically. The next favorable defect is the Fe‒Frenkel defect (4.20 eV/defect). This defect would not be significant at operating temperatures. The O‒Frenkel and FeO‒Schottky defect energies are high, but less than 5.00 eV. Other defects exhibit very high formation energies, meaning they would not play a role under any conditions.
Fe Frenkel : Fe Fe X V Fe + Fe i
Ti Frenkel : V Ti X V Ti + Ti i
O Frenkel : O O X V O + O i
Schottky : Fe Fe X + Ti Ti X + 3   O O X V Fe + V Ti + 3   V O + FeTiO 3
FeO Schottky : Fe Fe X + O O X V Fe + V O + FeO
TiO 2   Schottky : Ti Ti X + 2   O O X V Ti + 2   V O + TiO 2
Fe / Ti antisite   ( isolated ) : Fe Fe X + Ti Ti X Fe Ti + Ti Fe
Fe / Ti antisite   ( cluster ) : Fe Fe X + Ti Ti X { Fe Ti : Ti Fe } X

3.3. Self-Diffusion of Iron

Ionic transport is an important property of a material as it is linked to the ionic conductivity. The well-established current classical potential simulation enabled us to calculate ion diffusion paths with activation energies in FeTiO3. Establishing ionic transport pathways by experiments is generally difficult. The current methodology has been utilized successfully to study the ionic transport in a variety of ionic oxide materials [22,23,24,25,26,27,28,29]. Vacancy-assisted migration paths were considered for Fe2+ ions as their Frenkel is the lowest energy process among other Frenkels.
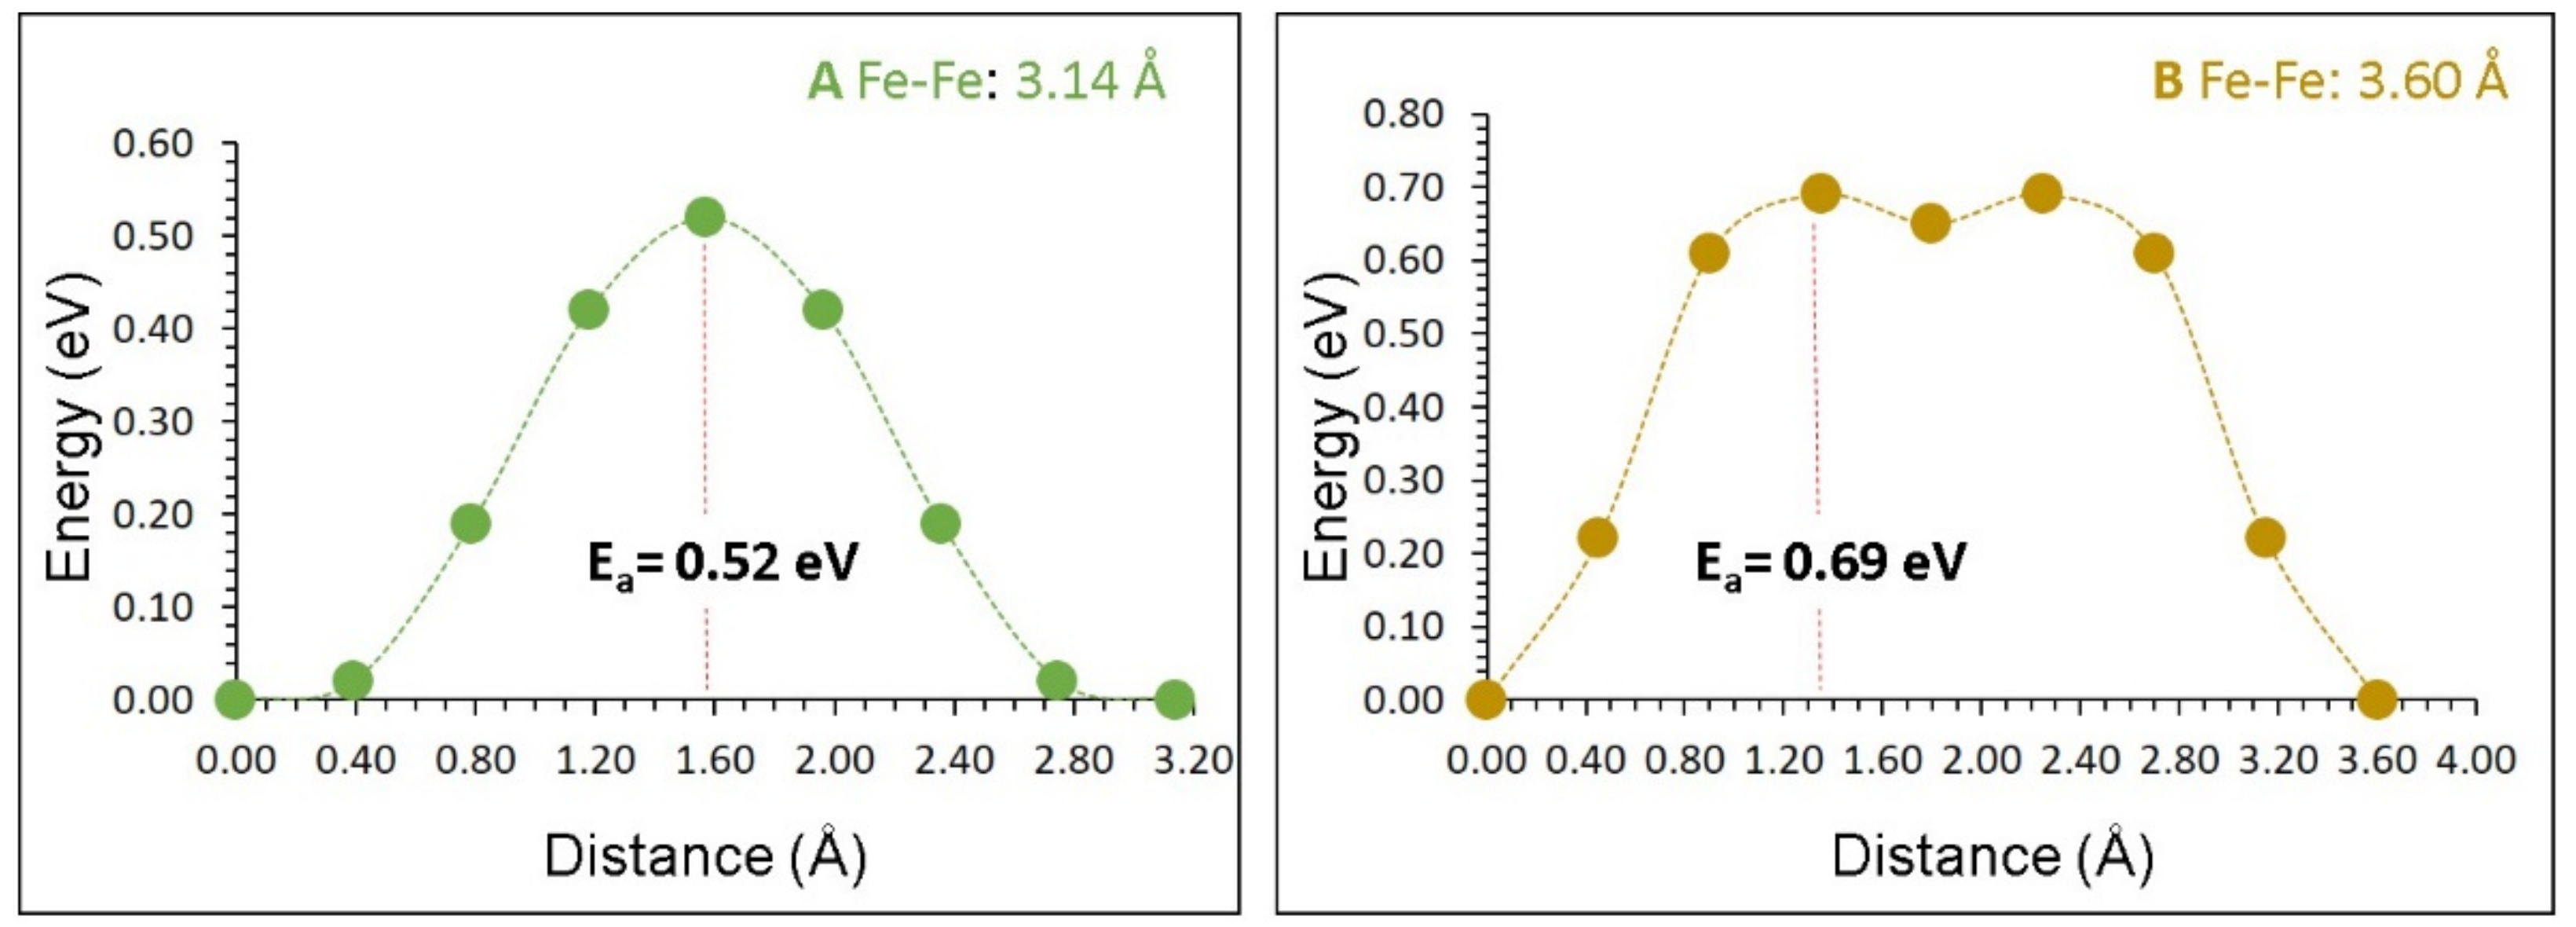
Two different local Fe hops (A and B) (refer to Figure 3) with jump distances of 3.14 Å and 3.60 Å were identified (refer to Figure 3). The activation energies for the individual Fe hops are listed in Table 3. Energy profile diagrams for each hop are shown in Figure 4. Fast movement of Fe2+ ions is noted for hop A, as its calculated activation is only 0.52 eV. Hop B exhibits a slightly higher value, increasing by 0.17 eV, compared to that of hop A. Long-range diffusion paths were constructed by connecting local hops. Two paths were identified. In the first path, Fe2+ ions migrate in the ab plane with a zig-zag pattern only connecting A hops and its activation is still 0.52 eV. The second path connects both A and B and the diffusion is observed to be along the c axis. The activation energy for this path is 0.69 eV because of the involvement of B. Both long-range paths are possible for ion migration, though ions would prefer to use the lowest activation energy path.

3.4. Dopant Substitution

A variety of dopants were substituted at the Fe and Ti sites and their solution energies were calculated using the classical potential simulation. Investigating promising dopants can be useful for future experimental studies as those dopants may change the electronic and mechanical properties of the material.

3.4.1. Divalent Dopants

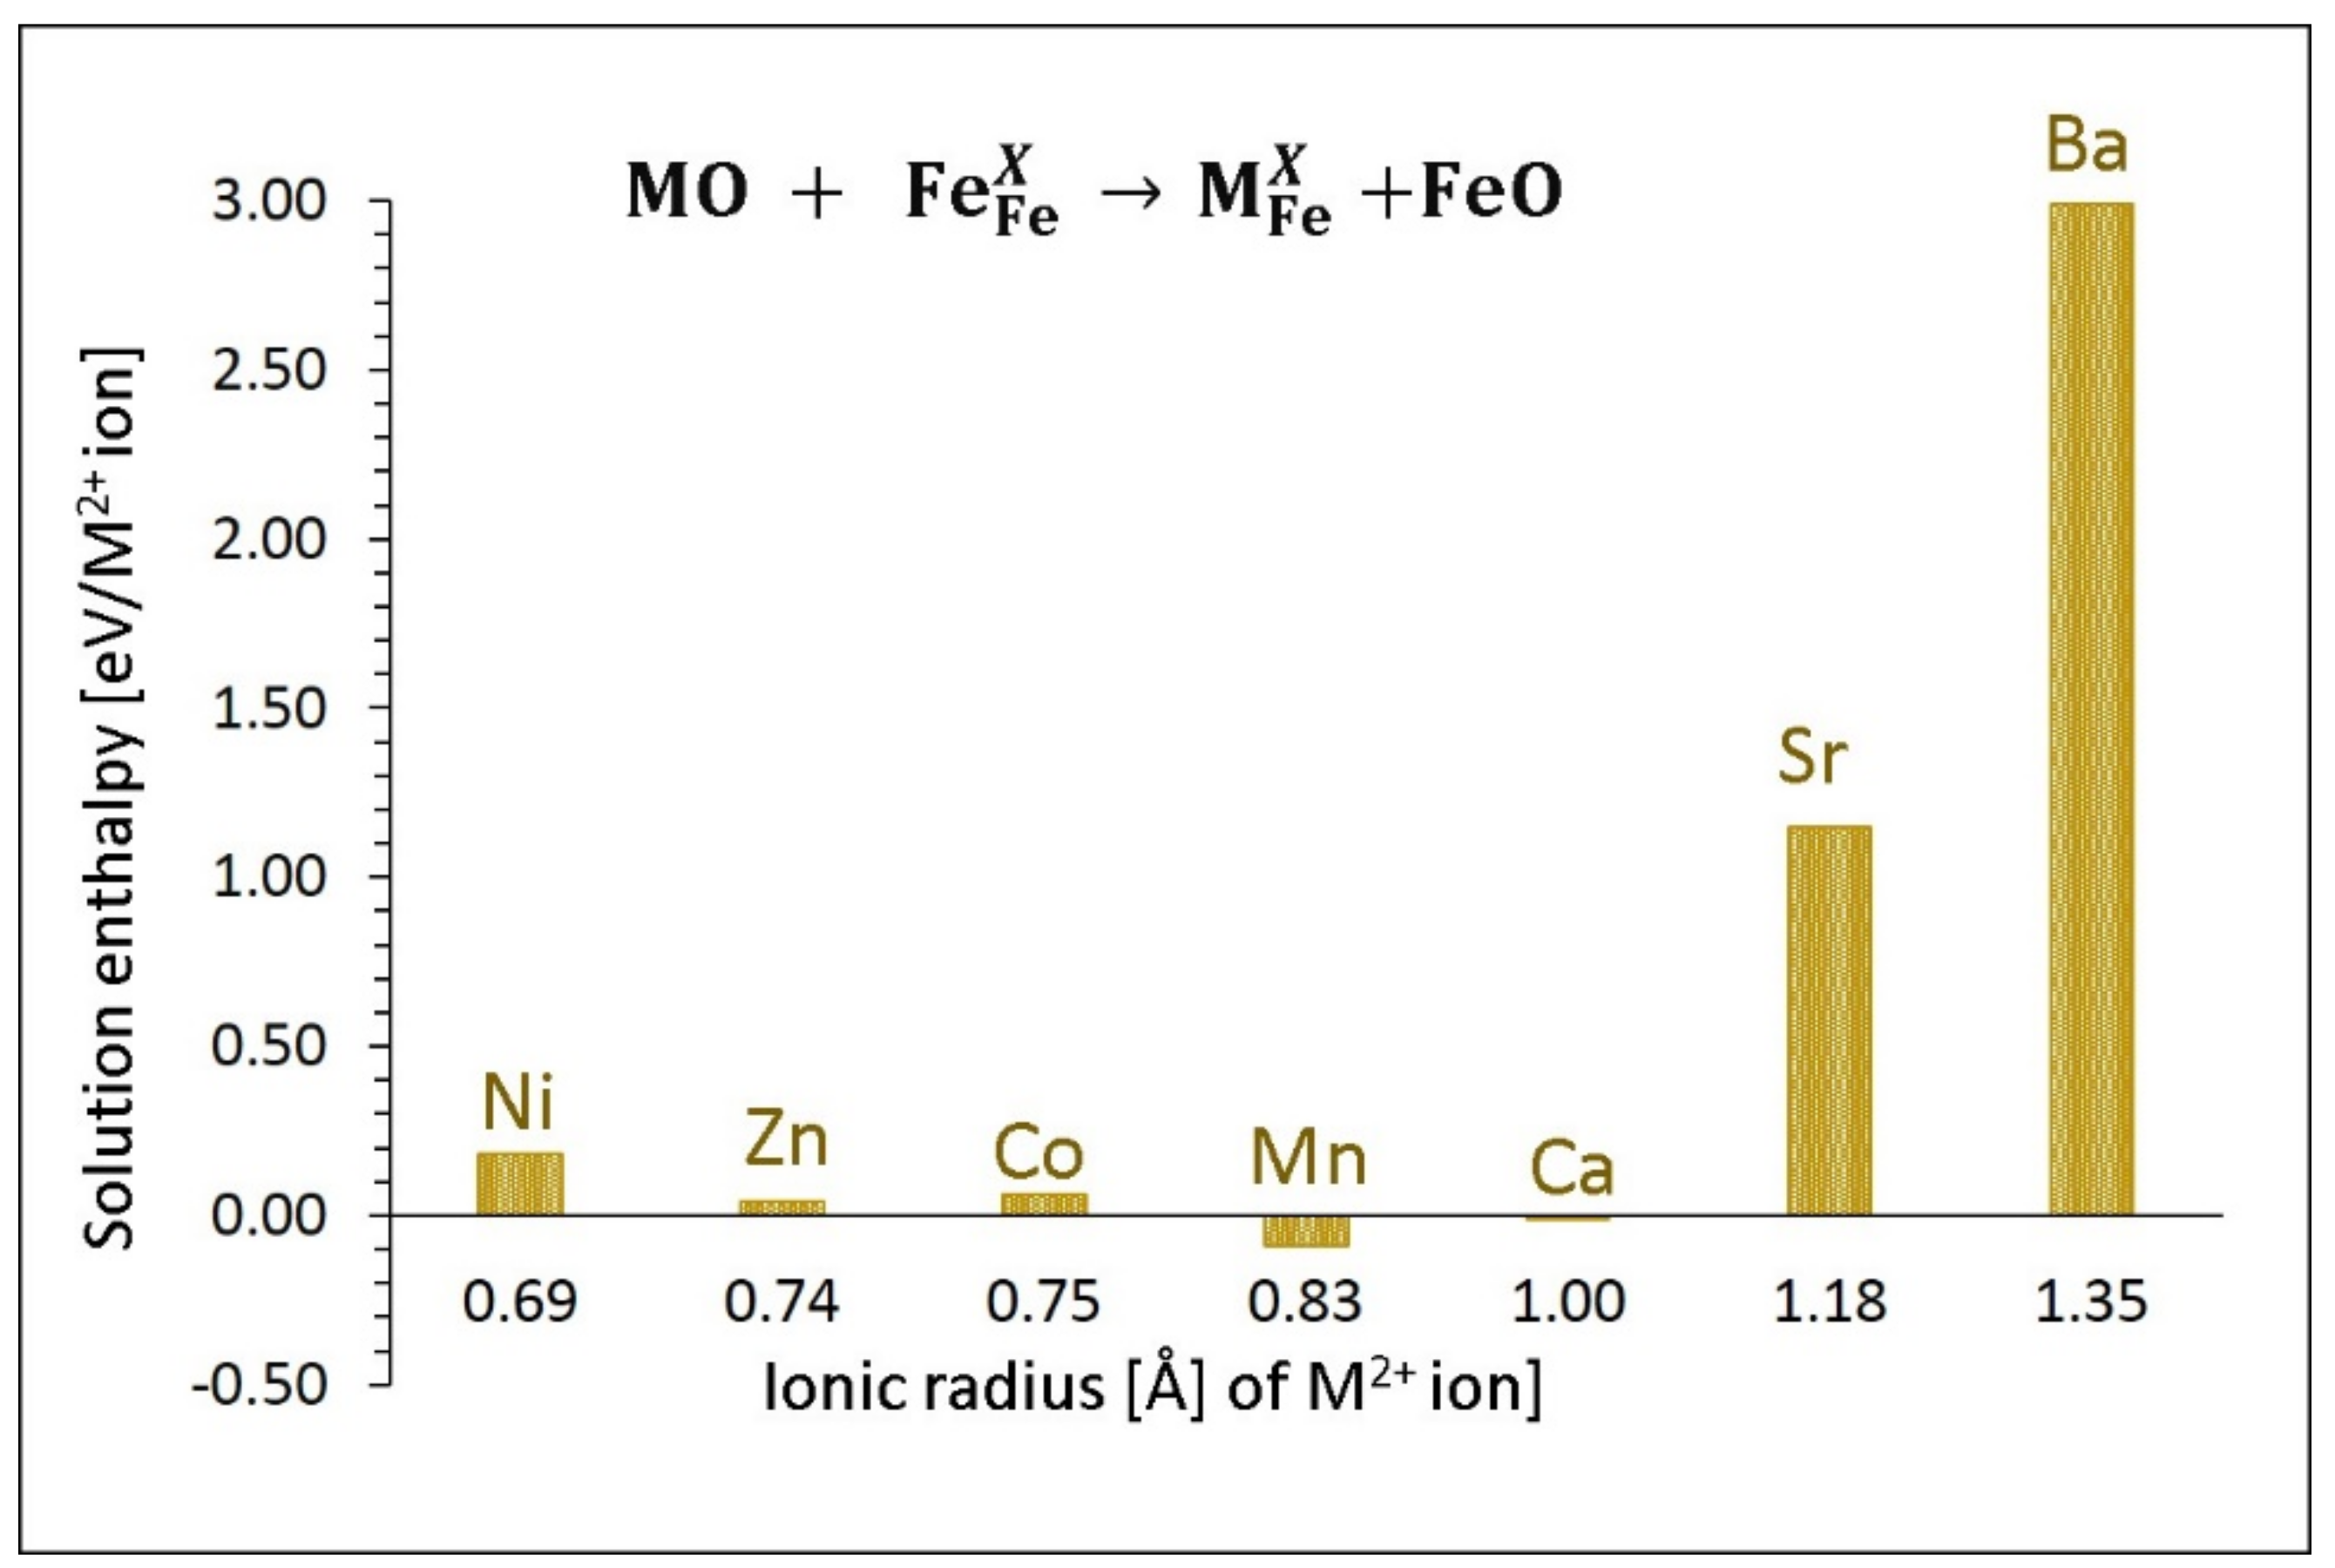
Here, we considered divalent dopants (Ni, Zn, Co, Mn, Ca, Sr, and Ba) at the Fe site. As the charge of Fe is +2 in FeTiO3, charge compensation was not necessary (refer to Figure 5) when calculating the solution enthalpy. Notably, Mn2+ is a promising dopant as its solution enthalpy is exothermic. Almost zero-solution enthalpy is observed for Ca2+, indicating that it is worth examining experimentally. Dopants Zn, Co, and Ni exhibit positive (but <0.2 eV) solution enthalpies, inferring that they can be doped at low temperatures. High positive values are observed for Sr and Ba. This is reminiscent of a similar behavior obtained when plotting the values of the activation energy for dielectric losses in alkali halides, e.g., NaCl, versus the ionic radii of divalent dopants (Ni, Zn, Co, Mn, Ca, Sr, and Ba), where markedly larger values are observed for Sr and Ba [42]. This could be due to the larger ionic radii of these two dopants than that of Fe2+ (0.78 Å).

3.4.2. Trivalent Dopants

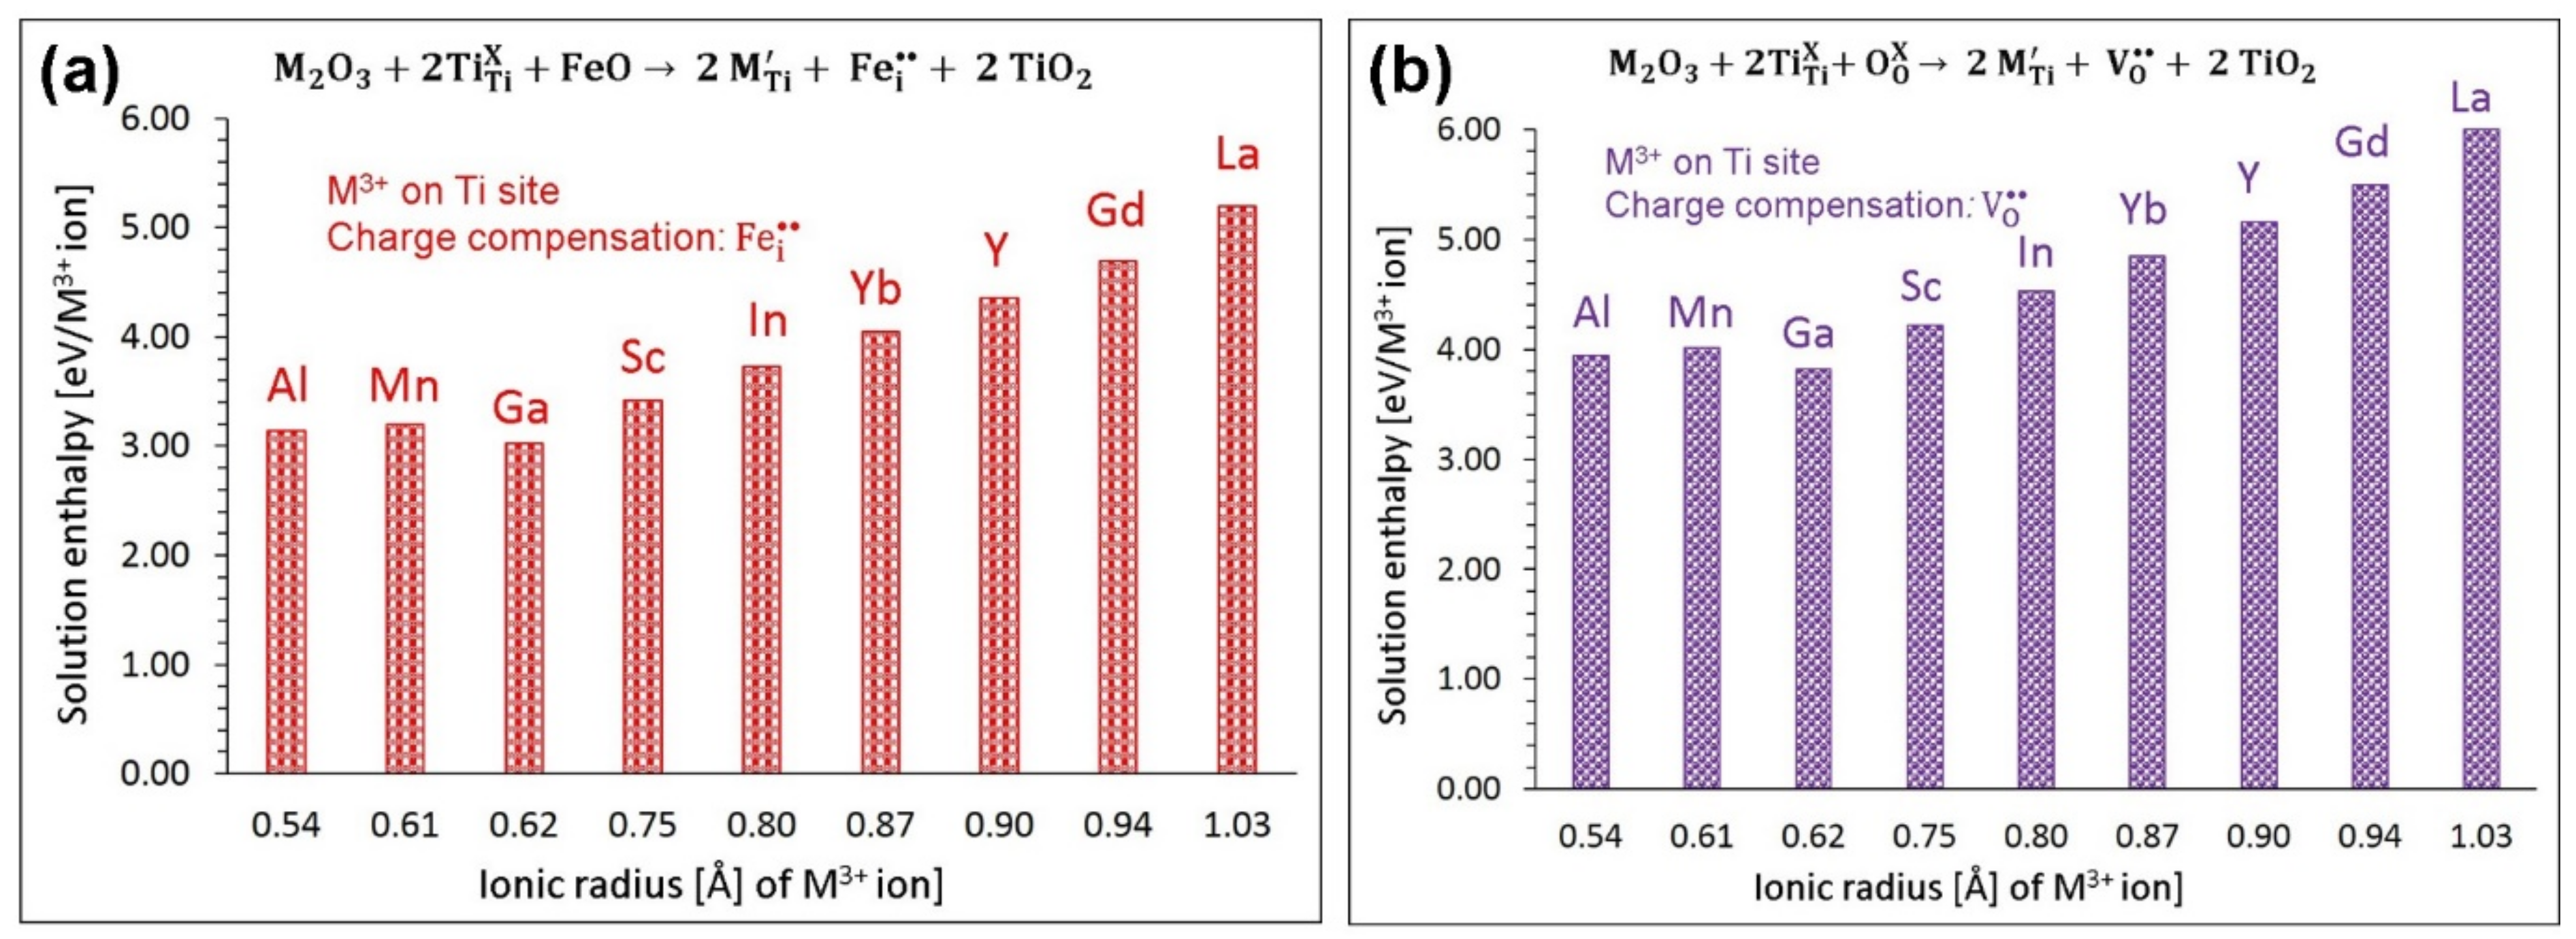
The Ti site was considered for the doping of trivalent dopants. Two different charge compensation schemes were introduced (refer to Figure 6). In the first scheme, additional Fe interstitials were created. This process can be an efficient strategy for increasing the Fe content in FeTiO3. The favorable dopant for this process is Ga3+, although its solution enthalpy is 3.02 eV (refer to Figure 6a). The possible synthesis composition could be Fe1+xTi1−xO3. Solution enthalpies of Al and Mn are higher by only 0.12 eV and 0.18 eV, respectively, compared to that of Al3+, meaning they are also candidate dopants. The favorability of these three dopants can be attributed to their ionic radii that are closer to the ionic radius of Ti4+ (0.61 Å) in an octahedral coordination. The solution enthalpy increases gradually with the ionic radius from Sc to La. The highest solution enthalpy is noted for La3+ (5.20 eV).
In the second scheme, trivalent doping resulted in the formation of oxygen vacancies. This process is important in the formation of FeO via an FeO Schottky-type reaction (Equation (5)). A similar trend in the solution enthalpy is observed as discussed above. The explanation for the trend is applicable here too, although the values are slightly higher than those calculated for the formation of Fe interstitials. The formation of oxygen vacancies in FeTiO3 can be experimentally attempted by doping Ga at the Ti site.

3.4.3. Tetravalent Dopants

Finally, tetravalent dopants (Si4+, Ge4+, Sn4+, Zr4+, and Ce4+) were considered at the Ti. As these dopants are isovalent to Ti4+, charge compensation was not necessary. Figure 7 reports the solution enthalpies and the equation representing the reaction for this process.
Exothermic solution enthalpies could be calculated for Si4+ and Ge4+. This could be due to the smaller radii of Si4+ (0.40 Å) and Ge4+ (0.53 Å) than that of Ti4+ (0.61 Å). The lowest solution enthalpy was calculated for Ge4+. For other dopants (Sn4+, Zr4+, and Ce4+), solution enthalpies increase gradually with the ionic radius due to their larger radii compared to that of Ti4+. An interesting doped configuration to be tested experimentally would be FeTi1−xGexO3.

3.5. Electronic Structures of Doped FeTiO3 Complexes

In order to examine the chemical environment of doped atoms and electronic structures of un-doped and doped configurations, DFT calculations were made. Here, we only discuss the results of the most favorable dopants (Mn2+, Ga3+, and Ge4+) identified in Section 3.4.
In the Mn-doped configuration, Mn‒O bond distances are slightly longer than the Fe‒O distance (refer to Figure 8). This is due to the slight increase (of 0.05 Å) in the ionic radius of Mn2+ compared to that of Fe2+. The total density of states (DOS) plot shows that FeTiO3 is a semiconductor (refer to Figure 8c). The band gaps between α-channels is ~2.00 eV, while that between β-channels is ~2.50 eV. The gap between the α-channel and β-channel is ~0.30 eV. The experimental band gap is ~2.54–2.58 eV [43]. The underestimation is due the inadequate description of self-interaction in different functionals, including GGA‒PBE [44]. As the present study examines the effect of doping with respect to bulk FeTiO3, the value of the band gap is less significant. The doping of Mn does not alter the DOS including the band gap much, except for introducing two peaks arising from the d states of Mn around 2.50 eV in the valence band and 4.0 eV in the conduction band (refer to Figure 8d,e). The charge density associated with the additional peaks of Mn is shown in Figure 8f.
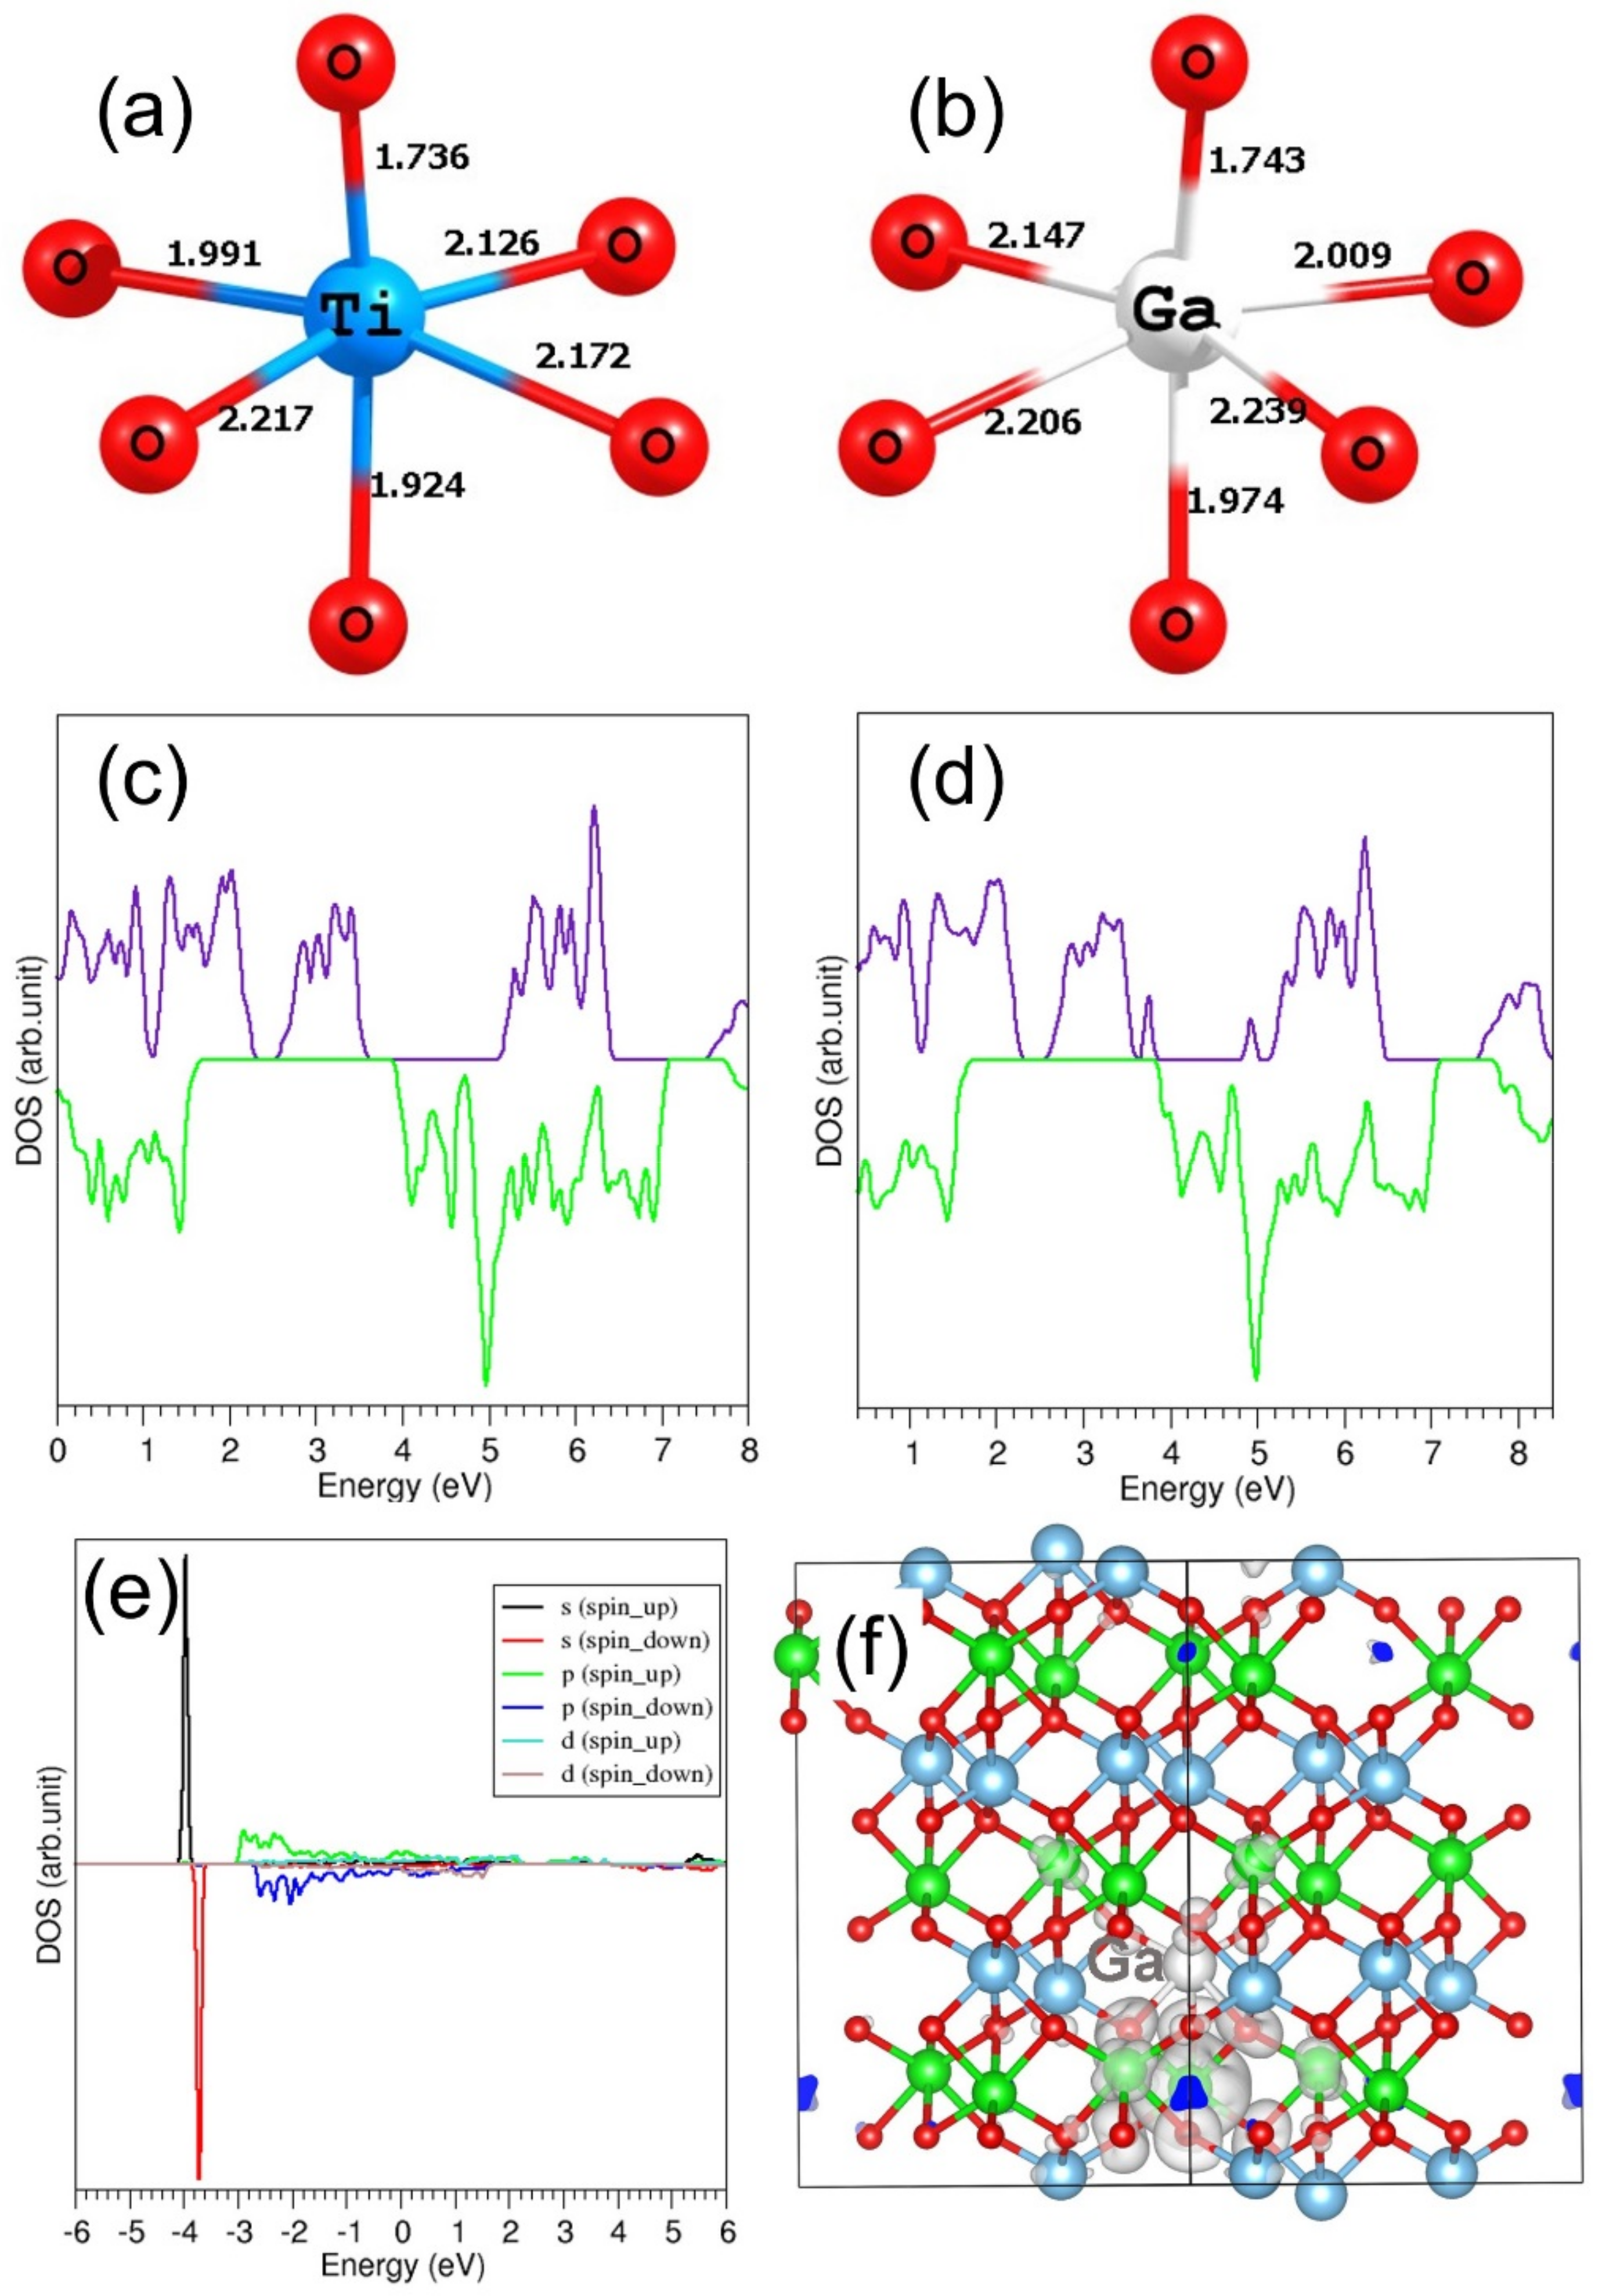
Next, we discuss the electronic structure of Ga-doped FeTiO3. The Ga‒O bond distances are slightly elongated (refer to Figure 9b). This is due to the weak Ga3+‒O2‒ electrostatic attraction compared to that of Ti4+‒O2‒. Deep states that appear at approximately ‒3.75 eV are from s states of Ga (refer to Figure 9e). Doping of Ga3+ at the Ti4+ site should produce an electron in the lattice and the peak associated with that electron can be seen in the band gap (refer to Figure 9d). The location of the electron is near the Ga and shown in Figure 9f.
Finally, the electronic structure of the Ge-doped FeTiO3 will be explained. In general, the Ge‒O bond distances are shorter than the Ti‒O bond distances (refer to Figure 10). This is due to the high charge density of Ge4+ arising from its smaller radius (0.53 Å) than that of Ti4+ (0.61 Å). The band gap regions of both un-doped and doped configurations are almost the same as both Ti and Ge are isovalent atoms. The valence s states of Ge appear further away from the band gap. Figure 10f shows the charge density associated with the deep s states of Ge.

4. Conclusions

In this study, computer modeling techniques were applied to examine the defects, ion diffusion, solution of dopants, and electronic structures of the doped-configurations in FeTiO3. An Fe/Ti anti-site was found to be the most favorable intrinsic defect, leading to the formation of a disordered configuration. The second most stable defect was Fe‒Frenkel, although this defect could only be observed at high temperatures. The fast diffusion of Fe2+ ions with the activation energy of 0.52 eV was calculated. The introduction of additional Fe2+ ions and O vacancies in the as-prepared material was possible by doping Ga3+ at the Ti site. Promising isovalent dopants were predicted to be Mn2+ and Ge4+ at Fe and Ti sites, respectively. Electronic structures of isovalent dopants were not altered significantly in the band gap region. Trivalent dopant Ga3+ introduced a peak in the band gap and this peak corresponded to an electron generated upon the doping of Ga at the Ti site.

Supplementary Materials

The following are available online at https://www.mdpi.com/2075-163X/9/10/610/s1: Table S1: Interatomic potential parameters used in the atomistic simulations of FeTiO3.

Author Contributions

Computation, N.K.; writing, N.K. and R.S.; analysis and editing, P.C.M.F. and A.C.

Funding

This research was financially supported by the European Union’s H2020 Programme under Grant Agreement no. 824072–HARVESTORE.

Acknowledgments

We acknowledge Imperial College for providing high-performance computing facilities.

Conflicts of Interest

The authors declare no conflicts of interest.

References

  1. Premaratne, W.A.P.J.; Rowson, N.A. The Processing of Beach Sand from Sri Lanka for the Recovery of Titanium Using Magnetic Separation. Phys. Sep. Sci. Eng. 2003, 12, 13–22. [Google Scholar] [CrossRef] [Green Version]
  2. Ismail, M.G.M.U.; Amarasekera, J.; Kumarasinghe, J.S.N. The upgrading of ilmenite from SRI lanka by the oxidation-reduction-leach process. Int. J. Miner. Process. 1983, 10, 161–164. [Google Scholar] [CrossRef]
  3. Premaratne, W.A.P.J.; Rowson, N.A. Microwave Assisted Dissolution of Sri Lankan Ilmenite: Extraction and Leaching Kinetics of Titanium and Iron Metals. J. Sci. Univ. Kelaniya Sri Lanka 2015, 9, 1–14. [Google Scholar] [CrossRef]
  4. Edwards, R.; Atkinson, K. Magmatic deposits. In Ore Deposit Geology and Its Influence on Mineral Exploration; Edwards, R., Atkinson, K., Eds.; Springer Netherlands: Dordrecht, The Netherlands, 1986; pp. 18–68. [Google Scholar]
  5. Spitz, K.; Trudinger, J. Mining and the Environment; CRC Press: London, UK, 2019. [Google Scholar]
  6. Filippou, D.; Hudon, G. Iron removal and recovery in the titanium dioxide feedstock and pigment industries. JOM 2009, 61, 36. [Google Scholar] [CrossRef]
  7. Herath, J.W. Mineral resources of Sri Lanka. Eco. Bull. 1975, 2, 1–75. [Google Scholar]
  8. Deep, A.; Malik, P.; Gupta, B. Extraction and Separation of Ti(IV) Using Thiophosphinic Acids and Its Recovery from Ilmenite and Red Mud. Sep. Sci. Technol. 2001, 36, 671–685. [Google Scholar] [CrossRef]
  9. Das, G.; Pranolo, Y.; Zhu, Z.; Cheng, C. Leaching of ilmenite ores by acidic chloride solutions. Hydrometallurgy 2013, 133, 94–99. [Google Scholar] [CrossRef]
  10. Rao, D.S.; Sengupta, D. Electron Microscopic Studies of Ilmenite from the Chhatrapur Coast, Odisha, India, and Their Implications in Processing. J. Geochem. 2014, 2014, 8. [Google Scholar] [CrossRef]
  11. Palliyaguru, L.; Arachchi, N.D.H.; Jayaweera, C.D.; Jayaweera, P.M. Production of synthetic rutile from ilmenite via anion-exchange. Miner. Process. Extr. Metall. 2018, 127, 169–175. [Google Scholar] [CrossRef]
  12. Parapari, P.S.; Irannajad, M.; Mehdilo, A. Modification of ilmenite surface properties by superficial dissolution method. Miner. Eng. 2016, 92, 160–167. [Google Scholar] [CrossRef]
  13. Fan, X.; Rowson, N.A. Fundamental Investigation of Microwave Pretreatment on the Flotation of Massive Ilmenite Ores. Dev. Chem. Eng. Miner. Process. 2000, 8, 167–182. [Google Scholar] [CrossRef]
  14. Fan, X.; Rowson, N.A. The effect of Pb(NO3)2 on ilmenite flotation. Miner. Eng. 2000, 13, 205–215. [Google Scholar] [CrossRef]
  15. Wilson, N.C.; Muscat, J.; Mkhonto, D.; Ngoepe, P.E.; Harrison, N.M. Structure and properties of ilmenite from first principles. Phys. Rev. B 2005, 71, 075202. [Google Scholar] [CrossRef]
  16. Ribeiro, R.A.P.; Camilo, A.; de Lazaro, S.R. Electronic structure and magnetism of new ilmenite compounds for spintronic devices: FeBO3 (B = Ti, Hf, Zr, Si, Ge, Sn). J. Magn. Magn. Mater. 2015, 394, 463–469. [Google Scholar] [CrossRef]
  17. Kishore, N.; Nagarajan, V.; Chandiramouli, R. High-pressure studies on electronic and mechanical properties of FeBO3 (B = Ti, Mn, Cr) ceramics—A first-principles study. Phase Transit. 2018, 91, 382–397. [Google Scholar] [CrossRef]
  18. Carmichael, C.M.; Blackett, P.M.S. The magnetic properties of ilmenite-haematite crystals. Proc. R. Soc. Lond. Ser. A Math. Phys. Sci. 1961, 263, 508–530. [Google Scholar]
  19. Ribeiro, R.A.P.; de Lázaro, S.R. Structural, electronic and elastic properties of FeBO3 (B = Ti, Sn, Si, Zr) ilmenite: a density functional theory study. RSC Adv. 2014, 4, 59839–59846. [Google Scholar] [CrossRef]
  20. Matko, V.; Jezernik, K. Greatly Improved Small Inductance Measurement Using Quartz Crystal Parasitic Capacitance Compensation. Sensors 2010, 10, 3954–3960. [Google Scholar] [CrossRef] [Green Version]
  21. Matko, V. Next generation AT-cut quartz crystal sensing devices. Sensors 2011, 11, 4474–4482. [Google Scholar] [CrossRef]
  22. Jay, E.E.; Rushton, M.J.D.; Chroneos, A.; Grimes, R.W.; Kilner, J.A. Genetics of superionic conductivity in lithium lanthanum titanates. Phys. Chem. Chem. Phys. 2015, 17, 178–183. [Google Scholar] [CrossRef]
  23. Fisher, C.A.J.; Hart Prieto, V.M.; Islam, M.S. Lithium Battery Materials LiMPO4 (M = Mn, Fe, Co, and Ni): Insights into Defect Association, Transport Mechanisms, and Doping Behavior. Chem. Mater. 2008, 20, 5907–5915. [Google Scholar] [CrossRef]
  24. Islam, M.S.; Driscoll, D.J.; Fisher, C.A.J.; Slater, P.R. Atomic-Scale Investigation of Defects, Dopants, and Lithium Transport in the LiFePO4 Olivine-Type Battery Material. Chem. Mater. 2005, 17, 5085–5092. [Google Scholar] [CrossRef]
  25. Kuganathan, N.; Kordatos, A.; Chroneos, A. Li2SnO3 as a Cathode Material for Lithium-ion Batteries: Defects, Lithium Ion Diffusion and Dopants. Sci. Rep. 2018, 8, 12621. [Google Scholar] [CrossRef] [PubMed]
  26. Kuganathan, N.; Kordatos, A.; Fitzpatrick, M.E.; Vovk, R.V.; Chroneos, A. Defect process and lithium diffusion in Li2TiO3. Solid State Ion. 2018, 327, 93–98. [Google Scholar] [CrossRef]
  27. Kuganathan, N.; Chroneos, A. Defects, Dopants and Sodium Mobility in Na2MnSiO4. Sci. Rep. 2018, 8, 14669. [Google Scholar] [CrossRef] [PubMed]
  28. Treacher, J.C.; Wood, S.M.; Islam, M.S.; Kendrick, E. Na2CoSiO4 as a cathode material for sodium-ion batteries: structure, electrochemistry and diffusion pathways. Phys. Chem. Chem. Phys. 2016, 18, 32744–32752. [Google Scholar] [CrossRef]
  29. Kuganathan, N.; Iyngaran, P.; Vovk, R.; Chroneos, A. Defects, dopants and Mg diffusion in MgTiO3. Sci. Rep. 2019, 9, 4394. [Google Scholar] [CrossRef]
  30. Gale, J.D.; Rohl, A.L. The General Utility Lattice Program (GULP). Mol. Simul. 2003, 29, 291–341. [Google Scholar] [CrossRef]
  31. Gale, J.D. GULP: A computer program for the symmetry-adapted simulation of solids. J. Chem. Soc. Faraday Trans. 1997, 93, 629–637. [Google Scholar] [CrossRef]
  32. Mott, N.F.; Littleton, M.J. Conduction in polar crystals. I. Electrolytic conduction in solid salts. Trans. Faraday Soc. 1938, 34, 485–499. [Google Scholar] [CrossRef]
  33. Varotsos, P. Point defect parameters in β-PbF2 revisited. Solid State Ion. 2008, 179, 438–441. [Google Scholar] [CrossRef]
  34. Kresse, G.; Furthmüller, J. Efficient iterative schemes for ab initio total-energy calculations using a plane-wave basis set. Phys. Rev. B 1996, 54, 11169–11186. [Google Scholar] [CrossRef] [PubMed]
  35. Kresse, G.; Joubert, D. From ultrasoft pseudopotentials to the projector augmented-wave method. Phys. Rev. B 1999, 59, 1758–1775. [Google Scholar] [CrossRef]
  36. Monkhorst, H.J.; Pack, J.D. Special points for Brillouin-zone integrations. Phys. Rev. B 1976, 13, 5188–5192. [Google Scholar] [CrossRef]
  37. Perdew, J.P.; Burke, K.; Ernzerhof, M. Generalized Gradient Approximation Made Simple. Phys. Rev. Lett. 1996, 77, 3865–3868. [Google Scholar] [CrossRef] [PubMed] [Green Version]
  38. Press, W.H.; Flannery, B.P.; Teukolsky, S.A.; Vetterling, W.T. Numerical Recipes. The Art of Scientific Computing; Cambridge University Press: Cambridge, UK, 1986; p. 818. [Google Scholar]
  39. Grimme, S.; Antony, J.; Ehrlich, S.; Krieg, H. A consistent and accurate ab initio parametrization of density functional dispersion correction (DFT-D) for the 94 elements H-Pu. J. Chem. Phys. 2010, 132, 154104. [Google Scholar] [CrossRef]
  40. Morosin, B.; Baughman, R.J.; Ginley, D.S.; Butler, M.A. The influence of crystal structure on the photoresponse of iron–titanium oxide electrodes. J. Appl. Crystallogr. 1978, 11, 121–124. [Google Scholar] [CrossRef]
  41. Kröger, F.A.; Vink, H.J. Relations between the Concentrations of Imperfections in Crystalline Solids. In Solid State Physics; Seitz, F., Turnbull, D., Eds.; Academic Press: Cambridge, MA, USA, 1956; Volume 3, pp. 307–435. [Google Scholar]
  42. Varotsos, P.; Miliotis, D. New aspects on the dielectric properties of the alkali halides with divalent impurities. J. Phys. Chem. Solids 1974, 35, 927–930. [Google Scholar] [CrossRef]
  43. Gambhire, A.B.; Lande, M.K.; Rathod, S.B.; Arbad, B.R.; Vidhate, K.N.; Gholap, R.S.; Patil, K.R. Synthesis and characterization of FeTiO3 ceramics. Arab. J. Chem. 2016, 9, S429–S432. [Google Scholar] [CrossRef]
  44. Ribeiro, R.A.P.; de Lazaro, S.R.; Gatti, C. The role of exchange–correlation functional on the description of multiferroic properties using density functional theory: the ATiO3 (A = Mn, Fe, Ni) case study. RSC Adv. 2016, 6, 101216–101225. [Google Scholar] [CrossRef]
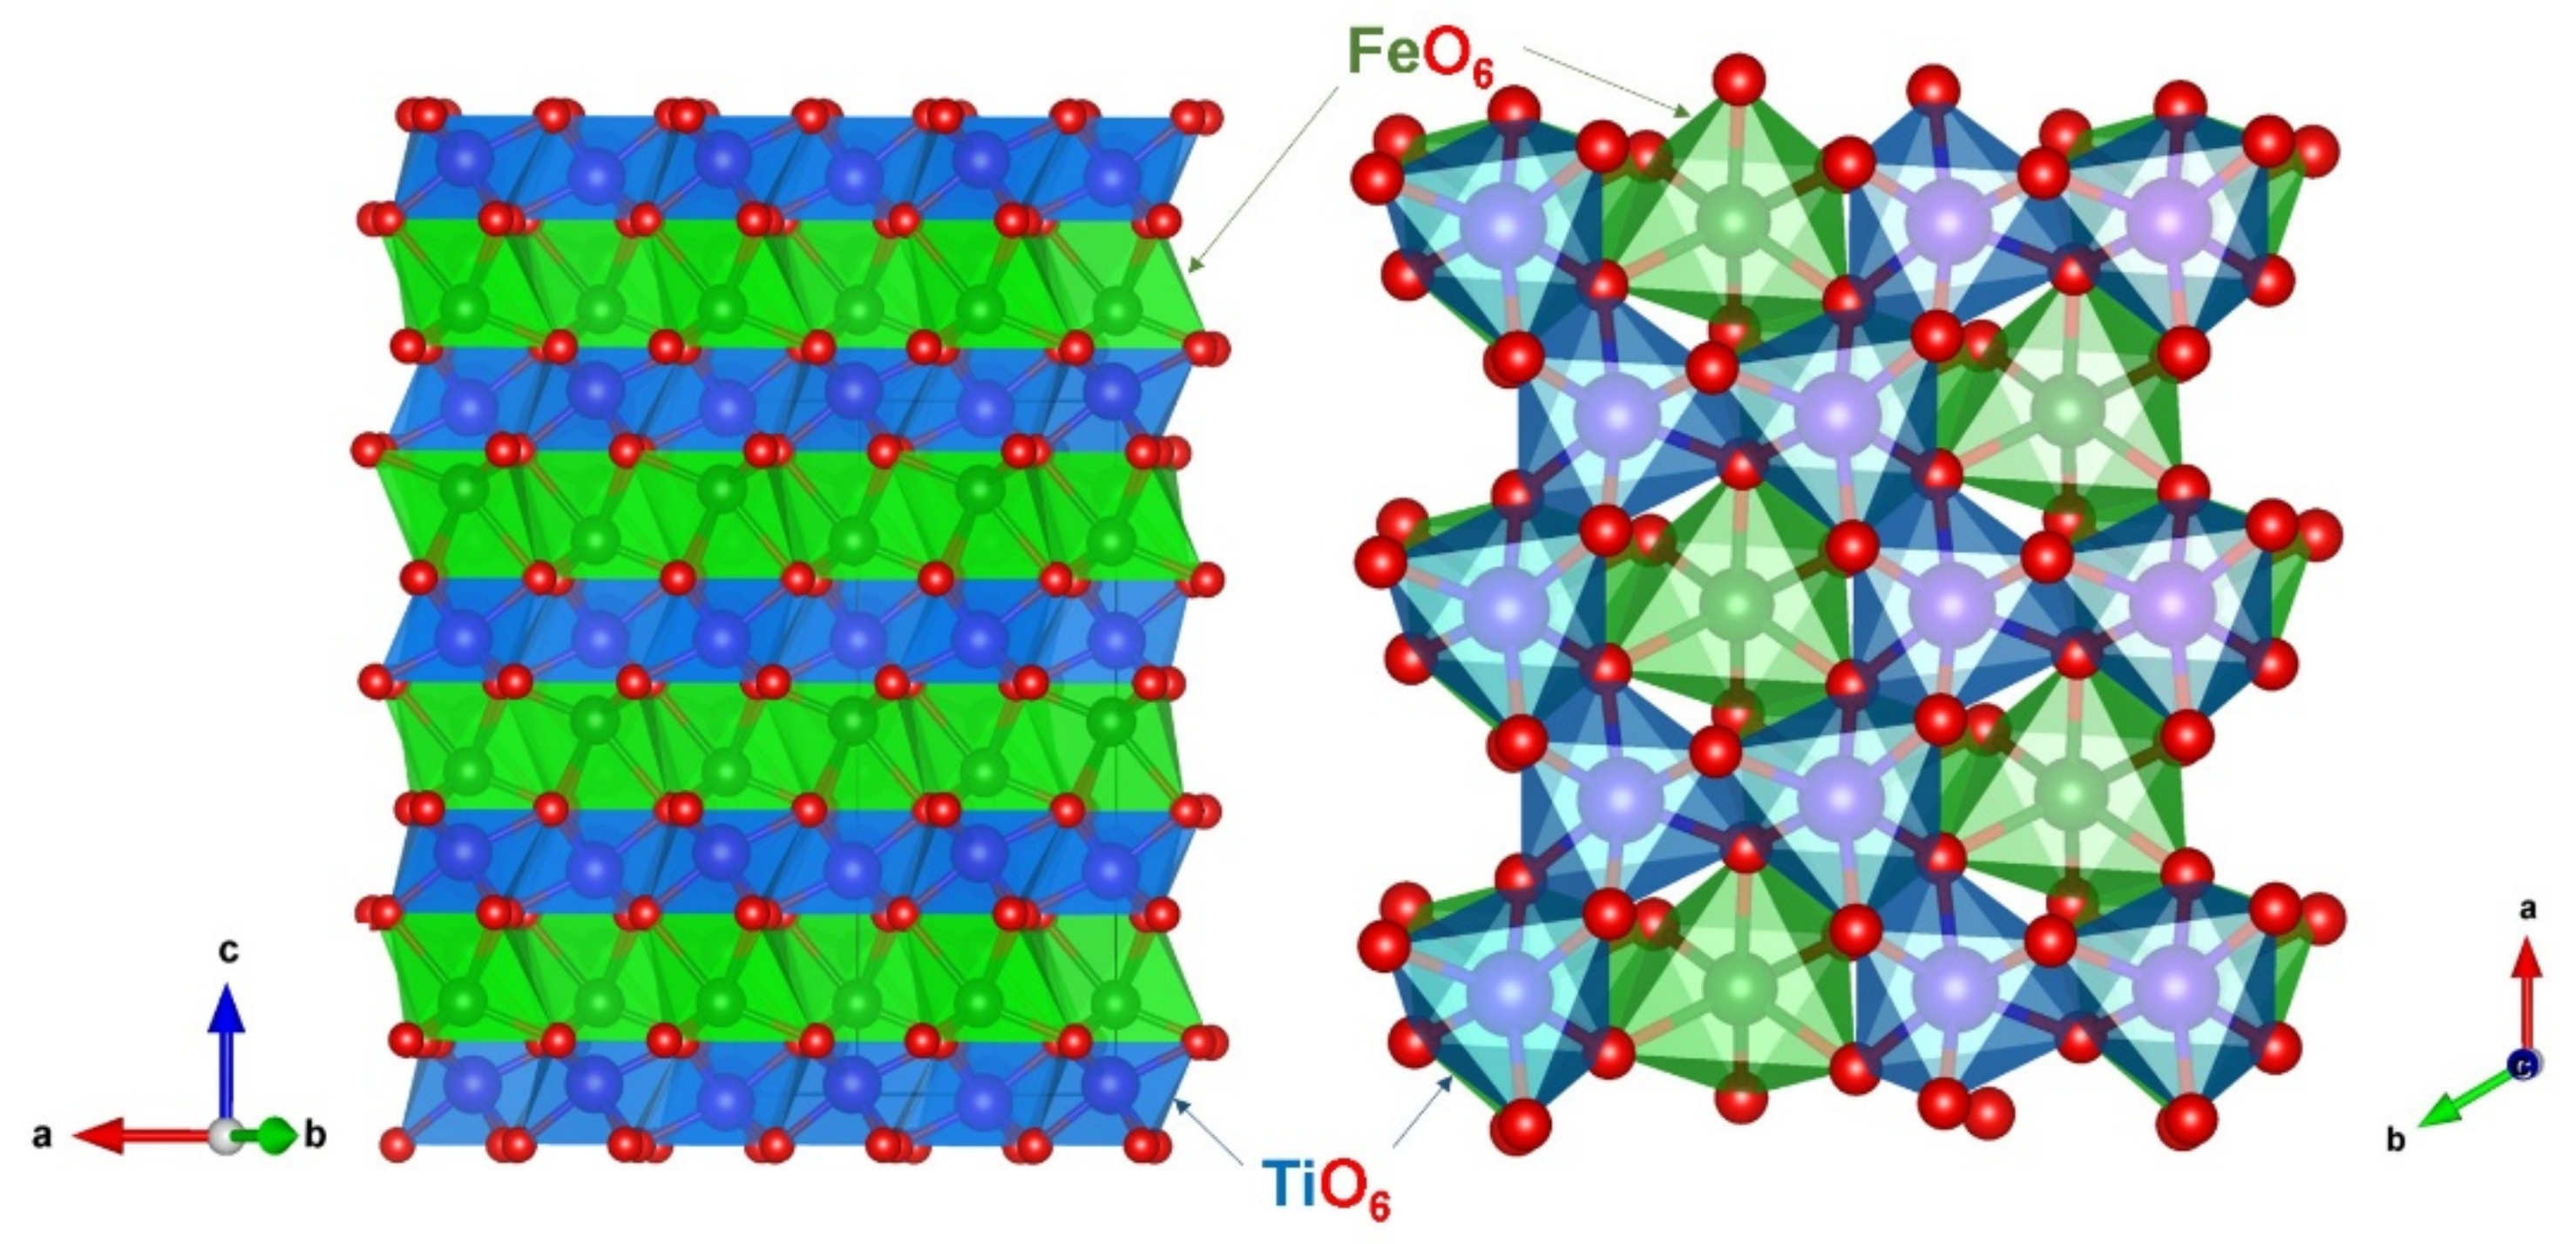
Figure 1. Crystal structure of rhombohedral ilmenite (FeTiO3).
Minerals 09 00610 g001
Figure 2. Schematic diagrams showing vacancy, interstitial, and anti-site defects; and calculation formulae of defect processes.
Minerals 09 00610 g002
Figure 3. Possible long-range iron vacancy migration paths considered. Green and yellow color atoms correspond to different Fe hopping trajectories.
Minerals 09 00610 g003
Figure 4. Two different energy profiles (as shown in Figure 3) of Fe vacancy hopping between two adjacent Fe sites in FeTiO3. Letters A and B are Fe-Fe local hops as shown in Figure 3.
Minerals 09 00610 g004
Figure 5. Enthalpy of solution of MO (M = Ni, Zn, Co, Mn, Ca, Sr, and Ba) with respect to the ionic radius of M2+ in FeTiO3.
Minerals 09 00610 g005
Figure 6. Solution enthalpies of M2O3 with respect to the ionic radius of M3+ at the Ti site forming (a) Fe interstitials and (b) O vacancies.
Minerals 09 00610 g006
Figure 7. Solution enthalpies of MO2 with respect to the ionic radius of M4+ at the Ti site.
Minerals 09 00610 g007
Figure 8. (a) FeO6 octahedral unit showing bond lengths in the relaxed un-doped FeTiO3, (b) MnO6 unit in the configuration of Mn2+ doped at the Fe site, (c) total density of states (DOS) of FeTiO3, (d) total DOS of Mn-doped FeTiO3, (e) atomic DOS of Mn, and (f) constant charge density plot associated with the atomic DOS of Mn.
Minerals 09 00610 g008
Figure 9. (a) TiO6 octahedral unit showing bond lengths in the relaxed un-doped FeTiO3, (b) GaO6 unit in the configuration of Ga3+ doped at the Ti site, (c) total density of states (DOS) of FeTiO3, (d) total DOS of Ga-doped FeTiO3, (e) atomic DOS of Ga, and (f) constant charge density plot associated with the electron formed.
Minerals 09 00610 g009
Figure 10. (a) TiO6 octahedral unit showing bond lengths in the relaxed un-doped FeTiO3, (b) GeO6 unit in the configuration of Ge4+ doped at the Ti site, (c) total density of states (DOS) of FeTiO3, (d) total DOS of Ge-doped FeTiO3, (e) atomic DOS of Ge, and (f) charge density plot associated with the deep s states of Ge.
Minerals 09 00610 g010
Table 1. Calculated structural parameters and corresponding experimental values reported for rhombohedral FeTiO3.
ParameterCalculatedExperiment [40]|∆| (%)
Force FieldDFTForce FieldDFT
a = b (Å)5.14655.07245.08701.170.29
c (Å)13.859314.006614.04201.300.25
α = β (°)90.0090.0090.000.000.00
γ (°)120.0120.0120.00.000.00
Table 2. Calculated energies of Schottky, Frenkel, and anti-site defects.
Defect ProcessDefect Energy (eV)Defect Energy (eV)/Defect
Fe Frenkel/18.404.20
Ti Frenkel/219.589.79
O Frenkel/39.024.51
Schottky/430.646.13
FeO Schottky/59.984.99
TiO2 Schottky-like/621.067.02
Fe/Ti anti-site (isolated)/74.522.26
Fe/Ti anti-site (cluster)/81.100.55
Table 3. Fe‒Fe distances and their corresponding activation energies for the Fe ion migration in FeTiO3, as reported in Figure 3.
Migration PathFe‒Fe Separation (Å)Activation Energy (eV)
A3.140.52
B3.600.69