Article

Fluid Inclusion and Oxygen Isotope Characteristics of Vein Quartz Associated with the Nabeba Iron Deposit, Republic of Congo: Implications for the Enrichment of Hypogene Ores

1
School of Civil and Environmental Engineering, University of Science and Technology Beijing, Beijing 100083, China
2
Key Laboratory of High-Efficient Mining and Safety of Metal Mines, Ministry of Education, Beijing 100083, China
3
Geological Engineering Department, University of Mines and Technology, P.O. Box 237, Tarkwa, Ghana
*
Author to whom correspondence should be addressed.
Minerals 2019, 9(11), 677; https://doi.org/10.3390/min9110677
Submission received: 7 August 2019 / Revised: 28 October 2019 / Accepted: 30 October 2019 / Published: 2 November 2019
(This article belongs to the Section Mineral Deposits)

Abstract

:
The Nabeba iron ore deposit is located at the northern part of Congo Craton, Republic of Congo. The ore deposit consists of supergene and hypogene ores, both of which are hosted in the Precambrian Nabeba banded iron formation (BIF). This study focuses on the hypogene iron ore mineralization associated with quartz veins in the Nabeba deposit, for which two hypogene ore stages have been recognized based on geologic and petrographic observations: early-stage high-grade hematite-rich ore (HO-1) and late-stage magnetite-rich ore (HO-2). Based on microthermometric measurements and laser Raman spectroscopy of the fluid inclusions, the H2O-NaCl ± CO2 fluids interacting with the Nabeba BIF at the HO-1 stage evolve from high-to-moderate temperatures (203–405 °C) and contrasting salinities (moderate-to-low: 1–15 wt. % NaCl equiv.; high: 30–35 wt. % NaCl equiv.) to H2O-NaCl fluids of moderate-to-low temperatures (150–290 °C) and salinities (1–11 wt. % NaCl equiv.) for the HO-2 ore stage. Assuming equilibrium oxygen isotopic exchange between quartz and water, the δ18Ofluid values range from 4.7–8.1‰ for the HO-1 stage and −2.3‰ to −1.5‰ for the HO-2 stage. This implies the ore-forming fluid of initially-mixed metamorphic–magmatic origin, later replenished by seawater and/or meteoric water during the formation of the HO-2 stage. These mixtures of different fluids, coupled with their interaction with the BIF lithology followed by phase separation, are responsible for the enrichment of hypogene iron ore in the Nabeba deposit.

Graphical Abstract

1. Introduction

Precambrian banded iron formations (BIFs) are known to host the world’s largest and richest iron deposits attractive for exploration [1,2]. Iron ore deposits in BIFs commonly form by supergene weathering under tropical conditions and by interaction with low-temperature (meteoric) fluids. However, some deposits have been considered to precipitate from high-temperature hypogene hydrothermal fluids [3,4,5,6,7].
The Nabeba iron deposit, hosted in a Precambrian BIF, is located in the northwestern edge of the Congo Craton and in the Ivindo Basement Complex (IBC) of the Souanké district of the Republic of Congo (Figure 1). Previously, the deposit was thought to contain only supergene ores (>62.3% Fe) and itabirite-type BIFs (34% Fe) [8]. However, subsequent drilling and core retrieval revealed hypogene hematite-rich (~55% Fe) and hypogene magnetite-rich ore (~45% Fe) associated with quartz veins below the supergene and itabirite-type mineralization [9,10].
In this paper, we present fluid inclusion and oxygen isotope data from these veins with the aim of reconstructing the nature of the hydrothermal fluids and physico-chemical processes that were involved in the iron ore enrichment.

2. Geological Setting

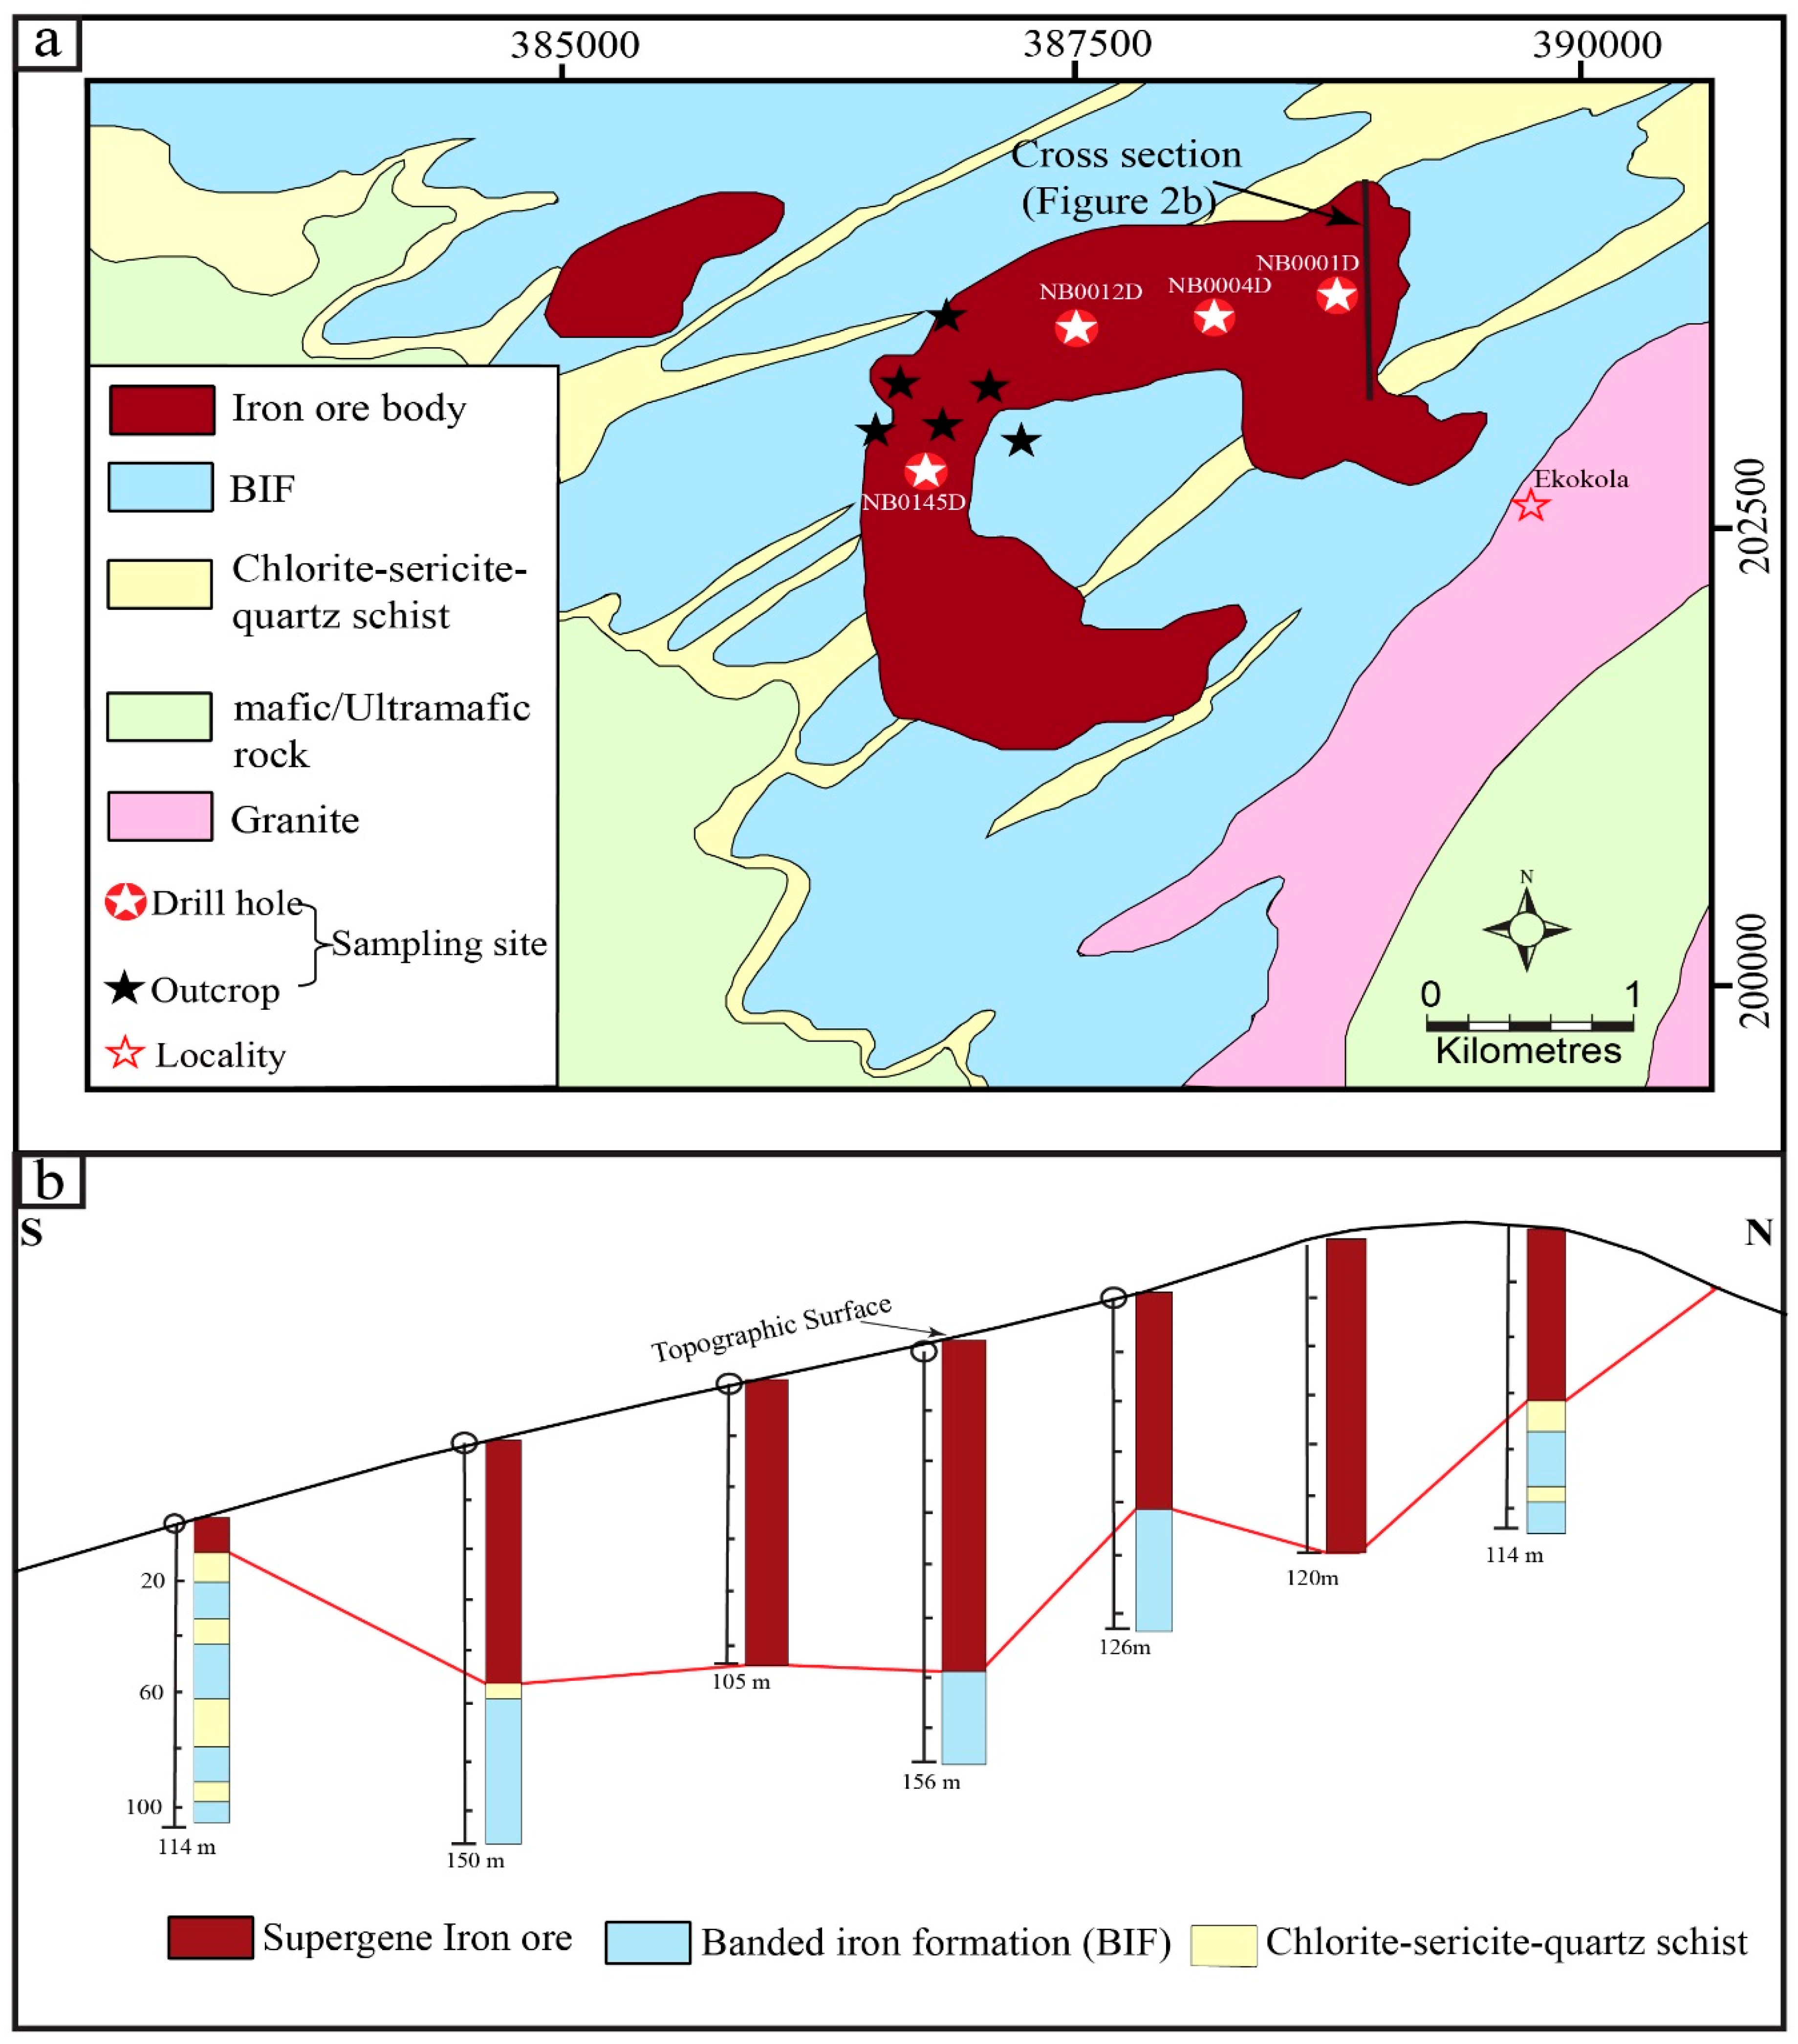
The Nabeba deposit, about 80 km from Souanké district, is a part of the Archean supracrustal rocks of IBC [11,12] (Figure 1), which includes banded-iron formations, sericitic and chloritic quartz schists, amphibolites and mafic to intermediate volcanic rocks (Figure 2), and intrusives such as syenite and alkaline microsyenite, fine-grained doleritic gabbro, porphyroid granite, and peridotite-pyroxenolite lenses [13]. In some sections of the deposit, the BIF alternates with chlorite-albite-carbonate-quartz schist and chlorite-sericite-quartz schist (greenstones) to a depth of about 80 m. The association with volcanic rocks and the dominant mineralogy of magnetite and hematite-rich bands renders the Nabeba deposit as an oxide facies Algoma-type BIF [9,10].
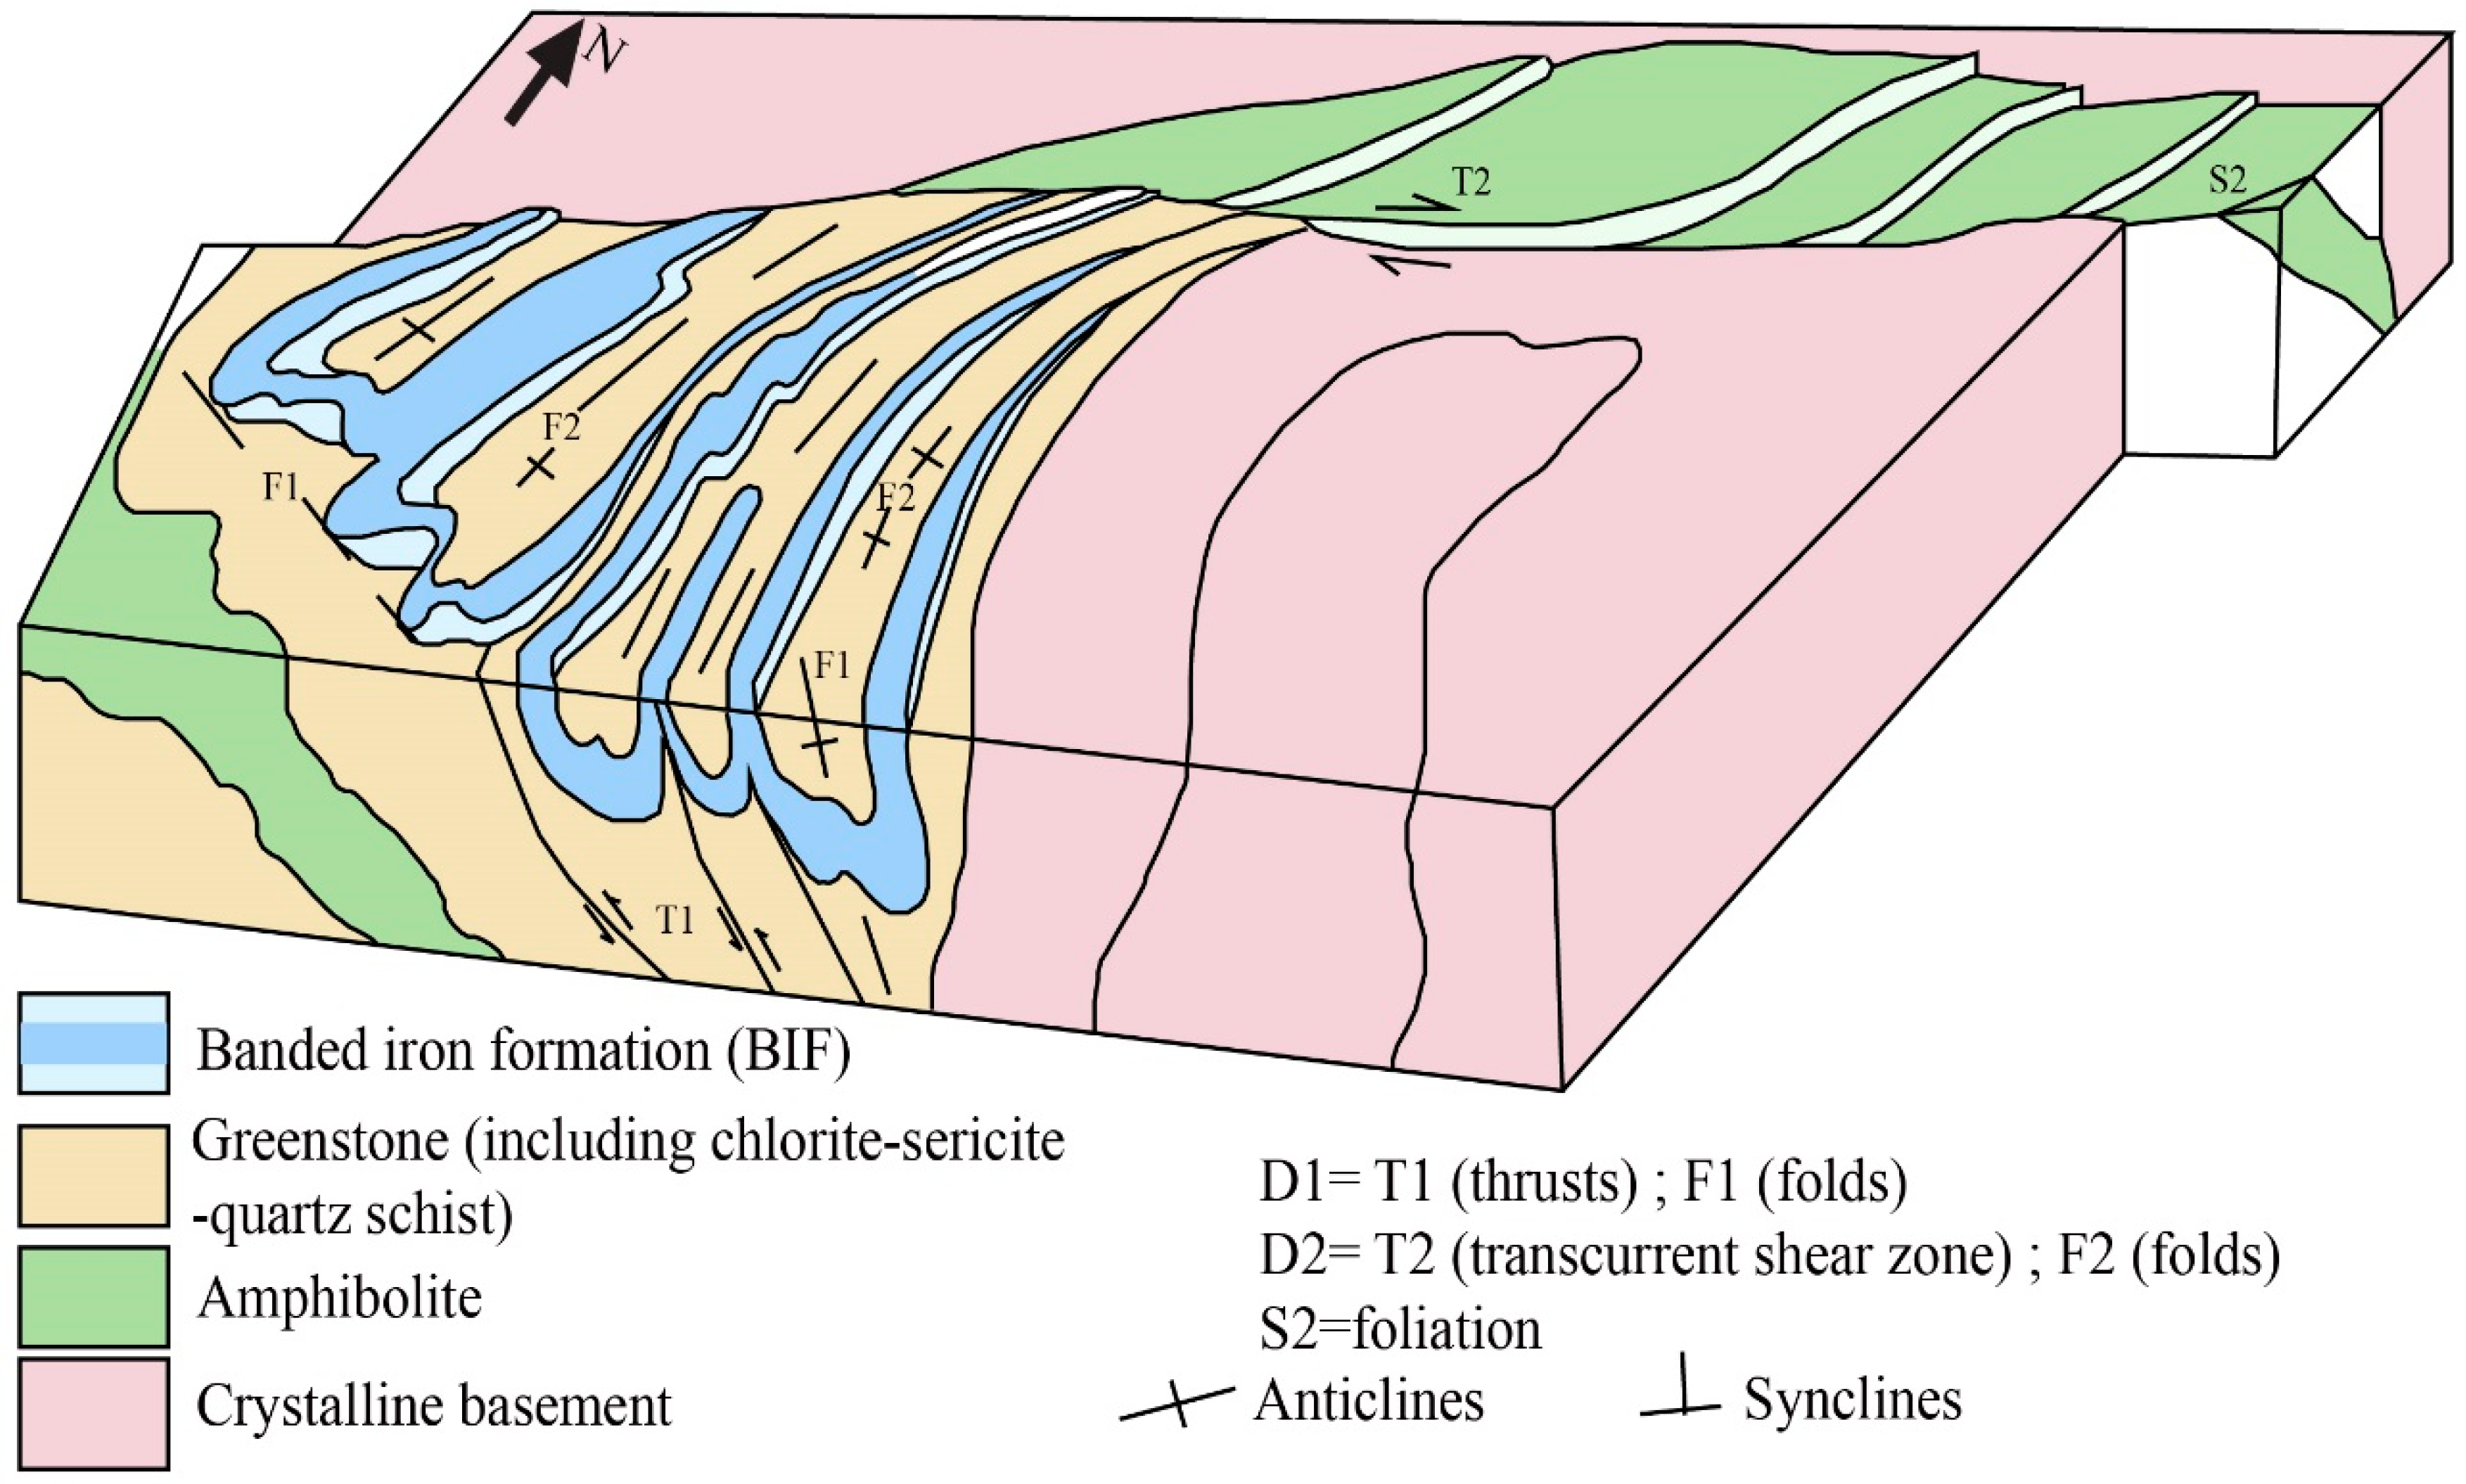
The Nabeba area was interpreted as a structurally-dismembered, fan-shaped set of convex North-East-striking imbricate thrusts or reverse faults, coalescing into an East-West-trending regional shear zone to the north of the deposit [8,9]. The BIFs are deformed to upright, tight to isoclinal, large-scale folds with flat plunges to the northeast and southwest. Centimeter- to decimeter-scale parasitic folds mimic the large-scale fold geometry [8] (Figure 3).
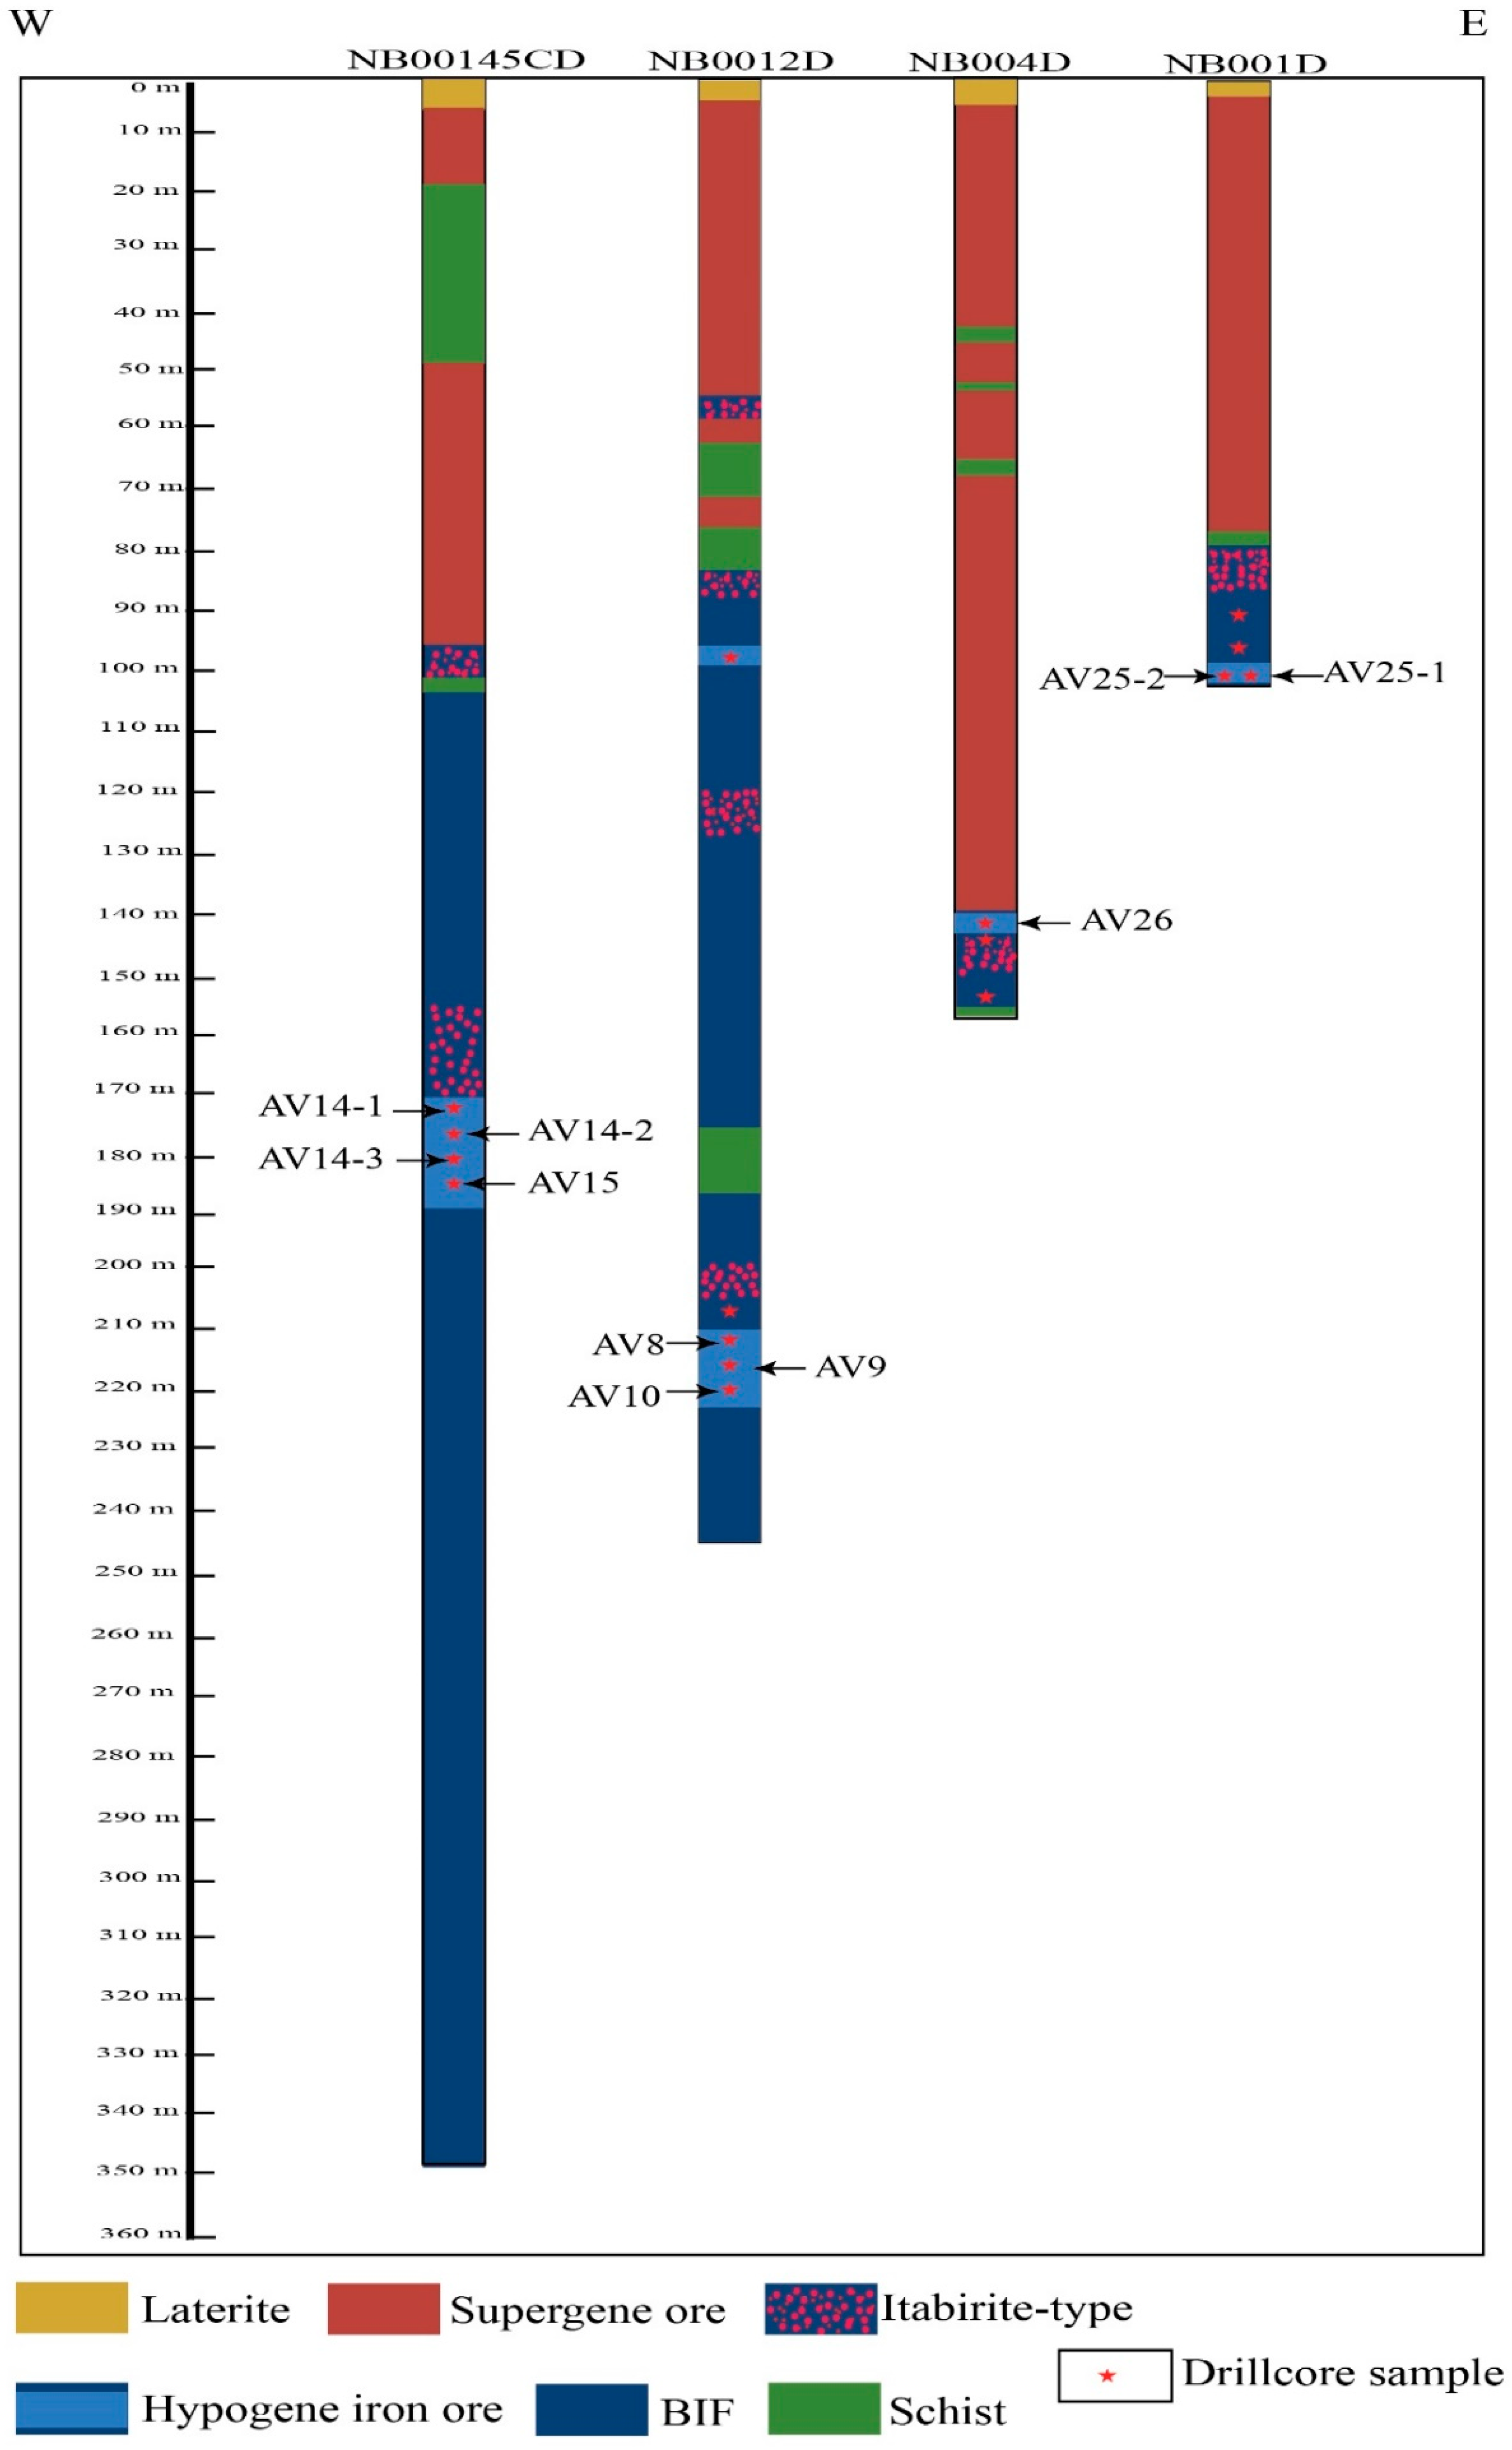
The structural deformation of the banded iron formations (BIFs) in the Nabeba area was overprinted hydrothermally. As shown in Figure 4, the vertical zonation of the deposit comprises three types of genetically-distinguishable iron ores: (1) Supergene goethite-hematite ore, (2) itabirite-type mineralization (hematite-enriched BIF), and (3) hypogene iron ore.

3. Sampling and Analytical Methods

Sampling for this study was carried out on fifteen drill cores that intersected the Nabeba BIF of contrasting ore grades and partly associated with the quartz veins.
To determine the mineral assemblages and the mineral paragenetic sequence, forty-four thin sections were prepared. Petrographic and mineral compositional analyses were conducted on the prepared samples using the reflected and transmitted light Olympus BX 51 microscope, scanning electron microscope (SEM) (Phenom-World B.V, Eindhoven, The Netherlands), and electron probe microanalysis (EPMA) (JEOL’s EPMA technologies, London, UK). A total of twelve doubly-polished sections were prepared. Petrographic descriptions were undertaken using an Olympus BX 51 microscope (Olympus Corporation, Tokyo, Japan) to define fluid inclusions types, sizes, morphologies, and assemblages. Microthermometric analyses were conducted using a Linkam THMSG600 (Linkam, London, UK) freezing–heating stage with a TMS 93 temperature controller (Linkam, London, UK), fitted on an Olympus BX 51 transmitted light microscope, at the Key Laboratory of the Department of Mineral Resources Engineering at the University of Science and Technology, Beijing. The unit operates in the temperature range of −190° to +600 °C. The stage was calibrated with Linkam synthetic fluid inclusion standards: pure H2O and mixed H2O–CO2. The cyclic technique [14] was used to acquire better precision in measurements of the temperatures of phase transitions. The accuracy of the freezing measurement runs was about ±0.1 and ±1 °C for heating runs between 200 and 500 °C. The precision for microthermometric measurements below 200 °C was ±0.2 °C. The following temperatures were recorded: (a) ice melting (Tm_ice); (b) halite dissolution (Tm_halite); (c) CO2 melting (Tm_CO2); (d) partial homogenization of CO2-rich phase (Th_CO2); (e) clathrate melting (Tm_clathrate); and, (f) total homogenization (Th_total). Calculations of fluid inclusion salinity (from Tm_ice, Tm_halite, and Tm_clathrate), density (from Th_CO2 and Th_total), and pressure-temperature (P–T) isochore slopes were made using worksheets of Steele-MacInnis et al. [15] for aqueous inclusions (HOKIEFLINCS_H2O-NaCl), Steele-MacInnis [16] for aqueous-carbonic inclusions, and Hansteen and Klügel [17] for monophase CO2 inclusions. Salinity is reported in equivalent weight percentages of NaCl (wt. % NaCl equiv.), and density as g/cm3.
Raman spectroscopy was used to qualitatively determine the composition of gases to complement the data acquired from fluid inclusion microthermometry. Raman spectra were obtained on a Jobin Yvon/Horiba LABRAM-HR 800 spectrometer (Horiba Jobin Yvon Ltd., Longjumeau, France) equipped with a tunable Ar + laser, with power up to 50 mW and with notch filters at 488 and 514 nm. The Raman signal was collected by a BX-51 Olympus microscope using 100× objectives. The lateral resolution was better than 2 μm, the acquisition time ranged from 10 to 120 s, and the accumulation number was 10. Collected Raman spectra were analyzed and optimized with Labspec 4.18 and Origin 8.0. Background was removed and peaks deconvoluted using the mathematical methods of Cadusch et al. [18]. Measurements were performed at the Raman Laboratory in the Beijing Research Institute of Uranium Geology.
For oxygen isotope study, seven samples of vein quartz were carefully selected from Veins A and B under a binocular microscope (~1 g for each sample) and crushed into 200 mesh. After, the crushed samples were reacted with BrF5 at 500–700 °C to liberate oxygen. The oxygen was converted to CO2 gas on a platinum-coated carbon rod and the oxygen isotope composition of CO2 gas was determined using a Finnigan MAT-253 mass spectrometer (Thermo Finnigan GmbH, Bremen, Germany) at the Analytical Laboratory, Beijing Research Institute of Uranium Geology. The isotopic data are reported relative to the standard mean ocean water (SMOW). The analytical precision is better than 0.2‰ for δ18O. The δ18O values of water in equilibrium with the hydrothermal quartz were calculated using the equation of Clayton et al. [19] using the minimum trapping temperatures of fluid inclusions in the same quartz samples.

4. Results

4.1. Ore Mineral Parageneses

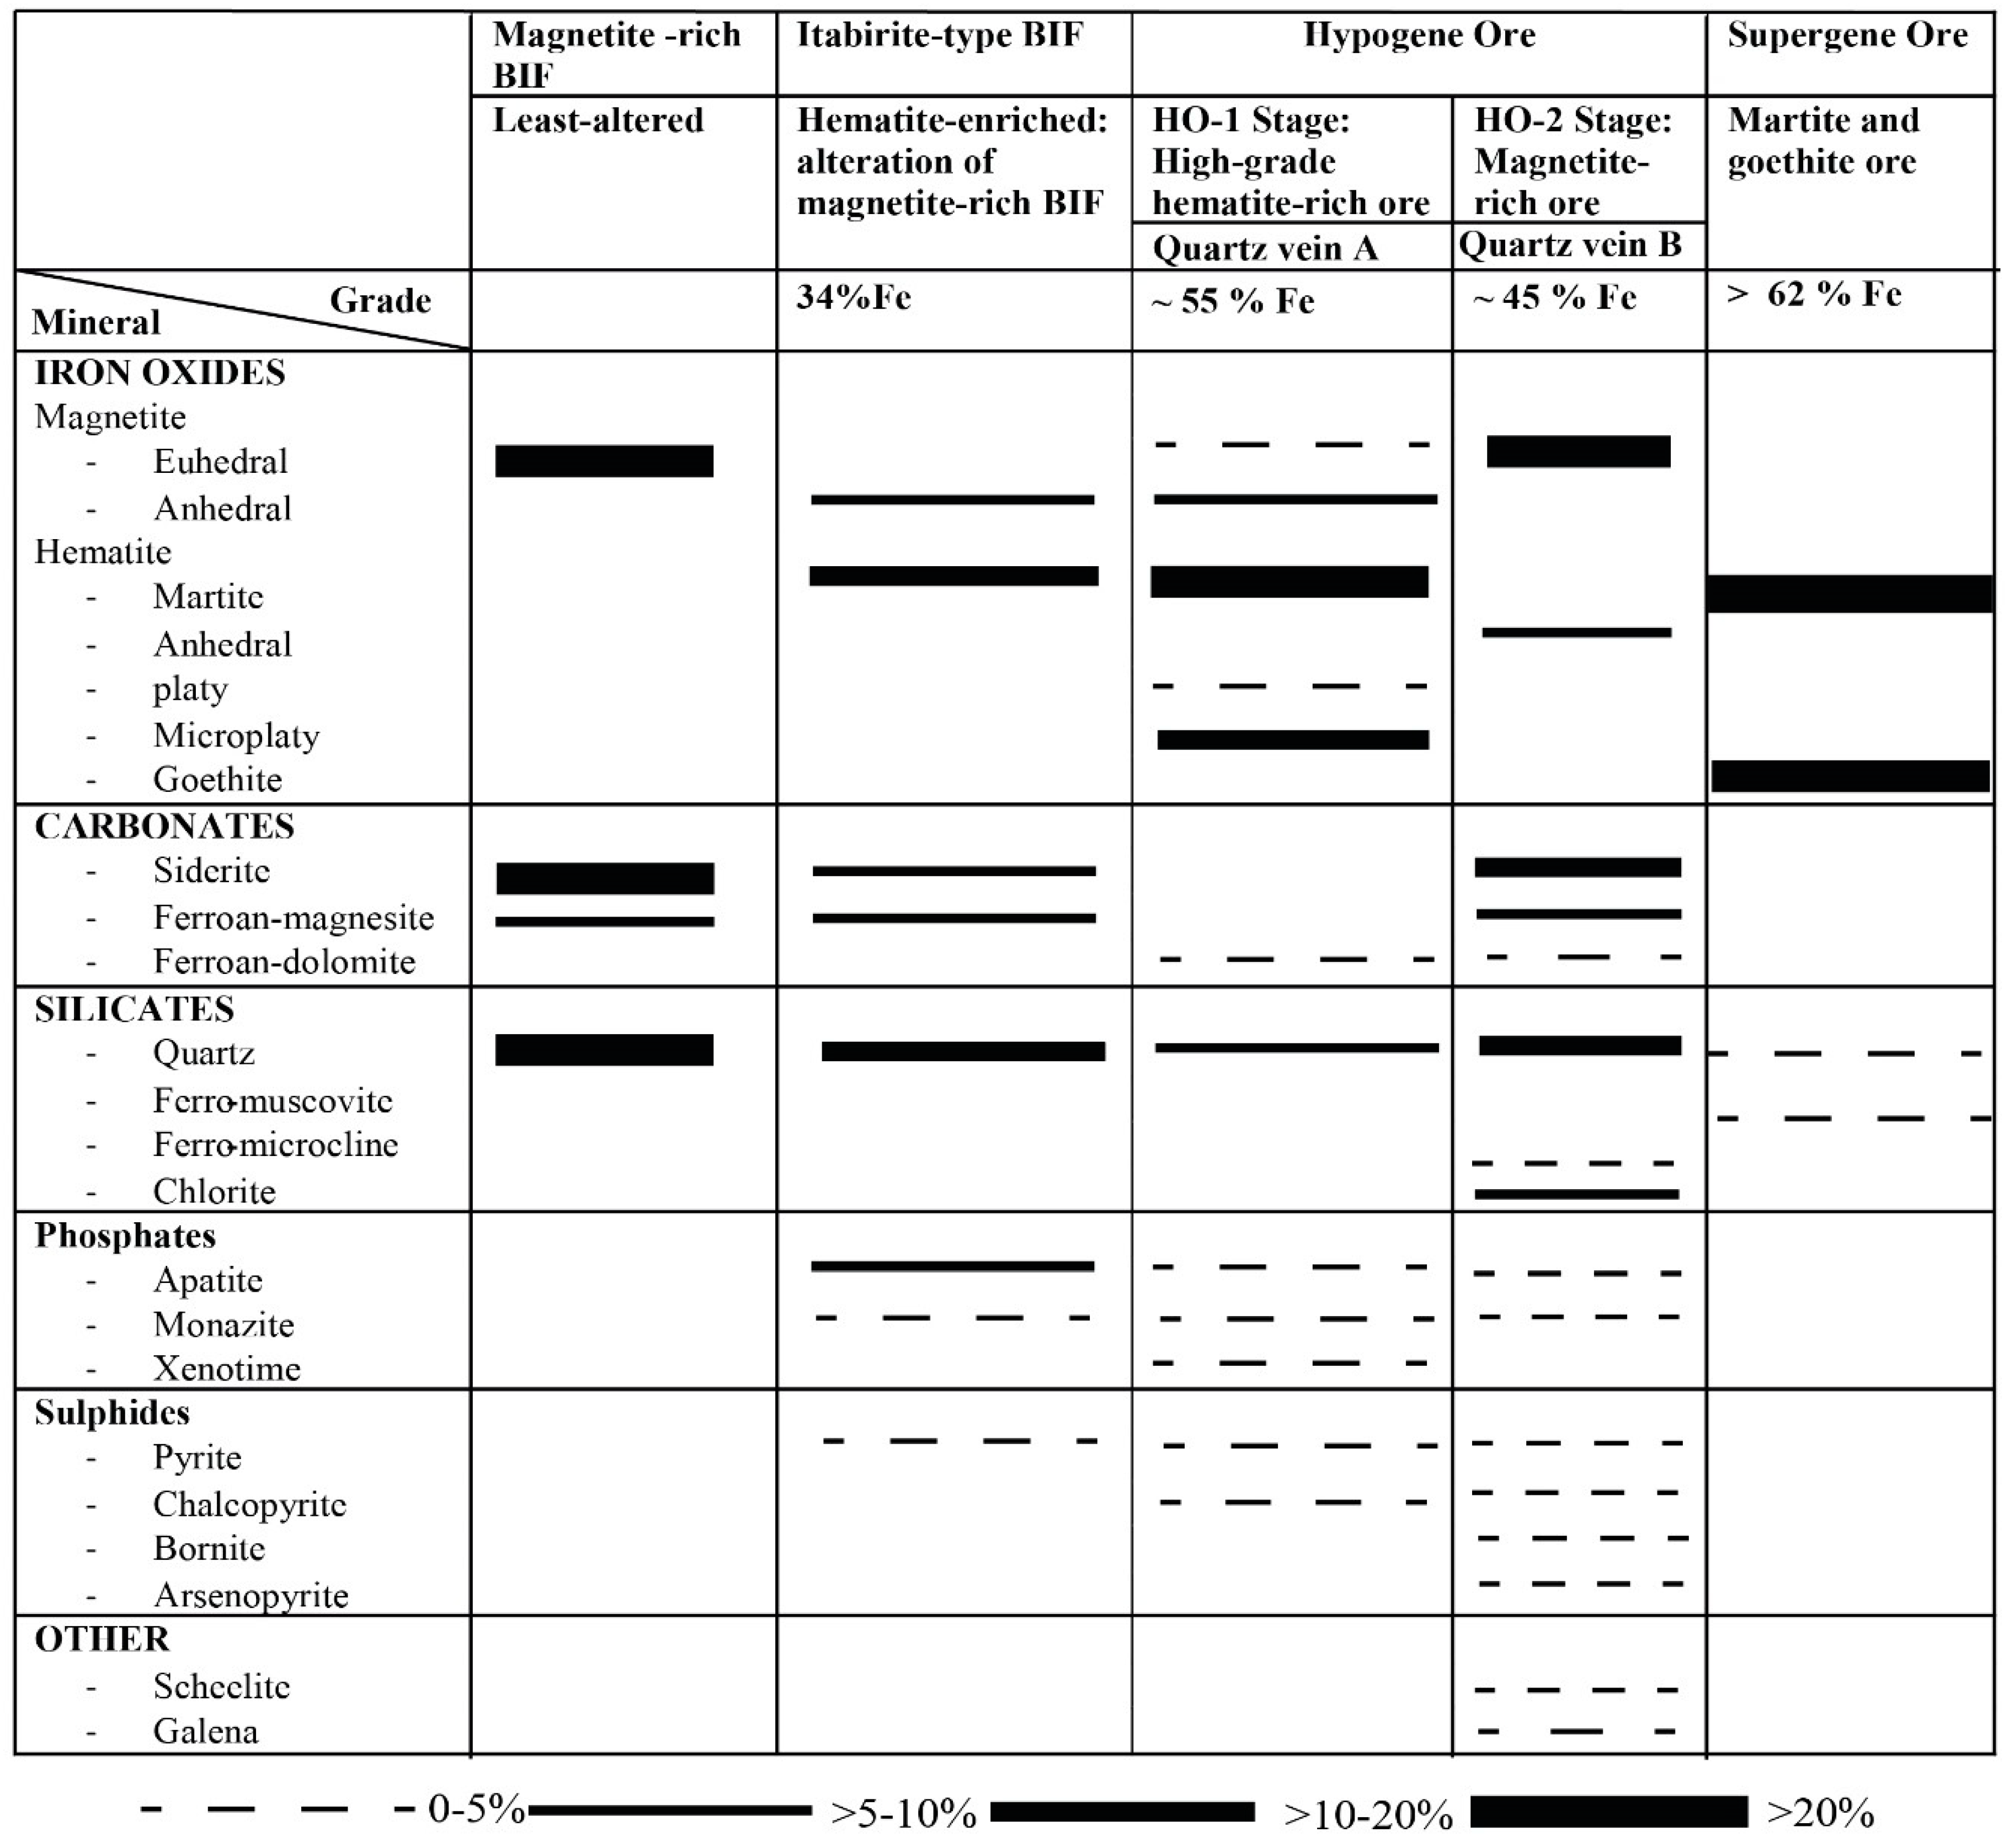
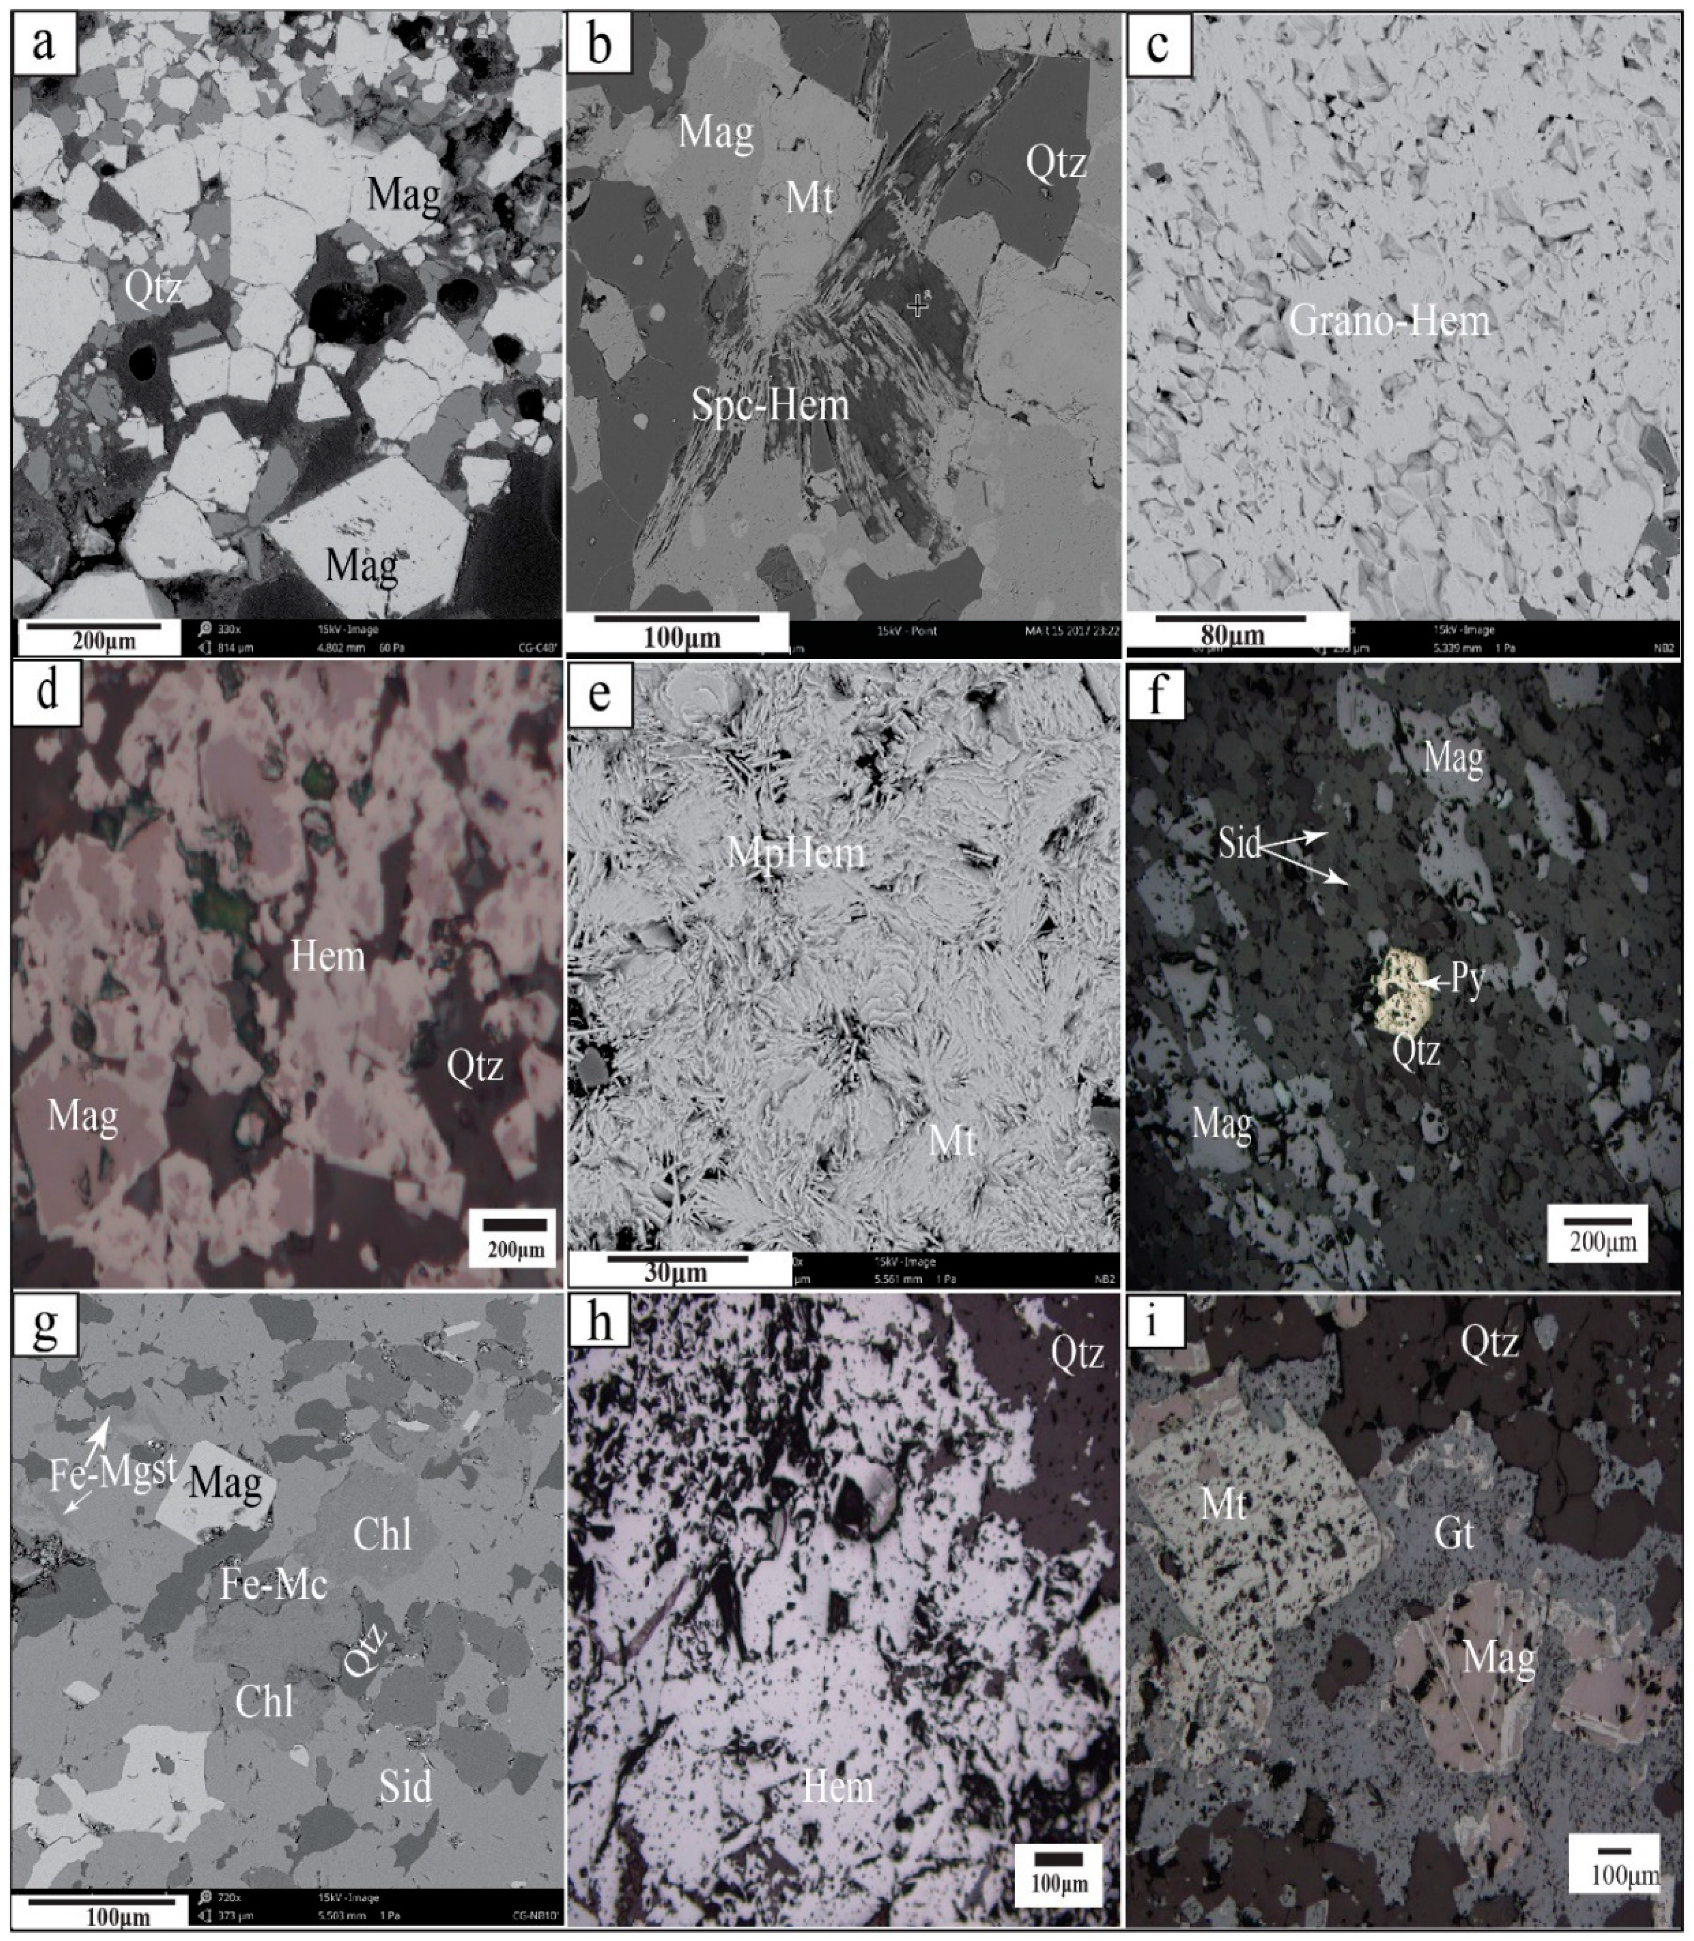
The paragenetic sequence in the least-altered Nabeba BIF (magnetite-rich), through the itabirite-type, hypogene and supergene ores, is shown in Figure 5.
The itabirite-type mineralization (Figure 6) is considered to have formed primarily by metamorphic alteration of the original magnetite-rich Nabeba BIF (Figure 7a). The ore consists primarily of coarser grains of quartz and magnetite replaced by hematite. In some BIF sections, siderite-ferroan magnesite are also abundant, containing accessory pyrite, fluorapatite, xenotime, monazite, ferri-muscovite, ferroan-dolomite, arsenopyrite, sphalerite, and chalcopyrite.
The hypogene iron ore enrichment (HO), within alternating bands of grey-to-white quartz and brown-to-dark brown iron oxide (Figure 6), occurs below the supergene and itabirite-type mineralization. The HO is subdivided into: early high-grade hematite-rich stage (HO-1) and late magnetite-rich stage (HO-2).
High-grade hypogene hematite-rich ore of the early HO-1 stage is consistently sub-vertical and sub-parallel to BIF bedding. The ore comprises steeply South-dipping zones of hard and massive hematite and local occurrences of specularite (Figure 7b). Hematite is commonly fine- to medium-grained, with sheaves of fine specularite and cm-scale vugs lined with specularite. The high-grade hypogene massive iron ore consists mostly of granoblastic and tabular hematite (Figure 7c). Relics of magnetite and subhedral to euhedral magnetite (Figure 7d), present in this stage, represent the earliest iron oxide mineral of the BIF, enclosed in hematite (martite). The presence of hard martite-microplaty hematite is noted also in this ore stage (Figure 7e). These high-grade hypogene hematite ores are in direct contact with quartz (Figure 7c–e).
The late hypogene magnetite-rich ore of stage HO-2 (Figure 7f,g) is the product of nucleation of magnetite crystals that remained after direct removal (or leaching) of silica from primary quartz-magnetite bands by the hydrothermal fluids. In this stage, the ore is composed of massive magnetite and hematite (Figure 7f,h); and the gangue minerals consist of fine-grained siderite, ferroan magnesite, chlorite, (Figure 7g), apatite, and monazite.
The supergene ore consists of dispersed hematite-goethite ± limonite-quartz-clay, with high-grade areas dominated by hematite. Some areas also contain hematite-martite, which is the result of the replacement of the least-altered BIF by supergene hematite-goethite (Figure 7i). Most of the goethite replaces hematite and magnetite along grain boundaries and fractures (Figure 7i).

4.2. Quartz Veins Associated with Nabeba Hypogene Iron Ore

The quartz vein systems (Figure 8) in the Nabeba deposit are constrained by different structural features that are closely associated with the formation of the hypogene ores. Two major types of quartz veins are recognized and labelled as quartz veins A and B, on the basis of crosscutting relationships that suggest the quartz vein A is older than the quartz vein B. The morphology of each vein system are defined by the lithology and deformation affecting the BIF.
Quartz vein A is considered to be related to the hypogene hematite-rich ore of stage HO-1. The vein is conformable with the S0 bedding plane of the BIF and seems to develop a divide along contact with the BIF (Figure 8a–c). The orientation of the vein is sub-parallel and concordant to the high-grade hematite-rich ore. In highly deformed sections, it is boudinaged and appears oblique to the hematite ore.
Quartz vein B is related to the hypogene magnetite-rich ore of the stage HO-2 (Figure 8d). About 1 to 4 cm thick veinlets of quartz vein B are observed to crosscut folded bands of magnetite-rich ore and appear to be discordant with the hypogene magnetite-rich ore.

4.3. Fluid Inclusion Study

In this study, fluid inclusions were genetically classified to primary, pseudo-secondary, and secondary according to the criteria given by Goldstein and Reynolds [14] and Roedder [20]. Only the primary and pseudo-secondary fluid inclusions were taken into consideration. Individual fluid inclusions and those that constitute fluid inclusion assemblages (FIAs) in individual quartz crystals were selected for microthermometry and Raman spectrometry. Volumetric proportions of the liquid (L) and vapor (V) phases relative to the total volume of each studied fluid inclusion at room temperature (25 °C) were estimated based on standardized charts of Shepherd et al. [21].

4.3.1. Fluid Inclusion Petrography

Five types of fluid inclusions were recognized. Quartz vein A contains all five fluid inclusion types, while quartz vein B contains Type IIa and Type IIb only.
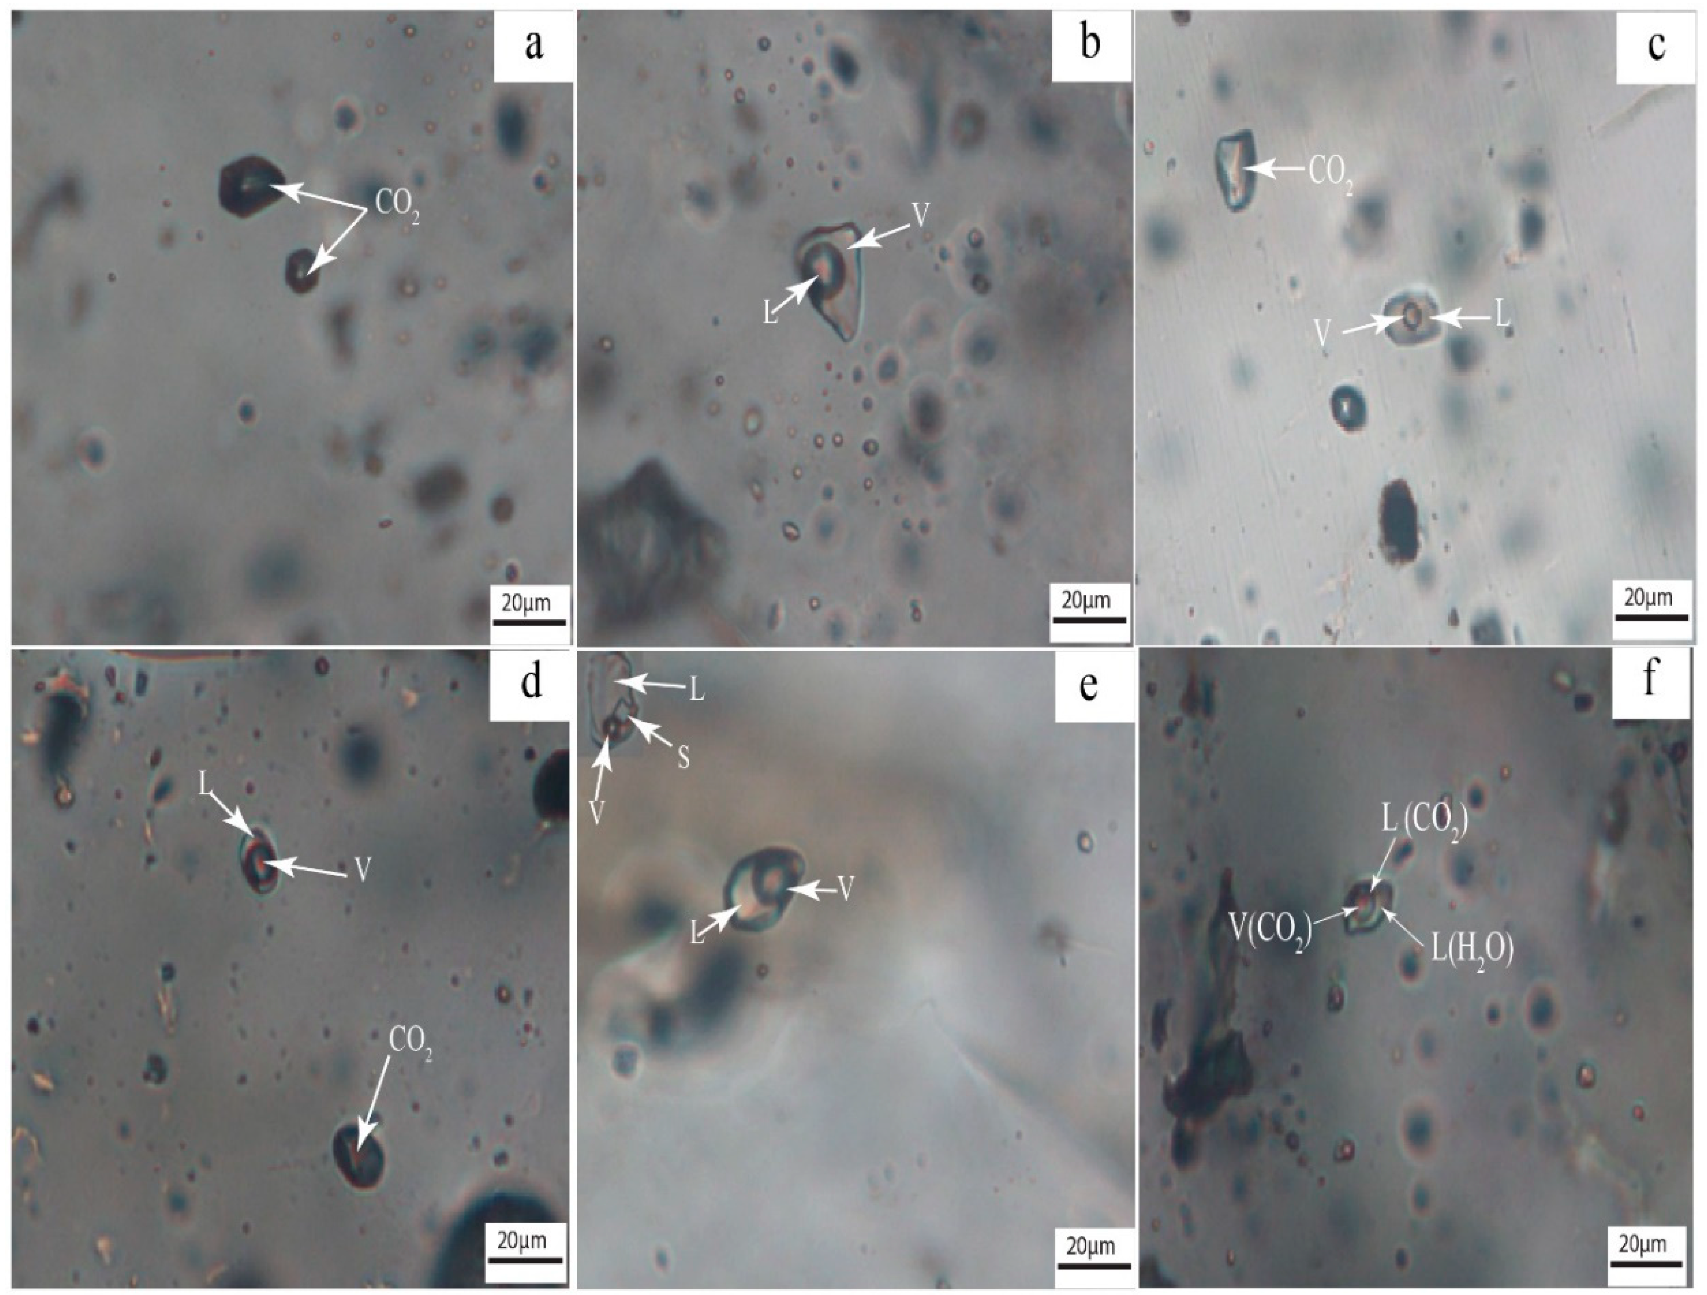
Type I monophase CO2-rich inclusions are relatively rare in comparison to the other fluid inclusion types. Type I fluid inclusions are found in irregular clusters confined to individual quartz grains. These inclusions have cylindrical, irregular, or negative crystal shapes with sizes ranging from less than 5 to 10 μm. They are transparent to dark-colored and single-phase at room temperature (Figure 9a).
Type IIa fluid inclusions are two-phase (L + V) aqueous inclusions at room temperature (Figure 9b,c). The vapor phase occupies <50 vol% of the total volume. This type does not contain daughter minerals and homogenize to the liquid on heating. Type IIa fluid inclusions are irregular- to negative-crystal-shaped, they occur isolated or as random clusters in quartz veins A and B or as intragranular growth planar arrays (in quartz vein A). Thus, the Type IIa fluid inclusions are considered as primary or pseudo-secondary. Their sizes range from 5.5 to 24 μm.
Type IIb fluid inclusions are also two phase (L + V) (Figure 9d) aqueous fluid inclusions, but the vapor phase occupies >50 vol% of the total volume at room temperature. They also occur in clusters or in trails within individual quartz grains. Hence, they are likely to be primary or pseudo-secondary. The Type IIb fluid inclusions do not contain daughter minerals and homogenize to the vapor on heating. They are regular to irregular in shape and vary in their size range from 7 to 24 μm.
Type IIIa fluid inclusions are liquid-rich, three-phase (L + V + S) fluid inclusions (Figure 9e). At room temperature, they are composed of aqueous liquid, vapor and halite. They occur as clusters in quartz vein A or along the small intragranular trails in quartz vein B within individual quartz grains. As such, they are interpreted as primary or pseudo-secondary. Sizes range from 7.6 to 22.5 μm.
Type IIIb fluid inclusions are aqueous-carbonic and composed of three phases (L + L + V) (Figure 9f): aqueous liquid, CO2 liquid, and vapor phases. These inclusions have irregular to negative crystal shapes and occur as random three-dimensional clusters and in intragranular trails. They are also interpreted as pseudo-secondary inclusions. Their sizes range from 7 to 24.6 μm.
In quartz vein A, the coexistence of Type IIIa with Type IIa and Type IIb aqueous inclusions in the same individual vein quartz crystals suggests heterogeneous trapping of the fluid inclusions, and that phase separation via the immiscibility and/or boiling phenomena occurred in the hydrothermal fluids from which quartz vein A (HO-1 stage) precipitated. Moreover, the coexistence of aqueous-carbonic Type IIIb and the carbonic Type I fluid inclusions with the other types of fluid inclusions (e.g., Type IIa and IIb) in the A veins also suggest heterogeneous trapping of the fluid inclusions and immiscibility characteristics of the aqueous-carbonic hydrothermal fluid (e.g., Figure 9c,d) in the hydrothermal system. For quartz vein B, the coexistence of only Types IIa and IIb fluid inclusions suggests that phase separation in the hydrothermal fluid continued locally during the fluid evolution at the late HO-2 stage.

4.3.2. Microthermometry and Raman Spectrometry

The microthermometric data from the analysis of the fluid inclusions is summarized in Table 1. The total homogenization temperatures decreased from quartz vein A (HO-1 stage) through quartz vein B (HO-2 stage).
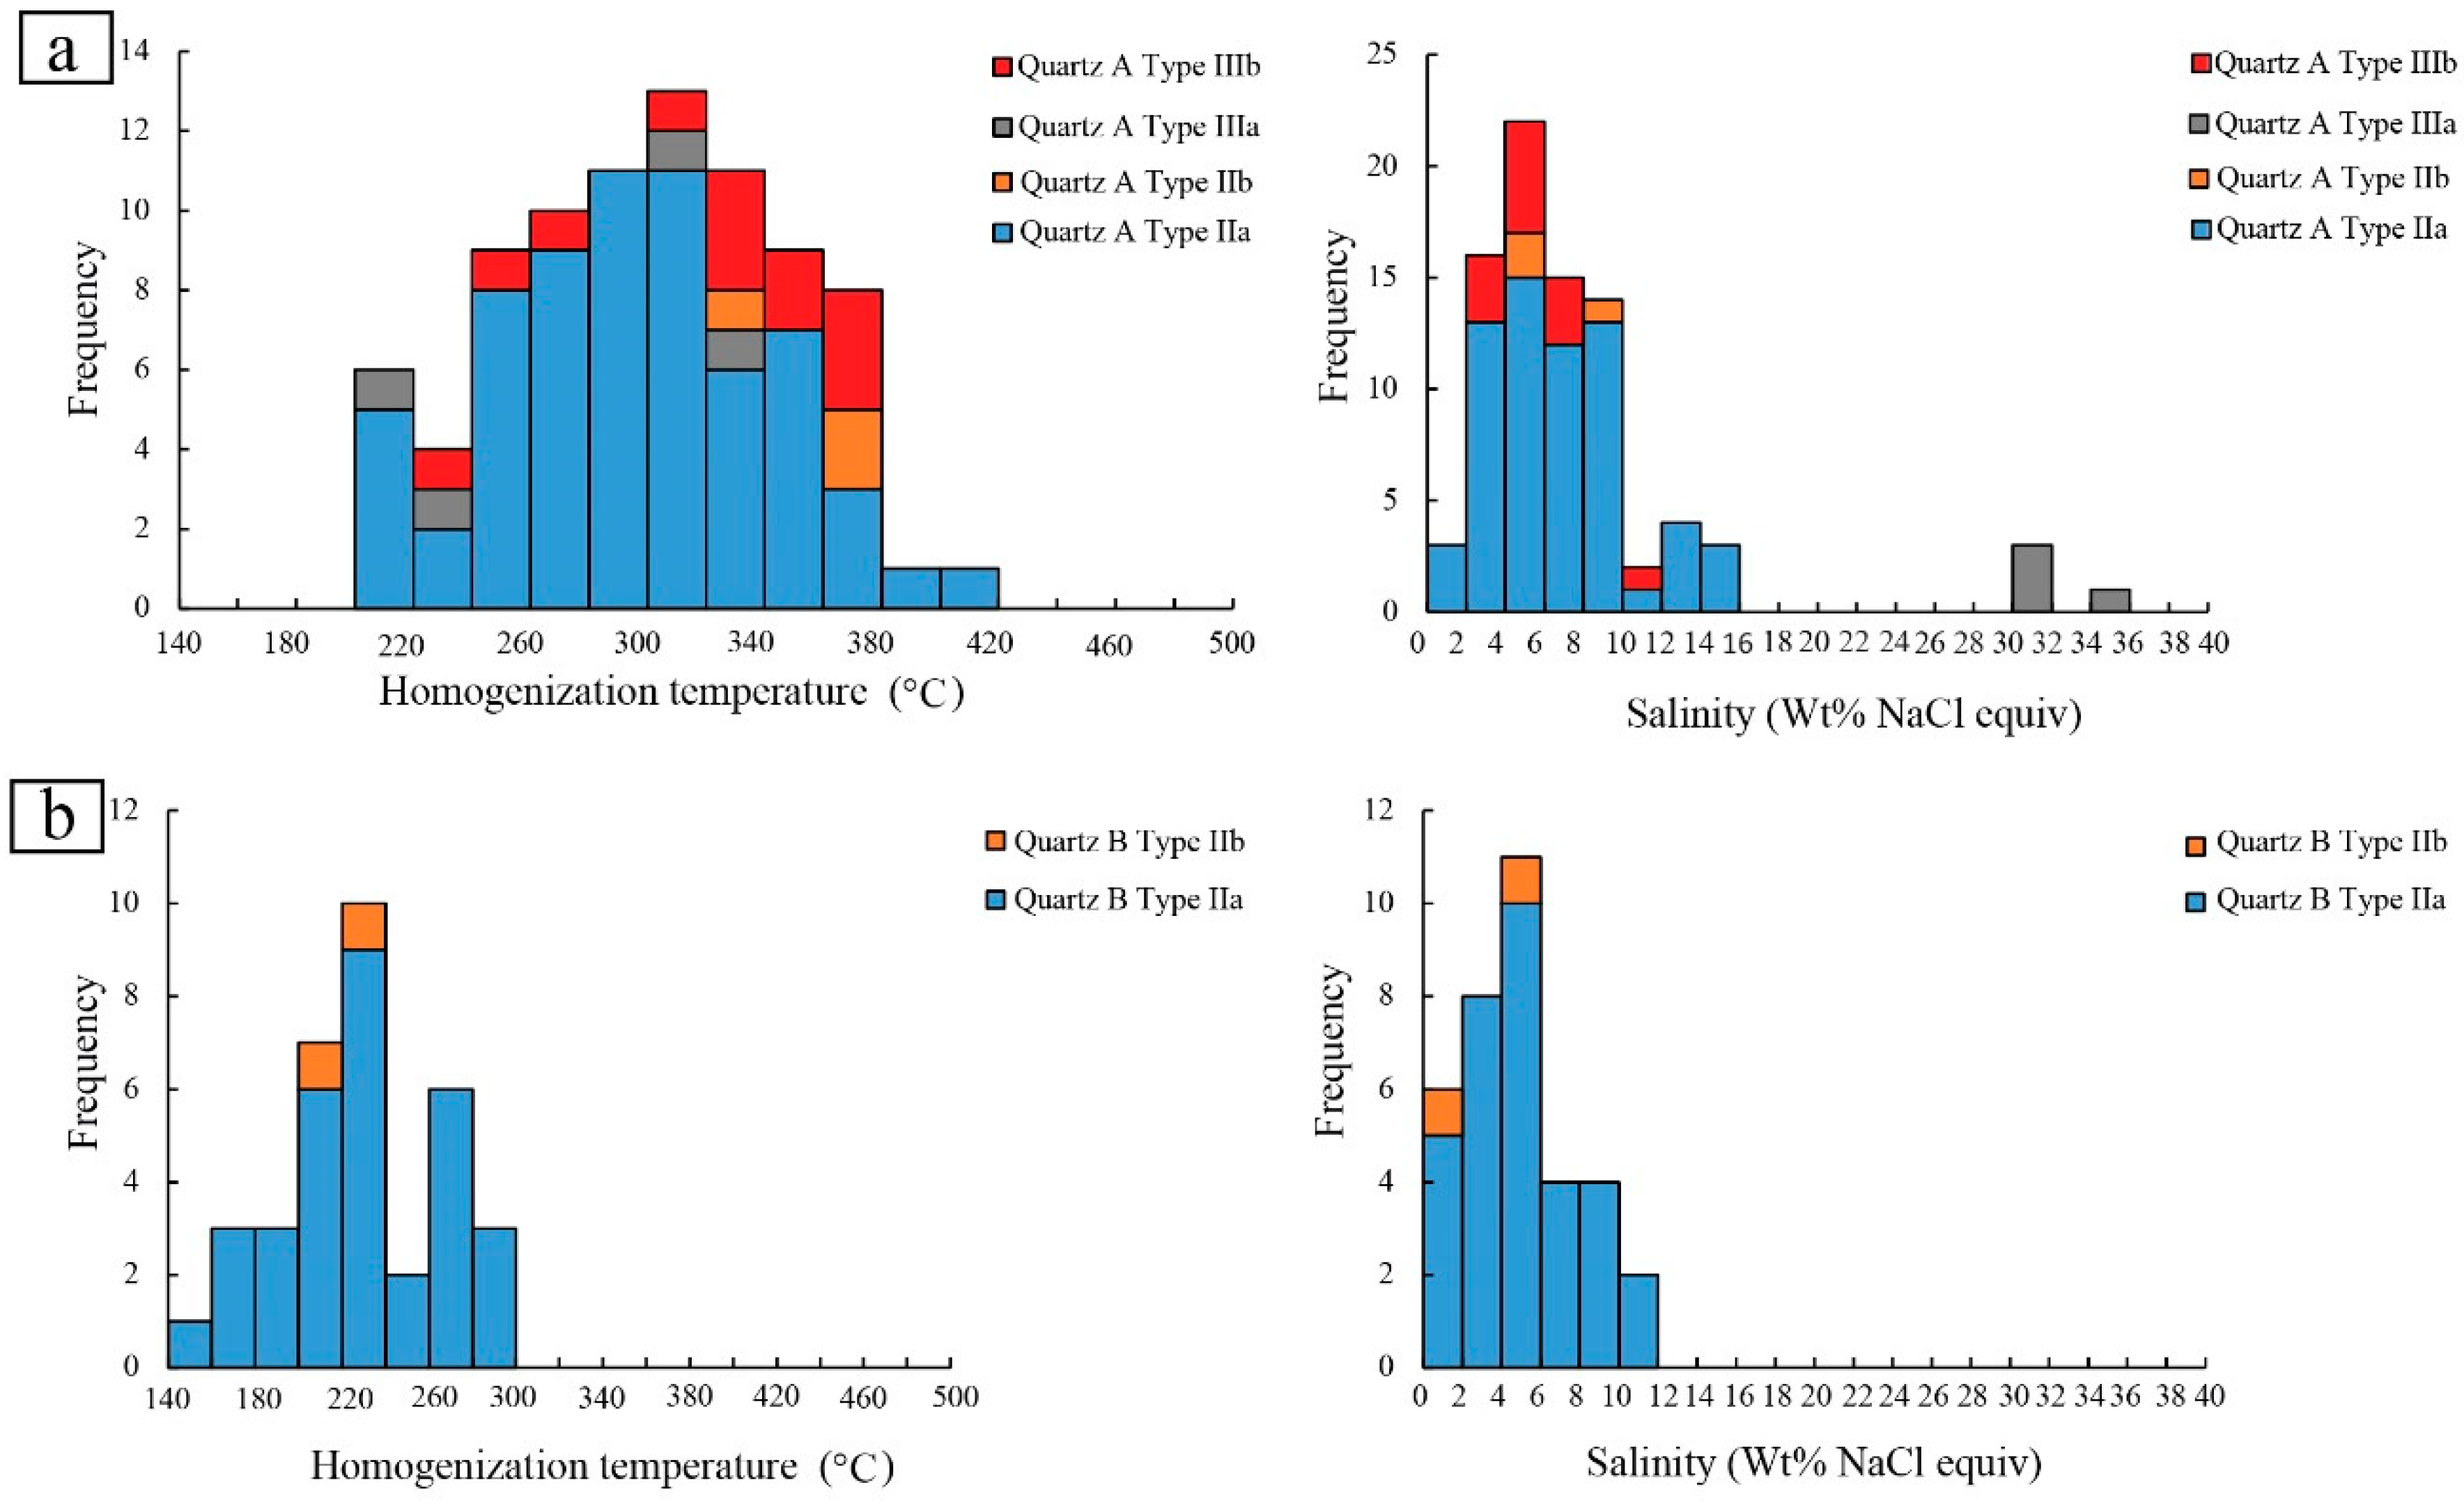
Quartz vein A host all the fluid inclusion types: I, IIa, IIb, IIIa, and IIIb. The range in total homogenization temperatures of the fluid inclusions in quartz vein A is 203–405 °C. The temperatures show a unimodal distribution, whereas their corresponding salinity displays a bimodal distribution of high salinity values (30–35 wt. % NaCl equiv.) and high densities (1.01–1.10 g/cm3) for Type IIIa, and low-to-moderate salinity values for the Type IIa, IIb, and IIIb fluid inclusions (Figure 10a). The Types IIa and IIb fluid inclusions have salinity values between 1–15 wt.% NaCl equiv., with lower calculated densities that range between 0.59 to 0.98 g/cm3 (Figure 10a) (Table 1). Type IIIb has salinity values between 2.8–11.2 wt. % NaCl equiv., calculated on the basis of corresponding clathrate temperatures at 3.5–8.6 °C (i.e., T_clathrate < 10 °C). The almost pure CO2 content of the Type IIIb fluid inclusions is implied from the temperatures of CO2-solid melting data of −58.2 to −56.7 °C Tm_CO2 and from the clathrate melting below 10 °C. However, one fluid inclusion sample did register Tm_CO2 of −59.9 °C, which suggests the likely presence of other carbonic phases such as CH4 or N2. The homogenization temperature of CO2 to the liquid phase of the Type IIIb fluid inclusions ranges between 14.2 and 29.9 °C with the calculated densities ranging from 0.86–1.05 g/cm3 (Table 1). The total concentration of CO2, X(CO2), of these aqueous-carbonic inclusions range between 7 to 15 mol % (Table S1). The unimodal distribution in temperature values but wide variations in salinity values can be attributed to fluid mixing of multiple fluids and/or phase separation.
Laser Raman analysis confirmed only CO2-rich carbonic phases in the Types I and IIIb fluid inclusions of quartz vein A (Figure 11a,b). The nature of occurrence of the Type I and IIIb fluid inclusions in only quartz vein A, and not in B (HO-2 stage), may suggest phase separation of the Type IIIb fluid to the Type I monophase carbonic inclusions and the Type II aqueous fluid inclusions.
For quartz vein B of the HO-2 stage, only Types IIa and IIb fluid inclusions have been found. The aqueous inclusions are predominantly of a low salinity (0.7–10.6 wt. % NaCl equiv.; Figure 10b) and theirs densities range from 0.76 to 0.97 g/cm3 (Table 1). This range in salinity is similar to that of quartz vein A. Total homogenization temperatures of 150 to 290 °C are lowest in comparison to those of quartz vein A (Figure 10b). Both distribution patterns in the homogenization temperatures and salinities of fluid inclusions in the Quartz vein B grains are generally unimodal.
Since heterogeneous trapping is implied from the textural distribution of these coexisting primary fluid inclusions in quartz veins from A through B, the homogenization temperatures of these fluid inclusions would serve as minimum trapping temperatures of the fluid inclusions [22]. Therefore, in the absence of other independent temperature estimates, these minimum temperatures would represent the true trapping temperatures of the fluid inclusions during the various stages of quartz development and hypogene iron mineralization in the Nabeba deposit (see discussion for details).

4.4. Oxygen Isotopes

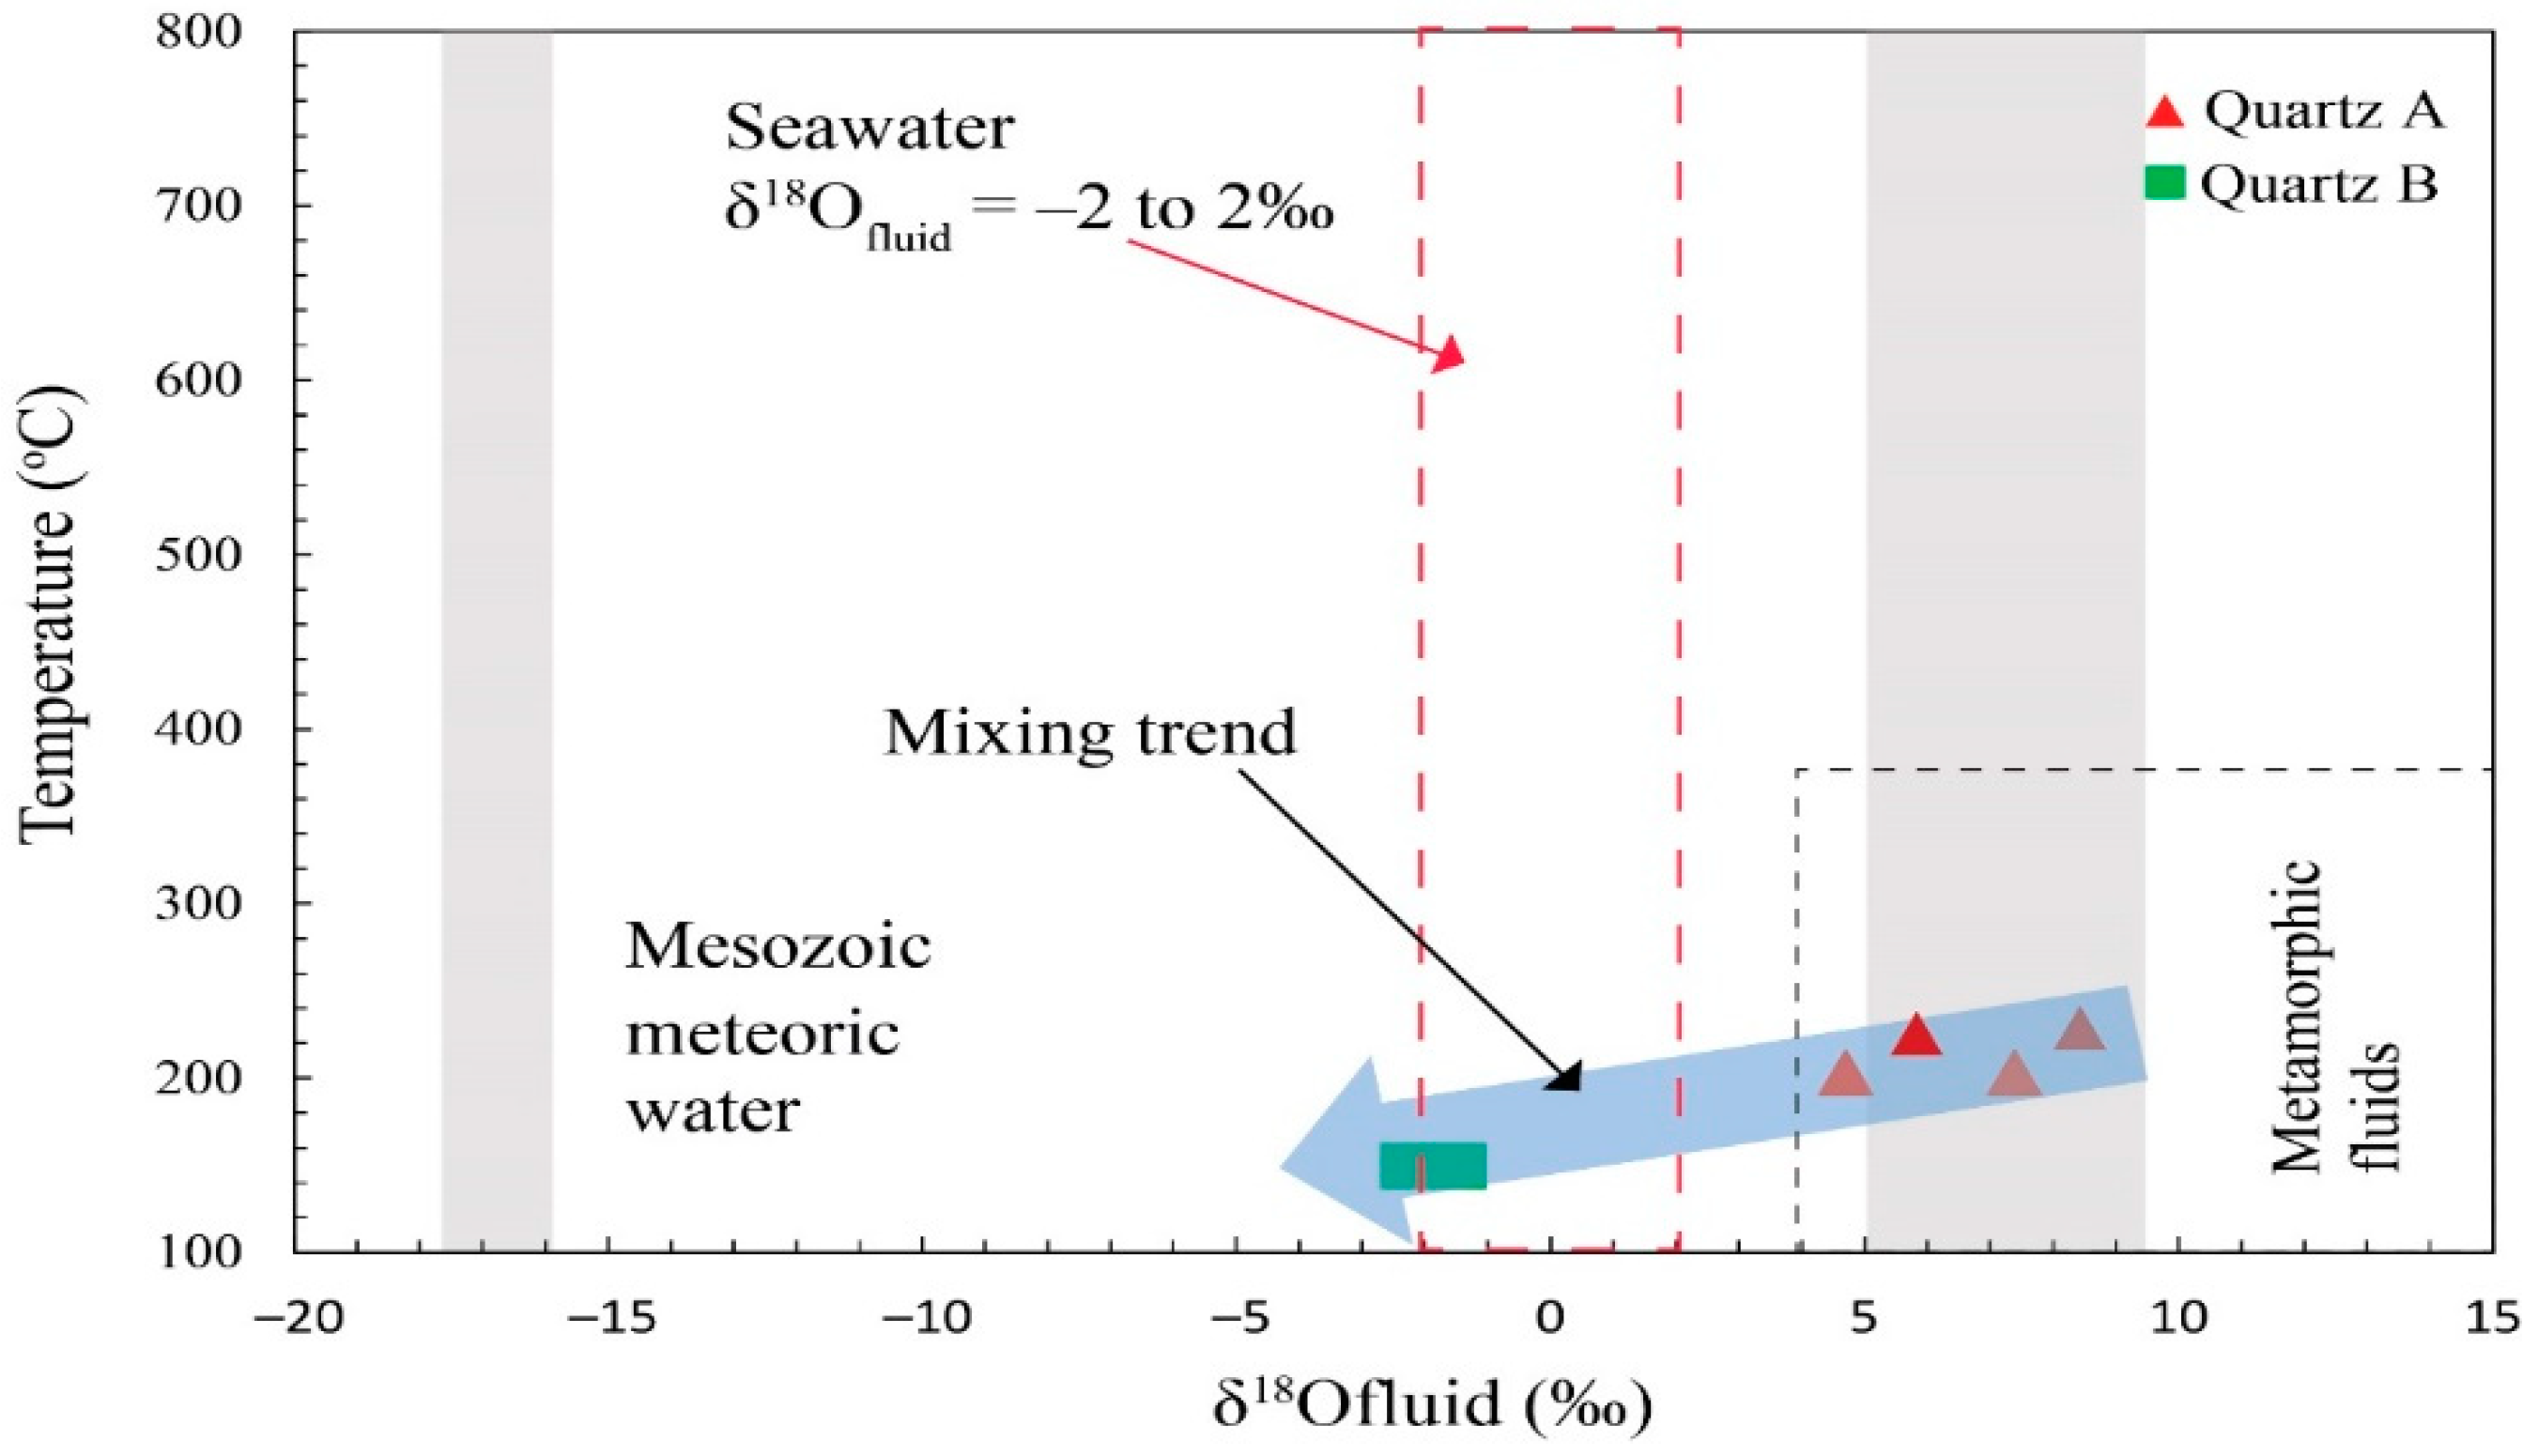
Quartz veins A and B yielded δ18O values of 16.2–18.9‰ and 13.2–14‰, respectively (Table 2). The δ18Ofluid values for water in equilibrium with quartz, calculated using the equation of Clayton et al. [19] are 4.7–8.1‰, and from −2.3‰ to −1.5‰, respectively.
In Figure 12, the plot of the minimum homogenization temperature and the δ18Ofluid values is illustrated. It shows a fluid mixing trend from high to low temperature regimes for the hydrothermal fluid components that represent the two ore stages of the Nabeba hypogene iron mineralization.

5. Discussion

5.1. Trapping Mechanism and Implications for Temperature, Pressure, and depth Conditions of Hypogene Iron Ore Mineralization

Straightforward estimates of the trapping pressure can only be carried out on T–P–density isochore diagrams when the actual trapping temperature is known, or if phase separation due to boiling or immiscibility occurred in the fluid system at the time of capture [28]. The microthermometric data and coexistence of Types I and IIIb with the other types of fluid inclusions in quartz veins A suggest heterogeneous trapping of the fluid inclusions and fluid immiscibility characteristics (e.g., Figure 8c,d) in the hydrothermal system. The coexistence of Type IIa and IIIa fluid inclusions that yielded similar homogenization temperatures but varying salinity in quartz vein A (HO-1 stage) are direct evidences of fluid immiscibility and/or boiling during vein quartz precipitation in these stages. Quartz vein B of the HO-2 stage does not have Type IIIa fluid inclusions. However, local phase separation of the fluid during fluid mixing at this stage can also be assumed since the Types IIa and IIb fluid inclusions coexist as gas-poor and gas-rich inclusions, respectively. Given that the fluid inclusions are heterogeneously-trapped, only the minimum homogenization temperatures correspond to true trapping temperatures [22]. Therefore, true trapping temperatures for vein quartz in quartz vein A and quartz vein B based on the aqueous fluid inclusions are 203 and 150 °C, respectively. Consequently, using the diagram from Driesner and Heinrich [29], trapping pressures were estimated at ~20 bars for hypogene hematite-rich ore associated with quartz vein B (HO-1 stage); and less than 10 bars for hypogene magnetite-rich ore associated with quartz vein B (HO-2 stage) (Figure 13). Hydrostatic pressure conditions suggest depths of 0.2 and 0.1 km, respectively.
The estimation of the minimum P–T conditions for entrapment of Type IIIb aqueous carbonic inclusions (H2O-CO2-NaCl system) in quartz A veins at the HO-1 stage requires a plot of P–T isochores that were constructed using the minimum and maximum fluid inclusion densities. Virtually all of the Type IIIb fluid inclusions followed the P–T path, which is represented by the isochore traced by the minimum density. The hypothesis that aqueous carbonic Type IIIb fluids were heterogeneously trapped and contained a minimum of ~7 mol% CO2 (Figure 14a) was essential to constrain the P–T range. The intersection between the minimum density isochore and the isopleth for 7 mol% CO2, which separates the liquid immiscibility region from the H2O–CO2 system, provided the minimum temperature (Tt min) and the minimum pressure (Pt min) of trapping in the H2O–CO2–NaCl system for the Type IIIb fluid inclusions of stage HO-1 at Tt min = 215 °C and Pt min = ~800 bars (Figure 14b). Assuming lithostatic conditions for the behavior of the Type IIIb fluid inclusions, a depth of up to ~2 km was estimated.
Therefore, the minimum trapping pressures of 800–20 bars at 203–215 °C for quartz vein A (HO-1 stage) and ~10 bars at 150 °C for the HO-2 stage corresponds to paleodepths of 0.2 to ~2 km and 0.1 km, respectively.

5.2. Nature and Origin of the Hypogene Ore-Forming Fluids

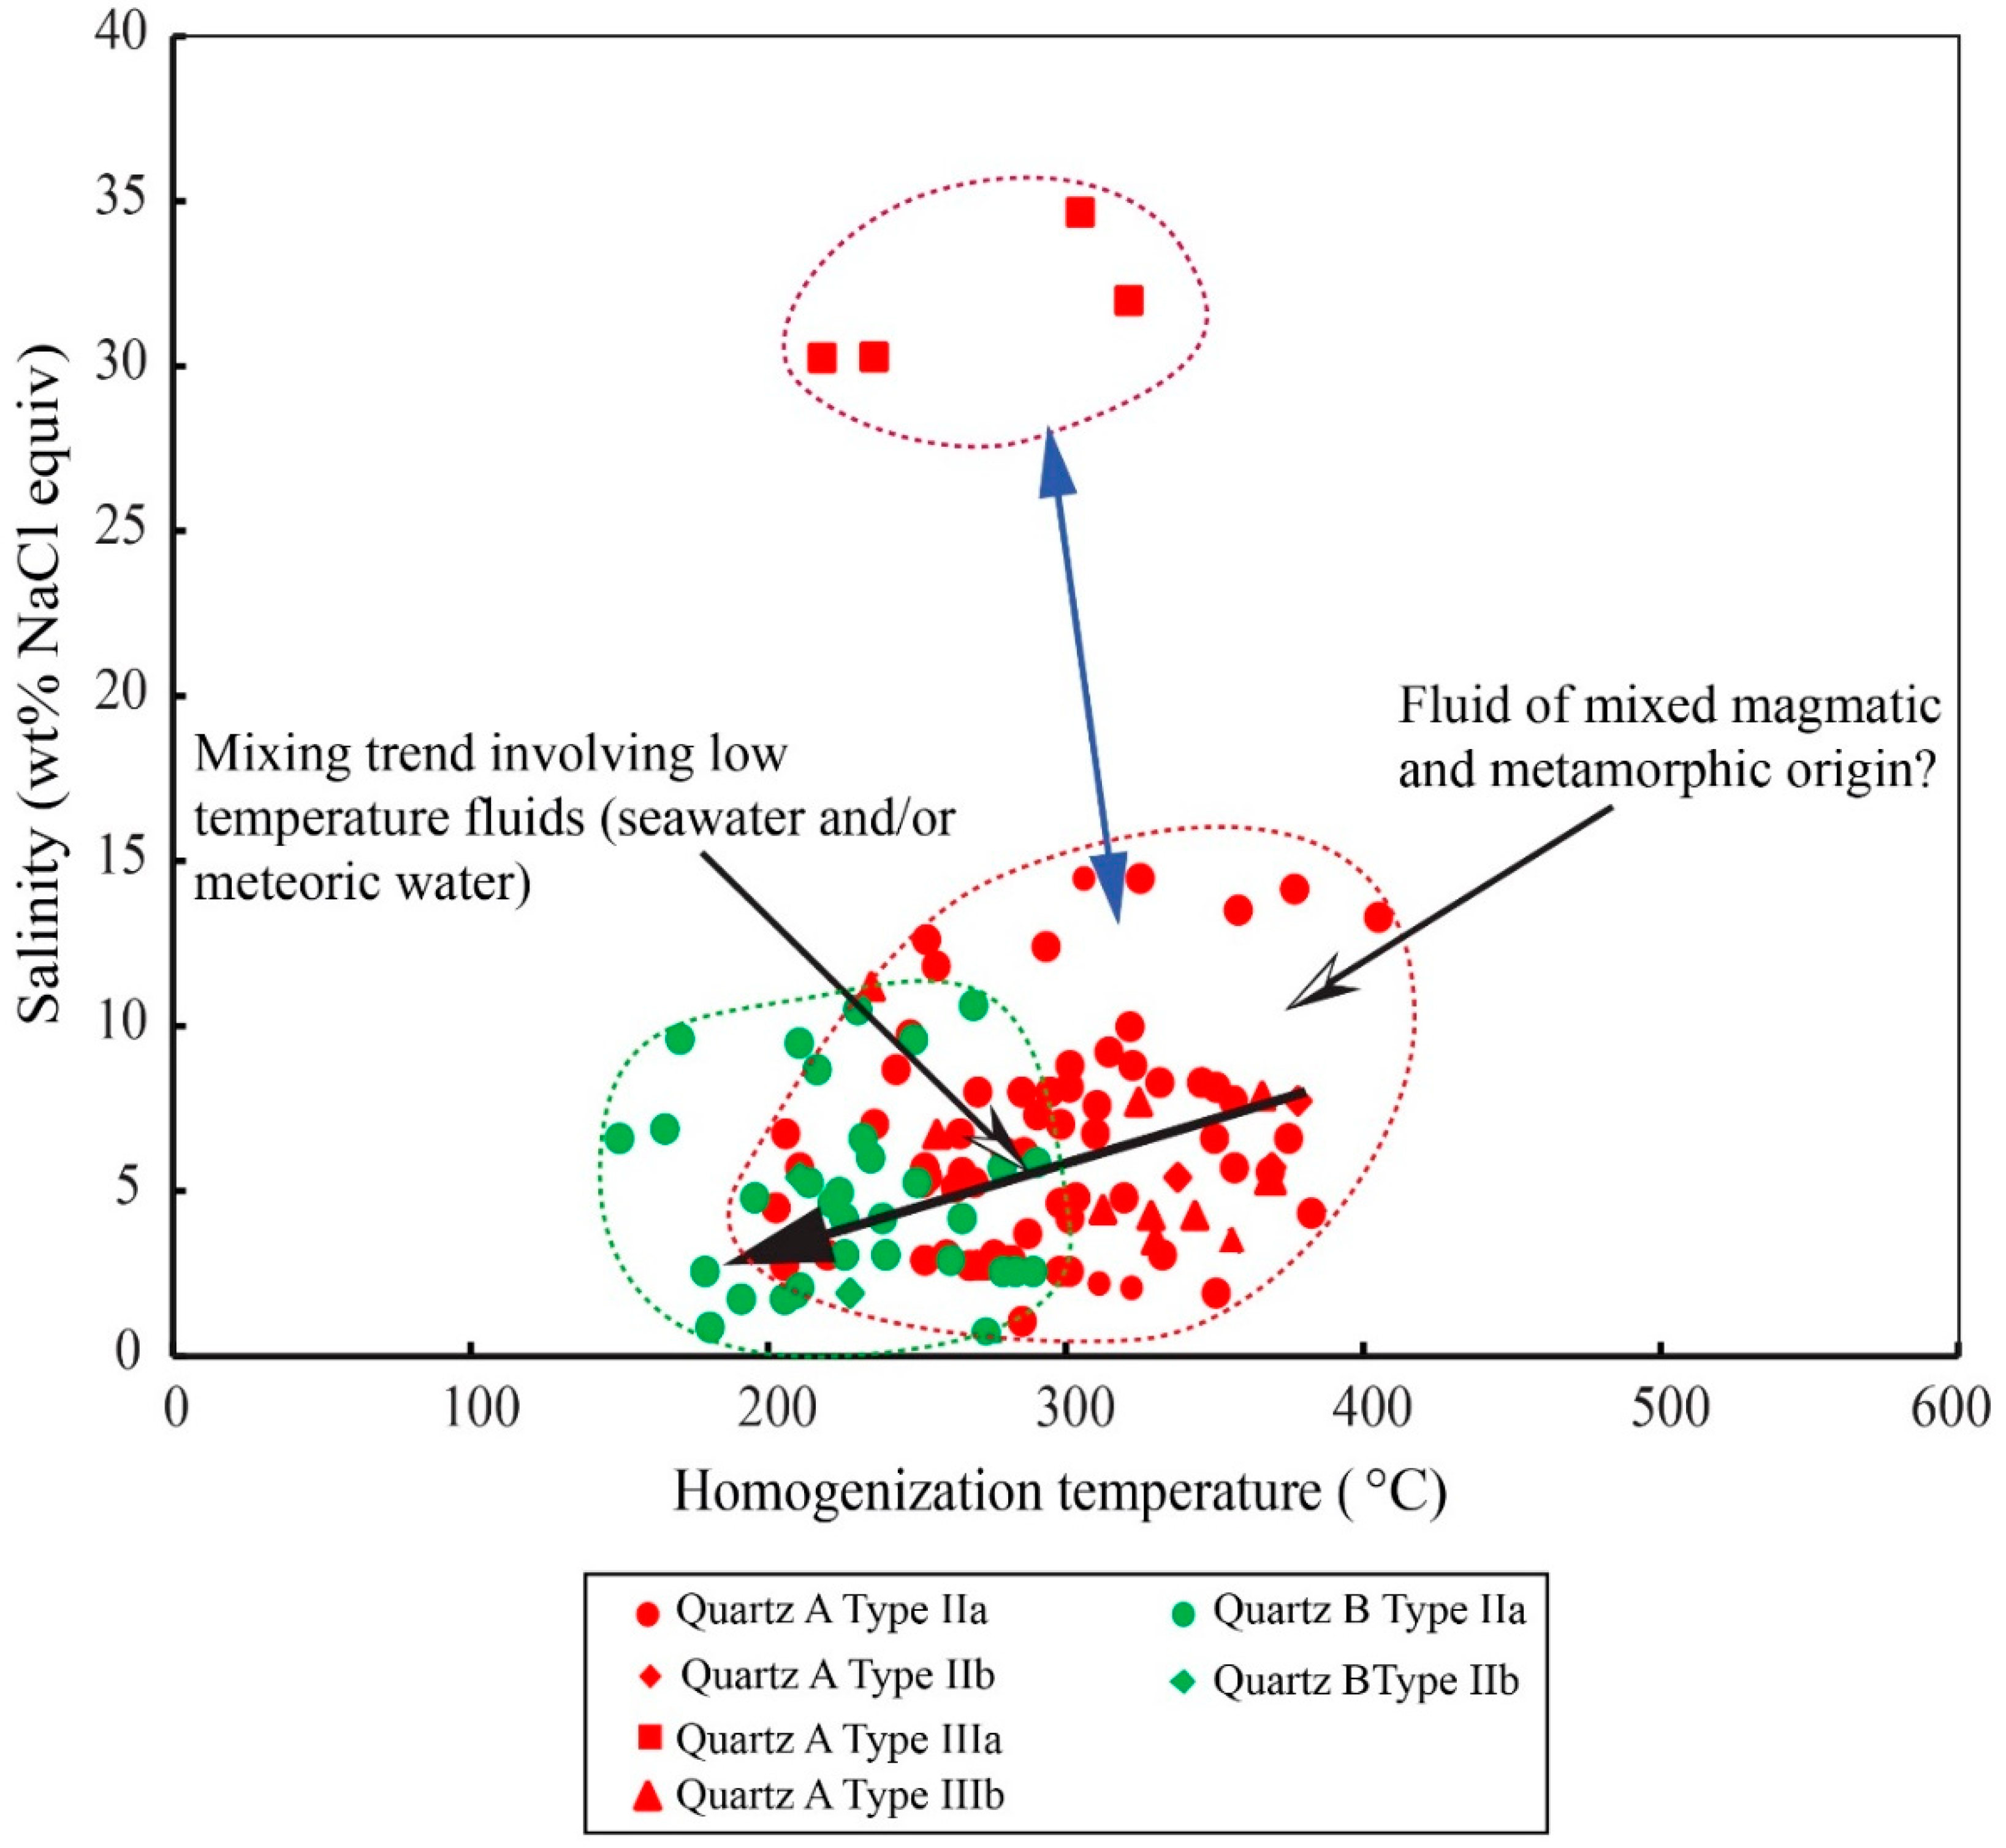
The evolution of ore-forming fluids in the Nabeba deposit can be illustrated by plotting the microthermometric data for all types of fluid inclusions as a function of the homogenization temperature and salinity (Figure 15). The distribution of the microthermometric data of fluid inclusions in quartz samples from the HO-1 stage and the HO-2 stage shows decreasing homogenization temperatures and salinities over time (Figure 15).
For stage HO-1, a large variation in fluid inclusion salinity values can be interpreted as reflecting the entrapment of high temperature, higher salinity Type IIIa fluid inclusions; low to high temperature, low to moderate salinity fluid Type IIa and IIIb fluid inclusions; and then, moderate temperature, low salinity Type IIb fluid inclusions (Figure 10 and Figure 15). These observed variations are best explained by the progressive trapping of multiple hydrothermal fluid pulses whose temperature and salinity values varied as a function of time and proximity to the central fluid source [25] and/or due to phase separation. In fact, most of the fluid inclusions in this stage correspond to Types IIa and IIIa, and display a positive correlation between homogenization temperatures and salinities. These characteristics and relationships indicate that the fluid at this stage contained a mixture of magmatic (high salinity aqueous) and metamorphic (low to moderate salinity aqueous-carbonic) components. Based on the quartz–water isotopic equilibrium fractionation factor at 203–215 °C, the hydrothermal vein quartz from the HO-1 stage was calculated to have δ18Ofluid values ranging from 4.7‰–8.1‰ (Table 2), which is consistent with a mixed metamorphic and magmatic origin for the fluids that formed the high-grade hypogene hematite-rich ore (Figure 12).
Quartz vein B of the HO-2 stage is characterized by the low to moderate salinity and temperature of fluid inclusions of Type IIa and Type IIb. These two types are characterized by lower homogenization temperatures and lower salinities compared to stage HO-1 fluid inclusions, which may imply cooling and dilution of the hypogene fluids (Figure 15). This hypothesis is corroborated by the lower δ18Ofluid values (−2.3‰ to −1.5‰; Table 2) for quartz vein B of the HO-2 stage, in comparison to quartz vein A of the HO-1 stage. Such low to moderate salinity fluids with low δ18Ofluid values and low temperatures can result from the mixing of magmatic and/or metamorphic fluids by low salinity, low temperature seawater or meteoric water [30]. The lower trapping temperatures of the fluid inclusions in the quartz of this HO-2 stage, whose timing coincides with the leaching of silica and the net removal of Fe-rich carbonate from BIF, suggests that the retrograde solubility of siliceous and Fe-rich carbonate minerals could have played an important role in the formation of magnetite-rich ore at the Nabeba deposit.
Based on the estimated shallow depths of the hypogene ore formation and the idea that metamorphic fluids are likely to maintain their CO2-rich component at shallower depths compared to magmatic fluids [31], we suggest that at greater depths distal from the site of deposition of the hypogene ores, a high-salinity aqueous magmatic-hydrothermal fluid mixed with a metamorphic-hydrothermal fluid containing the Type IIIb aqueous-carbonic fluid inclusions. Then, as this mixed fluid ascended to the site of ore deposition and interacted with the Nabeba BIF lithology, it underwent phase separation, via fluid immiscibility and/or boiling of the magmatic fluid component, to heterogeneously trap Type IIa, IIb, and IIIa, whereas the metamorphic fluid component underwent fluid immiscibility to heterogeneously trap Type I and Type IIa fluid inclusions. The deduction for the behavior of the metamorphic fluid component was based on the irregular to negative crystal shapes of the Type I and Type IIa fluid inclusions and their occurrence as intragranular planar arrays in quartz vein A.
Furthermore, this fluid evolved to a later HO-2 stage as low to moderate salinity and temperature fluids; a process that was influenced by the contribution from low salinity seawater fluid (−2.3‰ to −1.5‰) and/or meteoric water (Figure 12), to the mixed metamorphic and magmatic hydrothermal fluids, to form the hypogene magnetite-rich ore at stage HO-2. Given the similarity in fluid salinities of the HO-1 and HO-2 stages, it is believed that the cool seawater fluid mixed with the stage HO-1 fluid prior to the formation of the HO-2 stage fluid, thus implying multiple fluid mixing and interactions with the BIF units during the Nabeba hypogene iron ore formation. It also suggests that the Nabeba BIF was likely submarine during the formation of the hypogene ores. Subsequently, it was only after uplift of the BIF to the subaerial position that the supergene ores were later formed by supergene processes.

5.3. Comparison with Other BIF-Hosted Iron Ore Deposits.

A comparison of the results from our study with other major iron ore deposits around the World reveals similarities with those of the Weld Range hypogene iron ore deposit in Australia [25], the Krivoy Rog iron ores in Ukraine [32], and the Serra Norte deposit in the province of Carajás, Brazil [7]. The general models for these deposits implied variations in the BIF–water interaction by early-stage high temperature magmatic ± metamorphic fluids, followed by mixing with low temperature basinal brines, seawater, or meteoric waters. However, these results differ from those of Mount Tom Price [3] and Paraburdoo [33] in the Hamersley Province, where studies on hypogene orebodies demonstrated the participation of hot (T < 400 °C) and highly saline Ca-rich basinal brines, and cooler, low-salinity meteoric hydrothermal fluids during formation of high-grade magnetite- and hematite-rich ores.

6. Conclusions

Fluid inclusion and oxygen isotope studies of the Nabeba iron ore deposit have contributed to the understanding of the nature and evolution of the fluids and processes responsible for the hypogene iron ore enrichment. The initial fluids that interacted with the Nabeba BIF was of mixed metamorphic and magmatic hydrothermal origin, giving rise to hypogene hematite-rich ore of the HO-1 stage. Subsequently, influx of low temperature seawater and/or meteoric water resulted in the replenishment of the magmatic-metamorphic fluids, giving rise to the magnetite-rich ore mineralization at the HO-2 stage. In addition, water–rock interaction with the BIF units and phase separation may have also contributed to the hypogene iron ore enrichment. The high-grade hypogene hematite-rich ores formed at the paleodepth of 0.2 to ~2 km, while the magnetite-rich ores formed at a shallower paleodepth of about 0.1 km.

Supplementary Materials

The following are available online at https://www.mdpi.com/2075-163X/9/11/677/s1, Table S1: Microthermometric result for fluid inclusion study of Quartz veins associated with the hypogene iron ore in Nabeba deposit.

Author Contributions

Conceptualization: C.G.E., Y.X. and K.A.-A; methodology: C.G.E., Y.X. and K.A.-A.; formal analysis: C.G.E. and Y.X; investigation: C.G.E., Y.X., K.A.-A. and L.P.; resources: Y.X.; writing—original draft preparation: C.G.E.; writing—review and editing: C.G.E., Y.X., K.A.-A. and L.P.; funding acquisition: Y.X.

Funding

This research was funded by Administry of Science and Technology of the People’s Republic of China (State Key Research Plan), grant number 2017YFC0601302 and “The APC was funded by Administry of Science and Technology of the People’s Republic of China (State Key Research Plan).

Acknowledgments

This paper is part of the PhD thesis of the first author at the University of Science and Technology, Beijing, China. The authors would like to thank Aimé Emmanuel YOKA, Country Manager Of Congo Iron SA, and Louis Marie Joachim DJAMA, Manager of Mines and Geology at the Ministry of Mines and Geology of Republic of Congo, for their help and support during fieldwork. We also thank all technicians at the Beijing Institute of Uranium Geology for their help during Raman spectroscopy and the oxygen isotope analysis. We are sincerely grateful to the four anonymous Journal reviewers and the Associate Editor for their constructive comments that improved the quality of our presentation.

Conflicts of Interest

The authors declare no conflicts of interest.

References

  1. Duuring, P.; Hagemann, S.G.; Novikova, Y.; Cudahy, T.; Laukamp, C. Targeting iron ore in banded iron formations using ASTER data: Weld range Greenstone Belt, Yilgarn Craton, Western Australia. Econ. Geol. 2012, 107, 585–597. [Google Scholar] [CrossRef]
  2. Hagemann, S.G. The role of hydrothermal fluids in the formation of high grade BIF-hosted iron ore deposits. In Proceedings of the ECROFI XXIII, Leeds, UK, 27–29 June 2015; p. 20. [Google Scholar]
  3. Hagemann, S.G.; Barley, M.E.; Folkert, S.L.; Yardley, B.W.D. A hydrothermal origin for the Giant BIF-Hosted Tom Price Iron Ore Deposit. In Mineral Deposits, Processes to Processing; Stanley, C.J., Ed.; A.A. Balkema: Rotterdam, The Netherlands, 1999; pp. 41–44. [Google Scholar]
  4. Taylor, D.; Dalstra, H.J.; Harding, A.E.; Broadbent, G.C.; Barley, M.E.; Barley, M. Genesis of high-grade hematite orebodies of the Hamersley Province, Western Australia. Econ. Geol. 2001, 96, 837–873. [Google Scholar] [CrossRef]
  5. Thorne, W.S.; Hagemann, S.G.; Barley, M.E. Petrographic and geochemical evidence for hydrothermal evolution of the North Deposit, Mt Tom Price, Western Australia. Miner. Deposita 2004, 39, 766–783. [Google Scholar] [CrossRef]
  6. Silva, R.F.E.; Lobato, L.M.; Rosiere, C.; Hagemann, S.; Zucchetti, M.; Baars, F.; Morais, R.; Andrade, I. A hydrothermal origin for the Jaspilite-hosted, giant serra norte iron ore deposits in the Carajas mineral province, Para state, Brazil. In Banded Iron Formation-Related High-Grade Iron Ore; Society of Economic Geologists: Littleton, CO, USA, 2008; pp. 255–289. [Google Scholar]
  7. Figueiredo e Silva, R.C.; Hagemann, S.; Lobato, L.M.; Rosière, C.A.; Banks, D.A.; Davidson, G.J.; Vennemann, T.; Hergt, J. Hydrothermal fluid processes and evolution of the giant Serra Norte jaspilite-hosted iron ore deposits, Carajás Mineral Province, Brazil. Econ. Geol. 2013, 108, 739–779. [Google Scholar] [CrossRef]
  8. Longley, R.; Kitto, P.; Thornett, S. Iron Ore, Exploration History of the Mbalam Iron Ore Project; Sundance Resources Ltd.: Perth, Australia, 2013; Volume 80. [Google Scholar]
  9. Thornett, S.; Longley, R.; Robertson, I.; Meehan, D. Mbalam-Nabeba Iron Ore Project; 100-RG-GO-0009; Sundance Resources Ltd.: Perth, Australia, 2013; Volume 479, Unpublished. [Google Scholar]
  10. Gatsé Ebotehouna, C.; Issambo Dom, S. Geological Knowledge of the Iron Formation of the Nabeba Iron Deposit; Northwestern Republic of Congo: Brazzaville, Republic of Congo, 2016; Unpublished. [Google Scholar]
  11. Ministère des mines et de l’énergie; Direction Générale des mines. Carte géologique de la Republique du Congo au 1: 1 000 000; Ministère des mines et de l’energie: Brazzaville, Republic of Congo, 1995.
  12. Desthieux, F. Notice Explicative de la Carte Géologique de la République du Congo au 1/1.000. 000; Ministère des mines et de l’énergie and Direction Générale des Mines: Brazzaville, Congo, 1993; 27p. [Google Scholar]
  13. Meloux, J.; Bigot, M.; Viland, J. Plan Minéral de la République Populaire du Congo; BRGM: Orléans, France, 1986. [Google Scholar]
  14. Goldstein, H. Systematics of Fluid Inclusions in Diagenetic Minerals. SEPM Short Course 1994, 31, 199. [Google Scholar]
  15. Steele-MacInnis, M.; Lecumberri-Sanchez, P.; Bodnar, R.J. Short note: HokieFlincs_H2O-NaCl: A Microsoft Excel spreadsheet for interpreting microthermometric data from fluid inclusions based on the PVTX properties of H2O-NaCl. Comput. Geosci. 2012, 49, 334–337. [Google Scholar] [CrossRef]
  16. Steele-MacInnis, M. Fluid inclusions in the system H2O-NaCl-CO2: An algorithm to determine composition, density and isochore. Chem. Geol. 2018, 498, 31–44. [Google Scholar] [CrossRef]
  17. Hansteen, T.H.; Klugel, A. Fluid inclusion thermobarometry as a tracer for magmatic processes. Rev. Mineral. Geochem. 2008, 69, 143–177. [Google Scholar] [CrossRef]
  18. Cadusch, P.; Hlaing, M.; Wade, S.; McArthur, S.; Stoddart, P. Improved methods for fluorescence background subtraction from Raman spectra. J. Raman Spectrosc. 2013, 44, 1587–1595. [Google Scholar] [CrossRef] [Green Version]
  19. Clayton, R.N.; O’Neil, J.R.; Mayeda, T.K. Oxygen isotope exchange between quartz and water. J. Geophys. Res. 1972, 77, 3057–3067. [Google Scholar] [CrossRef]
  20. Roedder, E. Fluid Inclusions. Rev. Mineral. 1984, 12, 12–45. [Google Scholar]
  21. Shepherd, T.J.; Rankin, A.H.; Alderton, D.H.M. A Practical Guide to Fluid Inclusion Studies; Blackie & Son: Glasgow/London, UK, 1985; p. 240. [Google Scholar]
  22. Roedder, E. Natural occurrence and significance of fluids indicating high pressure and temperature. Phys. Chem. Earth 1981, 13, 9–39. [Google Scholar] [CrossRef]
  23. Wang, Y.-H.; Zhang, F.-F.; Li, B.-C. Genesis of the Yandong porphyry Cu deposit in eastern Tianshan, NW China: Evidence from geology, fluid inclusions and isotope systematics. Ore Geol. Rev. 2017, 86, 280–296. [Google Scholar] [CrossRef]
  24. Taylor, H. The application of oxygen and hydrogen isotope studies to problems of hydrothermal alteration and ore deposition. Econ. Geol. 1974, 69, 843–883. [Google Scholar] [CrossRef]
  25. Duuring, P.; Hagemann, S.G.; Banks, D.A.; Schindler, C. A synvolcanic origin for magnetite-rich orebodies hosted by BIF in the Weld Range District, Western Australia. Ore Geol. Rev. 2018, 93, 211–254. [Google Scholar] [CrossRef]
  26. Zhao, Y.; Wang, D.; Zhang, D.; Fu, X.; Bao, X.; Li, H.; Ai, Y. Ore Controlling Factors and Ore-Prospecting Models for Copper-Polymetallic Deposits in Southeast Inner Mongolia; Seismological Press: Beijing, China, 1994. [Google Scholar]
  27. Pope, E.C.; Bird, D.K.; Rosing, M.T. Isotope composition and volume of Earth’s early oceans. Proc. Natl. Acad. Sci. USA 2012, 109, 4371–4376. [Google Scholar] [CrossRef]
  28. Roedder, E.; Bodnar, R. Geologic pressure determinations from fluid inclusion studies. Annu. Rev. Earth Planet. Sci. 1980, 8, 263–301. [Google Scholar] [CrossRef]
  29. Driesner, T.; Heinrich, C.A. The system H2O–NaCl. Part I: Correlation formulae for phase relations in temperature–pressure–composition space from 0 to 1000 C, 0 to 5000 bar, and 0 to 1 XNaCl. Geochim. Cosmochim. Acta 2007, 71, 4880–4901. [Google Scholar] [CrossRef]
  30. Wilkinson, J. Fluid inclusions in hydrothermal ore deposits. Lithos 2001, 55, 229–272. [Google Scholar] [CrossRef]
  31. Baker, T.; Lang, J.R. Reconciling fluid inclusion types, fluid processes, and fluid sources in skarns: An example from the Bismark Deposit, Mexico. Miner. Deposita 2003, 38, 474–495. [Google Scholar] [CrossRef]
  32. Sośnicka, M.; Bakker, R.J.; Broman, C.; Pitcairn, I.; Paranko, I.; Burlinson, K. Fluid types and their geneticmeaning for the BIF-hosted iron ores, Krivoy Rog, Ukraine. Ore Geol. Rev. 2015, 68, 171–194. [Google Scholar] [CrossRef]
  33. Thorne, W.S.; Hagemann, S.G.; Sepe, D.; Dalstra, H.J.; Banks, D.A. Structural control, hydrothermal alteration zonation, and fluid chemistry of the concealed, high-grade 4EE iron orebody at the Paraburdoo 4E Deposit, Hamersley Province, Western Australia. Econ. Geol. 2014, 109, 1529–1562. [Google Scholar] [CrossRef]
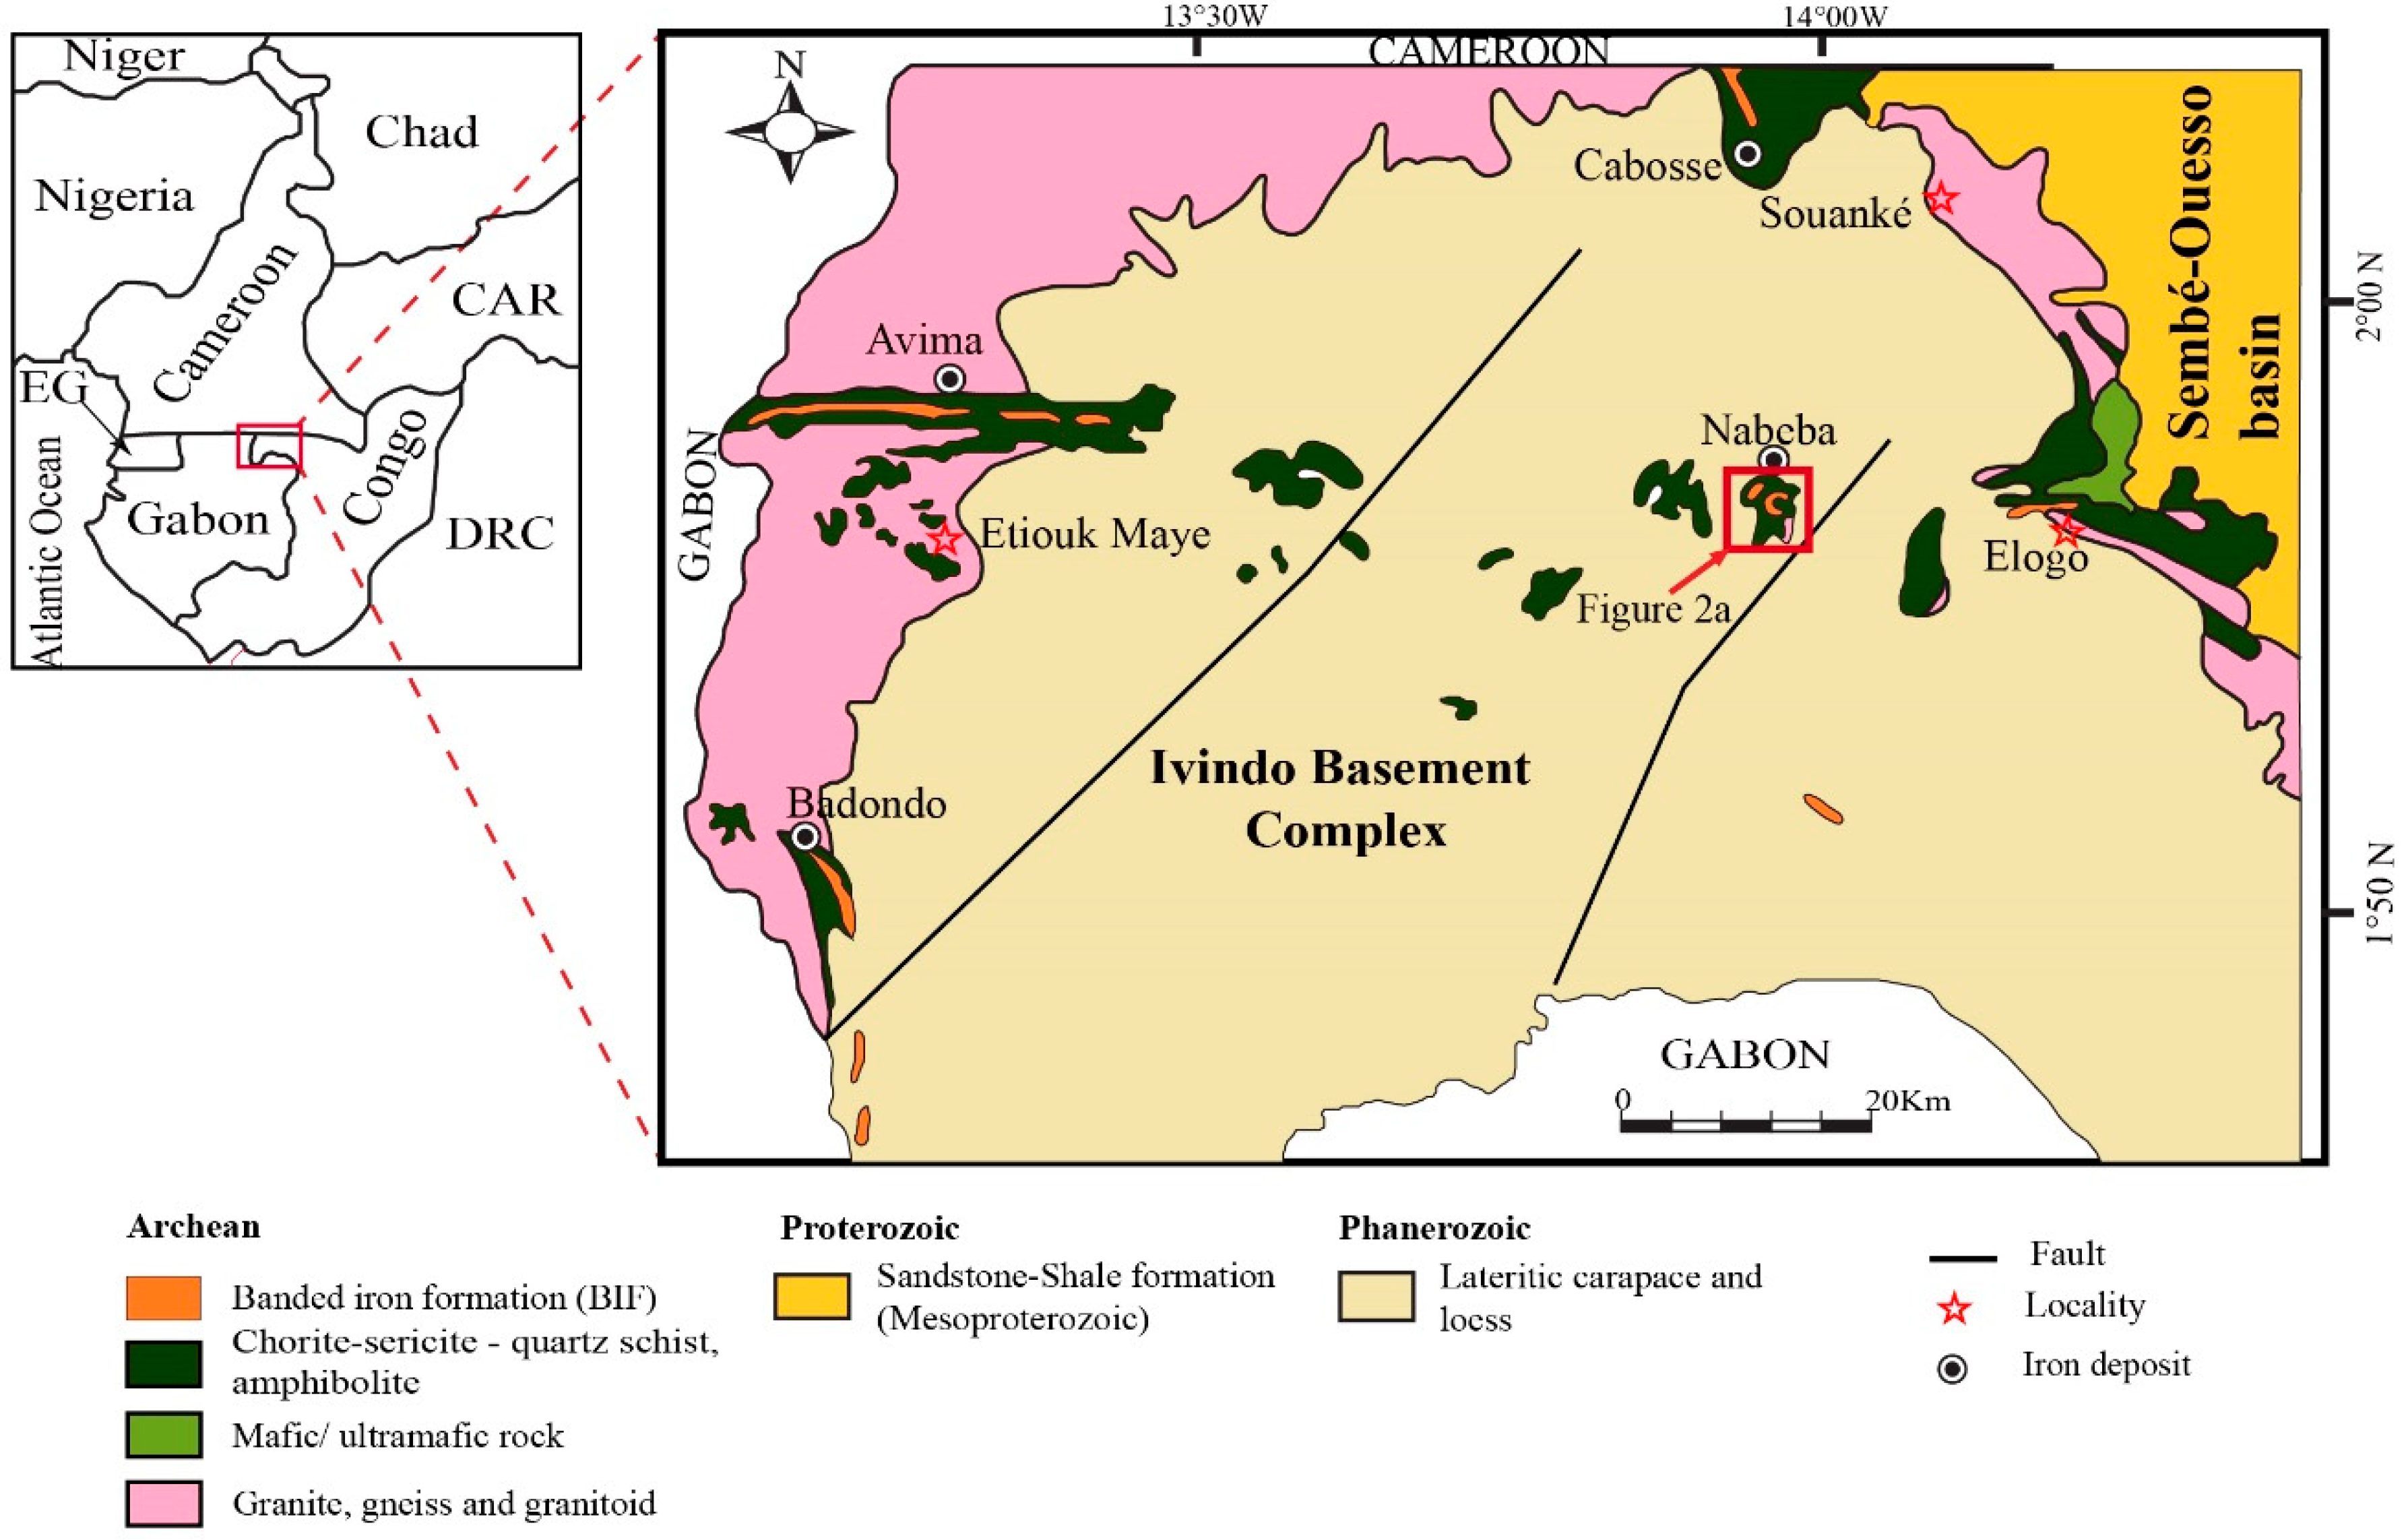
Figure 1. Regional geology of the northwestern Republic of Congo (modified after Ministère des mines et de l’énergie; Direction Générale des mines [11] and Desthieux [12]). Abbreviations: CAR, Central African Republic; DRC, Democratic Republic of the Congo; EG, Equatorial Guinea.
Minerals 09 00677 g001
Figure 2. (a) Geology of the Nabeba deposit (modified after Longley et al. [8] and Meloux et al. [13]); (b) drill holes showing vertical zonation of the deposit. Abbreviations: NB0001D, Nabeba diamond drill hole 0001D; NB0004D, Nabeba diamond drill hole 0004D; NB0012D, Nabeba diamond drill hole 0012D; NB0145D, Nabeba diamond drill hole 0145D.
Minerals 09 00677 g002
Figure 3. Structural interpretation of the Nabeba area (modified after Longley et al. [8]).
Minerals 09 00677 g003
Figure 4. Geologic sketch of representative drill cores that intersected hypogene iron ore associated with quartz veins in the Nabeba deposit. Abbreviations: AV (number), Associate quartz vein; BIF, banded iron formation.
Minerals 09 00677 g004
Figure 5. Paragenetic sequence of mineralization in the Nabeba deposit.
Minerals 09 00677 g005
Figure 6. Hand-specimen photos of the itabirite, showing the alternation of iron oxide-rich bands and quartz bands.
Minerals 09 00677 g006
Figure 7. (a) Euhedral to subhedral magnetite (Mag) crystals (Backscatter Electron image), magnetite and quartz boundaries locally display 120 °C triple junctions in hematite-enriched BIF; (b) photomicrograph displaying intergrowths of lamellar-grained specular hematite and crystalline quartz (Backscatter Electron image, stage HO-1); (c) granoblastic (metamorphic) recrystallization texture defined by hematite (stage HO-1; Backscatter Electron image); (d) high-grade iron ore showing hematite with magnetite relicts (reflected light); (e) microplaty hematite with distinct intergranular voids (likely caused by leached quartz or silicates) and local martite in high-grade hematite ore (Backscatter Electron image, stage HO-1); (f) photomicrograph showing large elongated magnetite grains forming magnetite bands orientated parallel to the banding of siderite and ferroan-magnesite, where pyrite occurs within it (reflected light, stage HO-2); (g) photomicrograph showing the assemblage of euhedral magnetite, chlorite, quartz, and ferro-microcline overgrowths. Siderite replaced by ferroan-magnesite (Backscatter Electron image, stage HO-2); (h) granular mass of hematite, high-grade iron ore (reflected light, stage HO-2); (i) martitization of magnetite along grain boundary with goethite (reflected light, supergene). Abbreviations: Chl, chlorite; Fe-Mc, ferro-microcline; Fe-Mgst, ferroan-magnesite; Fe-Ms, ferro-muscovite; Gt, goethite; grano-hem, granoblastic hematite; Hem, hematite; Mag, magnetite; Mt, martite; Mphem, microplaty hematite; Py, pyrite; Qtz, quartz; Sid, siderite; Spc hem, specularite hematite.
Minerals 09 00677 g007
Figure 8. Hand-specimen photos of the Nabeba iron ores associated with quartz vein. (a) Quartz vein controlled by S0 microbedding oblique to hypogene high-grade iron (HO-1 stage); (b, c) quartz vein B concordant with the hematite high-grade iron ore (HO-1 stage); (d) quartz veins crosscutting and concordant with the magnetite-rich ore (HO-2 stage). Abbreviations: Qtz, quartz; Mag, magnetite; Sid, siderite; Fe-Mgst, ferroan-magnesite; Hem, hematite.
Minerals 09 00677 g008
Figure 9. Photomicrographs showing different types of fluid inclusions observed in the Nabeba deposit. (a) Type I fluid inclusions in quartz vein A (HO-1 stage); (b) Type IIa fluid inclusions in quartz vein B (HO-2 stage); (c) Type I and Type IIa fluid inclusions in quartz vein A (HO-1 stage); (d) Type I and Type IIb fluid inclusions in quartz vein B (HO-1 stage); (e) Types IIb and IIIa fluid inclusions in quartz vein B (HO-1 stage); (f) Type IIIb fluid inclusions in quartz vein B (HO-1 stage).
Minerals 09 00677 g009
Figure 10. Histograms of homogenization temperature and salinity for all fluid inclusion types in the Nabeba deposit. (a) Fluid inclusion types in HO-1 stage; (b) Fluid inclusion types in HO-2 stage.
Minerals 09 00677 g010
Figure 11. Representative Raman spectra of fluid inclusions in vein quartz associated with hypogene iron ore of the Nabeba deposit. (a) H2O and CO2 spectra of the vapor phase in the Type IIIb fluid inclusion in quartz vein A (HO-1 stage); (b) CO2 spectrum of vapor phase in Type I fluid inclusion in quartz vein A (HO-1 stage).
Minerals 09 00677 g011
Figure 12. Plot of homogenization temperature versus calculated oxygen isotopic values of the ore-forming fluid in equilibrium with vein quartz A and B in the Nabeba deposit. The compositions of primary magmatic water [23,24], metamorphic fluids [25], the Mesozoic meteoric water in the northern Xilamulun district, northeastern China [26], and seawater [27] are also shown for comparison.
Minerals 09 00677 g012
Figure 13. Pressure estimation from fluid inclusion data for the Nabeba iron deposit. Isobars were calculated from the equations of Driesner and Heinrich [29].
Minerals 09 00677 g013
Figure 14. (a) Relationship between homogenization temperatures of CO2–Th(CO2) and amount of CO2 fraction–X(CO2) for Type IIIb aqueous-carbonic fluid inclusions. (b) The P–T diagram of isochores plotted for Type IIIb aqueous-carbonic fluid inclusions of ρ min and ρ max intersected by isopleth of 7 mol% CO2.
Minerals 09 00677 g014
Figure 15. Homogenization temperature versus salinity plot of fluid inclusion data associated with hypogene iron ore enrichment in the Nabeba deposit.
Minerals 09 00677 g015
Table 1. Summary of microthermometric data and calculated parameters for fluid inclusions in vein quartz associated with Nabeba hypogene iron ores.
StageSamplesF.I
Type (*n)
Size (μm)Tm_ice (°C)Tm_CO2Th_CO2Th _Total (°C)Tm_ClathrateTs_Halite (°C)Salinity (wt. % NaCl Equiv.) Bulk Density (g/cm3)
HO-1 stage Quartz vein A associated with hypogene hematite-rich ore (Samples AV8, AV9, AV10, AV14-1, AV14-2, AV14-3, AV15)Type I (9)5–10 −60.4 to −56.718.3 to 30.7 0.55 to 0.79
Type IIa Aqueous (64)6–22−10.6 to −0.6 203 to 405 1 to 150.59 to 0.98
Type IIb Aqueous (3)7.5–15.8−4.9 to −3.3 338 to 378 5.4 to 7.70.64 to 0.70
Type IIIa Aqueous (4)9–12 210 to 321 165 to 25030 to 351.01 to 1.10
Type IIIb Aqueous-carbonic (12)7–13.5 −59.9 to −56.714.2 to 29.9235 to 3693.5 to 8.6 2.8 to 11.20.89 to 1.04
HO-2 stage Quartz vein B associated with hypogene magnetite-rich ore (Samples AV25-1, AV25-2, AV26)Type IIa Aqueous (33)5–13.9−7.1 to −0.4 150 to 290 0.7 to 10.60.76 to 0.97
Type IIb Aqueous (2)6–8−3.3 to −1.1 211 to 228 1.9 to 5.40.85 to 0.90
Notes: F.I, fluid inclusion; Tm_clathrate, temperature of CO2-clathrate melting; Tm_halite, temperature of halite dissolution; Tm_ice, ice melting temperature; Tm_CO2, melting temperature of CO2; Th_total, total homogenization temperature; *n: number of measurements.
Table 2. Oxygen isotope data of vein quartz associated with hypogene iron ore in the Nabeba deposit.
Sample NumberSample Descriptionδ18OV-SMOW (‰)Ttminδ18Ofluid (‰)
CG-NB_AV25Quartz vein B, HO-2 stage13.2150 −2.3
CG-NB_AV26Quartz vein B, HO-2 stage14150 −1.5
CG-NB_AV8Quartz vein A, HO-1 stage18.9203–215 7.4–8.1
CG- NB_AV15Quartz vein A, HO-1 stage16.2203–215 4.7–5.4
Ttmin: Minimum trapping temperature (°C).