Article

Laser-Induced Breakdown Spectroscopy—An Emerging Analytical Tool for Mineral Exploration

by
Russell S. Harmon
1,*,
Christopher J.M. Lawley
2,
Jordan Watts
3,
Cassady L. Harraden
4,
Andrew M. Somers
5 and
Richard R. Hark
6
1
Department of Marine, Earth, and Atmospheric Sciences, North Carolina State University, Raleigh, NC 27695, USA
2
Natural Resources Canada, Geological Survey of Canada, 601 Booth Street, Ottawa, ON K1A 0E8, Canada
3
School of the Environment, University of Windsor, 401 Sunset Avenue, Windsor, ON N9B 3P4, Canada
4
Corescan Pty Ltd., Suite 1900, 1055 West Hastings Street, Vancouver, BC V6E 2E9, Canada
5
SciAps Inc., 7 Constitution Way, Woburn, MA 01801, USA
6
Institute for the Preservation of Cultural Heritage, Yale University, West Haven, CT 06516, USA
*
Author to whom correspondence should be addressed.
Minerals 2019, 9(12), 718; https://doi.org/10.3390/min9120718
Submission received: 22 October 2019 / Revised: 11 November 2019 / Accepted: 13 November 2019 / Published: 20 November 2019
(This article belongs to the Special Issue Novel Methods and Applications for Mineral Exploration)

Abstract

:
The mineral exploration industry requires new methods and tools to address the challenges of declining mineral reserves and increasing discovery costs. Laser-induced breakdown spectroscopy (LIBS) represents an emerging geochemical tool for mineral exploration that can provide rapid, in situ, compositional analysis and high-resolution imaging in both laboratory and field and settings. We demonstrate through a review of previously published research and our new results how LIBS can be applied to qualitative element detection for geochemical fingerprinting, sample classification, and discrimination, as well as quantitative geochemical analysis, rock characterization by grain size analysis, and in situ geochemical imaging. LIBS can detect elements with low atomic number (i.e., light elements), some of which are important pathfinder elements for mineral exploration and/or are classified as critical commodities for emerging green technologies. LIBS data can be acquired in situ, facilitating the interpretation of geochemical data in a mineralogical context, which is important for unraveling the complex geological history of most ore systems. LIBS technology is available as a handheld analyzer, thus providing a field capability to acquire low-cost geochemical analyses in real time. As a consequence, LIBS has wide potential to be utilized in mineral exploration, prospect evaluation, and deposit exploitation quality control. LIBS is ideally suited for field exploration programs that would benefit from rapid chemical analysis under ambient environmental conditions.

Graphical Abstract

1. Introduction

Mineral exploration plays an important role in society, as the continued discovery of new deposits is required to supply mineral and other natural resources for the more equitable and low-carbon economy of the future [1,2,3,4]. Rising global population and increased consumption by a growing middle class will apply new pressure to find additional resources, particularly for the elements that are required to make the specialized materials and components contained in advanced technologies [5,6]. The increased demand for these critical commodities led to significant investment by industry and government to search for additional mineral resources in green-field (i.e., remote) and brown-field (i.e., near mine) exploration environments [7,8,9]. However, the global trends of declining mineral reserves for many commodities and increasing discovery costs [3,4,10] suggest that exploration investment is insufficient and/or is not being deployed in the most effective manner possible. Both trends are also occurring at a time when new mineral deposit discoveries tend to be deeper, covered, and/or more remote, which are unlike near-surface mines that were often found, at least initially, by prospectors [4,7,8,9,11].
To address increasing demand and declining mineral reserves from deeper and more challenging deposits, the mineral exploration industry had to evolve and innovate by adopting new, cost-effective methodologies and technologies. For example, new conceptual models provide a predictive framework to identify the kinds of large-scale geological environments that should be considered the most prospective for finding additional mineral resources in greenfield areas of sparse geological data [12,13,14,15]. The ore system concept, which includes all of the geological processes required to transport and concentrate ore components from source to ore (i.e., drivers, sources, pathways, and traps), is one such predictive framework [12,13,14,16]. Because each of the required ore-forming components is manifested in the rock record as changes in mineralogy, texture, and/or composition, conceptual models can be transformed to mappable criteria to support mineral exploration [16]. Taken together, these mappable criteria are known as the mineral deposit’s footprint.
Some mineral deposit footprints are spectacular, including massive sulfide mineralization or coarse visible gold. Such obvious, mineralogical, and/or textural indicators are a direct consequence of ore-forming fluids and/or magmas transporting and concentrating base, precious, and critical metals. Geochemical and mineralogical investigations form the backbone of most mineral exploration programs, as geologists analyze minerals in sediments and hydrothermally altered bedrock, catalog the lithology and mineralogy of drill core, and model their spatial distributions at different spatial scales using the latest three-dimensional (3D) visualization tools. The recent introduction of field-portable technologies (e.g., X-ray diffraction (XRD), short-wavelength infrared (SWIR) spectrometers, field-portable X-ray fluorescence (fp-XRF)) is making the process of mapping geochemical and mineralogical footprints more robust and quantitative. Laser-induced breakdown spectroscopy (LIBS) is the latest addition to this group of technologies. Advanced technologies in the form of field-portable analyzers, mobile core scanners, and other on-site sensor technologies are also being utilized at drilling locations or in the core shack. As discussed and demonstrated here, chemical, mineralogical, and textural studies also have implications for processing and recovery of mineral resources later on in the supply chain, and LIBS analysis has an important potential application in such studies, as well as during initial exploration.
Advances in geophysical and geochemical methods, coupled with the reduced cost of these technologies, are also allowing more cryptic footprints to be mapped at greater resolution and/or larger spatial scales. Such multi-parameter, mineral deposit footprints are now well documented at most ore system types and are widely used to vector toward ore zones within individual deposits and, more rarely, at continent to mineral district scales [17,18,19,20]. Geophysical imaging is proven particularly effective at mapping these deposit footprints because ore-forming processes tend to produce mineralogical changes that impact rock properties, e.g., density, magnetic susceptibility, conductivity [21]. However, some components of a mineral deposit footprint can be invisible to geophysical methods, either because the rock property changes between the host rock and the ore-forming mineral assemblage are relatively subtle and/or because the ore-forming process only resulted in trace element substitution into the main rock-forming minerals. Cryptic geochemical footprints such as these may not be not associated with any visual indicators, but tend to be larger than any single mineralogical or geophysical pathfinder at most ore systems [19,22].
The identification of geochemical footprints has the potential to greatly increase the size of the exploration target. A large variety of approaches were deployed for geochemical vectoring, such as lithogeochemistry, stable and radiogenic isotopes, indicator minerals, hyperspectral scanning, biogeochemistry, hydrochemistry, and sediment geochemistry [23,24]. Each of these approaches depends on a growing list of analytical techniques with improved sensitivity for more elements, including mass spectrometry (e.g., inductively coupled plasma mass spectrometry (ICP-MS), secondary ion mass spectrometry (SIMS)), X-ray fluorescence (XRF), optical emission spectroscopy (ICP-OES), and a suite of electron micro-beam techniques (e.g., energy-dispersive spectroscopy (EDS), wavelength-dispersive spectroscopy (WDS), synchrotron micro-XRF). Despite this proliferation of geochemical methods and tools, many challenges remain. Firstly, mapping cryptic geochemical footprints requires low analytical detection limits because the absolute abundance of some pathfinder elements may range from μg/g (ppm) to ng/g (ppb) concentrations. Quantifying the low abundance of pathfinder elements is typically addressed by using large, expensive, and sensitive instruments hosted within research laboratories. Laboratory analysis is expensive, takes time, and most often needs to be completed off-site from the mineral exploration camp, which, in the case of greenfield exploration, often leads to a disconnect between sample collection and drill target decision-making. Secondly, most ore systems are complex and often comprise multiple overprinting events, some of which may be unrelated to mineralization. Unraveling the complex geologic history from the host rocks of ore systems must often be done at the microscale with mineral chemistry. Unfortunately, micro-analytical geochemistry was until very recently restricted to research applications due to the sophisticated instrumentation required and the lengthy time and high cost of analysis. Thirdly, the geochemical expression of ore-forming fluids and magmas often comprises more than just the element of economic interest. Very few analytical methods are capable of detecting the complete range of elements comprising a mineral deposit’s geochemical footprint. Therefore, mapping the complete multivariate geochemical footprint of mineral deposits often requires the use of multiple analytical techniques. Elements with low atomic mass (i.e., atomic number ≤12, or Mg), the so-called light elements, represent a specific challenge for conventional geochemical techniques despite their significant potential to be used as geochemical vectors. Some of these light elements (e.g., Li) also happen to be among the critical commodities that are required for green technologies in the low-carbon economy, which makes understanding their ore-forming processes particularly important.
Here, we focus on LIBS, an emerging technology for real-time chemical analysis in the field that has the potential to address each of the challenges of geochemical vectoring. We briefly introduce the theoretical and mechanistic basis of LIBS and follow that discussion with example applications relevant to mineral and ore deposit exploration, including element detection (i.e., geochemical fingerprinting), sample classification/discrimination, quantitative geochemical analysis, rock characterization (e.g., grain size analysis), and in situ geochemical imaging. The specific examples presented here illustrate how LIBS can (i) provide a geochemical signature for a large number of elements in minerals and rocks, including the light elements that cannot be analyzed by other in-field analytical techniques, (ii) support exploration decision-making with real-time and low-cost geochemical analysis in the field, and (iii) deliver micro-analytical geochemistry and textural analysis in support of mineral identification to unravel complex, multiply overprinting hydrothermal histories from the rock record.

2. Laser-Induced Breakdown Spectroscopy

Atomic emission spectroscopy is a technique for chemical analysis to determine either the presence or the mass fraction of an element present in a sample based on measurement of the intensity of light emitted from a flame, spark, arc, or plasma [25,26]. Laser-induced breakdown spectroscopy (LIBS) is an established, straightforward, reliable, and versatile form of atomic emission spectroscopy that has broad capability for rapid, in situ elemental detection in any material (solid, liquid, or gas), and quantitative analysis by LIBS is possible using either conventional calibration methods or calibration-free approaches [25,26,27,28,29,30,31]. Thus, LIBS has the potential for widespread use for rapid chemical detection and analysis outside the research laboratory. At its core, an LIBS analytical system (Figure 1) consists of just a few components: (i) a solid-state, short-pulsed, Q-switched laser operating at 1064 nm (or one of its frequency-multiplied harmonics) used to create a microplasma on the target, (ii) a set of optics to focus the laser light onto the target and to collect the light emitted as the plasma cools, (iii) a coupled fiber-optic and spectrometer/detector system for acquisition of the plasma light emission and spectral resolution of the light spectrum, and (iv) a computer for system control and data processing.

2.1. The LIBS Analysis

In LIBS, a high-intensity pulsed laser beam is focused onto the surface of a sample, which creates a high-temperature plasma through the multi-stage breakdown process that occurs when laser energy couples to a material. Typically, a sub-mg amount of material is ablated, vaporized, and dissociated in the high-temperature plasma into a mixture of free electrons and weakly ionized molecular, atomic, and ionic species. The plasma cools down rapidly, causing species recombination, de-excitation, and the release of energy as photons when electrons return to lower energy levels. Relatively sharp spectral lines are produced at discrete wavelengths after a few hundred nanoseconds of plasma expansion and cooling that results in the decay of the continuum emission caused by radiative recombination and bremsstrahlung radiation. The detector can be time-gated to optimize collection of the LIBS emission for specific elements. Because all elements emit in the 200–900 nm spectral range and many electron orbital transitions occur for most elements, an LIBS emission intensity spectrum, such as that shown in Figure 2, consists of multiple peaks for the majority of elements and contains hundreds to thousands of spectral lines for most geological materials. Monitoring the wavelength and intensity of emission lines in the LIBS plasma provides information on both the chemical species present and their abundance. The spectral line wavelength documents the identity of an element, whereas its intensity is proportional to the number of atoms of the element present. Generally, elements on the left side of the periodic table, such as Li, Na, and Ca that have relatively low ionization energy, display strong emission and, therefore, can be detected at very small abundances. By contrast, non-metallic elements on the right side of the periodic table with high ionization potentials, such as the halogen elements, are more challenging to determine by LIBS and, consequently, have much higher limits of detection.
Gases can be analyzed by forming the plasma within the gaseous environment of interest. Liquid analysis is accomplished by focusing the laser on the surface of the liquid or within the body of a liquid below its surface. The character of the micro-plasma created during solid sample analysis is complex and determined by several interrelated factors—the nature of the material being ablated (e.g., its composition, crystallinity, surface texture, and optical reflectivity), the operational characteristics of the laser (i.e., wavelength, energy, beam shape, and pulse duration), the degree of laser energy coupling to the sample surface, and the ambient environment in which the LIBS plasma is formed [32].

2.2. Specific Attributes of LIBS

LIBS has many attributes that make it an attractive analytical tool for analysis of a wide variety of geological materials both in a conventional laboratory setting and in the field. LIBS can analyze material in any state (solid, liquid, or gas) in real time with little to no sample preparation. All elements have optical emission lines within the 200–900-nm spectral range; thus, LIBS can detect all elements with typical limits of detection in the μg/g range. LIBS is especially sensitive to the light elements (H, He, Li, Be, B, C, N, O, Na, and Mg) that can be present in high abundance within natural materials but are difficult to determine by many other analytical techniques (e.g., fp-XRF). The LIBS signal generation of simultaneous multi-element emission can also be used for simple elemental detection or for quantitative analysis in real time. Despite the complications associated with the analysis of solid samples noted above, quantitative analysis is readily achieved by LIBS. Excellent precision and accuracy can be obtained utilizing an external calibration approach based on reference materials that are very closely matrix-matched to the type of samples being analyzed [33,34], and semi-empirical analysis is possible through calibration-free methodologies or through internal calibration-free techniques [35,36].
LIBS spectral analysis is capable of identifying and discriminating unknown materials when used in conjunction with chemometric techniques and pre-established databases. A particularly attractive feature of LIBS is its capability for chemical analysis outside the laboratory with little or no sample preparation for applications, such as geological prospecting, where rapid in-field analysis under ambient conditions is beneficial. Winterburn et al. [23] noted that the light-element detection capability of LIBS is particularly valuable in an exploration context. A recent increase in global demand for Li promoted the application of LIBS as a field analytical tool. As demonstrated herein, LIBS has the potential in the near future to become nearly as common a field tool in mineral exploration as fp-XRF.
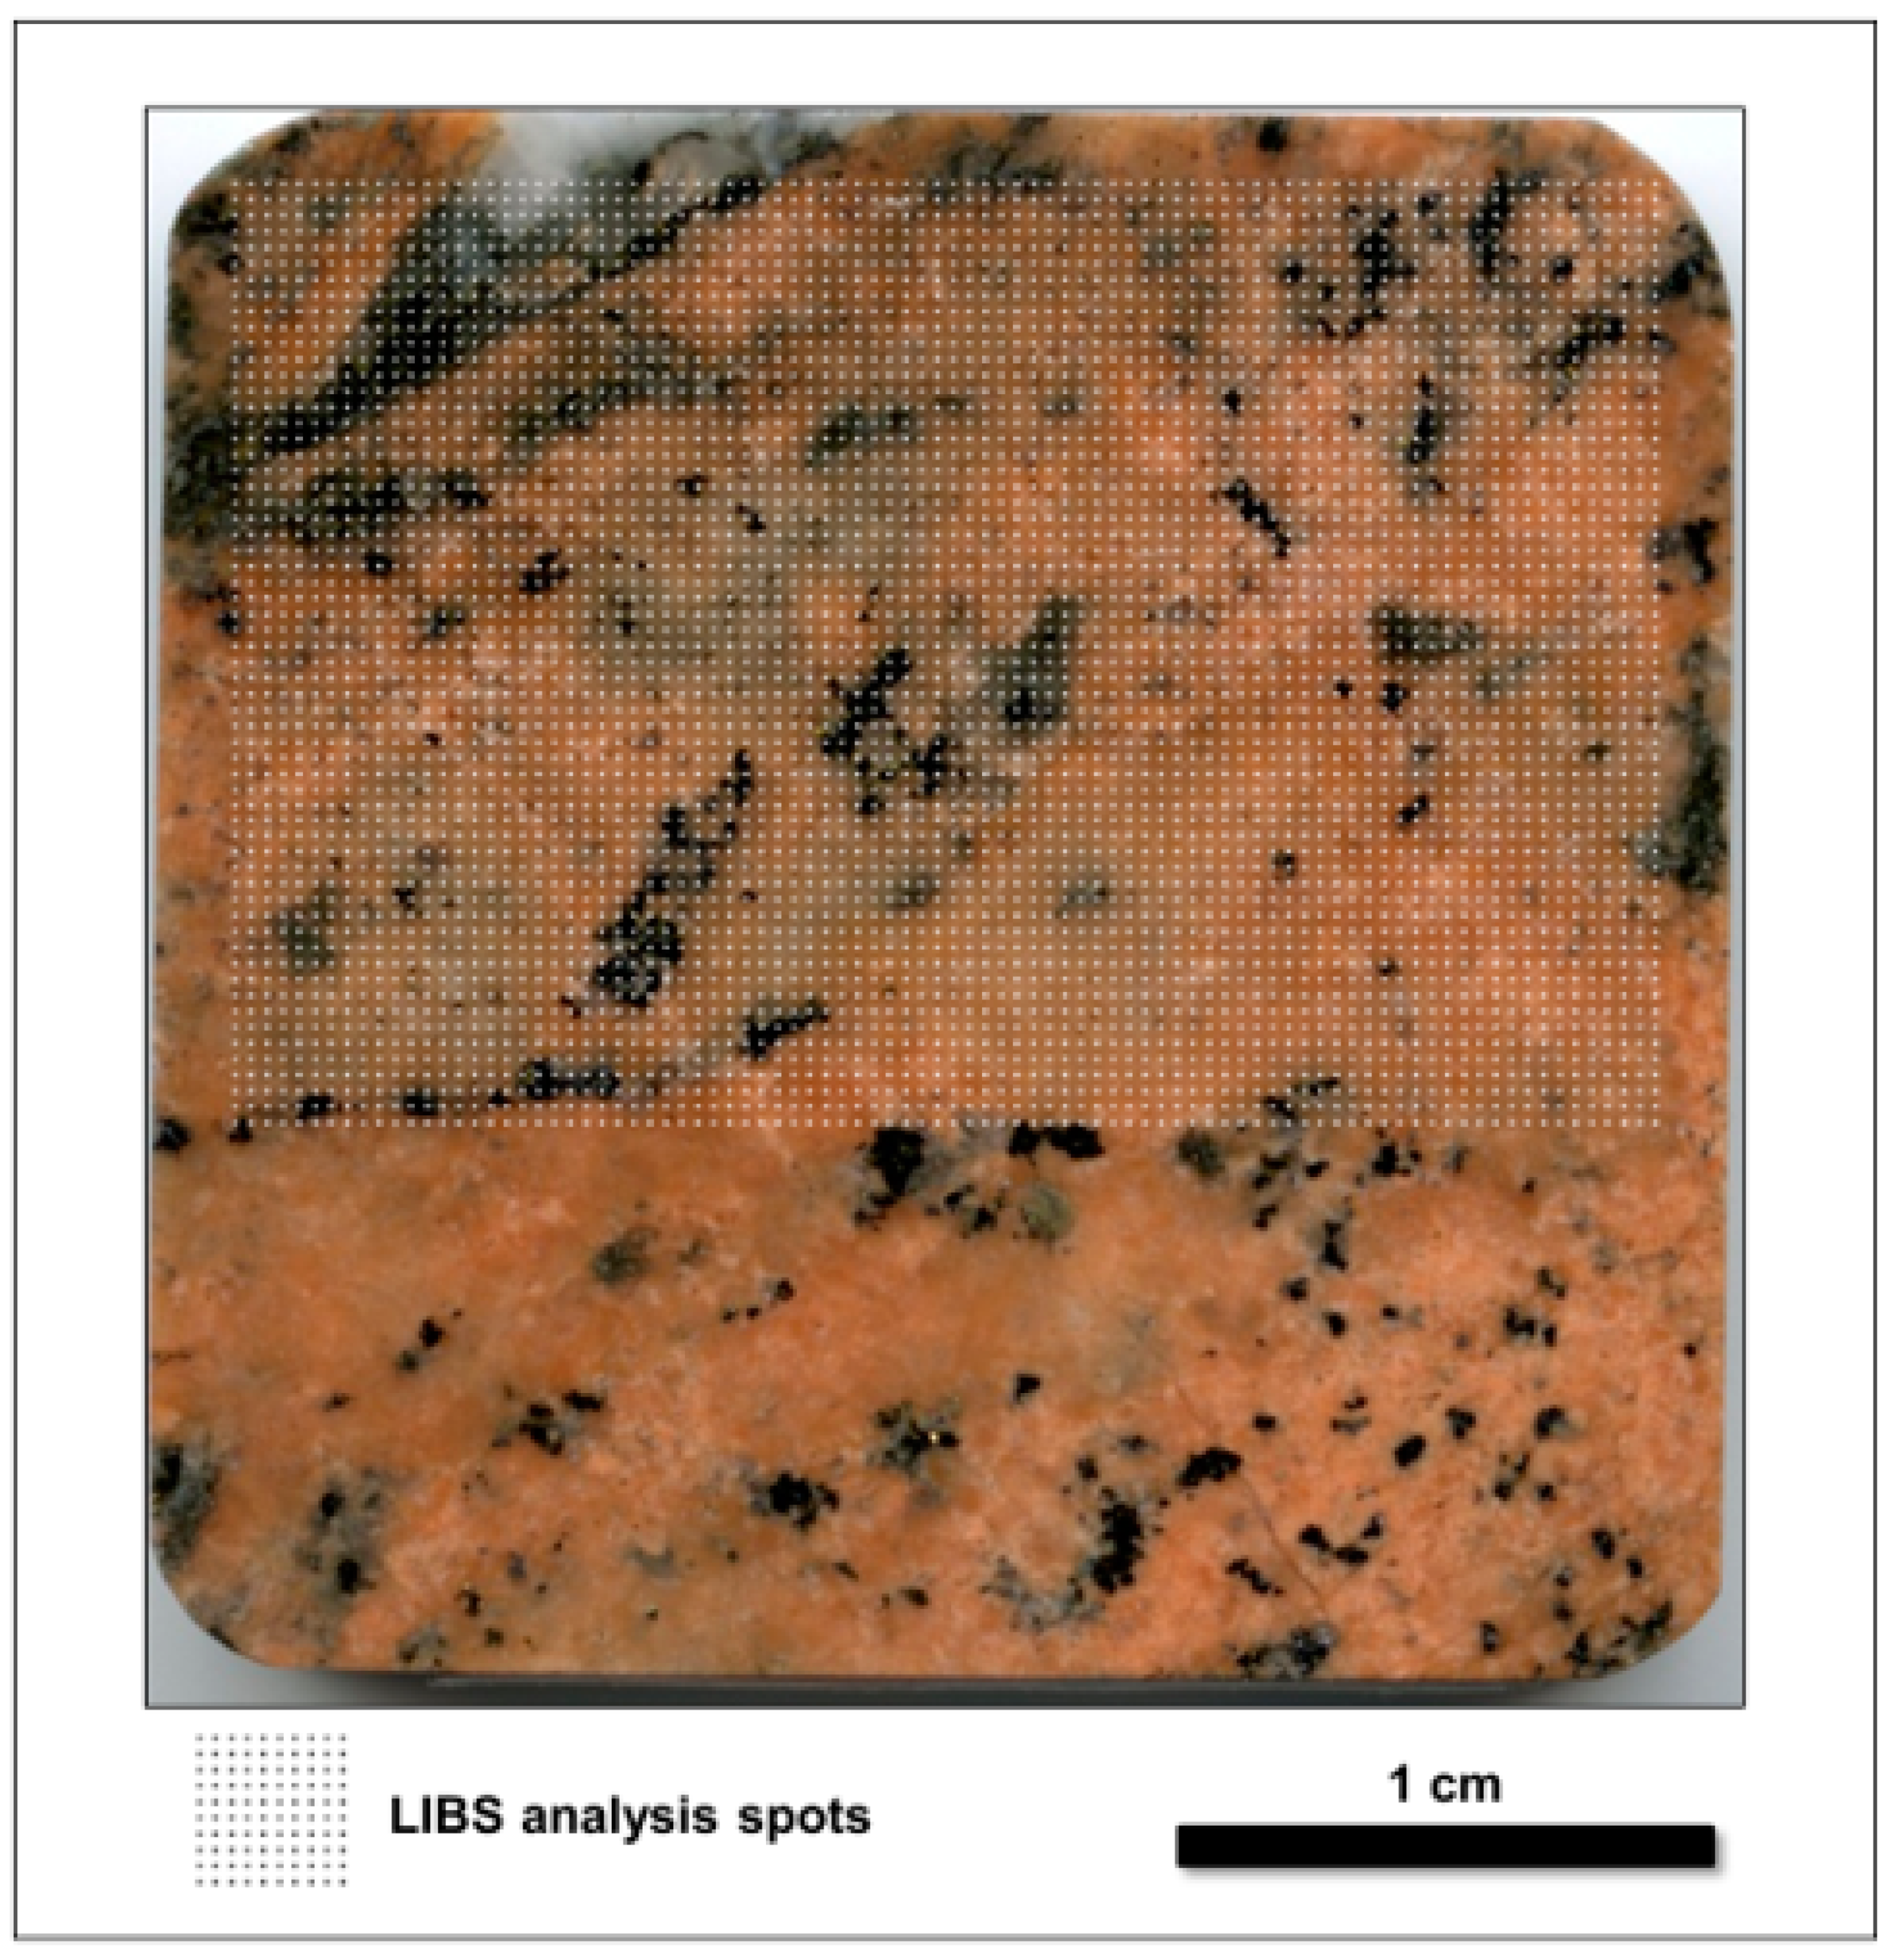
There is the additional feature that LIBS sampling is highly spatially resolved, as the plasma forms over a limited spatial area of only tens to hundreds of microns on the sample surface, so that only a small amount of material (typically picograms to nanograms) is sampled by each laser pulse. This allows for in situ analysis of individual particles, mineral grains, or inclusions [33,37,38,39,40,41], as well as the fine-scale compositional mapping of a complex sample such as a chemically zoned mineral [42,43,44,45,46,47], the analysis of thin crusts, coatings, or surface alteration zones without substrate interference [48], or chemical analysis at highly spatially resolved spatial scales to below ~10 μm [47,49,50,51,52,53,54]. Stratigraphic analysis of a sample by depth profiling is also possible, as sequential ablation forms a vertical crater that progressively bores down into a sample with successive laser pulses [55,56,57].

2.3. LIBS for Ore Prospecting

LIBS followed a typical arc of technology development. Since its beginnings in the 1960s, and throughout most of its history, LIBS was a laboratory-based research technique. Typically, researchers would assemble LIBS systems in many different configurations to conduct experiments aimed at understanding some aspect of laser–material interaction, breakdown phenomena in different media, or plasma physics. This resulted in a multiplicity of different bespoke and often ad hoc system designs that would frequently be modified from one experiment to another. However, this situation began changing in the early 2000s, driven by advances in compact laser sources, optical-fiber light delivery and collection and compact beam optics designs, and the miniaturization of high-resolution spectrometers, microelectronics, and computers that in parallel led to commercial laboratory LIBS systems, mobile LIBS devices, and handheld LIBS analyzers for real-time chemical analysis outside the laboratory [58,59,60,61,62,63,64,65,66,67]. Because of recent technological advances, the current generation of LIBS handheld analyzers has many features present in laboratory systems, including variable gating, gas purging, sample rastering, video targeting, and on-board chemometric analysis, which substantially enhance the application of LIBS outside the laboratory. Researchers utilized each stage of technology development to understand and demonstrate how LIBS might be utilized in prospecting for economic minerals and ores. Some early studies that set the stage for the applications discussed here are reviewed in the paragraphs that follow.
It is well established that LIBS is an efficacious means for rapidly discriminating different types of minerals [68,69], and LIBS is widely applied to the analysis of ore samples in this context. Early application of LIBS to ore prospecting and processing examined the effects of particle size and ore mineralogy on the quantitative analysis of major, minor, and trace elements in iron ore and phosphates [70,71,72,73,74,75,76].
In a pioneering LIBS study, Kaski et al. [50] demonstrated in a laboratory study using a bespoke LIBS system that sulfide minerals in drill cores could be rapidly identified in situ. The spectral region between 170 and 210 nm was monitored using a Kr–F excimer laser operating at 248 nm to create the emission plasma. This spectral region was selected for interrogation because the most intense sulfur lines are located here, and all minerals analyzed have a characteristic emission spectrum in this region. Reference spectra of pyrite, pyrrhotite, chalcopyrite, and sphalerite were obtained by accumulating the emission signals generated by 10 laser pulses acquired in air, and then three mineralized drill core specimens were analyzed along 5 cm lines at 0.2 mm sampling intervals using five laser pulses at 15 Hz repetition rate, with unknown spectra matched with reference spectra for identification. In one drill core, some 33% of the sampling points were observed to be sphalerite, 27% of them were observed to be pyrrhotite, and 23% of them were observed to be barite; pyrite comprised >70% of the sulfides in a second core, and the third was composed of 43% dolomite and 25% pyrite.
Haavisto et al. [51] used a similar analytical approach with a bespoke LIBS system to demonstrate the potential of LIBS for on-line analysis of an Au-mineralized drill core from the Agnico-Eagle Kittilä Mine in northern Finland, where the main minerals in the ore are carbonates, quartz, albite, chlorite, sericite, and graphite, with Au in the ore contained primarily in arsenopyrite and pyrite. Elemental concentrations determined by LIBS corresponded to laboratory assay by X-ray fluorescence. Gold was not detected by LIBS because of the refractory nature of the ore, but measured As concentrations directly reflected the amount of Au in the ore. Chemometric data processing based on based on principal component analysis was able to extract mineralogical information from the LIBS spectra based on elemental ratios.
Kuhn et al. [46] used LIBS as a method to obtain chemical information for drill cores from tailing material in a former Pb–Zn deposit at Beythal near Aachen, Germany. This deposit was mined for 43 years, with 3.7 Mm3 of flotation residues deposited over an area of about 45 ha. The tailing material was characterized by quartz and phyllosilicate sand plus minor amounts of carbonate, with drill cores 1 m long and 5 cm in diameter taken from a depth of about 7–9 m below surface. LIBS analyses were obtained utilizing a prototype LIBS core scanner system manufactured by LTB Lasertechnik GmbH (Berlin, Germany), capable of mapping an area of 1 m by 2.5 cm at a user-defined step size. Cores were mapped within an area of about 1 m by 1 cm at a step size of 400 μm, collecting the emission from five laser shots in air into each of 25 cumulate spectra along the y-direction and between 2478 and 2490 spectra along the x-direction for a total of approximately 62,000 spectra per meter of core. Quantitative analysis was undertaken on the basis of internal reference samples by partial least squares regression. Maximum concentrations of Pb, Zn, and Cu were observed between 785 and 789 cm sediment depth in the tailings pile, with average bulk concentrations of 0.95% Pb, 1.20% Zn, and 262 ppm Cu in that depth range. Distribution patterns of element content and variation predicted for whole drill cores exhibited a good correlation with determinations by WDS analysis.
Several recent studies examined gold ore using LIBS analysis as a means of improving ore processing efficiency and productivity through innovation in on-line analysis and control, automation, and real-time decision support. Monitoring and control of ore quality during mining operations utilizes laboratory analysis and, thus, requires sample collection and preparation for off-line analysis via traditional laboratory methodologies, an approach which is time-consuming and expensive, and which can also cause production delays to mining or processing that increase a mine’s operating and production costs.
Harhira et al. [77] investigated the use of LIBS to assess gold ores and quantify gold content in an Au-bearing core from the Lapa Mine in Quebec, Canada. The bespoke LIBS system employed a pulsed neodymium-doped yttrium aluminum garnet (Nd:YAG) laser operating at the fundamental wavelength of 1064 nm, which delivered a maximum pulse energy of 300 mJ at a maximum repetition rate of 10 Hz. The plasma emission in air was recorded by a Czerny–Turner/intensified charge coupled device (ICCD) spectrometer/detector system that was optimized for a spectral window centered at 265 nm and was tuned in terms of spectral response, sensitivity, and resolution to meet the requirements of detecting the Au at the ppm level. The first part of this study documented that principal component analysis of LIBS spectra was able to differentiate between Fe-rich and Si-rich gold-bearing minerals by using the data as geochemical fingerprints of the mineralized-rock mineralogy. The second demonstrated quantitative Au analysis in drill core with limits of detection of 0.75 ppm for Si-rich samples and 1.5 ppm for Fe-rich samples. The core was mounted on a motorized stage for scanning across the sample surface, with LIBS spectra acquired based on 10,000 laser shots of ~600-µm spot size at a step interval of 800 µm over a scanned area of 5 × 20 cm2 on the flat drill core surface. Calibration curves prepared from synthetic samples having Au concentrations between 0 and 120 ppm were used to quantify the Au content based on the measured intensity of the Au emission line at 267.59 nm. Averaging over the 10,000 laser shots gave a mean Au content in the core sample of 25.47 ppm, but the LIBS analysis also documented the heterogeneous distribution of Au in the core at the millimeter spatial scale, with high Au contents of up to a few thousand ppm recorded at some locations but very low concentrations at other sites. A quartz chlorite was determined to contain 31 ppm Au and 4.99% Fe, whereas 25.4 ppm Au and 39.55% Fe were measured for a pyrite sample.
Rifai et al. [47] determined the Au contents of 43 rock samples and 44 synthetic pressed powder reference materials of different composition, which had quasi-homogeneous Au concentrations between 0 and 1000 ppm based on a calibration curve developed using the Au spectral line at 267.59 nm. The bespoke LIBS system used for this study consisted of a 1064-nm Nd:YAG laser capable of delivering pulse energies of up to 600 mJ at a repetition rate of 10 Hz. The LIBS spectral emission in air was recorded by a Czerny–Turner spectrometer equipped with a grating of 2400 lines/mm blazed at 300 nm that covered the wavelength range of 180–650 nm. An ICCD camera with a resolution of 12 pm/pixel at 267 nm was coupled to the spectrometer to complete the LIBS system. Chemometric data processing using principal component analysis indicated that ~83% of the LIBS spectral variation was attributable to the presence of Fe in the samples. The calibration curve was characterized by two distinct branches, one for Si-rich samples and the other and for Fe-rich samples, with limits of detection of 0.8 ppm and 1.5 ppm, respectively. A detailed mapping of the Au content in a solid core sample revealed heterogeneity of the Au distribution at multiple spatial scales.
In a set of companion papers, Diaz et al. [53,78] first developed an analytical protocol for the quantification of Au and Ag in pressed pellets of surrogate samples prepared by the doping of an Au-free particulate matrix with Au and Ag standard solutions and naturally occurring Au- and Ag-bearing ore samples from a Colombian mine and then investigated the effects of laser wavelength and irradiance on gold analysis. The local geology in the vicinity of the mine consisted of mesothermal to epithermal gold-bearing quartz veins hosted in zones of faulting/shearing in the local granitoid intrusive and metamorphic rocks. Gold in ore samples was present as free native gold, electrum, and in association with the sulfide minerals pyrite, chalcopyrite, and galena. A bespoke laboratory LIBS system consisting of an Nd:YAG laser operating at 450 mJ, with a 6-ns pulse duration and a 5-Hz pulse repetition rate, was used to produce the LIBS plasma in air, with the plasma emission recorded by a 300-mm-focal-length, 10-μm-slit Czerny–Turner spectrometer. The effect on Au quantification was investigated at laser wavelengths and irradiances for 355 nm from 0.36–19.9 × 10⁹ W/cm2 and from 0.97–4.3 × 10⁹ W/cm2 at 1064 nm, respectively. Calibration curves behaved linearly for all wavelengths and irradiances, samples, and analytes for concentrations from 1–9 ppm Au in the surrogate samples and 0.7–47.0 ppm Ag in ore samples, but it was not possible to develop calibration curves for the Au-doped surrogates below 1 ppm and at any concentration for ore samples. Detection and intensity measurement of Ag was straightforward using the spectral line at 328.06 nm for concentrations from 0.4–43 ppm in ore samples. The spectral emission line for Au at 267.59 nm was not observed after accumulation of 100 single-shot LIBS spectra of ore samples with Au contents of up to 9.5 ppm, but quantification was successfully achieved at concentrations as low as 1 ppm after 5000 laser shots. It was noted that Ag quantification was accomplished at a limit of detection of 0.4 ppm without regard to matrix composition, but that the matrix effect is an important consideration for Au quantification, as different calibration slopes were observed for the surrogate samples that were prepared from quarry sands of similar chemical composition to the ore matrix at limits of detection between 0.8 and 2.6 ppm.

3. Analytical Methods

As noted for specific instances in the discussion that follows, with one exception, the results presented were obtained on either an RT100-HP laboratory LIBS system manufactured by Applied Spectra Inc. (West Sacramento, CA, USA), or one of the Z-series handheld analyzers manufactured by SciAps Inc. (Woburn, MA, USA). One of the premier attributes of LIBS analysis is that minimal to no sample preparation is required. Generally, it is common practice to use the first few laser shots to clean the surface of a mineral or section of core as it is scanned, but this is not necessary if a freshly exposed surface is analyzed and may not be desirable for soil analysis.
The RT100-HP is a versatile commercial laboratory LIBS system that consists of a 50-mJ Nd:YAG laser operating at 1064 nm with a 5-ns pulse width and 1–20-Hz variable repetition rate, a Czerny–Turner spectrograph, and a high-performance ICCD detector. Operational parameters that can be controlled include laser power, gate width, and signal acquisition delay time. The spectrograph/ICCD detector has a dual grating turret, involving 600 grooves/mm for low-resolution analysis and 2400 grooves/mm for high-resolution analysis, respectively providing 0.2–0.3-nm and 0.05–0.1-nm spectral resolution across a 190–1040-nm spectral window to produce composite LIBS spectra with over 12,000 data points. The wavelength coverage is adjustable, with the low-resolution option allowing for a 230–260-nm wavelength range and the high-resolution setting providing a 35–50-nm range. In addition, a broadband option is available in which the six gated Czerny–Turner spectrographs are coupled with high-performance CCD detectors to provide coverage from 187–1044 nm at a resolution of 0.055–0.068 nm. The RT100-HP has an automated 3D translational stage that permits data to be collected over a user-defined grid pattern at 0.5-mm spacing, with a guide laser for ablation spot location, complementary metal–oxide–semiconductor (CMOS) camera imaging, and active focusing system that automatically refocuses the laser onto the surface each time the stage is moved to a new surface location.
Handheld LIBS analyzers are well suited to geochemical applications [65,79,80], particularly for real-time analysis in the field. The work reported here utilized the Z-300 LIBS analyzer or its Z-500 predecessor. Both instruments have a built-in camera for beam targeting, a translational stage for 3D beam rastering across the sample surface, the capability to flow an inert gas across the sample surface, and broad spectral ranges of 190–950 nm for the Z-300 series instruments or the more limited 180–675 nm range for the Z-500 series. Typical detection limits for the Z-300 are in the tens to hundreds of ppm range for most elements when averaged across the field of sample collection points, which is possible with its rastering capability. The binary presence or absence of specific elements, such as Au, which are typically heterogeneously distributed within samples, can be observed at far lower concentrations especially when using high-density rastering [65].
The Z-300 uses a proprietary PULSARTM 1064-nm Nd:YAG pulsed laser with a 50-μm focused beam size. This diode-pumped solid-state laser delivers 6 mJ to the sample at a 1-ns pulse duration and 10-Hz firing rate. The instrument is capable of delivery of Ar or He purge gas directly to the sample surface. Small, replaceable gas cartridges that fit in the handle of the Z-300 can be used for field-based analyses. Alternatively, the Z-300 can be connected to a larger gas cylinder for stationary use. It is also possible to operate the analyzer in air without purge gas. If the purge gas is selected, flow is started shortly before the laser pulse train to displace any air present and ceases after the last shot to minimize gas consumption. The Z-300 analyzer is equipped with a 3D translation stage that is computer-controlled for automatically adjusting the laser focus on each sample location. Automated stage movements allow analysis over a raster pattern of up to a 2 × 2 mm area. The raster pattern, its internal spacing, and number of laser shots can be customized by the user. Multiple laser shots can also be collected at each location to improve data quality. Non-analytical cleaning shots, i.e., firing of the laser during which no data are collected, can be performed prior to the collection of data to remove surface coatings or tarnish. The resultant light emission signal from the micro-plasma is collected and the light is passed by fiber-optic cable into three internal spectrometers covering the wavelength intervals of 190–365 nm, 365–620 nm, and 620–950 nm. The Z-300 is equipped with time-gated CCD detectors with a resolution of 0.1 nm full width at half maximum (FWHM) below 365 nm and 0.3 nm above 365 nm. Data are typically collected with 1-µs delay times (i.e., the time between the laser pulse and beginning of emitted light collection and integration) over a 1-ms integration time, although data can be collected in a non-gated state or with variable gate delays from 250 ns up to 100 ns in 20.8 ns increments. This produces composite LIBS spectra comprising more than 23,400 data points.
The SciAps LIBS analyzers used in our work employ an Android operating system with a graphic user interface (GUI), and they are operated in the field by rechargeable Li-ion batteries that provide up to 10 h of operation or in the laboratory by connecting to alternating current (AC) power. Acquired spectral data can be stored on the analyzer and accessed via GUI, downloaded to a local computer via Universal Serial Bus (USB) or Wi-Fi, or emailed using a mail account set-up on the instrument when Wi-Fi is connected. There are two different methods for geochemical analysis: (i) a GeoChem mode that provides a quantitative analysis based upon a previously developed empirical calibration curve, and (ii) a GeoChem Pro mode for qualitative analysis that can both identify the spectral peaks of specific elements and generate estimated elemental concentration maps based upon the relative intensities of selected elemental peaks across a raster pattern.

4. Results and Discussion

4.1. Elemental Detection and Qualitative Analysis

Geological materials have an extremely wide range of composition, grain size, texture, and surface roughness. These features can be highly variable in the spatial scale and, thus, affect the LIBS analysis. For example, whether a sample surface is polished and smooth versus naturally rough determines the degree of laser energy coupling to the surface and consequent strength of the LIBS signal produced. Most rocks consist of multiple minerals. These minerals are of different hardness with variable grain size, and the minerals themselves may have interstitial phases, micro-fracture fillings, grain-boundary precipitates, or solid and liquid inclusions of different composition. Many minerals, particularly those in silicate rocks, are compositionally zoned. Soils and poorly indurated rocks may be aggregates of particles whose response to the laser pulse is unlikely to yield a reproducible plasma from one laser pulse to another. Variations in the intrinsic characteristics of these materials affect the development of the plasma and the resultant spectral emission intensity. For example, variations in the grain size or moisture of a soil sample can influence the detection limit of an element [69]. Thus, in many applications, where elemental abundance information is sought, it is common practice to aggregate the light emission signal from hundreds or thousands of laser pulses as a means of mitigating shot-to-shot variations in emission signal intensity arising for the reasons previously discussed. However, there is an increasing interest within the geosciences community to use single-pulse, qualitative LIBS elemental detection and material identification and discrimination.
Elemental detection is readily accomplished with LIBS by monitoring the spectral position of emission lines in the LIBS spectrum, so that the chemical species present in a sample can be readily ascertained by identifying the different peaks in an LIBS emission spectrum (Table 1, Figure 2). A broadband LIBS spectrum can be considered a geochemical fingerprint for a sample because all elements emit over the 200–900-nm range of typical LIBS signal monitoring. The concept of geochemical fingerprinting holds that minerals form in certain structures according to sets of well-understood rules (i.e., mineral stoichiometry) and that the chemical composition of a mineral or rock reflects the geological environment and processes associated with its formation [81]. In an LIBS context, geochemical fingerprinting uses the totality of chemical information contained in a broadband emission spectrum to provide a qualitative compositional comparison and discrimination amongst a group of related samples through chemometric analysis of their LIBS spectra [69,82,83,84,85,86]. As noted by Harmon et al. [79], although elemental identification and quantification is a primary LIBS capability, geochemical fingerprinting by LIBS can also be readily used (i) to discriminate between rocks and minerals of similar appearance but different composition, (ii) for stratigraphic correlation of volcanic, sedimentary, or metamorphic rocks, and (iii) to determine geomaterial provenance when used in conjunction with statistical chemometric data processing techniques.
Sample discrimination using qualitative LIBS data is a fundamentally different task than using LIBS to quantify the absolute abundance of an element of interest in a sample. The discrimination/classification task relies on chemometric approaches using multivariate statistics to develop a set of mathematical features to characterize each sample in a population. For LIBS, these features are the plasma emission intensities at each wavelength, as illustrated in the broadband spectra of Figure 2. For classification/discrimination, it is required that that each feature must be the same for every input to the classifier. Therefore, for example, if the 100th feature in an LIBS spectrum for one sample is the Pb emission line intensity at 405.78 nm in the spectrum, then the 100th feature for all samples must be that same emission line intensity. Classification approaches develop statistical models for the behavior of each feature in a dataset and, then, based on these models, determine which features are most important for the discrimination between the classes of samples to be labeled, rather than using a priori knowledge of the elements that are likely to distinguish samples collected from different sources. Once a classifier is trained on a dataset that links samples to their respective classes, the features the classifier used to make its decisions can be identified, and knowledge can be obtained about the compositional differences by which samples were discriminated. Then, by creating representative libraries of LIBS spectra from samples of known origin, one can readily develop classifier models that allow for identification and provenance attribution of samples of unknown origin. This is the approach utilized in the examples for the carbonate minerals, garnet, cassiterite, columbite–tantalite, and gold discussed below.

4.1.1. Chemometrics

Principal component analysis (PCA) is an unsupervised statistical analysis technique that reduces the complexity (i.e., dimensionality) of multidimensional compositional data by finding linear combinations of variables (i.e., principal components) that explain the differences between samples. This type of exploratory data analysis provides a graphical representation of the natural grouping of samples and highlights which variables (i.e., emission wavelengths) most strongly influence sample class differentiation. PCA scores are linear combinations of the original variables and describe how the samples relate to each other, whereas PCA loadings contain information about how the variables relate to each other. The first few PCA loadings usually explain most of the covariance observed between samples.
Partial least squares discriminant analysis (PLSDA) is a supervised inverse least squares technique in which an algorithm with predictive latent variables is created that maximizes the variance between input variables. In the case of LIBS analysis, the object is to differentiate samples on the basis of their emission spectra. Once the algorithm is trained on a sample of known origin, the model can then be used to predict the probability of an LIBS spectrum from a new sample belonging to a previously identified class. PLSDA results can be displayed in the form of a “classification matrix”, in which the model classes represent the different categories (e.g., a geographic identifier such as the sample, mine, or area location), to which each LIBS spectrum was assigned prior to building the PLSDA model. The algorithm then places each of the spectra being evaluated into one of the model classes. Correct classification corresponds to the values found along the diagonal, whereas values in off-axis cells correspond to misclassifications. PLSDA was proven to be a particularly effective technique for geochemical fingerprinting because it maximizes the inter-class variance (i.e., provenance) whilst minimizing the intra-class variance (i.e., shot-to-shot variability).
The necessary foundation for turning a successful geochemical fingerprinting study for lithologic correlation or mineral provenance determination into a practical application utilizing supervised chemometric analysis (e.g., PLSDA) for use in the field during an exploration campaign is the prior development of a robust spectral library of the geomaterial of interest, be it a specific mineral, soil class, or fresh/altered rock type. The spectral library would be pre-loaded onto a handheld LIBS analyzer, and then unknown samples could be interrogated in the field in real time to validate or refute a correlation or ascertain provenance through spectral matching.

4.1.2. Metal Carbonates

LIBS analysis of carbonate minerals, a class of minerals in which a divalent metal ion is coordinated by the CO32− carbonate molecule, provides an illustrative example of the concept of geochemical fingerprinting. Carbonate minerals have a flexible crystal structure that is hexagonal rhombohedral, orthorhombic, or monoclinic. Hexagonal rhombohedral forms result when anionic CO32− groups are combined with small divalent cations with ionic radii <1 Å, e.g., MgCO3, ZnCO3, and MnCO3, whereas large divalent cations with ionic radii >1 Å produce orthorhombic forms (e.g., BaCO3, SrCO3, and PbCO3). Ca2+ has an ionic radius of ~1 Å and, as a consequence, occurs in both hexagonal rhombohedral and orthorhombic polymorphs as calcite and aragonite. The crystal form of dolomite, CaMg(CO3)2, is similar to that of calcite, CaCO3, except that there is regular alternation of Ca and Mg ions in a rhombohedral structure. The hydrous copper carbonate minerals azurite and malachite, Cu3(CO3)2(OH)2 and Cu2CO3(OH)2, have a monoclinic structure. Carbonate minerals are commonly formed during sedimentary, hydrothermal, metamorphic, and weathering processes because of the nearly ubiquitous presence of the carbonate molecule in the Earth’s surface and near-surface environments.
Broadband LIBS spectra for a suite of 11 carbonate minerals were obtained in air using a bespoke laboratory LIBS system similar to that shown in Figure 1. As illustrated in Figure 3, the compositionally different carbonate minerals are not only clearly differentiated in the 10-shot average spectra acquired across the spectral range of 180–680 nm on the basis of their primary cationic constituent (Mg, Zn, Mn, Ca, Sr, Pb, Ba, and Cu), but also exhibit a high degree of compositional variability due to the broad range of ionic substitutions possible in both the rhombohedral and orthorhombic isostructural groups. As expected, the geochemical fingerprints for the copper carbonate minerals azurite and malachite are largely indistinguishable. Although Cu is the dominant cation in these two minerals, Cu was also detected in smithsonite in low abundance, which is not surprising because smithsonite occurs in weathered hydrothermal ore deposits, which are common sources of both Cu and Zn. Although the LIBS spectra for the CaCO3 polymorphs calcite and aragonite are quite different in terms of signal intensity, the same peaks are present in both spectra and, therefore, the two samples are characterized by the same overall geochemical fingerprint. As expected, the C lines at 193.09 and 247.86 nm are ubiquitous, but characterized by very reduced intensities because C has a relatively high ionization energy.

4.1.3. Garnet

The study of the gem mineral garnet by Alvey et al. [83] provides a straightforward demonstration of multivariate statistical analysis for LIBS spectral data for classification and discrimination. Garnets, which occur in a broad spectrum of mantle and crustal lithologies and can be a pathfinder mineral for diamond kimberlites, are orthosilicate mineral silicates of widely varying major element composition based upon the general chemical formula X3Y2Si3O12, where “X” is a divalent metal (typically Mg, Fe, Mn, or Ca) and “Y” is a trivalent metal (typically Al, Fe, or Cr). The principal mineral end-member compositions are pyrope (Mg3Al2Si3O12), almandine (Fe3Al2Si3O12), spessartine (Mn3Al2Si3O12), grossular (Ca3Al2Si3O12), andradite (Ca3Fe2Si3O12), and uvarovite (Ca3Cr2Si3O12). Members of the garnet mineral group have the same cubic crystal structure, but vary widely in chemical composition and, therefore, also exhibit ranges in many of their physical properties including color. Garnet is rarely found in nature in a colorless state, but commonly occurs in any and all colors. Garnet is allochromatic, which means that color variations in different species of garnet are due to their highly variable trace element impurities rather than to the major, mineral-forming elements that define their bulk composition. Garnets of the same type can have different colors, and different types of garnet can have the same color; thus, attempting to discriminate on the basis of color alone is not feasible, although it is the most common basis for classifying garnets in the field or when chemical analysis is not available.
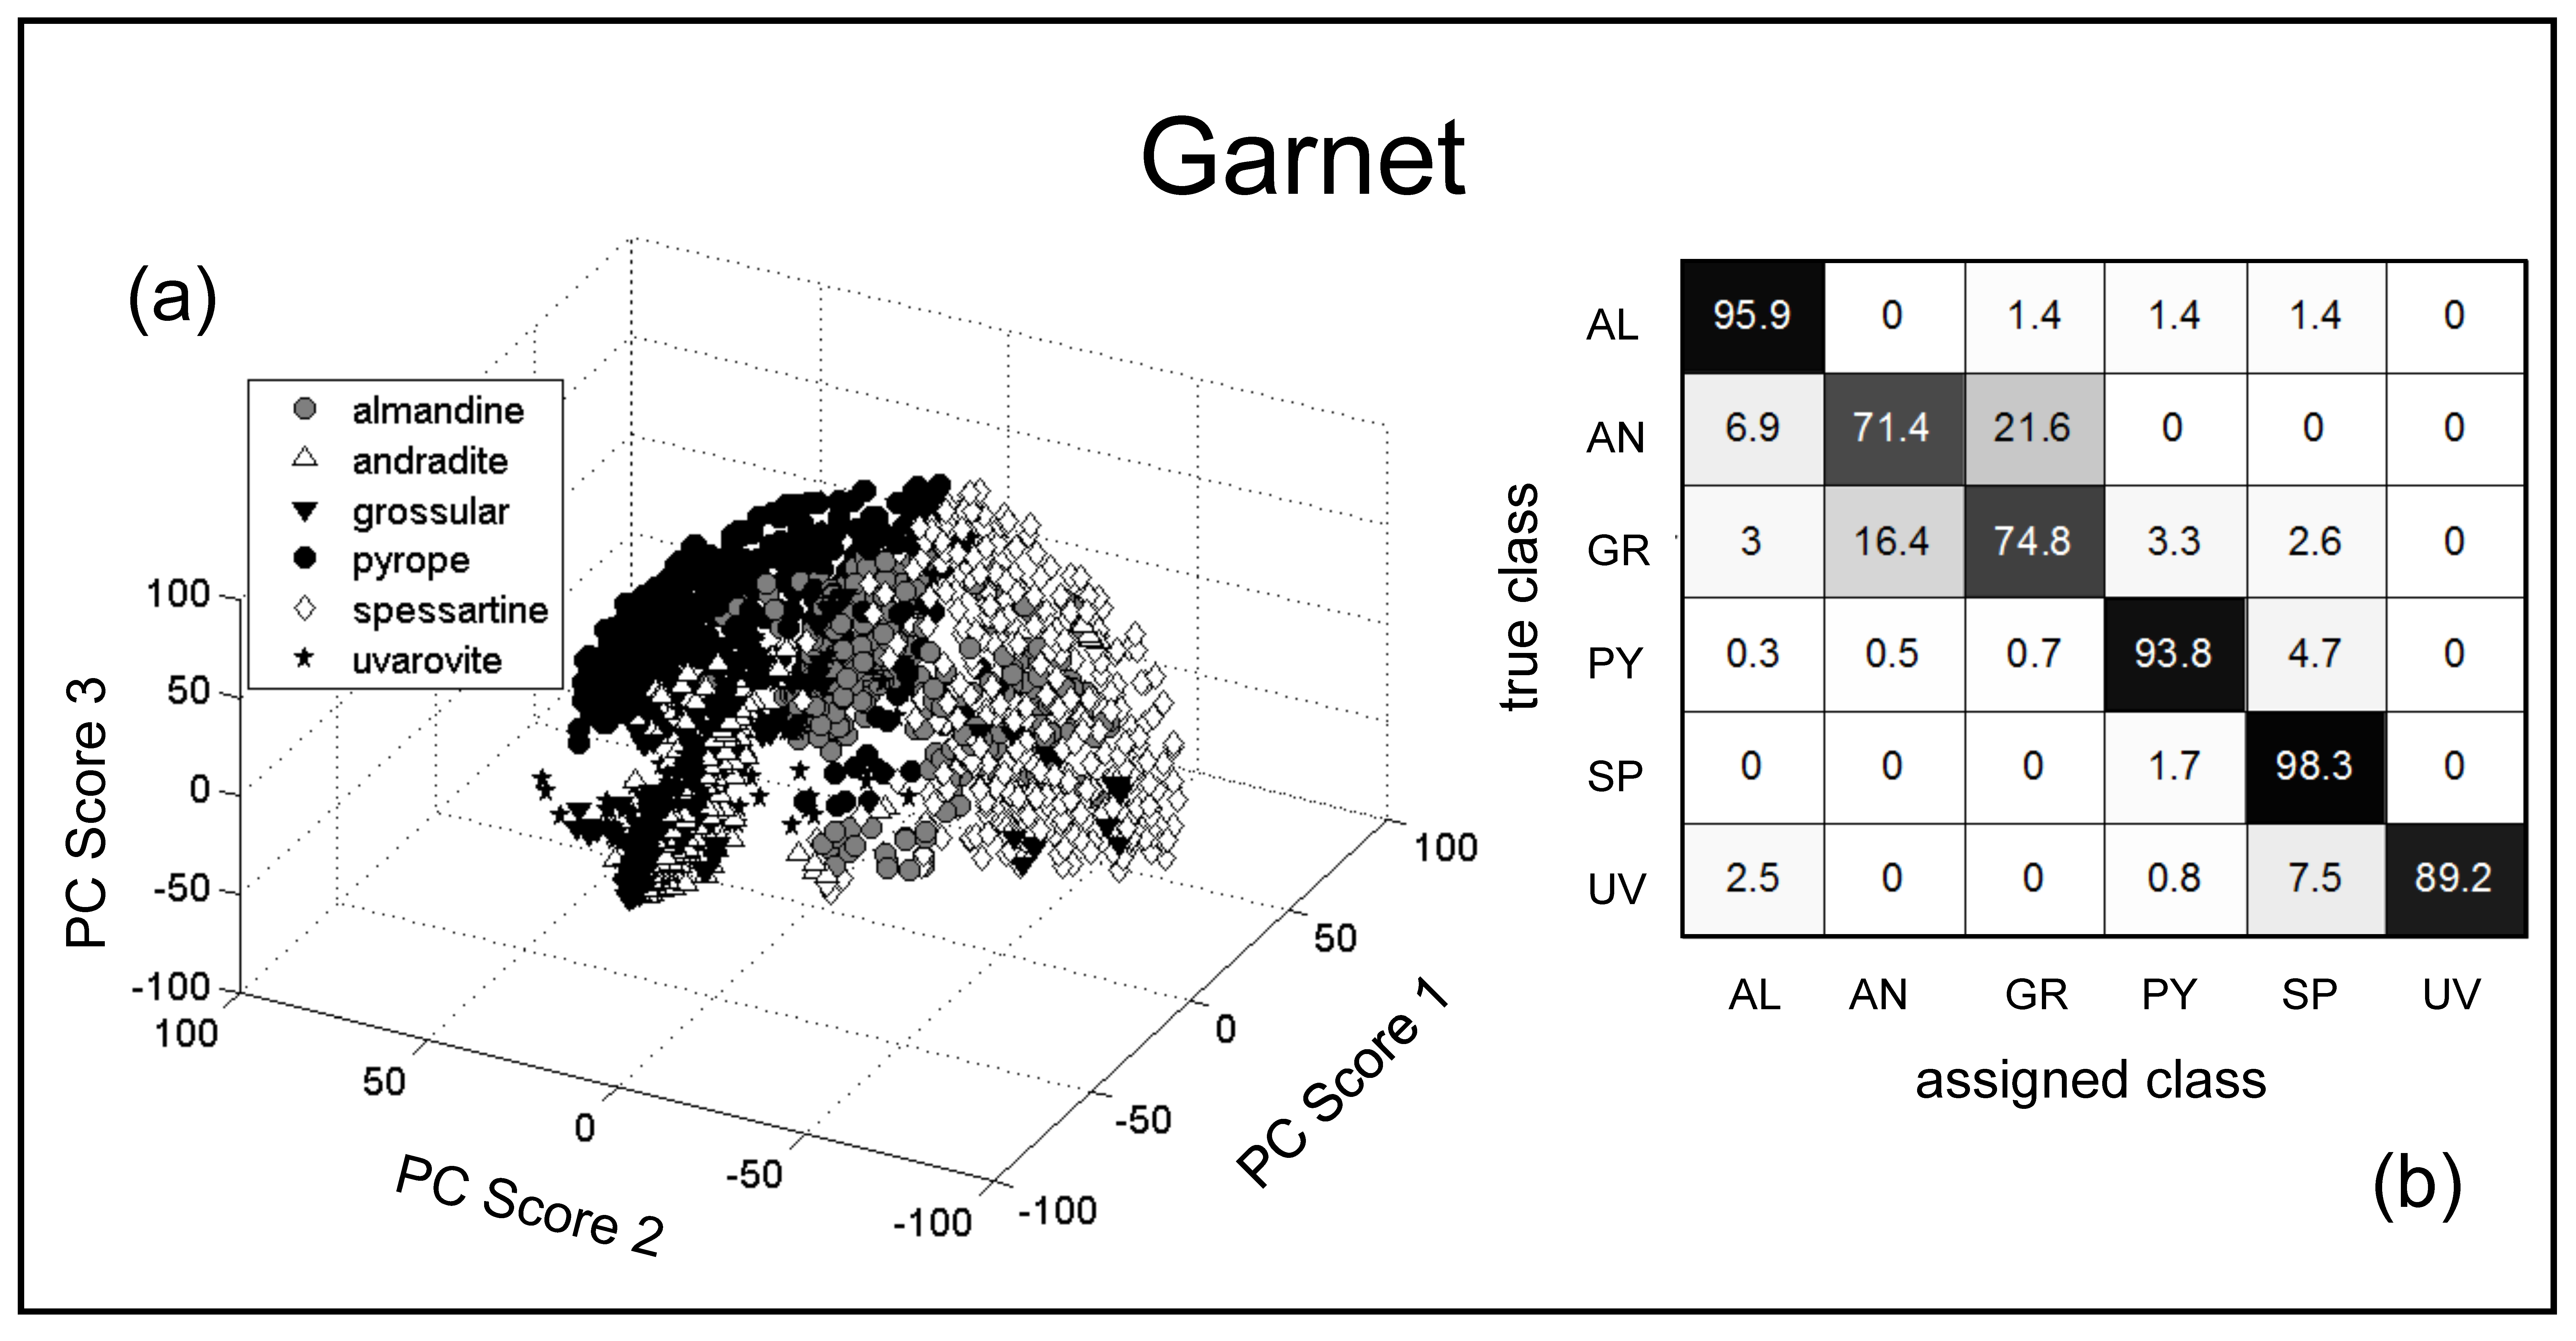
Alvey et al. [83] acquired single-shot broadband LIBS spectra in air over the spectral range of 200–960 nm for a suite of 157 garnets of different composition collected from 92 locations worldwide using a bespoke LIBS system employing a Big Sky CFR200 laser (Big Sky Laser Technologies Inc., Bozeman, MT, USA) and Ocean Optics LIBS2500 (Ocean Optics, Inc., Delray, FL, USA) spectrometer system. Discrimination of garnet compositional groups was accomplished by PLSDA analysis at an overall success rate of >95% based on sets of 25 broadband LIBS spectra for each sample. The LIBS spectral wavelengths of the main cations that differentiated the different garnet species (Mg, Fe, Mn, Al, Ca, and Cr) determined the garnet compositional classification. A cross-validation procedure was also used to ensure the robustness and performance of the classification algorithm, so that it could be used in the future as a spectral library to determine the type and geographic location of an unknown garnet specimen. In a subsequent study, Harmon et al. [79] using a SciAps Z-500 handheld analyzer and a much larger sample set of 288 garnets consisting of 66 almandines, 49 andradites, 60 grossulars, 35 pyropes, 56 spessartines, and 17 uvarovites, observed that the compositional differences characterizing the six garnet compositional groups were manifest on a three-component PCA plot (Figure 4a) and that the overall success for garnet type discrimination by PLSDA was >90% (Figure 4b). Fe–Al almandine, Mg–Al pyrope, and Mn–Al spessartine were distinguished from the other garnet groups at a success level better than 95% and Ca–Cr uvarovite at 89%. Significant misclassification only occurred for Ca–Fe andradite and Ca–Al grossular garnets, which commonly form a solid solution series in crystalline rock of intermediate compositions. Some 22% of the andradites were classified as grossular and, conversely, about 12% of grossular were classified as andradite. Metamorphic garnets could be distinguished from igneous garnets at a success of better than 80% through PLSDA (Figure 5a) and, within the igneous garnet type, garnet from granitic pegmatites and rhyolites, chromitite pods, and kimberlites were readily differentiated at a classification success of 92.7% (Figure 5b). Additionally, LIBS analysis of a small suite of garnets from South Africa supported the idea that pyrope from kimberlites might be distinguished by locality. Pyrope from South Africa was correctly distinguished from all other pyropes at about 90% success based on differences in Na, Mg, Ca, Al, Mn, Fe, and Cr emission line intensities. Likewise, as shown in Figure 5c, diamond-bearing kimberlites from within South Africa were confidently differentiated at an overall success of >96%, with the same seven elements responsible for the discrimination. This result has important implications for diamond kimberlite exploration, as it offers the potential for in-field analysis of garnet and, by analogy, clinopyroxene, which would permit the rapid identification kimberlite pathfinder minerals on a daily basis by a field exploration team.

4.1.4. Oxide Minerals

The identification of oxide minerals can pose a challenge to the field exploration geologist. The two examples below demonstrate how LIBS can be used for their rapid identification and source discrimination.
Cassiterite (SnO2) is the primary ore for tin, an element with high industrial demand for use as a corrosion-resistant coating on other metals, in electrically conductive coatings, as a fire-retardant in plastics, in anti-fouling paint for marine vessels, and in the alloys used for soft solder, pewter, bronze, and superconducting magnets. Cassiterite occurs naturally in hydrothermal veins associated with S-type granites, but is most commonly found as alluvial and placer accumulations because of its resistance to weathering. The increase in demand and relatively large supply of cassiterite in the underdeveloped parts of central Africa contributed to its illicit mining and trading as a “conflict mineral”. Determining the chemical composition of an ore is one means of illuminating its provenance, and ascertaining whether or not it comes from an area of civil conflict. Geochemical fingerprinting is a means of rapidly ascertaining the provenance of an ore based on the unique crustal signature associated with the location of its formation.
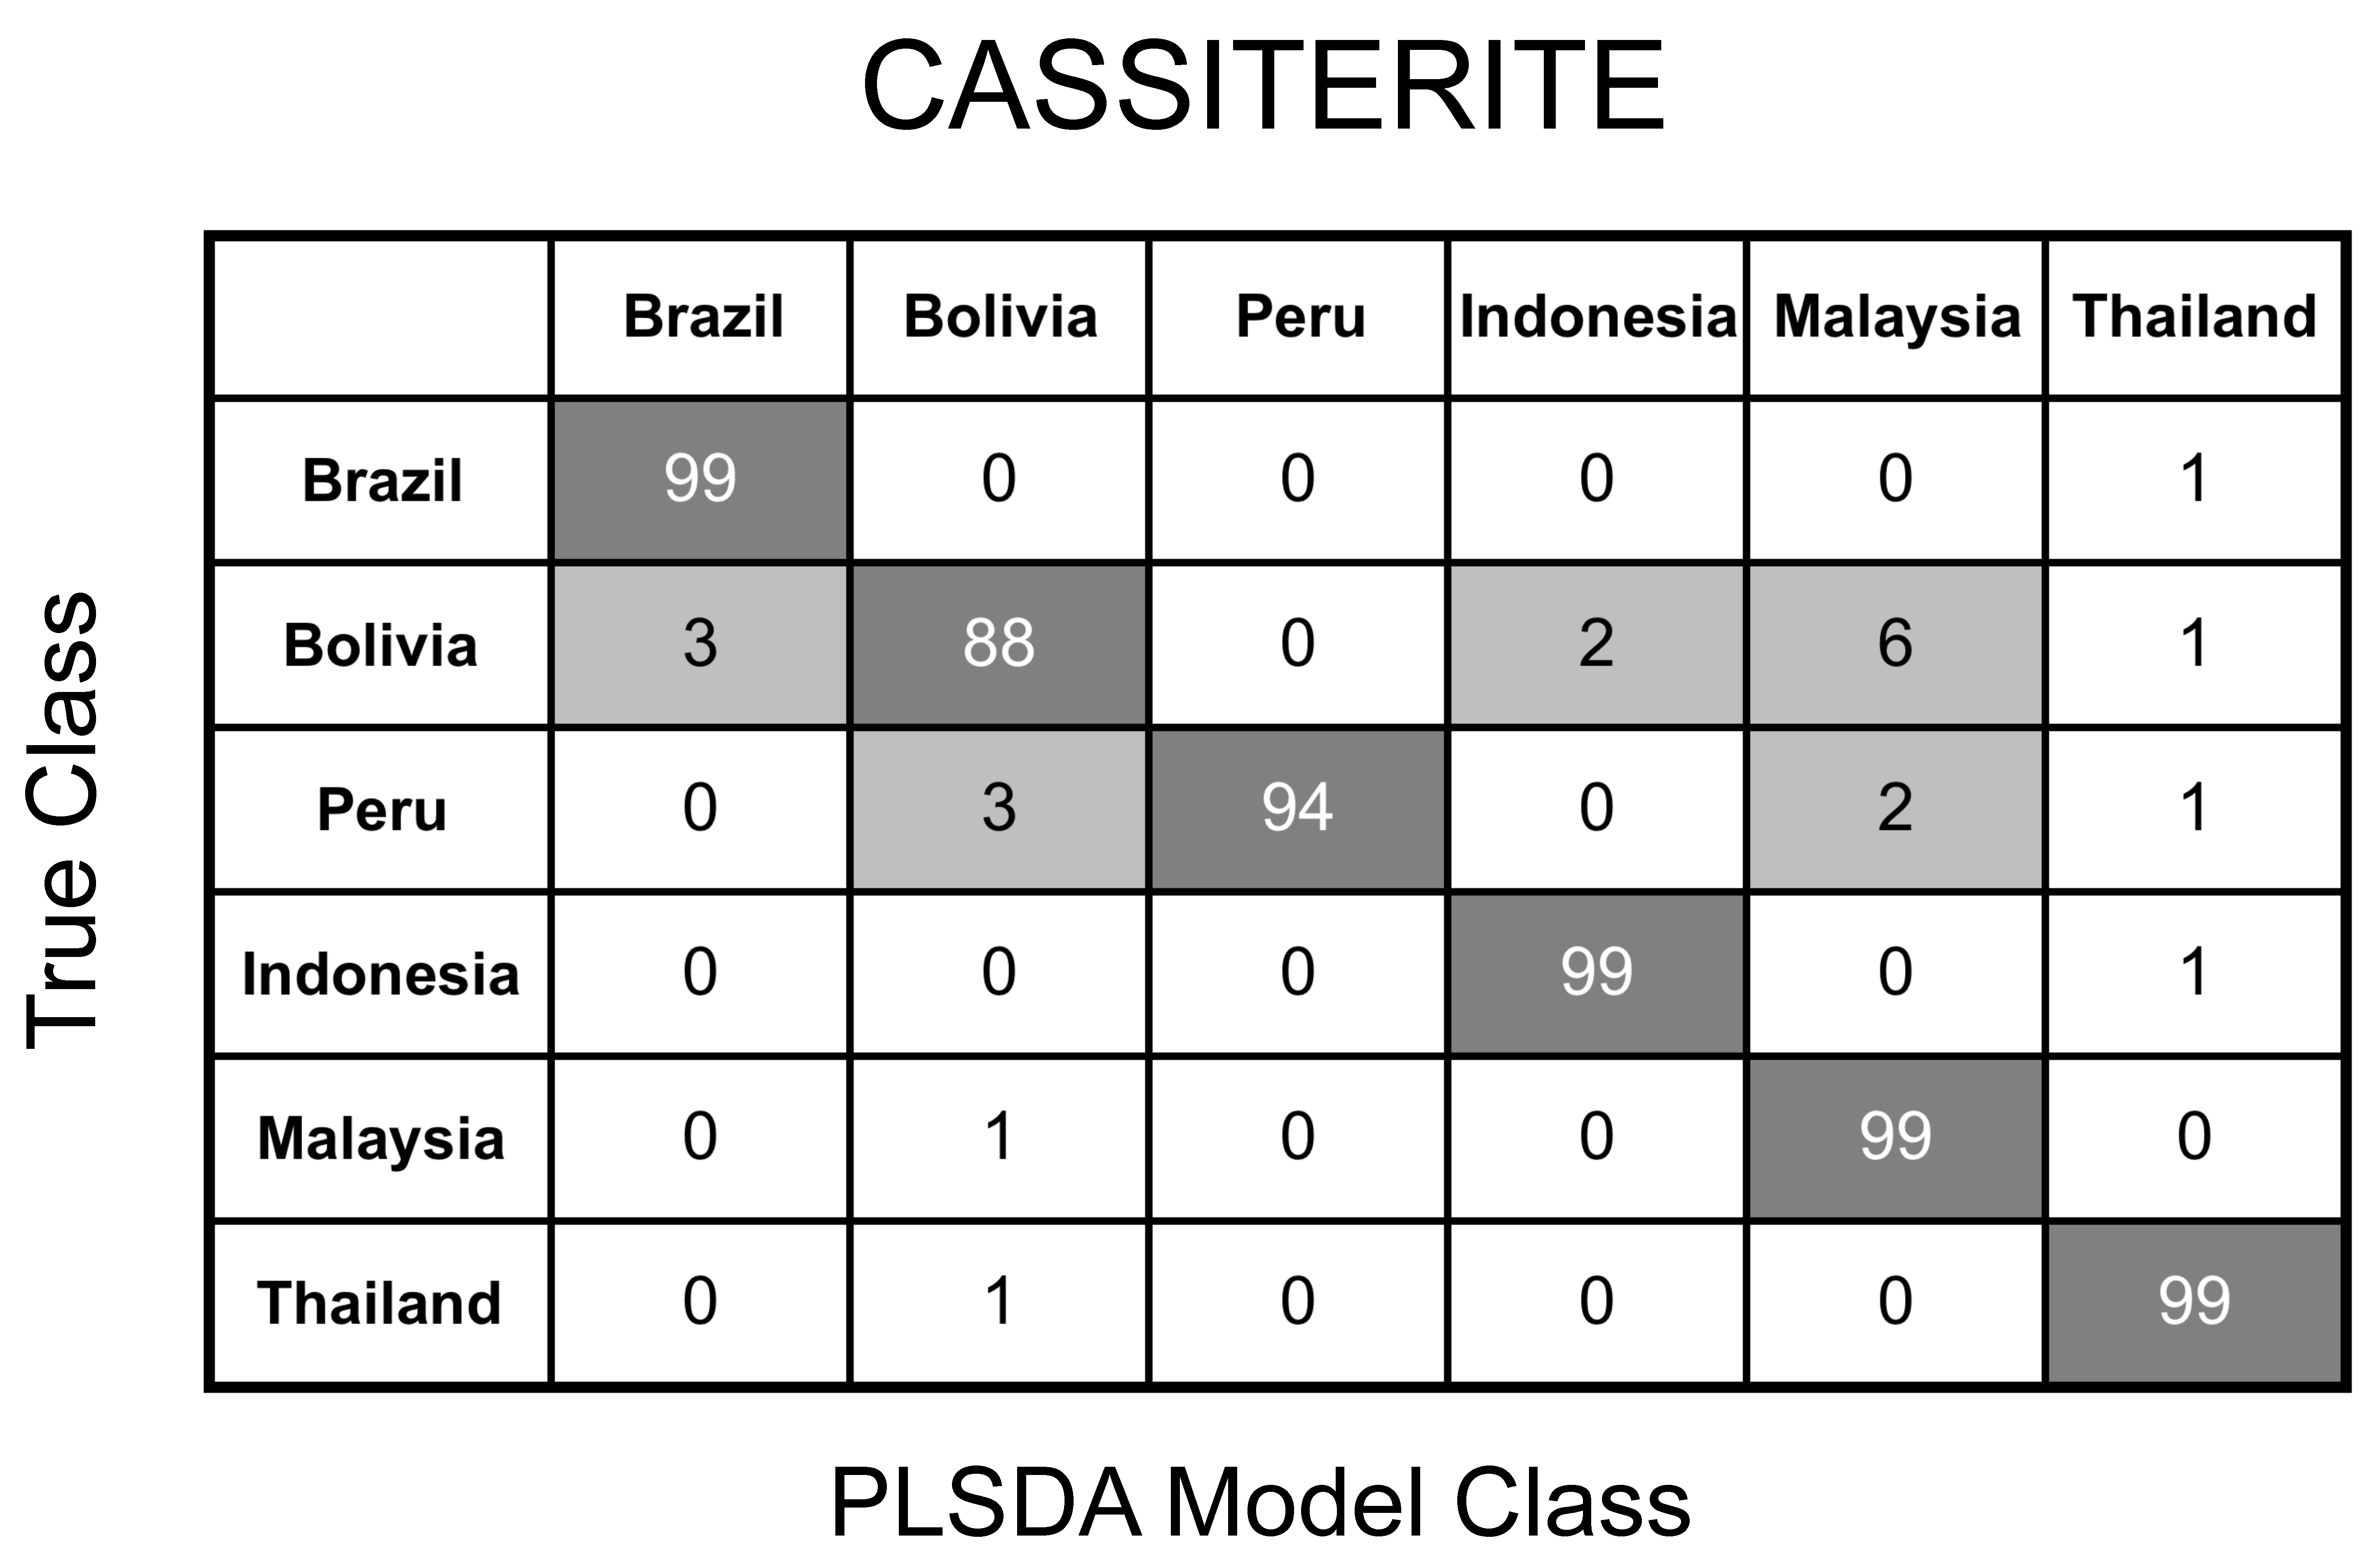
Hark and Harmon [84] analyzed 38 cassiterite ore samples from South America and southeastern Asia using a Applied Spectra RT100-HP laboratory LIBS system to determine if the geographic origin of cassiterite could be identified using LIBS geochemical fingerprinting. LIBS spectra were obtained in air and at low laser power (~9 mJ) at a spectral resolution 0.2–0.3 nm over three wavelength regions (220–440, 460–700, and 680–910 nm) using a laboratory RT100-HP LIBS system. Four laser pulses at each location on a 5 × 5 grid were acquired to generate 100 spectra for each sample, which were chemometrically processed by a PLSDA classifier that employed 120 components and 10-fold cross-validation to build a robust model that provided an overall correct sample-level classification rate of 97%. When the sample suite was grouped according to the 11 locations from which the ore concentrate was mined, the PLSDA model gave a correct overall classification rate of 87% (Figure 6).
The rare metals Nb and Ta are currently elements of high economic importance, as the high demand for these elements as components in modern electronics and medical devices drives exploration programs to locate new ore deposits. As the most important carriers of Nb and Ta in granites and granitic pegmatites, minerals of the columbite group, (Fe,Mn)(Nb,Ta)2O6, were long considered economic commodities. Columbite, the niobium-dominant member of the group (FeNb2O6 to MnNb2O6), and tantalite, its tantalum-rich analogue (Fe(Ta,Nb)2O6 to MnTa2O6), are commonly grouped together under the appellation coltan. Coltan ore occurs in many areas worldwide, such as Brazil, Australia, and Central Africa, but its exploitation became politically problematic as one of the most prominent of the African “conflict minerals”, because some 60% of the world’s coltan reserves are located in the eastern portion of the Democratic Republic of the Congo and adjacent areas, from which its illicit export and sale to the North American, European, and Asian markets is thought to be an important means by which civil conflicts in Central Africa are financed [87].
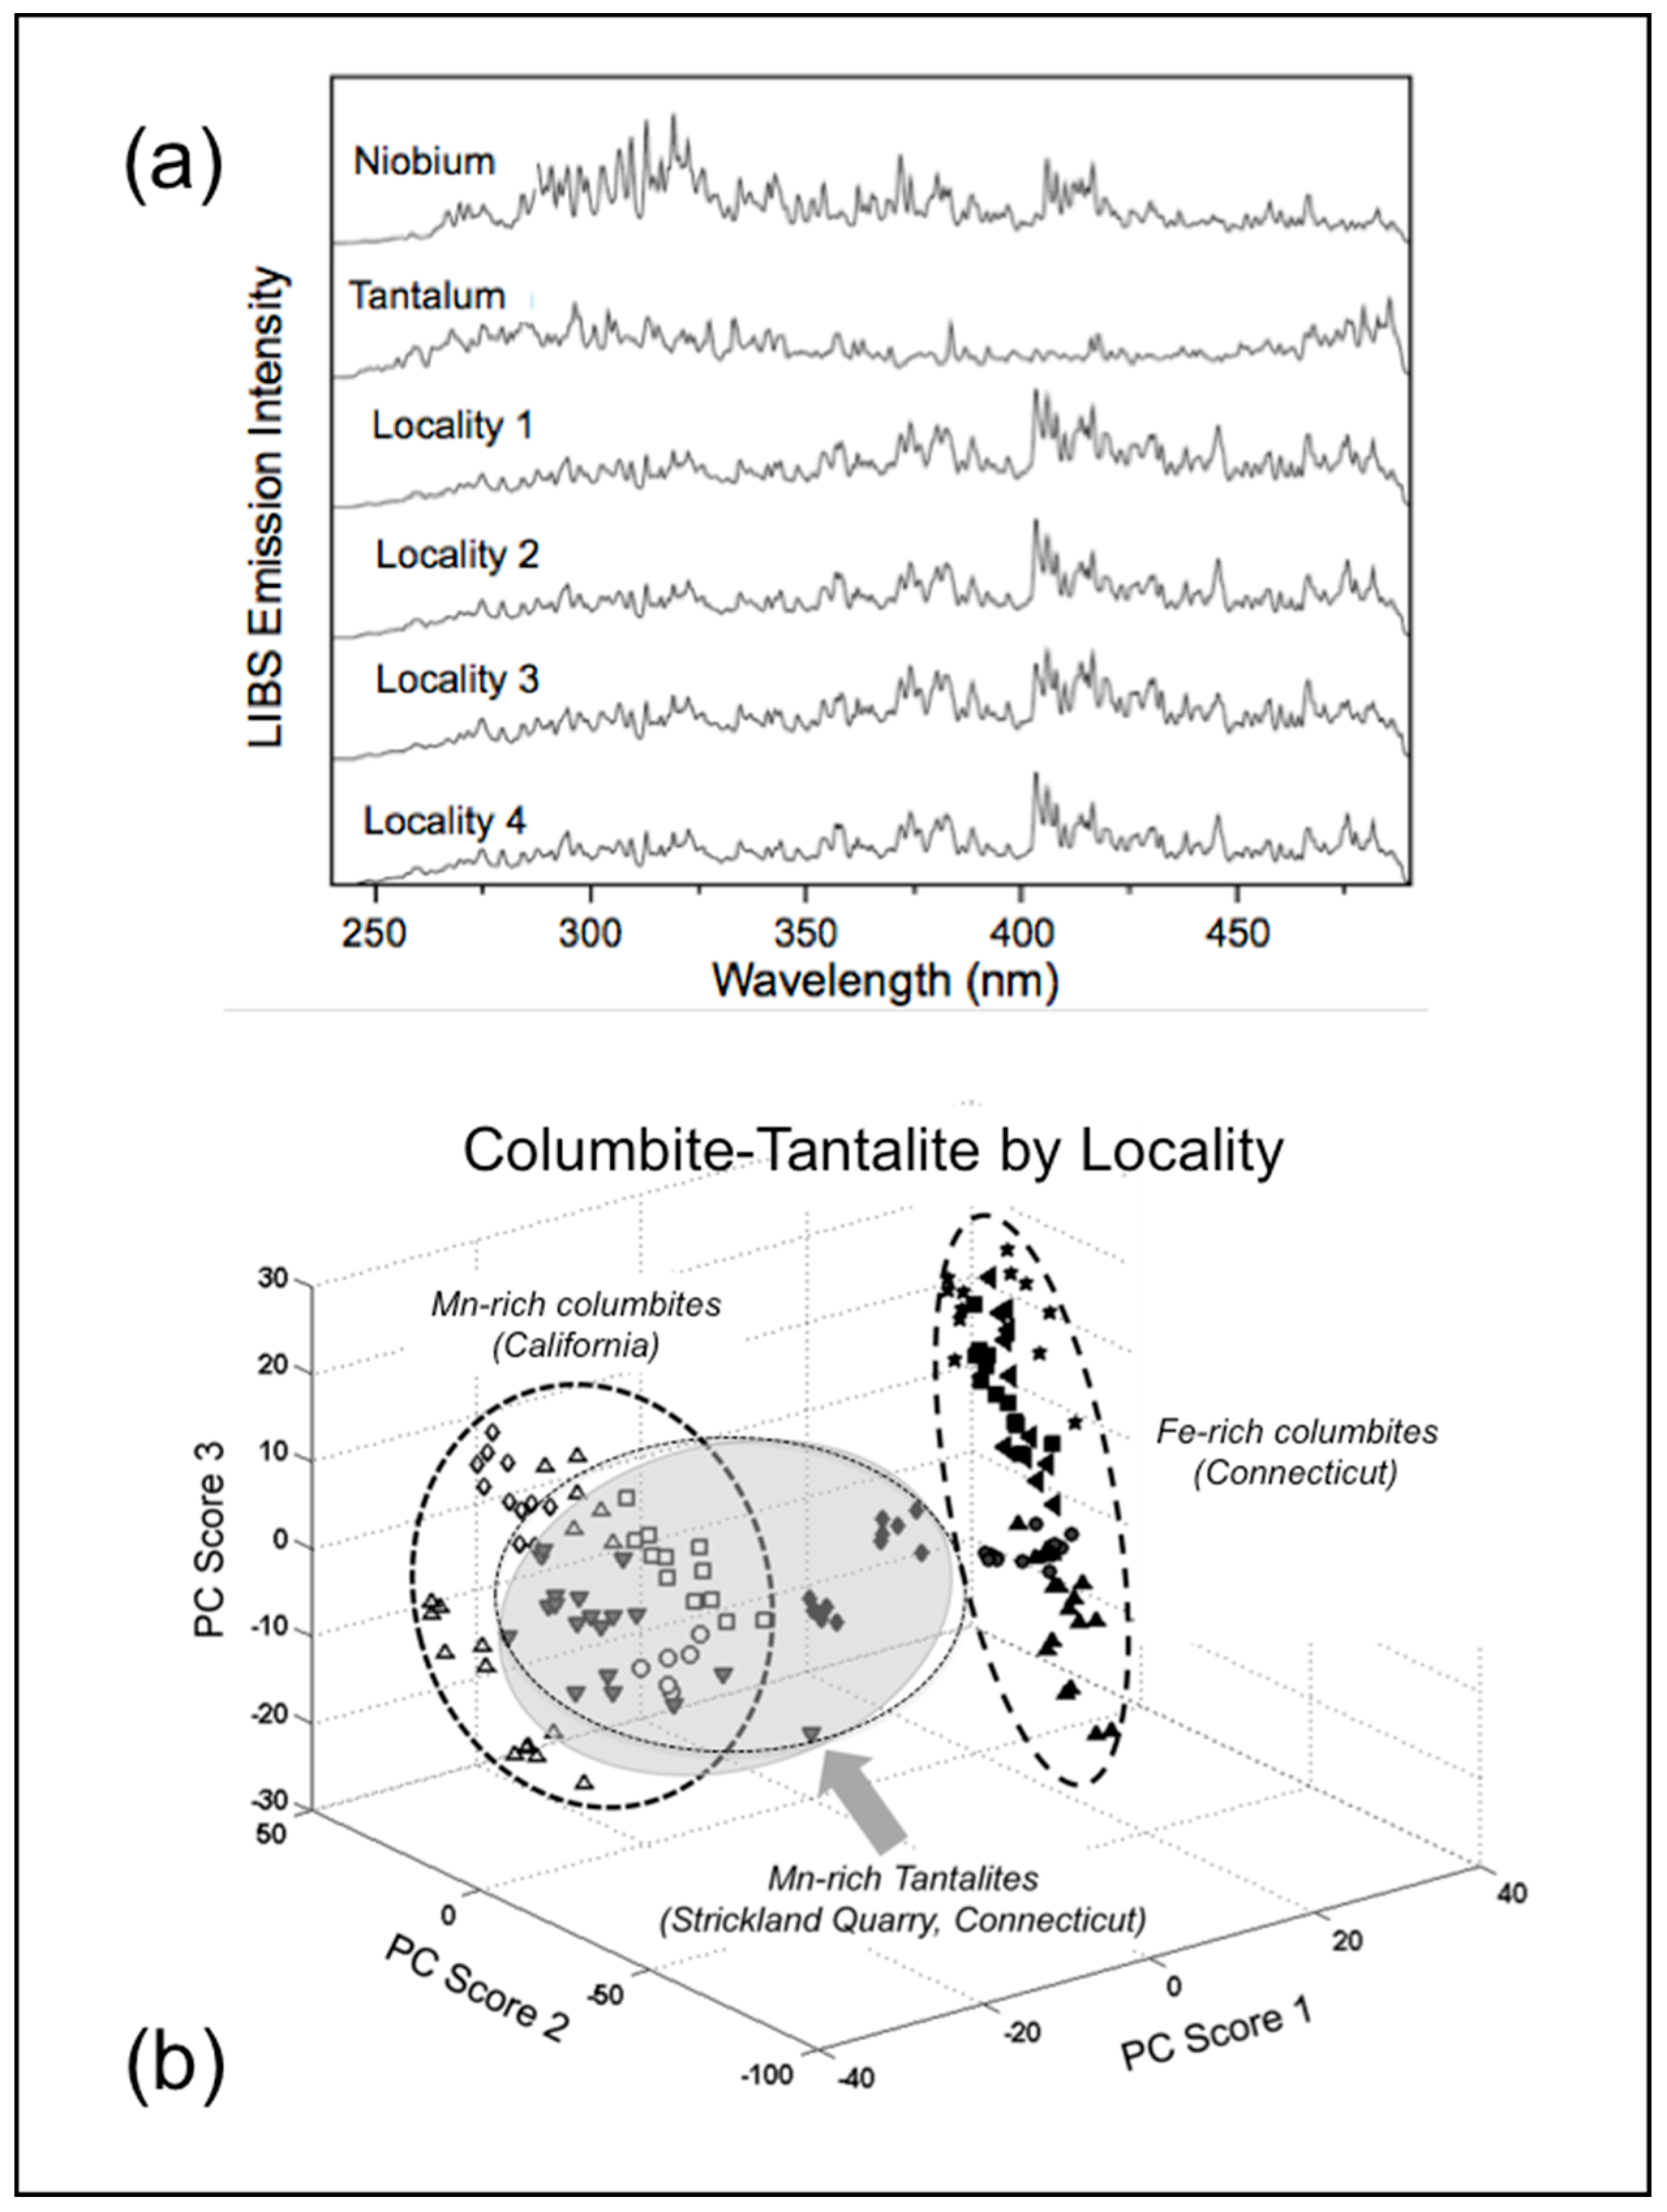
Harmon et al. [88] used a laboratory RT100-HP LIBS system to acquire LIBS spectra in air over the wavelength range of 250–490 nm and high-resolution spectra over the more limited 235–285-nm and 313–358-nm wavelength ranges for 14 columbite–tantalite samples from three pegmatite fields in North America formed in widely distinct space and time (Figure 7a). These spectral ranges were chosen to encompass many of the intense emission lines for the major elements known to commonly substitute in the columbite-group minerals (Table 1). Before statistical processing, each spectrum was normalized by the sum of its emission intensity values so that each spectrum exhibited unity when summed across all wavelengths. Partial least squares discriminate analysis was used to successfully discriminate the provenance of the coltan samples at a success rate of >90%. In a follow-up validation study, Hark et al. [84] also used the same RT100-HP laboratory LIBS system to analyze a larger geographically diverse set of 57 samples from 37 granite pegmatite fields in Africa, Asia, Australia, North America, and South America, which is representative of the natural range of compositions for columbite-group minerals. Each sample group was unique in its geologic environment, mineralogical make-up, and geochemical character. This heterogeneity is reflected in the variety of major elements (Ta, Nb, Fe, Mn) and significant trace elements (e.g., W, Ti, Zr, Sn, U, Sb, Ca, Zn, Pb, Y, Mg, and Sc) known to commonly substitute in the crystal structure of the columbite-group minerals ferrocolumbite (FeNb2O6), manganocolumbite (MnNb2O6), ferrotantalite (FeTa2O6), and manganotantalite (MnTa2O6) [89]. Chemometric analysis using a PLSDA classification model with k-fold cross-validation achieved a correct place-level geographic classification at success rates between 90% and 100%, highlighting the potential of LIBS as a real-time field tool to discriminate the different provenance of coltan ore.
Columbite-group minerals occur most frequently in granitic pegmatites of the three geochemical families defined by Černý and Ercit [89]—(i) the NYF pegmatites characterized by progressive accumulation during magmatic crystallization and fractionation of subaluminous to metaluminous A- and I-granites of Nb, Y, and F in addition to Be, rare-earth element (REE), Sc, Ti, Zr, Th, and U, (ii) a peraluminous LCT pegmatite family typified by prominent accumulation of Li, Cs, and Ta in addition to Rb, Be, Sn, B, P, and F predominantly associated with S-type granites, and (iii) and a mixed family of diverse origins that can involve contamination by undepleted supracrustal lithologies. Pegmatites of the LCT family tend to host the greatest abundance of columbite-group minerals.
Based upon the two successful studies using the laboratory LIBS instrumentation, Harmon et al. [79] examined two suites of columbite–tantalite samples from LCT-type pegmatites in Connecticut and California (United States of America (USA)) by handheld LIBS using a SciAps Z-500 analyzer. These samples originated from three pegmatite districts, with those from Connecticut (CT) originating from the Middletown (Glastonbury, Haddam, Middletown, Portland mines, and Strickland quarry) and Redding (Branchville mine) pegmatite districts, whereas all of the California specimens (El Molino, Katerina, Ingram, Olla mines) were from the Pala district. The California sample suite consisted of Mn-rich columbites, whereas the Connecticut sample suite comprised Fe-rich columbites, with one exception. The samples from the Strickland location in Connecticut were distinct, comprising a range of Mn-rich tantalite compositions. PLSDA classification success for these samples was >99% with a single Middletown, CT spectrum incorrectly assigned to the Glastonbury, CT class. Loading weights indicated that the main elements responsible for discrimination of the samples, in relative order of importance, were Na, Ca, Li, Mg, Mn, Be, and Ta. The ability of the handheld LIBS instrument to identify the presence of elements with very low atomic number such as Li and Be is especially noteworthy as this capability does not exist in any other field-portable technique. Interestingly, all of the spectra for one Connecticut sample (Strickland #1) clustered with the four California classes in the PCA score plot (Figure 7b). Examination of the chemical data for these samples revealed that the classes were defined by their differences in Fe and Mn content. Qualitative analysis scanning electron microscopy/energy-dispersive X-ray spectroscopy established that all of the California samples were Mn-columbite whereas most of the Connecticut samples were Fe-columbite. The composition of the Strickland #1 sample was Mn-tantalite and, therefore, it was not surprising that it plotted in the domain of the Mn-rich California samples (Figure 7b). Conversely, chemical heterogeneity with compositions ranging from Mn-columbite to (Fe, Mn)-tantalite was recognized in the Strickland #2 sample, which explained why its LIBS data plotted between the Fe-rich and Mn-rich classes. These results reinforce the idea that LIBS has the potential to be utilized in the field as a real-time screening tool to discriminate columbite–tantalite ores from different granites and associated pegmatites based on chemical composition.

4.1.5. Gold

Native gold occurs as lode deposits in a wide range of geological settings, having well-defined characteristics and environments of formation [90]. Gold is common in placer accumulation deposits that develop during weathering and fluvial transport processes because it is dense and resistant to chemical weathering. In many areas, such as Yukon region of Canada and the eastern Alaska region of the United States, placer gold is common and widely distributed in river sediments, although the lode sources for most deposits remain unknown [91,92]. Because natural gold typically contains a variety of elements as trace constituents, for example Ag, As, Bi, Ca, Cu, Fe, Hg, Mg, Mn, Pb, Pt, Pd, Sb, Si, Te, Ti, and V [93,94], handheld LIBS could be an expeditious and efficacious means for elucidating the provenance of placer gold or differentiating between gold in a placer deposit derived from one or more lode sources.
Samples from native gold from 18 placer locations in New Zealand, Australia, and the USA (Alaska, Idaho, California, Colorado, Virginia, and North Carolina) were analyzed by Harmon et al. [79] using a SciAps Z-500 handheld LIBS analyzer to ascertain the potential for geochemical fingerprinting by LIBS. Initially, samples were consolidated into 11 groups based on geological affinity, and these domains differentiated by handheld LIBS with an overall success of 98.4%. From the PLSDA analysis, the most important spectral lines for the discrimination were the Au lines at 312.28, 523.03, 583.73, and 479.26 nm plus the Ag lines at 546.55, 520.91, 328.07, and 338.29 nm. The stacked spectral plot of Figure 8 displays clear differences in Au and Ag line intensities, with the portion of the spectra from 305–345 nm for pure Au and Ag and three representative samples illustrating how LIBS could be used to identify the relative amounts of Ag in a placer gold deposit and potentially determine provenance on this basis.
Chemometric analysis of the full LIBS broadband spectra from 180–675 nm resulted in >98% classification success. By contrast, consideration of just Au and Ag compositions using the 16 most prominent Au and Ag spectral lines resulted in a discrimination success for the 11 gold samples of better than 92.5%. These results indicate that discrimination was based on the relative amount of silver present. Not only does the classifier consider the presence or absence of loadings for Au and Ag, it also takes into account the magnitudes of the emission lines relative to eac h other. Geochemical fingerprinting is frequently based on variations in trace element composition; however, in this case, the major elements Au and Ag were sufficient for discrimination. These results suggest that handheld LIBS could be expeditiously utilized in the field to determine the fineness of alluvial gold, to differentiate gold from different lode deposits, and to match samples to their geological source after creation of a provenance library.

4.2. Quantitative Analysis

Quantitative analysis is possible using LIBS, as the intensity of the LIBS plasma emission is proportional to the concentration of an element in a sample. For solid samples, the character of the microplasma created is determined by the physical nature of the material being ablated, i.e., its composition, crystallinity, optical reflectivity, optical transmissivity, and surface morphology [68], as well as the operational characteristics of the laser (i.e., wavelength, energy, and pulse duration), the degree of laser energy coupling to the sample surface, and the ambient environment in which the LIBS plasma is formed [95]. The elemental abundance in a sample can be quantified by measuring the intensity of the light captured at specific spectral wavelengths.
The use of LIBS for quantitative elemental analysis relies on some fundamental assumptions that must be verified, particularly that the plasma is optically thin and that a condition of local thermodynamic equilibrium is established within the plasma [26]. Quantitative measurement by LIBS is also complicated as a consequence of the transient nature of the LIBS plasma and matrix effects. Nonetheless, it is possible to quantify the elemental abundance in a sample by LIBS through a measurement of intensity of the light recorded at specific spectral wavelengths and then undertaking calibration against a reference material of the same type. As spectral emission intensity is not only influenced by the elemental concentration in the sample, but also by both the laser properties and the physical character of the sample, it is necessary to know how much mass is sampled by each laser pulse for quantitative analysis. Thus, standards must be homogeneous, and both the standard and the sample must be equally affected by the ablation, as it cannot be assumed that the standard and the desired element in the sample exhibit the same mass ablation rate behavior.
In the ideal case, when matrix-matched reference materials exist, LIBS can provide excellent quantitative results using single-element or multivariate calibration procedures. Typically, this involves the development of calibration curves for an element in the material of interest, and then LIBS measurements for the unknown samples are acquired under identical experimental conditions. Like all analytical methodologies, the ability to perform such quantitative analysis and its optimization are based on the quality of the standards. However, this becomes particularly problematic when reference standards do not exist, as is often the case with geological materials. There is also the possibility to use calibration-free (CF) approaches for semi-empirical analysis based on theoretical plasma models when matrix-matched standards do not exist [35,36]. However, there is still much research to be done on CF-LIBS before it can be routinely applied to the analysis of compositionally diverse and heterogeneous samples and, at present, calibration-free approaches are only possible for laboratory or mobile LIBS systems and not field-portable handheld LIBS analyzers.
The simplest form of quantitative LIBS analysis is the use of element ratios, which are readily calculated from pre-processed LIBS emission spectra because elemental concentrations in a sample are manifest in the observed spectral peak intensities. Gold deposits exhibit a wide range of Ag/Au ratios [96]. Harmon et al. [79] described an example of how this characteristic of placer gold deposits might be used in an exploration prospecting application.
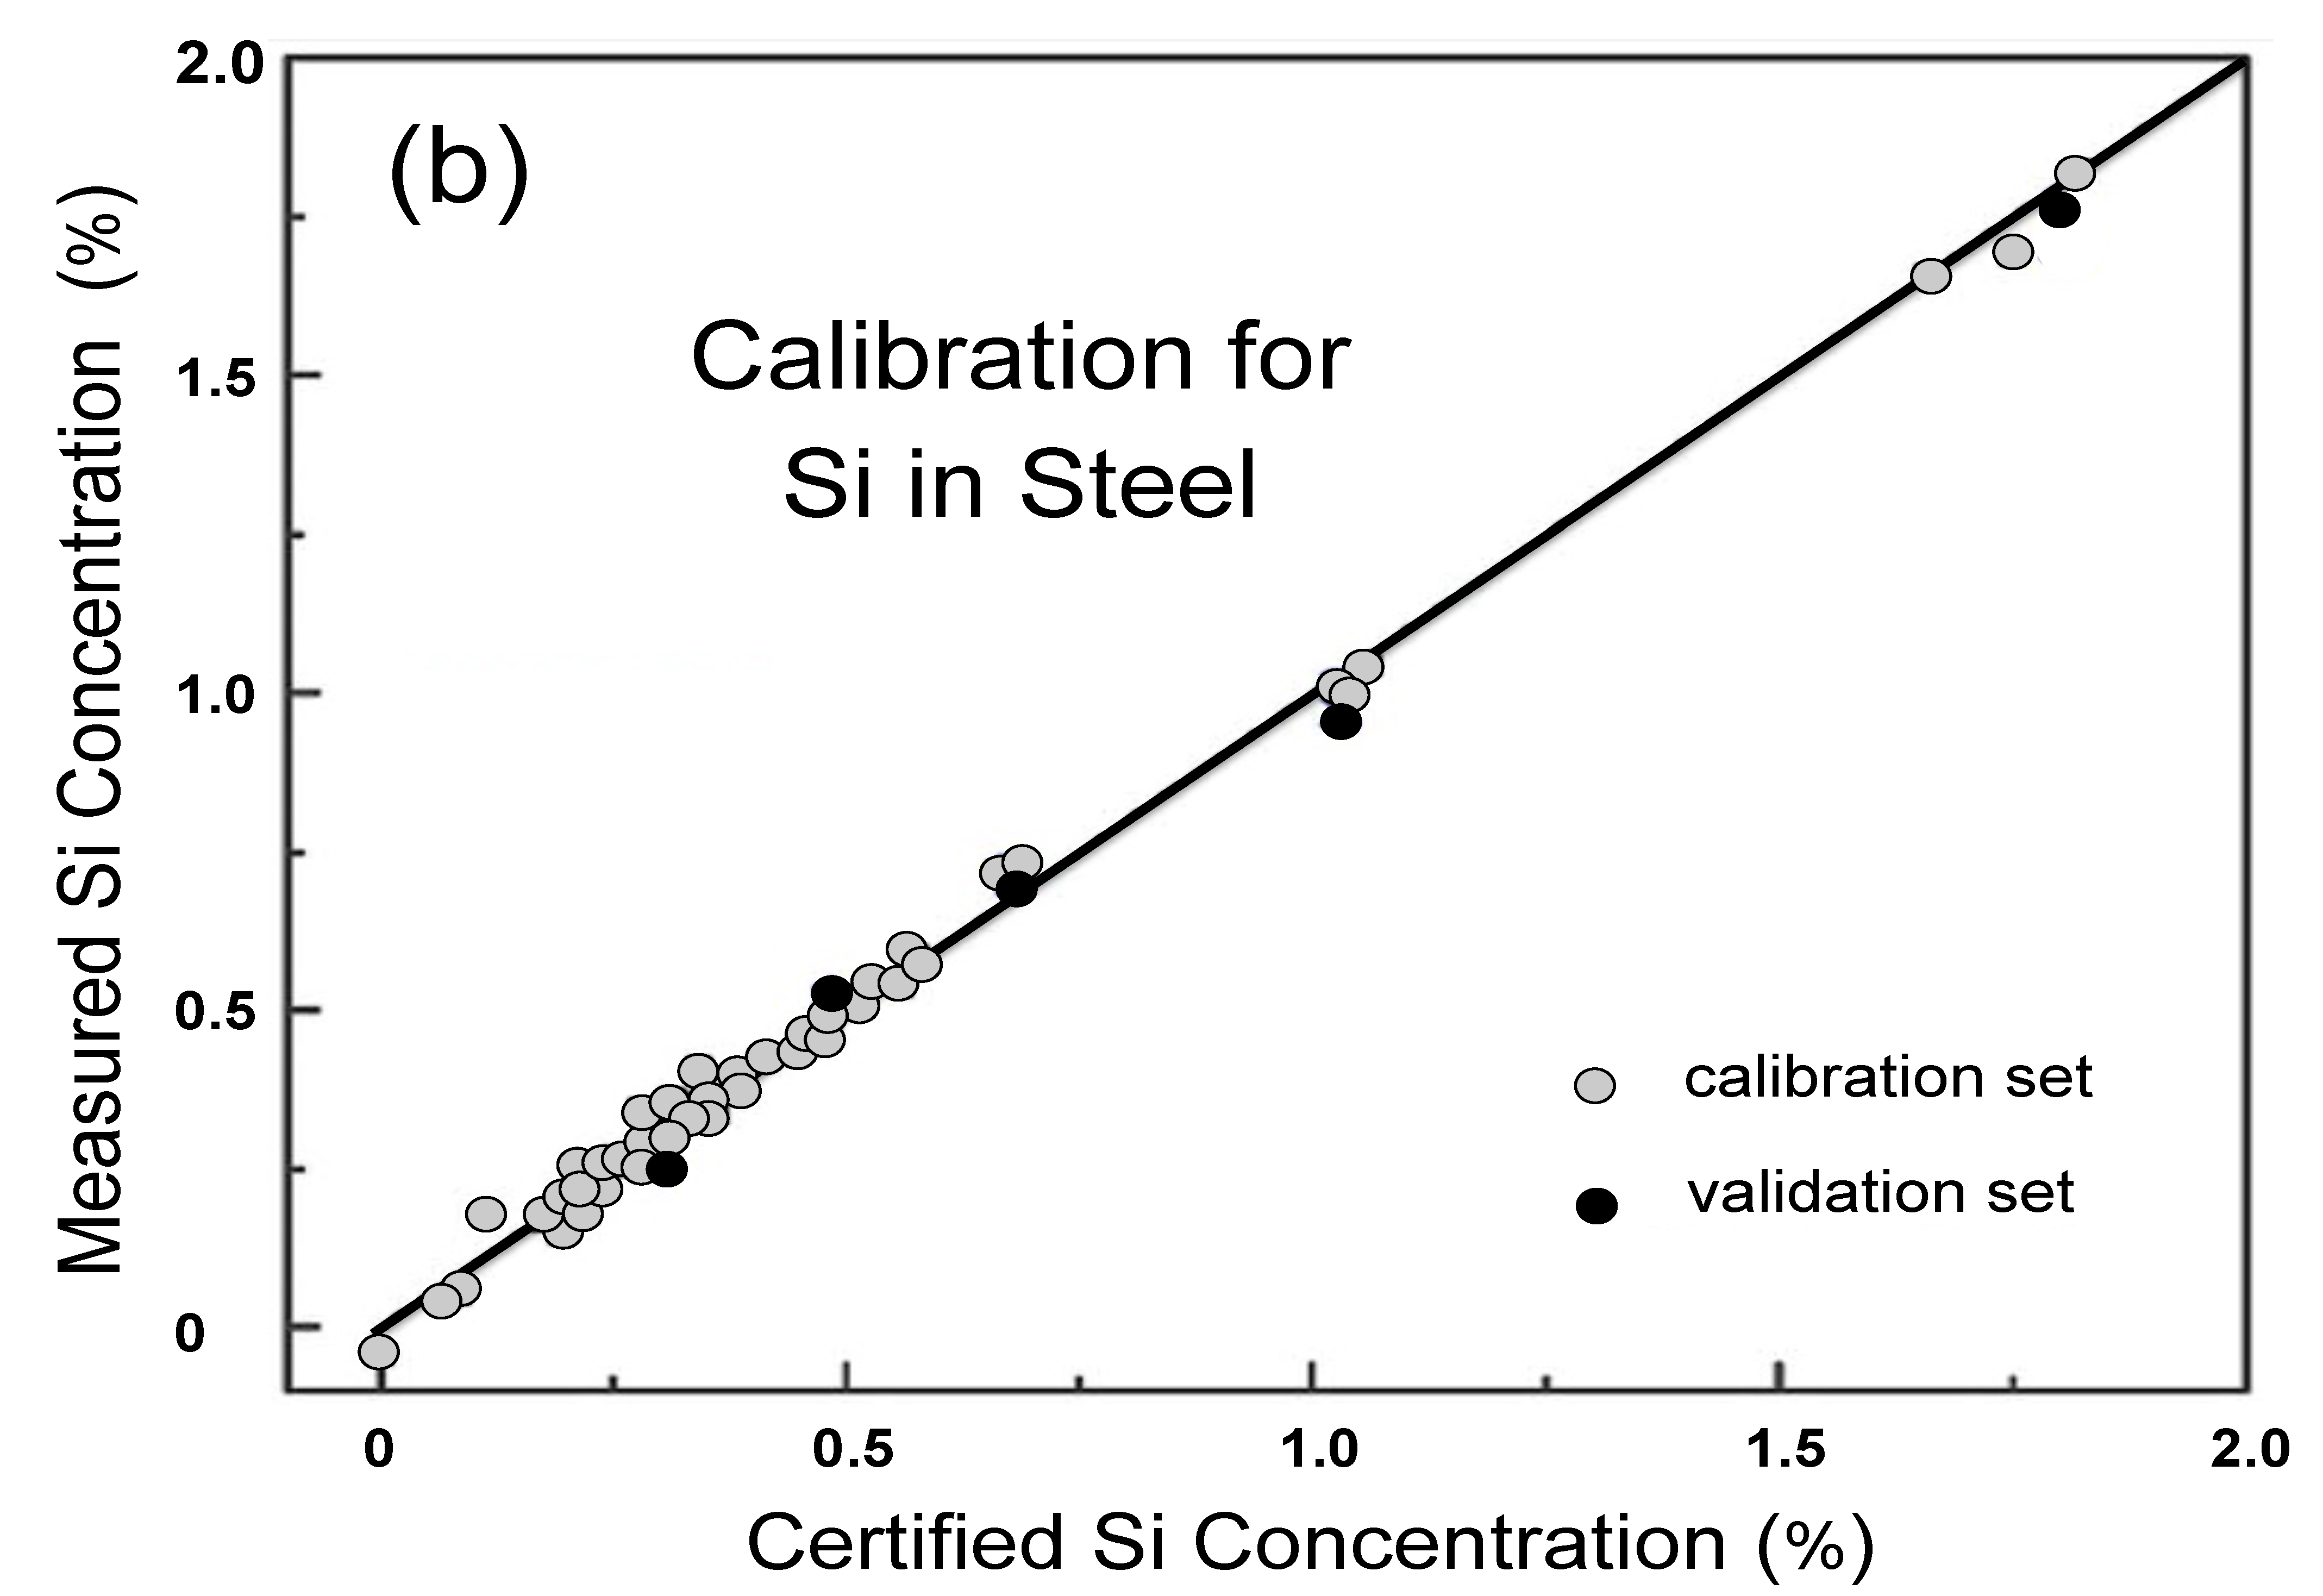
As noted above, quantitative analysis using handheld LIBS is possible for many elements, provided that calibration curves for the type of geological material to be analyzed can be developed from fit-for-purpose calibration materials. Calibration standards must encompass the same element suite and target element concentration ranges that the analytical investigation is expected to encounter in the field. Ideally, the calibration standards would be matrix-matched to address the complicating phenomena discussed in the previous paragraph. Where matrix-similar certified reference materials (CRMs) cannot be used for the entirety of the calibration set, then reliably assayed samples from the specific investigation site or from another site with similar material can be used as secondary reference materials to augment the CRM set or for calibration in the absence of suitable CRMs. For example, a calibration of the kind described above was reported by Afgan et al. [97], who used a B&W Tek (Newark, DE, USA) NanoLIBS-Q handheld LIBS analyzer to develop calibration curves for C, Cr, Mn, Mo, Mo, Si, V, and Cu in steel (Figure 9). Using dominant factor-based partial least squares regression with spectral standardization resulted in respective average absolute measurement errors of 0.019%, 0.039%, 0.013%, and 0.001% for Si, Cr, Mn, and Ni, and the overall average relative standard deviation for quantitative analysis of the eight elements was less than 5%.
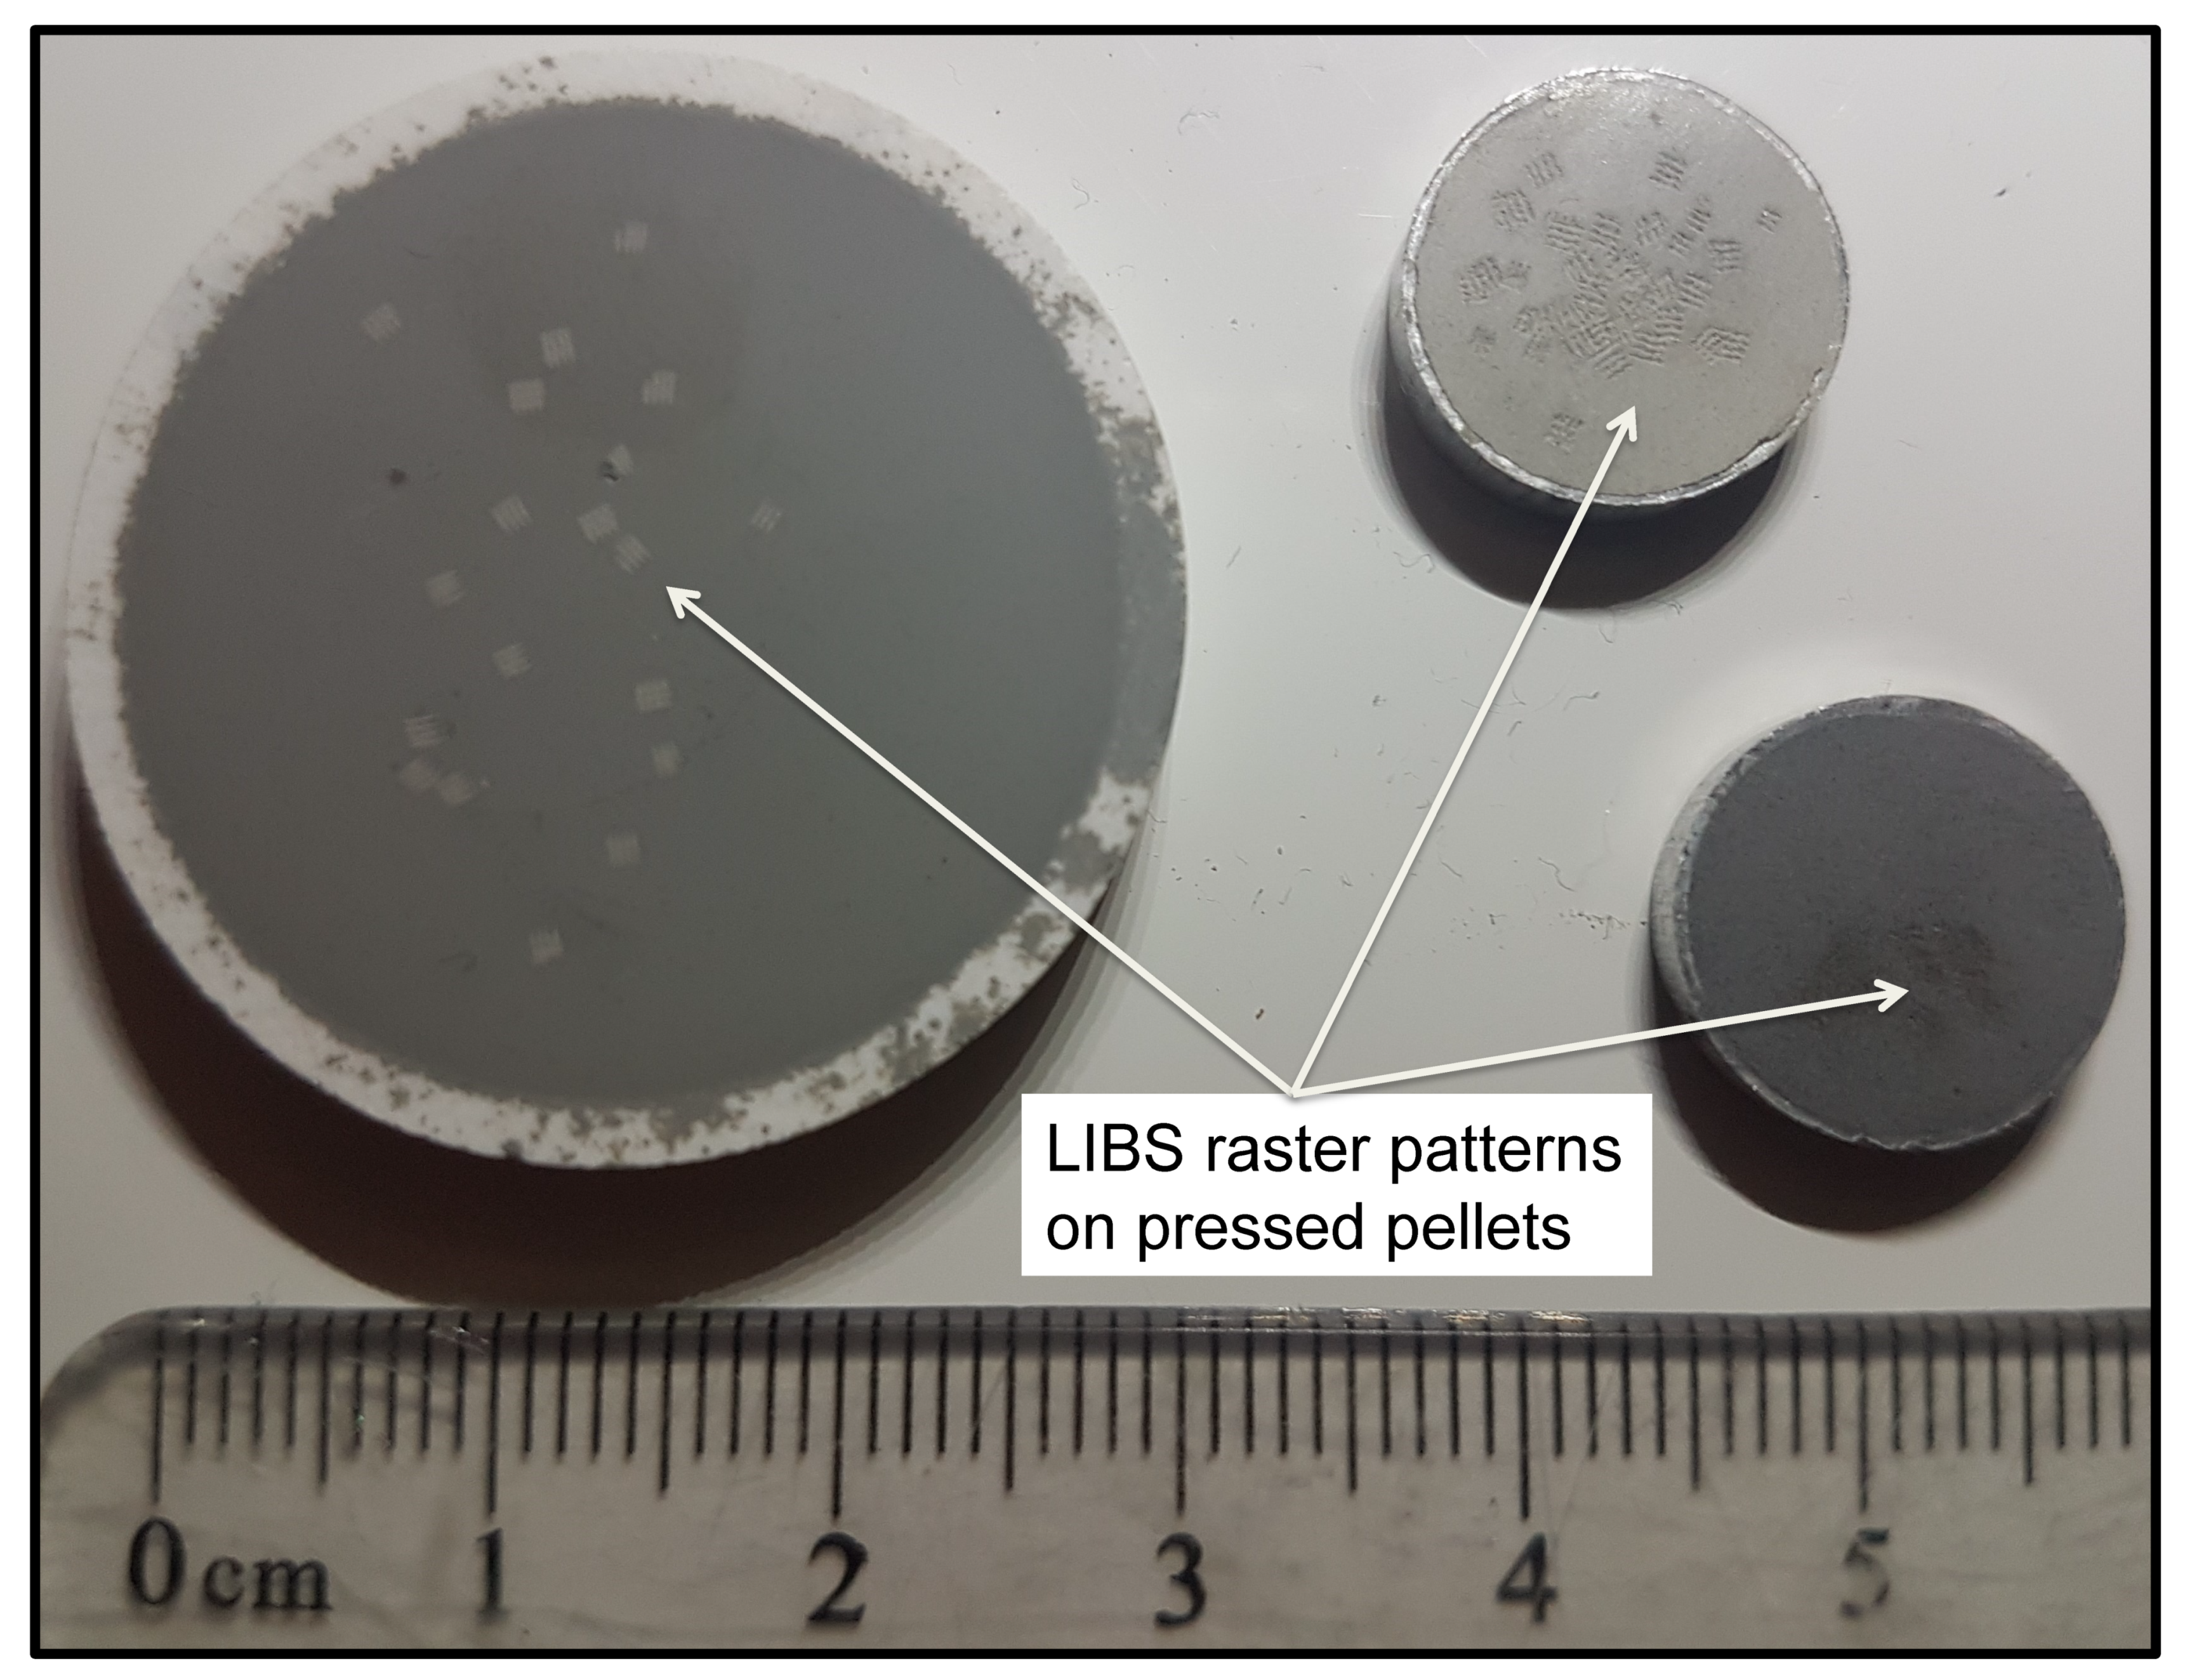
Unless the CRMs are pure metals (e.g., as in the example above), calibration materials should be very fine-grained, preferably <200 mesh (≤75 µm), and be pressure-pressed into pellets that remain fully consolidated during the ablation process (Figure 10). Binders should not be used, as incomplete mixing of the sample produces heterogeneous results. Typically, the LIBS analyzer would be moved to multiple locations across the pellet surface for analysis, and the data from each laser shot would be averaged in order to obtain a representative result. For example, to enhance the representativeness when using the SciAps Z-300 handheld analyzer, the default raster setting is for analysis of 12 individual locations in a 3 × 4 grid pattern at 500 m location spacing (Figure 10). Multiple shots can be collected at a sample site to improve the quality of analytical results. A set of similar matrix-matched quality control samples should be reserved for post-calibration validation to document satisfactory performance of the calibration.
The basic approach to empirical calibrations using LIBS utilizes a concentration versus intensity ratio approach. Firstly, emission line intensities measured in a CRM are used to develop a calibration curve for each element of interest (Figure 11). The intensity values for each element are generated from selecting specific wavelength ranges in the LIBS spectrum to define regions of interest (ROIs), as shown in Figure 11a for sulfur in a sulfide mineral matrix. Secondly, a ratio is calculated for each ROI of the selected element. Wavelength intensity ratios can be calculated on an element-by-element basis for the calibration standards and unknowns or against a relatively flat background portion of the sample spectra. Following this ratio-based approach, the target element in the unknowns represents the numerator, and the calibration element or local spectrometer background region represents the denominator. Whilst concentration values for each of the target elements are required, ROIs in the denominator are not; thus, other elements of approximately constant composition (e.g., O, S, Si, Al, Ca, or Fe) may be used for spectral intensity normalization. Once a set of calibration curves are constructed (Figure 11b), each LIBS analysis displays elemental concentrations in a test sample in real time (Figure 12).
Quantitative calibration curves can be established using the SciAps Z-300 handheld LIBS analyzer and its SciAps proprietary Profile Builder personal computer (PC)-based software package. This software utilizes a graphic user interface to facilitate the building of calibration curves by an operator through a pre-established workflow (e.g., Figure 11) Calibrations can be based upon existing factory templates, where much of the spectral pre-processing and ROIs are pre-defined for common applications or established by the user for a bespoke application. Selection of pre-loaded ROIs for many elements uses the SciAps proprietary LIBS spectral line library; alternatively, users can select from the National Institute of Standards and Technology (NIST) list of optical emission spectrometry lines, create custom element line lists, or create custom spectrometer regions. Users are guided through the following LIBS workflow: (i) selection of the element suite of interest; (ii) standard definition; (iii) standard acquisition; (iv) modeling of intensity ratio versus concentration plots for calibration. These models can then be saved to the analyzer using a USB or Wi-Fi connection to allow quantitative testing to be performed on the handheld analyzer. Once loaded onto the analyzer, basic slope and intercept corrections can be made to the calibration to make minor adjustments for field conditions. Finally, concentrations can be calculated for the target elements using the user-selected calibration method.
It should be noted that the use of univariate empirical calibrations comes with an inherent matrix specificity that needs to be considered when testing materials in the field using calibrations established under controlled conditions. For example, calibrations where S is not defined in the denominator would generally be unsuitable for the quantitative analysis of elements within sulfide minerals such as pyrite, arsenopyrite, chalcocite, or galena. LIBS analyzers often allow the choice of several different ROIs for elements so that different ROIs can be used for different matrix types to avoid interferences caused by constituents within the specific matrix other than those for which the calibration was developed.
The example below describes a field application of the process described above, including sample preparation, testing procedure, and results obtained using a SciAps Z-300 handheld LIBS analyzer during an exploration campaign at the Li-bearing hectorite clay-hosted Agua Fria prospect in the Sonora region of Mexico. The project campaign, as described by Griffin [98], was undertaken in 2017 by Lithium Australia NL (ASX: LIT) and Alix Resources Corp (TMX: AIX) and included examination of 16 reverse circulation drill holes, each completed to a depth of somewhat over 100 m.
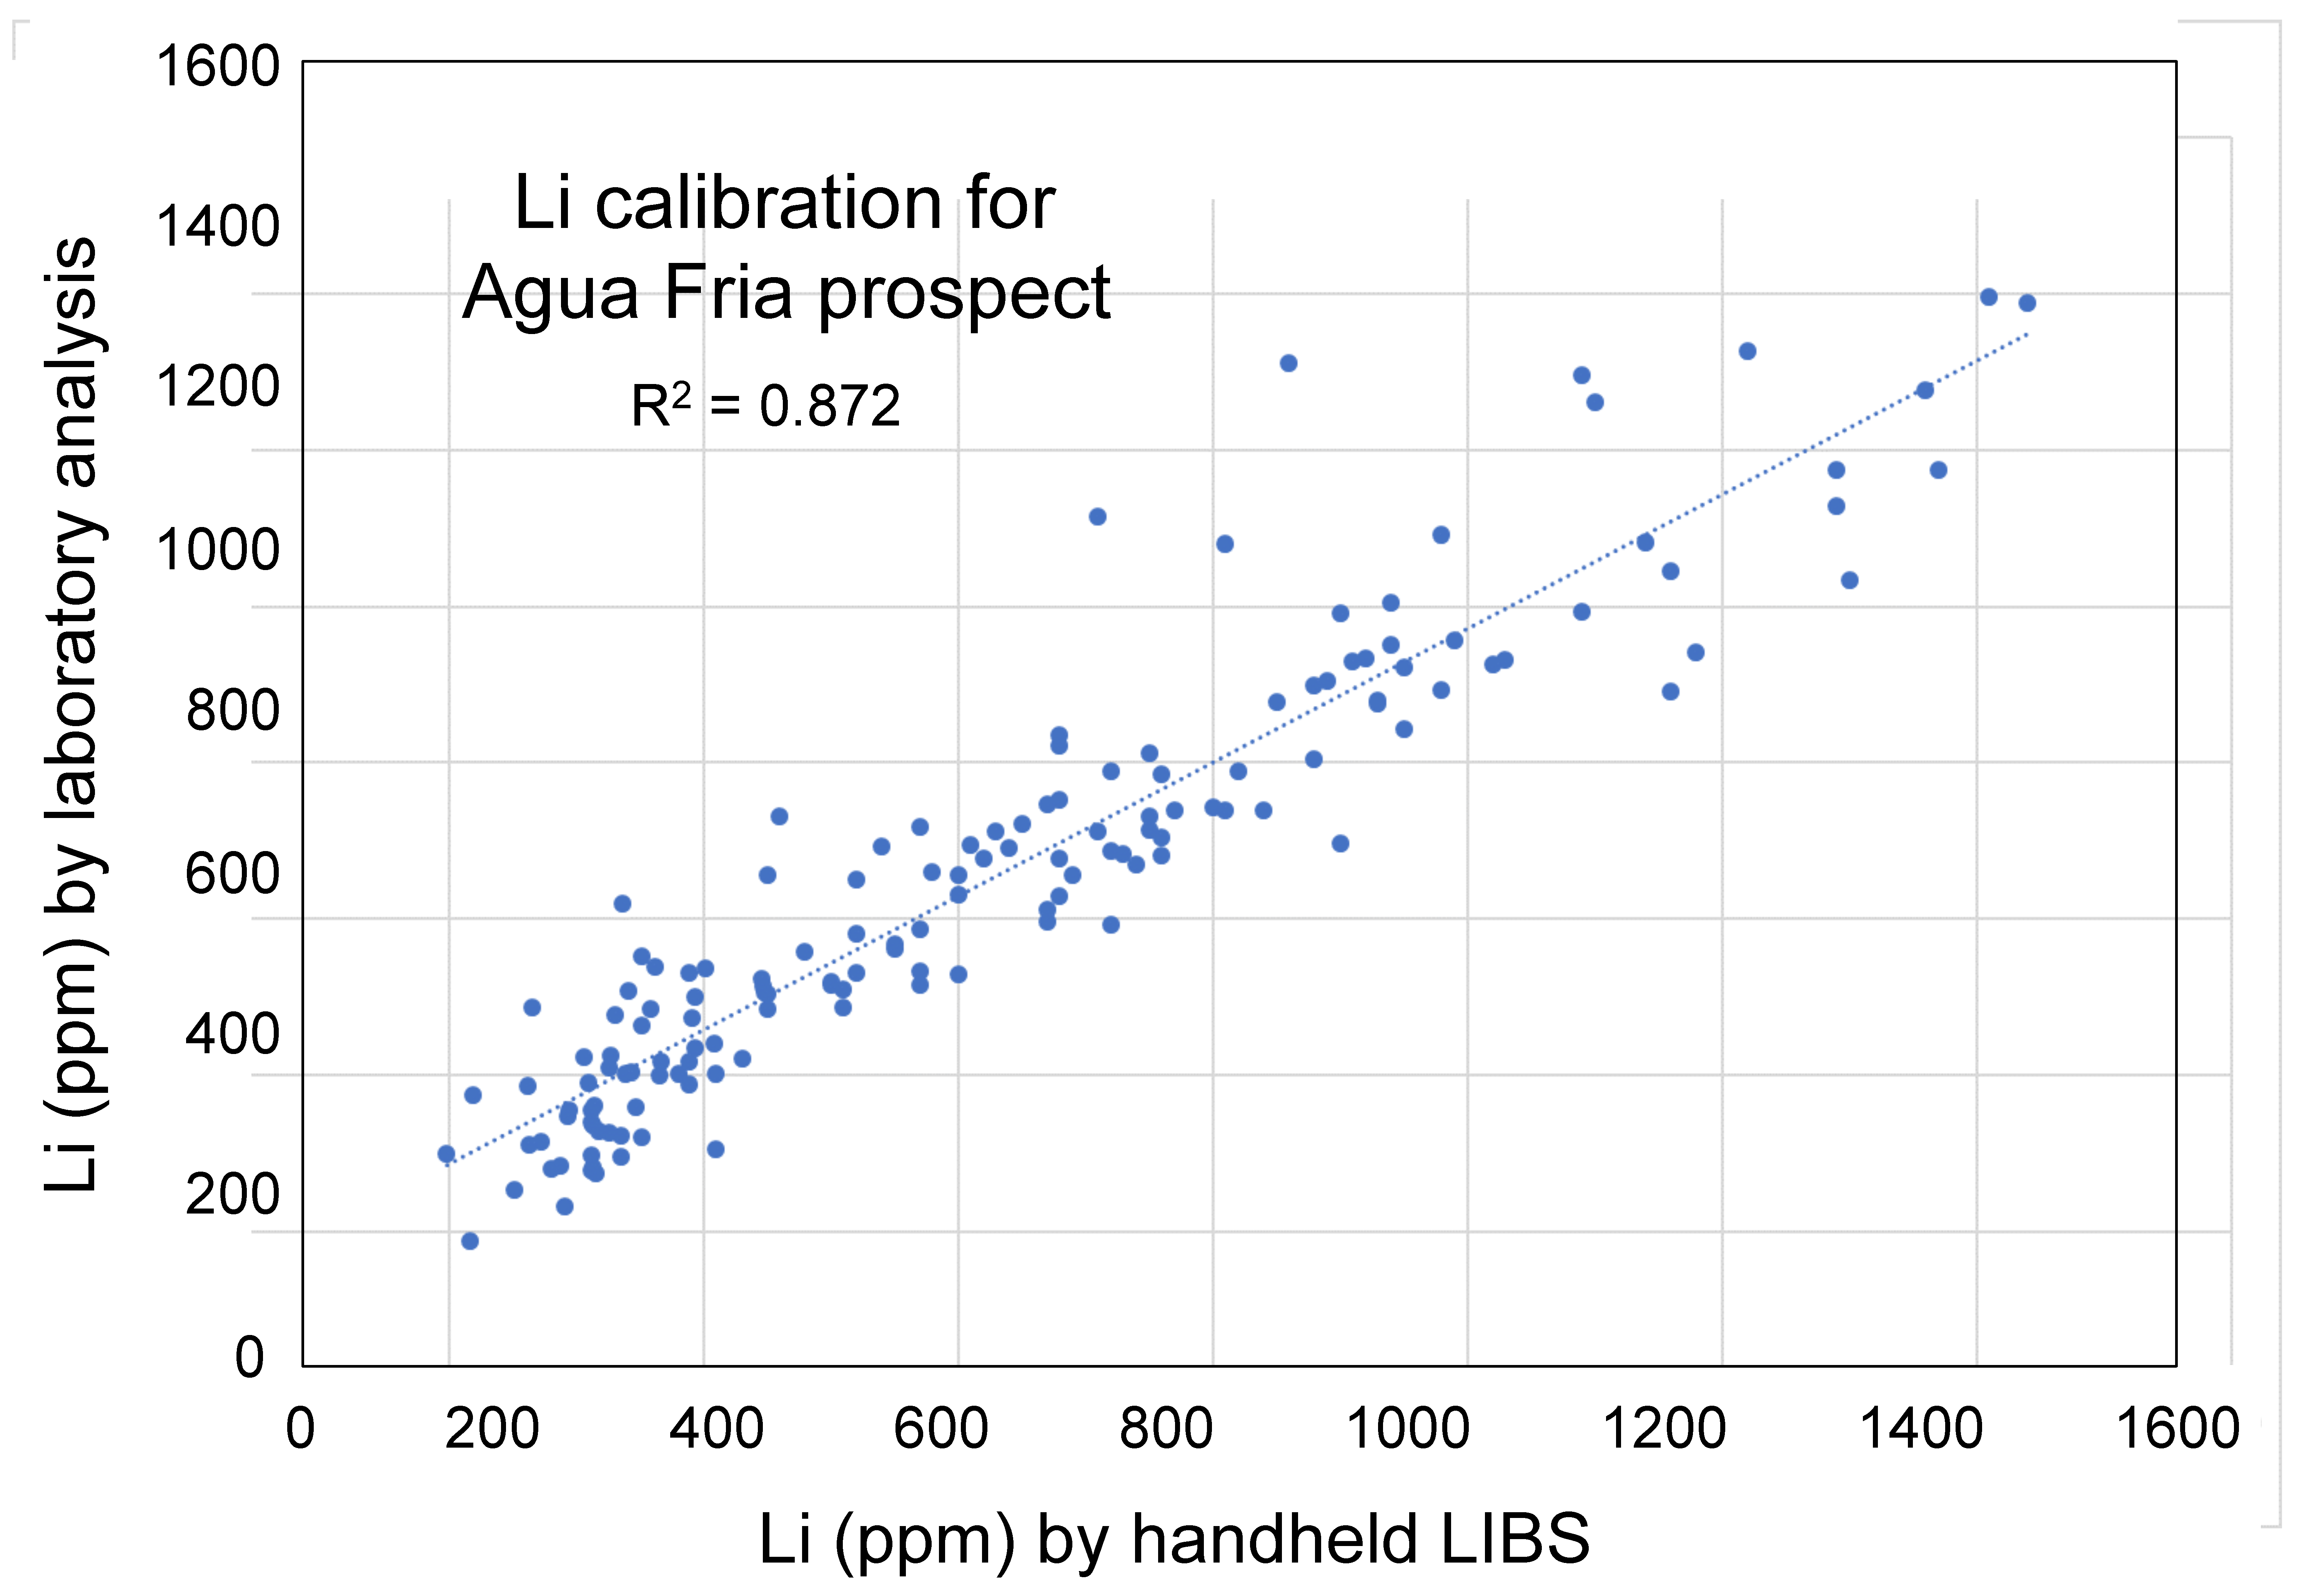
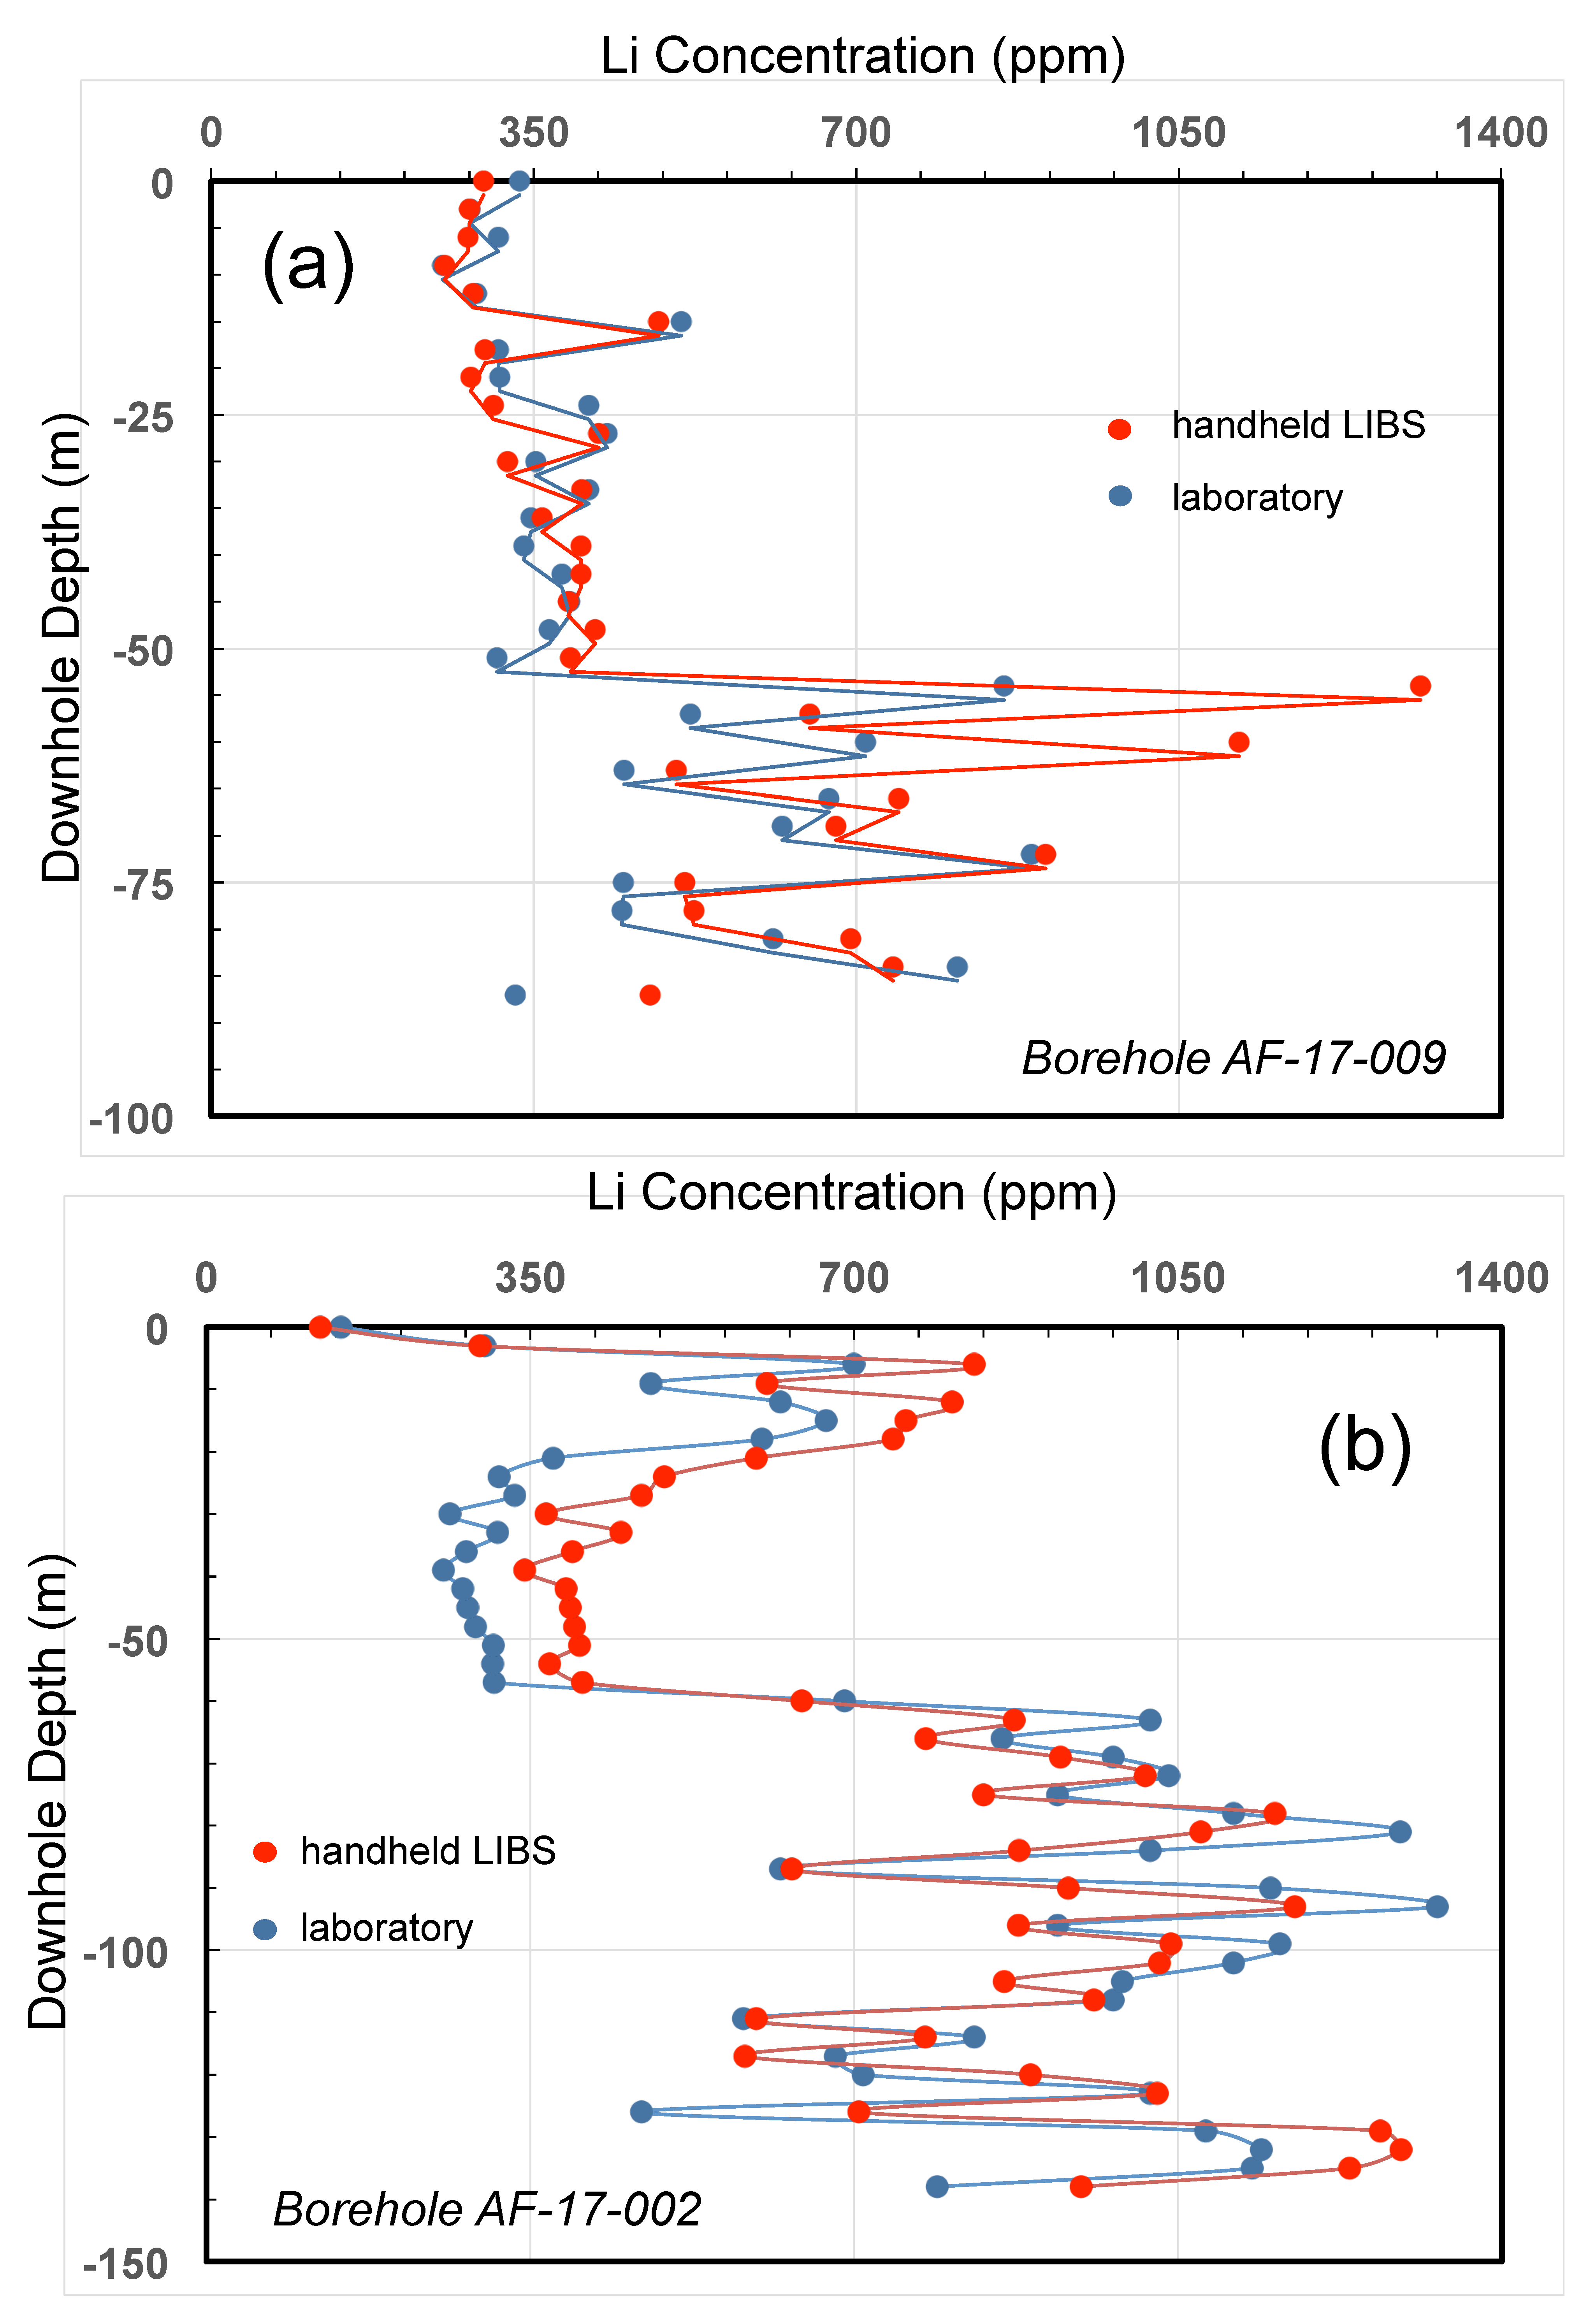
Composite samples were collected at 3-m intervals and homogenized by riffle splitting prior to sampling. Aliquots from homogenized 3–5-kg samples were submitted for quantitative, multi-element (n = 48) assays using a four-acid digestion with an ICP-MS finish (Australian Laboratory Services (ALS) geochemical procedure ME-MS61). A smaller sample aliquot was selected for further analysis using a SciAps Z-300 handheld LIBS analyzer. Sample pellets were pressed on-site using a portable Reflex hydraulic press. LIBS measurements taking 3 s each to acquire a 3 × 4 raster pattern at 12 locations were averaged to produce a single composite LIBS spectrum for each pressed pellet. Prepared samples from the initial Li calibration set were tested routinely. Handheld LIBS Li analyses agreed well with Li laboratory results, as illustrated in Figure 13, with an observed R2 of 0.86 for the suite of core samples analyzed. More scattering was observed at higher Li concentrations, but this did not result in incorrect classification of samples based on cut-off grades (i.e., higher-concentration samples still showed elevated levels of Li and, as such, were classified correctly as Li-rich samples). Some loss of accuracy was observed in cases when significantly different matrix types were encountered (Figure 14) or at the bottom of holes where moisture content was markedly higher [98].

4.3. Grain Size Analysis

4.3.1. Introduction

Successful mineral exploration involves not just the discovery of a sufficient concentration of the minerals of interest, but also a demonstration that these minerals can be extracted feasibly and economically. Numerous case studies demonstrated the important relationship between grain size and recovery [99,100]. Whilst many factors affect the recovery of economic minerals (including mineral texture and paragenesis), the size of the grains is a key parameter. Successful grain liberation is vitally important in extraction by techniques such as gravity separation, flotation, leaching, and magnetic and electrical separation, and it dictates the overall recovery [101]. If grain liberation is unsuccessful, recovery will be poor. Since grain size dictates crushing and grinding, which in turn affect overall liberation and recovery, grain size directly affects recovery. Understanding the processing behavior of ore minerals within a deposit is important when assessing the economic viability of an exploration project.
Grain size assessment is traditionally completed by reflected light microscopy or scanning electron microscopy (SEM) in conjunction with advanced mineralogical interpretation software packages [102,103,104]. Automated SEM systems equipped with advanced mineral identification software, such as the Mineral Liberation Analyzer (FEI Company, Hillsboro, OR, USA) and the quantitative evaluation of mineral by scanning electron microscopy (QEMSCAN, Hillsboro, OR, USA), are now commonly implemented in grain size assessment [102,104]. These systems identify minerals of interest, define the boundaries of the interested minerals, and then calculate the grain size of each mineral. These systems scan the entire sample surface, and typically cost hundreds of dollars per sample. This unit cost restricts the rollout of this type of analysis to a few tens to hundreds of analyses for a given rock volume.
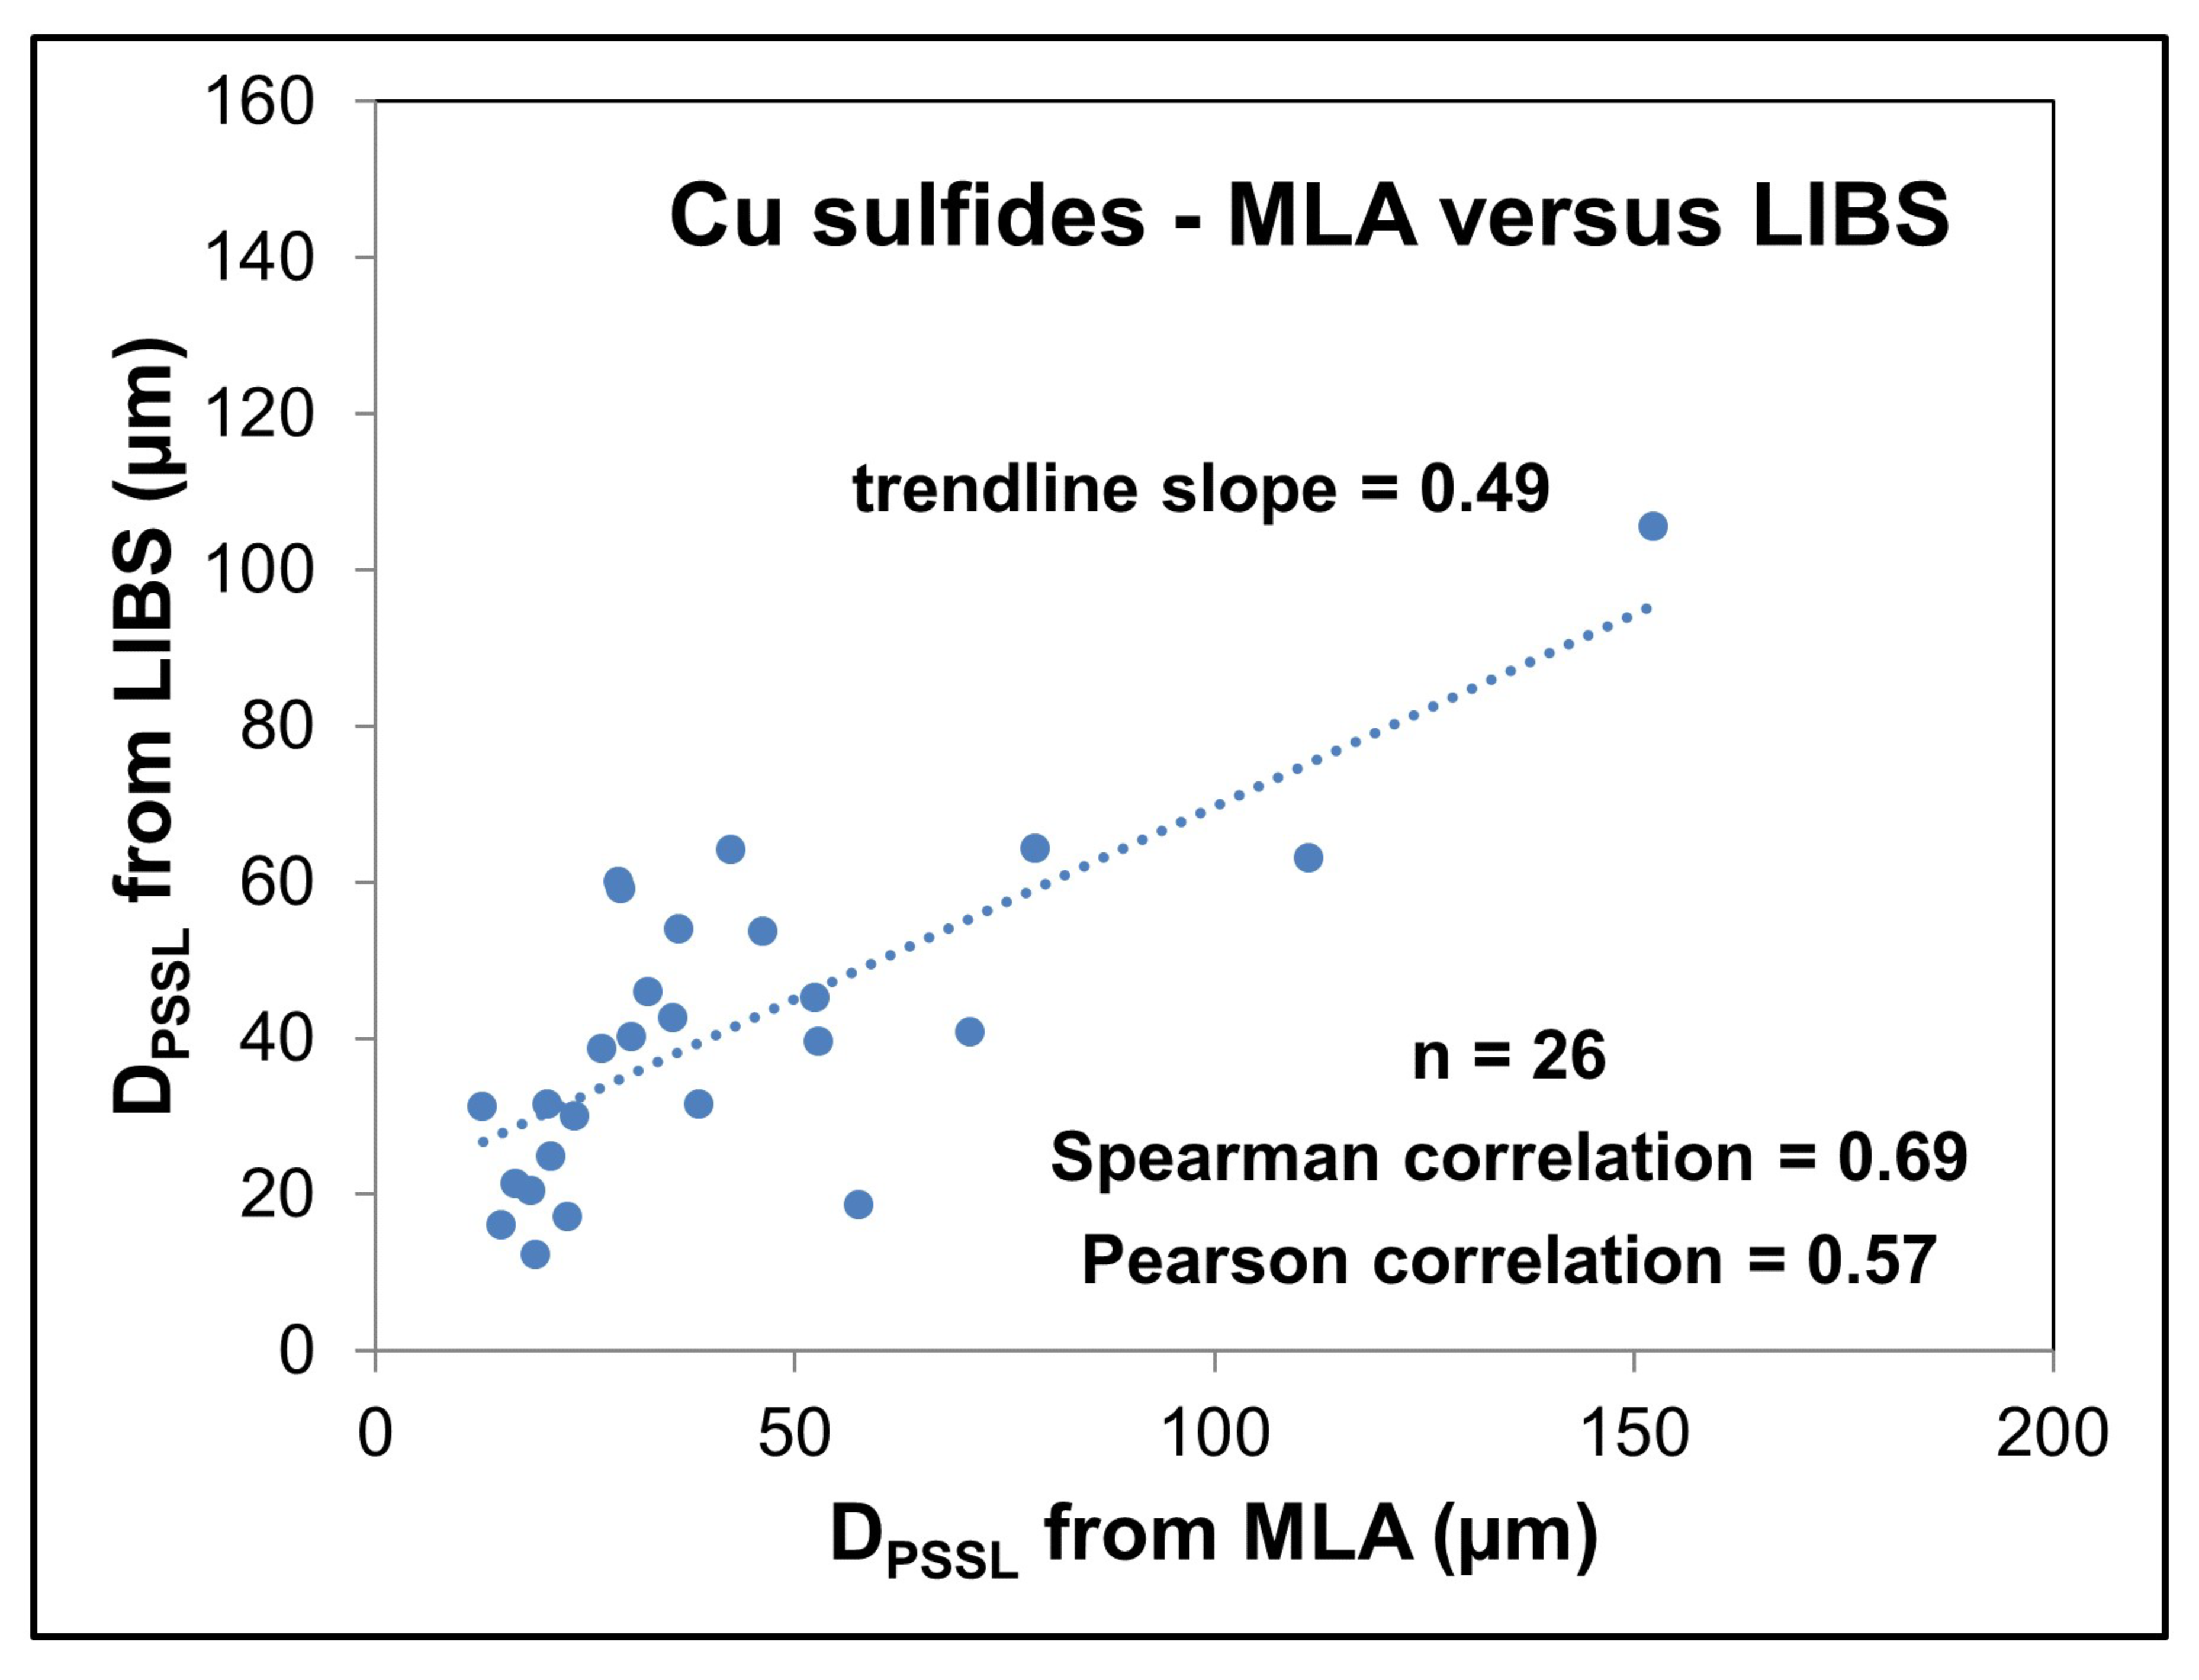
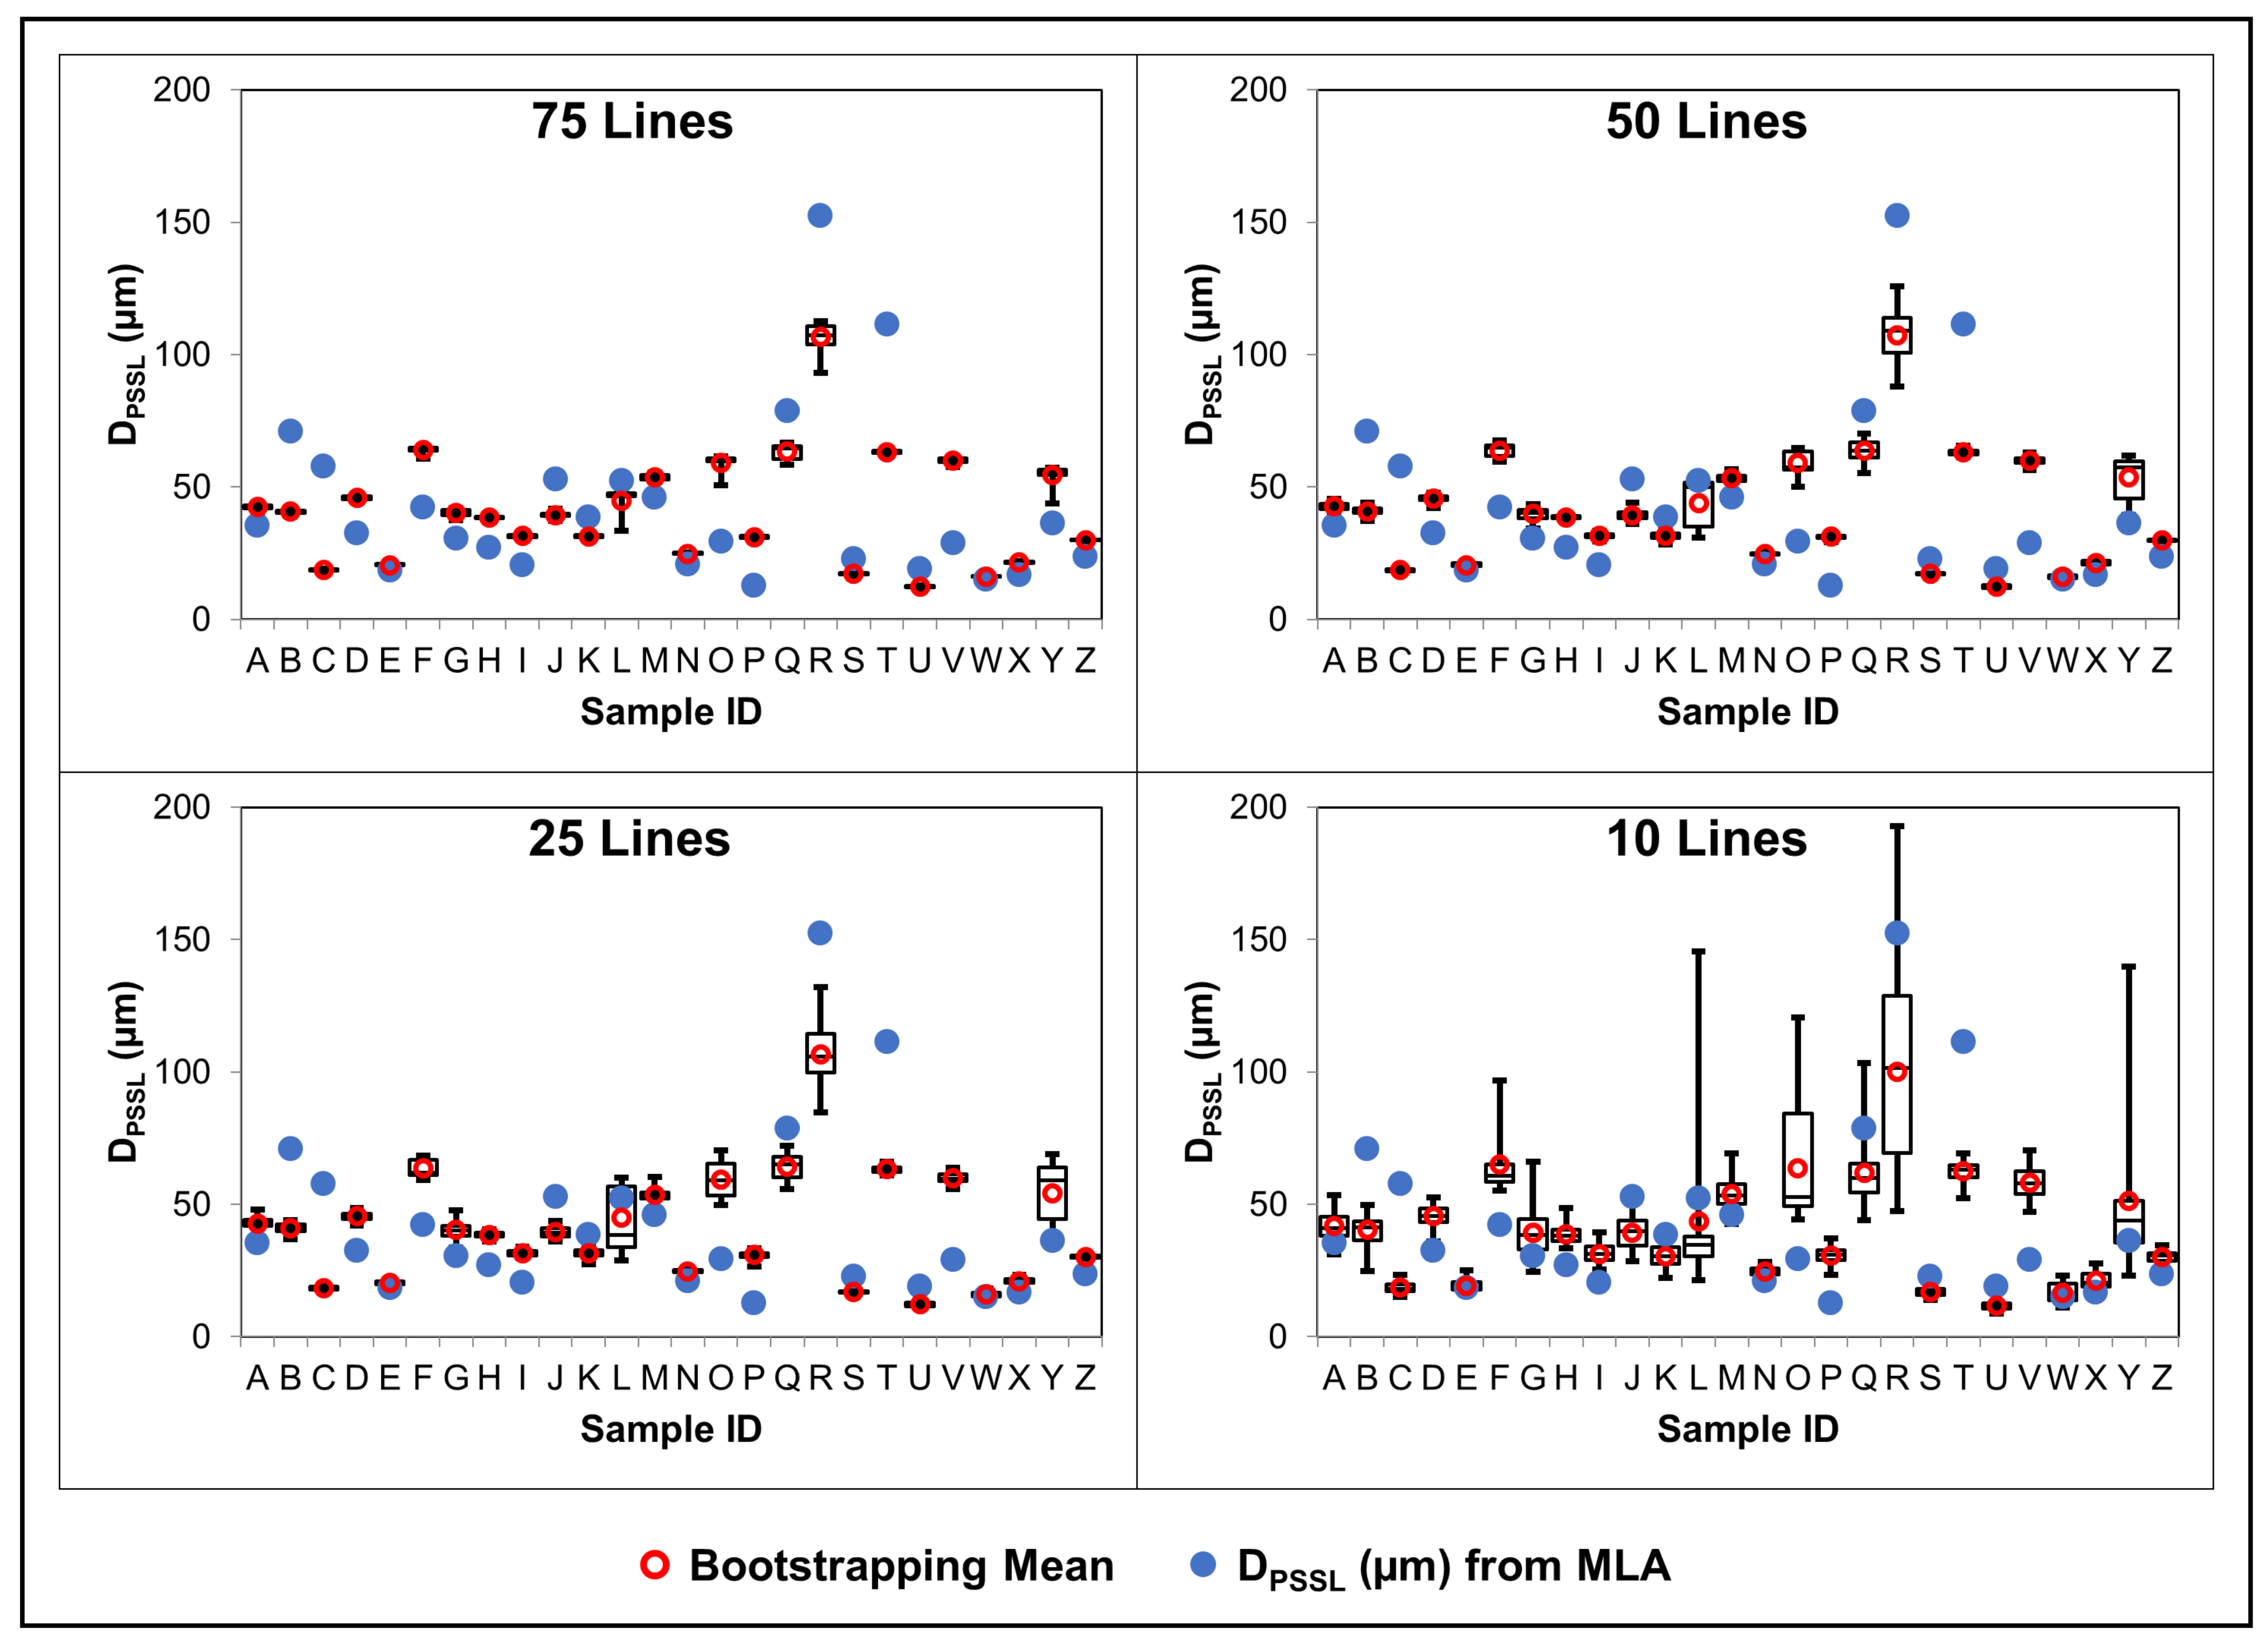
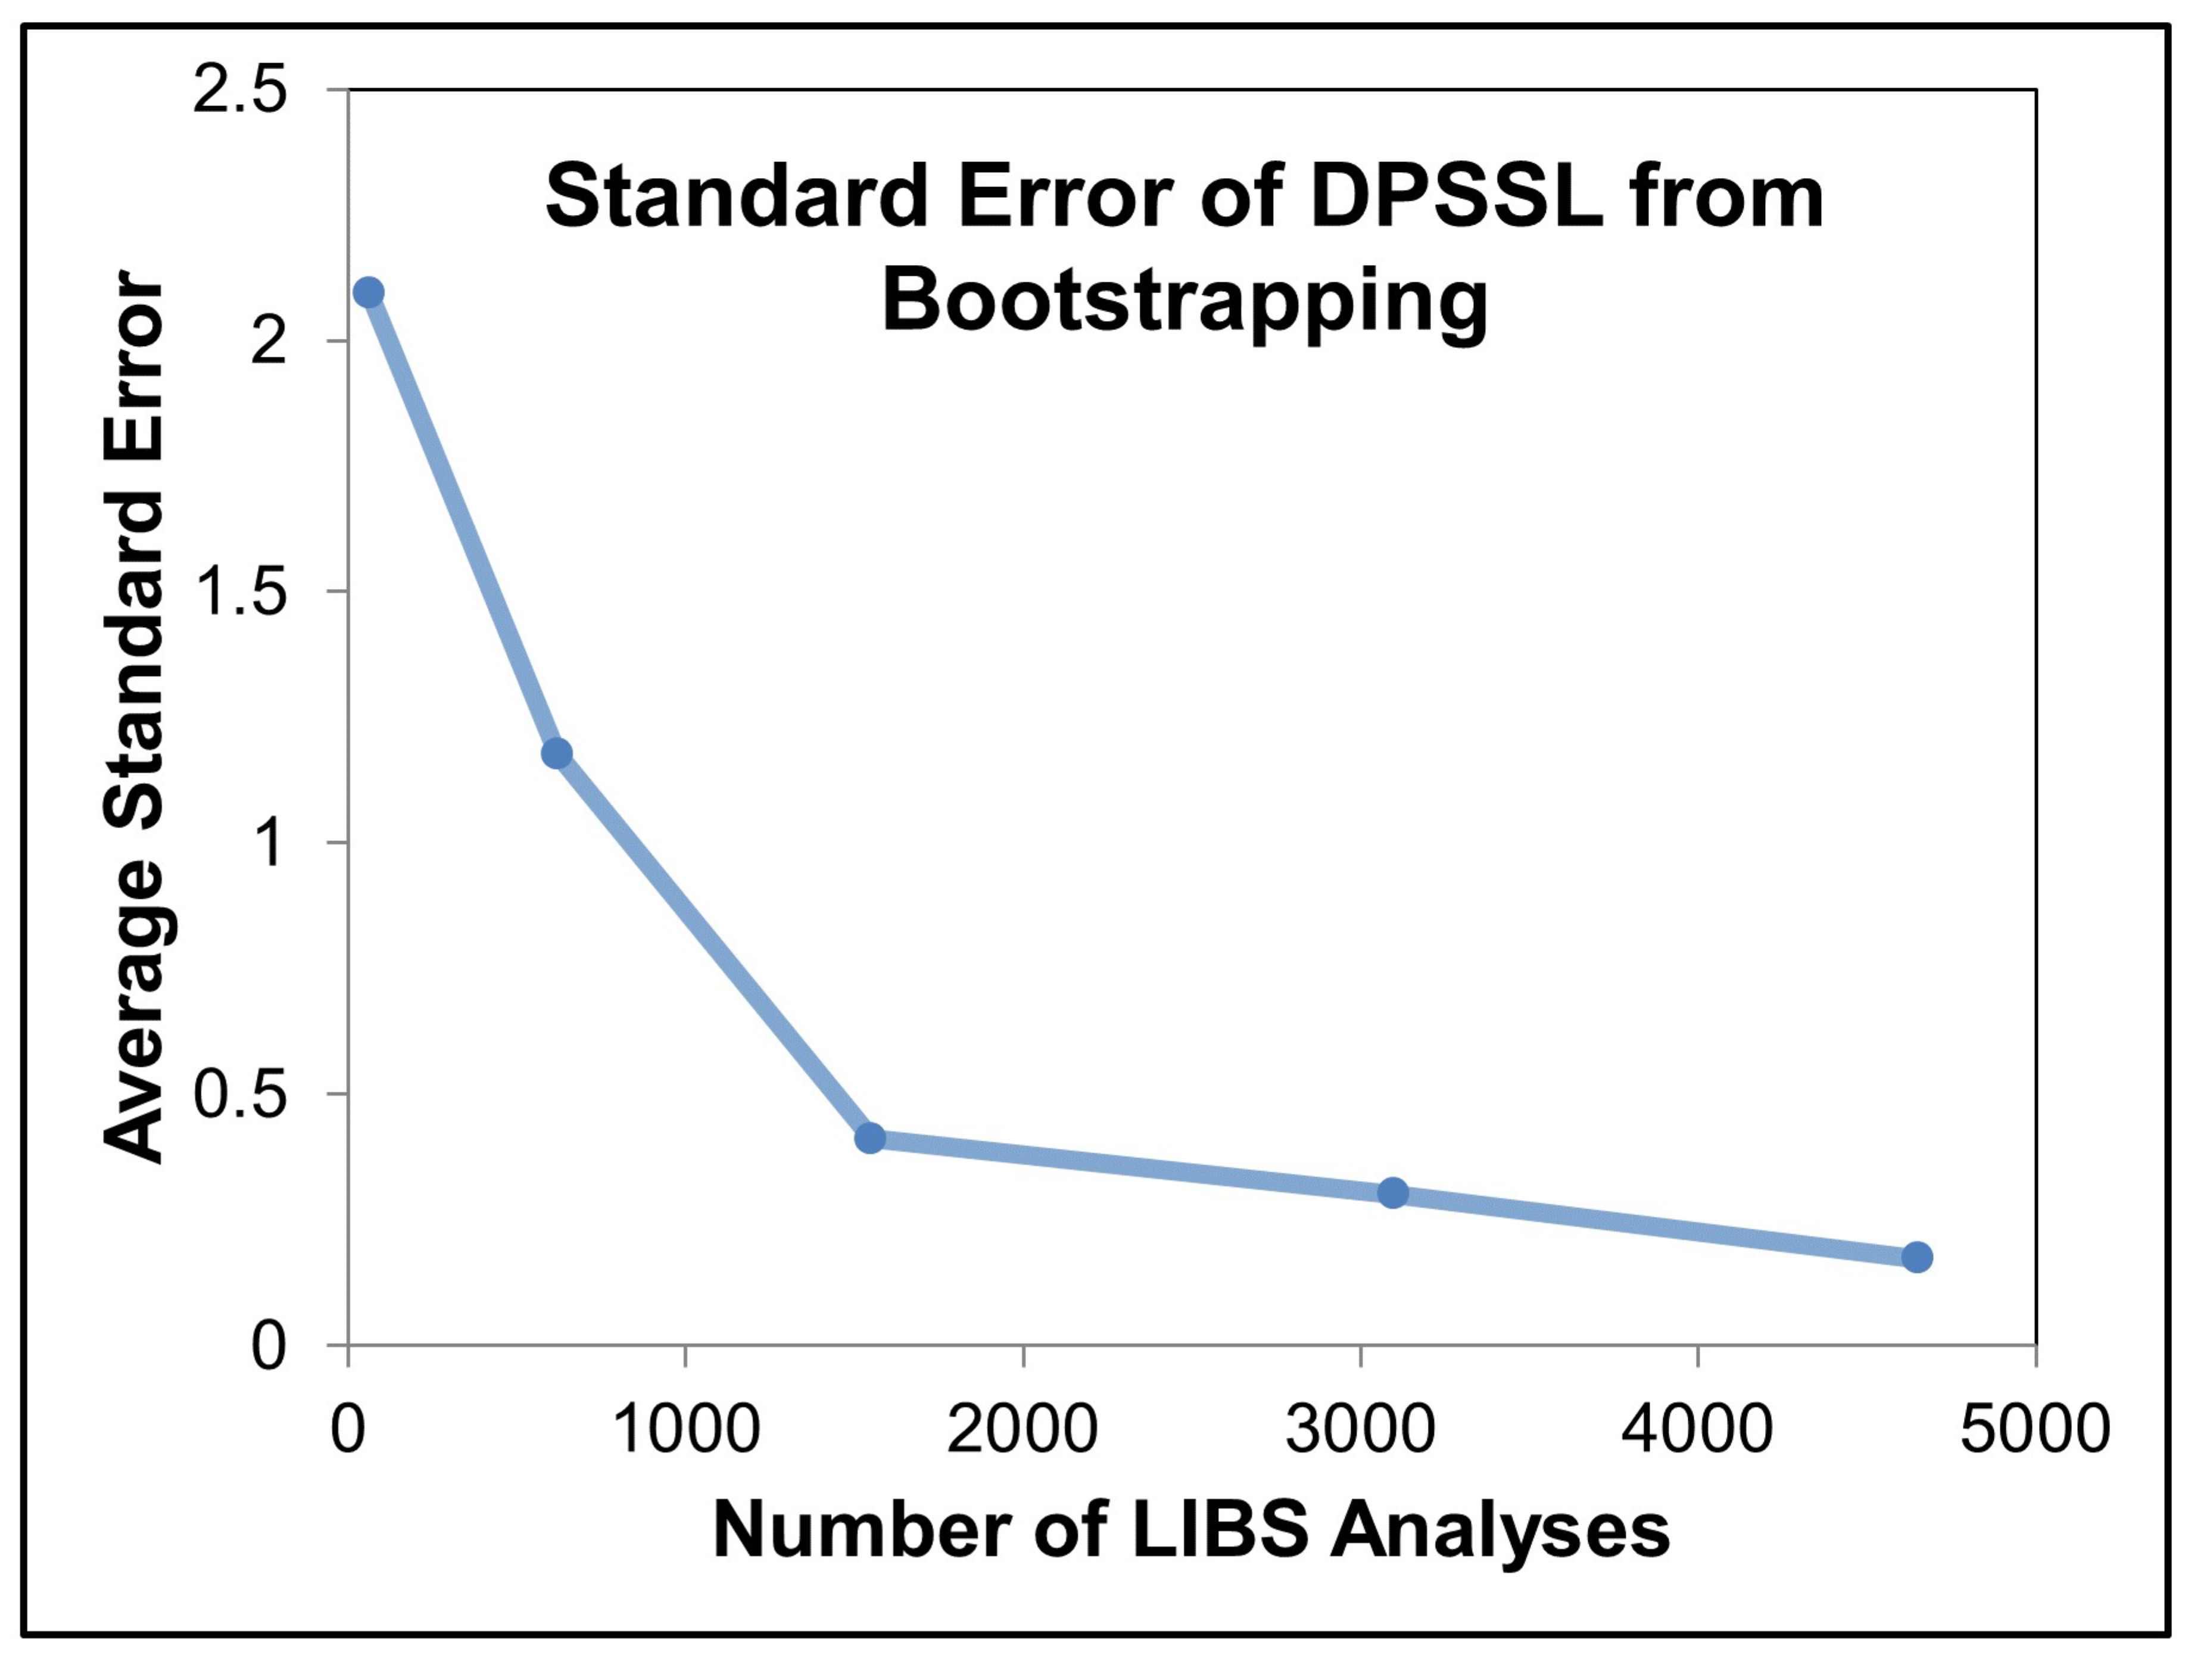
The LIBS technique for in situ analysis captures an optical emission spectrum that reflects the relative proportions of elements at a particular spatial location on a sample. The proportions of copper in an LIBS broadband spectrum are linked to the size of the Cu-bearing minerals present at the spot of analysis. Therefore, LIBS data can be used to develop proxies for determining grain sizes from the LIBS spectral signature. A combination of spectral matching and peak integration techniques was applied to identify copper minerals and calculate grain size proxies from 26 samples. These proxy results were then compared to the traditional MLA grain size measurements collected from the same samples. To determine the minimum number of LIBS analyses required (and, therefore, most rapid analysis time) to produce a representative grain size proxy, a series of bootstrapping experiments was completed.
Quantification of elemental abundances from LIBS spectra is difficult due to a number of factors described above and discussed by Harmon et al. [69] and Senesi [105]. In particular, the interactions between the laser and the sample material are complex and difficult to quantify, there can be multiple atomic emission peak overlaps resulting in signal interferences, and the likelihood of encountering multiple minerals and, therefore, multiple elements in a geological sample is high. Therefore, instead of attempting to quantify exact copper concentrations for grain size assessment, a combination of spectral matching and peak integration was used to identify copper minerals and develop grain size proxies based on relative abundances of each mineral.

4.3.2. Methodology

Data Collection

LIBS spectra were obtained from 26 rock tiles from a porphyry Au–Cu deposit. Compositional grids measuring 3 × 3 cm were collected using an Applied Spectra RT100-HP laboratory LIBS system at Juniata College in Huntingdon, Pennsylvania (USA). Spectra were acquired in air with a 100-µm beam size at 65% laser power operating at a repetition rate of 20 Hz. Typical detection limits reported in the literature for such LIBS copper analyses are in the range of tens of ppm [84]. Prior to LIBS analysis of the entire sample set, a series of LIBS measurements was collected on standard reference materials and an unknown sample to determine the effects of the laser on the sample surface and identify an appropriate analysis step size. Although the laser beam size used was 100 µm, the resulting ablation craters were measured to be approximately 150 µm in diameter. A circular damage zone containing deposits of ejected material was observed 20–50 µm outside of the ablation craters (Figure 15). Thus, a step size between analyses of 300 µm was used to avoid reanalyzing material ejected from the spot of the previous analysis. The analysis pattern consisted of 89 lines across the sample surface with 61 analysis spots per line, for a total of 5429 spot analyses per sample. As a consequence, some 60% of the areas of each 3 × 3 cm sample was covered in LIBS analysis spots (Figure 16).

Selection of Spectral Lines and Background

Pure Cu-sulfide minerals were analyzed to (i) select diagnostic Cu emission lines, (ii) determine background thresholds for data reduction, and (iii) identify spectra that contained Cu-sulfide using spectral matching. Specimens of single-phase chalcopyrite (CuFeS2) and bornite (Cu5FeS4) were analyzed under the same conditions used for the test sample analysis to serve as standards for these minerals. Cu emission lines were selected from the reference spectra to optimize peak intensity and minimize the effects of interferences from other element emission lines. The emission lines at 324.75 nm and 327.40 nm were selected as the main Cu peaks for the grain size analysis. These emission lines are commonly used to determine Cu concentrations from LIBS spectra, as they typically exhibit high intensities relative to background and have minimal interference from nearby emission lines [106]. Figure 17 shows example spectra collected for the bornite and chalcopyrite reference samples.
The background must be removed from the emission spectrum to ensure that only the LIBS signal related to the chemistry of a sample is used for the grain size proxy calculations. The chalcopyrite and bornite standards were used to assess background levels in the vicinity of the diagnostic Cu emission lines at 324.75 nm and 327.40 nm, which was measured at 329.90 nm.

Grain Size Proxy Calculations

Elemental quantification from LIBS data can be challenging; thus, basic techniques were used here to determine if LIBS is a viable option for rapid grain size assessment. Since most Cu-bearing grains are much smaller than the 150-µm spot size of the laser ablation crater, a single LIBS analysis could have sampled a number of different mineral grains. No attempt was made to distinguish between chalcopyrite and bornite grains or the number of grains at a single LIBS analysis spot. Instead, the grain size calculations were undertaken assuming that a single grain occurs in each spot, reporting an appropriate Cu threshold value, and that Cu was contained in combined Cu-sulfide composites consisting of 50% chalcopyrite and 50% bornite.
As a first pass, the spectral analysis software TSG HotCore (Australia Commonwealth Scientific Industrial Research Organisation, Canberra, Australia) was used to compare each unknown LIBS spectrum to the single mineral reference spectra. Copper was identified using the wavelength range of 320–335 nm. A Pearson correlation value between the unknown and the standard reference spectra was used to identify those spectra that were likely to contain Cu-sulfides. Pearson correlation cut-offs were selected by visually assessing numerous unknown spectra over a range of spectral correlation values to limit false positives (Figure 18). A cut-off of 0.3 Pearson correlation spectral match value was used, and spectra with a lower value were discarded from the Cu-sulfide grain size calculations.
Peak integration of the key emission lines was used to determine the proportion of Cu-sulfide present in spots exceeding the Pearson match criteria. To estimate the area under the emission lines, the area of multiple trapezoids drawn between the spectral channels to fit under the curve were summed by calculating an integration value as follows:
integration value = i = 0 n intensity i + intensity i + 1 2 × ( wavelength i + 1 wavelength i ) .
The proportion of combined Cu-sulfide contained in an individual LIBS analysis spot was calculated by firstly background-correcting the integration value (IV) for the sum of both Cu peaks as follows:
IV Cu Sulf = ( IV Cu   324.75 + IV Cu   327.40 ) ( 2 × IV BG   329.9 ) .
The integration intervals for Cu peaks and background, as well as the expected values for the chalcopyrite and bornite standards, are given in Table 2.
Since the background signal was variable from spectrum to spectrum, an individual “limit of detectable grain size” for each spectrum was determined by taking three times the square root of the integrated value background. This limit was then used to ensure that Cu could be qualitatively distinguished from the background signal [107]. Any spectrum with an integration value less than the limit of detectable grain size was discarded from the grain size calculations.
For LIBS analysis of spots that were not discarded at this point, the calculated background-corrected integration value was then compared to the expected value for combined Cu-sulfide from the reference spectra as follows:
Cu Sulf prop = IV Cu Sulfide   ( measured ) IV Cu Sulfide   ( standard ) .
LIBS craters in chalcopyrite and bornite were measured to be less than 2 µm deep; thus, it was assumed that the LIBS spot is an analysis area rather than an analysis volume. As such, the proportion by area of Cu-sulfide present in a spot can be easily converted into a grain size as follows:
Grain Size = Mineral prop × 150   μ m .
Assuming that the reported grain size values represented the length of a square grain, this length was then used to calculate the boundary length and area for each of the grains encountered in each sample. These values were used to determine the diameter by phase-specific surface area (DPSSL) for all of the grains detected in each sample. It should be noted that these proxy methods assume that the Cu-sulfide detected occurs in a single grain completely within a single LIBS analysis spot. It may be the case that an analysis spot contains numerous sub-spots or partial Cu-sulfide grains rather than a single large grain, but this cannot be resolved for grains less than the LIBS analysis spot size, which was 150 µm in this study.

4.3.3. Results

The grain size proxy results from LIBS data assuming that the copper is contained in combined Cu-sulfides were compared to the MLA results (Figure 19). These results had an R2 value of 0.57 and an rs correlation value of 0.69. Using all 5429 LIBS analysis spots provided a reasonable estimate of grain size. A series of bootstrapping experiments was completed to assess the minimum number of LIBS spots required to adequately estimate a grain size proxy. These experiments were designed to randomly select groups of 75, 50, 25, 10, and 1 line of LIBS analysis spots from each sample, and calculate the corresponding DPSSL grain size proxy. Fifty iterations of each bootstrapping experiment were completed.
To compare the performance of the calculated grain size estimates as the number of analysis lines decreases, a series of box-and-whisker plots containing the bootstrapping results for combined Cu-sulfides were plotted (Figure 20). In general, as the number of lines used to calculate the grain size proxy from LIBS decreased, the mean bootstrapped DPSSL values changed and the second and third quartile range values increased. Grain size proxy values for combined Cu-sulfide calculated from LIBS data had an average standard error of less than 1.5 in 50 experiments, when at least 620 of the total 5429 analysis spots were used for grain size assessment (Figure 21). A standard error value of 1.5 indicates that, with 95% confidence, using 620 random LIBS analyses would provide DPSSL values within 1.5 µm in 50 repeated experiments.

4.3.4. Discussion

A combination of spectral matching and peak integration was used to identify combined Cu-sulfides from LIBS spectra. LIBS analysis was successful in detecting and measuring combined Cu-sulfide grains. When including all 89 LIBS analysis lines, combined Cu-sulfides exhibited a Pearson correlation coefficient of R2 = 0.57 and a Spearman correlation coefficient of rs = 0.69 when compared to the DPSSL from MLA. These correlation coefficients show that the LIBS data can be used to rank samples by grain size. The slope of the correlation trendline, when compared to MLA, was below 0.5. Such a low slope value indicates that the LIBS grain size proxy underestimates the grain size by approximately 50%.
There are numerous complexities of LIBS analysis that should be investigated before implementing the approach described here as a grain size assessment tool. LIBS ablation craters are not uniform or symmetrical (Figure 22), which makes an estimation of the surface area or ablation volume challenging. While the ablation depth in quartz is more than 75 µm, the ablation depth in Cu-sulfide minerals is 1–5 µm. Such variation in LIBS ablation crater character indicates that different minerals ablate at different rates as a consequence of distinct laser–material interaction behaviors. Figure 23 shows an SEM image of an LIBS ablation crater in calcite and a Cu-sulfide, both of which display brittle (Figure 23A) and melting behavior (Figure 23B). Additionally, the depth of ablation varies depending on the mineral present at the spot of laser sampling. As illustrated in Figure 24, minerals such as quartz and feldspar produce very deep ablation craters (>100 µm) whilst Cu-sulfide minerals produce very shallow LIBS ablation craters (<5 µm). These changes in mineral behavior and ablation crater depth impact the ablation volume at a given spot. If Cu-sulfide grains are smaller than the spot size and hosted in other minerals, the ablation volume becomes higher than it would be if only Cu-sulfide was ablated.
For this study, it was assumed that all ablation craters are shallow, and that the LIBS spectra represent a surface area as opposed to a volume. If a Cu-sulfide grain smaller than the 150 µm laser spot size was hosted in quartz, then the ablation would be a volume not an area. By assuming this volume as an area, the grain size proxy calculation is underestimated. However, much of the ablated material is likely in the surrounding ejecta where the volume is large; thus, it is not possible to estimate the actual volume of material that enters the plasma. Therefore, further research to account for variable ablation behavior is required if the LIBS method for grain size proxies explored here is to be utilized in the future. A visible-light laser (e.g., wavelength-doubled Nd:YAG laser) or an ultraviolet (UV) laser (such as that used by References [50,51] or in laser ablation ICP-MS (LA-ICP-MS) analysis) would reduce the magnitude of the cratering, but these lasers have lower output power and may, therefore, produce smaller spot sizes [108].

4.3.5. Conclusions

Whilst the test dataset used in this study is small, the results show that Cu-sulfide grain size proxies developed from LIBS data can be used to adequately assess grain size. Calculated grain size proxy values are generally within 20 µm of the measured DPSSL values from MLA data, although the slope of the correlation trendline (R2 = 0.49) indicates that the LIBS analysis underestimates the MLA grain size by approximately 50%. Bootstrapping experiments show that this method requires only 620 LIBS analysis pixels to achieve repeatable grain size results for Cu-sulfides with an average standard error of less than 1.5 µm. In the case of Cu, at least 620 LIBS analyses at 150 µm are required to adequately estimate combined Cu-sulfide grain sizes using proxy calculations developed from LIBS data. The RT100-HP laboratory LIBS system used in this study can analyze the required 620 spots in 31 s. Therefore, currently available LIBS technology shows great promise to acquire early grain size information rapidly (under one minute) and with minimal damage to the samples being analyzed. This information can be used at an early exploration stage to assess project viability and economics.

4.4. Geochemical Imaging and Microscale Mapping

4.4.1. Introduction

Whole-rock lithogeochemistry and micro-analytical spot analysis still represent the two primary tools for mapping the geochemical footprint of ore systems. However, unraveling the complex and multiply overprinting hydrothermal alteration history of most ore systems from whole-rock analysis represents a major challenge. Spot microanalyses also often exclude, or ignore, grain boundaries, fractures, and/or complex mineral intergrowths. Unfortunately, these features are, in fact, important micro-textural sites for transporting and/or depositing ore-forming elements at the microscale. To address these analytical challenges, there is a growing interest in two-dimensional (2D) element mapping, which provides geochemical information in a complete geologic context with all of the adjoining mineral phases. With careful calibration using standards of known composition, these geochemical images can provide fully quantitative results for the targeted area of interest [109,110]. Interpreting geochemical data in a geologic context provides critical constraints on the relative timing relationships between microscale features, which can, in turn, be used to unravel overprinting hydrothermal histories. The interpretive power of geochemical data in a spatial context represents the main reason that 2D, and more recently 3D, element mapping is rapidly becoming the standard mode of data acquisition rather than conventional spot microanalyses. However, geochemical imaging until recently required large and expensive analytical equipment, which mostly restricted element mapping studies to research applications. Advances in handheld LIBS provide an opportunity to acquire geochemical images in the field.

4.4.2. Methodology

The SciAps Z-300 can generate 2D element maps by rastering its laser over the sample surface to create a 16 × 16 grid of spots. Each LIBS spot has a diameter of approximately 50–100 µm, which corresponds to a mapping area of roughly 2 × 2 mm for the standard raster grid pattern. LIBS spectra for each of the 256 spots can be integrated using the SciAps Geochem Pro software to generate qualitative 2D maps of wavelength intensity. The spectral signature of each spot is then matched to the on-board LIBS library before the relative abundance map for each of the identified elements is projected onto the Z-300′s results screen. Connors et al. [65] described how geochemical imaging can be applied to identify mineralogy and/or chemical zonation within individual minerals. Both of these applications have significant potential to assist with mapping the geochemical footprints of ore systems in the field.
We extended the capabilities of the SciAps Z-300 to accomplish the mapping of larger areas of interest (cm scale) than permitted by the pre-programmed raster domain of 16 × 16 grids or 2 × 2 mm, by stitching multiple spectral maps of this size together. To integrate data across multiple LIBS mapping experiments, new code was written in the free and open-source R software environment [111]. Semi-automated data processing following this new open-source workflow [112] includes wavelength binning (0.1–0.3 nm), baseline correction (i.e., using a local regression fitted to minimum intensities across the spectral range), local background estimation (i.e., running median to wavelength intensities), and peak finding (i.e., moving window). The most important wavelength intensity peaks are differentiated from the estimated background using a user-selected threshold (i.e., 1.5 × median absolute deviation on running median). Finally, LIBS spectral results are normalized to either the sum of the filtered wavelength peaks intensities or the maximum peak intensity for each pixel. All data processing is completed on a pixel-by-pixel basis, which is important for map areas that include multiple minerals. Here, mapping results are reported as a percentage of the maximum peak wavelength intensity. Wavelength intensities below the local background are reported as not available (NA).

4.4.3. Results

We applied this new LIBS mapping method to a suite of gold-bearing veins from the MacLellan gold deposit, Lynn Lake, Manitoba, Canada. LIBS spectra for the mapping were acquired in Ar on the unprepared surface of the cut drill core. Detailed field and laboratory studies identified multiple vein generations and hydrothermal alteration mineral assemblages at the MacLellan deposit [113,114,115]. As illustrated in Figure 2, many of the minerals associated with gold in these veins yield characteristic LIBS spectra. Handheld LIBS can, thus, be used to define the spectral fingerprint of the different vein suites and their hydrothermally altered halo in the field and directly on sawed core surfaces (Figure 25, Figure 26, Figure 27 and Figure 28).
The mineralogy of quartz veins is an important visual indicator of gold ore zones at the MacLellan deposit. Gold-bearing vein mineralogy can be complex (Figure 25a), including quartz (SiO2), calcite (CaCO3), arsenopyrite (FeAsS), pyrrhotite (Fe1−xS), sphalerite ([Zn,Fe]S), and rare galena (PbS). Geochemical imaging of the core surface clearly demonstrates how qualitative LIBS spectra can be used to differentiate the complex mineralogy of the vein at the microscale (Figure 25c–j). Sulfide-rich vein domains yield the typical spectral wavelengths for mineral-forming elements and/or minor (wt.%) to trace elements (µg/g or ppm) that readily substitute into sulfide minerals (Figure 25 and Figure 26), including Fe (404.6 nm), S (921.3 nm), As (228.8 nm), Zn (472.2 nm), and lesser Cd (508.6 nm). As expected, minerals that are devoid of these elements, such as the quartz and/or calcite vein matrix, yield relative intensities for these emission wavelengths that are below the estimated background (Figure 25h). The ability to detect minor to trace element signatures of sulfide phases is significant, because the relative abundance of these elements can be used to assist in mineral identification. For example, arsenian pyrite and arsenopyrite, which are the two main As-bearing phases at MacLellan, are readily distinguished from other Fe-bearing minerals in the sample matrix (Figure 25 and Figure 26). The minor to trace element composition of minerals can also be used to differentiate multiple generations of hydrothermal alteration phases and/or gain insight into the composition of the hydrothermal fluid that transported the ore-forming elements. For example, Cd2+ occurs at up to wt.% concentrations in sphalerite, which, due to its similar charge, readily substitutes for Zn2+ (Figure 25g). This substitution reaction is dependent, in part, on temperature, which makes the Cd concentration of sphalerite a potential geochemical fingerprint of ore-forming processes at different deposits [116].
Perhaps most importantly, LIBS mapping is also an effective tool for identifying minute minerals of significant economic interest. For example, geochemical images in Figure 25 map the distribution of at least three precious metal-rich grains and/or clusters of grains across the sample surface. Although the exact mineralogy remains somewhat unclear from the LIBS spectra alone, the main emission wavelengths for Au at 242.8 nm (and 267.5 nm) and Ag at 328.1 nm, together with their reproducible wavelength map patterns for these pixels, tend to support the presence of fine native gold (≤50 µm). Two of these native Au grains were observed prior to LIBS mapping (Figure 25a). Based on these LIBS map results, suspected native gold grains in Figure 25 are intergrown with sphalerite and an Mg-bearing carbonate (Figure 25g). Geochemical imaging, coupled with chemometric methods, can also be used to isolate gold-bearing pixels from the rest of the LIBS mapping results (Figure 27). Although the spatial resolution of the geochemical image in Figure 27 is relatively crude (n = 256 spots), the LIBS map results clearly show that native gold is enveloped by a thin quartz rim (≤100 µm) at the margin of the amphibole. Such detailed microscale paragenetic relationships are normally restricted to research applications, but, in this case, were acquired in the field on a non-prepared cut drill core with a handheld LIBS device.
Rare, micrometric galena grains (≤100 µm) spatially associated with arsenopyrite (Figure 26b) are also inferred from elevated wavelength intensities that correspond to Pb (368.4 nm). Some of these accessory, base metal-rich sulfide minerals represent important visual indicators of the high-grade ore zones at many gold deposits and districts (e.g., galena, tellurides, bismuthides), including at the MacLellan deposit [113]. The results indicate the potential of handheld LIBS for accurate mineral identification to distinguish base metal-rich vein types, even in cases where these accessory phases may be very fine grained (Figure 26 and Figure 27).
Geochemical imaging with LIBS is also effective at differentiating other vein minerals (Figure 25, Figure 26, Figure 27 and Figure 28), including quartz using the spectral emission line for Si at 288.6 nm, for calcite using the spectral emission line for Ca at 616.2 nm, and for biotite/muscovite using the spectral emission line for K at 766.49 nm. The association between K, Na, and Li and biotite–muscovite at the margins of the arsenopyrite-rich band in Figure 26 suggests that auriferous fluids were relatively enriched in light elements. The Li-bearing signature of the veins provides a hitherto unrecognized geochemical vector for mapping the geochemical footprint of the MacLellan deposit.
At many deposits and districts, Au is also often associated with particular composition of carbonate minerals, typically Fe-, Mn-, and/or Mg-bearing carbonate (e.g., ankerite). As discussed above, differentiating the different carbonate minerals and their minor element associations is often difficult in the field. Geochemical imaging in Figure 25 distinguishes at least two generations of carbonate. Coarse grained, Mg-bearing calcite is closely intergrown with sphalerite and gold, whereas finer Mg-poor carbonate within the vein matrix is closely intergrown with quartz. The fine grain size of the latter carbonate generation would have been difficult to identify in the absence of geochemical imaging.
The hydrothermally altered halos of veins represent another important component of the hydrothermal footprint of most ore systems. Map transects across different vein generations provide a geochemical fingerprint of the ore-forming fluid. When these hydrothermal alteration assemblages are overprinted, as in Figure 28, the relative timing of the different vein generations provides clues to the geochemical evolution of the ore system. For example, it is clear from LIBS results that the Ca-altered mafic volcanic rocks in Figure 28 were overprinted by younger K-, Na-, and Ba-rich fluids. Both veins types comprise part of the geochemical footprint at the MacLellan deposit; however, based on the whole-rock assay for this particular sample, the younger generation does not appear to be related to auriferous fluids. Repeated transects across each of the identified vein types could be used to build a more complete model for the geochemical evolution at the MacLellan deposit.

5. Summary and Future Prospects

The mineral exploration industry faces the enormous challenge of improving discovery rates and lowering discovery costs at a time when future mineral reserves will likely be sourced from deeper, covered, and/or lower-grade deposits. To address that challenge and meet society’s demand for critical commodities, new methodologies and technologies are required. Recent advances in both laboratory and field-portable LIBS have an unmatched potential to support mineral exploration efforts through rapid, qualitative to quantitative geochemical analyses conducted in situ under ambient environmental conditions with little to no sample preparation. As described above, qualitative LIBS broadband spectra, appropriately coupled with chemometric methods, can be used to achieve the following:
(i) Define geochemical fingerprints for classification- and/or discrimination-type problems. Provided that a spectral reference library is available, such geochemical fingerprints are being applied to identify and successfully predict the provenance of economic minerals and for tracing their source to ore pathways;
(ii) Raster the laser over the surface of a sample, to convert LIBS spectra to geochemical images of elemental distribution. This element mapping approach represents the preferred mode of data acquisition for micro-analytical geochemistry, which until now was mostly restricted to research investigations;
(iii) Obtain near-complete geochemical characterization for individual spots and mapping analysis at wt.% to ppm concentrations within the constraints of elemental limits of detection because all elements of the periodic table are associated with one or more emission wavelengths between 190 and 900 nm;
(iv) Analyze the light elements (e.g., B, Be, Li, Na, and Mg) to which LIBS is particularly sensitive, which represents one of the primary advantages of LIBS over other handheld technologies;
(v) Acquire semi- to fully quantitative geochemical analyses, based upon proper calibration. Quantitative LIBS calibration strategies were already described, and they represent an emerging tool for mapping cryptic geochemical footprints for minor to trace elements that are invisible to geophysical methods and/or impossible to observe directly.
The specific attributes of LIBS over other analytical techniques make it an important stand-alone tool for mineral explorationists. However, the future of LIBS may, in part, rest with so-called tandem or hyphenated technologies that combine multiple analytical techniques into one sensor. For example, integrated LIBS and laser ablation ICP-MS laboratory systems combine the excellent sensitivity of mass spectrometry methods for element detection down to ppb or ng/g concentrations, with the added benefit of light element analysis [117]. Combining both methods compensates for the limitations of each technique and promises near-complete coverage of the periodic table for characterizing multi-element geochemical footprints. Other types of small, portable tandem instruments are already commercially available (e.g., Olympus TERA portable XRD/XRF analyzer) or are being developed for research applications, including space exploration. More blended handheld technologies should be expected in the future (e.g., Raman/LIBS; XRF/LIBS), which will benefit mineral exploration through improved sample compositional characterization.
In addition to more sensitive spectrometers and other hardware improvements (e.g., double-pulse LIBS, femtosecond LIBS, standoff LIBS), the most promising areas of LIBS development in the short to medium term will likely center around upgraded software and the further application of advanced data analytics. Machine learning tools have the potential to automate all or parts of spectra deconvolution, which represents one of the most complex and time-consuming aspects of the LIBS method. Because of the rich information contained within broadband spectra, chemometric methods are particularly well suited for extracting the most element information possible from the raw LIBS data. Automated or semi-automated data processing will be required for future applications of LIBS mapping or real-time spot analyses deployed at scale. Many of these machine learning tools already exist, but need to be designed for this specific application and better integrated with the software pre-loaded on handheld units. Robust spectral libraries also need to be created, particularly for elements and/or geomaterials relevant to mineral exploration. These spectral libraries will play an important role for quantitative LIBS results and for generating predictive models to convert spectra to element concentrations. In the short term, spectral library development should focus on the ore minerals that host light elements, some of which represent critical commodities (e.g., Li). These spectral libraries will need to be pre-loaded onto handheld units, or, more likely, accessed wirelessly through internet-connected LIBS devices. New data management strategies and methods will also be required to accommodate the storing, accessing, and interpreting of the vast amounts of new information that will be acquired. Wherever possible, these data will need to be labeled so that new results can be integrated into dynamic spectral libraries that improve as more LIBS analyses are acquired.
Going forward, we anticipate that advances in LIBS capability are likely to track and leverage other hardware and software advances in a variety of research fields. Together, these advances will improve LIBS instrument sensitivity for trace element analysis, provide more complete geochemical and/or molecular sample characterization, and improve usability. The mineral exploration industry will benefit from these advanced technologies, which promise the rapid, low-cost, and on-site mapping of geochemical footprints and mineral textures.

Author Contributions

All authors contributed to the analytical work discussed here; R.S.H. and R.R.H. are responsible for Section 4.1, A.M.S. and R.S.H. are responsible for Section 4.2, C.L.H. and R.R.H. are responsible for Section 4.3, and C.J.M.L. and J.W. are responsible for Section 4.4. The original draft was written by R.S.H., C.J.M.L., and C.L.H., supported by A.M.S. and J.W., with all authors contributing to the editing.

Funding

The grain size assessment work of C.L.H. was funded by Transforming the Mining Value Chain (TMVC), an Australian Research Council (ARC) Industrial Transformation Research Hub (project #IH130200004) at the University of Tasmania. C.J.M.L. acknowledges support from the Targeted Geoscience Initiative. J.W. acknowledges support from Alamos Gold and a Society of Economic Geologists student research grant.

Acknowledgments

C.J.M.L. and J.W. would like to acknowledge the support of Alamos Gold over the course of this study. C.L.H. graciously thanks Ron Berry at the University of Tasmania and Mary Harris at Newcrest Mining for their supervision and contributions to this work.

Conflicts of Interest

The authors declare no conflicts of interest.

References

  1. Meinert, L.D.; Robinson, G.; Nassar, N.T. Mineral resources: Reserves, peak production and the future. Resources 2016, 5, 14. [Google Scholar] [CrossRef]
  2. Lusty, P.; Gunn, A. Challenges to global mineral resource security and options for future supply. In Ore Deposits in An Evolving Earth; Special Publications; Jenkin, G., Lusty, P., McDonald, I., Smith, M., Boyce, A., Wilkinson, J., Eds.; Geological Society: London, UK, 2019; Volume 393, pp. 265–276. [Google Scholar]
  3. Ali, S.; Giurco, D.; Arndt, N.; Nickless, E.; Brown, G.; Demetriades, A.; Durrheim, R.; Enriquez, M.; Kinnaird, J.; Littleboy, A.; et al. Mineral supply for sustainable development requires resource governance. Nature 2017, 543, 367–372. [Google Scholar] [CrossRef] [PubMed]
  4. Arndt, N.; Fontboté, L.; Hedenquist, J.; Kesler, S.; Thompson, J.; Wood, D. Future global mineral resources. Geochem. Perspect. 2017, 6, 171. [Google Scholar] [CrossRef]
  5. Skirrow, R.; Huston, D.; Mernagh, T.; Thorne, J.; Dulfer, H.; Senior, A. Critical Commodities for A High-Tech World: Australia′s Potential to Supply Global Demand; Geoscience Australia: Canberra, Australia, 2013; p. 126. [Google Scholar]
  6. Mudd, G.M.; Jowitt, S.M.; Werner, T.T. The world′s by-product and critical metal resources part I: Uncertainties, current reporting practices, implications and grounds for optimism. Ore Geol. Rev. 2017, 86, 924–938. [Google Scholar] [CrossRef]
  7. Sillitoe, R. Grassroots Exploration: Between a Major Rock and a Junior Hard Place. Soc. Econ. Geol. Newsl. 2010, 83, 11–13. [Google Scholar]
  8. Beaty, R. The Declining Discovery Trend: People, Science or Scarcity? Soc. Econ. Geol. Newsl. 2010, 81, 14–18. [Google Scholar]
  9. Duke, J. Government Geoscience to Support Mineral Exploration: Public Policy Rationale and Impact; Prospectors and Developers Association of Canada, PDAC: Toronto, ON, Canada, 2010; p. 72. [Google Scholar]
  10. Blain, C. Fifty-year trends in minerals discovery—Commodity and ore-type targets. Explor. Min. Geol. 2001, 9, 1–11. [Google Scholar] [CrossRef]
  11. Wood, D. Mineral Resource Discovery—Science, Art & Business. Soc. Econ. Geol. Newsl. 2010, 80, 12–17. [Google Scholar]
  12. Hagemann, S.G.; Lisitsin, V.A.; Huston, D.L. Mineral system analysis: Quo vadis. Ore Geol. Rev. 2016, 76, 504–522. [Google Scholar] [CrossRef]
  13. McCuaig, T.C.; Beresford, S.; Hronsky, J. Translating the mineral systems approach into an effective exploration targeting system. Ore Geol. Rev. 2010, 38, 128–138. [Google Scholar] [CrossRef]
  14. Huston, D.L.; Mernagh, T.P.; Hagemann, S.G.; Doublier, M.P.; Fiorentini, M.; Champion, D.C.; Jaques, A.L.; Czarnota, K.; Cayley, R.; Skirrow, R.; et al. Tectono-metallogenic systems—The place of mineral systems within tectonic evolution, with an emphasis on Australian examples. Ore Geol. Rev. 2016, 76, 168–210. [Google Scholar] [CrossRef]
  15. Rogers, N. Targeted Geoscience Initiative: 2018 report of activities. Geol. Surv. Can. Open File 8549 2018, 2, 448. [Google Scholar]
  16. Wyborn, L.; Heinrich, C.; Jaques, A. Australian Proterozoic mineral systems: Essential ingredients and mappable criteria. In The AusIMM Annual Conference Proceedings; AusIMM Darwin: Northern Territory, Australia, 1994; pp. 109–115. [Google Scholar]
  17. Gaillard, N.; Williams-Jones, A.E.; Clark, J.R.; Lypaczewski, P.; Salvi, S.; Perrouty, S.; Piette-Lauzière, N.; Guilmette, C.; Linnen, R.L. Mica composition as a vector to gold mineralization: Deciphering hydrothermal and metamorphic effects in the Malartic district, Quebec. Ore Geol. Rev. 2018, 95, 789–820. [Google Scholar] [CrossRef]
  18. Noble, R.; Christie, A. Update on exploration geochemistry initiatives in Australia and New Zealand. Explore 2015, 166, 13–17. [Google Scholar]
  19. Lesher, C.; Hannington, M.; Galley, A. Integrated multi-parameter exploration footprints of the Canadian Malartic disseminated Au, McArthur River-Millennium unconformity U, and Highland Valley porphyry Cu Deposits: Preliminary results from the NSERC-CMIC Mineral Exploration Footprints Research. Proc. Explor. 2017, 17, 23. [Google Scholar]
  20. De Caritat, P.; Main, P.T.; Grunsky, E.C.; Mann, A.W. Recognition of geochemical footprints of mineral systems in the regolith at regional to continental scales. Aust. J. Earth Sci. 2017, 64, 1033–1043. [Google Scholar] [CrossRef]
  21. Vallée, M.A.; Morris, W.A.; Perrouty, S.; Lee, R.G.; Wasyliuk, K.; King, J.J.; Ansdell, K.; Mir, R.; Shamsipour, P.; Farquharson, C.G.; et al. Geophysical inversion contributions to mineral exploration: Lessons from the Footprints project. Can. J. Earth Sci. 2019, 543, 525–543. [Google Scholar] [CrossRef]
  22. Halley, S.; Dilles, J.; Tosdal, R. Footprints: Hydrothermal alteration and geochemical dispersion around porphyry copper deposits. Soc. Econ. Geol. Newsl. 2015, 100, 12–17. [Google Scholar]
  23. Winterburn, P.A.; Noble, R.R.P.; Lawie, D. Advances in exploration geochemistry, 2007 to 2017 and beyond. Geochem. Explor. Environ. Anal. 2019, 30, 10. [Google Scholar] [CrossRef]
  24. Kyser, K.; Barr, J.; Ihlenfeld, C. Applied geochemistry in mineral exploration and mining. Elements 2015, 11, 241–246. [Google Scholar] [CrossRef]
  25. Noll, R. Laser-Induced Breakdown Spectroscopy: Fundamentals and Applications; Springer: Berlin, Germany, 2012. [Google Scholar]
  26. Cremers, D.; Radziemski, L. Handbook of Laser-Induced Breakdown Spectroscopy; Wiley: Hoboken, NJ, USA, 2013. [Google Scholar]
  27. Lee, Y.; Song, K.; Sneddon, J. Laser-induced Breakdown Spectrometry; Nova Publishers: Hauppauge, NY, USA, 2000. [Google Scholar]
  28. Miziolek, A.; Palleschi, V.; Schechter, I. (Eds.) Laser Induced Breakdown Spectroscopy; Cambridge University Press: Cambridge, UK, 2006. [Google Scholar]
  29. Singh, J.; Thakur, S. (Eds.) Laser-Induced Breakdown Spectroscopy; Elsevier: Amsterdam, The Netherlands, 2007. [Google Scholar]
  30. Musazzi, S.; Perini, U. (Eds.) Laser-Induced Breakdown Spectroscopy, Theory and Applications; Springer: Berlin, Germany, 2014. [Google Scholar]
  31. Rusak, D.; Castle, B.; Smith, B.; Winefordner, J. Fundamentals and applications of laser-induced breakdown spectroscopy. Crit. Rev. Anal. Chem. 1997, 27, 257–290. [Google Scholar] [CrossRef]
  32. Harmon, R.; Russo, R.; Hark, R. Applications of laser-induced breakdown spectroscopy for geochemical and environmental analysis: A comprehensive review. Spectrochim. Acta Part B 2013, 87, 11–26. [Google Scholar] [CrossRef]
  33. Fabre, C.; Boiron, M.; Dubessy, I.; Cathelineau, M.; Banks, D. Palaeofluid chemistry of a single fluid event: A bulk and in-situ multi-technique analysis (LIBS, Raman Spectroscopy) of an Alpine fluid (Mont-Blanc). Chem. Geol. 2002, 182, 249. [Google Scholar] [CrossRef]
  34. Stipe, C.; Miller, A.; Brown, J.; Guevara, E.; Cauda, E. Evaluation of laser-induced breakdown spectroscopy (LIBS) for measurement of silica on filter samples of coal dust. Appl. Spectrosc. 2012, 66, 1286–1293. [Google Scholar] [CrossRef]
  35. Tognoni, E.; Cristoforetti, G.; Legnaiolia, S.; Palleschi, V. Calibration-free laser-induced breakdown spectroscopy: State of the art. Spectrochim. Acta Part B 2010, 65, 1–14. [Google Scholar] [CrossRef]
  36. Praher, B.; Palleschi, V.; Viskup, P.; Heitz, J.; Pedarnig, J. Calibration free laser induced breakdown spectroscopy of oxide materials. Spectrochim. Acta Part B 2010, 65, 671–679. [Google Scholar] [CrossRef]
  37. Winefordner, J.; Gornushkin, I.; Correll, T.; Gibb, E.; Smith, B.; Omenetto, N. Comparing several atomic spectrometric methods to the super stars: Special emphasis on laser induced breakdown spectrometry, LIBS, a future super star. J. Anal. At. Spectrom. 2004, 19, 1061–1083. [Google Scholar] [CrossRef]
  38. Hahn, D.; Flower, W.; Hencken, K. Discrete particle detection and metal emissions monitoring using laser-induced breakdown spectroscopy. Appl. Spectrosc. 1997, 51, 1836–1844. [Google Scholar] [CrossRef]
  39. Derome, D.; Cathelineau, M.; Cuney, M.; Fabre, C.; Lhomme, T.; Banks, D. Mixing of sodic and calcic brines and uranium deposition at McArthur River, Saskatchewan, Canada: A Raman and laser-induced breakdown spectroscopic study of fluid inclusions. Econ. Geol. 2005, 100, 1529–1545. [Google Scholar] [CrossRef]
  40. Lebedev, V.; Makarchuk, P.; Stepanov, D. Real-time qualitative study of forsterite crystal–Melt lithium distribution by laser-induced breakdown spectroscopy. Spectrochim. Acta Part B 2017, 137, 23–27. [Google Scholar] [CrossRef]
  41. Fabre, C.; Devismes, D.; Moncayo, S.; Pelascini, F.; Trichard, F.; Leocmte, A.; Bousquet, B.; Cauzid, J.; Motto-Ros, V. Elemental imaging by laser-induced breakdown spectroscopy for the geological characterization of minerals. J. Anal. At. Spectrom. 2018, 33, 1345–1353. [Google Scholar] [CrossRef]
  42. Kim, T.; Lin, C.; Yoon, Y. Compositional mapping by laser-induced breakdown spectroscopy. J. Phys. Chem. B 1998, 102, 4284–4287. [Google Scholar] [CrossRef]
  43. Cabalín, L.; Mateo, M.; Laserna, J. Chemical maps of patterned samples by microline-imaging laser-induced plasma spectrometry. Surf. Interface Anal. 2003, 35, 263–267. [Google Scholar] [CrossRef]
  44. Novotný, K.; Kaiser, J.; Galiová, M.; Konečna, V.; Novotný, J.; Malina, R.; Liška, M.; Kanický, V. Mapping of different structures on large area of granite sample using laser-ablation based analytical techniques, an exploratory study. Spectrochim. Acta Part B 2008, 63, 1139–1144. [Google Scholar] [CrossRef]
  45. Sweetapple, M.; Tassios, S. Laser-induced breakdown spectroscopy (LIBS) as a tool for in situ mapping and textural interpretation of lithium in pegmatite minerals. Am. Mineral. 2015, 100, 2141–2151. [Google Scholar] [CrossRef]
  46. Kuhn, K.; Meima, J.; Rammlmair, D.; Ohlendorf, C. Chemical mapping of mine waste drill cores with laser-induced breakdown spectroscopy (LIBS) and energy dispersive X-ray fluorescence (EDXRF) for mineral resource exploration. J. Geochem. Explor. 2016, 161, 72–84. [Google Scholar] [CrossRef]
  47. Rifai, K.; Laflamme, M.; Constantin, M.; Vidal, F.; Sabsabi, M.; Blouin, A.; Bouchard, P.; Fytas, K.; Castello, M.; Kamwa, N. Analysis of gold in rock samples using laser-induced breakdown spectroscopy: Matrix and heterogeneity effects. Spectrochim. Acta Part B 2017, 134, 33–41. [Google Scholar] [CrossRef]
  48. Maravlekai, P.; Zafiropulos, V.; Kilikoglou, V.; Kalaitzaki, M.; Fotakis, C. Laser-induced breakdown spectroscopy as a diagnostic technique for the laser cleaning of marble. Spectrochim. Acta Part B 1997, 52, 41–53. [Google Scholar] [CrossRef]
  49. Ortiz, P.; Vázquez, M.; Ortiz, R.; Martin, J.; Ctvrnickova, T.; Mateo, M.; Nicolas, G. Investigation of environmental pollution effects on stone monuments in the case of Santa Maria La Blanca, Seville (Spain). Appl. Phys. A 2010, 100, 965–973. [Google Scholar] [CrossRef]
  50. Kaski, S.; Häkkänen, H.; Korppi-Tommola, J. Sulfide mineral identification using laser-induced plasma spectroscopy. Miner. Eng. 2003, 16, 1239–1243. [Google Scholar] [CrossRef]
  51. Haavisto, O.; Kauppinen, T.; Häkkänen, H. Laser-induced breakdown spectroscopy for rapid elemental analysis of drillcore. IFAC Proc. Vol. 2013, 46, 87–91. [Google Scholar] [CrossRef]
  52. Popov, A.; Labutin, T.; Zaytsev, S.; Seliverstova, I.; Zorov, N.; Kal′ko, I.; Sidorina, Y.; Bugaev, I.; Nikolaev, Y. Determination of Ag, Cu, Mo and Pb in soils and ores by laser-induced breakdown spectrometry. J. Anal. At. Spectrom. 2014, 29, 1925–1933. [Google Scholar] [CrossRef]
  53. Díaz, D.; Hahn, D.; Molina, A. Quantification of gold and silver in minerals by laser-induced breakdown spectroscopy. Spectrochim. Acta Part B 2017, 136, 106–115. [Google Scholar] [CrossRef]
  54. Rifai, K.; Doucet, F.; Özcan, L.; Vidal, F. LIBS core imaging at kHz speed: Paving the way for real-time geochemical applications. Spectrochim. Acta Part B 2018, 150, 43–48. [Google Scholar] [CrossRef]
  55. Zorba, V.; Mao, X.; Russo, R. Ultrafast laser induced breakdown spectroscopy for high spatial resolution chemical analysis. Spectrochim. Acta Part B 2011, 66, 189–192. [Google Scholar] [CrossRef]
  56. Čtvrtníčková, T.; Fortes, F.; Cabalin, L.; Laserna, J. Optical restriction of plasma emission light for nanometric sampling depth and depth profiling of multilayered metal samples. Appl. Spectrosc. 2007, 61, 719–724. [Google Scholar] [CrossRef] [PubMed]
  57. Čtvrtníčková, T.; Fortes, F.; Cabalin, L.; Kanický, V.; Laserna, J. Depth profiles of ceramic tiles by using orthogonal double-pulse laser induced breakdown spectrometry. Surf. Interface Anal. 2009, 41, 714–719. [Google Scholar] [CrossRef]
  58. Yamamoto, K.; Cremers, D.; Ferris, M.; Foster, L. Detection of metals in the environment using a portable laser-induced breakdown spectroscopy instrument. Appl. Spectrosc. 1996, 50, 222–233. [Google Scholar] [CrossRef]
  59. Wainner, R.; Harmon, R.; Miziolek, A.; McNesby, K.; French, P. Analysis of environmental lead contamination: Comparison of LIBS field and laboratory instruments. Spectrochim. Acta Part B 2001, 56, 777–793. [Google Scholar] [CrossRef]
  60. Palanco, S.; Alises, A.; Cunat, J.; Baena, J.; Laserna, J. Development of a portable laser-induced plasma spectrometer with fully-automated operation and quantitative analysis capabilities. J. Anal. At. Spectrom. 2003, 18, 933–938. [Google Scholar] [CrossRef]
  61. Goujon, J.; Giakoumaki, A.; Piñon, V.; Musset, O.; Georgiou, E.; Boquillon, J. A compact and portable laser-induced breakdown spectroscopy instrument for single and double pulse applications. Spectrochim. Acta Part B 2008, 63, 1091–1096. [Google Scholar] [CrossRef]
  62. Cuñat, J.; Fortes, F.; Cabalín, L.; Carrasco, F.; Simón, M.; Laserna, J. Man-portable laser-induced breakdown spectroscopy system for in situ characterization of karstic formations. Appl. Spectrosc. 2008, 62, 1250–1255. [Google Scholar] [CrossRef]
  63. Rakovský, J.; Musset, O.; Buoncristiani, J.; Bichet, V.; Monna, F.; Neige, P.; Veis, P. Testing a portable laser-induced breakdown spectroscopy system on geological samples. Spectrochim. Acta Part B 2012, 74, 57–65. [Google Scholar] [CrossRef]
  64. Bertolini, A.; Carelli, G.; Francesconi, F.; Francesconi, M.; Marchesini, L.; Marsili, P.; Sorrentino, F.; Cristoforetti, G.; Legnaioli, S.; Palleschi, V.; et al. Modì: A new mobile instrument for in situ double-pulse LIBS analysis. Anal. Bioanal. Chem. 2006, 385, 240–247. [Google Scholar] [CrossRef]
  65. Connors, B.; Somers, A.; Day, D. Application of handheld laser-induced breakdown spectroscopy (LIBS) to geochemical analysis. Appl. Spectrosc. 2016, 70, 810–815. [Google Scholar] [CrossRef] [PubMed]
  66. Radziemski, L. From LASER to LIBS, the path of technology development. Spectrochim. Acta Part B 2002, 57, 1109–1113. [Google Scholar] [CrossRef]
  67. Bogue, R. Boom time for LIBS technology. Sens. Rev. 2004, 24, 353–357. [Google Scholar] [CrossRef]
  68. McMillan, N.; McManus, C.; Harmon, R.; DeLucia, F.; Miziolek, A. Laser-induced breakdown spectroscopy analysis of complex silicate minerals—Beryl. Anal. Bioanal. Chem. 2006, 385, 263–271. [Google Scholar] [CrossRef] [PubMed]
  69. Harmon, R.; Remus, J.; McMillan, N.; McManus, C.; Collins, L.; JL, G.; DeLucia, F.; Miziolek, A. LIBS analysis of geomaterials: Geochemical fingerprinting for the rapid analysis and discrimination of minerals. Appl. Geochem. 2009, 24, 1125–1141. [Google Scholar] [CrossRef]
  70. Grant, K.; Paul, G.; O′Neill, J. Time-resolved laser-induced breakdown spectroscopy of iron ore. Appl. Spectrosc. 1990, 44, 1711–1714. [Google Scholar] [CrossRef]
  71. Grant, K.; Paul, G.; O′Neill, J. Quantitative elemental analysis of iron ore by laser induced breakdown spectroscopy. Appl. Spectrosc. 1991, 45, 701–705. [Google Scholar] [CrossRef]
  72. Sun, Q.; Tran, M.; Smith, B.; Winefordner, J. Determination of Mn and Si in iron ore by laser induced plasma spectroscopy. Anal. Chim. Acta 2000, 413, 187–195. [Google Scholar] [CrossRef]
  73. Michaud, D.; Leclerc, R.; Proulx, É. Influence of particle size and mineral phase in the analysis of iron ore slurries by Laser-Induced Breakdown Spectroscopy. Spectrochim. Acta Part B 2007, 62, 1575–1581. [Google Scholar] [CrossRef]
  74. Death, D.; Cunningham, A.; Pollard, L. Multi-element analysis of iron ore pellets by laser induced breakdown spectroscopy and principal components regression. Spectrochim. Acta Part B 2008, 63, 763–769. [Google Scholar] [CrossRef]
  75. Gaft, M.; Sapir-Sofer, I.; Modiano, H.; Stana, R. Laser induced breakdown spectroscopy for bulk minerals online analyses. Spectrochim. Acta Part B 2007, 62, 1496–1503. [Google Scholar] [CrossRef]
  76. Rosenwasser, S.; Asimellis, G.; Bromley, B.; Hazlett, R.; Martin, J.; Pearce, T.; Zigler, A. Development of a method for automated quantitative analysis of ores using LIBS. Spectrochim. Acta Part B 2001, 56, 707–714. [Google Scholar] [CrossRef]
  77. Harhira, A.; Bouchard, P.; Rifai, K.; El Haddad, J.; Sabsabi, M.; Blouin, A.; Laflamme, M. Advanced Laser-induced breakdown spectroscopy (LIBS) sensor for gold mining. In Proceedings of the Conference of Metallurgists (COM), Vancouver, BC, Canada, 27–30 August 2017; p. 11. [Google Scholar]
  78. Díaz, D.; Molina, A.; Hahn, D. Effect of laser irradiance and wavelength on the analysis of gold-and silver-bearing minerals with laser-induced breakdown spectroscopy. Spectrochim. Acta Part B 2018, 145, 86–95. [Google Scholar] [CrossRef]
  79. Harmon, R.S.; Hark, R.R.; Throckmorton, C.S.; Rankey, E.C.; Wise, M.A.; Somers, A.M.; Collins, L.M. Geochemical fingerprinting by handheld laser-induced breakdown spectroscopy. Geostand. Geoanal. Res. 2017, 41, 563–584. [Google Scholar] [CrossRef] [Green Version]
  80. Somers, A. Application of hand-held laser induced breakdown spectroscopy to drilling samples: New technology providing new in-field analytical capabilities. In Proceedings of the Drilling for Geology II, Brisbane, Australia, 26–28 July 2017; pp. 89–96. [Google Scholar]
  81. Hoefs, J. Geochemical fingerprints: A critical appraisal. Eur. J. Mineral. 2010, 22, 3–15. [Google Scholar] [CrossRef] [Green Version]
  82. Gottfried, J.; Harmon, R.; De Lucia, F.; Miziolek, A. Multivariate analysis of laser-induced breakdown spectroscopy chemical signatures for geomaterial classification. Spectrochim. Acta Part B 2009, 64, 1009–1019. [Google Scholar] [CrossRef]
  83. Alvey, D.; Morton, K.; Harmon, R.; Gottfried, J.; Remus, J.; Collins, L.; Wise, M. Laser-induced breakdown spectroscopy-based geochemical fingerprinting for the rapid analysis and discrimination of minerals: The example of garnet. Appl. Opt. 2010, 49, C168–C180. [Google Scholar] [CrossRef] [Green Version]
  84. Hark, R.; Harmon, R. Geochemical fingerprinting using LIBS. In Laser-Induced Breakdown Spectroscopy–Theory & Applications; Musazzi, S., Perini, U., Eds.; Springer: Berlin, Germany, 2014; pp. 309–348. [Google Scholar]
  85. Harmon, R.; Throckmorton, C.; Hark, R.; Gottfried, J.; Wörner, G.; Harpp, K.; Collins, L. Discriminating volcanic centers with handheld laser-induced breakdown spectroscopy (LIBS). J. Archaeol. Sci. 2018, 98, 112–127. [Google Scholar] [CrossRef]
  86. Death, D.L.; Cunningham, A.P.; Pollard, L. Multi-element and mineralogical analysis of mineral ores using laser induced breakdown spectroscopy and chemometric analysis. Spectrochim. Acta Part B 2009, 64, 1048–1058. [Google Scholar] [CrossRef]
  87. Young, S.; Dias, G. LCM of metals supply to electronics: Tracking and tracing “conflict minerals”. In Proceedings of the LCM 2011—Towards Life Cycle Sustainability Management, Berlin, Germany, 28–31 August 2011; p. 12. [Google Scholar]
  88. Harmon, R.; Shughrue, K.; Remus, J.; Wise, M.; East, L.; Hark, R. Can the provenance of the conflict minerals columbite and tantalite be ascertained by laser-induced breakdown spectroscopy? Anal. Bioanal. Chem. 2011, 400, 3377–3382. [Google Scholar] [CrossRef]
  89. Černý, P.; Ercit, T. Mineralogy of niobium and tantalum: Crystal chemical relationships, paragenetic aspects and their economic implications. In Lanthanides, Tantalum and Niobium; Springer: Berlin, Germany, 1989; pp. 27–79. [Google Scholar]
  90. Robert, F.; Brommecker, R.; Bourne, B.; Dobak, P.; McEwan, C.; Rowe, R.; Zhou, X. Models and exploration methods for major gold deposit types. In Proceedings of the Exploration 07: Fifth Decennial International Conference on Mineral Exploration, Toronto, ON, Canada, 9–12 September 2007; Volume 48, pp. 691–711. [Google Scholar]
  91. Mortensen, J.; Chapman, R.; LeBarge, W.; Jackson, L. Application of placer and lode gold geochemistry to gold exploration in western Yukon. In Yukon Exploration and Geology 2004; Emond, D., Lewis, L., Bradshaw, G., Eds.; Yukon Geological Surve: Whitehorse, YT, Canada, 2004; pp. 205–212. [Google Scholar]
  92. Chapman, R.; Mortensen, J.; LeBarge, W. Styles of lode gold mineralization contributing to the placers of the Indian River and Black Hills Creek, Yukon Territory, Canada as deduced from microchemical characterization of placer gold grains. Miner. Depos. 2011, 46, 881–903. [Google Scholar] [CrossRef]
  93. McCandless, T.; Baker, M.; Ruiz, J. Trace element analysis of natural gold by laser ablation ICP-MS: A combined external/internal standardization approach. J. Geostand. Geoanal. 1997, 21, 271–278. [Google Scholar] [CrossRef]
  94. McInnes, M.; Greenough, J.; Fryer, B.; Wells, R. Trace elements in native gold by solution ICP-MS and their use in mineral exploration. A British Columbia example. Appl. Geochemi. 2008, 23, 1076–1085. [Google Scholar] [CrossRef]
  95. Liu, H.; Mao, X.; Mao, S.; Greif, R.; Russo, R. Particle size dependence chemistry from laser ablation of brass. Anal. Chem. 2005, 77, 6687–6691. [Google Scholar] [CrossRef] [PubMed]
  96. Sillitoe, R.; Hedenquist, J. Linkages between volcanotectonic settings, ore-fluid compositions, and epithermal precious metal deposits. Soc. Econ. Geol. Spec. Publ. 2003, 10, 315–343. [Google Scholar]
  97. Afgan, M.; Hou, Z.; Wang, Z. Quantitative analysis of common elements in steel using a handheld μ-LIBS instrument. J. Anal. At. Spectrom. 2017, 32, 1905–1915. [Google Scholar] [CrossRef]
  98. Griffin, A. Lithium Australia Success with Innovative Lithium Analyser at Agua Fria, Mexico. Available online: http://www.asx.com.au/asxpdf/20170502/pdf/43hz02zvjm8f0y.pdf (accessed on 2 May 2017).
  99. Sutherland, D. Estimation of mineral grain size using automated mineralogy. Miner. Eng. 2007, 20, 452–460. [Google Scholar] [CrossRef]
  100. Berry, R.; Hunt, J. Proxy Methods for Domaining ore Deposits for Au Grain Size: Geometallurgical Mapping and Mine Modelling; Technical Report, AMIRA Project P843; University of Tasmania: Hobart, Australia, 2013. [Google Scholar]
  101. Wills, B. Wills’ Mineral Processing Technology: An Introduction to the Practical Aspects of Ore Treatment and Mineral Recovery; Elsevier: Amsterdam, The Netherlands, 2011. [Google Scholar]
  102. Fandrich, R.; Gu, Y.; Burrows, D.; Moeller, K. Modern SEM-based mineral liberation analysis. Int. J. Miner. Process. 2007, 84, 310–320. [Google Scholar] [CrossRef]
  103. Goodall, W.; Butcher, A. The use of QEMSCAN in practical gold deportment studies. Miner. Process. Extr. Metall. 2012, 121, 199–204. [Google Scholar] [CrossRef]
  104. Gu, T. Automated scanning electron microscope based mineral liberation analysis an introduction to JKMRC/FEI mineral liberation analyser. J. Miner. Mater. Charact. Eng. 2003, 2, 33. [Google Scholar] [CrossRef]
  105. Senesi, G.S. Laser-Induced Breakdown Spectroscopy (LIBS) applied to terrestrial and extraterrestrial analogue geomaterials with emphasis to minerals and rocks. Earth Sci. Rev. 2014, 139, 231–267. [Google Scholar] [CrossRef]
  106. Bolger, J. Semi-quantitative laser-induced breakdown spectroscopy for analysis of mineral drill core. Appl. Spectrosc. 2000, 54, 181–189. [Google Scholar] [CrossRef]
  107. Potts, P. Laboratory methods of analysis. In Analysis of Geological Materials; Riddle, C., Ed.; Marcel Dekker: New York, NY, USA, 1993; pp. 123–220. [Google Scholar]
  108. Tamura, S.; Horisawa, H.; Yamaguchi, S.; Yasunaga, N. Laser ablation of sapphire with a pulsed ultra-violet laser beam. In Initiatives of Precision Engineering at the Beginning of a Millennium; Springer: Berlin, Germany, 2002; pp. 224–228. [Google Scholar]
  109. Lawley, C.; Creaser, R.A.; Jackson, S.E.; Yang, Z.; Davis, B.; Pehrsson, S.; Dubé, B.; Mercier-Langevin, P.; Vaillancourt, D. Unravelling the western Churchill Province Paleoproterozoic gold metallotect: Constraints from Re-Os arsenopyrite and U-Pb xenotime geochronology and LA-ICPMS arsenopyrite trace element chemistry at the BIF-hosted Meliadine Gold District, Nunavut, Canada. Econ. Geol. 2015, 110, 1425–1454. [Google Scholar] [CrossRef]
  110. Lawley, C.; Kjarsgaard, B.; Jackson, S.; Yang, Z.; Petts, D.; Roots, E. Trace metal and isotopic depth profiles through the Abitibi cratonic mantle. Lithos 2018, 314–315, 520–533. [Google Scholar] [CrossRef]
  111. R Development Core Team. R: A Language and Environment for Statistical Computing, Vienna. 2018. Available online: https://www.r-project.org (accessed on 12 February 2018).
  112. Wehrens, R. Chemometrics with R; Springer: Berlin/Heidelberg, Germany, 2011. [Google Scholar]
  113. Samson, I.; Gagnon, J. Episodic fluid infiltration and genesis of the Proterozoic MacLellan Au-Ag deposit, Lynn Lake greenstone belt. Explor. Min. Geol. 1995, 4, 33–50. [Google Scholar]
  114. Samson, I.M.; Blackburn, W.H.; Gagnon, J.E. Paragenesis and composition of amphibole and biotite in the MacLellan gold deposit, Lynn Lake greenstone belt, Manitoba, Canada. Can. Mineral. 1999, 37, 1405–1421. [Google Scholar]
  115. Hastie, E.C.G.; Gagnon, J.E.; Samson, I.M.; Lake, L. The Paleoproterozoic MacLellan deposit and related Au-Ag occurrences, Lynn Lake greenstone belt, Manitoba: An emerging, structurally-controlled gold camp. Ore Geol. Rev. 2018, 94, 24–45. [Google Scholar] [CrossRef]
  116. Cook, N.J.; Ciobanu, C.L.; Pring, A.; Skinner, W.; Shimizu, M.; Danyushevsky, L.; Saini-eidukat, B.; Melcher, F. Trace and minor elements in sphalerite: A LA-ICPMS study. Geochim. Cosmochim. Acta 2009, 73, 4761–4791. [Google Scholar] [CrossRef]
  117. Laser-Induced Breakdown Spectroscopy—An Emerging Analytical Tool for Mineral Exploration. Available online: https://appliedspectra.com/products.html# (accessed on 10 November 2019).
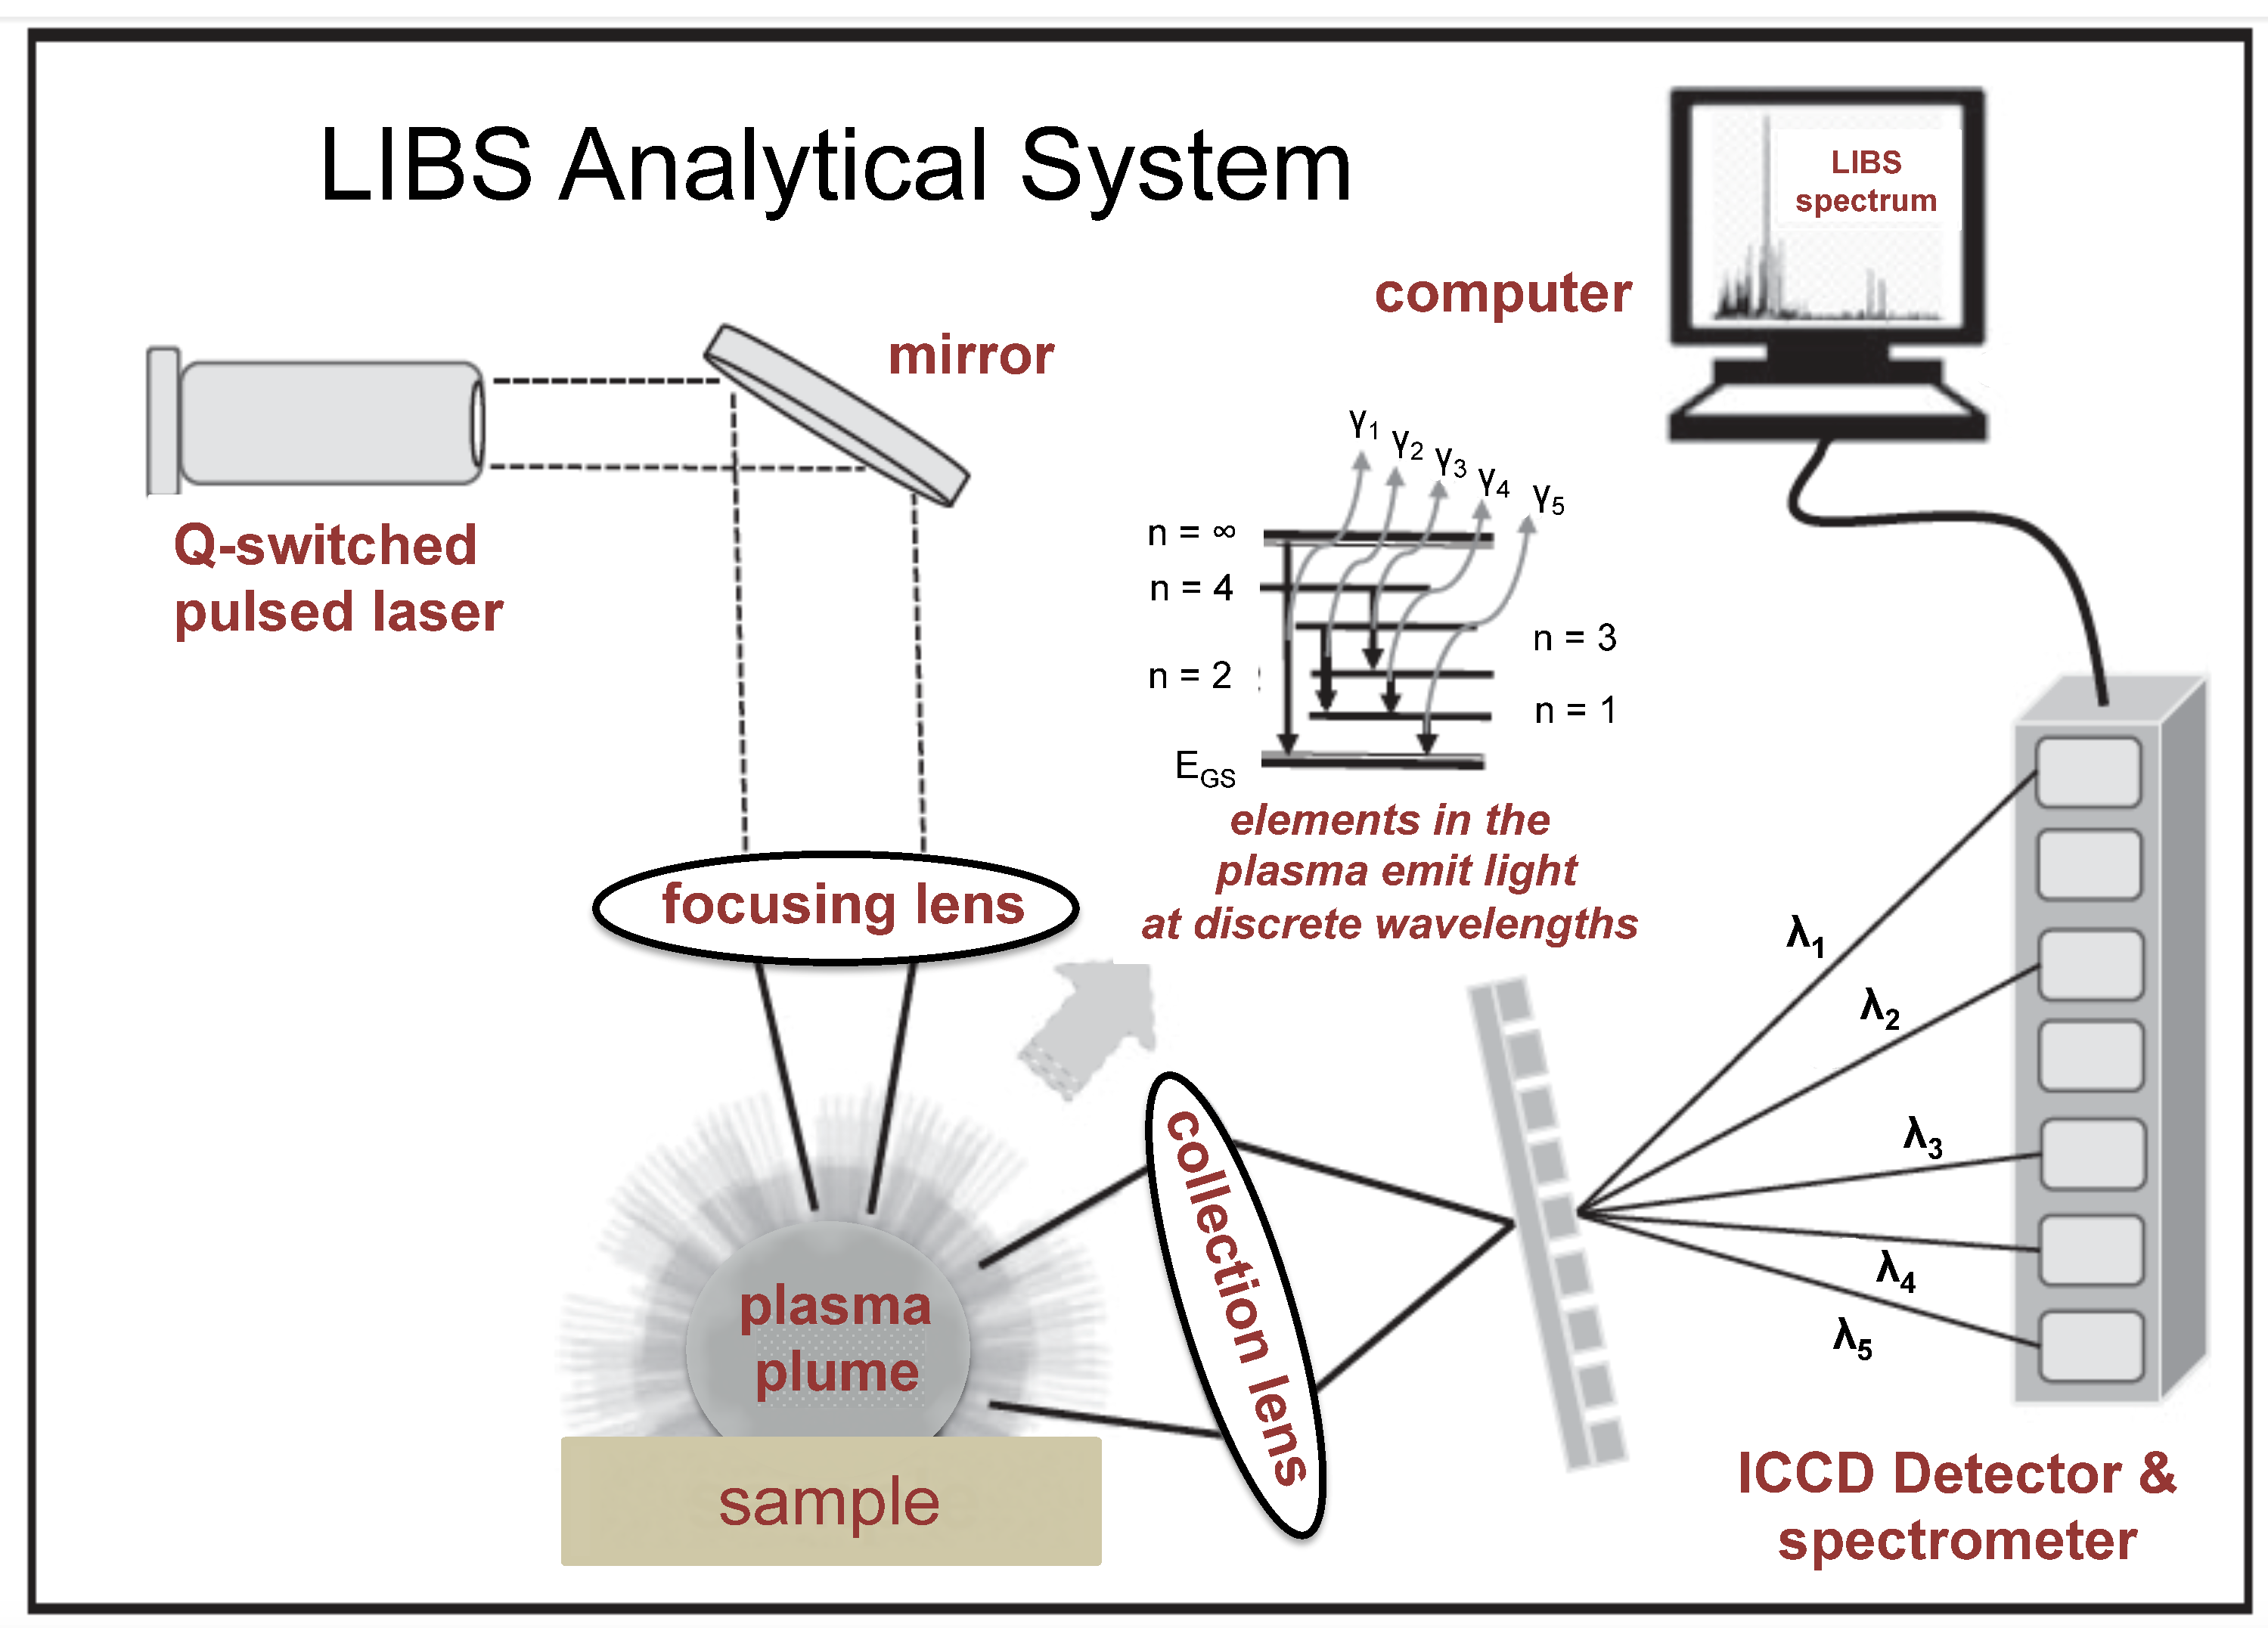
Figure 1. Schematic diagram of a typical laser-induced breakdown spectroscopy (LIBS) system consisting of a solid-state, short-pulsed, Q-switched laser used to create a micro-plasma on the sample, lenses to focus the laser light onto the sample and then collect and transmit the light produced during the micro-plasma event, a detector/spectrometer combination to receive and resolve the light spectrum, and a computer for system control and data processing.
Minerals 09 00718 g001
Figure 2. Example broadband LIBS spectra for (a) sphalerite showing emission lines for Zn, Fe, and Cd, (b) galena showing emission lines for Pb and Ag, and (c) chalcopyrite showing emission lines for Fe and Cu. Data were acquired in Ar with a SciAps Z-300 handheld LIBS analyzer and processed (i.e., baseline correction and normalization) using the internal software utility described in Section 3. The large number of Fe emission lines often results in complex LIBS spectra for Fe-rich minerals (e.g., chalcopyrite), particularly in the 350–450-nm spectral range.
Minerals 09 00718 g002
Figure 3. Single-pulse LIBS spectra acquired with a SciAps Z-500 handheld analyzer for a suite of divalent metal carbonate minerals (data from Reference [79]). From top to bottom: magnesite—MgCO3, smithsonite—ZnCO3, rhodochrosite—MnCO3, aragonite—orthorhombic CaCO3, calcite—hexagonal CaCO3, strontianite—SrCO3, cerrusite—PbCO3, witherite—BaCO3, dolomite—CaMg(CO3)2, azurite—Cu3(CO3)2(OH)2, and malachite—Cu2CO3(OH)2.
Minerals 09 00718 g003
Figure 4. Principal component analysis (PCA) score plot (a) and partial least squares discriminant analysis (PLSDA) classification matrix (b) for the analysis of the common garnet groups using a SciApS Z-500 handheld LIBS analyzer (data from Reference [79]). AL = almandine (Fe3Al2Si3O12), AN = andradite (Ca3Fe2Si3O12), GR = grossular (Ca3Al2Si3O12), PY = pyrope (Mg3Al2Si3O12), SP = spessartine (Mn3Al2Si3O12), and UV = uvarovite (Ca3Cr2Si3O12).
Minerals 09 00718 g004
Figure 5. PLSDA classification matrices from handheld LIBS analysis of garnets by (a) geological type and (b) igneous host type, and (c) for garnets from five South African kimberlite locations (after Harmon et al. [79]): IGN = igneous, MET = metamorphic; CP = chromitite pods, GPR = granitic pegmatites and rhyolites, and K = kimberlites; KZNP = KwaZulu-Natal Province, NCP-BW = Barkley West, in Northern Cape Province, NCP-K = Kimberley in Northern Cape Province, NK = North of Kimberley in Northern Cape Province, and OFS = Orange Free State (data from Reference [79]). See text for discussion.
Minerals 09 00718 g005
Figure 6. PLSDA classification matrix for LIBS spectral analysis of 38 cassiterite samples from six countries generated using 80 components and 10-fold cross-validation (after Hark and Harmon [84]).
Minerals 09 00718 g006
Figure 7. (a) LIBS spectra from 250–490 nm of pure niobium and tantalum, together with representative spectra of columbite–tantalite samples from (1) the Starrett pegmatite in southern Maine, (2) the Pack Rat pegmatite in San Diego County, California, (3) the Moose pegmatite in the east–central Northwest Territories, Canada, and (4) the BeeBee pegmatite in San Diego County, California. (b) PCA score plot for columbite–tantalite samples from LCT (Li, Cs, and Ta; see text) pegmatite locations at Branchville, Glastonbury, Haddam, Middletown, Portland, and the Strickland Quarry in Connecticut and mines at El Molino, Ingram, Katerina, and Olla in California (modified from Harmon et al. [79]). See text for discussion.
Minerals 09 00718 g007
Figure 8. LIBS emission spectra between 305 and 345 nm for pure silver (a), placer gold samples from Leadville, Colorado, USA (b), Cripple Creek, Colorado, USA (c), and Sidney Flats, Australia (d), and pure gold (modified from Harmon et al. [79]). See text for discussion.
Minerals 09 00718 g008
Figure 9. LIBS emission spectrum for a steel sample between 200–550 nm (a) and calibration/validation data for Si in different steels (b) using a dominant factor based PLS with spectrum standardization (modified from Reference [97]).
Minerals 09 00718 g009aMinerals 09 00718 g009b
Figure 10. Example of pressed powder pellets showing a typical 12-position 3 × 4 LIBS analysis raster pattern.
Minerals 09 00718 g010
Figure 11. (a) SciAps Z-300 Geochem Pro screen display showing the LIBS spectra for S acquired from analysis of 15 Ore Research and Exploration Pty Ltd Assay Standards (OREAS) certified reference materials (CRMs) of known sulfur content over the spectral range of 920.82–921.75 nm, and (b) the resulting calibration curve. See text for discussion.
Minerals 09 00718 g011
Figure 12. SciAps Z-300 screen display showing the quantitative analytical results for Fe, S, Si, and Al obtained after analyzer calibration.
Minerals 09 00718 g012
Figure 13. Comparison of Li concentrations for the Agua Fria Li prospect drilling samples by handheld LIBS and certified laboratory assay.
Minerals 09 00718 g013
Figure 14. Comparison of Li concentrations for the Agua Fria prospect drill core by handheld LIBS and laboratory analysis for (a) drill hole AF-17-004, where the entire hole represents the calibrated clay matrix showing concordance between the laboratory and LIBS analyses, and (b) drill hole 17-002, where the upper 60 m of the hole intersects a non-calibrated basalt matrix; although the handheld LIBS still shows a similar overall pattern of downhole Li variation, a significant difference between the laboratory and LIBS analyses is evident. Analytical performance improves once the calibrated clay matrix is encountered at approximately 60 m depth.
Minerals 09 00718 g014
Figure 15. Reflected light three-dimensional (3D) step image of a LIBS crater in chalcopyrite (outlined in white). The ablation depth in copper sulfide minerals is 1–5 µm.
Minerals 09 00718 g015
Figure 16. Configuration of LIBS analysis spots on each test sample. The upper 60% of each analysis line was used, for a total of 5429 LIBS analyses per sample.
Minerals 09 00718 g016
Figure 17. LIBS spectra of the chalcopyrite and bornite standards over the wavelength interval of 335–370 nm. The Cu spectral lines at 324.75 nm and Cu 327.40 nm were selected, and a background value was taken at 329.90 nm.
Minerals 09 00718 g017
Figure 18. Example of a Pearson spectral match value for a series of unknown spectra with spectral matches just above the 0.3 cutoff threshold (green), just below that threshold (red), and well above the threshold (orange) compared to a pure chalcopyrite mineral spectrum (blue). The Pearson spectral match threshold values were selected by analyzing this relationship for numerous unknown spectra.
Minerals 09 00718 g018
Figure 19. Comparison of the DPSSL (diameter by phase-specific surface area) for combined copper sulfide measured from mineral liberation analysis (MLA) data and the grain size calculated using LIBS data. These calculations assumed that chalcopyrite and bornite equally occur as combined copper sulfides.
Minerals 09 00718 g019
Figure 20. Box-and-whisker plot for the 26 tiles analyzed showing the bootstrapping results for combined Cu-sulfides using 75, 50, 25, and 10 random LIBS lines per sample. The boxes outline the upper and lower quartiles, and the whiskers represent the minimum and maximum values. These are compared with the mineral liberation analysis (MLA) results (blue dots) on the same tiles.
Minerals 09 00718 g020
Figure 21. Comparison of the number of LIBS analysis spots used and the average range of grain size proxy values calculated for all 26 test samples. This trend shows that about 620 total 150 µm LIBS analysis are required to rank samples in terms of Cu-sulfide mineral grain size proxies to a satisfactory precision.
Minerals 09 00718 g021
Figure 22. Example of a reflected light 3D step image of an LIBS crater in feldspar. The crater is not uniform or symmetrical, making an estimation of area or ablation volume challenging.
Minerals 09 00718 g022
Figure 23. Scanning electron microscope images of an LIBS ablation crater in calcite (darker gray) and a Cu-sulfide (brighter gray). The ablation craters generally show brittle behavior (A); however, up close, both calcite and copper sulfide also display melting behavior (B).
Minerals 09 00718 g023
Figure 24. Reflected light 3D step image of LIBS craters (outlined in yellow circles) in quartz (gray) and chalcopyrite (colored). While the ablation depth in quartz is more than 50 µm, the ablation depth in Cu-sulfide minerals is 1–5 µm.
Minerals 09 00718 g024
Figure 25. (a) Gold- and base metal-rich quartz vein from the MacLellan deposit, Lynn Lake, Manitoba. Mapping area comprises quartz (Qtz), calcite (Calc), arsenopyrite (Asp), pyrrhotite (Po), and sphalerite (Sph); (b) transmitted light photomicrograph of LIBS mapping area; (cj) LIBS results for Au (c), Ag (d), Zn (e), Cd (f), Mg (g), S (h), Fe (i), and Ca (j) were processed using new R code and are displayed as relative wavelength intensities (%). Each mineral phase identified within the mapping area can identified based on its LIBS spectral signature and some prior knowledge of the main mineral-forming elements. Minor to trace elements associated with each mineral can be used to support mineral identification (g). Geochemical imaging is also effective at mapping the distribution of minute minerals of significant economic interest, including native Au inclusions (d,e). Maps were acquired in an Ar environment on the unprepared surface of the cut drill core.
Minerals 09 00718 g025
Figure 26. (a) Photo of gold- and base metal-rich quartz vein from the MacLellan deposit, Lynn Lake, Manitoba. Mapping area comprises quartz (Qtz), arsenopyrite (Asp), biotite (Bt), muscovite (Mus), and lesser galena (Gl); LIBS mapping results for (b) Fe, (c) As, (d) Pb, (e) K, (f) Na, and (g) Li processed using new R code and displayed as relative wavelength intensities (%). Geochemical imaging is also effective at mapping the distribution of rare galena and the enrichment of light elements along the margins of and within the arsenopyrite-rich vein. Maps were acquired in an Ar environment on the unprepared surface of the cut drill core.
Minerals 09 00718 g026
Figure 27. (a) Photo of coarse visible gold intergrown with quartz (Qtz) and amphibole (Amph) within an arsenopyrite (Asp)-rich quartz vein; (b) principal component analysis (PCA) biplot showing LIBS results and resultant wavelength loadings for one 16 × 16 grid map from 256 laser shots. Wavelengths are reported in nm units. Clusters of PCA scores are based on the k-means algorithm implemented in R [111]; (ce) LIBS mapping results for the Au spectral lines at 242.9, 267.5, and 312.6 nm processed using new R code displayed as relative wavelength intensities (%); (f) LIBS map color coded to k-means clustering of PCA scores (same as b). These maps highlight how chemometrics can be used to re-classify qualitative LIBS results to assist with mineral identification.
Minerals 09 00718 g027
Figure 28. (a) Core photo of quartz (Qtz)–calcite (Calc) veinlet with sericite (Ser) and hematite (Hem) halo overprinting carbonate-altered mafic volcanic rock; LIBS mapping results for (b) Ca, (c) Na, (d) K, and (e) Ba processed using new R code and displayed as relative wavelength intensities (%). Maps highlight Na- and K-rich halo overprinting Ca-altered mafic volcanic host rock. The most K-rich veinlet domains are associated with Ba, reflecting minor element substitution within hydrothermal K-feldspar. Maps were acquired in an Ar environment on the unprepared surface of the cut drill core.
Minerals 09 00718 g028
Table 1. Examples of useful spectral emission lines (wavelengths in nm) for elemental identification in common rock-forming minerals (blue columns) and ore deposits (green columns).
ElementWavelengthWavelengthWavelengthElementWavelengthWavelengthWavelength
O777.42794.76844.64Ag328.07520.91338.29
Si288.16251.61390.55Au267.59242.80312.28
Al309.30394.40396.15Co238.89389.41258.04
Mg2795.5383.33279.80Cr425.44427.48284.33
Fe259.94259.84438.35Cu521.82324.75578.21
Ca393.37396.85422.67Mn478.34482.35602.48
Na589.99589.59330.24Mo267.28379.89268.41
K766.49769.90404.72Ni239.45241.63300.25
Li670.78610.35812.62Pb405.78438.65363.96
B249.77249.68208.96Pt265.95214.42224.55
Rb780.03794.76-Sn380.10283.99317.50
Sr430.54407.78460.73Ti334.94375.93376.13
Ba452.49614.17389.18Zn472.22481.05328.23
Table 2. Integration intervals used to calculate the proportion of copper minerals present in each spot interrogated by laser-induced breakdown spectroscopy (LIBS) analysis.
Integration Intervals and ValuesChalcopyriteBorniteCombined Cu-Sulfides
Mineral integration interval 1 (nm)324.62–325.13324.62–325.13324.62–325.13
Mineral integration interval 2 (nm)327.19–327.70327.19–327.70327.19–327.70
Background integration interval (nm)329.6–330.18329.67–330.18329.67–330.18
Pure mineral integration value 126,239.9229,919.83-
Pure mineral integration value 221,116.5924,962.61-
Pure mineral background integration value (same interval used for 1 and 2)2156.213159.25-