Article

Geochemical Analysis for Determining Total Organic Carbon Content Based on ∆LogR Technique in the South Pars Field

1
Department of Petroleum Engineering, Mahabad Branch, Islamic Azad University, Mahabad 59135-433, Iran
2
Department of Natural Resources Engineering and Management, School of Science and Engineering, University of Kurdistan Hewlêr (UKH), Erbil 44001, Kurdistan Region, Iraq
3
Department of Reservoir Geology, National Iranian South Oil Company (NISOC), Ahwaz 61735-1333, Iran
4
Department of Earth Sciences, Faculty of Natural Sciences, University of Tabriz, Tabriz 51666-16471, Iran
5
Korea Polar Research Institute (KOPRI), Songdomirae-ro, Yeonsu-gu, Incheon 21990, Korea
6
Institute of Oceanography and Environment (INOS), Universiti Malaysia Terengganu (UMT), Kuala Nerus 21030, Terengganu, Malaysia
7
Department of Geosciences, Universiti Teknologi PETRONAS (UTP), Perak 32610, Malaysia
8
Southeast Asia Carbonate Research Laboratory, Universiti Teknologi PETRONAS (UTP), Perak 32610, Malaysia
*
Authors to whom correspondence should be addressed.
Minerals 2019, 9(12), 735; https://doi.org/10.3390/min9120735
Submission received: 5 November 2019 / Revised: 25 November 2019 / Accepted: 25 November 2019 / Published: 28 November 2019

Abstract

:
There is a recognized need for the determination of total organic carbon (TOC) as an essential factor in the evaluation of source rocks. In this study, the ∆LogR technique was coupled with logging curves of sonic, resistivity, spectral gamma-ray (SGR), and computed gamma-ray (CGR) to determine an accurate content of TOC in the Gadvan Formation. Multiple linear regression analysis was also applied to the ∆LogR technique. To this aim, 14 samples of the Gadvan Formation were taken from Wells B and C in the South Pars field and analyzed using Rock-Eval pyrolysis. Results from the ∆LogR technique and multiple linear regression analysis, well logs, and Rock-Eval were compared to calculate the accurate content of TOC in the Gadvan Formation. Geochemical data confirmed that the Gadvan Formation was a relatively poor source rock in the South Pars field, as average TOC and Tmax values of the samples were 0.79 and less than 430 °C, respectively. Also, the content of potassium (K < 0.1%) confirmed the origin of the source rock as a pure carbonate, whereas the low content of thorium (Th < 5 ppm) was indicative of the percentage of clays. There was a moderate content of uranium (U < 10 ppm), suggesting that the Gadvan Formation was not deposited in an excellent reducing environment to conserve the organic matter. Moreover, the results from the integration of the multiple linear regression model with SGR and CGR showed that the value of R2 was higher than the results obtained without SGR and CGR. Findings from this study could help the exploration and production team to determine the accurate content of TOC using the ∆LogR technique in association with logging curves.

1. Introduction

The issue of source rocks that produced the oil and gas has received considerable critical attention [1,2,3,4,5,6]. What known about the source rocks, total organic carbon (TOC) has been the most crucial concept in the study of the source rocks [7]. Otherwise, actual work is required to determine the TOC amount in the evaluation process of source rocks [5].
Petrophysical logs have been attracting considerable interest in providing further information regarding characterizations of source rocks in subsurface formations [8]. The gamma-ray (GR), as one of the most significant petrophysical log, is responsible for the detection of all the natural radioactive elements in the source rock. Spectral gamma-ray (SGR) is a more sophisticated tool that differentiates the source of the natural radioactivity into three contributors: uranium (U), potassium (K), and thorium (Th) elements. The SGR is a powerful tool in estimating the mineralogy, picking stratigraphic surfaces, and evaluating the depositional conditions [9,10]. Referring to depositional conditions of source rocks, U values differ from free to rich depending on oxidizing or reducing environments [11]. While shales are present in the interval of source rocks, radioactivity elements are amplified. Occasionally, the U exists in argillaceous, phosphates, and organic matters (OM).
Moreover, the K is customarily found in evaporites, clay minerals, and rarely carbonates and is hardly related to the OM content in source rocks. Besides, the Th with high stability and negligible solubility is found in clastic sediments and heavy minerals [12]. The limitation of this approach is that the SGR is often a poor clay indicator in carbonate rocks. Therefore, the extent of radioactivity is not originated from the clay content even if some quantity of the U may exist. On the other hand, there is no evidence to record Th and K elements in pure carbonates because of their insolubility. It has also been established that the U element is not detected in pure carbonates formed in an oxidizing environment [13]. In this regard, the SGR approach does not attempt to give enough information and should be combined with other log data to represent the accurate content of the U. Therefore, a combination of SGR and computed gamma-ray (CGR) provides further support for the evaluation of the conceptual premise of source rocks [14].
Also, the ∆LogR technique is employed to recognize the intervals rich in the OM content. Initially, Passey et al. [15] devised this technique as a combination of porosity logs (i.e., sonic (AC), density (ØD), and neutron (ØN)), resistivity (RT) log in recognition, and determination of the TOC content in the source rock interval. In this regard, the value of TOC and also thermal maturity are determined manually; however, conventional well logs are used. Kamali and Mirshady [1] applied the ∆LogR method in combination with a neuro-fuzzy approach for determining the TOC content of the Gurpi and Pabdeh formations in the Dezful Embayment, as a subset of the Zagros Basin in Iran. Another successful example of this is the study carried out by Khoshnoodkia et al. [16] in which an artificial intelligent system was applied to predict the TOC content of the Gadvan Formation in the South Pars field. However, in previously published studies, far too little attention has been paid to assess an accurate content of TOC in source rocks.
The ∆LogR technique for measuring TOC is found to be varied somewhat across this research area. Accordingly, in this study, the use of the standard ΔLogR method in shale formations was improved, and it was modified to assess the accurate content of TOC in the source rocks. In this manner, the conventional logs like AC and RT were also applied to determine the precise content of TOC. Through using the modified ΔLogR, the results from the geochemical analysis, i.e., Rock-Eval pyrolysis, and petrophysical data were first discussed, and then their effects on the determination of the OM content were evaluated. As a case study, the Gadvan Formation, an effective source rock in the Dezful Embayment [1] and the South Pars field [4,16,17], was selected to apply the ∆LogR technique with its modified approach for determining the accurate content of TOC in source rocks.

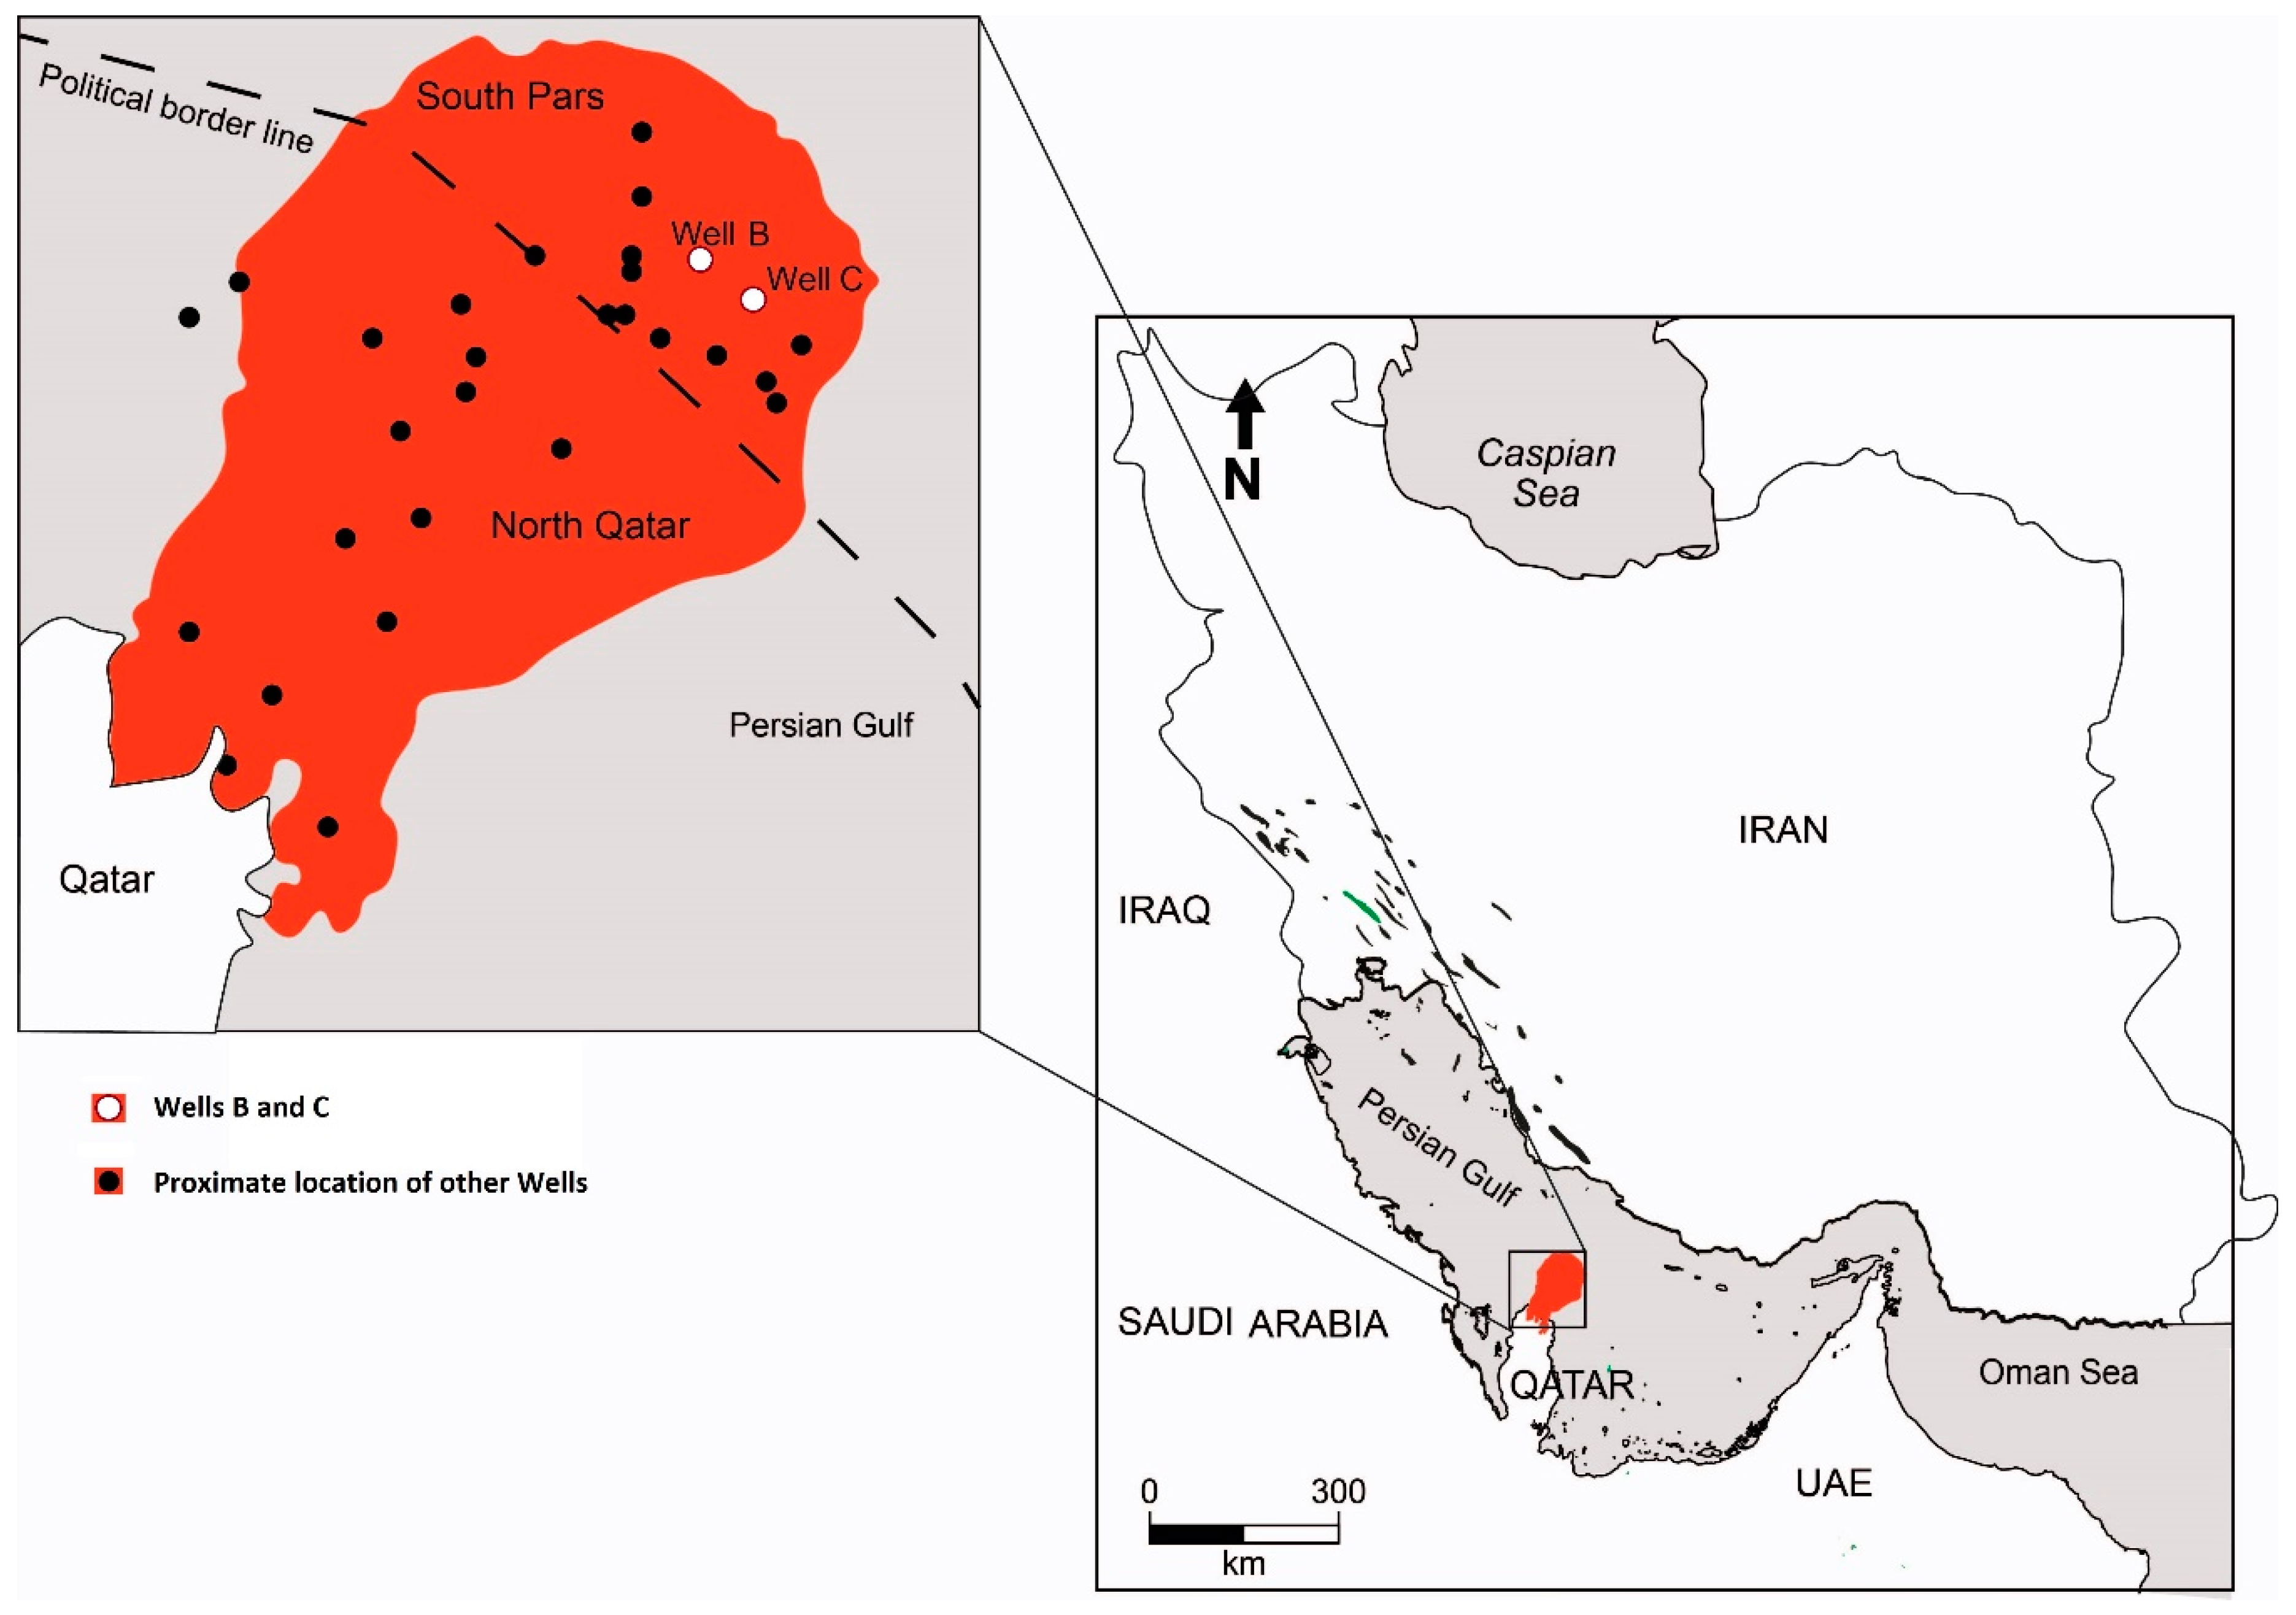
2. Geological Setting

2.1. Tectonic Setting
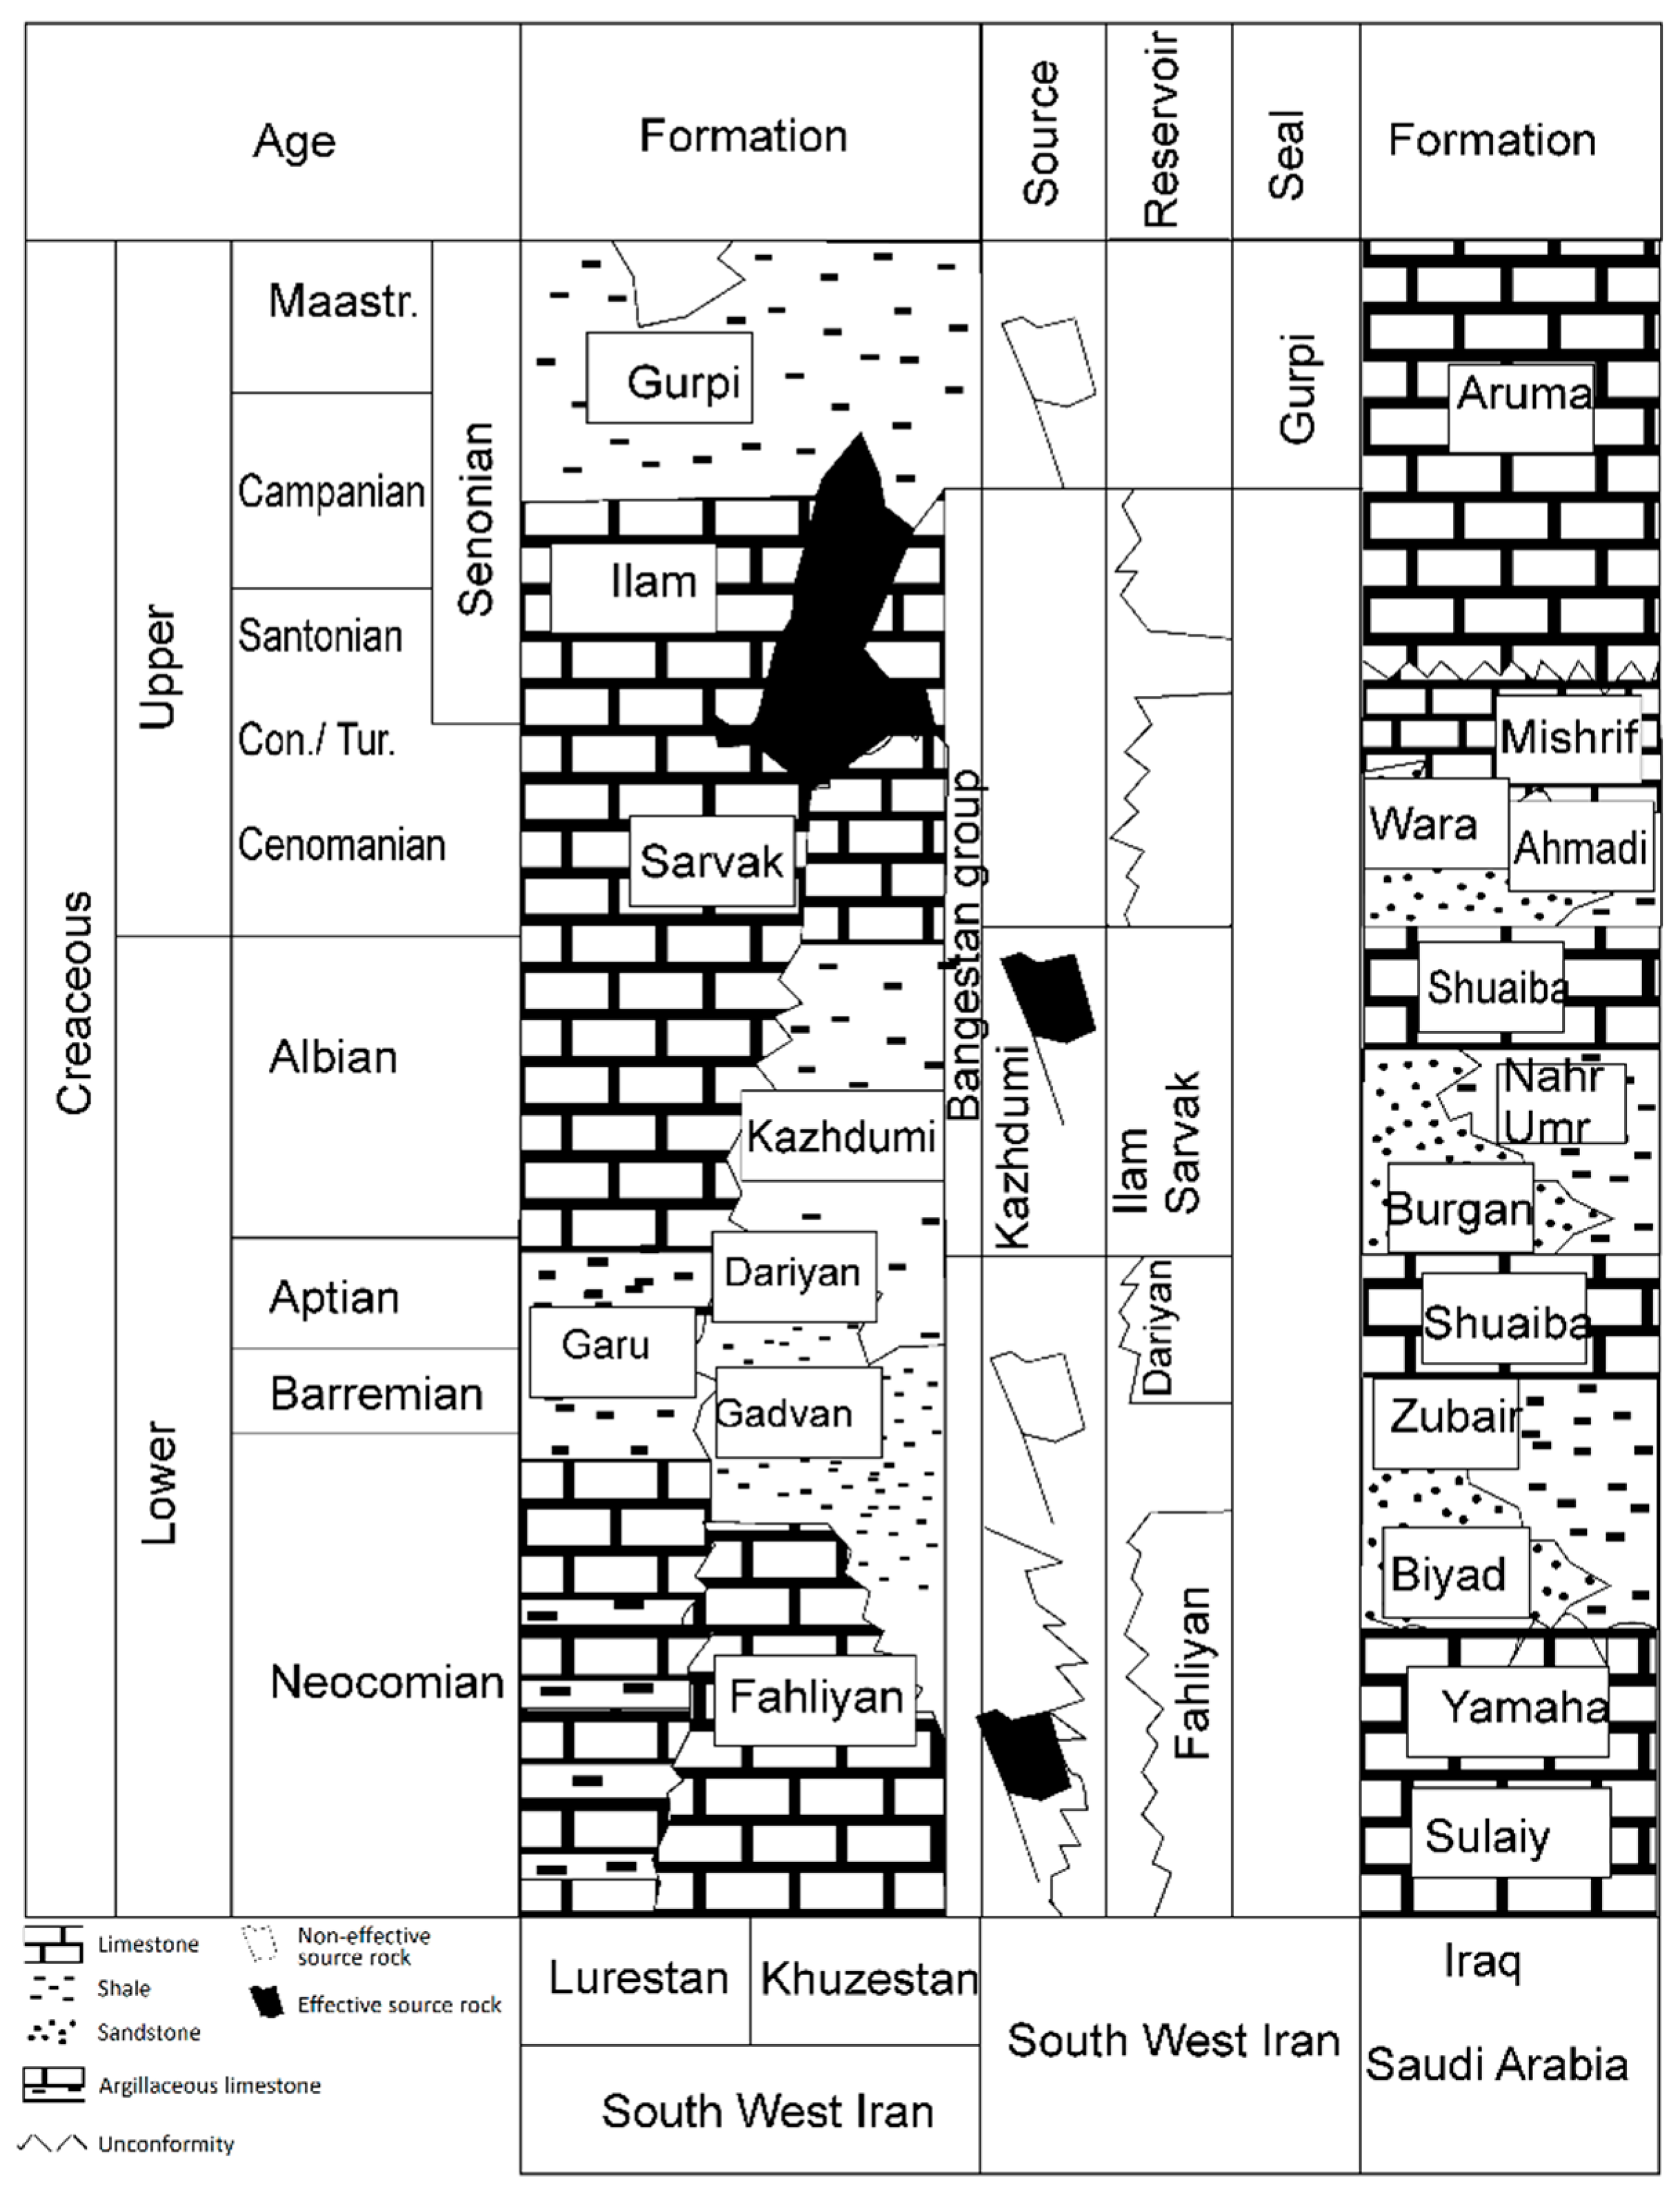
What is known about the structure of the South Pars field (Figure 1) is derived mainly from a few primary studies conducted by Aali et al. [18], Rahmani et al. [4,17], and Aali and Rahmani [19,20]. The South Pars field involves the most significant non-associated gas accumulation in the world. It is located in the interior of the Arabian Plate platform and considered as the northern extension of Qatar’s North field. In the north and northeast, the structural feature of the South Pars field has been bounded by the Zagros fold belt [4].
Two principal tectonic phases found to influence the structure feature of the South Pars field that has been explored in several studies [4,21,22]. The Amar Collision in the Arabian Shield is the first tectonic phase that was appeared about 640 Ma ago. The Najd Rift system is referred to as the second tectonic phase that occurred approximately 570 Ma ago. The NW–SE trend of these major tectonic events is generally parallel to the Zagros Mountains. Tavakoli et al. [22] stated that these tectonic phases were mainly responsible for forming the structural feature of Qatar-Fars and Ghawar highs. Besides, the upcoming rejuvenation events regulate the development of sedimentary structures and the pattern of reservoir distributions in the study area [4].

2.2. Stratigraphy

Figure 2 displays an overview of the stratigraphic column in the South Pars field. What stands out in this figure is the Gadvan Formation overlies the Fahliyan Formation and grades upward into the succeeding Dariyan Formation. In the regional stratigraphical district, the upper unit of the Dariyan Formation is equivalent to the Shuaiba Formation and is deposited in moderately deep-water habitat and consisted of wackestone to packstone, partially bound-stone, and skeletal grainstone. The central unit of the Dariyan Formation, Hawar Member, is based on the Lower Darian and incorporates around 23 m of blue-green marl and shale, which is prosperous of “Choffatella decipiens”. While this member is entirely present in Qatar’s onshore, it changes to bioclastic, peloidal packstone, wackestone and argillaceous, and glauconitic lime-mudstone in offshore. The lower unit of the Dariyan Formation is consisted of white limestone and deposited in a shallow water habitat. In the South Pars field, the Gadvan Formation not only rises towards the subsequent Dariyan Formation, but it also lies on top of the Fahliyan Formation. It is subdivided into three units: lower, Khalij, and upper members. Within the study area, the Gadvan Formation is composed of clayey limestone at both lower and upper members. However, the Khalij member consists of oil-show limestones without any clay minerals [4].
Moreover, the Gadvan Formation represents the intrashelf deep-water conditions and is deposited as a result of the progressive phase of sea level in the euxinic environment. Nevertheless, it is due to OM in the Zagros Basin, and it is affluent in OM at the site of the resident Dezful Embayment. It seems that these rocks are upward to the Garau Formation, which is composed of argillaceous limestones and gray-black carbonaceous shales deposited in an open–marine condition of the Khuzestan Region.

3. Method and Data

3.1. Geochemical Analysis

Rock-Eval pyrolysis is among the popular tools in the oil and gas industry for assessing the type of kerogen and thermal maturation in the source rocks. Rock-Eval pyrolysis also provides the real value for the quality and quantity of OM in the source rocks and evaluates their production index (PI) [4]. Before commencing the study, 14 samples taken from oil-prone Wells B and C of the South Pars field were first pulverized using an agate mortar and a pestle. Analysis of the samples was performed at the Research Institute of Petroleum Industry in Tehran, Iran (RIPI). In the follow-up stage of the study, 70 mg of each sample was weighed and placed in a clean crucible based on the sampling depth. Following conformational analysis of the Rock-Eval pyrolysis, the samples were decontaminated to prevent the contamination of the tool. According to Bolandi et al. [23], iron filings and mica decontaminate the samples while the drill bit and lost circulation materials, respectively. Once the samples were located, their characterizations (e.g., sampling weight and depth) were marked and entered into the system. To investigate the PI of Gadvan’s samples, they were heated in a pyrolysis oven under a nitrogen flow. Also, a flame ionization detector was applied to quantify their hydro-carbonaceous effluents. Rock-Eval pyrolysis technique was used to obtain the main parameters, including TOC (wt. %), S1 (mg HC (hydrocarbon)/g rock), S2 (mg HC/g rock), and Tmax (°C). To determine the chemical composition of kerogen in the Gadvan Formation, the elemental analysis was also carried out upon 14 samples at the RIPI. For potential hydrocarbon appraisal of the Gadvan Formation, five major elements, including carbon (C), hydrogen (H), nitrogen (N), oxygen (O), and sulfur (S), were considered to analyze the kerogen of the samples. The data from elements of H and O were plotted in a Van Krevelen diagram as atomic ratios of H/C and O/C, respectively, to classify the kerogen type. The ratios of H/C or O/C were calculated through Equation (1):
( H   o r   O ) / C =   w e i g h t   p e r c e n t   ( H   o r   O ) a t o m i c   w e i g h t   ( H   o r   O )   w e i g h t   p e r c e n t   C   a t o m i c   w e i g h t   C
Moreover, a Leitz MPV-SV reflectance microscope (Leitz GmbH & Co. KG, Oberkochen, BW, Germany) was applied to determine vitrinite reflectance (Ro), as the primary method to identify the temperature history in sedimentary rocks. For determining Ro, as recorded results regarding the light percentage reflected in oil, the samples were prepared in aspheric lenses following the standard SY/T5124-2012 [24].

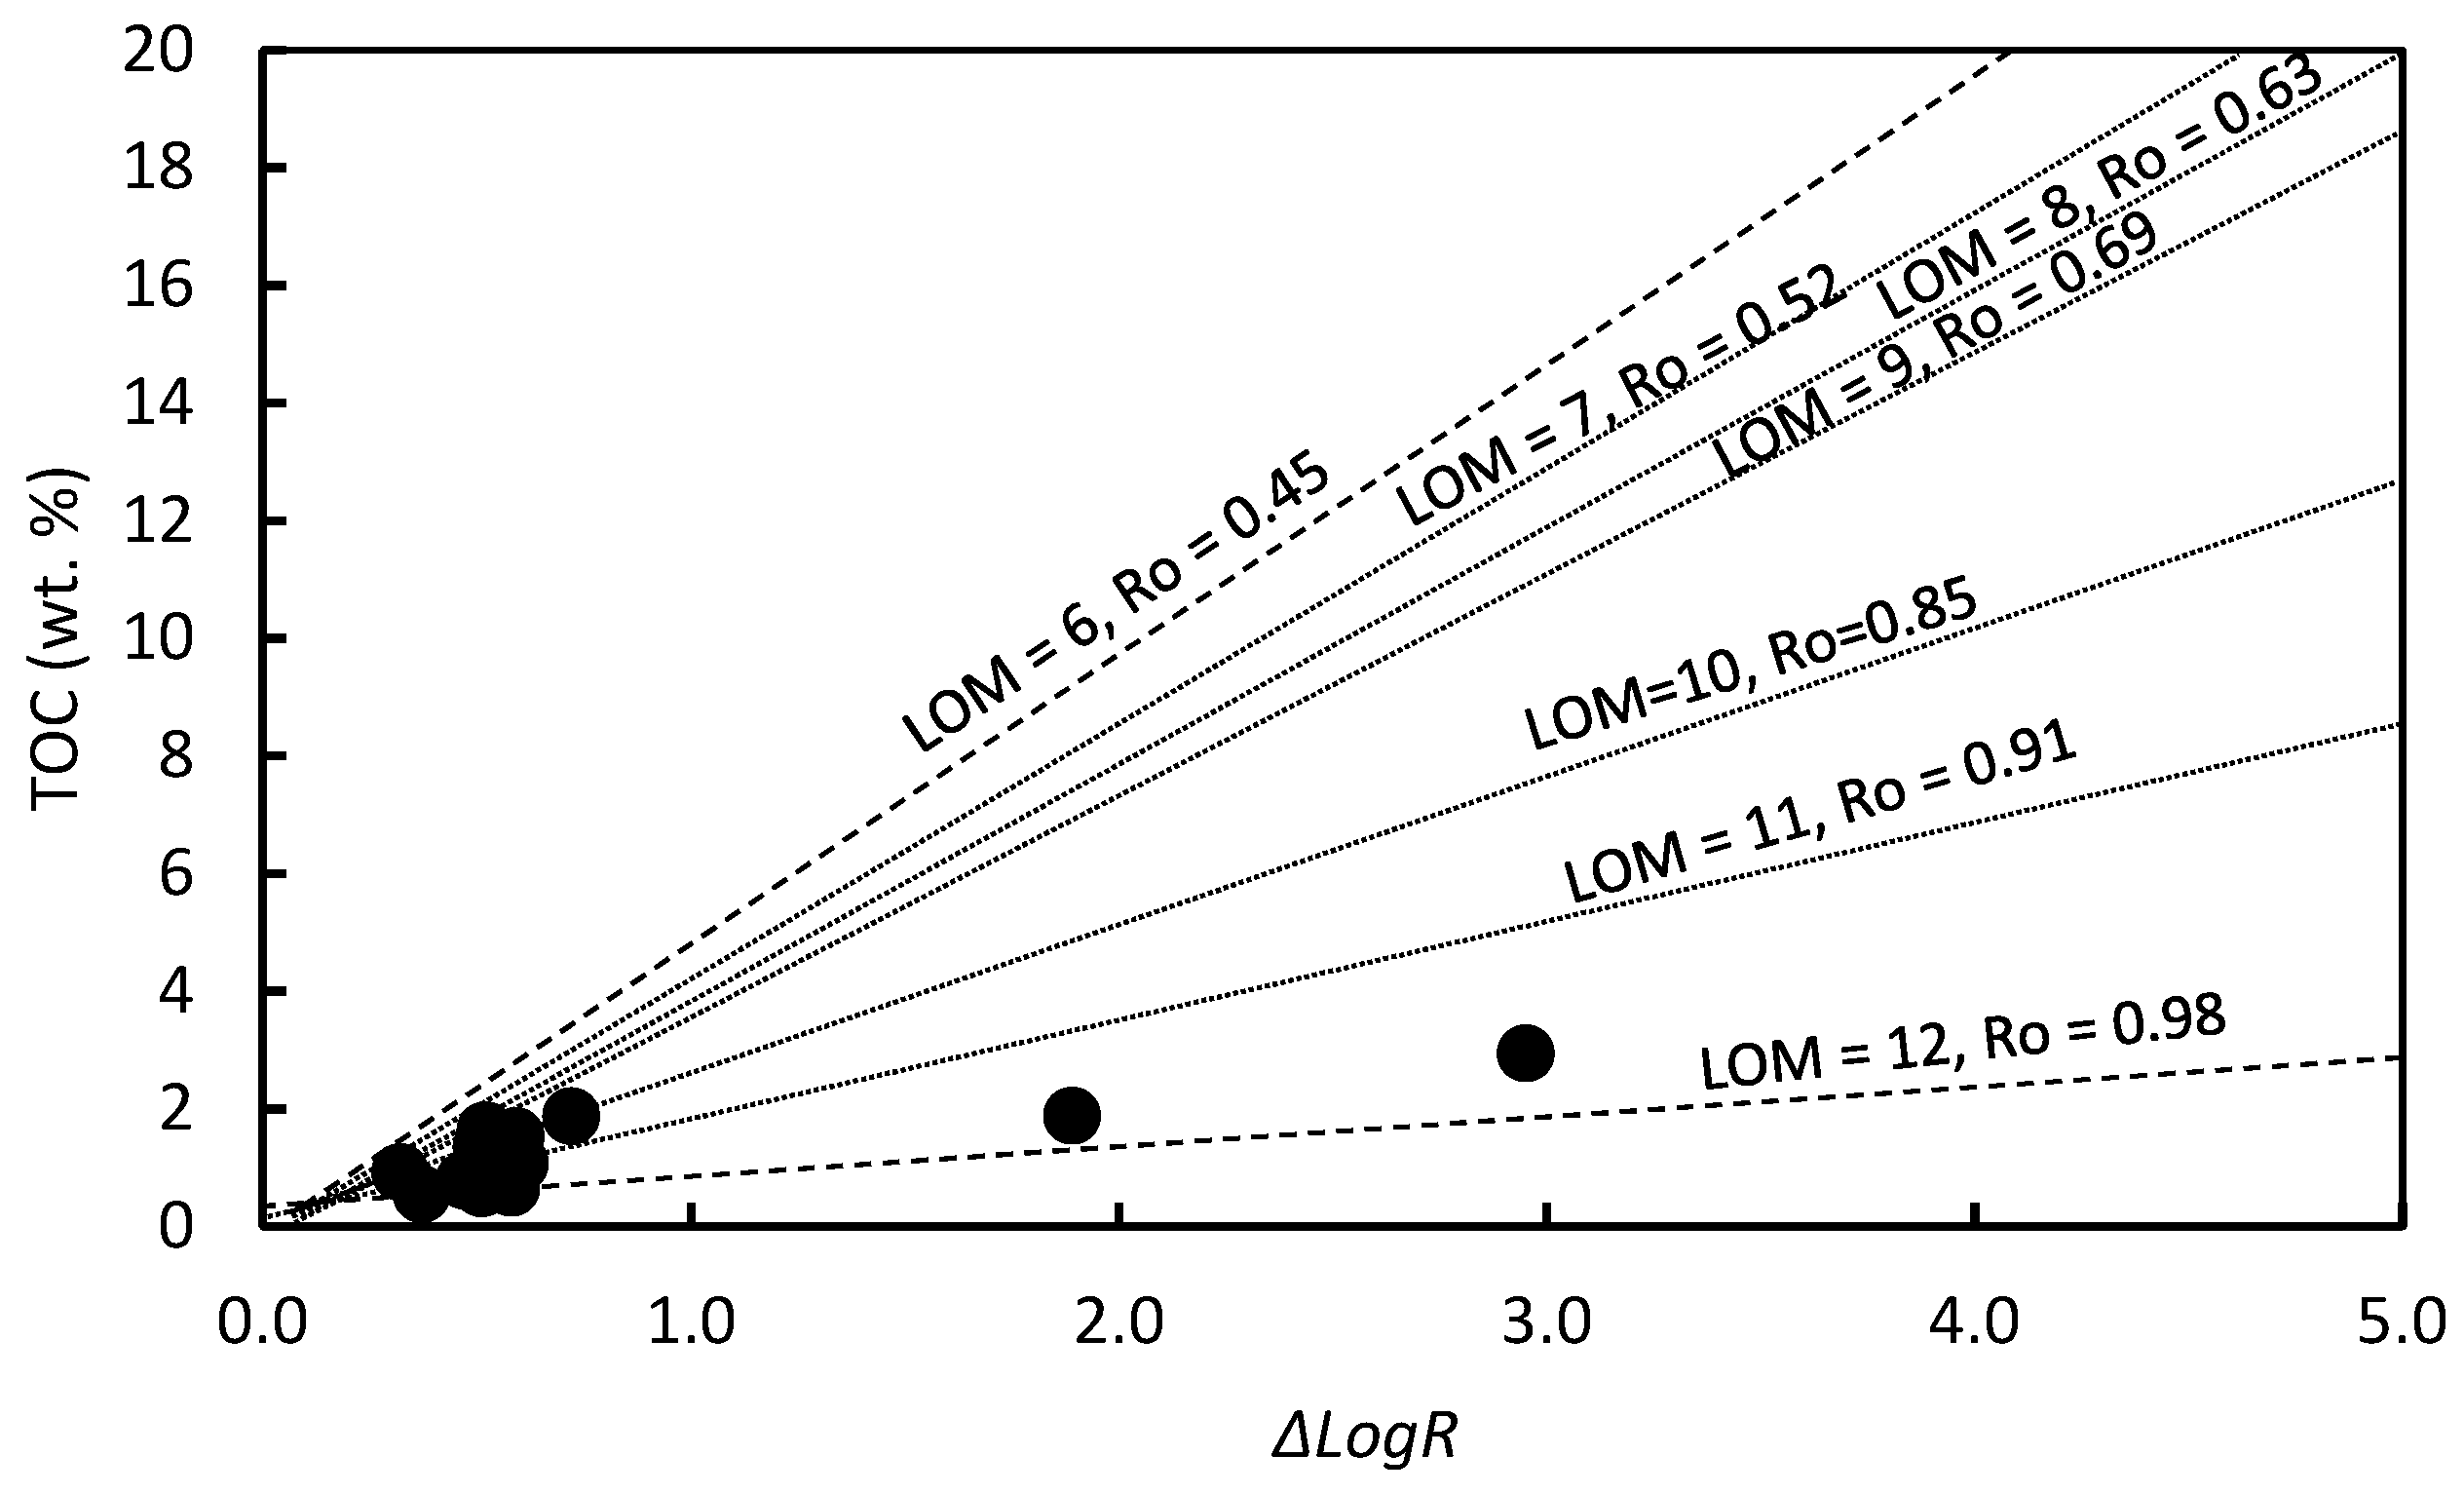
3.2. ΔLogR Technique

The ΔLogR model, proposed by Passey et al. [15,25], is considered as one of the most popular tools to evaluate the thermal maturity and determine the TOC content of source rock candidates, such as shale formations. The ΔLogR method was applied to overlap appropriately scaled sonic (AC) log on deep resistivity (RT) log. According to Passey et al. [25], a separation between RT and AC logs occurs in OM rich source rocks with the same thermal maturity (Equation (2)). However, two curves are paralleled and overlain in organic-lean water-saturated rocks [26]. In this study, the ΔLogR method was applied to involve source rocks with different levels of thermal maturity. In this regard, the common ΔLogR correlation was reshaped and confirmed by modifying the positive and also the negative isolation of ΔLogR as a result of the resistivity from shales with low values of TOC. As revealed by Wang et al. [14], the resistivity in the shales rich in OM was lower than organic-deficient shales. The benefit of this approach was that the value of TOC was reproduced with two aspects of relative and absolute differences within half and whole weight percent, respectively. Readings from the difference between SGR and CGR (computed gamma-ray) logs in the common ΔLogR were merged to progress the ΔLogR technique. Keeping in mind the concentration of the U was considered as a principal determining the factor of TOC content in the shales rich in OM while other radioactive elements (e.g., Th, K) were absent. Equations (2) and (3) are for calculating the content of TOC (wt. %) with the ΔLogR value by considering relative and absolute differences in TOC content (i.e., 0.5).
Δ l o g R = l o g 10 ( R R T R A C ) + 0.02   ( Δ t R T Δ t A C )
T O C = Δ l o g R × 10 ( 2.297 0.1688 L O M )
In Equation (2), RRT and RAC are the values for resistivity log and reference resistivity value in Ohm.m. ΔtRT and ΔtAC present transit time for sonic log and sonic reference value in µs/m. Reference zones are non-source rock zones where the separation between porosity and deep resistivity logs is nil. In Equation (3), LOM denotes the level of organic maturity.

3.3. Multiple Linear Regression Model

Quintessential physical properties of the OM cause to the respond of logging curves to its present in source rocks. On the other hand, the determination of the TOC content in source rocks depends on some dependent and independent variables; therefore, the outcome from well logs can be further reliable using the multiple regression analysis. Initially, a simple regression analysis was conducted to correlate the measured TOC by various well logs. Moreover, to identify which well logs’ response could be involved in the multiple linear regression model, a series of outcomes from the petrophysical properties of the OM were analyzed. For this purpose, Equation (4) was applied to proceed with the multiple linear regression model.
y i = β 0 + β 1 x i , 1 + β 2 x i , 2 + + β p 1 x i , p + ε i
where y i is the predicted linear relationship that is calculated for dependent variables, x 1 through x p refer from 1 to p distinguishable independent variables. β 0 donates the value of y when x 1 through x p is zero. β 1 through β p as estimated regression coefficients show the value change of y about independent variables.
The inputs of the regression model were ΔLogR results derived from an overlay of AC and LLD logs in the unified scale together with CGR and SGR logs. Considering the small amounts of TOC in the Gadvan Formation, the relationship between CGR, SGR, and ΔLogR results with TOC was nearly linear, and therefore, MRA provided satisfactory results in this study.

3.4. Samples Preparation to Well-Log Data

Building on the work of Khoshnoodkia et al. [16], Wang et al. [14] pointed out the architecture of well-log data and its preparation as followings. Before the data were analyzed, the depth of the samples was matched. In doing so, two curves of the GR taken from the samples on the ground and the well were compared to validate well-log data. No taxonomic error was found by comparing the curves. Also, a standard deviation was calculated to prevent data contamination.
Moreover, various logs, such as density, sonic, neutron, and resistivity, were applied to predict the TOC content. The determination of TOC content from these logs was based on this principle that high-OM source rocks represent further irregularities in the logs [26]. Furthermore, the determination coefficient (R2) was applied to determine precisely the TOC value. Equation (5) provides an overview regarding the R2 calculation:
R 2 = Σ   W E n W ¯ E ¯ ( n 1 ) [ S D ( W )   S D ( E ) ]    
In Equation (5), W and W ¯ are the parameters and their mean from well-logs, respectively. E and E ¯ denote the values and their mean from experimental tests, respectively. n indicates the taken samples, and SD is the standard deviation.

4. Results and Discussion
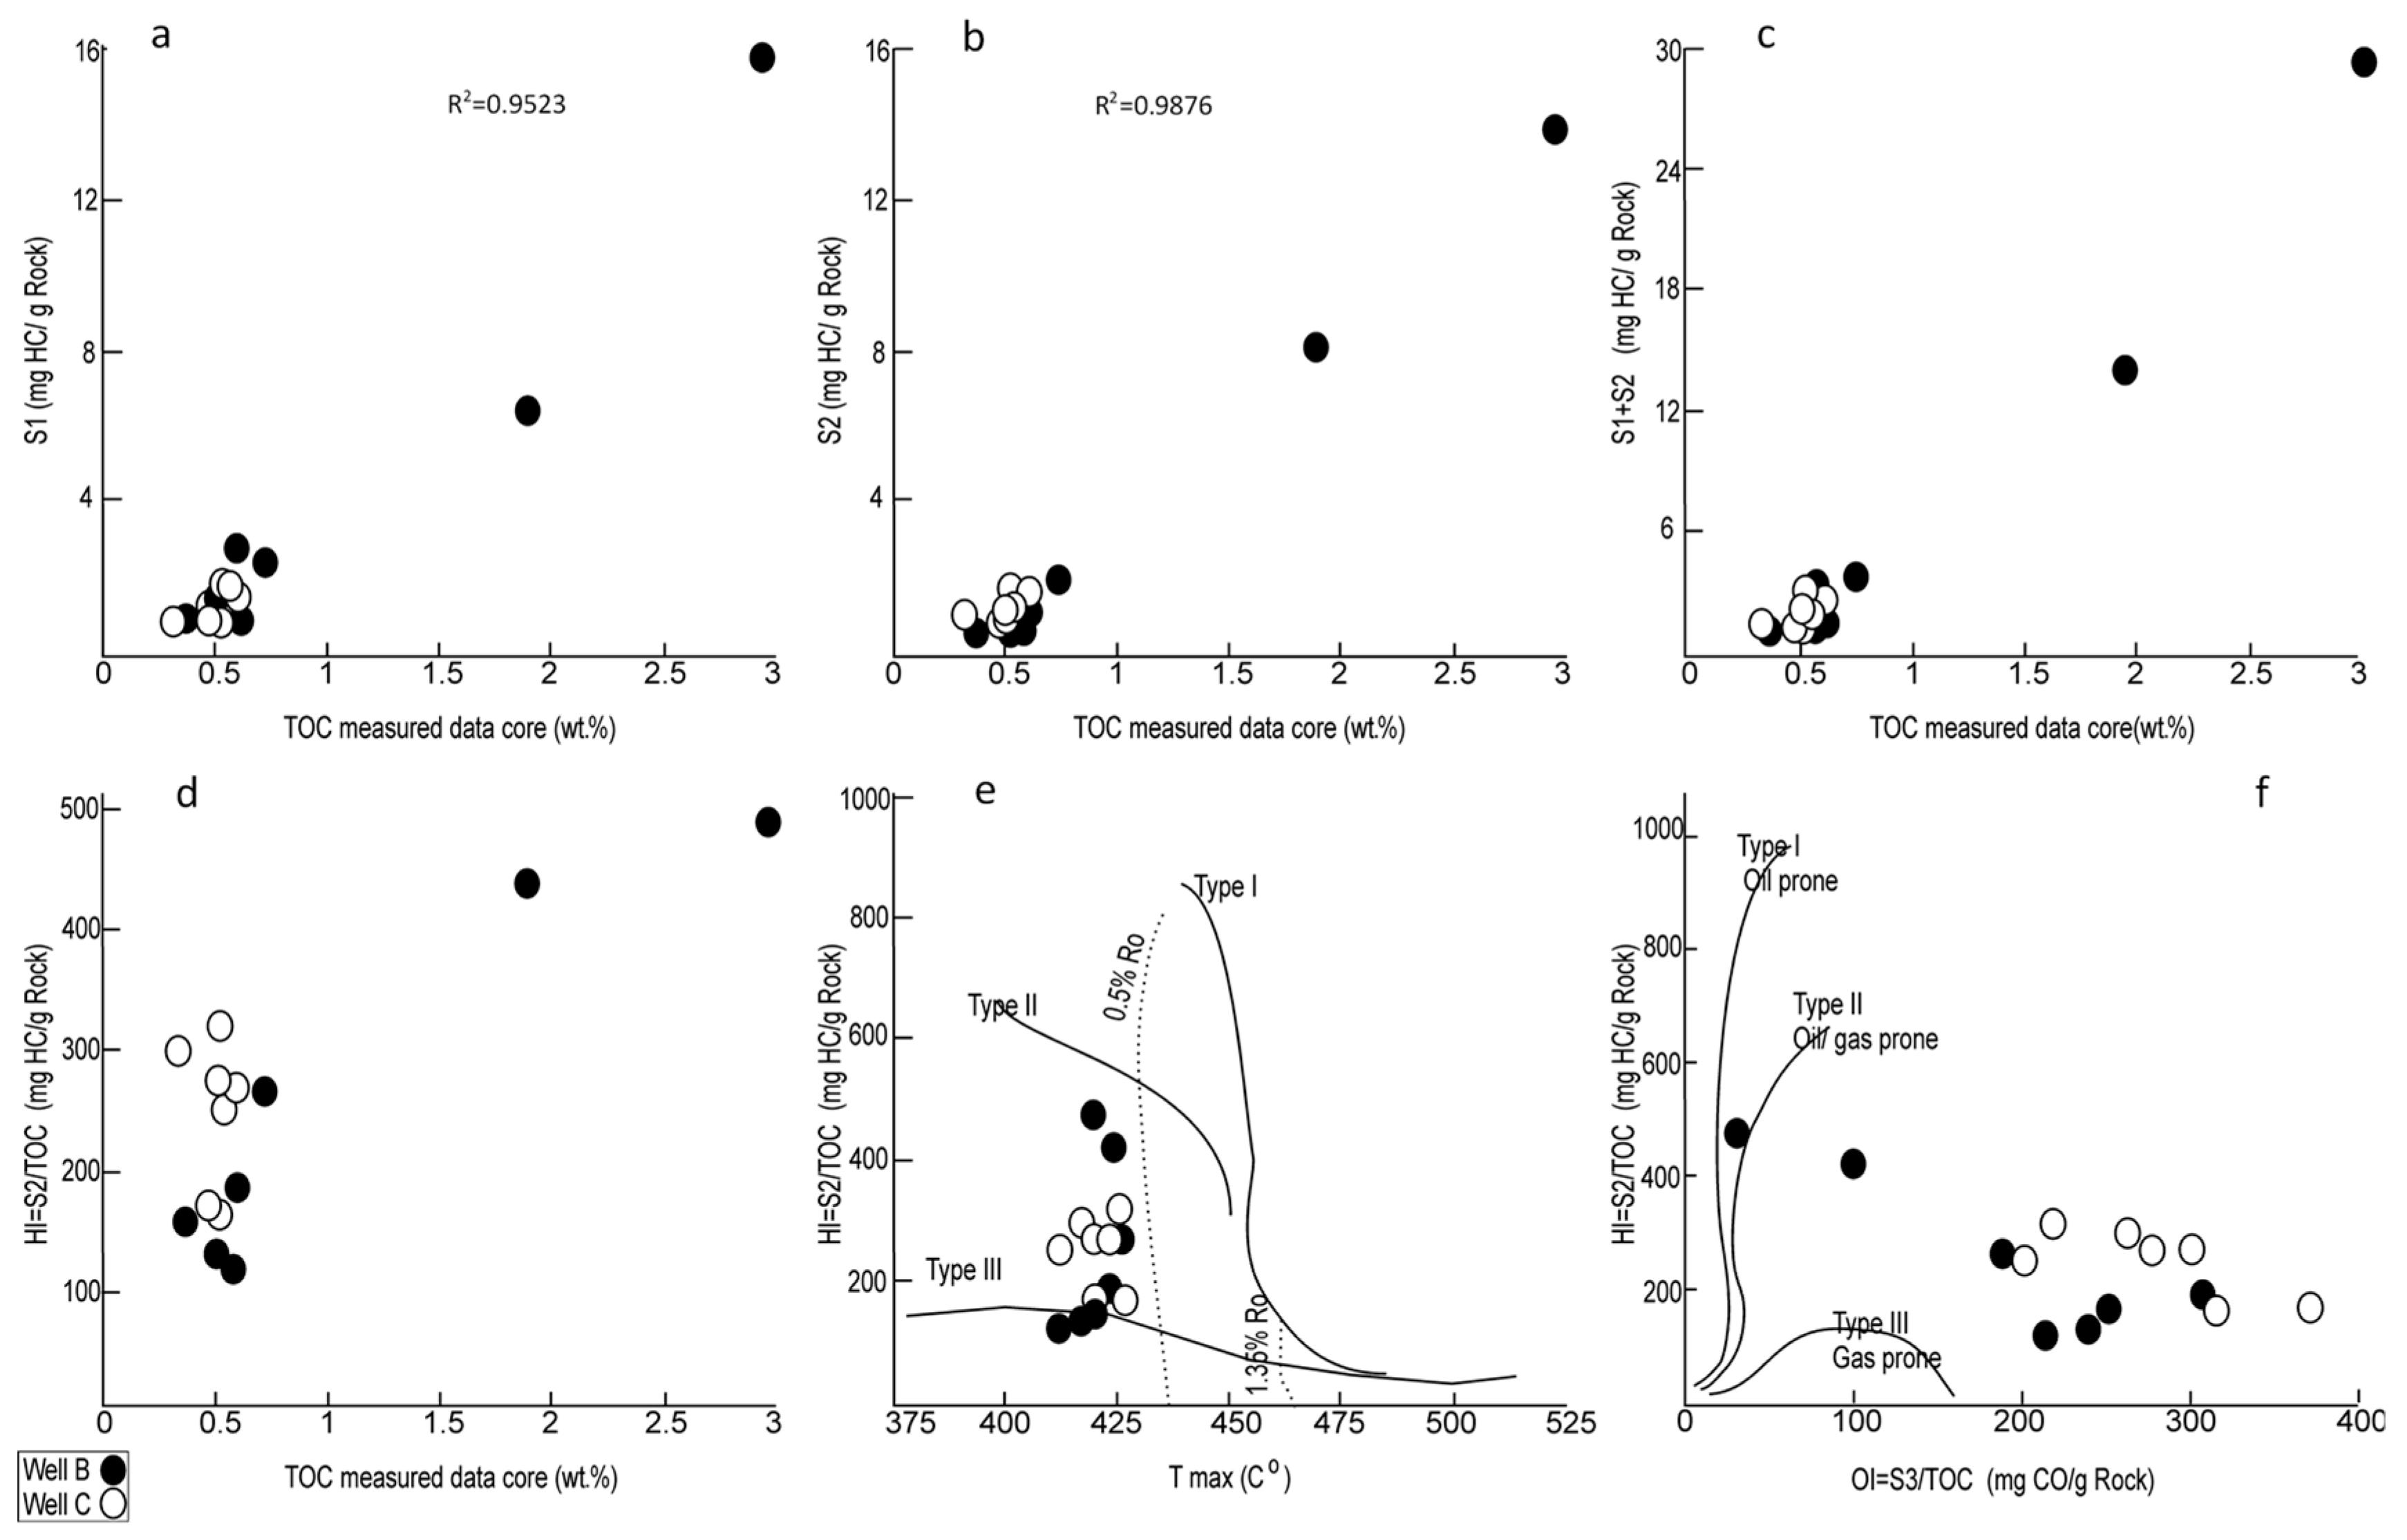
4.1. Geochemistry

Table 1 presents the results of Rock-Eval pyrolysis obtained from drill cuttings of the Gadvan Formation in two oil-prone Wells B and C in the South Pars field. The average TOC of 0.79 for the Gadvan samples was categorized as kerogen type III (Figure 3). Kerogen type III had a HI (hydrogen index) below 300 (mg HC/g TOC) and an OI (oxygen index) above 100 (mg CO/g TOC), which meant these samples could typically generate the gas. Besides, the average ratio S2/S3 of the Gadvan Formation is 0.47. This ratio is an indicator of hydrogen richness in the kerogen. Because the ratio of S2/S3 was lower than 3, the Gadvan Formation was only capable of producing gaseous hydrocarbon.
Further analysis showed that the Tmax for all Gadvan samples was less than the value of 430 °C. It explained this source rock candidate had not reached the stage of thermal maturity. The number of free hydrocarbons (S1) and hydrocarbon yield from kerogen cracking (S2) of the samples coincided with an increase in the richness of the OM in the Gadvan Formation (Figure 3). From Figure 3, cross-plot of S2 vs. TOC gave the evidence that this formation was a poor source potential, and the mean of S2 of the samples fell below 2.5 (mg HC/g Rock).
Table 1 also provides the results obtained from the elemental analysis of the Gadvan samples. What is interesting about the consequences of elemental analysis is that we could classify the kerogen type and study the maturity path reflecting the changes in the chemical structure of kerogens [4]. Looking at Table 1, it is apparent that the sum of all elements was significantly more than 95 wt. %. Per se these data from Table 1, there was a visible result in accepting the reliability of the elemental analysis. Vandenbroucke and Largeau [27] stated that the elemental analysis was considered reliable, while the sum of carbon, hydrogen, nitrogen, and oxygen was more than 90 wt. %.
Moreover, the H/C ratio ranged from 0.79 to 1.41 for the Gadvan samples, indicating a consistent quantity of OM in these samples. Looking at the burial depth of the samples, it was apparent that the lowest and highest H/C ratios occurred in the deepest and shallowest depths of the Gadvan Formation. Following the decrease of the H/C atomic ratio, an increase in the burial depth was recorded for the Gadvan Formation. Turning now to the experimental evidence on Ro values (i.e., 0.5%), which are accordant with Tmax values, indicates the Gadvan Formation has not been reached to an oil-prone stage or HC generation [4]. These results provided valuable insights to categorize the type III kerogen of the Gadvan samples that is an association between OM and H/C.

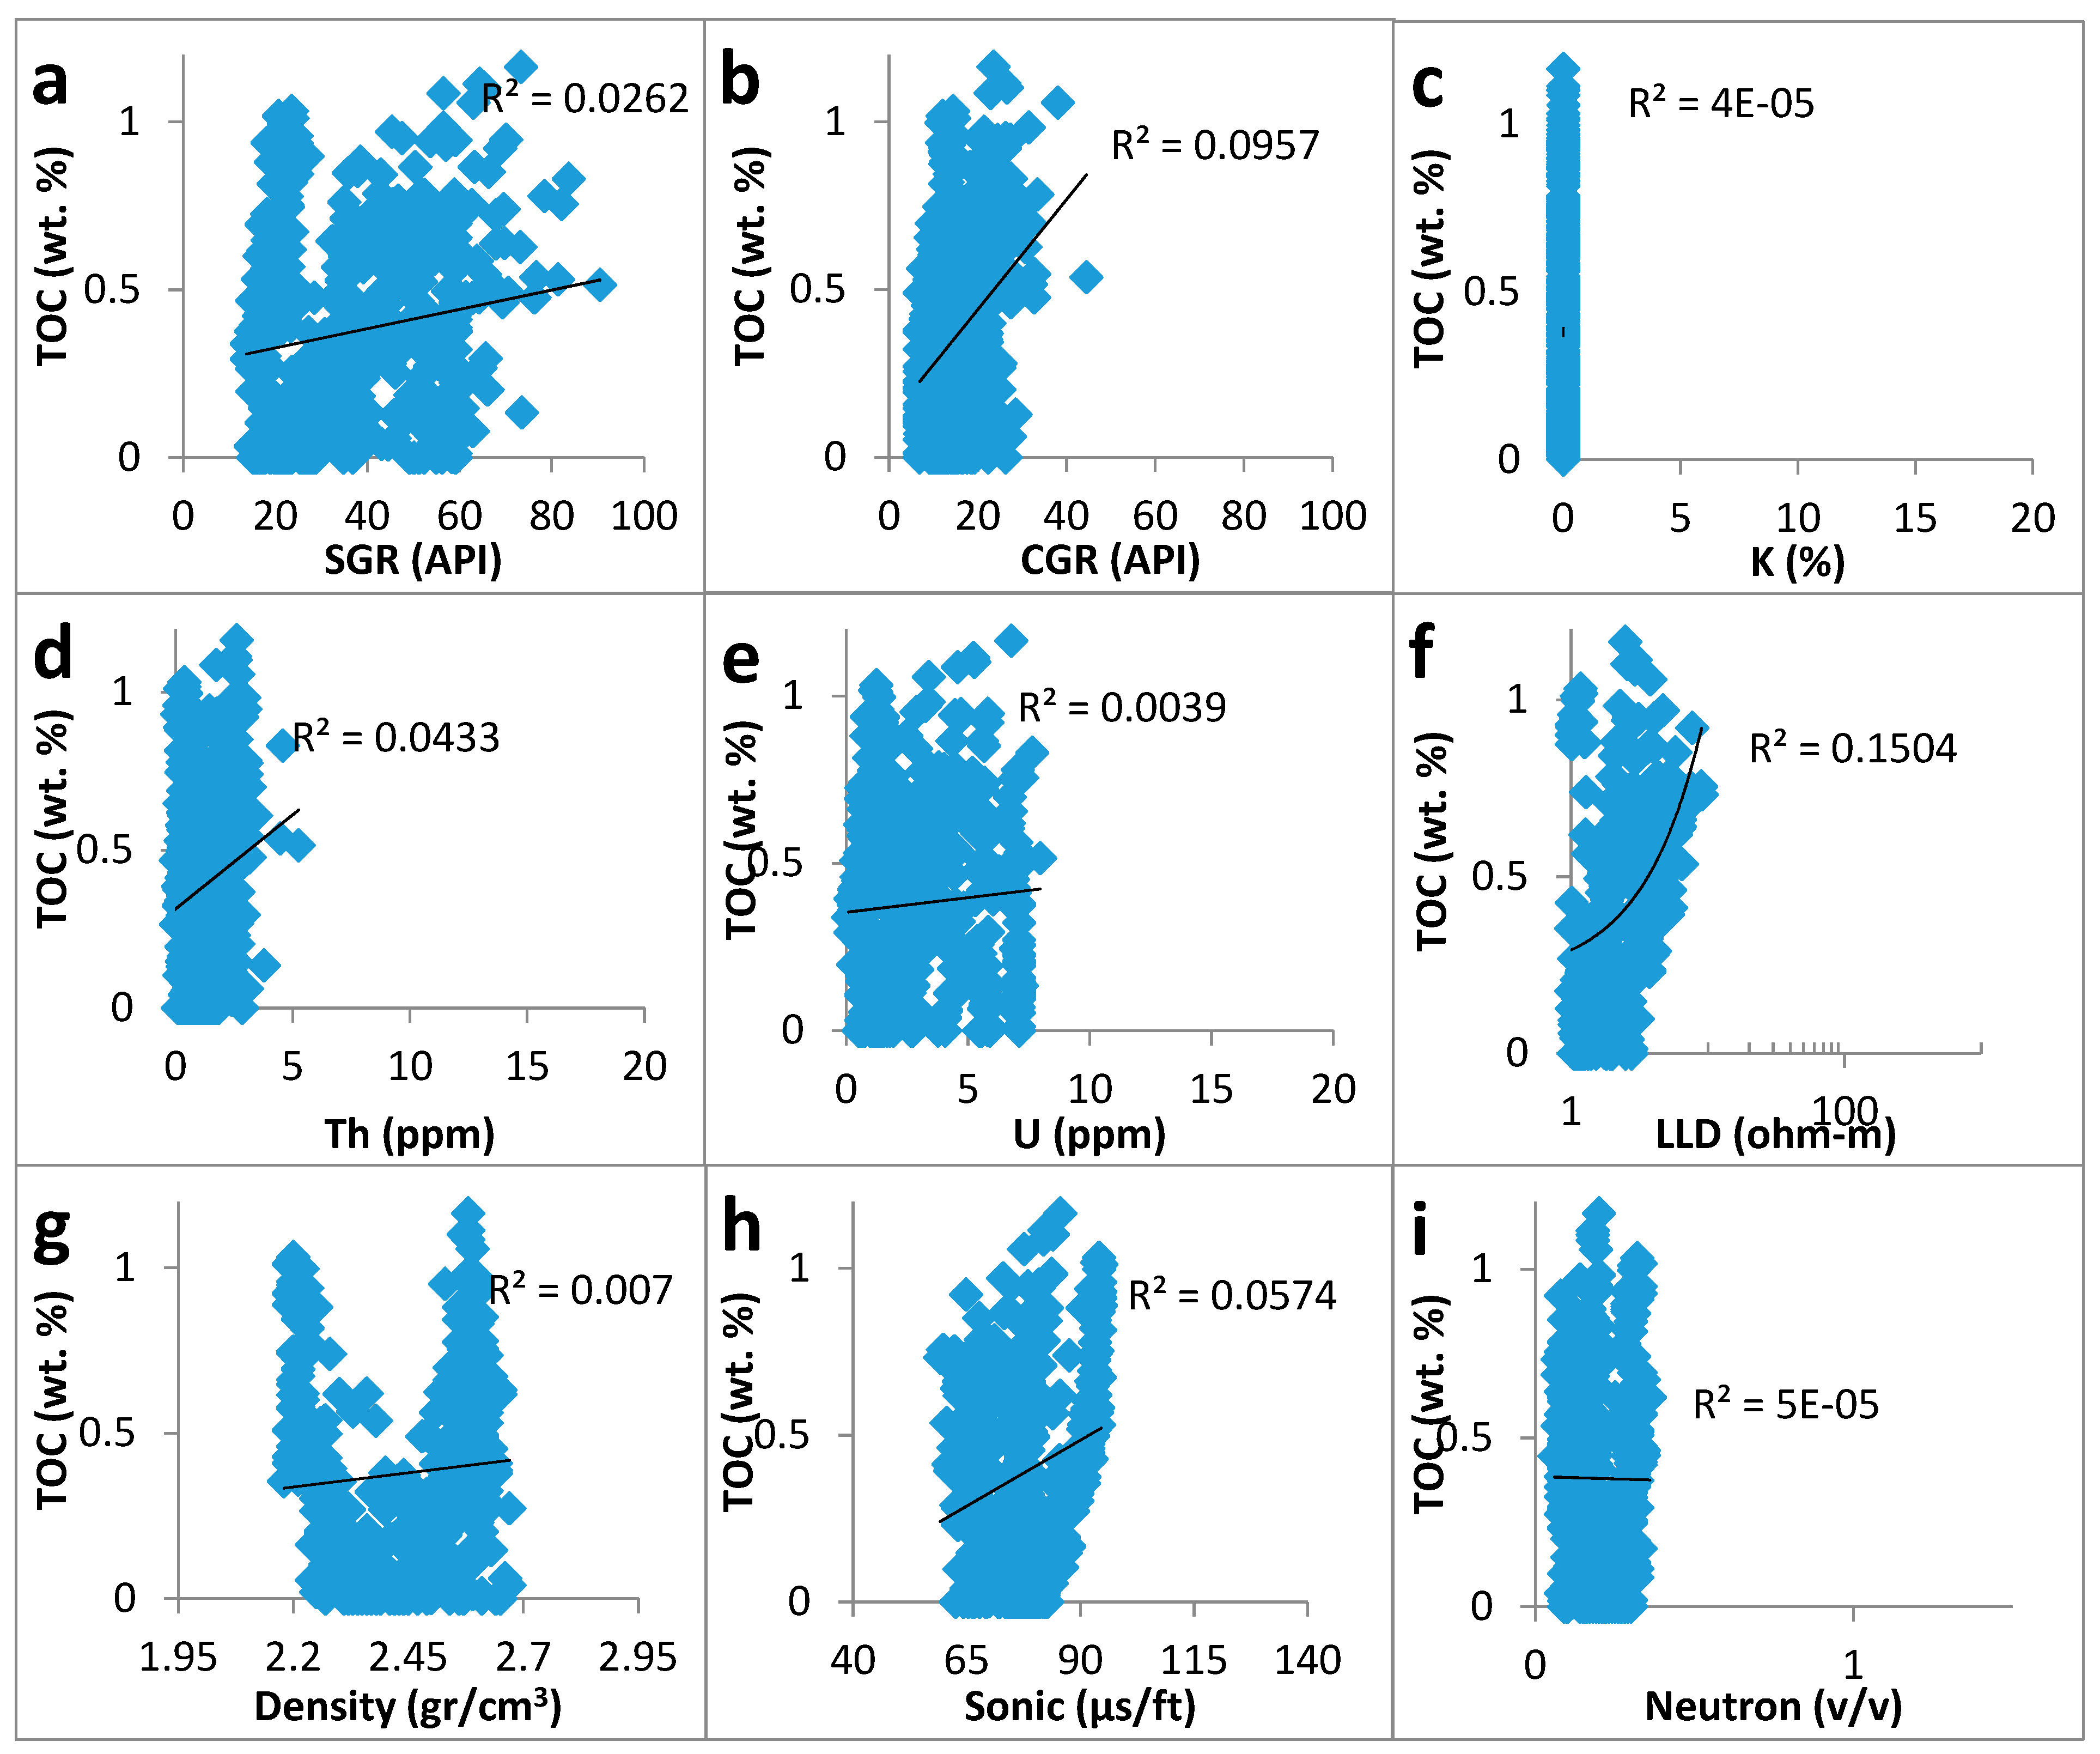
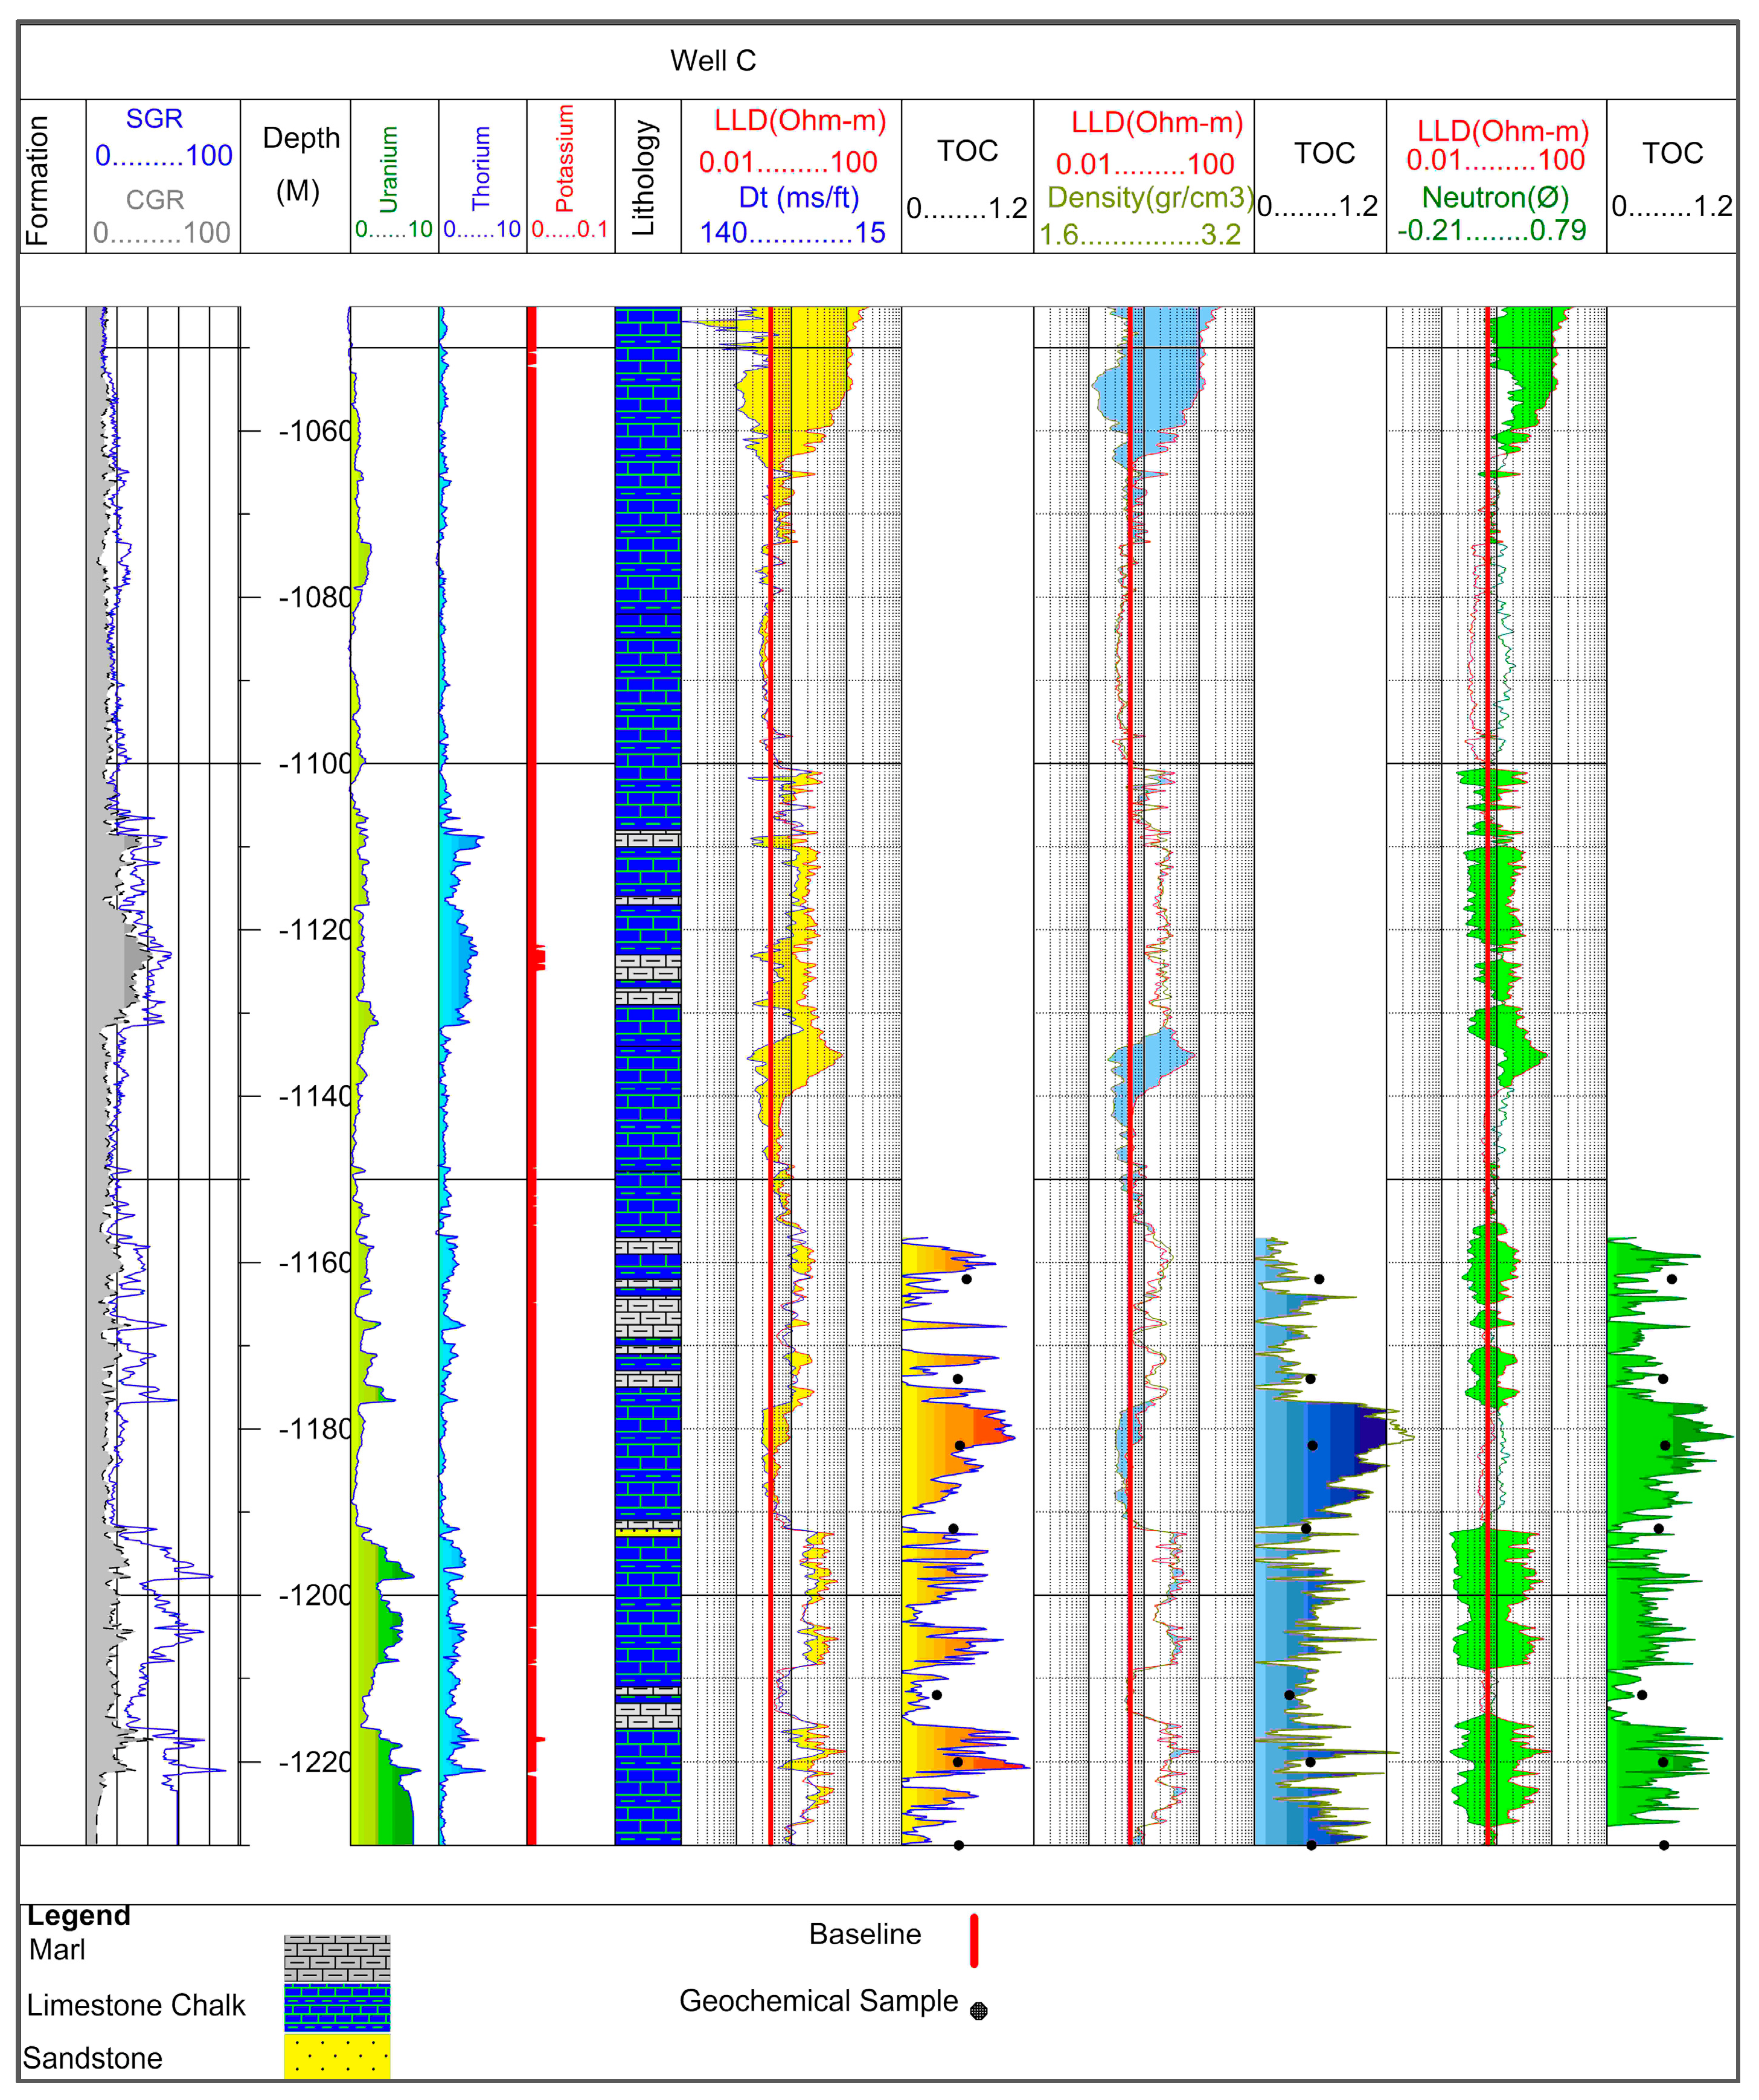
4.2. Well Log Response

Various well logs were used to record the physical properties of the Gadvan Formation as a source rock candidate in the South Pars field. Hence, this sub-section provides the correlation between the TOC content measured from cutting samples of the Gadvan Formation and calculated from well logs respond in the oil-prone Wells B and C. As shown in Figure 4a,b, the SGR and CGR results indicated the intensity less than 60 API (American Petroleum Institute) for the Gadvan samples. It is apparent from this figure that the Gadvan Formation is was not considered as a good source rock because a closer inspection of the results confirmed that source rocks are defined through high-intensity in SGR and CGR logs [12]. Moreover, the spectrometry measurement showed that the K content was near to zero (<0.1%), corresponding to a nearly pure carbonate without a source of evaporites (Figure 4c). While there was a little content of the Th (<5 ppm), it might indicate the presence of clays in the Gadvan Formation (Figure 4d).
Furthermore, an excellent variable percentage of the U was not recorded. The low-content of the U (<10 ppm) also established that the Gadvan Formation was not deposited in an excellent reducing environment, an ideal setting for the conservation of the OM (Figure 4e). On the other hand, the response of resistivity log in the source rock presented a meaningful relationship between the maturity level of OM and types of fluid. While hydrocarbons generate in source rocks, the resistivity log would increase in value [14]. However, low-values LLD (<10 ohm.m) record for the samples could indicate the immature state of the Gadvan Formation (Figure 4f).
The most striking result to emerge from the data was that bulk density recorded less value for the OM rather than the source rock matrix. Therefore, the density log presented a scattered pattern from less than 2.2 gr/cm3 to about 2.7 gr/cm3 in the Gadvan Formation with different content of TOC (Figure 4g). Additionally, a high-value and scattered pattern of the sonic velocity from less than 60 μs/ft to about100 μs/ft was recorded concerning the Gadvan Formation. This result suggested that an immature source rock represented a rapid response of the sonic log rather than a mature interval (Figure 4h). Also, the recorded slow response in the neutron log between 0.1 to 0.4 v/v could be attributed to the presence of immature source rock in the studied area of the Gadvan Formation (Figure 4i).

4.3. Results from ∆LogR

Referring to Equation (3), there were two basic approaches currently being adopted in research into LOM (level of organic maturity). One was from the chart of Ro (as an indicator of thermal maturity) and Tmax, and two was through the diagram of TOC to S2 (see Figure 3). From Equation (2), we could determine the values for RRT and RAC, which were 0.7 ohm.m and 93.1 μs/ft, respectively. Among other well logs, sonic-resistivity curves presented a proper validation between the results from cutting samples and extracted ones. Besides, LOM in Equation (3) was determined for the experimental measured Ro. From Figure 5, the LOM value of 10 was extracted for calculating the TOC content and drawing the TOC curve. These findings were then compared to the results from Rock-Eval analysis for its reliability and validity (Figure 6). From the experimental results, Ro values were less than 0.5% for the Gadvan samples in the South Pars field, corresponding to the LOM value of <7 (see Figure 5).
Moreover, R2 was applied to predict the capacity of ∆LogR in the determination of TOC content. Looking at Figure 6, it was apparent to match the calculated TOC from Equation (3), and experimental results as the R2 was 0.9876 for TOC vs. S2 (see also Figure 3). Also, the R2 values from the multiple linear regression model, including SGR and CGR (i.e., R2SGR+CGR = 0.1219), reported significantly more than the other logs. According to Wang et al. [14], and as a result of Figure 4, applying both SGR and CGR was a useful tool in the multiple linear regression model to calculate the accuracy content of TOC.

5. Conclusions

This study was designed to determine the accurate content of TOC in the Gadvan Formation based on the ∆LogR technique and the multiple linear regression model. The content of TOC, as the amount of carbon available in an organic compound, was assessed using conventional well logs, such as resistivity, sonic, density, neutron, and gamma-ray logs. Due to quintessentially physical properties of well logs, obtained curves from them represented the presence of the OM. Because the content of TOC indicates the amount of OM in source rocks, the accurate determination of TOC could be valuable in the model of multiple linear regression. The obtained results via using a combination of SGR and CGR logs were trained with the ∆LogR technique for the prediction of TOC content. From well logs of SGR and CGR, the low content of K confirmed that there was no source of evaporites and indicated the presence of pure carbonate sediments in the Gadvan Formation.
Furthermore, the low content of Th is a criterion for the non-existence of clay mineral in a pure carbonate environment. The moderate content of the U established that the Gadvan Formation was not deposited in an excellent reducing environment for the conservation of the OM. It was due to the insolubility of the Th and its migration in a colloidal form in the depositional environment, as it was seen in a low content in the Gadvan Formation. Instead, the moderate content of the U established that the Gadvan Formation was not deposited in an excellent reducing environment for the conservation of organic matter, and the U was not detected in pure carbonates formed in an oxidizing environment. Thus, the SGR approach did not attempt to give sufficient information and should be combined with other log data to have a better evaluation of the formation. However, the value of R2 resulted from the multiple linear regression model with SGR and CGR was higher than the results obtained without SGR and CGR; therefore, a combination of SGR and CGR was considered as a significant predictor in this model. As a case study, results from the ∆LogR and multiple linear regression analysis confirmed that the Gadvan Formation is a very poor source rock in the oil-prone well C from the South Pars field.

Author Contributions

Resources, conceptualization, and writing—original draft preparation, O.R.; Methodology, software, and validation, M.K.; funding acquisition, A.B.P.; Writing-review and editing, A.K. and H.T.

Funding

This research was partially supported by the P.O.G.C. (Pars Oil and Gas Company) and the UTP (Universiti Teknologi PETRONAS) with Cost Center “015LB0-046”.

Acknowledgments

The authors would like to appreciate the Research Institute of Petroleum Industry (RIPI) for providing materials, data preparation, and geochemical analysis. Table 1 reprinted by permission (License Number: 4685151209318) from Springer Nature: International Journal of Earth Sciences, Reference [4], COPYRIGHT 2013. Figure 2, Figure 3 and Figure 6 reprinted with permission (License Number: 4713050757389) from Elsevier: Journal of Petroleum Science and Engineering, Reference [16], COPYRIGHT 2011.

Conflicts of Interest

The authors declare no conflicts of interest.

References

  1. Kamali, M.R.; Mirshady, A.A. Total organic carbon content determined from well logs using ∆LogR and Neuro Fuzzy techniques. J. Pet. Sci. Eng. 2004, 45, 141–148. [Google Scholar] [CrossRef]
  2. Kadkhodaie-ilkhchi, A.; Rezaee, M.R.; Rahimpour-Bonab, H. A committee neural network for prediction of normalized oil content from well log data: An example from South Pars Gas Field, Persian Gulf. J. Pet. Sci. Eng. 2009, 65, 23–32. [Google Scholar] [CrossRef]
  3. Opera, A.; Alizadeh, B.; Sarafdokht, H.; Janbaz, M.; Fouladvand, R.; Heidarifard, M.H. Burial history reconstruction and thermal maturity modeling for the Middle Cretaceous–Early Miocene Petroleum System, southern Dezful Embayment, SW Iran. Int. J. Coal Geol. 2013, 120, 1–14. [Google Scholar] [CrossRef]
  4. Rahmani, O.; Aali, J.; Junin, R.; Mohseni, H.; Padmanabhan, E.; Azdarpour, A.; Zarza, S.; Moayyed, M.; Ghazanfari, P. The Origin of Oil in the Cretaceous Succession from the South Pars Oil Layer of the Persian Gulf. Int. J. Earth Sci. 2013, 102, 1337–1355. [Google Scholar] [CrossRef]
  5. Mahmoud, A.A.A.; Elkatatny, S.; Mahmoud, M.; Abouelresh, M.; Abdulraheem, A.; Ali, A. Determination of the total organic carbon (TOC) based on conventional well logs using artificial neural network. Int. J. Coal Geol. 2017, 179, 72–80. [Google Scholar] [CrossRef]
  6. Mashhadi, Z.S.; Rabbani, A.R. Organic geochemistry of crude oils and Cretaceous source rocks in the Iranian sector of the Persian Gulf: An oil–oil and oil–source rock correlation study. Int. J. Coal Geol. 2015, 146, 118–144. [Google Scholar] [CrossRef]
  7. Bolandi, V.; Kadkhodaie, A.; Farzi, R. Analyzing organic richness of source rocks from well log data by using SVM and ANN classifiers: A case study from the Kazhdumi formation, the Persian Gulf basin, offshore Iran. J. Pet. Sci. Eng. 2017, 151, 224–234. [Google Scholar] [CrossRef]
  8. Anemangely, M.; Ramezanzadeh, A.; Tokhmechi, B. Shear wave travel time estimation from petrophysical logs using ANFIS-PSO algorithm: A case study from Ab-Teymour Oilfield. J. Nat. Gas Sci. Eng. 2017, 38, 373–387. [Google Scholar] [CrossRef]
  9. Lüning, S.; Kolonic, S. Uranium spectral gamma-ray response as a proxy for organic richness in black shales: Applicability and limitations. J. Pet. Geol. 2003, 26, 153–174. [Google Scholar] [CrossRef]
  10. Ehrenberg, S.; Svånå, T. Use of spectral gamma-ray signature to interpret stratigraphic surfaces in carbonate strata: An example from the Finnmark carbonate platform (Carboniferous-Permian), Barents Sea. AAPG Bull. 2001, 85, 295–308. [Google Scholar]
  11. Gambacorta, G.; Caronni, V.; Antonielli, E.; Previde Massara, E.; Riva, A.; Scotti, P.; Trincianti, E.; Erba, E. Hot shale in an ice world: Paleoceanographic evolution of the northern Gondwana margin during the early Paleozoic (Tanezzuft Formation, Tunisia). Mar. Pet. Geol. 2016, 72, 393–411. [Google Scholar] [CrossRef]
  12. Ramasamy, V.; Paramasivam, K.; Suresh, G.; Jose, M.T. Function of minerals in the natural radioactivity level of Vaigai River sediments, Tamilnadu, India – Spectroscopical approach. Spectrochim. Acta Part A: Mol. Biomol. Spectrosc. 2014, 117, 340–350. [Google Scholar] [CrossRef] [PubMed]
  13. Chen, X.; Romaniello, S.J.; Herrmann, A.D.; Hardisty, D.; Gill, B.C.; Anbar, A.D. Diagenetic effects on uranium isotope fractionation in carbonate sediments from the Bahamas. Geochim. Cosmochim. Acta 2018, 237, 294–311. [Google Scholar] [CrossRef]
  14. Wang, J.; Gu, D.; Guo, W.; Zhang, H.; Yang, D. Determination of Total Organic Carbon Content in Shale Formations With Regression Analysis. J. Energy Resour. Technol. 2019, 141, 012907. [Google Scholar] [CrossRef]
  15. Passey, O.R.; Moretti, F.U.; Stroud, J.D. A practical modal for organic richness from porosity and resistivity logs. AAPG Bull. 1990, 74, 1777–1794. [Google Scholar]
  16. Khoshnoodkia, M.; Rahmani, O.; Mohseni, H.; Mohammadi, A. TOC determination of Gadvan Formation in South Pars Gas field, using artificial intelligent systems and geochemical data. J. Pet. Sci. Eng. 2011, 78, 119–130. [Google Scholar] [CrossRef]
  17. Rahmani, O.; Aali, J.; Mohseni, H.; Rahimpour-Bonab, H.; Zalaghaie, S. Organic geochemistry of Gadvan and Kazhdumi Formations (Cretaceous) in South Pars field. J. Pet. Sci. Eng. 2010, 70, 57–66. [Google Scholar] [CrossRef]
  18. Aali, J.; Rahimpour-Bonab, H.; Kamali, M.R. Geochemistry and origin of the world’s largest gas field from Persian Gulf, Iran. J. Pet. Sci. Eng. 2006, 50, 161–175. [Google Scholar] [CrossRef]
  19. Aali, J.; Rahmani, O. Evidences for secondary cracking of oil in South Pars field, Persian Gulf, Iran. J. Pet. Sci. Eng. 2011, 76, 85–92. [Google Scholar] [CrossRef]
  20. Aali, J.; Rahmani, O. H2S–Origin in South Pars gas field from Persian Gulf, Iran. J. Pet. Sci. Eng. 2012, 86–87, 217–224. [Google Scholar] [CrossRef]
  21. Al-Husseini, M.I. Origin of the Arabian Plate Structures: Amar Collision and Najd Rift. GeoArabia 2000, 5, 527–542. [Google Scholar]
  22. Tavakoli, V.; Rahimpour-Bonab, H.; Esrafili-Dizaji, B. Diagenetic controlled reservoir quality of South Pars gas field, an integrated approach. C. R. Geosci. 2011, 343, 55–71. [Google Scholar] [CrossRef]
  23. Bolandi, V.; Kadkhodaie-Ilkhchi, A.; Alizadeh, B.; Tahmorasi, J.; Farzi, R. Source rock characterization of the Albian Kazhdumi formation by integrating well logs and geochemical data in the Azadegan oilfield, Abadan plain, SW Iran. J. Pet. Sci. Eng. 2015, 133, 167–176. [Google Scholar] [CrossRef]
  24. SY/T5124-2012. Method of determining microscopically the reflectance of vitrinite in sedimentary; China Oil & Gas Industry Standards: Beijing, China, 2012.
  25. Passey, Q.R.; Bohacs, K.M.; Esch, W.L.; Klimentidis, R.; Sinha, S. From Oil-Prone Source Rock to Gas-Producing Shale Reservoir Geologic and Petrophysical Characterization of Unconventional Shale Gas Reservoirs. In Proceedings of the SPE International Oil and Gas Conference and Exhibition, Beijing, China, 8–10 June 2010. [Google Scholar]
  26. Wang, H.; Wu, W.; Chen, T.; Dong, X.; Wang, G. An improved neural network for TOC, S1 and S2 estimation based on conventional well logs. J. Pet. Sci. Eng. 2019, 176, 664–678. [Google Scholar] [CrossRef]
  27. Vandenbroucke, M.; Largeau, C. Kerogen origin, evolution and structure. Org. Geochem. 2007, 38, 719–833. [Google Scholar] [CrossRef]
Figure 1. Location map of the South Pars field and studied Wells B and C.
Minerals 09 00735 g001
Figure 2. Stratigraphy column and petroleum play of the South Pars field and adjacent area; reprinted from Khoshnoodkia et al. [16].
Minerals 09 00735 g002
Figure 3. Geochemical parameters of (a) S1 vs. TOC; (b) S2 vs. TOC; (c) S1 + S2 vs. TOC; (d) HI vs. TOC; (e) HI vs. Tmax; and (f) HI vs. OI for the Gadvan samples in the South Pars field; reprinted from Khoshnoodkia et al. [16]. S1 and S2 are free hydrocarbon content and the remaining hydrocarbon generating potential value, respectively, in mg HC/g rock; TOC is total organic carbon (wt. %); HI is hydrogen index (mg HC/g TOC); Tmax donates the pyrolysis temperature at the S2 peak maximum (°C); OI is an oxygen index (mg CO/g TOC).
Minerals 09 00735 g003
Figure 4. Well logs response vs. calculated TOC for the Gadvan Formation in Well C from the South Pars field. (a) SGR vs. TOC; (b) CGR vs. TOC; (c) K vs. TOC; (d) Th vs. TOC; (e) U vs. TOC; (f) LLD vs. TOC; (g) Sensity vs. TOC; (h) Sonic vs. TOC; (i) Neutron vs. TOC.
Minerals 09 00735 g004
Figure 5. ΔLogR vs. TOC, indicating the values of LOM (level of organic maturity) and Ro (vitrinite reflectance).
Minerals 09 00735 g005
Figure 6. Overlapping well logs for the calculation of the TOC content in the Gadvan Formation; modified and reprinted from Khoshnoodkia et al. [16].
Minerals 09 00735 g006
Table 1. Results of Rock-Eval pyrolysis and elemental analysis for taken samples of the Gadvan Formation in the South Pars field; reprinted from Rahmani et al. [4].
WellSample No.DepthPyrolysis Rock-Eval
S1S2S3TOCHIOITmaxPI
BB–116211620.840.561.40.371512494191.666
B–117411740.931.092.020.601823084222.172
B–118211822.740.673.410.581162144111.244
B–119211922.361.884.240.722611884251.796
B–121212121.340.6620.511292414161.492
B–1220122015.8313.8629.692.95470314191.875
B–123012306.428.0014.421.894231014242.246
CC–116211621.421.542.960.592613024252.084
C–117411741.101.362.460.512672784252.236
C–118211821.631.312.940.532472004221.803
C–119211920.860.791.650.471663724111.918
C–121212120.800.931.730.322912624192.162
C–122012200.810.811.620.511593144162.000
C–123012301.731.643.370.523152194301.948
Mean--2.772.55.280.79245.57234.21420.281.9
WellSample No.DepthElemental Composition (wt. %)Atomic RatiosSum (%) (CHNO)
CHNOO + SH/CO/CN/C
BB–1162116264.5421.500.658.158.311.410.123.4594.84
B–1174117466.4622.550.657.957.980.990.242.4797.61
B–1182118247.8744.400.454.404.411.120.062.5497.12
B–1192119248.7742.250.474.954.960.930.203.1596.44
B–1212121254.0937.330.515.655.671.090.132.4697.58
B–1220122077.4219.120.120.290.490.890.113.0296.95
B–1230123062.1932.160.150.460.470.910.191.9894.96
CC–1162116255.0834.980.505.455.511.020.211.9496.01
C–1174117464.1125.450.616.786.860.840.112.1296.95
C–1182118252.4537.730.485.335.351.210.152.2995.99
C–1192119265.3220.510.657.287.291.160.142.0593.76
C–1212121264.2918.650.658.528.531.150.242.1392.11
C–1220122063.5620.130.658.358.361.050.311.8692.69
C–1230123050.0935.120.475.055.110.790.171.6890.73
Mean--59.7329.420.55.615.661.040.172.3695.26
Depth in m; S1 and S2 are free hydrocarbon content and the remaining hydrocarbon generating potential value, respectively, in mg HC/g rock; TOC is total organic carbon (wt. %); HI is hydrogen index (mg HC/g TOC); Tmax donates the pyrolysis temperature at the S2 peak maximum (°C); PI is the production index (S1/(S1 + S2)); OI is oxygen index (mg CO/g TOC).

