Abstract
High-grade ore zones in low-sulfidation epithermal deposits are commonly associated with the occurrence of banded quartz veins. The ore minerals in these veins are heterogeneously distributed and are mostly confined to ginguro bands, which can be identified in hand specimen based on their distinct dark gray to black color. Micro-X-ray fluorescence element maps obtained on representative samples of banded quartz veins show that Au occurs together with Ag minerals in some of the ginguro bands, but Au can also be present in quartz bands that are light gray to white and cannot be macroscopically distinguished from barren bands. The occurrence of compositionally distinct ginguro and gankin bands, the latter being a new term coined here for colloform quartz bands containing primarily electrum or native gold, can be explained by temporal changes in the composition of the ore-forming thermal waters or variations in the conditions of ore deposition. Textural relationships, including the dendritic shape of ore minerals that appear to have grown in a matrix of silica microspheres, suggest that the ginguro and gankin bands have formed as a result of rapid deposition associated with vigorous boiling or flashing of the thermal waters.
1. Introduction
Low-sulfidation epithermal deposits are a significant source of Au and Ag [1]. They form in the shallow subsurface (<1.5 km) from near-neutral chloride waters, with temperatures of up to 300 °C [2,3]. The ore-forming waters are rock-buffered and typically have low (<3–4 wt. % NaCl equiv.) salinity [2,4]. Many low-sulfidation epithermal deposits are characterized by high-grade ore zones confined to banded quartz veins that range from centimeters to several meters in width [5,6,7,8,9,10,11,12].
The ore minerals are heterogeneously distributed within the high-grade veins of low-sulfidation epithermal deposits but primarily confined to bands of colloform quartz [2,3]. Ore minerals are particularly abundant in specific colloform bands that can be identified in hand specimen based on their color. These bands are commonly dark gray to black and are referred to as ginguro layers, which is the Japanese word for silver black. One of the earliest descriptions of these ore bands is given by Mukaiyama [13] for the epithermal ore of the Sado Kinzan deposit in Japan. Ginguro bands have been described from many other deposits worldwide, including Buckskin National in Nevada [14]; Hokuryu in Japan [15]; Ivanhoe in Nevada [14]; Koryu in Japan [7,12]; Kushikino in Japan [5]; and Midas in Nevada [9]. Some of the best examples of ginguro bands occur at the high-grade Hishikari deposit of Kyushu in Japan [6,8,10,16,17]. At all of these deposits, ginguro bands are characterized by extremely high precious metal grades and can contain thousands of ppm Au and Ag. Many low-sulfidation epithermal deposits would not be economically viable without the occurrence of these high-grade ore bands [11].
This contribution reports on the distribution of precious metals in banded low-sulfidation epithermal veins as constrained by micro-X-ray fluorescence (µXRF) mapping of hand specimens. Combined with optical petrography, this study shows that native gold or electrum do not always occur together with Ag sulfides or selenides in ginguro bands, but can also be present in significant quantities in other quartz bands. These Au-bearing quartz bands cannot be visually distinguished from barren quartz bands. The findings highlight that comprehensive petrographic studies are required to fully characterize low-sulfidation epithermal deposits as macroscopic vein characteristics only provide limited information on the location of ore minerals within the veins. Implications for the current understanding of the ore-forming processes are discussed.
2. Materials and Methods
2.1. Sample Locations
This study focuses on three representative hand specimens of epithermal ores collected from the Hokuryu deposit of Hokkaido in Japan, the Midas deposit in Nevada, and the Sado Kinzan deposit in Japan.
The Hokuryu deposit in the Omu mining camp of Hokkaido in Japan represents a small low-sulfidation epithermal deposit that produced a total of ~300,000 metric tons of ore for an estimated ~68,000 oz Au and ~370,000 oz Ag between 1928 and 1943. High-grade ores were recovered from a NE-striking vein zone over a strike length of 320 m and down dip for over 160 m [15]. The high-grade quartz veins at Hokuryu are hosted by Miocene volcanic rocks [15,18,19]. The vein material displays complex quartz textures with many veins containing multiple ginguro bands, which contain electrum, naumannite (Ag2Se), aguilarite (Ag4SeS), acanthite (Ag2S), and pyrargyrite [15].
The middle Miocene [9] Midas low-sulfidation epithermal deposit, located in Elko County in Nevada, is the largest known Au–Ag epithermal deposit associated with the middle Miocene rift of northern Nevada [20]. The deposit consists of several NW-striking and steeply dipping quartz veins that locally contain >3430 g/t Au. Historic production in the area occurred between 1907 and 1942. Between 1998 and 2013, the still-active underground mine produced over 2.4 Moz Au and 32.8 Moz Ag [21]. The main vein, the Colorado Grande, has a strike length of nearly 2 km, and mineralization occurs over a vertical range of over 500 m [20]. Ginguro bands in the banded quartz veins are primarily composed of electrum, aguilarite, naumannite, stromeyerite, chalcopyrite, galena, marcasite, pyrite, and sphalerite. Additional selenides recognized include fischesserite, clausthalite, eucairite, berzelianite, and eskebornite [20].
The Miocene [22] Sado Kinzan low-sulfidation epithermal deposit on Sado Island, Japan, was one of Japan’s most significant Au producers and was in operation from 1601 to 1989. In total, 15 Mt of ore were mined at Sado Kinzan, yielding 2.51 Moz Au at an average grade of 5.2 g/t Au. In addition, over 74 Moz Ag were recovered at an average grade of 153 g/t Ag. The veins at Sado Kinzan strike east and are subvertically dipping. One of the largest veins was 1500 m in strike length and has been productive over a depth extent of ~300 m [13]. Ginguro bands contained in the banded quartz veins are composed of electrum, pyrite, chalcopyrite, sphalerite, galena, tetrahedrite, argentite, stephanite, pyrargyrite, polybasite, native silver, hessite, stromeyerite, and antimonpearceite. In addition, Br-bearing cerargyrite was recognized along fracture surfaces and in vugs [13,23,24].
2.2. Analytical Methods
The distribution of major and trace elements in slabbed hand specimens of the low-sulfidation epithermal veins were mapped using a bench-top Bruker M4 Tornado µXRF (Bruker Nano GmbH, Berlin, Germany) equipped with dual 30 mm2 silicon drift detectors at the Colorado School of Mines, Golden, CO, USA. The instrument is equipped with a Rh X-ray tube with polycapillary optics achieving a spot size of ~25 µm. Measurements were made under vacuum (~20 mbar) at 50 kV and 600 µA, using a 12.5 µm thick Al filter. Element mapping was conducted at a line scan spacing of 50 µm (equivalent to final pixel size), and a data acquisition dwell time of 50 ms (equivalent to a stage speed of ~1 mm/s). Following data acquisition, X-ray peaks were checked manually prior to deconvolution. Element distribution maps were obtained showing normalized count rates.
Equivalent to scanning electron microscopy–energy-dispersive X-ray spectroscopy (SEM-EDX), the µXRF collects the entire characteristic X-ray energy spectrum that is excited by the X-ray source (for the Rh source: ~0.5–30 keV are readily accessible). Therefore, specific X-ray lines are not chosen prior to mapping (c.f., wavelength dispersive spectrometry) and the intensity variation of any portion of the measured spectrum can be represented in a map. An example of the sum spectrum for all pixels from an entire map is presented in Supplementary Material Figure S1, and for comparison examples of sum spectra for selected areas of the same map, highlighting regions of elevated Si, K, and Au, are presented in Supplementary Material Figure S2.
Using the µXRF maps as a guide, billets for thick section preparation were obtained from the samples. The thick (90 µm) sections were used for transmitted and reflected light optical petrography using an Olympus BX51 microscope (Olympus Corporation, Tokyo, Japan). Following carbon-coating, the ore mineralogy of the samples was studied using a TESCAN MIRA3 LMH Schottky field emission-scanning electron microscope (FE-SEM; TESCAN, Brno, Czech Republic) at the Colorado School of Mines, Golden, CO, USA. The FE-SEM was operated at an accelerating voltage of 15.0 kV with a working distance of 10 mm. Semiquantitative chemical analysis of the ore minerals was performed by EDX on the FE-SEM using a Bruker XFlash 6/30 silicon drift detector.
3. Results
3.1. Banded Vein from Hokuryu in Japan
The investigated vein sample from the Hokuryu deposit in Hokkaido is symmetrically banded with a cm-thick central band displaying a lattice texture with open vugs that are lined by small euhedral quartz crystals. The colloform bands in the sample vary in thickness but are typically 2–5 mm wide. The sample is dominantly white to light gray in color but one very thin (<0.5 mm) ginguro band is located on each side of the central vug (Figure 1).
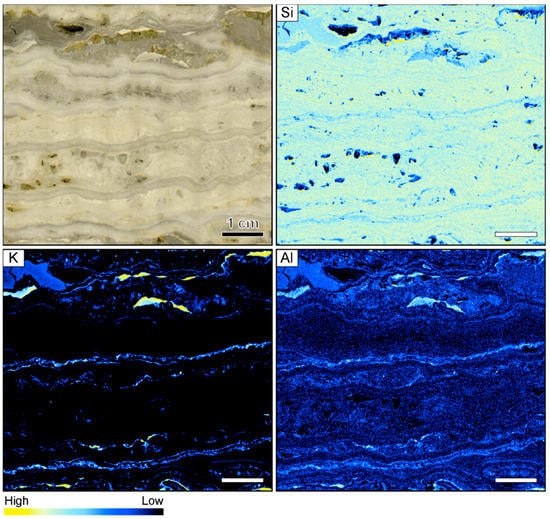
Figure 1.
Sample image and corresponding element maps of a banded quartz vein sample from the Hokuryu low-sulfidation epithermal deposit in Japan. The element maps were obtained by micro-X-ray fluorescence (µXRF) measurements. The sample is primarily composed of quartz, as demonstrated by the high Si count rates. Only two continuous bands in the specimen show elevated K and Al count rates, which may be related to the occurrence of adularia. The scale bar is 1 cm.
Element mapping showed that the sample is primarily composed of quartz, as demonstrated by the fairly homogeneous distribution of Si count rates (Figure 1). The other elements analyzed by µXRF yielded low count rates, generally showing only minor variations between adjacent bands. However, enrichment of K and Al (relative concentration changes can be detected despite the use of an Al filter) occurs in some bands, which presumably relate to the occurrence of adularia in the vein. The highest K and Al count rates were registered in white, light gray, and slightly pink colloform quartz bands, whereas the count rates of these elements are typically lower in the dark gray bands and the thin ginguro bands (Figure 1).
The µXRF further shows that the highest Au count rates do not occur in the ginguro bands (Figure 2). Elevated Au count rates were observed in two light gray quartz bands that occur on both sides of the central vug. These bands do not contain detectable Ag concentrations. In reference to the Au-rich nature, these bands are referred to as gankin bands in this contribution. The colloform gankin bands do not stand out macroscopically as ore-bearing and would have been easily missed without the µXRF mapping. The distributions of Ag and Se are similar, suggesting that much of the Ag is hosted by selenide phases. The highest count rates of these two elements occur within the thin ginguro bands observable in hand sample. Discrete grains of Ag and Se occur in some of the other quartz bands (Figure 2).
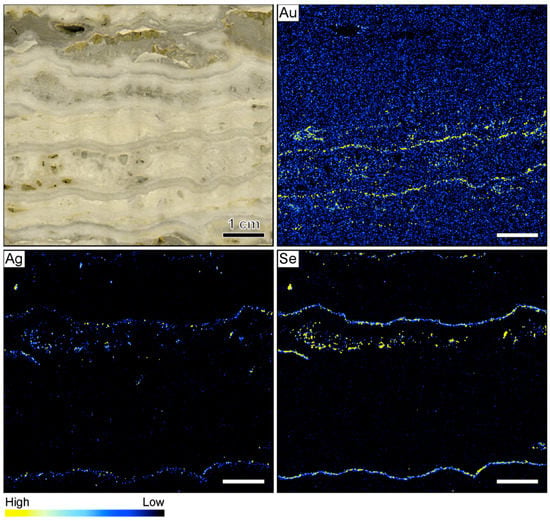
Figure 2.
Sample image and corresponding element maps of a banded quartz vein sample from the Hokuryu low-sulfidation epithermal deposit in Japan. The element maps were obtained by µXRF measurements. The highest Au count rates are identified in two light gray quartz bands, referred to as gankin bands, in reference to their Au-rich nature. The Ag-rich ore minerals in this specimen primarily occur in thin ginguro bands. The distribution of Au does not overlap with the distribution of Ag-bearing ore minerals. The scale bar is 1 cm.
Optical microscopy revealed that the colloform bands contained in the banded quartz vein mostly exhibit mosaic textures under crossed-polarized light. The mosaic texture is characterized by anhedral quartz grains with irregular and interpenetrating grain boundaries. The mosaic texture appears to have formed through recrystallization of two different types of colloform banding. Within ginguro and gankin bands, the colloform bands locally exhibit well-preserved 1–3 µm microspheres (Figure 3A). These microspherical colloform bands exhibit various degrees of recrystallization to mosaic quartz, with much of the mosaic quartz being composed of only small grains. In contrast, barren colloform bands commonly show chalcedonic microfibers that are oriented perpendicular to the bands. The chalcedonic colloform bands are also locally recrystallized to mosaic quartz. In addition to colloform bands, quartz bands displaying a range of other textures can be observed (Figure 3B). Most notable are distinct zones of lattice-bladed quartz that are interpreted to have formed by replacement of calcite (Figure 3C). Rare electrum grains are present within these bands of lattice-bladed quartz (Figure 3D), which is consistent with the µXRF maps showing that not all Au and Ag is confined to the ginguro and gankin bands. Backscattered electron imaging revealed that minor adularia is present in the same bands of lattice-bladed quartz containing rare electrum grains (Figure 3E).
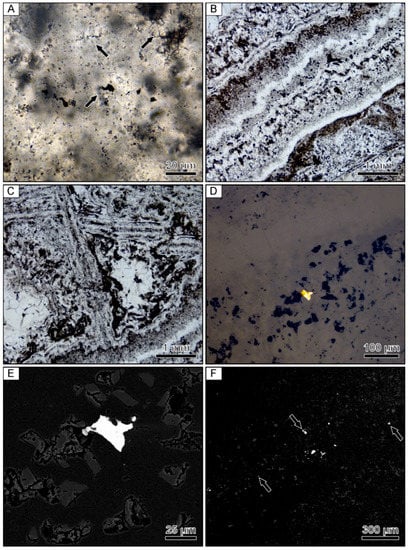
Figure 3.
Photomicrographs of a banded quartz vein sample from the Hokuryu low-sulfidation epithermal deposit in Japan. (A) Microspherical colloform band containing small opaque grains of naumannite. Arrows point to examples of aggregates of microspheres. (B) Finely banded colloform quartz. (C) Lattice-bladed quartz with clear euhedral quartz crystals infilling the space between the blades. (D) Reflected light image of an isolated grain of electrum occurring within a band consisting primarily of lattice-bladed quartz. (E) Backscattered electron image of the same electrum grain showing the presence of fine-grained rhombic adularia between the lattice-bladed quartz. (F) Backscattered electron image of the ginguro band with arrows highlighting disseminated Ag-bearing minerals.
Compositional analyses show that the Ag-bearing opaque phases contained in the ginguro bands include Ag-bearing sulfides and selenides, including acanthite, naumannite, and aguilarite (Figure 3F). Most grains are <30 µm in size. Electrum grains occurring in the gankin bands and within the bands of lattice-bladed quartz range from 5–20 µm in size.
3.2. Banded Vein from Midas in Nevada
The hand sample from the Midas low-sulfidation epithermal deposit in Nevada contains several distinct ginguro bands characterized by the presence of dark gray to black ore minerals. The ginguro bands can be up to 1–2 mm in thickness. In some cases, the ore minerals form elongate dendrites or acicular aggregates that occur at high angle to the colloform bands and cut across adjacent bands of quartz and adularia. The quartz bands in the sample are opaque and white in color (Figure 4).
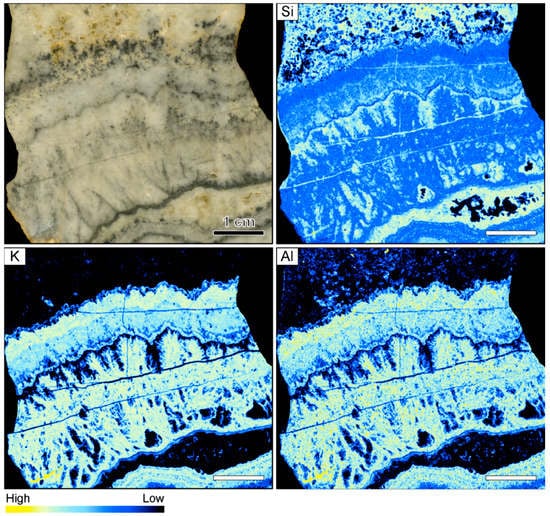
Figure 4.
Sample image and corresponding element maps of a banded quartz vein sample from the Midas low-sulfidation epithermal deposit in Nevada. The element maps were obtained by µXRF measurements. The element maps illustrate that adularia represents a common mineral in the banded vein. Some of the adularia forms elongate dendrite-like aggregates. The scale bar is 1 cm.
Compositional mapping by µXRF showed that the banded vein is not entirely composed of quartz, as illustrated by the variable Si count rates (Figure 4). Adularia is common in many of the bands, as highlighted by the distribution of K and Al. The adularia forms dendrites that are up to 10 mm in length. They are characterized by a feather-like appearance with a backbone and small acicular crystals radiating away from the backbone. In addition to these large aggregates, small needle-like crystals of adularia occur in many of the bands (Figure 4).
The Au map shows that this element is generally not abundant in the sample (Figure 5). Where present, elevated Au count rates coincide with the occurrence of ginguro bands visible in hand specimen. The maps further illustrate that Ag and Se are strongly correlated in the sample investigated. High count rates of these elements also overlap with the macroscopically identifiable ginguro bands. The Ag-bearing ore minerals form dendrites that are oriented nearly perpendicular to bands containing quartz and adularia or occur as disseminated grains within the ginguro bands (Figure 5).
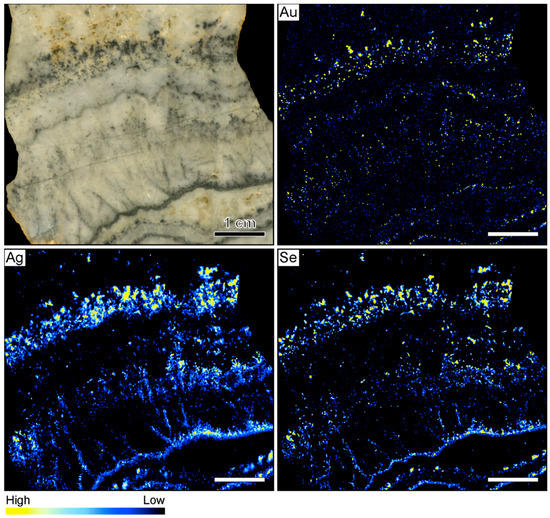
Figure 5.
Sample image and corresponding element maps of a banded quartz vein sample from the Midas low-sulfidation epithermal deposit in Nevada. The element maps were obtained by µXRF measurements. The ore minerals in this specimen primarily occur in the ginguro bands. The scale bar is 1 cm.
Ginguro bands in the sample are colloform and are composed of fine-grained mosaic quartz containing abundant well-preserved 1–3 µm-sized microspheres (Figure 6A,B). In addition to the mineralized bands, barren colloform bands occur that are characterized by mosaic quartz. Some of the thick bands contain abundant adularia. Adularia occurs in two different textural settings. It forms euhedral crystals intergrown with quartz (Figure 6C) or occurs as cm-sized feathery dendrites. Some of the feathery adularia dendrites are intergrown with small amounts of precious metal-bearing minerals. These ore minerals occur outside of the distinct ginguro bands visible in the µXRF images. The space between the adularia dendrites is largely taken up by quartz that has a ghost-sphere or comb texture.
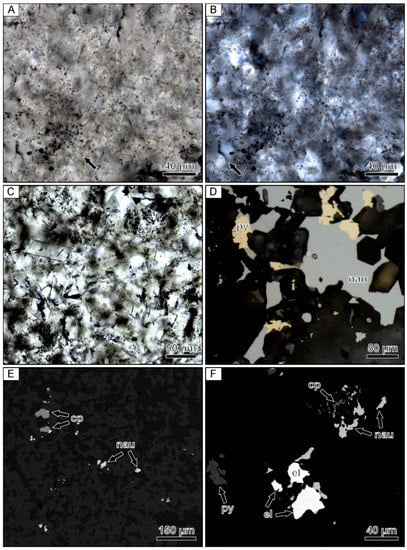
Figure 6.
Photomicrographs of a banded quartz vein sample from the Midas low-sulfidation epithermal deposit in Nevada. (A) Relic microspheres within a colloform band containing opaque ore minerals. The arrow points to well-preserved representative microspheres. (B) Crossed-polarized light image of the same field of view showing that the microspherical colloform band is partially recrystallized to mosaic quartz. The arrow points to mosaic quartz. (C) Fine-grained euhedral adularia located within an adularia-rich band. (D) Reflected light image of a composite naumannite-pyrite aggregates filling open spaces between small euhedral quartz crystals. (E) Backscattered electron image showing isolated to composite grains of chalcopyrite and naumannite. (F) Backscattered electron image showing a cluster of coarse-grained electrum with pyrite, chalcopyrite, and naumannite. el = electrum, cp = chalcopyrite, nau = naumannite, py = pyrite.
Scanning electron microscopy and EDX analyses showed that the dominant opaque mineral phases occurring in these bands include pyrite, chalcopyrite, naumannite, and electrum. The ore minerals occur as coarse composite grains that are ≤500 µm in size or 1–3 mm clusters of grains (Figure 6D–F). Although the ore minerals are located within microspherical colloform bands, the ore minerals are typically in contact with small euhedral quartz grains. These euhedral quartz grains appear to form an overgrowth on the mosaic quartz showing relic microspheres. Compositional analyses show that the electrum grains have variable compositions, but always contain higher Au contents when compared to Ag.
3.3. Banded Vein from Sado Kinzan in Japan
The hand sample from the Sado Kinzan deposit in Japan shows complex textures consisting of interlayered quartz and ginguro bands (Figure 7). An earlier set of colloform bands is crosscut by a younger set of bands. Distinct ginguro bands separated by 2–4 mm thick bands of gray quartz occur in the earlier set of bands. The crosscutting younger set of bands contains colloform quartz bands of variable color but lacks distinct ginguro bands. The younger colloform bands are overgrown by lattice bladed quartz that presumably formed through replacement of earlier bladed calcite (Figure 7).
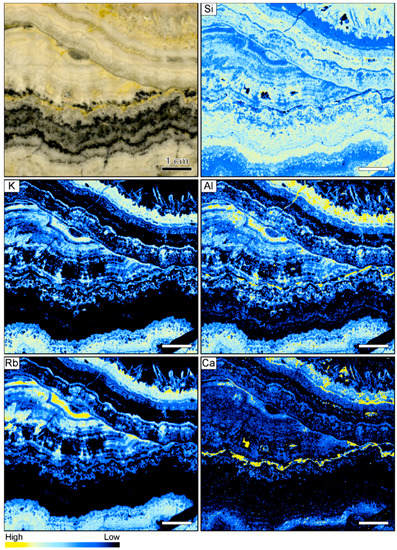
Figure 7.
Sample image and corresponding element maps of a banded quartz vein sample from the Sado Kinzan low-sulfidation epithermal deposit in Japan. The element maps were obtained by µXRF measurements. The element distribution maps highlight that many of the bands contain high K, Al, and Rb count rates, suggesting the occurrence of adularia. In addition, some bands are characterized by high Ca and lower Si and Al count rates, suggesting the presence of carbonate minerals. The scale bar is 1 cm.
In contrast to the samples from the other locations, a number of elements display significant variations between individual bands in the vein from Sado Kinzan (Figure 7). The sample is primarily composed of quartz, and the count rates for Si are generally very high. There is a negative correlation between the count rates of Si and those of other elements, which exemplifies the colloform banding in the sample. The count rates of Si are high in some of the colloform bands adjacent to the ginguro bands, but also show high concentrations within these ore-bearing bands. High count rates of K, Al, and Rb largely coincide. The element association suggests that these elements are primarily hosted by adularia, which is consistent with the results of optical microscopy. The count rates of K, Al, and Rb are very low in the ginguro bands, suggesting that adularia was not formed at the same time as the ore minerals. Within the band of lattice bladed quartz, elevated count rates of K, Al, and Rb are registered, suggesting that adularia occurs as an overgrowth on the quartz. Some of the barren colloform bands show elevated Ca counts, which are likely related to the presence of carbonate minerals. In some cases, high Ca rates were registered in bands also containing high K, Al, and Rb contents. However, the highest Ca rates are present in a band that is located immediately adjacent to one of the ginguro bands (Figure 7).
The element maps of the metals Au, Ag, Se, As, and Cu are shown in Figure 8. The occurrence of high count rates of these elements reflects the distribution of ore minerals that were not observed in the samples from the other locations. In general, elevated count rates of these elements correlate well with the macroscopically identifiable ginguro bands. Elevated Au count rates are registered for only one of the ginguro bands. Elevated concentrations also occur in some of the other bands, but Au-bearing ore minerals appear to occur only disseminated along the ginguro bands (Figure 8). There is a strong correlation between Ag and Se, suggesting that much of the Ag is contained in selenium-bearing minerals, which is confirmed by the sample petrography. Silver-bearing ore minerals occur in high concentrations in the ginguro bands with some of the highest count rates occurring in the same band as the high Au count rates. However, Ag and Se also define rare acicular grains that appear to have grown at high angle to the colloform bands. The maps show that As and Cu are also enriched in the ginguro bands, but the highest count rates of these elements are observed in different bands. Comparison between the element distribution maps illustrates that the different ginguro bands have different compositions. Some bands are enriched in Au and Ag. Other bands show elevated concentrations of Ag and Se but contain only little Au. High Cu contents broadly correlate with high Ag and Se values. The highest As count rates were registered in a ginguro band that only shows local enrichment in the other elements (Figure 8).
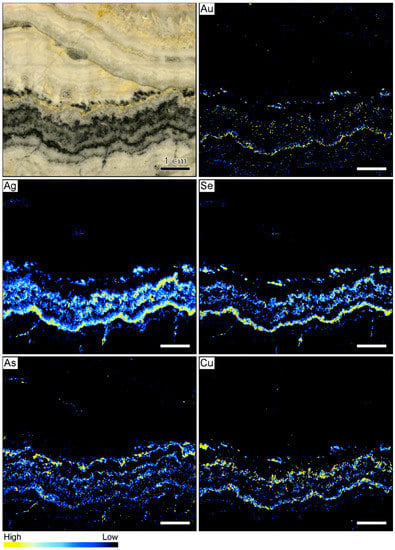
Figure 8.
Sample image and corresponding element maps of a banded quartz vein sample from the Sado Kinzan low-sulfidation epithermal deposit in Japan. The element maps were obtained by µXRF measurements. The maps highlight that ore minerals in this specimen primarily occur in ginguro bands. However, the ginguro bands have different compositions. Only one band shows elevated Au count rates, whereas most bands are Ag-rich. The scale bar is 1 cm.
The sample from the Sado Kinzan deposit is predominately composed of colloform quartz bands exhibiting mosaic textures. Precious metal-rich ginguro bands are characterized by very fine-grained mosaic quartz that locally exhibits relic 1–3 µm microspheres (Figure 9A). Although microspheres can be observed in all of the ginguro bands, the Ag-bearing ore minerals are typically in contact with small euhedral quartz crystals that form an overgrowth on aggregates of the microspherical quartz, suggesting that the ore minerals did not co-precipitate with the microspherical host. Some ginguro bands are predominantly composed of ore minerals and quartz showing a mosaic texture (Figure 9B,C). Most of the barren colloform bands in the younger set of bands are composed of mosaic quartz that is intergrown with adularia. Chalcedonic colloform bands consisting of microfibers oriented perpendicular to the bands are present. In addition to the colloform bands, bands of comb, zonal, flamboyant, and lattice-bladed quartz are common textures.
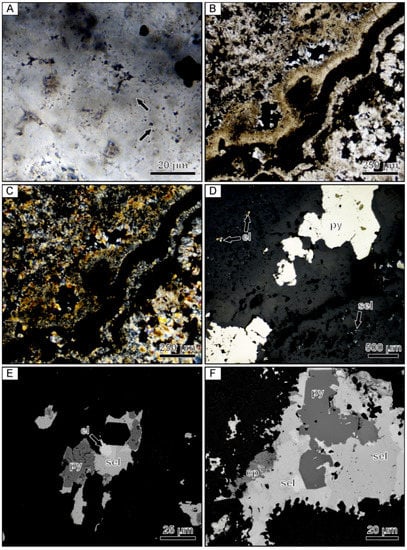
Figure 9.
Photomicrographs of a banded quartz vein sample from the Sado Kinzan low-sulfidation epithermal deposit in Japan. (A) Microspherical colloform band containing opaque Au- and Ag-bearing ore minerals. Examples of well-preserved microspheres are highlighted by the arrows. (B) Colloform banding containing abundant opaque ore minerals. (C) Crossed-polarized light image of the same field of view showing that the colloform bands are composed of mosaic quartz. (D) Reflected light image of parallel microspherical colloform bands containing abundant ore minerals and pyrite. The upper and lower bands contain dominantly fine-grained Cu- and Au-bearing phases and Ag-bearing phases, respectively. The central band contains coarse pyrite with minor electrum. (E) Backscattered electron image showing a composite grain composed of Au and Ag-bearing phases with pyrite. (F) Backscattered electron image of a coarse composite grain displaying a core of subhedral pyrite that is enveloped by a complex Ag–Se-bearing phase, which is in turn mantled by chalcopyrite. el = electrum, cp = chalcopyrite, py = pyrite, sel = Ag–Se-bearing phases.
Within the ginguro bands, S- and Se-bearing minerals and electrum occur as small (~10 µm) isolated monomineralic grains or form complex aggregates that can range up to 500 µm in size (Figure 9D–F). Composite opaque grains rarely have a core composed of a euhedral pyrite grain that is enclosed by Ag–S–Se phases, which is, in turn, overgrown by chalcopyrite. The proportion of various precious metal-bearing minerals in each band is variable, with some containing more Ag-rich minerals while others contain more electrum and chalcopyrite (Figure 9D). Electrum compositions as determined by EDX analyses were found to be variable, but Au typically occurs at higher concentrations than Ag.
4. Discussion
4.1. Silica Deposition in Ore-Bearing Bands
This study demonstrates that ore minerals in the investigated banded quartz vein samples occur in two types of colloform bands. The µXRF mapping shows that ginguro bands that are dark gray to black in color represent the main host of Ag-bearing ore minerals. These bands can be easily identified in hand specimen. The ginguro bands may contain elevated Au contents. In addition, distinct light gray to white colloform quartz bands are recognized that contain electrum or native gold but are largely devoid of other ore minerals. These bands are referred to as gankin bands in this contribution, which makes reference to their Au-rich nature.
Careful optical petrography revealed that the ginguro and gankin bands have microtextural characteristics that differ from other quartz bands in the banded veins. The ore minerals in the samples from the three investigated deposits are contained in fine-grained colloform quartz bands that exhibit mosaic textures in crossed-polarized light. The mosaic texture consists of anhedral quartz grains with irregular and interpenetrating grain boundaries. In plane-polarized light, these colloform bands show rare 1–3 µm relic microspheres and globular aggregates consisting of fused microspheres. The presence of relic microsphere textures in ore-bearing colloform quartz bands has been previously documented at McLaughlin in California [25] and Buckskin National in Nevada [26].
Taksavasu et al. [26] proposed that microspherical colloform quartz in banded quartz veins from low-sulfidation epithermal deposits was originally composed of a noncrystalline silica precursor phase. Similar textural relationships have been recorded from young silica sinters formed around hot springs [27,28,29,30,31,32,33]. Noncrystalline silica also forms as a scaling in geothermal power plants [34,35], sometimes exhibiting microspherical textures [36]. Saunders [37,38] suggested that the ore-bearing colloform bands in low-sulfidation epithermal veins were originally gel-like at the time of deposition, explaining textures that resemble soft-sediment textures caused by hydraulic shaping and gravity-induced sagging of the soft silica deposits. Textural evidence supporting a gel-like nature of the microspherical silica deposits was identified at Hollister in Nevada [14,39,40], Koryu in Japan [12], Republic in Washington [39], Sleeper in Nevada, [37,38], and Silver City in Idaho [41].
Studies on silica sinters [28,31,32,42,43,44] and siliceous sediments [45,46,47,48] have shown that opal-A is thermodynamically unstable and matures over time. The maturation process involves the transformation of opal-A into opal-CT, which in turn recrystallizes into opal-C and then into microcrystalline quartz. Recrystallization of the noncrystalline silica precursor is interpreted to have been completed in the samples investigated, as only anisotropic quartz was observed in the ginguro and gankin bands studied. This is consistent with the findings of Lovering [49], showing that complete recrystallization of noncrystalline silica results in quartz having a mosaic texture. The maturation of opal-A originally present in the veins likely occurred during the evolution of the hydrothermal system following silica deposition. Laboratory studies show that the transformation from opal-A to quartz may take place within days to months under hydrothermal conditions [50,51,52].
The observation that ginguro and gankin bands show distinct microtextural characteristics suggests that the ore-bearing bands were formed by unique processes. The original presence of a noncrystalline silica precursor in these bands suggests that silica deposition occurred as a result of supersaturation (with respect to quartz), which could have been achieved due to vigorous boiling or flashing of the thermal waters [26,37,38,53,54]. Vigorous boiling or flashing events in geothermal systems can be seismically triggered [55] and result in the formation of hydrothermal eruptions on surface [56,57,58,59].
Vigorous boiling or flashing of the thermal waters could also explain the presence of a high proportion of ore minerals in the ginguro and gankin bands. Vaporization of thermal liquids results in the precipitation of metals due to the loss of dissolved H2S into the vapor phase [60,61,62,63,64]. Analogous processes can be observed in geothermal power plants where metal precipitation in response to a sharp pressure drop occurs at the point of flashing in the wellhead. Sulfide scales formed as a result of flashing are composed of chalcopyrite, galena, sphalerite, magnetite, and pyrite [35,36,61,63,65]. The scales can contain high concentrations of Au and Ag [36,61,65]. Theoretical considerations by Sanchez-Alfaro et al. [66] confirm that flashing is an effective mechanism for Au precipitation.
In addition to silica deposition and the precipitation of metals, vigorous boiling or flashing could also be responsible for the deposition of adularia, which forms dendritic aggregates in the banded vein from Midas. The gas loss associated with vigorous boiling or flashing causes a shift in the stability from illite to adularia, triggering deposition of this mineral from solution [67,68,69,70,71].
The microtextural characteristics of the ginguro and gankin bands differ significantly from other quartz bands present in the samples investigated, which appear to be essentially barren. Zeeck [15] first reported that the banded veins from Hokuryu commonly contain colloform bands that show a chalcedonic texture consisting of microcrystalline fibrous quartz. Chalcedony is common in banded veins and has been reported from a number of low-sulfidation epithermal deposits [72,73,74]. The texture consists of rhythmic bands composed of radiating chalcedonic fibers that are oriented perpendicular to the substrate on which the bands have developed. The outermost bands form botryoidal surfaces in open space. Flamboyant extinction patterns are common in chalcedonic colloform bands [72,74]. As first pointed out by Camprubí and Albinson [11], the term chalcedony-ginguro used by Corbett [75] appears to be a misnomer. In the samples investigated, ginguro bands do not contain microcrystalline fibrous quartz.
Moreover, the chalcedonic colloform bands do not contain ore minerals and do not have a dark gray to black color. Fournier [76] pointed out that chalcedony is formed at lower degrees of silica supersaturation (with respect to quartz) than noncrystalline silica and commonly controls silica solubility at temperatures below 90 °C to 140 °C, and sometimes as high as 180 °C. Colloform bands with a noncrystalline silica precursor and chalcedonic colloform bands are formed at different conditions and processes [15].
4.2. Compositional Variations in Ore-Bearing Bands
The present study demonstrates that the composition of ore-bearing colloform quartz bands within a single banded quartz vein can be highly variable, raising the question as to which processes are responsible for these compositional variations and the apparent decoupling of Au, Ag, and other metals. Based on the available evidence, several different models can be invoked.
The banded quartz veins in low-sulfidation epithermal deposits represent transient high-flux conduits that open episodically throughout the lifetime of the ore-forming geothermal system [55]. For instance, Sanematsu et al. [10] showed that silica precipitation resulting in the formation of the Hosen-1 vein at the Hishikari deposit in Japan occurred over a duration of ~260,000 years, with periods of vein formation being separated by intervals as long as ~30,000 to ~110,000 years [10]. The duration of vein formation at Hishikari is comparable to the lifespans of modern geothermal systems [77,78,79]. Given these long lifespans, it appears possible that the metal supply to the geothermal system changes over time [80], which could translate to variations in the composition of adjacent ore-bearing colloform quartz bands in vein samples.
Potential variations in the composition of the ore-forming liquids could be related to the episodic influx of magmatic-hydrothermal fluids derived from intrusions. Although low-sulfidation epithermal deposits are primarily formed from deeply circulated meteoric waters [3], small magmatic contributions from a degassing magma chamber could contribute significantly to the metal content of the ore-forming liquids. In situ oxygen isotope analysis by secondary ion mass spectrometry on banded vein material from the Sleeper deposit in Nevada revealed that δ18O values in the quartz increase towards Au-rich bands with the quartz in these bands with values of 8.6‰ to 13.7‰ [14]. Saunders et al. [14] suggested that the oxygen isotopy of the quartz in these Au-rich bands is best explained by an incursion of magmatic water into the geothermal system. This conclusion is supported by stable isotope data collected on thermal waters from active geothermal systems of the Taupo Volcanic Zone in New Zealand. The data lie close to the meteoric water line but show a small positive 18O shift that can be attributed to a minor (up to ~10%) contribution of magmatic water [80,81]. Simmons et al. [80] proposed that the highest concentrations and fluxes of Au, Ag, Cu, and Te in the geothermal systems of the Taupo Volcanic Zone can be related to such an input of magmatic-hydrothermal fluids.
The study of low-sulfidation epithermal deposits has shown that mineral deposition in the epithermal environment can occur by three processes, namely cooling, boiling, and flashing of the thermal chloride waters [37,64,66,71]. Each of these processes may be responsible for, or contribute to, the observed compositional difference between adjacent ore-bearing colloform quartz bands and the apparent decoupling of Au, Ag, and other metals.
Brown and Simmons [82] and Simmons and Brown [83] demonstrated that the precious metal concentrations in deep thermal waters in the geothermal systems of the Taupo Volcanic Zone in New Zealand range from <0.1 to 23 ppb Au and 2.7 to 2400 ppb Ag at temperatures between 195 °C to 322 °C. In most deep thermal water samples, Au is undersaturated by an order of magnitude compared to theoretical aqueous Au concentrations, whereas Ag is undersaturated or close to its saturation limit [80]. Solubility experiments and thermodynamic modeling constrain how metal solubility in these thermal waters changes in response to cooling in the upflow zone of geothermal systems [81,84,85,86,87]. Cooling of the near-neutral thermal waters results in a reduction of Au solubility, with the Au being dominantly transported as [Au(HS)2]−. Sanchez-Alfaro et al. [66] demonstrated that a temperature decrease of 160 °C from the reservoir temperature results in the deposition of 95% of the Au.
In contrast, thermodynamic modeling showed that cooling of low-salinity thermal waters causes only a minor decrease in Ag solubility, assuming that Ag sulfides are the main host of this precious metal [86]. Stefánsson and Seward [86] demonstrated that ~70% of the dissolved Ag in thermal waters occurs as Ag(HS)0 whereas ~30% is accounted for by [Au(HS)2]−. The solubility of Ag sulfides with respect to Ag(HS)0 is almost temperature independent [86]. As a consequence of the different temperature-dependencies on metal solubility, fluctuations in temperature of the mineralizing thermal waters could result in variations in the Au and Ag contents of the ore-bearing colloform quartz bands. Variations in temperature throughout the vein formation could occur in response to changes in flow velocity and/or mixing of the thermal liquid with groundwater along the flow path [64,88].
However, textural evidence suggests that many, if not all, ore-bearing colloform quartz bands formed during intermittent periods of vigorous boiling or flashing, not a process of simple cooling. The near-instantaneous vaporization of the thermal waters most likely accounts for the apparent decoupling of metals and the formation of ore-bearing colloform bands having variable metal signatures. Vigorous boiling or flashing of thermal waters results in metal supersaturation in the remaining liquid and the formation of submicroscopic particles [80] or colloidal solutions [37,89]. The site at which metal particles are formed may be distinctly different from the site of ore mineral formation as the metal-bearing solutions will be transported up the vein by the high-velocity two-phase flow associated with vigorous boiling or flashing. The depth to which vaporization occurs is most likely different for each event of vigorous boiling or flashing, resulting in vaporization of thermal waters having different temperatures and precious metal concentrations. The occurrence of such dynamic processes of metal deposition in low-sulfidation epithermal deposits is supported by the observations of Christenson and Hayba [63] at Kawerau in New Zealand. At this geothermal power plant, initial metal precipitation occurred at depth in the feed zones of the production wells, and metals were subsequently swept to the surface by the strong flow in the well, resulting in the formation of banded siliceous precipitates in wellhead silencers.
4.3. Formation of Ore Minerals in Ore-Bearing Bands
Modeling of isothermal vapor loss at 230 °C by Christenson and Hayba [63] showed that different ore minerals are deposited from thermal waters at different degrees of vaporization, which could contribute to the observed compositional differences between adjacent ore-bearing colloform quartz bands. The degree of vaporization will change rapidly as vaporstatic conditions in the fracture or fault hosting the vein propagate to depth. Christenson and Hayba [63] showed that sphalerite and pyrite precipitation starts with the onset of vaporization of the liquid. Sphalerite is stable throughout the process of vaporization, whereas pyrite is replaced by chalcopyrite at ~3 wt. % vapor loss. Chalcopyrite is replaced by bornite and then chalcocite at 47 wt. % and 70 wt. % vapor loss, respectively. Galena saturates at 3 wt. % vapor loss and continues to precipitate throughout the process of vaporization. Christenson and Hayba [63] also demonstrated that Au precipitation starts at ~6 wt. % vapor loss and continues to 90 wt. % vapor loss. The highest grade ore is formed during the early stage of vapor loss (~10 wt. %), but more extensive (20–40 wt. %) vapor loss is required to produce the precipitation of large amounts of Au [63].
It is envisaged here that the microspherical silica in the ginguro and gankin bands record events of vigorous boiling or flashing within the vein. During each event of vigorous boiling or flashing, the location of the vaporstatic conditions propagates towards depth, and repeated events reach towards different depths in the vein. During vigorous boiling or flashing, the silica is deposited from the residual liquid within the two-phase flow. Metal precipitation may have occurred together with silica deposition. This is especially true for ore mineral grains present in the so-called sluice-box textures in which ore minerals intermixed with silica were deposited around protrusions of the vein walls forming a thin layer over the tops of the protrusion and a thick deposit on the leeward side [14,39,40,41]. This texture has not been observed in the limited number of samples investigated in this study. However, many of the ore mineral grains in the samples studied appear to have grown within the bands of microspherical silica, presumably as the matrix was gel-like and yielding. In contrast, the large aggregates of composite ore minerals appear to have grown into open spaces between silica microspheres, as suggested by the presence of euhedral quartz overgrowths separating the ore minerals from the microspherical matrix. Metal deposition within the silica bands likely also occurred from the liquid under conditions of two-phase flow, with much of the vapor streaming occurring in the center of the open vein potentially forming an annular flow (Figure 10). Metal supersaturation in the liquid flowing through the pore space between the silica microspheres may have been achieved by vapor loss from the liquid. Different ore minerals were formed at different times and locations depending on the temperature of the residual liquid and the degree of vaporization. Continued recharge of buoyant liquid from depth ensures continuous metal supply allowing deposition of comparably large amounts of metals within the ginguro and gankin bands.
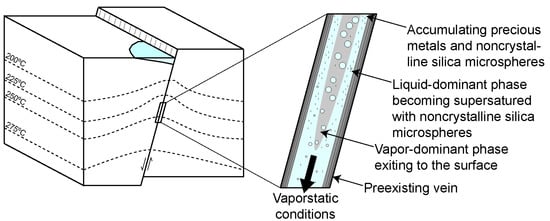
Figure 10.
Model showing how the deposition of silica and the accumulation of precious metals could occur during an event of vigorous boiling or flashing. Two-phase liquid and vapor flow occurs along the fault, with vaporstatic conditions propagating down the fault. Annular flow develops as a result of the vaporization of the liquid. Deposition of noncrystalline silica takes place from the remaining liquid. Ore mineral dendrites grow within the matrix of silica microspheres from the liquid as a result of the vapor loss.
4.4. Design of Textural and Microanalytical Studies
Because gankin bands cannot be macroscopically distinguished from colloform bands that are barren, targeted sampling of the gankin bands for geometallurgical or scientific investigations aimed at identifying the ore mineralogy of low-sulfidation epithermal veins ranging up to several meters in thickness is essentially impossible without the help of element distribution maps. As µXRF mapping can be conducted at relatively low cost, it is suggested here to scan transects across banded veins to guide subsampling routinely. Without application of this technique, subsampling will be invariably biased, limiting the understanding of the mineralogical sequestration of Au.
Over the course of this study, it also proved useful to scan billets of thin sections to guide detailed petrographic work on the gankin bands. As the excitation volume of the µXRF analysis is comparably large, electrum or native gold grains can be detected that are not exposed on the surface. This is in contrast to reflected light microscopy or backscattered electron imaging where identification of electrum or native gold in the gankin bands is limited to exposed grains. Depending on the abundance of precious metal grains, the size of these grains, and the degree of plucking caused during thin section preparation, gankin bands can be challenging to identify optically. The element distribution maps obtained on billets proved to be invaluable to allow rapid identification of the exact locations of gankin bands in thin section, which could then be inspected in greater detail at high magnification until electrum or native gold grains were found.
4.5. Exploration Implications
This study demonstrates that the distribution of precious metals in banded veins from low-sulfidation epithermal deposits can be effectively mapped by µXRF, providing valuable information that cannot be obtained by macroscopic study of the veins. Ginguro bands that can easily be identified macroscopically appear to be the primary host of Ag-bearing ore minerals such as naumannite, aguilarite, acanthite, and pyrargyrite as well as other sulfide phases such as chalcopyrite, marcasite, galena, pyrite, or sphalerite. Ginguro bands may contain significant Au contents. However, the µXRF mapping revealed that the Au content in the ginguro bands can be variable within a given hand specimen and between different deposits. In some cases, significant Au enrichment is encountered in light gray to white gankin bands that are macroscopically indistinguishable from barren bands of colloform quartz. This has significant implications for exploration as the presence or absence of ginguro bands may not be used to predict Au grade in hand specimen reliably. For instance, the investigated sample from the Hokuryu deposit in Hokkaido contains only very thin ginguro bands, but grades 10.7 g/t Au and 107 g/t Ag [15]. The Au is not located within these ginguro bands. Based on its macroscopic characteristics, the sample could easily not have been assayed.
5. Conclusions
Ginguro and gankin bands contained in banded quartz veins of low-sulfidation epithermal deposits are characterized by unique microtextural characteristics. These bands are composed of fine-grained quartz that has a mosaic texture under crossed-polarized light, with many of the bands exhibiting relic microspheres. The occurrence of relic microspheres provides evidence that the ginguro and gankin bands originally contained a noncrystalline silica precursor that subsequently recrystallized to quartz. The microtextures of the ginguro and gankin bands are interpreted to reflect conditions of rapid deposition of silica caused by vigorous boiling or flashing of the thermal waters. Many of the ore mineral grains, most notably those forming larger intergrown aggregates, appear to have grown within the matrix of yielding silica microspheres. In contrast, barren bands of quartz lack relic microspheres and probably formed by different processes, including the cooling of the thermal waters. Although not all precious metals are hosted in ginguro and gankin bands, these bands account for much of the grade.
The µXRF investigations of this study demonstrate that ginguro and gankin bands can have distinctly different compositions. The macroscopically identifiable ginguro bands are the principal host to Ag-rich phases, but may also contain other ore minerals. The Au content of these bands can be variable. In contrast, gankin bands contain electrum or native gold with few other ore minerals present. Macroscopically, gankin bands cannot be easily distinguished from barren quartz bands. The µXRF maps show that the distribution of Au in vein samples does not necessarily correlate with the presence of ginguro bands. This has important implications for the design of geometallurgical or scientific investigations aiming to determine the mineralogy of the ores through representative subsampling of vein material and the preparation of thin sections as well as grade estimation in exploration.
The formation of compositionally distinct ginguro and gankin bands in low-sulfidation epithermal ores can be explained by several alternative models, and future research is required to test which of these models is most suited to explain compositional variations between the ore-bearing bands. Possible explanations include variations in the composition of the thermal waters forming these bands throughout the lifetime of the hydrothermal system and fluctuations in the temperature of the thermal fluids precipitating ore minerals at a given location. However, most likely, compositional variations and the apparent decoupling of Au, Ag, and other metals can be related to variable degrees of vapor loss during vigorous boiling or flashing of the thermal waters.
Supplementary Materials
The following are available online at https://www.mdpi.com/2075-163X/9/12/740/s1, Figure S1: EDX spectra with associated µXRF map exported from data collected by the Bruker M4 Tornado, Figure S2: Spot EDX spectra with associated µXRF map collected by the Bruker M4 Tornado.
Author Contributions
L.Z. and T.M. conducted the sampling at the Hokuryu deposits of northern Hokkaido in Japan. N.M.K. and T.M. designed the analytical plan. E.R.T. and L.Z. conducted the microanalytical work under supervision of N.M.K. and K.P. Optical petrography was conducted by E.R.T., L.Z., and T.J.R. The results of the study were jointly discussed by all authors. E.R.T., T.M., and L.Z. wrote the manuscript. T.J.R., K.P., and N.M.K. edited an earlier version of the manuscript.
Funding
E.R.T. acknowledges financial support by Equinox Gold. Irving Resources financially supported fieldwork in Hokkaido and supported L.Z. during the course of this study.
Acknowledgments
We thank Quinton Hennigh for providing access to sample material from the Sado Kinzan deposit in Japan. Subaru Tsuruoka is acknowledged for fruitful discussions on the geological setting of low-sulfidation epithermal deposits in Japan. Jae Erickson is thanked for thin section preparation. This research would not have been possible without Bruker Nano Analytics providing access to the M4 Tornado µXRF. We acknowledge two anonymous reviewers for their constructive reviews which helped us improve an earlier version of the manuscript.
Conflicts of Interest
The authors declare no conflict of interest.
References
- Lipson, R. The promise and perils of porphyry deposits in the future of gold production. SEG Newsl. 2014, 98, 14–21. [Google Scholar]
- Hedenquist, J.W.; Arribas, A.; Gonzalez-Urien, E. Exploration for epithermal gold deposits. Rev. Econ. Geol. 2000, 13, 245–277. [Google Scholar]
- Simmons, S.F.; White, N.C.; John, D.A. Geological characteristics of epithermal precious and base metal deposits. In Economic Geology 100th Anniversary Volume; Hedenquist, J.W., Thompson, J.F.H., Goldfarb, R.J., Richards, J.P., Eds.; Society of Economic Geologists: Littleton, CO, USA, 2005; pp. 485–522. [Google Scholar]
- Bodnar, R.J.; Lecumberri-Sanchez, P.; Moncada, D.; Steele-MacInnis, M. Fluid inclusions in hydrothermal ore deposits. In Treatise on Geochemistry; Holland, H.D., Turekian, K.K., Eds.; Elsevier: Oxford, UK, 2014; pp. 119–142. [Google Scholar]
- Takeuchi, K.; Shikazono, N. Mineralization of the Arakawa No. 4 vein of the Kushikino mine, Kagoshima Prefecture, Japan. Mining Geol. 1984, 34, 187–195. [Google Scholar]
- Matsuhisa, Y.; Aoki, M. Temperature and oxygen isotope variations during formation of the Hishikari epithermal gold-silver veins, southern Kyushu, Japan. Econ. Geol. 1994, 89, 1608–1613. [Google Scholar] [CrossRef]
- Shimizu, T.; Matsueda, H.; Ishiyama, D.; Matsubaya, O. Genesis of epithermal Au–Ag mineralization of the Koryu mine, Hokkaido, Japan. Econ. Geol. 1998, 93, 303–325. [Google Scholar] [CrossRef]
- Faure, K.; Matsuhisa, Y.; Metsugi, H.; Mizota, C.; Hayashi, S. The Hishikari Au–Ag epithermal deposit, Japan: Oxygen and hydrogen isotope evidence in determining the source of paleohydrothermal fluids. Econ. Geol. 2002, 97, 481–498. [Google Scholar] [CrossRef]
- Leavitt, E.D.; Spell, T.L.; Goldstrand, P.M.; Arehart, G.B. Geochronology of the Midas low-sulfidation epithermal gold-silver deposit, Elko County, Nevada. Econ. Geol. 2004, 99, 1665–1686. [Google Scholar] [CrossRef]
- Sanematsu, K.; Watanabe, K.; Duncan, R.A.; Izawa, E. The history of vein formation determined by 40Ar/39Ar dating of adularia in the Hosen-1 vein at the Hishikari epithermal gold deposit, Japan. Econ. Geol. 2006, 101, 685–698. [Google Scholar] [CrossRef]
- Camprubí, A.; Albinson, T. Epithermal deposits in México—Update of current knowledge, and an empirical reclassification. Geol. Soc. Am. Spec. Pap. 2007, 422, 377–415. [Google Scholar]
- Shimizu, T. Reinterpretation of quartz textures in terms of hydrothermal fluid evolution at the Koryu Au-Ag deposit, Japan. Econ. Geol. 2014, 109, 2051–2065. [Google Scholar] [CrossRef]
- Mukaiyama, H. On some gold-silver ores from the Sado mine, Sado Island, Niigata Prefecture, Japan. J. Geol. Soc. Jpn. 1950, 56, 181–187. [Google Scholar] [CrossRef]
- Saunders, J.A.; Unger, D.L.; Kamenov, G.D.; Fayek, M.; Hames, W.E.; Utterback, W.C. Genesis of Middle Miocene Yellowstone hotspot-related bonanza epithermal Au–Ag deposits, northern Great Basin, USA. Miner. Depos. 2008, 43, 715–734. [Google Scholar] [CrossRef]
- Zeeck, L. The Role of Flashing in the Formation of High-Grade, Low-Sulfidation Epithermal Deposits: A Case Study from the Omu Camp in Hokkaido, Japan. Master’s Thesis, Colorado School of Mines, Golden, CO, USA, August 2018. [Google Scholar]
- Izawa, E.; Urashima, Y.; Ibaraki, K.; Suzuki, R.; Yokoyama, T.; Kawasaki, K.; Koga, A.; Taguchi, S. The Hishikari gold deposit: High-grade epithermal veins in Quaternary volcanics of southern Kyushu, Japan. J. Geochem. Explor. 1990, 36, 1–56. [Google Scholar] [CrossRef]
- Shimada, N.; Nakamura, T.; Morinaga, Y.; Shikama, Y. Invisible gold from the Hishikari epithermal gold deposit, Japan: Implication for gold distribution and deposition. Resour. Geol. 2005, 55, 91–100. [Google Scholar] [CrossRef]
- Suzuki, M.; Konoya, M.; Fujiwara, T. Explanatory text of the Geological Map of Japan (Scale 1:50,000): Omu (Abashiri-6); Geological Survey of Hokkaido: Sapporo, Japan, 1966. [Google Scholar]
- Watanabe, Y. A tectonic model for epithermal Au mineralization in NE Hokkaido, Japan. Resour. Geol. Spec. Issue 1995, 18, 257–269. [Google Scholar]
- Goldstrand, P.M.; Schmidt, K.W. Geology, mineralization, and ore controls at the Ken Snyder gold-silver mine, Elko County, Nevada. In Geology and Ore Deposits 2000: The Great Basin and Beyond; Cluer, J.K., Price, J.G., Struhsacker, E.M., Hardyman, R.F., Morris, C.L., Eds.; Geological Society of Nevada: Reno, NV, USA, 2000; pp. 265–287. [Google Scholar]
- John, D.A.; Vikre, P.G.; du Bray, E.A.; Blakely, R.J.; Fey, D.L.; Rockwell, B.W.; Mauk, J.L.; Anderson, E.D.; Graybeal, F.T. Descriptive Models for Epithermal Gold-Silver Deposits; USGS Scientific Investigation Report 2010-5070-Q; United States Government Publishing Office: Washington, DC, USA, 2018; p. 247.
- Shikazono, N.; Tsunakawa, H. K-Ar ages of Hosokura Pb-Zn and Sado Au-Ag vein-type deposits, north eastern part of Japan. Mining Geol. 1982, 32, 479–482. [Google Scholar]
- Bunno, M. Hessite from the Sado mine, Niigata Prefecture, Japan. Min. Geol. 1971, 21, 301–305. [Google Scholar]
- Shikazono, N.; Nakata, M.; Shimizu, M. Geochemical, mineralogic and geologic characteristics of Se- and Te-bearing epithermal gold deposits in Japan. Min. Geol. 1990, 40, 337–352. [Google Scholar]
- Sherlock, R.L.; Lehrman, N.J. Occurrences of dendritic gold at the McLaughlin mine hot-spring gold deposit. Miner. Depos. 1995, 30, 323–327. [Google Scholar] [CrossRef]
- Taksavasu, T.; Monecke, T.; Reynolds, T.J. Textural characteristics of noncrystalline silica in sinters and quartz veins: Implications for the formation of bonanza veins in low-sulfidation epithermal deposits. Minerals 2018, 8, 331. [Google Scholar] [CrossRef]
- Jones, B.; Renaut, R.W.; Rosen, M.R. Biogenicity of silica precipitation around geysers and hot-spring vents, North Island, New Zealand. J. Sediment. Res. 1997, 67, 88–104. [Google Scholar]
- Herdianita, N.R.; Browne, P.R.L.; Rodgers, K.A.; Campbell, K.A. Mineralogical and textural changes accompanying ageing of silica sinter. Miner. Depos. 2000, 35, 48–62. [Google Scholar] [CrossRef]
- Campbell, K.A.; Rodgers, K.A.; Brotheridge, J.M.A.; Browne, P.R.L. An unusual modern silica-carbonate sinter from Pavlova spring, Ngatamariki, New Zealand. Sedimentology 2002, 49, 835–854. [Google Scholar] [CrossRef]
- Guidry, S.A.; Chafetz, H.S. Anatomy of siliceous hot springs: Examples from Yellowstone National Park, Wyoming, USA. Sediment. Geol. 2003, 157, 71–106. [Google Scholar] [CrossRef]
- Lynne, B.Y.; Campbell, K.A. Morphologic and mineralogic transitions from opal-A to opal-CT in low-temperature siliceous sinter diagenesis, Taupo Volcanic Zone, New Zealand. J. Sediment. Res. 2004, 74, 561–579. [Google Scholar] [CrossRef]
- Rodgers, K.A.; Browne, P.R.L.; Buddle, T.F.; Cook, K.L.; Greatrex, R.A.; Hampton, W.A.; Herdianita, N.R.; Holland, G.R.; Lynne, B.Y.; Martin, R.; et al. Silica phases in sinters and residues from geothermal fields of New Zealand. Earth Sci. Rev. 2004, 66, 1–61. [Google Scholar] [CrossRef]
- Fernandez-Turiel, J.L.; Garcia-Valles, M.; Gimeno-Torrente, D.; Saavedra-Alonso, J.; Martinez-Manent, S. The hot spring and geyser sinters of El Tatio, northern Chile. Sediment. Geol. 2005, 180, 125–147. [Google Scholar] [CrossRef]
- Skinner, B.J.; White, D.E.; Rose, H.J.; Mays, R.E. Sulfides associated with the Salton Sea geothermal brine. Econ. Geol. 1967, 62, 316–330. [Google Scholar] [CrossRef]
- Karabelas, A.J.; Andritsos, N.; Mouza, A.; Mitrakas, M.; Vrouzi, F.; Christanis, K. Characteristics of scales from the Milos geothermal plant. Geothermics 1989, 18, 169–174. [Google Scholar] [CrossRef]
- Reyes, A.G.; Trompetter, W.J.; Britten, K.; Searle, J. Mineral deposits in the Rotokawa geothermal pipelines, New Zealand. J. Volcanol. Geotherm. Res. 2002, 119, 215–239. [Google Scholar] [CrossRef]
- Saunders, J.A. Colloidal transport of gold and silica in epithermal precious-metal systems: Evidence from the Sleeper deposit, Nevada. Geology 1990, 18, 757–760. [Google Scholar] [CrossRef]
- Saunders, J.A. Silica and gold textures in bonanza ores of the Sleeper deposit, Humboldt County, Nevada: Evidence for colloids and implications for epithermal ore-forming processes. Econ. Geol. 1994, 89, 628–638. [Google Scholar] [CrossRef]
- Saunders, J.A.; Beasley, L.; Vikre, P.; Unger, D.L. Colloidal and physical transport textures exhibited by electrum and naumannite in bonanza epithermal veins from western USA, and their significance. In Great Basin Evolution and Metallogeny, Proceedings of Geological Society of Nevada 2010 Symposium, Reno-Sparks, NV, USA, 14–22 May 2010; Steininger, R.C., Pennell, B., Eds.; Geological Society of Nevada: Reno-Sparks, NV, USA, 2011; pp. 825–831. [Google Scholar]
- Unger, D.L. Geochronology and geochemistry of mid-Miocene bonanza low-sulfidation epithermal ores of the northern Great Basin, USA. Master’s Thesis, Auburn University, Auburn, AL, USA, May 2008. [Google Scholar]
- Aseto, C.O. Geology, geochemistry and geochronology of the mid-Miocene, low-sulfidation epithermal gold-silver ores on War Eagle Mountain, Silver City district, Idaho. Master’s Thesis, Auburn University, Auburn, AL, USA, August 2012. [Google Scholar]
- Campbell, K.A.; Sannazzaro, K.; Rodgers, K.A.; Herdianita, N.R.; Browne, P.R.L. Sedimentary facies and mineralogy of the late Pleistocene Umukuri silica sinter, Taupo Volcanic Zone, New Zealand. J. Sediment. Res. 2001, 71, 727–746. [Google Scholar] [CrossRef]
- Lynne, B.Y.; Campbell, K.A.; Moore, J.N.; Browne, P.R.L. Diagenesis of 1900-year-old siliceous sinter (opal-A to quartz) at Opal Mound, Roosevelt Hot Springs, Utah, USA. Sediment. Geol. 2005, 179, 249–278. [Google Scholar] [CrossRef]
- Lynne, B.Y.; Campbell, K.A.; James, B.J.; Browne, P.R.L.; Moore, J. Tracking crystallinity in siliceous hot-spring deposits. Am. J. Sci. 2007, 307, 612–641. [Google Scholar] [CrossRef]
- Mitzutani, S. Silica minerals in the early stage of diagenesis. Sedimentology 1970, 15, 419–436. [Google Scholar] [CrossRef]
- Murata, K.J.; Nakata, J.K. Cristobalitic stage in the diagenesis of diatomaceous shale. Science 1974, 184, 567–568. [Google Scholar] [CrossRef]
- Murata, K.J.; Friedman, I.; Gleason, J.D. Oxygen isotope relations between diagenetic silica minerals in Monterey Shale, Temblor Range, California. Am. J. Sci. 1977, 277, 259–272. [Google Scholar] [CrossRef]
- Mustoe, G.E. Diatomaceous origin of siliceous shale in Eocene lake beds of central British Columbia. Can. J. Earth Sci. 2005, 42, 231–241. [Google Scholar] [CrossRef]
- Lovering, T.G. Jasperoid in the United States—Its Characteristics, Origin, and Economic Significance; USGS Professional Paper 710; United States Government Publishing Office: Washington, DC, USA, 1972; p. 164.
- Ernst, W.G.; Calvert, S.E. An experimental study of the recrystallization of porcelanite and its bearing on the origin of some bedded cherts. Am. J. Sci. 1969, 267-A, 114–133. [Google Scholar]
- Bettermann, P.; Liebau, F. The transformation of amorphous silica to crystalline silica under hydrothermal conditions. Contrib. Mineral. Petr. 1975, 53, 25–36. [Google Scholar] [CrossRef]
- Oehler, J.H. Hydrothermal crystallization of silica gel. Geol. Soc. Am. Bull. 1976, 87, 1143–1152. [Google Scholar] [CrossRef]
- Moncada, D.; Mutchler, S.; Nieto, A.; Reynolds, T.J.; Rimstidt, J.D.; Bodnar, R.J. Mineral textures and fluid inclusion petrography of the epithermal Ag–Au deposits at Guanajuato, Mexico: Application to exploration. J. Geochem. Explor. 2012, 114, 20–35. [Google Scholar] [CrossRef]
- Saunders, J.A.; Burke, M. Formation and aggregation of gold (electrum) nanoparticles in epithermal ores. Minerals 2017, 7, 163. [Google Scholar] [CrossRef]
- Rowland, J.V.; Simmons, S.F. Hydrologic, magmatic, and tectonic controls on hydrothermal flow, Taupo Volcanic Zone, New Zealand: Implications for the formation of epithermal vein deposits. Econ. Geol. 2012, 107, 427–457. [Google Scholar] [CrossRef]
- Muffler, L.J.P.; White, D.E.; Truesdell, A.H. Hydrothermal explosion craters in Yellowstone National Park. Geol. Soc. Am. Bull. 1971, 82, 723–740. [Google Scholar] [CrossRef]
- Nairn, I.A.; Wiradiradja, S. Late Quaternary hydrothermal explosion breccias at Kawerau geothermal field, New Zealand. Bull. Volcanol. 1980, 43, 1–13. [Google Scholar] [CrossRef]
- Hedenquist, J.W.; Henley, R.W. Hydrothermal eruptions in the Waiotapu geothermal system, New Zealand: Their origin, associated breccias, and relation to precious metal mineralization. Econ. Geol. 1985, 80, 1640–1668. [Google Scholar] [CrossRef]
- Marini, L.; Principe, C.; Chiodini, G.; Cioni, R.; Fytikas, M.; Marinelli, G. Hydrothermal eruptions of Nisyros (Dodecanese, Greece). Past events and present hazard. J. Volcanol. Geotherm. Res. 1993, 56, 71–94. [Google Scholar] [CrossRef]
- Weissberg, B.G. Gold-silver ore-grade precipitates from New Zealand thermal waters. Econ. Geol. 1969, 64, 95–108. [Google Scholar] [CrossRef]
- Brown, K.L. Gold deposition from geothermal discharges in New Zealand. Econ. Geol. 1986, 81, 979–983. [Google Scholar] [CrossRef]
- Krupp, R.E.; Seward, T.M. The Rotokawa geothermal system, New Zealand: An active epithermal gold-depositing environment. Econ. Geol. 1987, 82, 1109–1129. [Google Scholar] [CrossRef]
- Christenson, B.W.; Hayba, D.O. Hydrothermal eruptions in ore forming reservoirs: Analogues and models. In Exploring the Rim, Proceedings of the PACRIM Congress, Auckland, New Zealand, 19–22 November 1995; Australasian Institute of Mining and Metallurgy: Melbourne, Australia, 1995; pp. 119–124. [Google Scholar]
- Simmons, S.F.; Browne, P.R.L. Hydrothermal minerals and precious metals in the Broadlands-Ohaaki geothermal system: Implications for understanding low-sulfidation epithermal environments. Econ. Geol. 2000, 95, 971–999. [Google Scholar] [CrossRef]
- Hardardóttir, V.; Hannington, M.; Hedenquist, J.; Kjarsgaard, I.; Hoal, K. Cu-rich scales in the Reykjanes geothermal system, Iceland. Econ. Geol. 2010, 105, 1143–1155. [Google Scholar] [CrossRef]
- Sanchez-Alfaro, P.; Reich, M.; Driesner, T.; Cembrano, J.; Arancibia, G.; Pérez-Flores, P.; Heinrich, C.A.; Rowland, J.; Tardani, D.; Lange, D.; et al. The optimal windows for seismically-enhanced gold precipitation in the epithermal environment. Ore Geol. Rev. 2016, 79, 463–473. [Google Scholar] [CrossRef]
- Browne, P.R.L.; Ellis, A.J. The Ohaki-Broadlands hydrothermal area, New Zealand: Mineralogy and related geochemistry. Am. J. Sci. 1970, 269, 97–131. [Google Scholar] [CrossRef]
- Hedenquist, J.W. The thermal and geochemical structure of the Broadlands-Ohaaki geothermal system, New Zealand. Geothermics 1990, 19, 151–185. [Google Scholar] [CrossRef]
- Dong, G.; Morrison, G.W. Adularia in epithermal veins, Queensland: Morphology, structural state and origin. Miner. Depos. 1995, 30, 11–19. [Google Scholar] [CrossRef]
- Shimizu, T. Elemental analysis of bonanza ores of the Ryosen veins, Hishikari epithermal Au-Ag deposit, Japan, using micro X-ray fluorescence (µ-XRF). Bull. Geol. Surv. Jpn. 2015, 66, 1–14. [Google Scholar] [CrossRef][Green Version]
- Moncada, D.; Baker, D.; Bodnar, R.J. Mineralogical, petrographic and fluid inclusion evidence for the link between boiling and epithermal Ag-Au mineralization in the La Luz area, Guanajuato mining district, México. Ore Geol. Rev. 2017, 89, 143–170. [Google Scholar] [CrossRef]
- Sander, M.V.; Black, J.E. Crystallization and recrystallization of growth-zoned vein quartz crystals from epithermal systems—Implications for fluid inclusion studies. Econ. Geol. 1988, 83, 1052–1060. [Google Scholar] [CrossRef]
- Bobis, R.E. A review of the description, classification and origin of quartz textures in low sulphidation epithermal veins. J. Geol. Soc. Philipp. 1994, 49, 15–39. [Google Scholar]
- Dong, G.; Morrison, G.; Jaireth, S. Quartz textures in epithermal veins, Queensland–Classification, origin, and implication. Econ. Geol. 1995, 90, 1841–1856. [Google Scholar] [CrossRef]
- Corbett, G. Epithermal gold for explorationists. AIG News 2002, 67, 1–26. [Google Scholar]
- Fournier, R.O. The behavior of silica in hydrothermal solutions. Rev. Econ. Geol. 1985, 2, 45–61. [Google Scholar]
- Browne, P.R.L. Minimum age of the Kawerau geothermal field, North Island, New Zealand. J. Volcanol. Geotherm. Res. 1979, 6, 213–215. [Google Scholar] [CrossRef]
- Grimes, S.; Rickard, D.; Hawkesworth, C.; van Calsteren, P.; Browne, P. A U-Th calcite isochron age from an active geothermal field in New Zealand. J. Volcanol. Geotherm. Res. 1998, 81, 327–333. [Google Scholar] [CrossRef]
- Arehart, G.B.; Christenson, B.W.; Wood, C.P.; Foland, K.A.; Browne, P.R.L. Timing of volcanic, plutonic and geothermal activity at Ngatamariki, New Zealand. J. Volcanol. Geotherm. Res. 2002, 116, 201–214. [Google Scholar] [CrossRef]
- Simmons, S.F.; Brown, K.L.; Tutolo, B.M. Hydrothermal transport of Ag, Au, Cu, Pb, Te, Zn, and other metals and metalloids in New Zealand geothermal systems: Spatial patterns, fluid-mineral equilibria, and implications for epithermal mineralization. Econ. Geol. 2016, 111, 589–618. [Google Scholar] [CrossRef]
- Giggenbach, W.F. Magma degassing and mineral deposition in hydrothermal systems along convergent plate boundaries. Econ. Geol. 1992, 87, 1927–1944. [Google Scholar]
- Brown, K.L.; Simmons, S.F. Precious metals in high-temperature geothermal systems in New Zealand. Geothermics 2003, 32, 619–625. [Google Scholar] [CrossRef]
- Simmons, S.F.; Brown, K.L. The flux of gold and related metals through a volcanic arc, Taupo Volcanic Zone, New Zealand. Geology 2007, 35, 1099–1102. [Google Scholar] [CrossRef]
- Seward, T.M. Thio complexes of gold and the transport of gold in hydrothermal ore solutions. Geochim. Cosmochim. Acta 1973, 37, 379–399. [Google Scholar] [CrossRef]
- Seward, T.M. The hydrothermal chemistry of gold and its implications for ore formation: Boiling and conductive cooling as examples. Econ. Geol. Monogr. 1989, 6, 398–404. [Google Scholar]
- Stefánsson, A.; Seward, T.M. Experimental determination of the stability and stoichiometry of sulphide complexes of silver(I) in hydrothermal solutions to 400 °C. Geochim. Cosmochim. Acta 2003, 67, 1395–1413. [Google Scholar] [CrossRef]
- Stefánsson, A.; Seward, T.M. Gold(I) complexing in aqueous sulphide solutions to 500 °C at 500 bar. Geochim. Cosmochim. Acta 2004, 68, 4121–4143. [Google Scholar] [CrossRef]
- Taguchi, S.; Nakamura, M. Subsurface thermal structure of the Hatchobaru geothermal system, Japan, determined by fluid inclusion study. Geochem. J. 1991, 25, 301–314. [Google Scholar] [CrossRef]
- Hannington, M.; Hardardóttir, V.; Garbe-Schönberg, D.; Brown, K.L. Gold enrichment in active geothermal systems by accumulating colloidal suspensions. Nat. Geosci. 2016, 9, 299–302. [Google Scholar] [CrossRef]


© 2019 by the authors. Licensee MDPI, Basel, Switzerland. This article is an open access article distributed under the terms and conditions of the Creative Commons Attribution (CC BY) license (http://creativecommons.org/licenses/by/4.0/).