Article

A pXRF In Situ Study of 16th–17th Century Fresco Paints from Sviyazhsk (Tatarstan Republic, Russian Federation)

1
Analytical and Restoration Department, Institute of Archaeology of Tatarstan Academy of Science, 30, Butlerova St., 420012 Kazan, Tatarstan, Russia
2
Archeotechnologies & Archeological Material Sciences Laboratory, Institute of International Relations, History and Oriental Studies, Kazan (Volga Region) Federal University, 18 Kremlevskaya Str., 420000 Kazan, Tatarstan, Russia
3
Department of Geology, Babeş-Bolyai University, 1 Kogălniceanu Str., 400084 Cluj-Napoca, Romania
4
Laboratory of Isotope and Element Analysis, Institute of Geology and Petroleum Technologies, Kazan (Volga Region) Federal University, 18 Kremlevskaya Str., 420000 Kazan, Tatarstan, Russia
*
Author to whom correspondence should be addressed.
Minerals 2019, 9(2), 114; https://doi.org/10.3390/min9020114
Submission received: 13 December 2018 / Revised: 10 February 2019 / Accepted: 13 February 2019 / Published: 15 February 2019

Abstract

:
Twenty frescoes from “The Assumption” Cathedral located in the island town of Sviyazhsk (Tatarstan Republic, Russian Federation)—dated back to the times of Tsar Ivan IV “the Terrible”—were chemically analyzed in situ with a portable X-ray fluorescence (pXRF) spectrometer. The investigation focused on identifying the pigments and their combinations in the paint recipes. One hundred ninety-three micropoints randomly chosen from the white, yellow, orange, pink, brown, red, grey, black, green, and blue areas were measured for major and minor elements. The compositional types separated within each color indicate different recipes. The statistical processing of the data unveiled the most important oxides (CaO, MgO, Fe2O3, PbO, SO3, Sb2O3, Al2O3, SiO2, and P2O5) and their relationships. The results allowed to infer the mineral composition of the paints, and, hence, the recipes used by the Russian artisans. Slaked lime and slaked dolomitic lime mixed with variable amounts of “antimony white” and “bone white” were used for white, pink, yellow, and orange paints and for preparing a basic batch for all other colors. Mostly yellow ochre, red ochre, and lead minerals, and occasionally blue ochre, green earth, realgar, orpiment, bone black, galena, stibnite, and magnetite were the pigments involved in various amounts in preparing the paints.

Graphical Abstract

1. Introduction

The old frescoes acquire a greater relevance with each year, due both to their historical and artistical value, and to the complexity of issues related with their restoration and conservation. There are many factors that could affect the integrity and stability of the mural artworks [1], among which are climate (including seasonal temperature variation and humidity), colonization by vegetal or animal organisms, human intervention, etc. Preventive conservation requires the use of non-destructive and non-invasive techniques [2]. A large spectrum of analytical techniques, e.g., optical microscopy [3], X-ray diffraction [4,5], scanning electron microscopy [6,7,8], Fourier transform infrared spectroscopy [9,10], X-ray fluorescence (XRF) [10,11], Raman spectroscopy [5,12], and mass spectrometry [13] are involved in the study of frescoes. Reliable data were obtained by multi-analytical approaches, comprising optical microscopy, XRF, colorimetry, micro-Raman spectrometry, and Fourier transform infrared spectroscopy [2,7,14].
The use of a portable XRF (pXRF) brought the possibility to study frescoes in situ, while minimizing damage to the archaeological material [4,15,16,17,18]. Simsek et al. [19] stated, “this noninvasive technique in fact allows the study of a large number of samples, thus giving a more representative, statistical view of the production variability.” This kind of investigation may be associated with a degree of uncertainty [20], but the advantage is a fast and simple procedure that provides reliable data.
Founded by Tsar Ivan IV “the Terrible” in 1551, the town of Sviyazhsk (55°46.222’N, 48°39.611’E, elevation 80 m a.s.l. (above sea level)) is located on a small island on the Volga River, about 25 km upstream from the city of Kazan, capital of Tatarstan (Russian Federation). This island town held an economical, key position due to its proximity to the “Volga Route” and the “Silk Road”. It also became famous for “The Assumption of the Mother of God” (known as “The Assumption”) Cathedral and the Orthodox Christian monastery [21]. The walls of the cathedral are decorated with well-preserved frescoes, representative of the Russian Medieval artisanal art of the 16th–17th centuries (Figure 1a,b). They show religious scenes, with human silhouettes drawn in the specific Russian style, influenced by the Byzantine art that followed the rules of the Nicaea Council held in 787 [22].
The frescoes from Sviyazhsk are key works in understanding the development of the distinct Russian art style and its later development in the easternmost part of Europe. The written sources from that time offer little information about the composition of these mural paintings, the pigments, or the techniques and the recipes used [4,23]. The mural paintings from “The Assumption” Cathedral are called “buon” frescoes (frescoes sensu stricto (s.s.)) because they are painted on wet plaster [24]. Preliminary investigations identified three painting phases and a substrate obtained from slaked lime, slaked dolomitic lime, and fine quartzitic sand [24,25]. The frescoes show only rare and isolated signs of scaling, fading, or fine cracking. No salt efflorescence, and no discolored or darker spots have been observed that indicates alteration [26]. Blisters or biofilms related to biodegradation are missing. The latter is a process otherwise common to fresco paints created in the same period [27,28,29]. It is acknowledged that the Sviyazhsk mural paintings underwent some small restoration works in the late 19th century, but no precise details are known.
The “The Assumption Cathedral” in Sviyazhsk is a UNESCO Cultural Heritage site; therefore, no investigation that could affect the integrity of the material is allowed. Hence, our study applied a non-invasive method, i.e., portable X-ray fluorescence spectrometry, to investigate the frescoes from the cathedral in order to define the basic chemical features of the paints, and to identify the pigments and the recipes used. For conservation works it is important to infer the original materials used to avoid color inadequacy or reactions with the restoration paints. It is of equal importance to use non-invasive research methods, because even the smallest intervention can trigger later damages. This is the first study that aims to shed light on the possible pigments and the paint palette used in 16th–17th century in Russia. This paper is a case study, aiming to demonstrate that it is possible to obtain essential information in situ, using portable equipment such as a pXRF.

2. Fresco Technique

Frescoes (mural paintings) have been known since Dynastic Egypt and the Mediterranean Bronze Age [29,30]. They became more and more common from antiquity to modern times [12,31]. Three fresco techniques are known, all implying the application of paint on a substrate made of plaster. Plaster covers the small irregularities of the wall and provides an even and homogeneous surface. The composition of the plaster is variable and depends on geographical position, available raw materials, and time [32]. It is obtained generally from slaked lime or slaked dolomitic lime [33,34] mixed with quartzitic sand and, occasionally, gypsum. If the sand is coarse the plaster is called “arricio”, and if it is fine it is called “intonaco”.
The paint can be applied on a wet plaster (“buon” fresco or fresco sensu stricto), on a nearly dry plaster (“mezzo” fresco), or on a completely dry plaster (“secco” fresco technique). In the “buon” fresco technique, the paint should be applied immediately after finishing the plaster or within eight hours [33]. The fluid paint is absorbed into the wet and porous plaster, and both will dry and harden simultaneously due to a chemical reaction between the atmospheric CO2 and the slaked lime—Ca(OH)2. The resulting mass of calcite crystals entraps the pigments [35,36] and forms a thin (a few mm), distinct “pictorial layer” [37] separated from the underlying non-colored plaster. However, Edwards and Farwell [38] demonstrated that relics of slaked lime that did not re-carbonate to calcite can be still found in 1000-year-old plaster.
The paints are fluid suspensions made of a pigment mixed with a binder that acts as glue, for example, water, limewater (calcium hydroxide solution), or slaked lime. A common batch made of slaked lime, dolomitic slaked lime, bone white, and quartz, was often used as a basis for all colors. It helped to increase the mass of the paint and to control the lighter hues.
Red, yellow, and blue are “primary colors”, which cannot be obtained by mixing other colors. They stand at the origin of the “secondary” and “tertiary” colors. For example, orange is obtained from yellow plus some red, green results from yellow and blue, and violet is made from red and blue. Combining all primary colors, i.e., red, yellow, and blue, produces black. To obtain yellow, pink, blue, light green, or grey, it is enough to mix a very small amount of the corresponding pigment into white paint.
Since prehistory, the most common coloring agents were “ochres” or “earthy pigments” [39,40]. They all have an inorganic nature, as displayed in Table S1, and generally represent a mixture of various minerals [41]. “Yellow ochre”, or “limonite”, is mostly goethite with some lepidocrocite, jarosite (optional), clay minerals (kaolinite, illite), quartz, muscovite, and feldspar [41]. Dark brown ochre, called “umber”, contains manganese oxide instead of goethite, quartz, and clay minerals [42]. Reddish brown “burned umber” has mostly hematite, similar to “red ochre”. “Green earth” consists of hydrated Fe silicates, e.g., glauconite and celadonite, chlorite, serpentine, or amphibole [4]. “Blue ochre”, called “blue iron oxide” is vivianite [43], a hydrated Fe phosphate [41].
Lead minerals were used as fresco pigments due to their generally clear and bright colors. Lead oxides, such as massicot (PbO; yellow), litharge (PbO; red), minium (Pb3O4; red), and plattnerite (PbO2; black) have been widely involved in producing paints. Plattnerite occurs as an alteration product of lead white and massicot [44,45]. Minium was described in frescoes [46], but it is reported to be unstable if not protected by a binder [36].
Many other minerals, and even rocks, were used as pigments. Calcite, chalk, limestone, marble, and slaked lime were used as white paints [47]. Hydrated copper carbonates, such as green malachite and blue azurite, were frequently used as pigments since antiquity. “Verdigris” is a mixture of products from Cu mineral alteration, mostly copper acetate [43], with a bluish green color. “Egyptian blue” is a synthetic cuprorivaite—calcium and copper silicate—and was prepared in ancient Egypt [48]. The rock called lapis lazuli, known also as “ultramarine blue” when artificially produced [49], is a mixture of lazurite, diopside, calcite, and some pyrite, which gives a deep blue pigment [50].
A number of substances were involved in producing black and grey colors, such as coal, graphite, magnetite (“black powder”), stibnite (“antimony”), galena (“blue lead”), or arsenic. Charring animal bones results in “bone white” and “bone black”, comprising calcium carbonate and apatite [51]. “Bone black” has the addition of graphite. From native arsenic, dark grey, black, and even white pigments can be obtained. The arsenic sulphides orpiment and realgar give a yellow and a bright red-orange color, respectively. Stibiconite and cervantite are the main compounds of the “antimony ochre”, displaying white, grey, or yellow color [52]. Stibnite was used for dark grey and black paints (Table S1). “Antimony white” is an antimony oxide [43] that can be obtained by roasting stibnite. Starting in the 17th century, a lead antimonite called “Naples yellow” was used [43].

3. Materials and Methods

The chemistry of one hundred ninety-three micropoints, located on an undamaged surface of twenty-two frescoes (Table S2) and randomly selected to include all hues (white, yellow, orange, pink, brown, red, grey, black, green, and blue), was measured in situ by pXRF. An S1-Turbo Bruker portable (~2 kg) spectrometer (Bruker, Kennevick, WA, USA; Figure 1b), equipped with a silver (Ag) X-ray target working at 45 kV and 50 μA, was used. The 10 mm2 X-Flash® silicon drift detector (Bruker, Kennevick, WA, USA), with an energy resolution of 145 eV at 100,000 pulses/s, enabled the analysis of light elements such as Mg, Al, Si, P, and S, without using a vacuum pump and helium atmosphere. Na and C could not be identified by pXRF. The elliptically shaped collimator was 2 × 8 mm in size. The surface of a measured point was approximately 5 mm in diameter. During measurements, the collimator was kept close and as perpendicular as possible to the fresco surface. An infrared sensor checked that the measured point was within the correct examination window. Acquisition time was 50 s on average. The X-ray penetration depth was a function of the mineral phase, generally up to 100 μm, much below the thickness of the pictorial layer (around 0.5 mm). The measurements were targeted to reach the “infinity thickness for each element.
Measurements were carried out three times for each point to avoid errors regarding possible heterogeneity of the analyzed point and to internally check the results. Each result was reported as the mean value of three measurements for each individual point. Emission spectral analysis and electron microscopy were used together with the initial test measurements to make sure the obtained data were correct. The tests were satisfactory, indicating correctly functioning equipment and a good match of data. Therefore, our data can be regarded as between quantitative (i.e., measured) and semiquantitative (i.e., estimated). The operating system used was Microsoft Windows.
Twenty-six major (CaO, MgO, Fe2O3, PbO, SO3, Sb2O3, Al2O3, SiO2, P2O5, K2O, and TiO2) and trace elements (CuO, As2O3, MnO, Co3O4, ZnO, Cr2O3, NiO, ZrO2, SrO, SnO2, Ta2O5, Bi2O3, V2O5, CeO2, and HfO2) were determined (Table S3). As the materials involved in the study were mineral materials, the results were expressed as oxides. The analyses with very low totals were not included in the study. Each chemical analysis was labelled according to color: W for white, Y for yellow, O for orange, P for pink, B for brown, R for red, GR for grey, BK for black, GN for green, and BL for blue. The first digit(s) represented the fresco number according to Table S2. The last digits represented the analyzed point. The results were given in mass %, in agreement with the International System of Units [53]. For lead, the content was additionally presented as mass % element recalculated by a factor of 0.7989 [54]. Table S3 contains the detection limits for all elements. Table S4 displays calculated standard deviation and average data for each color type.
The interpretation of the main chemical parameters and their mutual relationships were based on the principal component analysis (PCA). This is a widely used statistical method [55] that enables visualizing the relationship between variables—in our case, the major chemical compounds. The PCA plot was obtained by the Excel XLSTAT program.

4. Results and Discussion

4.1. Chemistry of the Paints

Table S3 contains the XRF raw chemical data. All major elements (CaO, MgO, Fe2O3, PbO, SO3, Sb2O3, Al2O3, SiO2, P2O5, K2O, and TiO2) showed large variations in composition (Figures S1a–d, S2a,b and S3a–d). The amounts of CuO, As2O3, MnO, Co3O4, ZnO, Cr2O3, NiO, ZrO2, SrO, SnO2, Ta2O5, Bi2O3, V2O5, CeO2, and HfO2 were generally close to, or below, the detection limit and were not discussed here (except in the rare cases when they were higher).
In the following, the most probable pigments used were inferred based on the main features of each color and the mutual relationships between chemical components. The binary diagrams in Figure 2a–d and Figure 3a–d display the trends of the main oxides. The significant amount of CaO and MgO measured in all paints was due to the plaster substrate, as well as a binder media composed essentially of slaked lime and slaked dolomitic lime. The sum of CaO + MgO may reach 80 mass %. The overall relatively high SiO2 content was most likely due to quartz, present both in the plaster and in the ochres.

4.1.1. White Paint

A medium to high amount of CaO associated with a notable amount of MgO was characteristic for most of the white paints (Table S3). Based on chemistry, two groups were distinguished and conventionally labelled white A and white B, respectively (Figure S1a). The white A type was dominated by high lead (12.8 to ~42 mass %) and high sulphur (12 to ~15 mass %). CaO content was relatively low (up to ~11 mass %), whereas MgO was generally around 20 mass %. The high content of both PbO and SO3 (Figure 2a), and the relatively low CaO content, addressed the use of anglesite as white pigment and excluded gypsum. Galena (PbS) was also excluded, as it would have produced a dark grey to black color.
Most of the white micropoints belonged to the white B type, characterised by >30 mass % CaO, with a maximum at ~68 mass % (Figure 2b). Only a few points were <30 mass % CaO. MgO content was average, ~20 mass %, which was slightly lower than the white A. These indicate, together with the high SiO2 content (>30 mass %), that the painter could have left the substrate plaster exposed instead of applying a real paint, in a similar way that has been previously described [9,56]. SO3 content was up to ~12 mass %, and PbO was up to ~8 mass % (Figure 2a). The contribution of a variable quantity of Sb-containing white pigment (probably “antimony white”) can be determined. There was a positive, exponential relationship between Sb2O3 and CaO (Figure 2c). This correlation was non-linear because the rate of change of the variables (calcium oxide and antimony oxide) was not constant, despite their concurrent increases or decreases. The overall Sb2O3–CaO correlation coefficient was 0.92 for all colors. There was also a noticeable correlation between CaO and P2O5 in the white as well as other paints (Figure 2d). The negative correlation between calcium and sulphur (Figure 3a) also excludes gypsum for white B color.

4.1.2. Yellow Paint

The chemistry of the yellow points was relatively homogeneous (Table S3, Figure S1b). Similar to the white B paint, the yellow one showed high and variable CaO content, between 22 and 62 mass %. MgO content was average (~20 mass %). The positive correlation of CaO with MgO (Figure 2b) and Sb2O3 (Figure 2c) indicates the painter used the same batch as for the white color (probably slaked lime + slaked magnesian lime + “antimony white”). The yellow paint owed its hue to the iron content, ranging from ~2 to over 8.5 mass %, and was added as yellow ochre (goethite). The positive correlation between Al2O3 and SiO2 (Figure 3b) was due to the yellow ochre.

4.1.3. Orange Paint

There are only a few parts of the frescoes showing an orange color (Figure S1c). The four points analyzed had essentially a similar composition as the yellow paint (Table S3), with high CaO (from 29 to 54 mass %) and variable MgO (between ~8 and 23 mass %), due to slaked lime and slaked dolomitic lime. The hue was due to Fe2O3 content, ranging from ~2 to almost 8 mass %, added as red ochre. The PbO content below 1 mass % excluded the presence of red litharge or minium. The significant amount of antimony oxide (up to 4 mass %) was due to the similar batch used for the white and the yellow color.

4.1.4. Pink Paint

This paint can be obtained by dispersing fine-grained red pigment in a white batch, such as slaked lime; therefore, not much coloring agent is needed. Two types of pink paint were distinguished (Figure S1d). Pink A comprised most of the points and was characterized by high CaO content and average to low MgO content. They were strongly correlated (Figure 2a) and demonstrated the involvement of a batch made of slaked lime and slaked dolomitic lime. The content of Fe2O3 (up to 4.64 mass %) pointed to the use of red ochre (hematite) as pigment in helping to obtain a pink hue. The lead content was low.
The pink B type was identified in a single point, characterised by a very high PbO content (26.1 mass %). For this type, instead of red ochre, “red lead” litharge or minium (Table S1) could have been introduced in the batch. Arsenic (1.17 mass %) usually accompanied lead minerals [57]. The pink B points in Figure 2c have a similar non-linear correlation trend as CaO and Sb2O3, compared to other colors, due to their common usage in the batch. The same was valid for the relation between CaO and P2O5 shown in Figure 2d.

4.1.5. Brown Paint

Table S3 reveals the presence of Fe2O3 in most of the brown colors. In the discrimination diagram in Figure 2a all brown paints were in the area of low to medium CaO content, and low MgO content. Manganese, which is generally regarded as producing brown hues [58], was barely above the detection limit. Hence, the brown ochre (“umber”) was excluded as being the cause for the brown color. There were three types of brown paint (Figure S2a).
The brown A type was Fe-dominated and included most of the brown micropoints. Iron content varied considerably, from 11.5 to almost 59 mass %. CaO was non-homogeneously distributed (from ~9 to 41 mass %). The P2O5 content was over 1 mass % in general. Figure 3b,c outlines the positive correlation between Al2O3–SiO2 and Fe2O3–K2O, respectively, and suggests the overall involvement of yellow ochre, probably mixed with bone black. As MnO content was very low, the brown ochre (“umber”) cannot be accepted as pigment.
In the brown B type, PbO was prevalent (~10 to 45 mass %), followed by variable quantities of Fe2O3 (up to ~5 mass %). Massicot could have been responsible for this color, if mixed with yellow ochre and some bone black. Massicot was largely used in Russia between 11th and 18th centuries [56], hence its presence is likely. The average amount of MgO and CaO indicated the use of slaked dolomitic lime. The high As2O3 content (11.6 mass %) in one brown point can be connected with the high PbO content (37 mass %) in the same point.
Brown C showed a marked difference compared with previously described brown A and B types. It had more CaO content (up to almost 50 mass %), low Fe2O3 content, and almost no PbO. Iron was the main cause of the color. It reached a maximum of 8.75 mass %, and most likely originated from the yellow ochre (no Mn content) pigmented with bone black (P2O5 > 1 mass %).

4.1.6. Red Paint

The red color’s overall chemistry is marked, as for all other colors, by high and variable CaO and MgO content (Table S3). Two types of red paint were defined (Figure S2b). Most of the points belonged to the red A type, with high Fe2O3 content (from ~10 to >55 mass %), low lead, and over 30 mass % CaO. The latter showed a maximum of 60 mass %. Red ochre (hematite) was most likely the cause of color. Between Fe2O3 and K2O there was a positive relationship (Figure 3c), due to their common origin from the red ochre.
The red B type showed up to 10 mass % Fe2O3 and very high PbO content (23–46 mass %), suggesting the use of red ochre in addition to litharge (or minium). The amount of arsenic was too high (1.44 to 9.27 mass %) to account for it as an accessory element in the lead or iron minerals. Most likely, a red arsenic mineral, e.g., realgar (AsS), was added as pigment. The strong positive correlation between calcium and antimony for all red points (Figure 2c,d) was explained by the use of the same batch of slaked lime and antimony oxides, similar to the white, yellow, orange, and pink colors.

4.1.7. Grey Paint

In Medieval times, the grey hues were obtained by staining a white batch with some black material, for example bone black [51], coal, graphite, magnetite, stibnite, galena, or native arsenic. Alternatively, a mixture of brown, yellow, and red ochre was used [59]. Similar to other colors of the Sviyazhsk frescoes, the grey paints showed a large variability in CaO, MgO, Fe2O3, PbO, and Sb2O3 content (Table S3). In Figure 2a, the grey paint was similar to the white and black colors, in an area of variable CaO content, due to a common background. In Figure 2c, all grey paint points fit to all other colors, on a slightly curved correlation field between CaO and Sb2O3. Three groups of grey were chemically distinguished (Figure S3a).
Grey A included a single point, with extremely high Fe2O3 content (>43 mass %) resulting from iron oxide (magnetite). The CaO amount was relatively low (15 mass %). The Grey B type was dominated by CaO (24 to >63 mass %) and Sb2O3, generally over 4 mass %. The latter could have been added in the slaked lime as antimony white. The negative correlation for grey in Figure 3d (SO3 versus Sb2O3) ruled out the presence of antimony sulphide for the grey paint. Fe2O3 and PbO were very low, and played no role in the grey B type.
The Grey C paint displays an important quantity of PbO, which extends between 10 and >32 mass %. The amount of SO3 was also very high (10–23 mass %), pointing to a light colored lead sulphate, which was consistent with anglesite. If it would have been mainly lead sulphide (galena), it would have produced a dark grey, almost black color. However, a small amount of galena could have been added for the greyish hue. The phosphorous content over 1 mass % supports the addition of bone black to the batch of slaked lime and slaked dolomitic lime. The As2O3 content between ~1 and ~9 mass % supported the use of native arsenic.

4.1.8. Black Paint

The black color was problematic. In many cases this color is based on carbon [60], an element not measurable by pXRF. Black also results when all three primary colors, i.e., red, yellow, and blue, are mixed together. The distribution of the main oxides (Table S3) allowed grouping the data into three types of black (Figure S3b). Figure 2c shows the plot of the black colors together with all other colors in the CaO versus Sb2O3 diagram.
Black A type included most of the analyzed points, characterized by a high CaO content generally above 40 mass %. Iron and lead levels were too low to be connected with a black pigment. P2O5 was consistently above 1.5 mass %, up to approximately 2.5 mass %, and positively correlated with CaO (Figure 2d). Hence, the bone black can be presumed as a source of this color. Antimony was also unusually high, with values up to 7 mass %, and can be associated with a black or dark grey compound, such as stibnite.
A combination of Fe- and Pb-rich materials defined the black B type. It was equally dominated by iron (~13 mass %) and lead (up to 15.4 mass % oxide, i.e., 12.3 mass % element). SO3 was up to 4 mass %. The chemistry, with high lead and some Sulphur, indicated a (black) lead sulphide, probably galena. As2O3 (around 1 mass %) could have also been associated with galena as trace element. Fe originated from a black oxide, magnetite. Neither black B nor black C showed antimony content, indicating the use of a clearly distinct paint compared to black A.
The main feature of the black C paint was related to high lead content, between 17 and 32.60 mass % oxide (14 to 28.4 mass % element Pb). The SO3 content was highly variable, and did not show a direct correlation with lead (Figure 2a). This excluded lead Sulphur, and pointed to lead oxide (plattnerite?). Iron occurred in much smaller amounts than in the black A and B types. Antimony was highly variable, ranging from 0.73 to ~6 mass %.

4.1.9. Green Paint

Most of the green points analyzed had either high or low CaO content (Table S3). Two groups of green paint have been defined (Figure S3c). Green A comprised most of the points and was clearly dominated by Fe2O3, which reached 8 mass %. The relatively high K2O, SiO2, and Al2O3 contents can be linked with the glauconite–celadonite component of “green earth” (Table S1). Calcium was high and reflected the use of slaked lime. Copper was generally close to the detection limit, except for two points showing 1.37 mass % CuO, which could be related to a small amount of either malachite or chrysocolla. Malachite could have been obtained as native copper corrosion product. Verdigris, also containing Cu, is highly instable [43] and, therefore, its use cannot be detected.
Green B type had a PbO content between 5.47 and 12.20 mass %, with the highest amount at 42 mass %. It correlated well with the SO3 content, suggesting the use of anglesite. The low amount of Fe2O3 and K2O excluded the contribution of green earth. One outlier had an extremely high As2O3 content of 10.7 mass %, which could originate from some orpiment occasionally added to obtain a yellowish nuance of green.

4.1.10. Blue Paint

To infer the cause of blue hues is relatively difficult. There are few blue substances, among which are Egyptian blue, azurite, and lapis lazuli [43] or carbon black [61] giving blue pigments. Sodium cannot be detected by pXRF; thus, the presence of lapis lazuli is uncertain. Even more, this pigment would imply higher SiO2 and higher Al2O3 content [49] than those obtained here. A blue color can also be obtained by overlapping different layers of paint, for example carbon black (also undetectable by pXRF) and ochre made of a greyish blue layer and dark blue base [60].
The blue paint, with apparent heterogeneity in respect to chemistry (Table S3), was separated into three distinct groups (Figure S3d). Most of the micropoints were included in the blue A type. The most significant elements were iron (up to ~4 mass % Fe2O3), lead (up to ~2 mass % PbO), and antimony (up to 6.7 mass % Sb2O3). The iron content could originate from the blue ochre, vivianite. Ca was within normal ranges, similar to other light colors, i.e., generally between and ~50 mass %. SiO2 was high (12.2 to 32.1 mass %). However, the Al content was too low to account for lazulite or lazurite. A single micropoint showed 1.37 mass % Co3O4, which could be linked with smalt [62]—an artificially produced cobalt-doped glass.
Blue B was dominated by extremely high PbO, which ranged from 27 to >52 mass %. This suggests that the basic material for producing blue paint could have been a white lead (anglesite) pigmented with low amounts of “blue lead” (galena). A higher amount of galena would have induced a dark grey color, not a bluish one. Mg was average, between ~15 and ~22 mass %. Three samples also showed high amounts of As2O3, between 8 and 13 mass %, which could have originated as an accompanying element to the lead ore.
Blue C included only two samples, marked by high copper (6.52 and 8.68 mass % CuO). CaO (from 52 to ~60 mass %) and Sb2O3 (between ~4 and ~6 mass %) were also high. The paint owes its color to a Cu-bearing mineral. This could have been azurite—commonly used for mural painting [63]. Egyptian blue (calcium-copper silicate), artificially produced since ancient Egypt [48] and could have come to Sviyazhsk via the Volga Route, cannot be excluded as pigment for a few blue C paints. On the other hand, “verdigris” is highly unstable [36], and the paint would have shown intense alteration. The high calcium content can also be related to slaked lime, not only to Egyptian blue. Antimony white and some stibnite might have also been added in the batch, and this explains the high content of Sb.

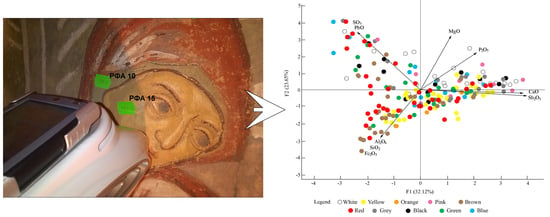
4.2. Statistical Processing

In the frescoes studied, the correlation between the prevalent chemical elements helped in finding the nature and the origin of colors. The data below the detection limit were replaced by a conventional value equal with the detection limit/2 [64]. For the principal component analysis, the main chemical compounds CaO, MgO, Fe2O3, PbO, SO3, Sb2O3, Al2O3, SiO2, and P2O5 were used as variables.
The statistical processing of the data separated two factors, F1 and F2 (Table 1), accounting for 55.77% of all variations. F1 included CaO, Sb2O3, P2O5, PbO, and SO3, whereas F2 included MgO, SO3, Fe2O3, SiO2, and P2O5. Some variables, such as SO3 and P2O5, occurred in both factors. There were positive and negative correlations, with coefficients close to, or higher than, 0.5 or –0.5. They formed three groups: a) CaO–Sb2O3–P2O5; b) Fe2O3–SiO2–Al2O3, and c) MgO–SO3–PbO–P2O5.
The vectors (arrows in the PCA plot in Figure 4) show the dominant chemical elements and similar trends. One trend included CaO and MgO (as components of the slaked lime and slaked dolomitic lime), Sb2O3 (as antimony oxide), and P2O5 (as apatite-like material). The second trend reflected the compositional pattern of the ochres, with Fe2O3, SiO2, and Al2O3. The third trend connected PbO and SO3, and was probably related to both Pb oxides (litharge or minium?) and lead sulphate (anglesite).
The distribution of the white, pink, black, grey, and blue colors coincided with the PbO + SO3 vectors on one side, and CaO + Sb2O3 + P2O5 on the other side. The yellow and orange were dominated on one side by Fe2O3, Al2O3, and SiO2 as parts of the ochres, and CaO, Sb2O3, and P2O5 as part of the basic batch on the other side. In the red, brown, black, and green paints, all vectors were involved, except for MgO and P2O5, proving their origin in a complex mixture of ochres and oxides. The high content of CaO (generally over 40 mass %) and MgO (around 20 mass %) indicated the same batch of slaked lime and slaked dolomitic lime, colored by black lead pigment (galena), and probably “bone black”.

4.3. General Remarks on Pigments

Many of the pigments identified in the Sviyazhsk frescoes were known and intensely used in Europe since Hellenistic and Roman times, e.g., lime white, calcite, Fe-ochres, magnetite, green earth, cinnabar, Egyptian blue, charcoal, bone black, and lapis lazuli [5,65,66,67,68]. The Medieval ages, and in particular the Renaissance, continued the Roman frescoes technique. The pigment palette depended on local sources and the trade network. The pigments used in the Medieval Ages in Western [61,69] and Eastern-Southeastern Europe, including Byzantine churches [16,46,70,71,72,73], were slaked lime, calcite, Fe-ochres, azurite, Cu-minerals, white lead, red lead, green earth, carbon black, cinnabar, and lapis lazuli. Blue vivianite was “a specialty of the European medieval times” [48]. In the 13th–14th centuries, smalt started to be used in Constantinople [65]. The pigments identified at Sviyazhsk are similar to those used elsewhere in East and Southeast Europe, as well as in the Near East area where Byzantium had a strong influence. Four elements mark the specificity of pigments used at Sviyazhsk—mostly lead and iron, but also antimony and phosphorous. Variable, but high, amounts of Pb were measured in all colors, except for yellow and orange. Fe-bearing material is also present in all colors, except for white. The consistent and significant amount of P2O5 in almost all colors, including the darker ones, can be explained by the presence of bone white [43,50].
Antimony, a quite unusual element, showed an increasing, but non-linear, trend with CaO (Figure 2c) for all colors. The calculated correlation coefficient reflects a strong relationship, being generally close to, or higher than, 0.9 for all colors except blue. The exponential shape of the trend suggests that small, pre-made batches were used in various amounts to obtain all pigments. Antimony was, and still is, a common element involved in producing pigments. In neighboring areas, such as Transcaucasia or Persia (today Iran), the lead ores contain high amounts of stibnite [74]. However, the Pb–Sb relationship, if any, is very weak in our samples. On the other hand, roasting of stibnite was a common process in antiquity [74,75]. In the Sviyazhsk paints, antimony could have been added as an oxide (“white antimony”—white, light grey in color) for the white, yellow, orange, pink, red, and brown paint, and as stibnite (dark grey, almost black in color) for the black, grey, and blue paint, respectively.
The location of the island town of Sviyazhsk, with its proximity to the various mineral deposits in the Ural Mountains [76,77,78] and its intersection with the “Volga Route” and the “Silk Road”, offered it pigments and minerals otherwise rare, such as malachite, azurite, arsenic, lead, and antimony. In the Southern Urals, in the second millennium B.C., people produced antimony–lead–cooper alloys [79]. Arsenic was also a common element in the metallic objects produced there.
On the other hand, the “lead white” darkens easily and gets a greyish nuance [80], hence its presence in the well-preserved white, pink, and blue colors (see below). This indicates the probable use of a small amount of stabilizer, such as animal glue or egg yolks [31,80], not detected by XRF. In this respect, part of the sulphur detected in the Sviyazhsk frescos could be related to an organic medium [72].
Few points show an unusually high content of TiO2, NiO, and Cr2O3, which are associated with pigments artificially prepared in the late 19th to the early 20th century [40]. The occasional high content of TiO2 in the yellow (~3 to ~6 mass %), pink (2.2 to 2.7 mass %), brown (2 to ~3 mass %), red (~2 to ~4 mass %), grey (~3.6 to 8 mass %), green (~3 to 5 mass %), and blue paint (5.7 mass %) is supposed to reflect restoration works [81]. The same is valid for the unusually high NiO content (11 mass %) measured in one white point, and Cr2O3 (1 mass %) in one green point. The high Ta2O5 content (>1 mass %) found in one blue paint is probably an error of the instrument, as its line overlaps with that produced by lead. The presence of elements linked to modern pigments revealed that the restoration works [82] affected several isolated areas for all colors, except orange.

5. Conclusions

The investigation by portable XRF proved to be an appropriate, non-invasive method for analyzing the chemical and mineral composition of the paints used in Russia in the 16th–17th centuries. The painting materials involved a basic batch consisting of slaked lime (CaO) ± slaked dolomitic lime (CaO + MgO), with some “antimony white” (Sb2O3) and “bone white” (CaO + P2O5). The pigments identified are typical for the Middle Age color palette, with a predominance of ochres, as well as iron- and lead-rich materials. The use of a single pigment or a mixture of ochres, oxides, carbonates, sulphides, sulphates, and carbonates, enabled a large range of colors to be obtained (Table 2). Arsenic minerals (and in a lesser amount, copper minerals) were only involved in certain colors, such as red, grey, green, and blue. Bone black was probably the source for the black and part of the grey hues.
The contrasting chemistry within the same color demonstrates that different recipes and paints were simultaneously used. One type of yellow and orange, two types of white, pink, red, and green, and three types of brown, grey, black, and blue paint were distinguished. A batch media made of slaked lime/slaked magnesian lime, bone white, and white antimony was involved in all colors. The presence of rare pigments, such as stibnite and white antimony, can be explained by the close proximity of the town to the Ural Mountains, with a large variety of mineral deposits [76,77,78].
Most likely, several masters accompanied by apprentices worked together, each with their own recipe and a personal mixing experience. This was also customary elsewhere in the Medieval period [81]. Even if different pigments were used for a certain color, the masters obtained similar tones. A similar situation was described by Baraldi et al. [66] for the Roman frescoes from Italy.
The Russian artisans had a good knowledge of the mineral substances and their compatibility/incompatibility, and consequently the colors remained unchanged over several centuries. This study contributes to the knowledge of the artisan decoration and the art of frescoes in the late Medieval ages in the easternmost part of Europe. New insights into the chemical composition of frescoes provide useful data for future restoration and maintenance works. Further studies using, for example, portable Raman spectroscopy will bring new insights and validate/invalidate certain pigments.

Supplementary Materials

The following are available online at https://www.mdpi.com/2075-163X/9/2/114/s1: Table S1: Pigments (alphabetically ordered) discussed in the text. Mineralogy and chemistry based on IMA List of Minerals [40]; Table S2: List of the frescoes studied and their location in the church. Abbreviation: Fr# = Fresco number; Table S3: Raw chemical data for all paints, as obtained by in situ pXRF measurements and the grouping of color types. All elements are in mass % oxides. The yellow highlight marks the most significant element for each color; Table S4: Calculated standard deviation and average content for all paints; Figure S1: Charts showing the distribution and the weight of main oxides (in mass %) in the white (a), yellow (b), orange (c) and pink (d) paints. The charts show the chemical grouping within the white and pink colors; Figure S2: Charts showing the distribution and the weight of main oxides (in mass %) in the brown (a) and red (b) paints. The charts show the grouping within the brown and red colors; Figure S3: Charts showing the distribution and the weight of main oxides (in mass %) in the grey (a), black (b), green (c) and blue (d) paints. The charts show the grouping within the grey, black, green and blue colors.

Author Contributions

Conceptualization, R.K. and P.K.; Data curation, A.G.; Formal analysis, B.G.; Funding acquisition, R.K.; Investigation, B.G.; Methodology, A.S.; Project administration, R.K. and P.K.; Validation, R.K., C.I., A.S. and A.G.; Visualization, C.I.; Writing–original draft, R.K. and C.I.; Writing–review & editing, C.I. and R.K.

Funding

This research was funded by Russian Foundation for Basic Research (RFFI) Grant No. 17-06-00560 and the Fund “Renaissance” of the Republic of Tatarstan. C.I. acknowledges subsidy from the Russian Government to support the Program of competitive growth of Kazan Federal University.

Acknowledgement

The authors are really grateful to the anonymous reviewers whose pertinent comments and suggestions greatly helped to improve the manuscript. Thanks are also due to Monica Mereu for the computer drawings. Valery Kosushkin gave valuable advice during the pXRF investigation including selecting the analytical points.

Conflicts of Interest

The authors declare no conflict of interest. The funders had no role in the design of the study; in the collection, analyses, or interpretation of data; in the writing of the manuscript, or in the decision to publish the results.

References

  1. Deneckere, A.; Schudel, W.; Van Bos, M.; Wouters, H.; Bergmans, A.; Vandenabeele, P.; Moens, L. In situ investigations of vault paintings in the Antwerp cathedral. Spectrochim. Acta Part A 2010, 75, 511–519. [Google Scholar] [CrossRef] [PubMed]
  2. Izzo, F.C.; Capogrosso, V.; Gironda, M.; Alberti, R.; Mazzei, C.; Nodari, L.; Gambirasi, A.; Zendria, E.; Nevin, A. Multi-analytical non-invasive study of modern yellow paints from postwar Italian paintings from the International Gallery of Modern Art Cà Pesaro, Venice. X-Ray Spectrom. 2015, 44, 296–304. [Google Scholar] [CrossRef]
  3. Samanian, K. Identification of pigment used in Persian wall paintings (AD 1501-1736) using PLM, FT-IR, SEM/EDX and GC-MS techniques. Archaeometry 2015, 57, 740–758. [Google Scholar] [CrossRef]
  4. Hein, A.; Karatasios, I.; Mourelatos, D. Byzantine wall paintings from Mani (Greece): Microanalytical investigation of pigments and plasters. Anal. Bioanal. Chem. 2009, 395, 2061–2071. [Google Scholar] [CrossRef]
  5. Linn, R. Layered pigments and painting technology of the Roman wall paintings of Caesarea Maritima. J. Archaeol. Sci. Rep. 2017, 11, 774–781. [Google Scholar] [CrossRef]
  6. Uvarov, V.; Popov, I.; Rozenberg, S. X-ray diffraction and SEM investigation of wall paintings found in the Roman Temple Complex at Horvat Omrit, Israel. Archaeometry 2015, 57, 773–787. [Google Scholar] [CrossRef]
  7. Holclajtner-Antunović, I.; Stojanović-Marić, M.; Bajuk-Bogdanović, D.; Žikić, R.; Uskoković-Marković, S. Multi-analytical study of techniques and palettes of wall paintings of the monastery of Žiča, Serbia. Spectrochim. Acta Part A 2016, 156, 78–88. [Google Scholar] [CrossRef]
  8. Marić-Stojanović, M.; Bajuk-Bogdanović, D.; Uskoković-Marković, S.; Holclajtner-Antunović, I. Spectroscopic analysis of XIV century wall paintings from Patriarchate of Peć Monastery, Serbia. Spectrochim. Acta Part A 2018, 191, 469–477. [Google Scholar] [CrossRef]
  9. Mohanu, I.; Mohanu, D.; Gomoiu, I.; Barbu, O.H.; Fechet, R.M.; Vlad, N.; Voicu, G.; Truşcă, G. Study of the frescoes in Ioneştii Govorii wooden church (Romania) using multi-technique investigations. Microchem. J. 2016, 126, 332–340. [Google Scholar] [CrossRef]
  10. Čechák, T.; Gerndt, J.; Musílek, L.; Kopecká, I. Analysis of fresco paintings by X-ray fluorescence method. Radiat. Phys. Chem. 2001, 61, 717–719. [Google Scholar] [CrossRef]
  11. Cesareo, R.; Castellano, A.; Buccolieri, G.; Quarta, S.; Marabelli, M.; Santopadre, P.; Ioele, M.; Gigante, G.E.; Ridolfi, S. From Giotto to De Chirico: Analysis of paintings with portable EDXRF equipment. In Cultural Heritage Conservation and Environmental Impact Assessment by Non-Destructive Testing and Micro-Analysis; Van Grieken, R., Janssens, K., Eds.; Taylor and Francis Group, A.A. Balkema Publ.: Leiden, The Netherlands, 2004; pp. 183–196. ISBN 9789058096814. [Google Scholar]
  12. Zucchiatti, A.; Prati, P.; Bouquillon, A.; Giuntini, L.; Massi, M.; Migliori, A.; Cagnana, A.; Roascio, S. Characterisation of early medieval frescoes by μ-PIXE, SEM and Raman spectroscopy. Nucl. Instrum. Methods Phys. Res. Sect. B 2004, 219–220, 20–25. [Google Scholar] [CrossRef]
  13. Nord, A.G.; Tronner, K.; Billström, K.; Strandberg Zerpe, B. Analysis of mediaeval Swedish paintings influenced by Russian-Byzantine art. J. Cult. Herit. 2017, 23, 162–169. [Google Scholar] [CrossRef]
  14. Miriello, D.; Bloise, A.; Crisci, G.M.; De Luca, R.; De Nigris, B.; Martellone, A.; Osanna, M.; Pace, R.; Pecci, A.; Ruggieri, N. Non-destructive multi-analytical approach to study the pigments of wall painting fragments reused in mortars from the archaeological site of Pompeii (Italy). Minerals 2018, 8, 134. [Google Scholar] [CrossRef]
  15. Duran, A.; Perez-Rodriguez, J.L.; Jimenez de Haro, M.C.; Franquelo, M.L.; Robador, M.D. Analytical study of Roman and Arabic wall paintings in the Patio De Banderas of Reales Alcazares’ Palace using non-destructive XRD/XRF and complementary techniques. J. Archaeol. Sci. 2011, 38, 2366–2377. [Google Scholar] [CrossRef]
  16. Vornicu, N.; Bibire, C.; Murariu, E.; Ivanov, D. Analysis of mural paintings using in situ non-invasive XRF, FTIR spectroscopy and optical microscopy. X-Ray Spectrom. 2013, 42, 380–387. [Google Scholar] [CrossRef]
  17. Mendoza Cuevas, A.; Bernardini, F.; Gianoncelli, A.; Tuniz, C. Energy dispersive X ray diffraction and fluorescence portable system for cultural heritage applications. X-Ray Spectrom. 2015, 44, 105–115. [Google Scholar] [CrossRef]
  18. Simsek, G.; Unsalan, O.; Bayraktar, K.; Colomban, P. On-site pXRF analysis of glaze composition and coloring agents of “Iznik” tiles at Edirne mosques (15th and 16th-centuries). Ceram. Int. 2019, 45, 595–605. [Google Scholar] [CrossRef]
  19. Simsek, G.; Casadio, F.; Colomban, P.; Bellot-Gurlet, L.; Faber, K.T.; Zelleke, G.; Milande, V.; Moinet, E. On-Site Identification of early BÖTTGER red stoneware made at Meissen using portable XRF: 1, Body Analysis. J. Am. Ceram. Soc. 2014, 97, 2745–2754. [Google Scholar] [CrossRef]
  20. Ridolfi, S. Portable EDXRF in a multi-technique approach for the analyses of paintings. Insight Non-Destruct. Test. Condit. Mon. 2017, 59, 273–275. [Google Scholar] [CrossRef]
  21. Gabdrakhmanov, N.K.; Ulengov, R.A.; Gorelova, Y.N. The historic city of the Republic of Tatarstan as a basis for regional tourism cluster. J. Organ. Cult. Commun. Confl. 2016, 20, 46. [Google Scholar]
  22. Hussey, J.M. The Orthodox Church in the Byzantine Empire; Oxford University Press: Oxford, UK, 2010; p. 456. ISBN 9780199582761. [Google Scholar]
  23. Bikiaris, D.; Daniilia, S.; Sotiropoulou, S.; Katsimbiri, O.; Pavlidou, E.; Moutsatsou, A.P.; Chryssoulakis, Y. Ochre-differentiation through micro-Raman and micro-FTIR spectroscopies: Application on wall paintings at Meteora and Mount Athos, Greece. Spectrochim. Acta Part A 1999, 56, 3–18. [Google Scholar] [CrossRef]
  24. Khramchenkova, R.H.; Batalin, G.A.; Gareev, B.I.; Kaplan, P.J.; Kosushkin, V.F.; Nuzhdin, E.V.; Safina, I.R.; Sitdikov, A.G. Investigation of the Layer of Fresco Painting. In Kazan. Assumption Cathedral. Study and Preservation; Valeeva, R.M., Sitdikova, A.G., Hajrutdinova, R.R., Eds.; Glavdizajn OOO: Kazan, Tatarstan, 2016; Volume 2, pp. 123–141. (In Russian) [Google Scholar]
  25. Valeev, R.M.; Sitdikov, A.G.; Hajrutdinov, R.R. (Eds.) Kazan. Assumption Cathedral. Study and Preservation; Glavdizajn OOO: Kazan, Tatarstan, 2016; Volume 2, pp. 94–181. (In Russian) [Google Scholar]
  26. Kotulanová, E.; Bezdicka, P.; Hradil, D.; Hradilová, J.; Svarcová, S.; Grygar, T. Degradation of lead-based pigments by salt solutions. J. Cult. Herit. 2009, 10, 367–378. [Google Scholar] [CrossRef]
  27. Unković, N.; Ljaljević Grbić, M.; Subakov-Simić, G.; Stupar, M.; Vukojević, J.; Jelikić, A.; Stanojević, D. Biodeteriogenic and toxigenic agents on 17th century mural paintings and façade of the old church of the Holy Ascension (Veliki Krčimir, Serbia). Indoor. Built. Environ. 2015, 25, 826–837. [Google Scholar] [CrossRef]
  28. Karpovich-Tate, N.; Rebrikova, N.L. Microbial communities on damaged frescoes and building materials in the cathedral of the Nativity of the Virgin in the Pafnutii-Borovskii Monastery, Russia. Intern. Biodeter. 1991, 27, 281–296. [Google Scholar] [CrossRef]
  29. Brysbaert, A.; Melessanaki, K.; Anglos, D. Pigment analysis in Bronze Age Aegean and Eastern Mediterranean painted plaster by laser-induced breakdown spectroscopy (LIBS). J. Archaeol. Sci. 2006, 33, 1095–1104. [Google Scholar] [CrossRef]
  30. Jones, R.E.; Photos-Jones, E. Source: Technical studies of Aegean Bronze Age wall painting: Methods, results and future prospects. Br. Sch. Athens Stud. 2005, 13, 199–228. [Google Scholar]
  31. Westlake, P.; Siozos, P.; Philippidis, A.; Apostolaki, C.; Derham, B.; Terlixi, A.; Perdikatsis, V.; Jones, R.; Anglos, D. Studying pigments on painted plaster in Minoan, Roman and Early Byzantine Crete. A multi-analytical technique approach. Anal. Bioanal. Chem. 2012, 402, 1413–1432. [Google Scholar] [CrossRef]
  32. Elsen, J. Microscopy of historic mortars—A review. Cement Concr. Res. 2006, 36, 1416–1424. [Google Scholar] [CrossRef]
  33. Stulik, D. Paint. In The Science of Paintings; Taft, W.S., Mayer, J.W., Eds.; Springer: New York, NY, USA, 2000; pp. 12–25. ISBN 0-387-98722-3. [Google Scholar]
  34. Bläuer-Böhm, C.; Jägers, E. Analysis and recognition of dolomitic lime mortars. In Roman Wall Painting Materials, Techniques, Analysis and Conservation; Béarat, H., Fuchs, M., Maggetti, M., Paunier, D., Eds.; Institute of Mineralogy and Petrography Fribourg: Fribourg, Switzerland, 1997; pp. 223–235. [Google Scholar]
  35. Taft, W.S.; Mayer, J.W. The Science of Paintings; Springer: New York, NY, USA, 2000; p. 236. ISBN 0-387-98722-3. [Google Scholar]
  36. Coccato, A.; Moens, L.; Vandenabeele, P. On the stability of mediaeval inorganic pigments: A literature review of the effect of climate, material selection, biological activity, analysis and conservation treatments. Herit. Sci. 2017, 5, 25. [Google Scholar] [CrossRef]
  37. Horgnies, M.; Darque-Ceretti, E.; Bayle, M.; Gueita, E.; Aucouturier, M. An exceptionally perennial surface artwork: Fresco on lime or on cement. Surf. Interface Anal. 2014, 46, 791–795. [Google Scholar] [CrossRef]
  38. Edwards, H.G.M.; Farrel, D.W. The conservational heritage of wall paintings and buildings: An FT-Raman spectroscopic study of prehistoric, Roman, mediaeval and Renaissance lime substrates and mortars. J. Raman Spectrosc. 2008, 39, 985–992. [Google Scholar] [CrossRef]
  39. Konta, J. Clay and man: Clay raw materials in the service of man. Appl. Clay Sci. 1995, 10, 275–335. [Google Scholar] [CrossRef]
  40. Hradil, D.; Grygar, T.; Hradilová, J.; Bezdička, P. Clay and iron oxide pigments in the history of painting. Appl. Clay Sci. 2003, 22, 223–236. [Google Scholar] [CrossRef]
  41. IMA (International Mineralogical Association). List of Minerals. Available online: http://nrmima.nrm.se//IMA_Master_List_%282018-11%29.pdf (accessed on 1 December 2018).
  42. Neuendorf, K.K.E.; Mehl, J.P., Jr.; Jackson, J.A. (Eds.) Glossary of Geology, 5th ed. revised.; American Geosciences Institute Alexandria: Alexandria, VA, USA, 2011; p. 783. [Google Scholar]
  43. Eastaugh, N.; Walsh, V.; Chaplin, T.; Siddall, R. The Pigment Compendium: A Dictionary of Historical Pigments; Elsevier Butterworth-Heinemann: Amsterdam, The Netherlands, 2004; p. 499. ISBN 100750689803. [Google Scholar]
  44. Petushkova, J.P.; Lyalikova, N.N. Microbiological degradation of lead-containing pigments in mural paintings. Stud. Conserv. 1986, 31, 65–69. [Google Scholar] [CrossRef]
  45. Aze, S.; Vallet, J.M. Chromatic degradation processes of red lead pigment. Chem. Preprint Arch. 2002, 6, 236–243. Available online: http://preprint.chemweb.com/inorgchem/0206001 (accessed on 14 February 2019).
  46. Iordanidis, A.; Garcia-Guinea, J.; Strati, A.; Gkimourtzina, A.; Papoulidou, A. Byzantine wall paintings from Kastoria, northern Greece: Spectroscopic study of pigments and efflorescing salts. Spectrochim. Acta Part A 2011, 78, 874–887. [Google Scholar] [CrossRef]
  47. Gettens, R.J.; Fitzhugh, E.W.; Feller, R.L. Calcium carbonate whites. Stud. Conserv. 1974, 19, 157–184. [Google Scholar] [CrossRef]
  48. Berke, H. The invention of blue and purple pigments in ancient times. Chem. Soc. Rev. 2007, 36, 15–30. [Google Scholar] [CrossRef]
  49. Deer, W.A.; Howie, R.A.; Zussman, J. An Introduction to the Rock-Forming Minerals; Pearson Prentice Hall: London, UK, 1992; p. 696. [Google Scholar]
  50. Colomban, P. Lapis lazuli as unexpected blue pigment in Iranian Lâjvardina ceramics. J. Raman Spectrosc. 2003, 34, 420–423. [Google Scholar] [CrossRef]
  51. Hernanz, A.; Gavira-Vallejo, J.M.; Ruiz-López, J.F.; Edwards, H.G.M. A comprehensive micro-Raman spectroscopic study of prehistoric rock paintings from the Sierra de las Cuerdas, Cuenca, Spain. J. Raman Spectrosc. 2008, 39, 972–984. [Google Scholar] [CrossRef]
  52. Mason, B.; Vitaliano, C.J. The mineralogy of the antimony oxides and antimonates. Miner. Mag. 1953, 30, 100–112. [Google Scholar] [CrossRef]
  53. Taylor, B.N. The International System of Units (SI); USA National Institute of Standards and Technology Special Publication 330: Washington, DC, USA, 2001; p. 75. [Google Scholar]
  54. Fieshbeck, K. Logarithmische Rechentafeln für Chemiker, Pharmazeuten, Medziner und Physiker; Walter de Gruyter: Berlin, Germany; New York, NY, USA, 1972; p. 81. [Google Scholar]
  55. Bro, R.; Smilde, A.K. Principal Component analysis. J. Anal. Methods Chem. 2014, 6, 2812–2831. [Google Scholar] [CrossRef]
  56. Kolovrat (Mihajlova), N. Fresco technique. Himija i zhizn 1969, 6, 30–33. Available online: http://www.domarchive.ru/gallery/freska/3474 (accessed on 14 February 2019). (In Russian).
  57. Makita, M.; Esperón, M.; Pereyra, B.; López, A.; Orrantia, E. Reduction of arsenic content in a complex galena concentrate by Acidithiobacillus ferrooxidans. BMC Biotechnol. 2004, 4, 22. [Google Scholar] [CrossRef]
  58. Molera, J.; Coll, J.; Labrador, A.; Pradell, T. Manganese brown decorations in 10th to 18th century Spanish tin glazed ceramics. Appl. Clay Sci. 2013, 82, 86–90. [Google Scholar] [CrossRef]
  59. Piovesan, R.; Siddall, R.; Mazzoli, C.; Nodari, L. The Temple of Venus (Pompeii): A study of the pigments and painting techniques. J. Archaeol. Sci. 2011, 38, 2633–2643. [Google Scholar] [CrossRef]
  60. Germinario, C.; Francesco, I.; Mercurio, M.; Langella, A.; Sali, D.; Kakoulli, I.; De Bonis, A.; Grifa, C. Multi-analytical and non-invasive characterization of the polychromy of wall paintings at the Domus of Octavius Quartio in Pompeii. Eur. Phys. J. Plus 2018, 133, 359. [Google Scholar] [CrossRef]
  61. Amato, S.R.; Bersani, D.; Lottici, P.P.; Pogliani, P.; Pelosi, C. A multi-analytical approach to the study of the mural paintings in the presbytery of Santa Maria Antiqua al Foro Romano in Rome. Archaeometry 2017, 59, 1050–1064. [Google Scholar] [CrossRef]
  62. Khramchenkova, R.; Gubaidullin, A.; Safina, I.; Nuzdin, E. Chemical composition of the fragment of Islamic enamel glass vessel 13th centuries. In Proceedings of the Technart Symposium on Non-destructive and Microanalytical Techniques in Art and Cultural Heritage, Catania, Italy, 27–30 April 2015; p. 141. [Google Scholar]
  63. Bersani, D.; Berzioli, M.; Caglio, S.; Casoli, A.; Lottici, P.P.; Medeghini, L.; Poldi, G.; Zannini, P. An integrated multi-analytical approach to the study of the dome wall paintings by Correggio in Parma cathedral. Microchem. J. 2014, 114, 80–88. [Google Scholar] [CrossRef]
  64. Kovács, J.; Kovácsné-Székely, I. Understanding the spatio-temporal samples: A practical view for geologists. Földt. Közl. 2006, 136, 139–146, (In Hungarian, in original). [Google Scholar]
  65. Gettens, R.J.; Stout, G.L. A monument of Byzantine wall painting: The method of construction. Stud. Conserv. 1958, 3, 107–119. [Google Scholar]
  66. Baraldi, P.; Bonazzi, A.; Giordani, N.; Paccagnella, F.; Zannini, P. Analytical characterization of Roman plasters of the ‘Domus Farini’ in Modena. Archaeometry 2006, 48, 481–499. [Google Scholar] [CrossRef]
  67. Avlonitou, L. Pigments and colors: An inside look at the painted decoration of the Macedonian funerary monuments. J. Archaeol. Sci. 2016, 7, 668–678. [Google Scholar] [CrossRef]
  68. Bakiler, M.; Kırmızı, B.; Öztürk, Ö.O.; Hanyalı, Ö.B.; Dağ, E.; Çağlar, E.; Köroğlu, G. Material characterization of the Late Roman wall painting samples from Sinop Balatlar Church Complex in the black sea region of Turkey. Microchem. J. 2016, 126, 263–273. [Google Scholar] [CrossRef]
  69. Lepot, L.; Denoël, S.; Gilbert, B. The technique of the mural paintings of the Tournai Cathedral. J. Raman Spectrosc. 2006, 37, 1098–1103. [Google Scholar] [CrossRef]
  70. Hernanz, A.; Bratu, I.; Marutoiu, O.F.; Marutoiu, C.; Gavira-Vallejo, J.M.; Edwards, H.G.M. Micro-Raman spectroscopic investigation of external wall paintings from St. Dumitrus Church, Suceava, Romania. Anal. Bioanal. Chem. 2008, 392, 263–268. [Google Scholar] [CrossRef]
  71. Buzgar, N.; Buzatu, A.; Apopei, A.-I.; Cotiugă, V. In situ Raman spectroscopy at the Voroneţ Monastery (16th century, Romania): New results for green and blue pigments. Vib. Spectrosc. 2014, 72, 142–148. [Google Scholar] [CrossRef]
  72. Cheilakou, E.; Troullinos, M.; Koui, M. Identification of pigments on Byzantine wall paintings from Crete (14th century AD) using non-invasive Fiber Optics Diffuse Reflectance Spectroscopy (FORS). J. Archaeol. Sci. 2014, 41, 541–555. [Google Scholar] [CrossRef]
  73. Barbu, O.-H.; Zahariade, A. Noninvasive in situ study of pigments in artworks by means of VIS, IRFC image analysis, and X-ray fluorescence spectrometry. COLOR Res. Appl. 2016, 41, 321–324. [Google Scholar] [CrossRef]
  74. Forbes, R.J. Metallurgy in Antiquity. A Notebook for Archaeologists and Technologists; Brill Archive: Leiden, The Netherlands, 1950; p. 489. [Google Scholar]
  75. Wang, C.Y. Antimony: Its History, Chemistry, Mineralogy, Geology, Mettalurgy, Uses, Preparations, Analysis, Production, and Valuation; with Complete Bibliographies, 2nd ed.; Charles Griffin & Co. Ltd.: London, UK, 1919; p. 225. [Google Scholar]
  76. Puchkov, V.N. General features relating to the occurrence of mineral deposits in the Urals: What, where, when and why. Ore Geol. Rev. 2017, 85, 4–29. [Google Scholar] [CrossRef]
  77. Maslennikov, V.V.; Maslennikova, S.P.; Large, R.R.; Danyushevsky, L.V.; Herrington, R.J.; Ayupova, N.R.; Zaykov, V.V.; Lein, A.Y.; Tseluyko, A.S.; Melekestseva, I.Y. Chimneys in Paleozoic massive sulfide mounds of the Urals VMS deposits: Mineral and trace element comparison with modern black, grey, white and clear smokers. Ore Geol. Rev. 2017, 85, 64–106. [Google Scholar] [CrossRef]
  78. Givental, E. Three Hundred Years of Glory and Gloom: The Urals Region of Russia in Art and Reality; SAGE Open: Thousand Oaks, CA, USA, 2013; pp. 1–9. [Google Scholar]
  79. Gimbutas, M. Bronze Age Cultures in Central and Eastern Europe; De Gruyter Mouton & Co Publ.: The Hague, The Netherlands, 1965; ISBN-10 3111283410, ISBN-13: 978-3111283418; 784p. [Google Scholar]
  80. Giovannoni, S.; Matteini, M.; Moles, A. Studies and developments concerning the problem of altered lead pigments in wall painting. Stud. Conserv. 1990, 35, 21–25. [Google Scholar] [CrossRef]
  81. Edwards, H.G.M.; Farrel, D.W.; Newton, E.M.; Perez, R.F. Minium; FT-Raman non-destructive analysis applied to an historical controversy. Analyst 1999, 124, 1323–1326. [Google Scholar] [CrossRef]
  82. Alekseev-Aljurvi, J.V. Colorful Raw Materials and Paints Used in Painting; AOOT Tver’: Moskow, Russia, 2004; pp. 238–247. (In Russian) [Google Scholar]
Figure 1. (a) The fresco #1, “The Assumption of the Mother of God” with the location of some of the analyzed points; (b) Detailed image of the fresco, with the portable X-ray fluorescence (XRF) analyzer.
Minerals 09 00114 g001
Figure 2. Plot of chemical data for all colors in the discrimination diagrams: (a) PbO versus SO3; (b) CaO versus MgO; (c) CaO versus Sb2O3; and (d) CaO versus P2O5.
Minerals 09 00114 g002
Figure 3. Plot of chemical data for all colors in the discrimination diagrams: (a) CaO versus SO3; (b) Al2O3 versus SiO2; (c) Fe2O3 versus K2O; and (d) SO3 versus Sb2O3.
Minerals 09 00114 g003
Figure 4. Principal component analysis for the compositional data for all paints in the frescoes. The arrows are the main vectors. The length of the arrow is in agreement with the importance of the vector.
Minerals 09 00114 g004
Table 1. Factors F1 and F2 and the correlation coefficients among main variables.
VariablesCaOMgOFe2O3PbOSO3Sb2O3Al2O3SiO2P2O5
F10.970.25−0.37−0.50−0.530.93−0.22−0.330.46
F2−0.070.61−0.570.650.68−0.04−0.34−0.500.42
Table 2. The prevalent elements and the inferred recipes used for the fresco paints. The predominant compounds are in bold, and the subordinated compounds are in italics.
Color TypeDominant Chemical ElementInferred Recipes (Main Pigments)
White APbMgAnglesiteSlaked dolomitic lime
White BCaMgSbSlaked limeSlaked dolomitic limeAntimony white
YellowCaMgFeSlaked limeSlaked dolomitic limeYellow ochre
OrangeCaMgFeSlaked limeSlaked dolomitic limeRed and yellow ochre
Pink AFePbCaRed ochreLitharge (Minium?)—Slaked lime
Pink BPbMgLitharge (Minium?)Slaked dolomitic lime
Brown AFePYellow ochreBone black
Brown BPbMassicot
Brown CCaPFeBone blackYellow ochre
Red AFeRed ochre
Red BPbFeAsLitharge (Minium)Red ochreRealgar
Grey AFeMagnetite
Grey BCaSbSlaked limeStibnite
Grey CPb(As)Anglesite (As)
Black APSbCaBone blackStibniteSlaked lime
Black BPbFeGalenaMagnetite
Black CPbPlattnerite
Green AFeCaCuGreen earthSlaked limeMalachite? (Chrysocolla?)
Green BPbFeAsAnglesiteYellow ochreOrpiment
Blue AFeBlue ochre (Vivianite)
Blue BPbWhite lead (Anglesite) + Blue lead (Galena)
Blue CCaCuSbSlaked limeAzurite(Egyptian blue?)Stibnite

