Article

Scrubbing and Inhibiting Coagulation Effect on the Purification of Natural Powder Quartz

School of Chemical and Environmental Engineering, China University of Mining and Technology (Beijing), Beijing 100083, China
*
Authors to whom correspondence should be addressed.
Minerals 2019, 9(3), 140; https://doi.org/10.3390/min9030140
Submission received: 27 January 2019 / Revised: 19 February 2019 / Accepted: 19 February 2019 / Published: 26 February 2019
(This article belongs to the Special Issue Physical Separation and Enrichment)

Abstract

:
The low removal efficiency of fine clay impurities in natural powder quartz (NPQ) is the main problem that affects the practical utilization of this natural resource. In this work, detailed characterizations of NPQ and clay impurities in NPQ were analyzed by SEM-EDS, mineral liberation analysis (MLA) and impurities distribution analysis. A combined physical purification process, including sieving, scrubbing and centrifugation, was applied to remove the clay impurities. It was observed that the fine clay impurities adhering on quartz surface were effectively liberated by scrubbing, and the content of Fe2O3 and Al2O3 in the concentrate decreased from 0.48% and 0.40% to less than 0.01% and 0.02% at pH 9.3 or when the dosage of sodium hexametaphosphate (SHMP) was 1 × 10³ g/t. The coagulation interaction between quartz and impurities including hematite and orthoclase were analyzed based on the classical Deyaguin-Landau-Verwey-Overbeek (DLVO) theory. The results indicated that the main coagulation affecting the separation efficiency was the heterocoagulation between quartz and impurities and homocoagulation among hematite particles. Furthermore, adding regulators such as sodium hydroxide (NaOH) or SHMP could significantly decrease the zeta potential of minerals and thus increase the total interaction energy (VT), which could effectively improve the dispersion of these fine impurity particles, and consequently improve the removal efficiency of impurities. Reverse increase of the zeta potential of minerals in strongly alkaline solutions or excessive SHMP were detected, which was likely the main factor limiting the further improvement of the purification efficiency.

1. Introduction

Quartz is a highly critical and strategic material for advanced and emerging industrial technologies, which can be used extensively in advanced manufacturing of materials such as optical fibers, semi-conduct materials, highly pure glass in aerospace, etc. [1,2]. Considering the constant demand for better living standards of the increasing population, more and more quartz resources will be required in the future. Among different natural quartz resources, crystal is still the first choice for high purity quartz preparation. However, high purity crystal resources are rare in the world. Hence, researchers have tried to purify other natural quartz resources such as quartzite, quartz sand and white sand as substitutes [3,4]. In order to remove impurities, various processing methods were used. Physical methods such as magnetic separation, reverse flotation [5,6], and chemical treatment such as acidic leaching by hydrogen fluoride (HF) combined with other different fractions strong industrial acids such as HCl, HNO3 or H2SO4 [2,7] were usually employed. In addition, some other new purification methods were also proposed, including bioleaching, supersonic-enhanced leaching and microwave explosion [8,9]. Because of the scarcity of high-quality resources and the high processing costs, developing feasible and economical processing technology is especially important.
NPQ is a natural quartzose material which is widely distributed in China; it is formed by the the weathering of quartzite [10]. The characteristics of this resource include about 97–99% SiO2, integrity granular shape and extremely fine grain (D90 is approximately 67 μm and D50 is around 39 μm) compared with other quartz resource. However, this resource is contaminated by different contents of impurities such as Fe2O3 and Al2O3 coming from fine clay minerals, which might significantly limit its application. Additionally, these fine clay impurities generated in the weathering course or exploitation are difficult to remove.
The traditional purification methods for NPQ include elutriation, flushing by quantitative water and spontaneous precipitation in a settling basin [11]. However, these methods have low separating efficiencies and high operation costs in practical applications. With the improvement in separation technologies, some methods such as magnetic separation and reverse flotation were applied for the purification of NPQ [12,13]. However, all these reported methods were inefficient for the removal of fine clay minerals in NPQ. The main reason for the low removal efficiency is that the impurity contents were so scarce that they could not be definitively distinguished by traditional methods, which limited advances in purification methods. On the other hand, chemical treatment with excellent desliming effect has disadvantages, such as high operation costs and acid wastewater discharge, causing environmental problems, etc. Hence, the efficient utilization of NPQ resources on a large scale was delayed. Therefore, the removal of fine clay impurities from NPQ by an effective, environmentally friendly and affordable process is particularly critical for the large scale industrial utilization of NPQ.
Attrition scrubbing has been used as a physical decontamination treatment in many fields of mineral purification, especially in the removal of clay impurities from target mineral surfaces [14,15,16]. Centrifugal separation is one of the cost-effective solutions for the treatment of waste water, flotation slurries and chemical industry [17,18]. Hence, it is expected that the scrubbing-centrifugation technology could be an ideal method for the removal of clay impurities in NPQ.
In this paper, the feasibility of a combination technique of sieving, scrubbing and centrifugal separation on the removal of clay impurities in NPQ was investigated. In order to purify NPQ more efficiently, both NaOH and SHMP were added as regulators in the purification process. Furthermore, the possible mechanisms were also proposed by studying the heterocoagulation and homocoagulation between quartz and impurity particles according to the DLVO theory.

2. Materials and Methods

2.1. Materials

The raw ore of NPQ used in this study was obtained from JiangXi province, China. The main chemical composition was measured by ICP-AES (inductively-coupled plasma atomic emission spectrometry) and the result is presented in Table 1. As shown in Table 1, NPQ is mainly composed of SiO2 (98.88%), and the main impurities are Al2O3 (0.48%) and Fe2O3 (0.19%); there are some other impurities like TiO2, CaO, and MgO, etc. X-ray diffraction (XRD) was used to examine the purity of raw ore; the XRD pattern are presented in Figure 1. Figure 1 shows that the main peaks match well with the standard quartz peaks. However, no clear impurity peaks were observed, since the impurity content is too low, i.e., it exceeded the detection limit of XRD analysis.
All the reagents used in this study were chemically pure and purchased from Beijing Chemical Reagent Company (Beijing, China). Distilled water was used throughout the experiments.

2.2. Purification Methods

Highly concentrated (about 75%) pulp was prepared by adding 175 g water to 500 g raw ore, and then scrubbing tests were performed in vessels for about 25 min with the stirring rate of 1500 rpm. An appropriate amount of regulators (NaOH or SHMP) was pre-dissolved in 5 mL of water and then added to the scrubbing suspension at room temperature. After scrubbing, the pulp was stirred and dispersed for 5 min with extra 1750 mL water before being sieved using a 200 mesh standard screen (75 μm); the oversized product was tailing and labelled as “T1”. The under-sized product was centrifuged at 315 rpm (RCF (relative centrifugal force) =10) for 1 min. The sediment of centrifugation was concentrated and labelled “Con”, and the suspension of centrifugation was tailing and labelled “T2”. All products were dried and weighed for analysis.

2.3. Equipment

The chemical compositions of the raw NPQ and purification products were measured using an ICP-OES (Agilent730, Agilent Technologies, Santa Clara, CA, USA). The crystalline phase identification of samples were undertaken by X-ray diffraction analysis D8 ADVANCE (Bruker, Billerica, MA, USA), equipped with a Cu-Kα radiation at a goniometer rate of 2θ = 4°/min and the crystalline phase identification of trace impurities were detected by MLA. Microstructures were investigated by scanning electron microscopy (HT7700, Hitachi, Tokyo, Japan) at 10.0 KV, equipped with energy-dispersive microanalysis facilities (EDS). Zeta (ζ) potentials were measured using a Brookhaven zeta potential analyzer and three runs of measurement were conducted. The Mineral Liberation Analyser (MLA250, FEI, Hillsboro, OR, USA) was provided by Beijing General Research Institute of Mining & Metallurgy (BGRIMM, Beijing, China).

3. Results and Discussion

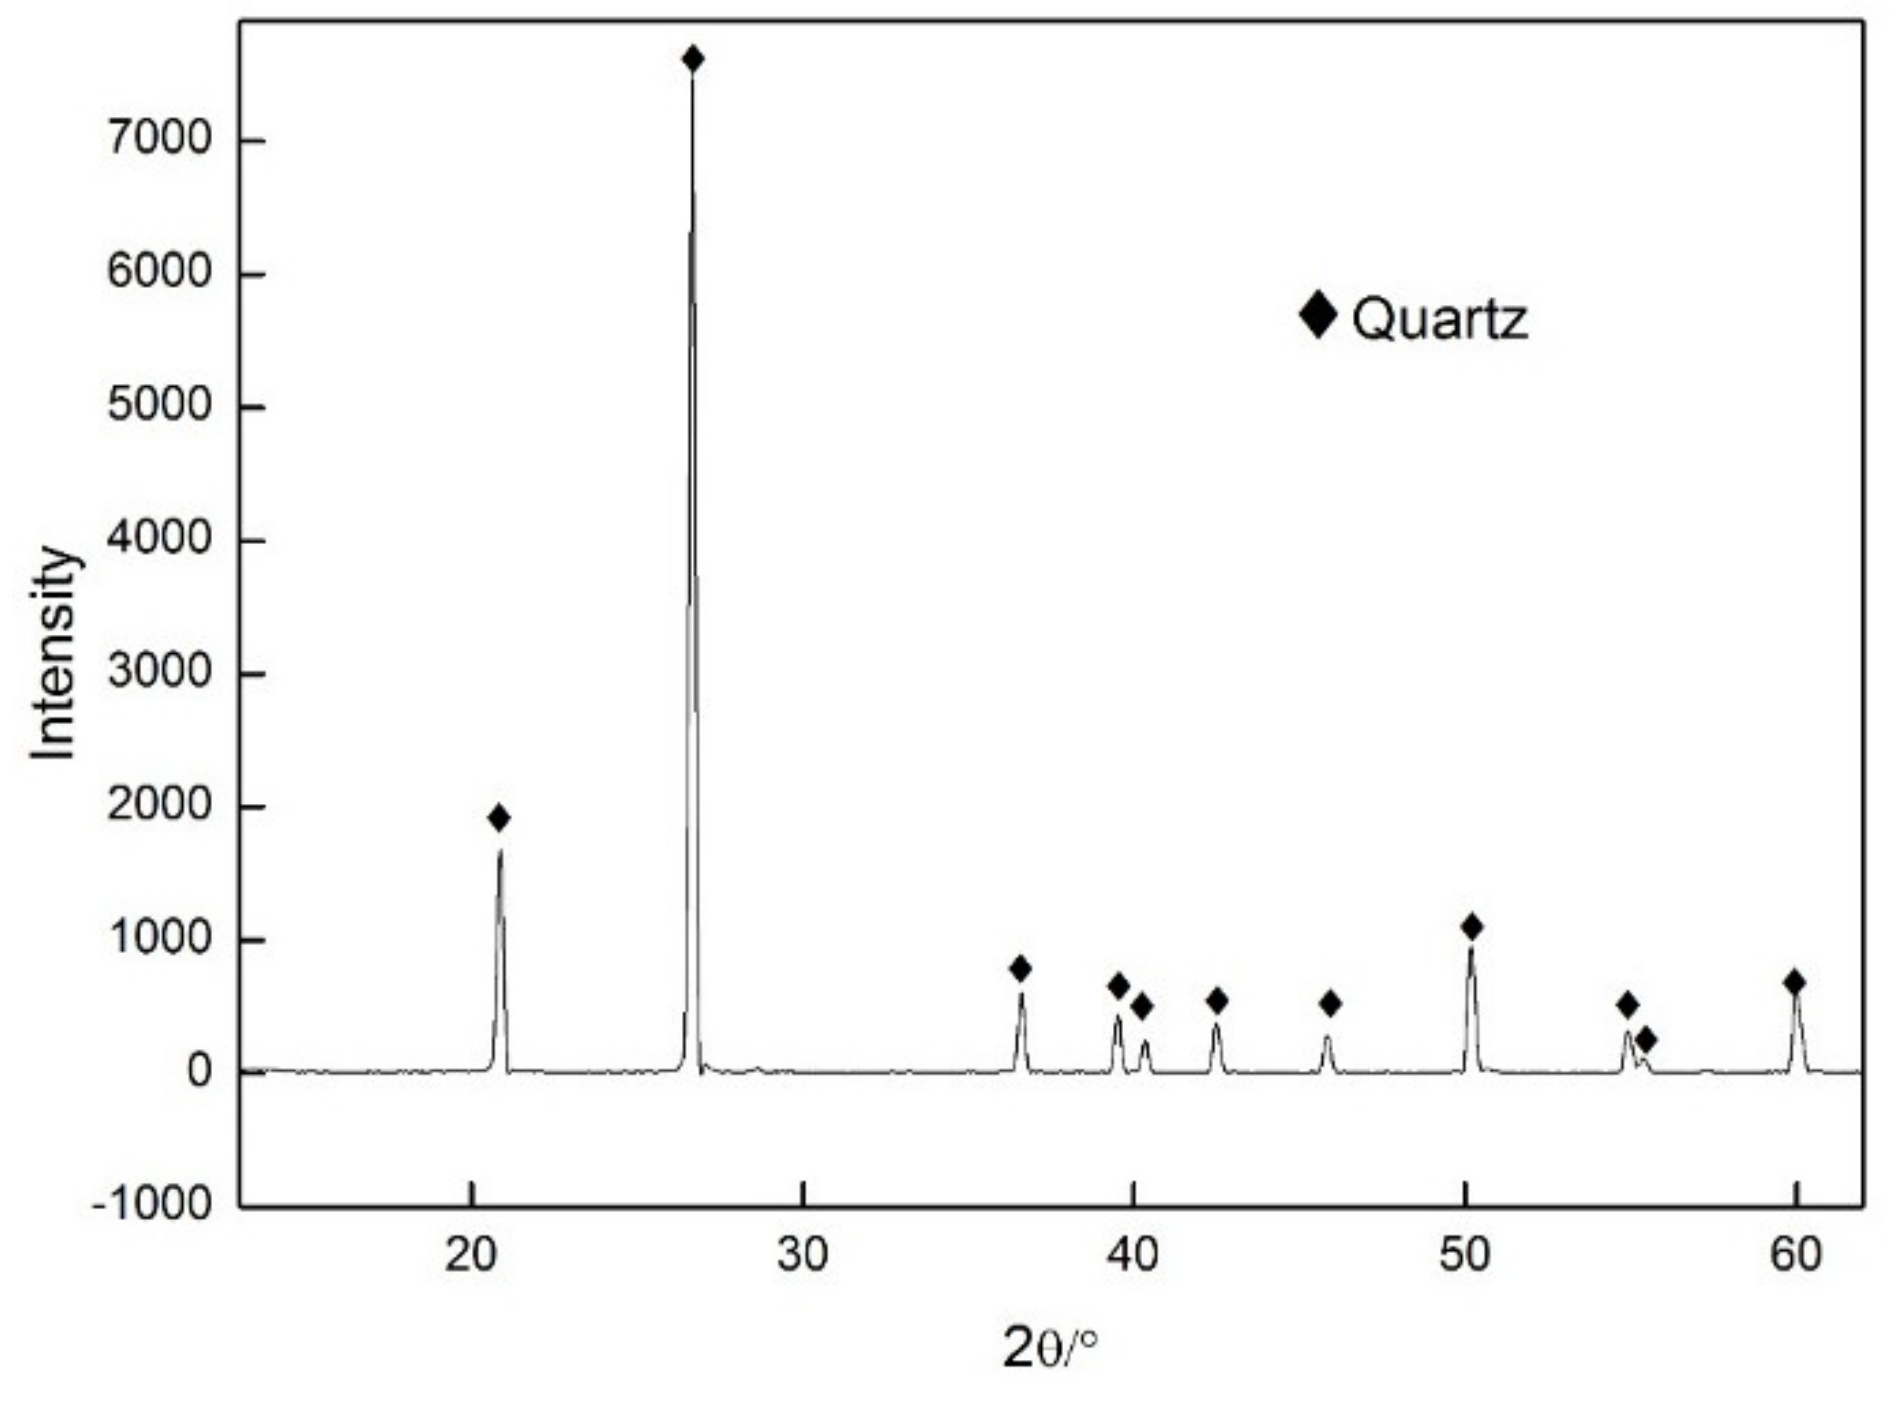
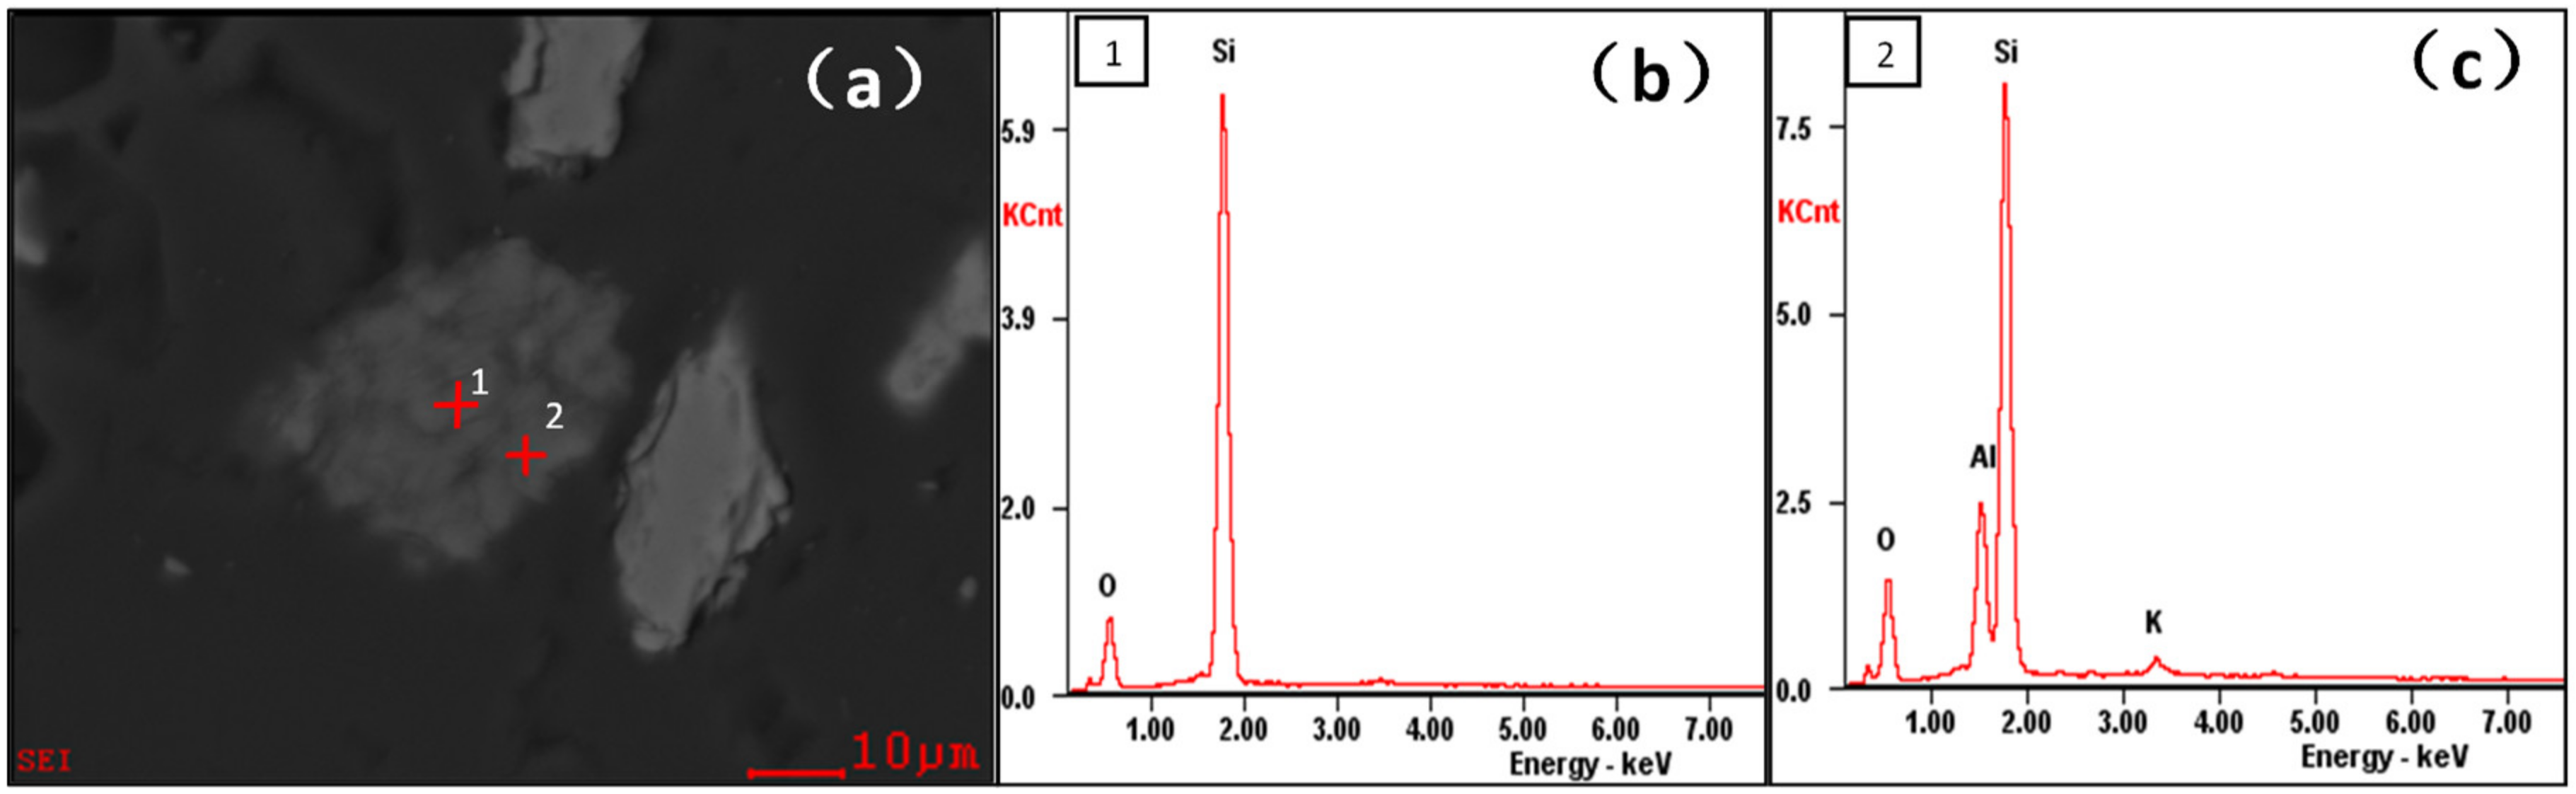
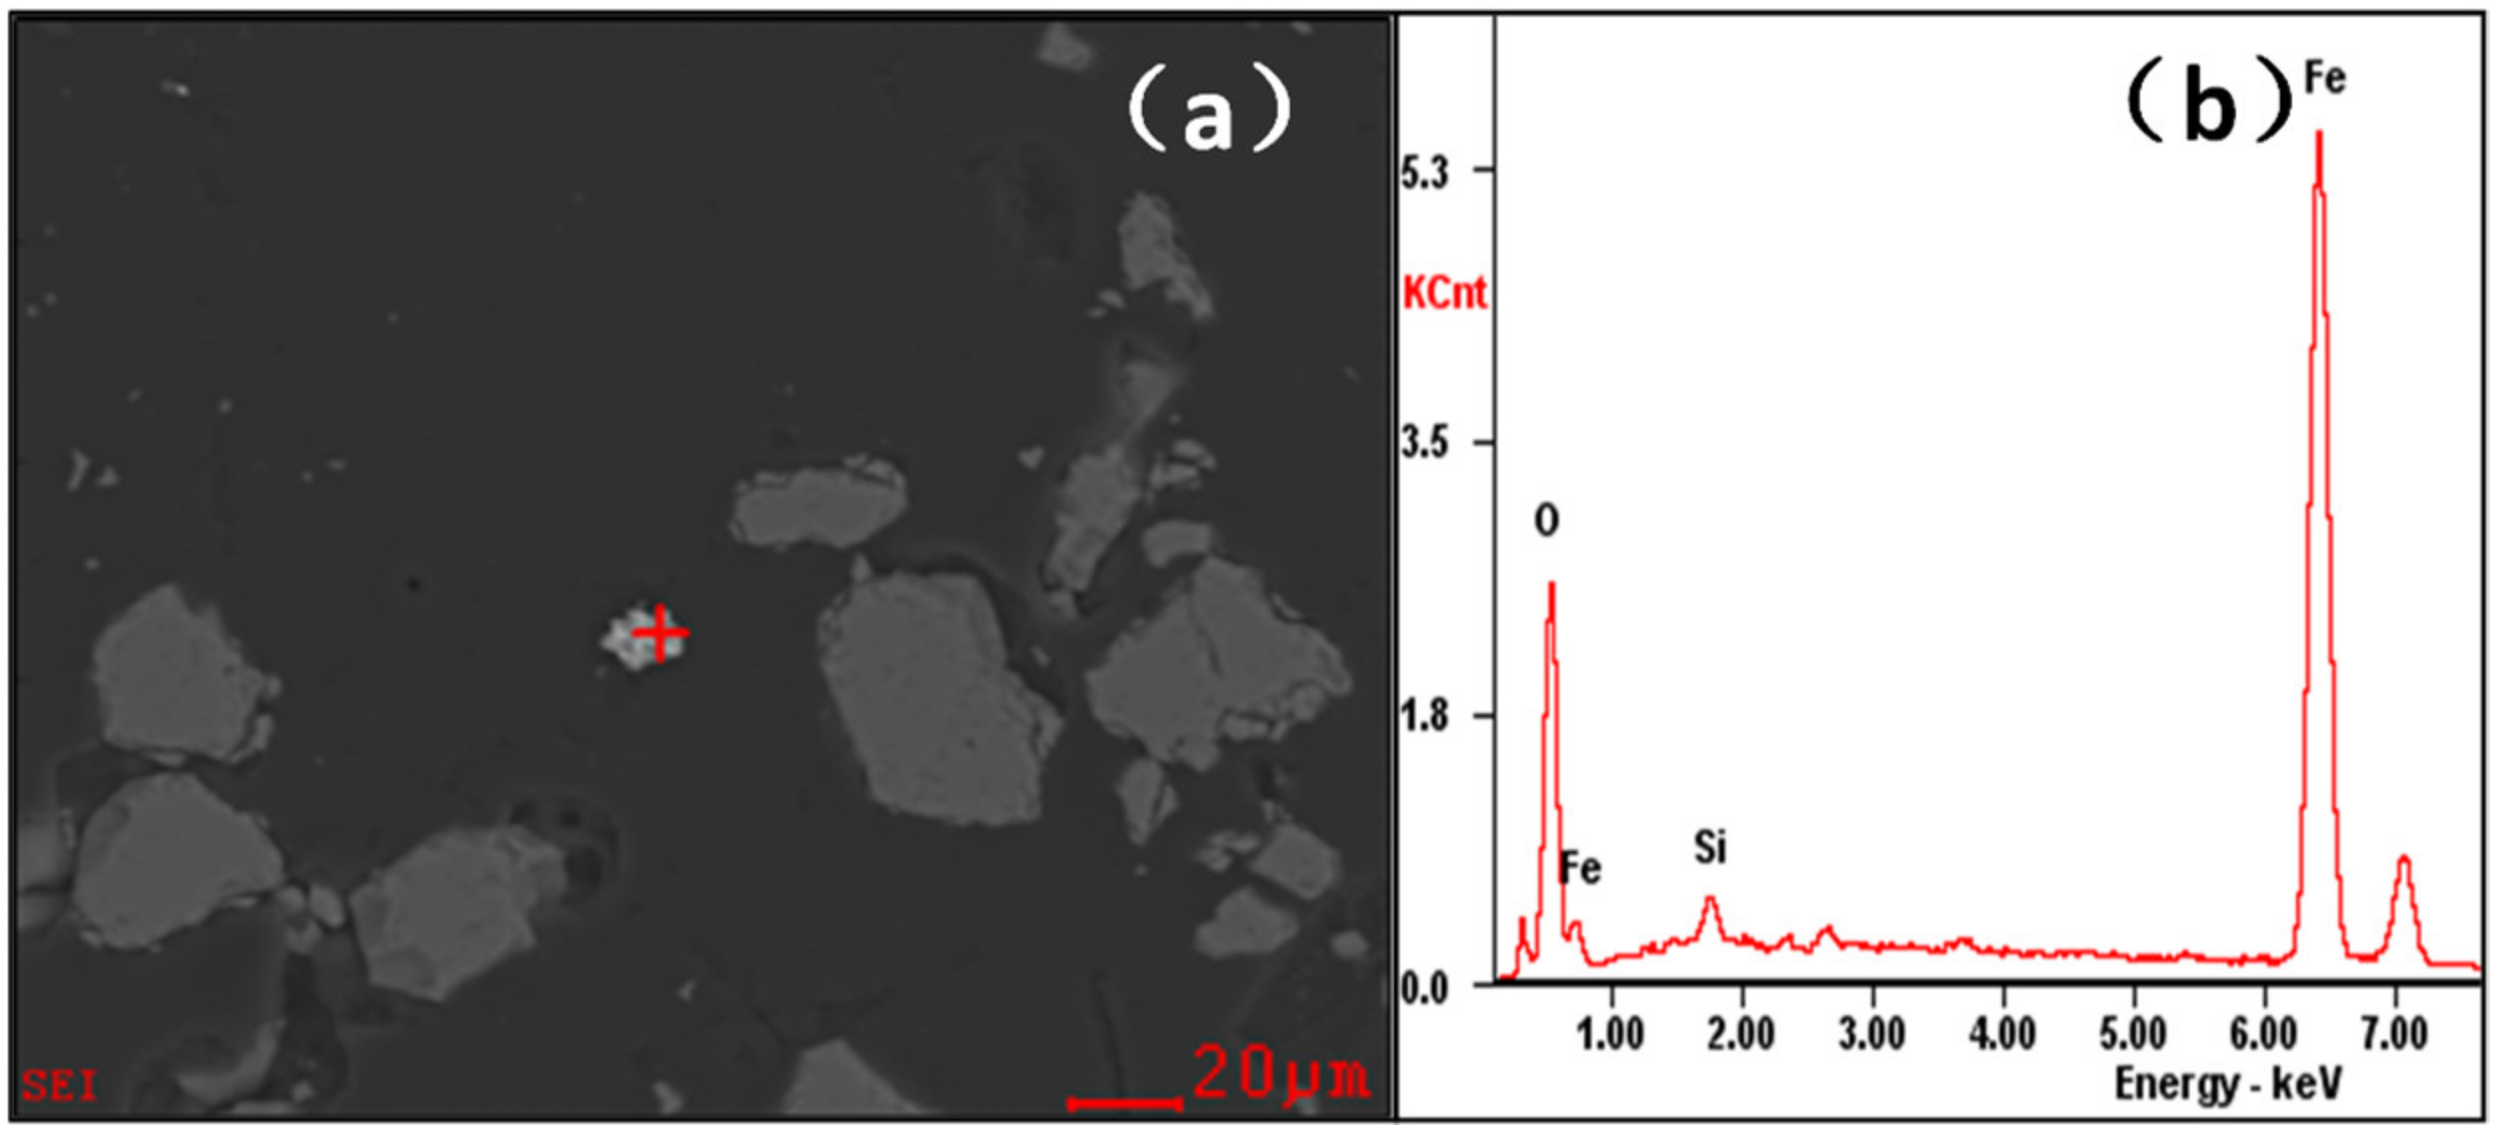
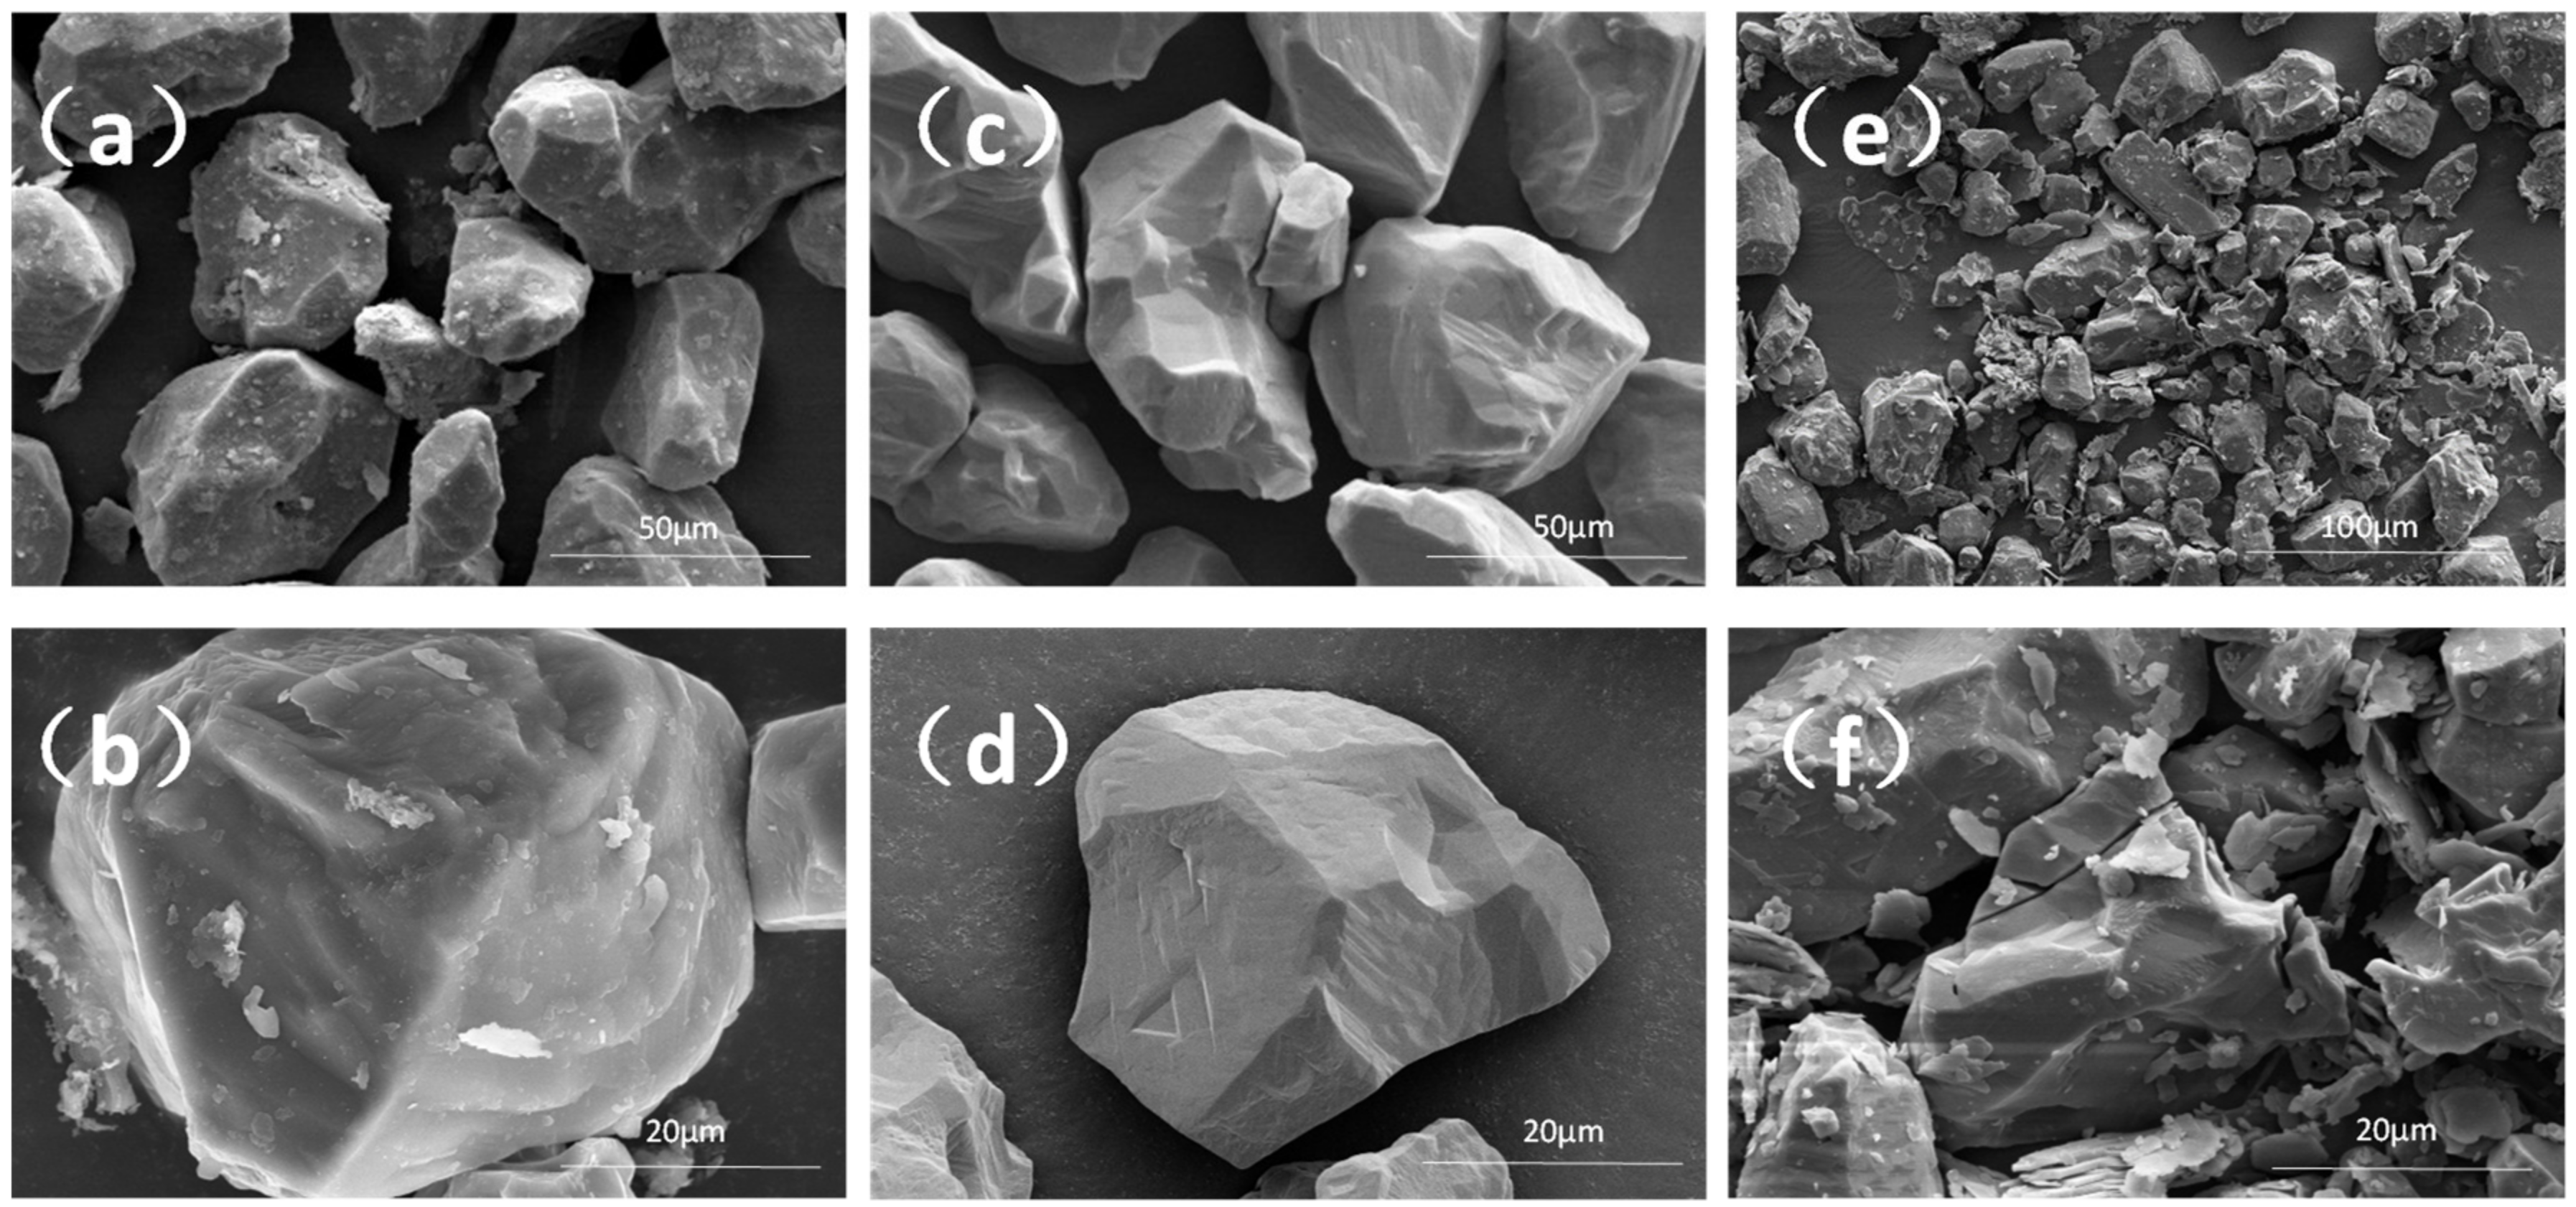
3.1. Impurity Analysis of NPQ

In order to analyze the distribution of impurities in different sizable fractions, NPQ were first sieved using a set of standard screens (100, 200 and 325 mesh), and then the part of −325 mesh was divided into sediment and suspension by centrifugation at 315 rpm for 1 min. The yields and contents of Fe2O3 and Al2O3 in different sizes of NPQ are summarized in Table 2. As displayed in Table 2, the yields were 1.96%, 4.51% and 5.44% for +100 mesh, −100~+200 mesh and micro-fine (centrifugal suspension) samples, respectively. The contents of Fe2O3 and Al2O3 in coarse grains are within the range of 0.132–0.301%and 0.157–0.862%, and in micro-fine the contents of Fe2O3 and Al2O3 are 2.576% and 8.790%, respectively. On the other hand, the yields of −200~+325 mesh and the sediments of −325 mesh are 26.14% and 61.95% respectively with relatively lower content of impurities. It was concluded that the impurities of Fe2O3 and Al2O3 were mainly distributed in coarse grains (>200 mesh) and micro-fine grains.
SEM equipped with EDS analysis was used to directly observe the microstructural characteristics and confirm the elements compositions of clay particles existing in NPQ. As shown in Figure 2, the dispersion of quartz was very even and the particle sizes were approximately in the range of 20–55 μm. Meanwhile, a large number of small particles (1–3μm) were found adhering to the quartz surface. The EDS analysis showed that the main elements of particles on the quartz surface are Si, O, Al and Fe, indicating that the fine particles could be clay impurities.
Mineral liberation analysis (MLA) is a commercially available SEM-based image analysis system which has been widely applied in mineralogy and metallurgical processing [19,20]. Each mineral grain delineation inside the grain can be identified automatically with single X-ray analysis. The SEM-based image (BSE) signal in MLA has higher spatial resolution (0.1–0.2 μm) than X-ray of 2–5 μm. Hence, the mineralogy and the content of impurities in NPQ could not be determined by XRD because of the limitations of analytical accuracy, but could be determined by MLA. The representative results are displayed in Figure 3 and Figure 4, and the distribution of Fe2O3 and Al2O3 according to mineralogy semi-quantitatively is summarized in Table 3. It was revealed that the presence of Fe2O3 comes mainly from hematite, and Al2O3 comes from orthoclase and anorthose. In addition, impurities such as mica were present in the sample.

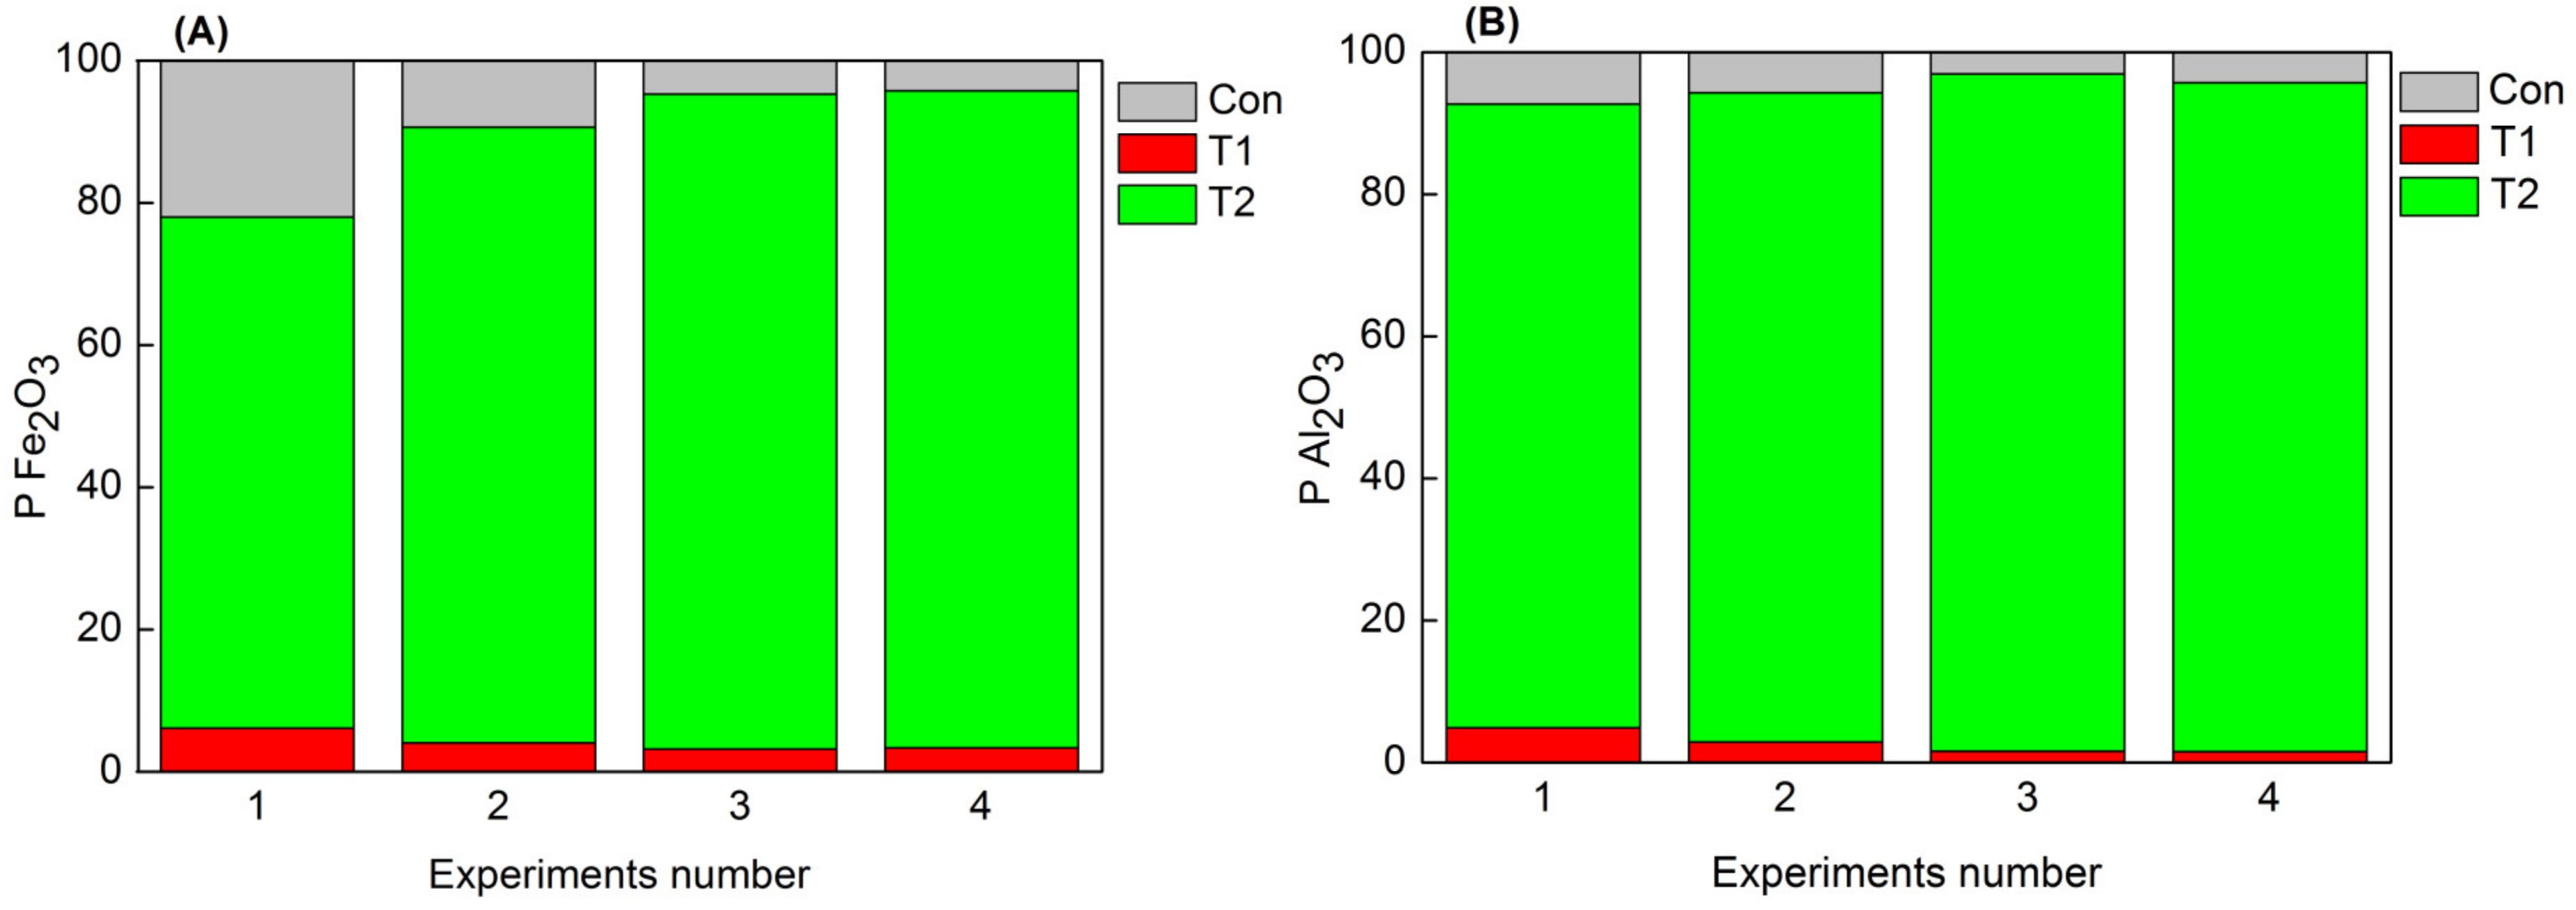
3.2. Effects of Scrubbing and Regulators on Impurities Removal

According to the character of impurities existing in the sample, a series of experiments were conducted as displayed in Table 4 to explore the effect of scrubbing and regulators on impurity removal. Firstly, experiments with and without scrubbing were performed. Subsequently, different regulators were added to the pulp when scrubbing. Test No. 1 was stirred 25 min with equivalent water and separated under the same condition as the test No. 2. The yields and element contents of Fe2O3 and Al2O3 in different products are summarized in Table 4.
The results displayed that the content of Fe2O3 and Al2O3 in concentrate without scrubbing decreased from 0.048% and 0.040% to 0.020% and 0.033% after scrubbing, respectively. Adding NaOH or SHMP when scrubbing could further decrease the content of Fe2O3 in concentrate to around 100 μg/g (0.01%) and the content of Al2O3 to around 200 μg/g (0.018–0.024%). The yield of both T2 and concentrate with scrubbing increased from 5.44% and 88.09% to 5.85% and 89.63%, and the yield of T1 decreased from 6.47% to 4.52%. Compared with scrubbing without regulators, adding regulators has little effect on the yields of products.
The impurity distribution ratio (P) in different products under different conditions was calculated according Equation (1), which revealed the impurity change from a comprehensive view of content and yield, where YPro and GPro represent the yield and the contents of Fe2O3 or Al2O3 in different products respectively, and Craw represents the impurity content in raw ore.
P = Y P r o × G P r o C r a w × 100 %
The results in Figure 5 suggest that PFe2O3 and PAl2O3 of T1 and concentrate all decreased significantly after scrubbing, and thus, the PFe2O3 and PAl2O3 of T2 both increased. It could be inferred that the physical impact and shearing actions occurring between contaminated particles and either the liquid phase or the walls and impellers stripped the clay impurities from quartz surface and crushed the coarse grains as micro-size fractions. The increase of PFe2O3 and PAl2O3 of T2 indicated that more impurities were separated into T2 by centrifugation. The experimental results of test No. 3 and 4 showed that the concentrations of both PFe2O3 and PAl2O3 further decreased, indicating that the separation efficiency of clay impurities from NPQ was improved by adding NaOH or SHMP.
Some representative SEM images shown in Figure 6 were applied to identify the effect of scrubbing and centrifugation on the clay impurity removal of NPQ. As displayed in Figure 6 c,d, it is obvious that the fine clay particles adhering on quartz surface disappeared, and the surface was clearer and smoother after scrubbing compared with the samples which had not undergone scrubbing (Figure 6 a,b). It could be concluded that the impurity minerals were effectively stripped from the surface of quartz through scrubbing. According to Figure 6 e,f, it was demonstrated that the fine particles were separated into the T2 by centrifugation, which is the key factor affecting the removal efficiency of the clay impurities.

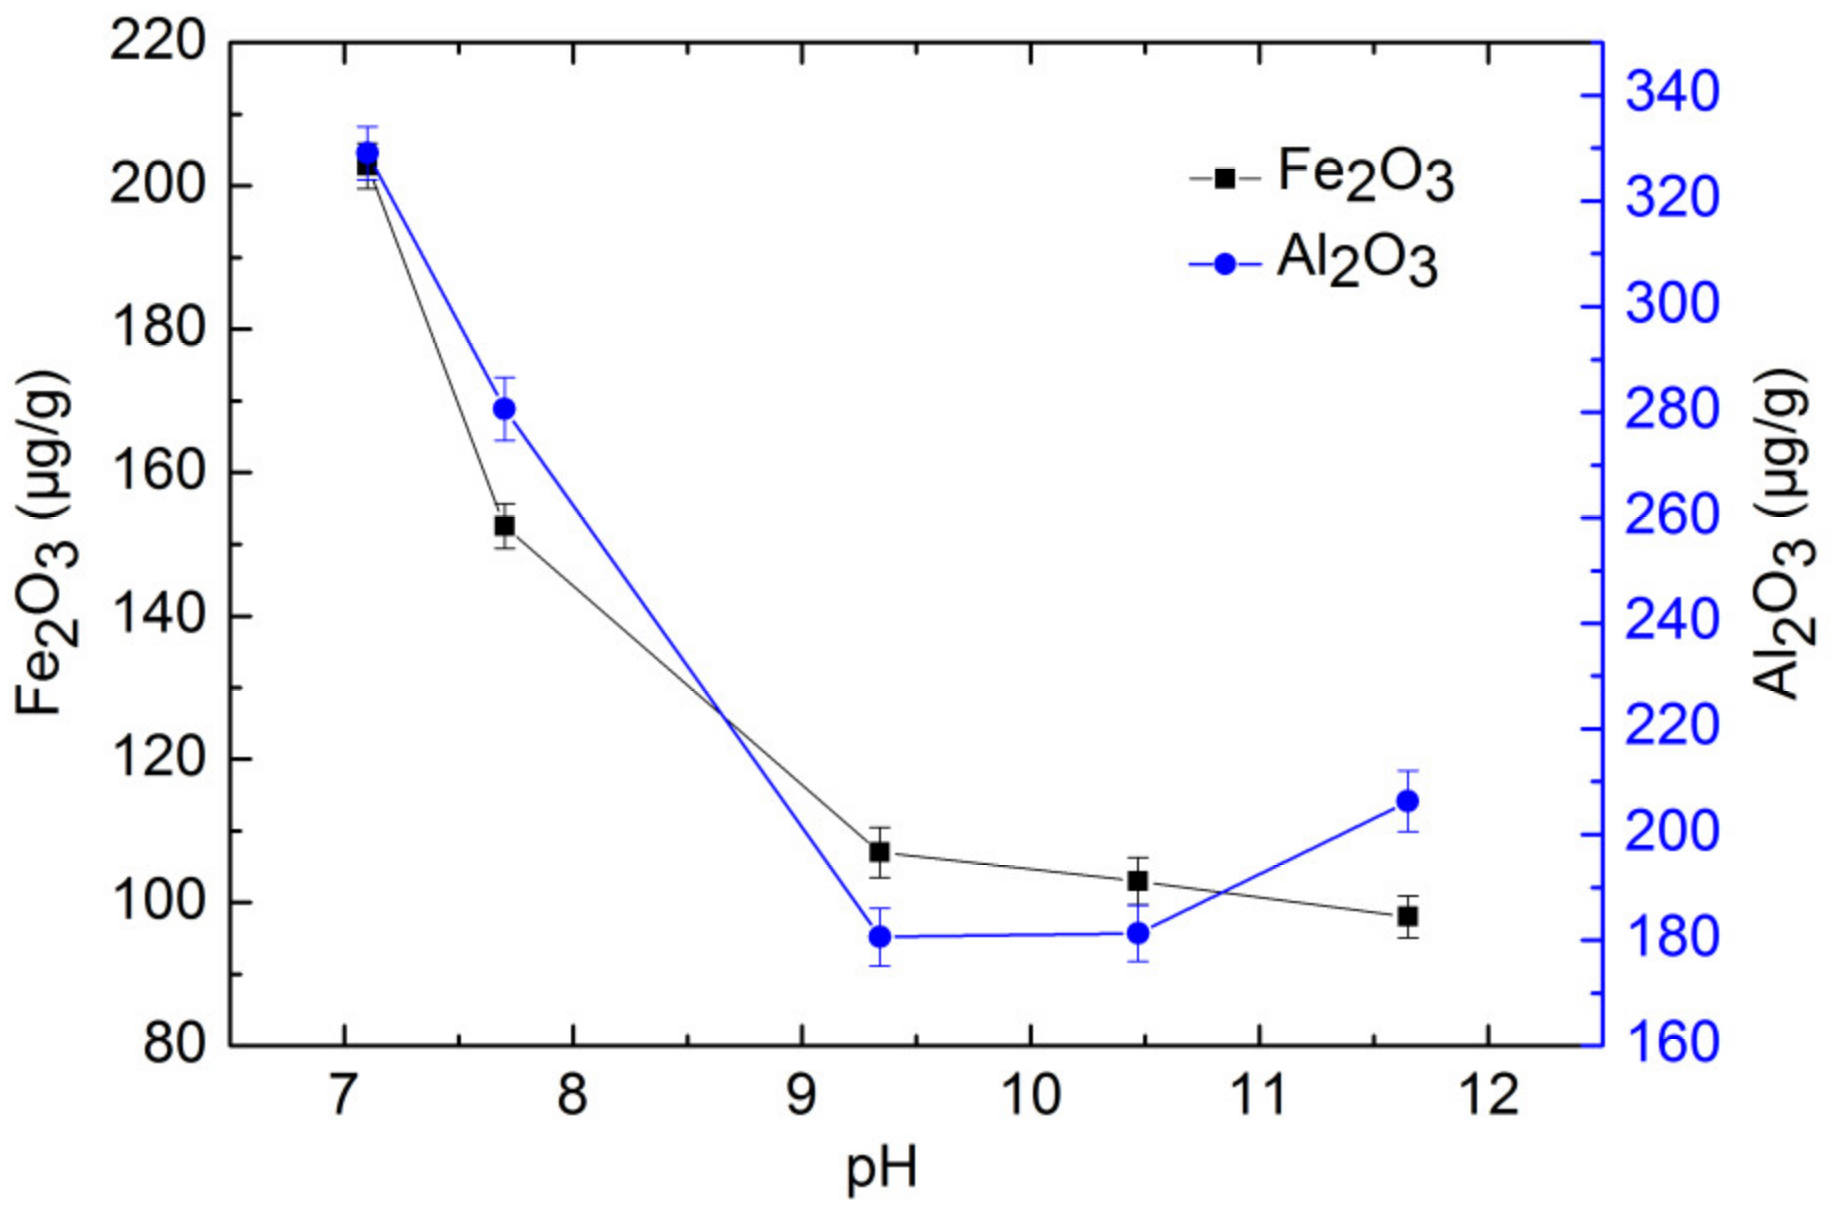
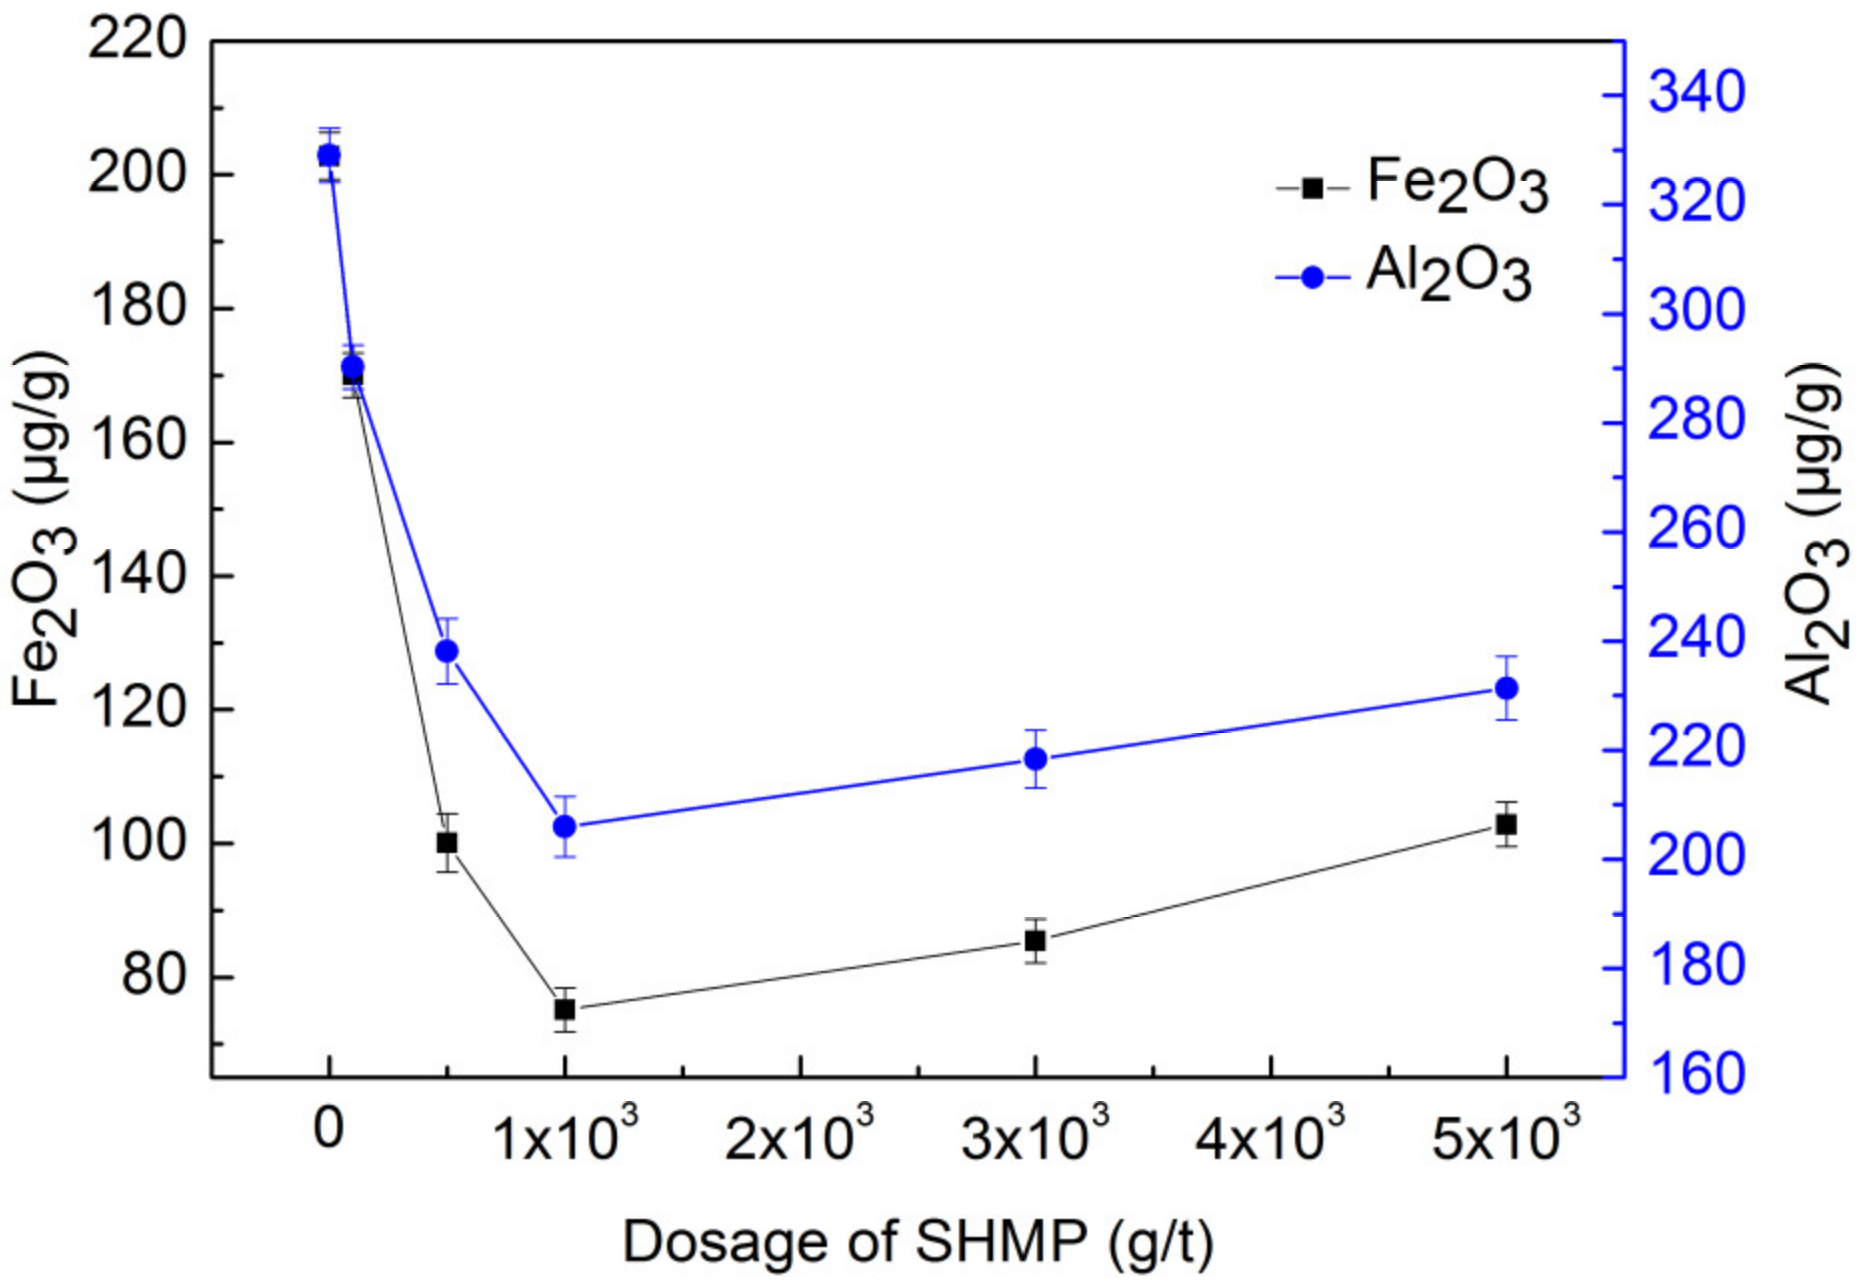
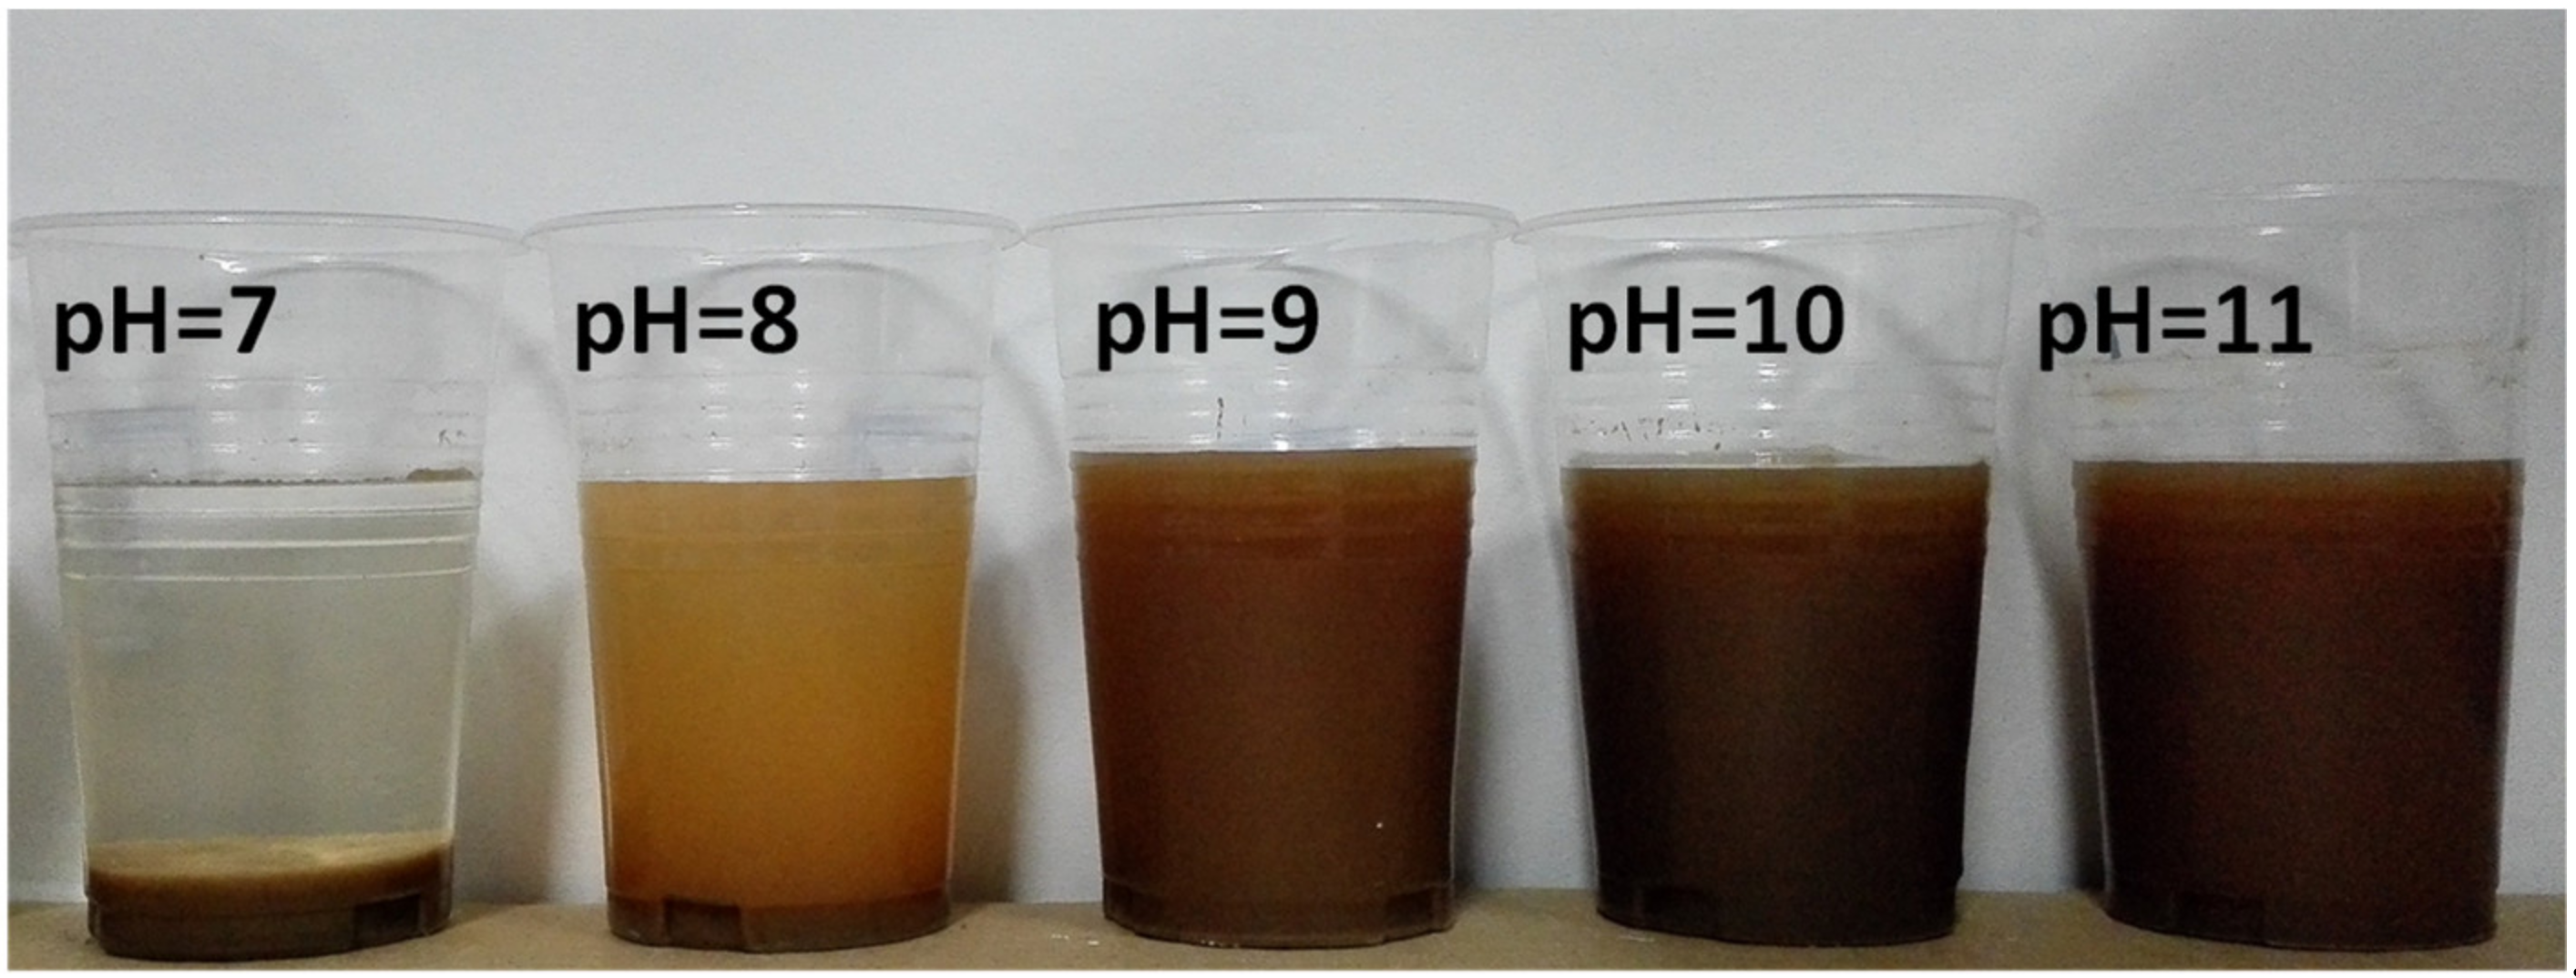
3.3. Effects of pH and Dosage of SHMP on Impurities Removal

To reveal the influence of pH on the removal efficiency of clay impurities, the impurities content of Fe2O3 and Al2O3 in concentrate were illustrated as a function of pH in Figure 7. The pH of solution was adjusted through adjusting NaOH amount, and the practical pH values were measured before centrifugation. The results showed that when the pH increased from 7.1 to 9.3, both of the contents of Fe2O3 and Al2O3 decreased significantly, but the increase of pH from 9.3 to 11.7 only shows slight influence on impurities removal.
The influence of SHMP on impurities removal was studied for dosages of 100, 500, 1000, 3000 and 5000 g/t at pH = 7 and the results are given in Figure 8. As expected, the dosage of SHMP affects both of the content of Fe2O3 and Al2O3 in concentrate. The removal efficiency of impurities was improved with the dosage of SHMP increases from 100 to 1000 g/t, and an optimal effect can be obtained at 1000 g/t. However, with increasing the dosage of SHMP continuously, the content of both Fe2O3 and Al2O3 in the concentrate presented an increasing trend, which indicated that an excess of SHMP can inhibit the removal efficiency of impurities.

4. Purification Mechanism

It is obvious that scrubbing enhanced the liberation of minerals, and the separation efficiency was dominated by centrifugation. Since previous experiments revealed that adding NaOH or SHMP could improve the removal efficiency of clay impurities, the mechanism was analyzed based on the influence of NaOH or SHMP on the interaction between quartz and clay impurity particles including hematite and orthoclase. Classical DLVO theory was used to study the stability of slurry and mineral particles by many researchers [21,22]. Based on the DLVO theory, the interactions between particles in aqueous solution include the van der Waals attraction force and the electrostatic double layer repulsive force. The coagulation and dispersion behaviors of mineral particles are mainly determined by the total interaction energy (VT), which is the sum of the London-van der Waals dispersion interaction energy (VA) and electrostatic repulsive energy (VR), i.e., Equation (2), and the interaction energy VA and VR between two spheres can be calculated by Equations (3) and (4) [23].
V T =   V R +   V A
V R =   A 132 6 D R 1 R 2 R 1   +   R 2
V A = π ε 0 ϵ R 1 R 2 R 1   +   R 2 4 φ 1 φ 2 l n 1   +   e k D 1     e k D   +   φ 1 2   +   φ 2 2 ln 1 e 2 k D
where R1 and R2 are the radius of two spheres, D is the separation distance of two spheres. A132 is the effective Hamaker constant of substances 1 and 2 interacting in medium 3; it can be calculated by Equation (5), using the Lifshitz approach based on quantum physics [24]. φ 1 and φ 2 are the surface potentials of substance 1 and 2, which are substituted by the measured ζ potential value, κ−1 is the double layer thickness (9.6 nm in 1 mM KCl). ε is the dielectric constant of the aqueous medium (78.4 C2·m·J−1), ε0 is the dielectric constant of vacuum (8.854 × 10⁻¹² C2·m·J−1), the dielectric constants of quartz, hematite and orthoclase are 4.3, 6.9 and 81, respectively [25,26].
A t o t a l =   A v = 0   +   A v > 0 3 4 k T ε 1 ε 3 ε 1 + ε 3 ε 2 ε 3 ε 2 + ε 3 + 3 h v e 8 2 n 1 2 n 3 2 n 2 2 n 3 2 n 1 2 + n 3 2 n 2 2 + n 3 2 n 1 2 + n 3 2 + n 2 2 + n 3 2
where kB is the Boltzmann constant (1.381 × 10⁻²³ J·K−1), T is the room temperature (293.15 K), h is the Planck constant (6.626 × 10⁻³⁴ J·s), νe is the main electronic absorption frequency in the UV typically around 3 × 10¹⁵ s−1 and n is the refractive index.

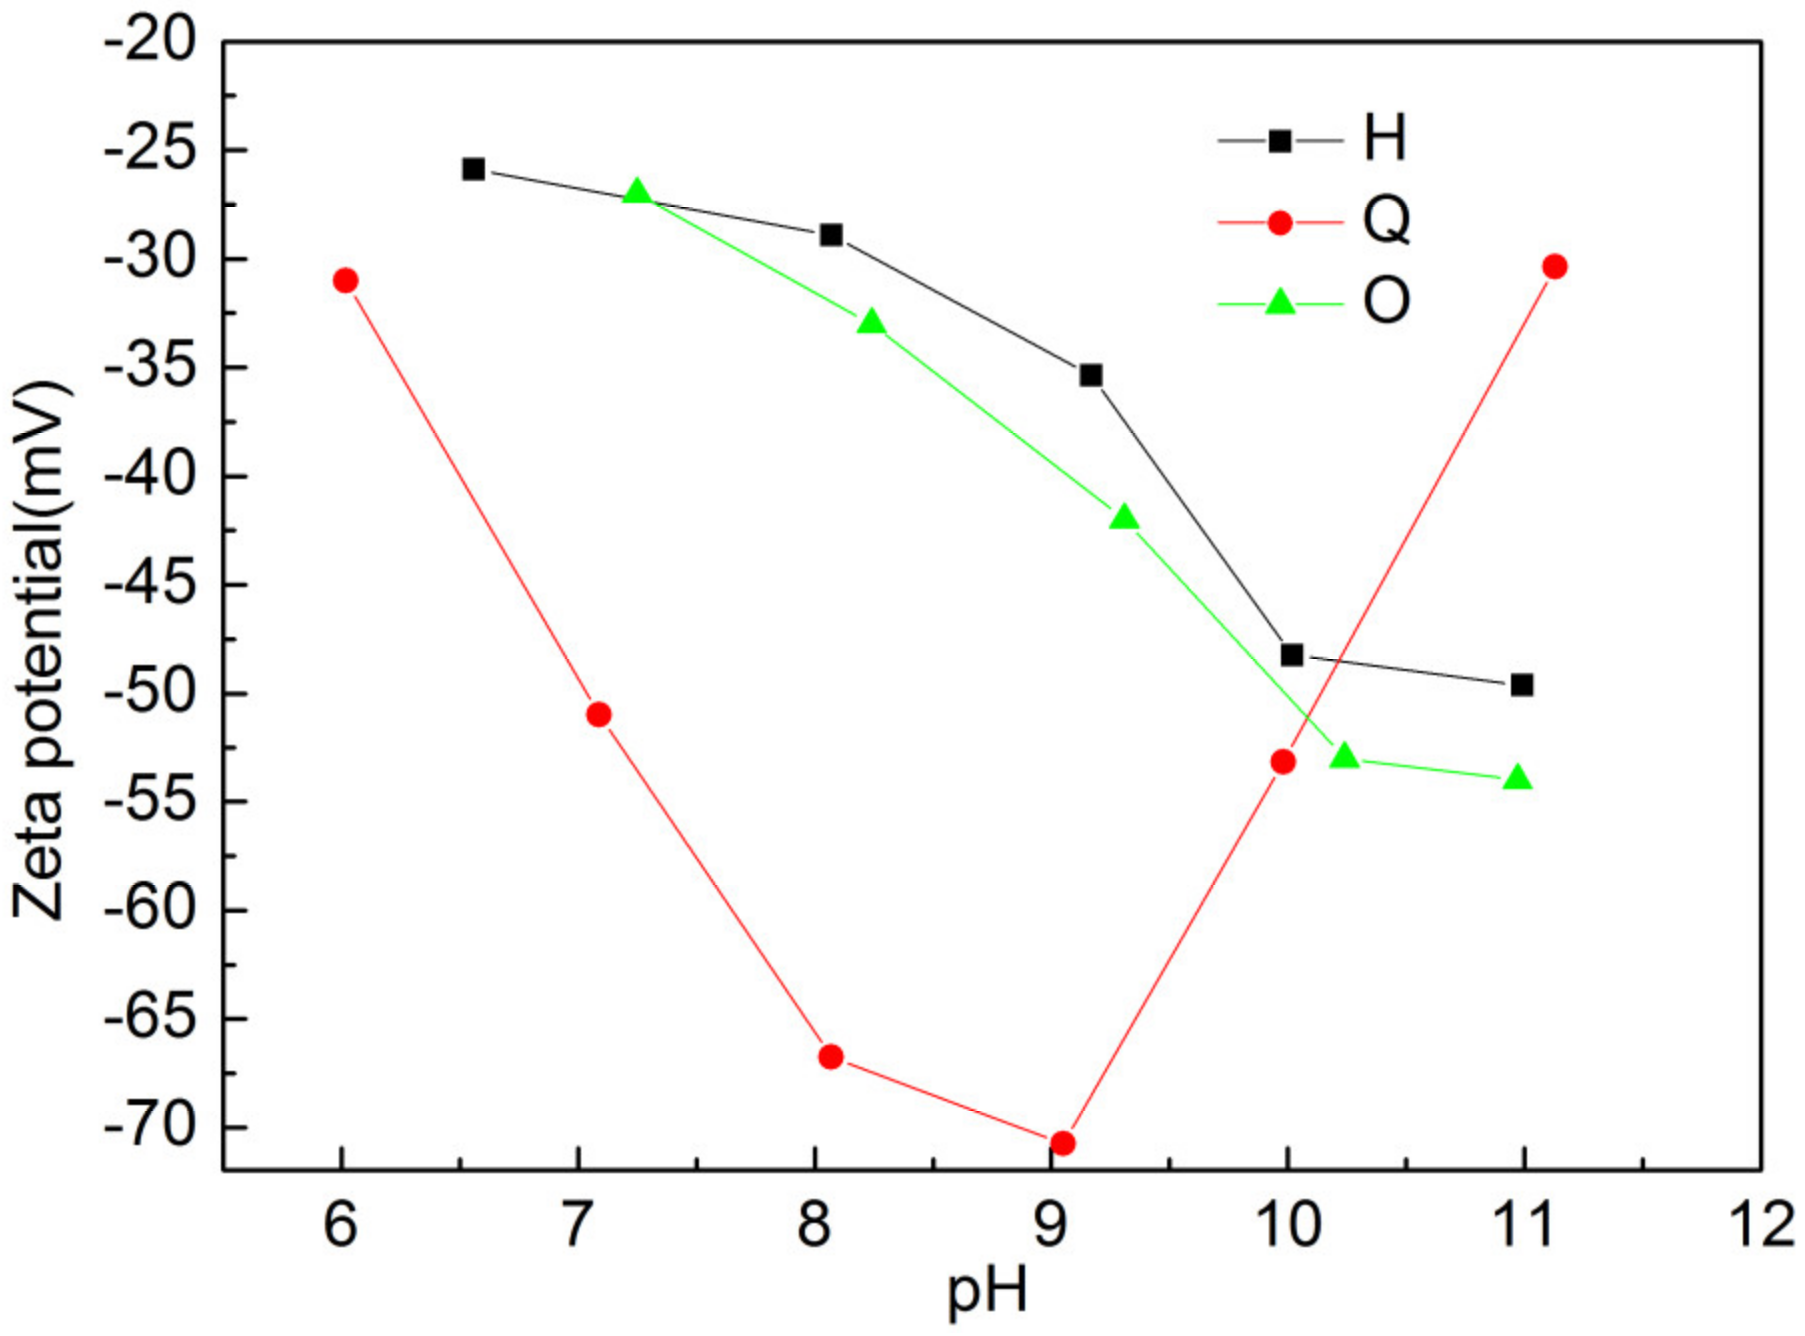
4.1. Effects of pH on the Zeta Potential

In this study, the standard minerals of hematite and orthoclase were selected as the main objects of impurity to analyze the processing mechanism. The standard minerals were obtained from commercial vendors. The quartz used in this paper was the concentrate of test No. 3, which was washed several times with distilled water. All the samples were ground and sieved by a 400 mesh for the test.
The ζ potentials of quartz, hematite and orthoclase were measured at different pHs, from neutral to alkaline, with a fixed ionic strength of 1.0 mM KNO3. As shown in Figure 9, the ζ potentials of both hematite and orthoclase decreased as the pH increased, which were in agreement with the results reported by other researchers [27,28]. Unlike the characteristic of ζ potentials of hematite and orthoclase, one interesting feature has been observed from the plot of ζ potential of quartz. Initially, the ζ potential of quartz decreased as the pH increased from 7 to 9. However, when the NaOH was added to the slurry to increase the pH above 9, this potential of quartz gradually increased; this phenomenon also has been detected by other researchers [29]. The possible reasons for the charge changing of quartz according to the reference could be explained as follows: the metal ions in solution and the clay particles coated on the quartz surface, or the solubility of quartz rises sharply with increasing the solution pH, which could compressed the electric double layers of minerals, and thus, decreased the negative charge potentials [30,31,32].

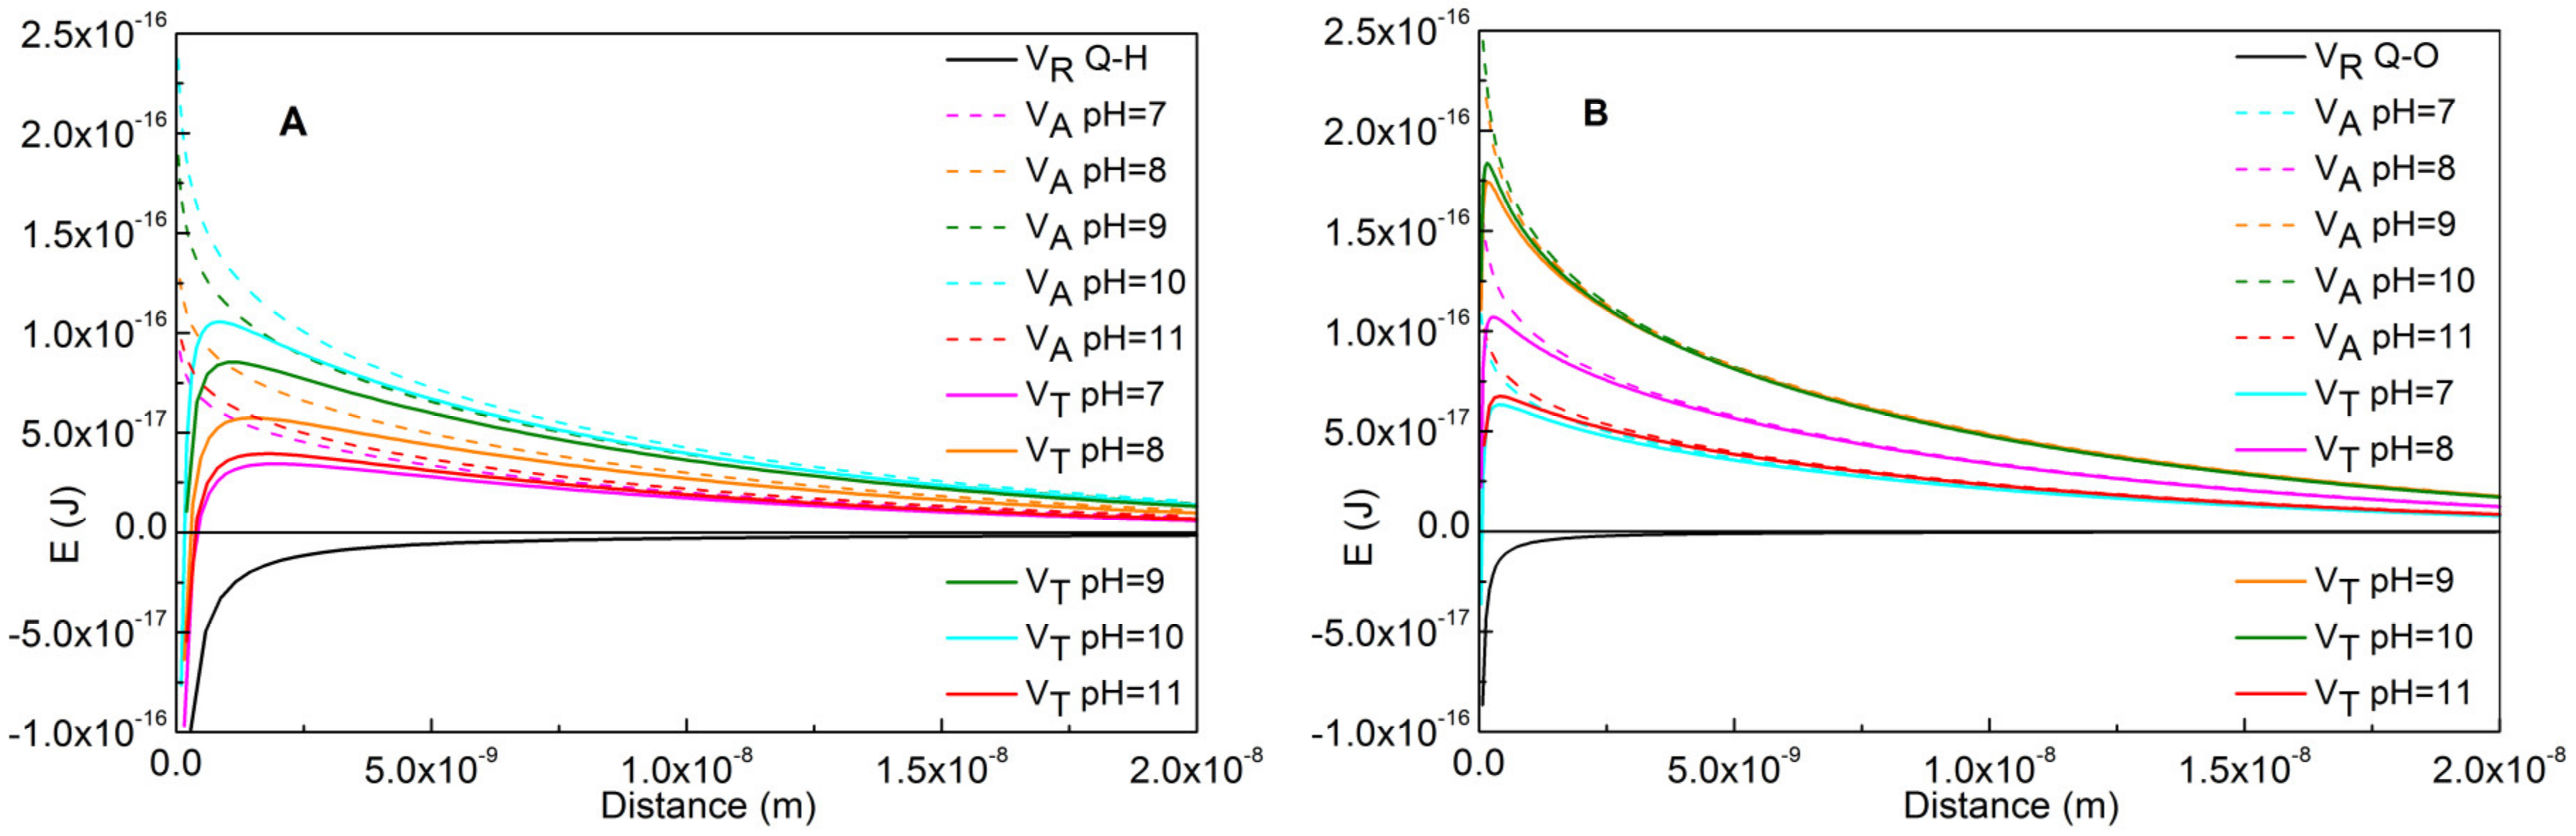
4.2. Heterocoagulation between Quartz and Impurities

The interaction energy between quartz and impurity particles was calculated based on the DLVO theory firstly. It is important to emphasize that the impurity particles (radius 3 μm) and NPQ (radius 40 μm) were assumed as two ideal spheres and the measured ζ potential value as the surface potential. Figure 10 showed the interaction energy of VR, VA and VT respectively between quartz and hematite (Q–H), quartz and orthoclase (Q–O) at different pHs. When the separation distance was above 3 nm, both of the VT of Q–H and Q–O were dominated by VR, and thus, the values were positive as pHs varied from 7 to 11, which suggested that the interaction between quartz and impurities was primarily repulsive in nature. It is also indicated that the VT change to negative with the VA tend to negative infinitely when interaction distance being much closer (less than 1 nm), which means that the interaction force was attractive when the impurity particles adhering on quartz surface. The results also illustrated the importance of scrubbing, which provided sufficient energy to overcome the strong VA between quartz and impurities adhering on quartz surface.
Although the VT between quartz and impurities always remained positive, the experimental results showed that the removal efficiency of impurities has a strong correlation with the changing of VT. As can be seen, the VT was increased gradually with the pH increase from 7 to 9, which is consistent with the changing trend of removal efficiency of impurities according to the previous experiments results. The reason could be explained that the VT was calculated based on the assumption that the averaging particle size of impurity was 3 μm, but the practical particle size should be normally distributed. According to Equation (2), VT is roughly proportional to the radius of impurity particle R1 when the radius of quartz R2 and the ζ potential of minerals are fixed. When the radius of impurity tends to 0, VT also tends to zero, which means that there are always a certain proportion of fine impurity particles which could be attracted on the quartz surface easily, and the proportion of particles attached on quartz would decrease with the increase of VT.
At pH 10, even though the ζ potential of quartz displayed a reverse increase, VT keeps increasing as the ζ potentials of both hematite and orthoclase decreased, and the effect of pH from 9 to 10 on impurities removal is not notable. When pH was up to 11, VT reduced significantly, and consequently, a worse impurity removal effect was observed. All the results indicated that increasing VT by adjusting pH could improve the impurities removal. However, the strong alkaline environment was not beneficial for impurity removal, as the reverse increasing of the ζ potential of quartz.

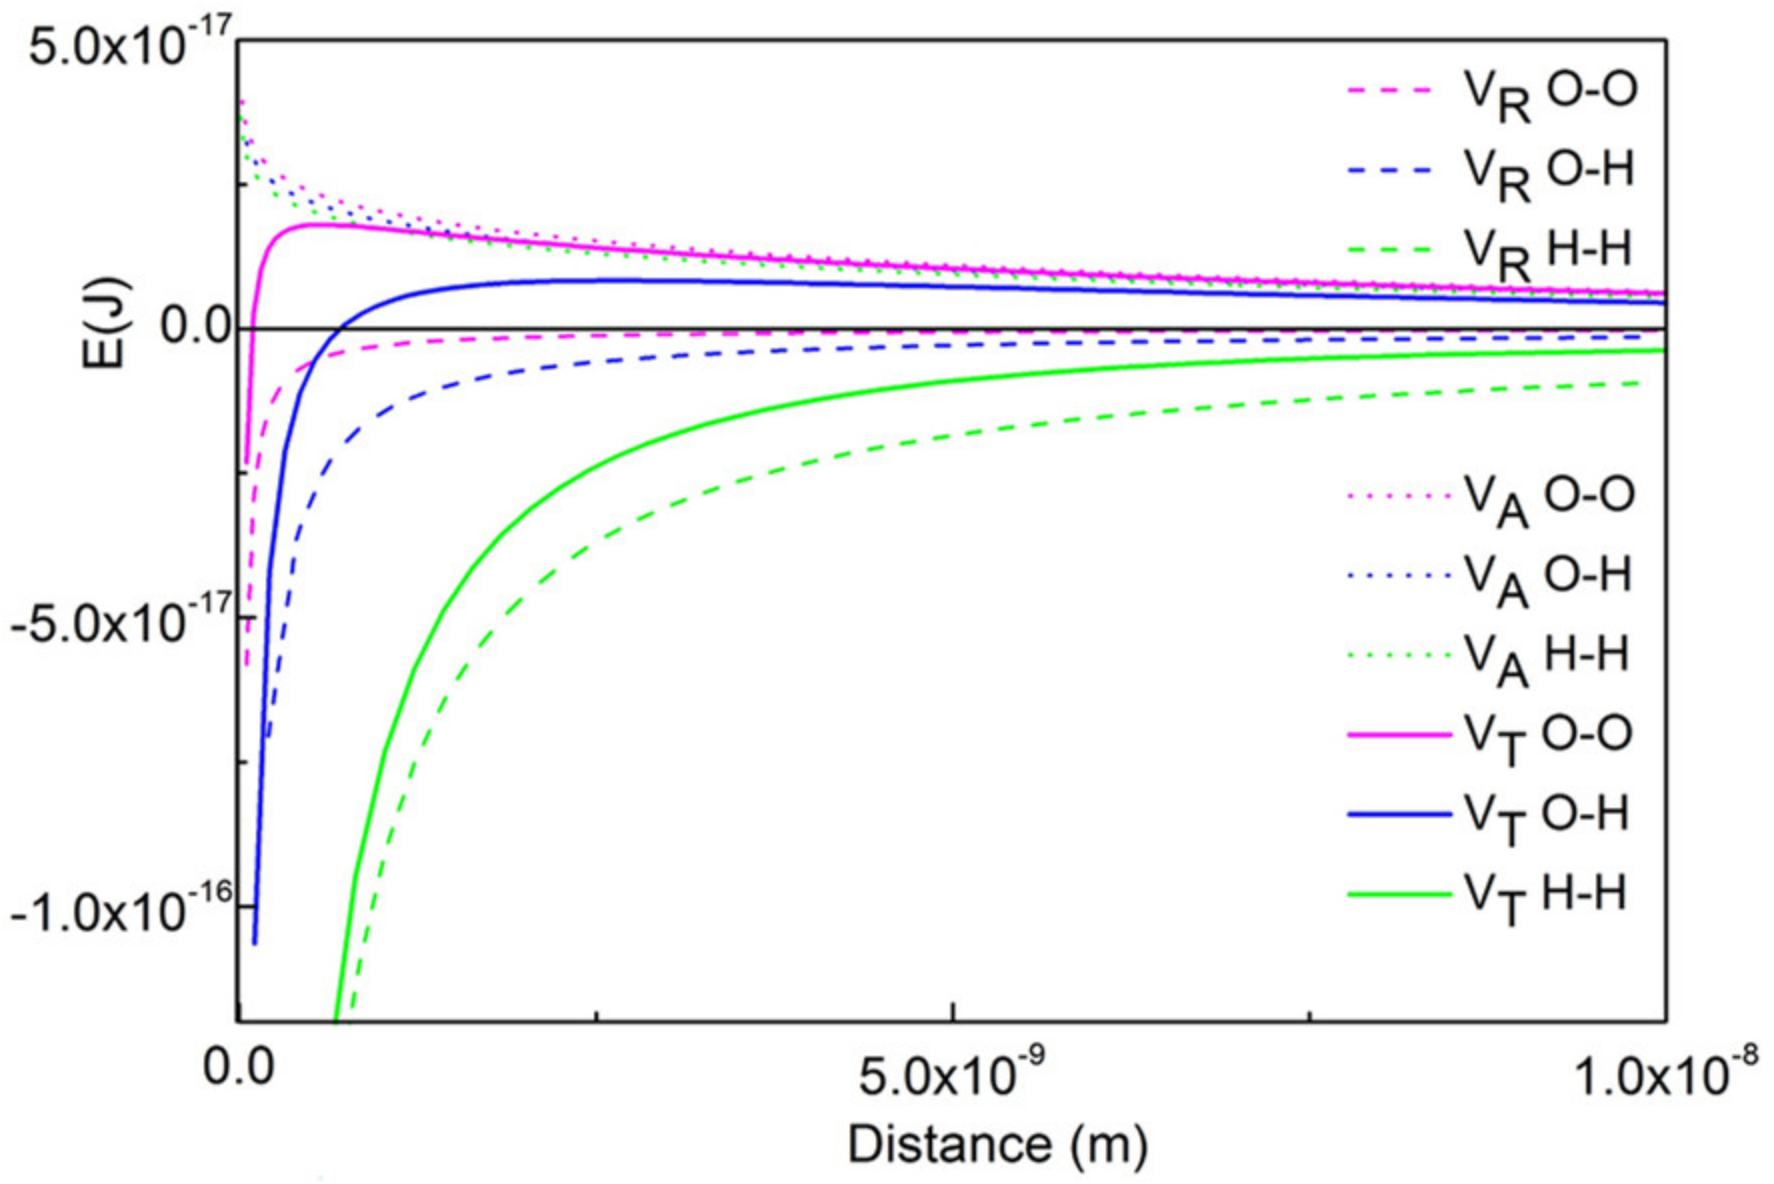
4.3. Coagulation of Fine Impurity Particles

Apart from the heterocoagulation between quartz and impurity particles, the interaction among fine impurity particles was also calculated to analyze the coagulation, which could also influence impurity removal. Figure 11 indicates the interaction energy between hematite and hematite (H–H), orthoclase and orthoclase (O–O), orthoclase and hematite (O–H) under natural condition (pH = 7). The results showed that the VT of O–O and O–H were both positive, while the VT of H–H was negative over the whole separation distance, which indicated that the coagulation of fine particles occurred mainly by the formation of homocoagulation between H–H in the slurry.
VT of H–H at different pHs is shown in Figure 12. As can be seen, VT was negative at pH 7 and 8. When the pH increased to 9, VT was close to zero and then changed to positive at pH 10 and 11. The results indicated that the homocoagulation of H–H occurred more easily when the pH was 7 and 8, and then became dispersive at pH > 9. The conclusion was reinforced by the observation about the stability of slurry of T2, as shown in Figure 13, which showed the settlement of T2 after centrifugation for 24 h at different pH values. As can be seen, when the pH was lower than 9, the fine particles in the slurry were coagulated, and consequently, they settled more easily. On the other hand, when the pH was over 9, the slurry became more stable, which was favorable to the removal of these impurities.

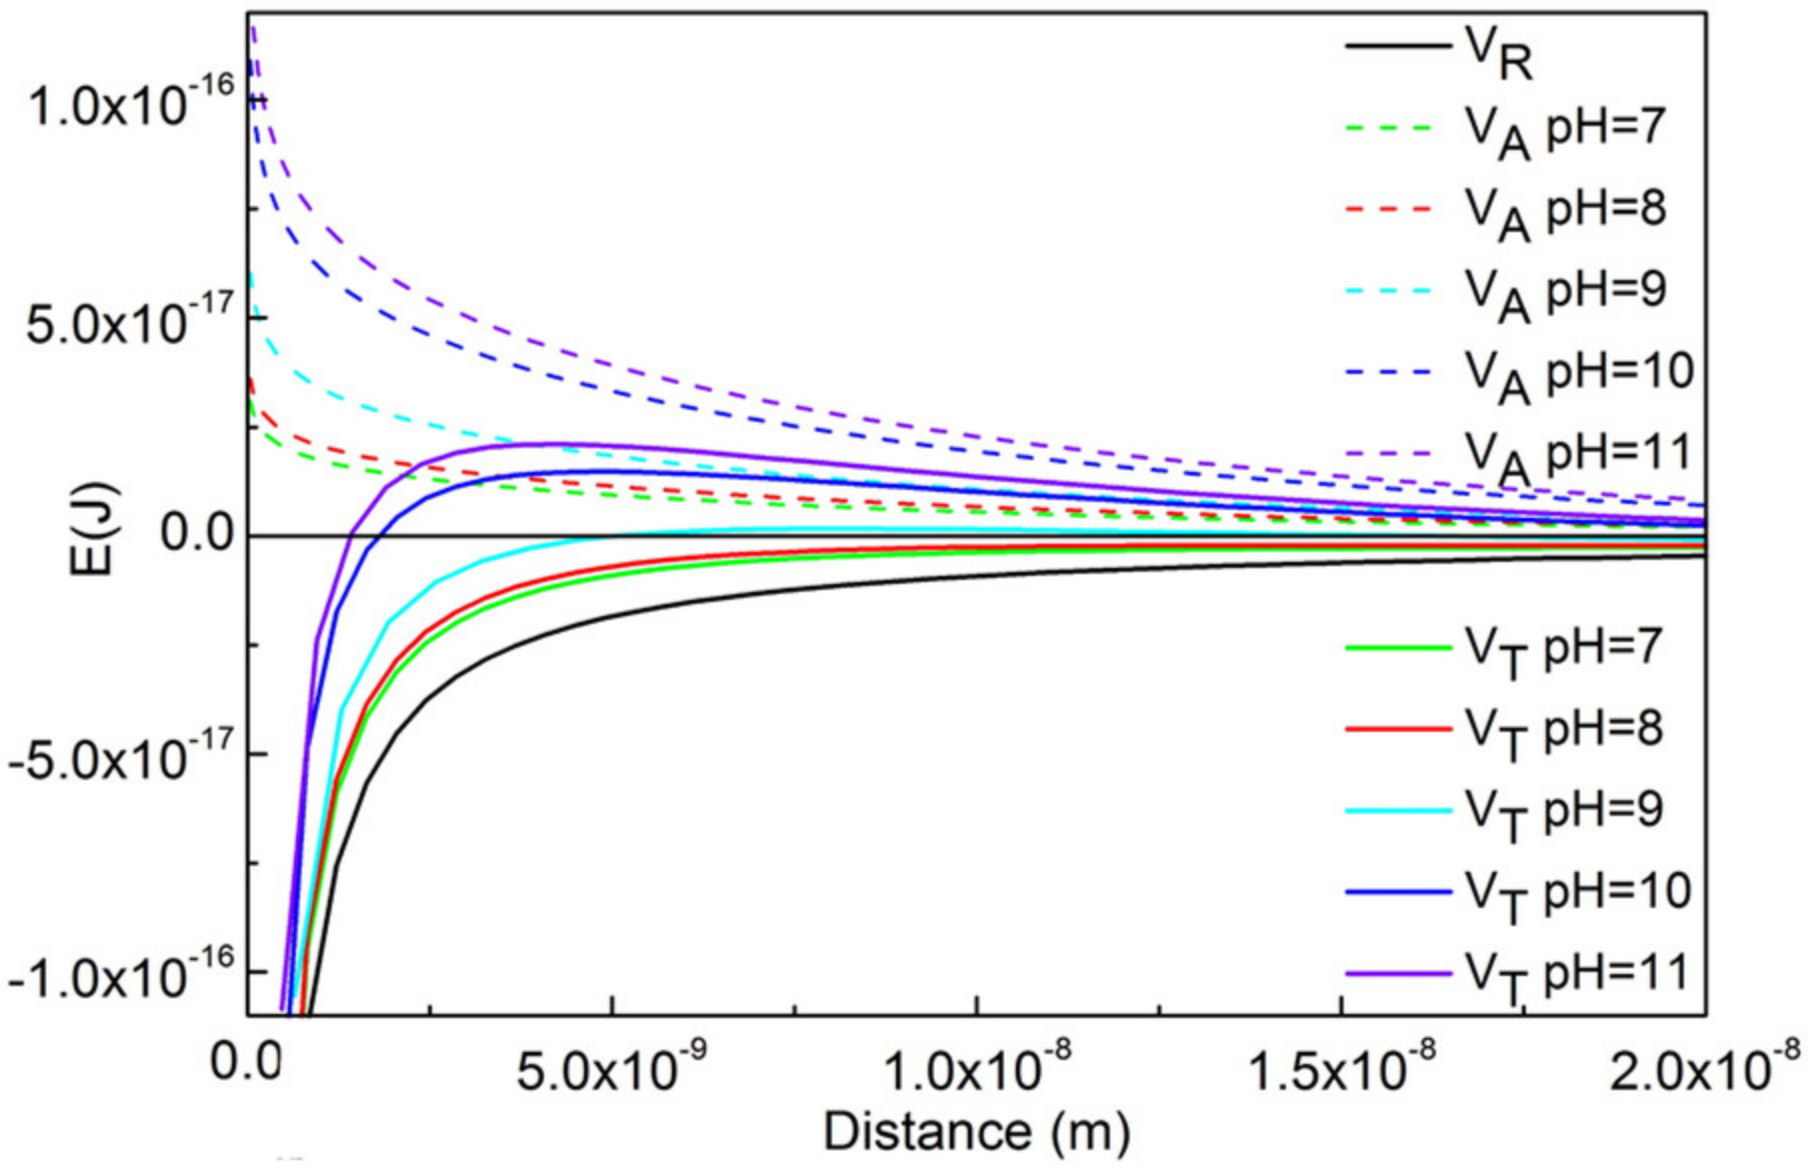
4.4. Effects of SHMP on the Zeta Potential and Desliming

SHMP is a kind of long-chain inorganic salt that has been used as a dispersant for clay mineral separation, which could increase the negative zeta potential of particles, and thus improve the dispersion of slurry [33,34]. The ζ potentials of quartz, hematite and orthoclase were measured at the optimized proportion of SHMP (1 × 10³ g·t−1), according to the previous experiments. As can be seen from Table 5, the addition of SHMP exhibited a remarkable effect on decreasing the ζ potential of all three minerals. As stated in the previous analysis, the ζ potentials of minerals were negative enough to lead to a good dispersion of slurry, which is agreement with the impurity removal results, as shown in Figure 8.
Moreover, ζ potentials of quartz, hematite and orthoclase at the dosage of SHMP being 5 × 10³ g·t−1 were measured to explain the destabilization of impurity removal when excessive SHMP were added. When the dosage of SHMP increased from 1 × 10³ g·t−1 to 5 × 10³ g·t−1, as can be seen, ζ potentials of all three minerals present an inverse increase (absolute value decrease). It should also be noted that the electrical double layers of minerals were significantly compressed at high ionic strengths [35]. All the results indicate that an appropriate dosage of SHMP could improve the removal efficiency of clay impurities in NPQ, but an excessive dosage of SHMP could have a negative impact on the impurity removal, i.e., the same as adjusting pH.

5. Conclusions

In summary, scrubbing combining with centrifugation was proven to be an effective method for the desliming purification of NPQ. The removal efficiency of impurities reached an optimal value at pH 9.3, or when the dosage of SHMP reached 1 × 10³ g/t. The main impurities of Fe2O3 and Al2O3 in the concentrate decreased to less than 0.01% and 0.02%, respectively. It was concluded that the scrubbing process played an important role in the enhancement of impurities liberation. Then, the addition of regulators such as NaOH or SHMP could effectively increase the negative ζ potential of minerals, and thus increase the VT, which could effectively decrease the possibility of the heterocoagulation between quartz and impurities, as well as the homocoagulation among hematite particles, consequently improving the removal efficiency of impurities. In conclusion, this technique could be an environment-friendly and highly efficient method for the purification of NPQ.

Author Contributions

Conceptualization, Z.S. and S.Z.; Data Curation, X.D.; Investigation, X.D., C.L. and D.H.; Project Administration, Z.S. and S.Z.; Software, X.D.; Supervision, Z.S. and S.Z.; Writing—Original Draft, X.D.; Writing—Review and Editing, Z.S. and S.Z.

Funding

This research was funded by the Young Elite Scientists Sponsorship Program by CAST (2017QNRC001), the Fundamental Research Funds for the Central Universities (2010YH10 and 2015QH01)

Conflicts of Interest

The authors declare no conflict of interest.

References

  1. Santos, M.F.M.D.; Fujiwara, E.; Schenkel, E.A.; Enzweiler, J.; Suzuki, C.K. Quartz sand resources in the Santa Maria Eterna formation, Bahia, Brazil: A geochemical and morphological study. J. South Am. Earth Sci. 2015, 62, 176–185. [Google Scholar] [CrossRef]
  2. Huang, H.; Li, J.; Li, X.; Zhang, Z. Iron removal from extremely fine quartz and its kinetics. Sep. Purif. Technol. 2013, 108, 45–50. [Google Scholar] [CrossRef]
  3. Prakash, S.; Das, B.; Mohanty, J.K.; Venugopal, R. The recovery of fine iron minerals from quartz and corundum mixtures using selective magnetic coating. Int. J. Miner. Process. 1999, 57, 87–103. [Google Scholar] [CrossRef]
  4. Zhong, L.L.; Lei, S.M.; Wang, E.W.; Pei, Z.Y.; Li, L.; Yang, Y.Y. Research on Removal Impurities from Vein Quartz Sand with Complexing Agents. Appl. Mech. Mater. 2013, 454, 194–199. [Google Scholar] [CrossRef]
  5. Andrews, P.R.A.; Collings, R.K. Canadian silica resources for glass and foundry sand production: Processing studies at CANMET. Int. J. Miner. Process. 1989, 25, 311–317. [Google Scholar] [CrossRef]
  6. Tuncuk, A.; Akcil, A. Iron removal in production of purified quartz by hydrometallurgical process. Int. J. Miner. Process. 2016, 153, 44–50. [Google Scholar] [CrossRef]
  7. Zhang, Z.; Li, J.; Li, X.; Huang, H.; Zhou, L.; Xiong, T. High efficiency iron removal from quartz sand using phosphoric acid. Int. J. Miner. Process 2012, 114–117, 30–34. [Google Scholar] [CrossRef]
  8. Hou, Y.; Liu, P.; Hou, Q.; Duan, H.; Xie, Y. Study on removal fluid inclusions in quartz sand by microwave explosion. Nanosci. Nanotechnol. Lett. 2017, 9, 151–154. [Google Scholar] [CrossRef]
  9. Štyriakov, A.I.; Štyriak, I.; Kraus, I.; Uhlík, P.; Madejov, A.J.; Orolínov, A.Z. Bioleaching of clays and iron oxide coatings from quartz sands. Appl. Clay Sci. 2012, 61, 1–7. [Google Scholar] [CrossRef]
  10. He, M.S.; Yao, Q.; Yi, Y.Q. Analysis of the development and utilization and the supply and demand situation on Natural powder quartz at Jiang Xi province. China Nonmet. Miner. Ind. 2003, 6, 52–55. (In Chinese) [Google Scholar]
  11. Richard, B.; John, M.M. Geology of Microcrcrystalline Silica (Tripoli) Deposits, Southernmost Illinois. Illinois State Geological Survey. 1994, pp. 4–8. Available online: https://core.ac.uk/download/pdf/17355415.pdf (accessed on 27 January 2019).
  12. Tan, J.; Zhou, H.; Wang, M.; Zhu, B.Q.; Gao, X.Q.; Zheng, C.H. Study of the purification and whitening of Natural powder quartz. Acta Mineral. Sin. 2014, 34, 7–12. (In Chinese) [Google Scholar]
  13. Zhang, Y.P.; Huang, K.L.; Liu, S.Q. Separation of clinochlore from powder quartz by reverse flotation and its mechanism. J. Cent. South Univ. Technol. (Sci. Technol.) 2007, 2, 285–290. (In Chinese) [Google Scholar]
  14. Bayley, R.W.; Biggs, C.A. Characterisation of an attrition scrubber for the removal of high molecular weight contaminants in sand. Chem. Eng. J. 2005, 111, 71–79. [Google Scholar] [CrossRef]
  15. Stražišar, J.; Sešelj, A. Attrition as a process of comminution and separation. Powder Technol. 1999, 105, 205–209. [Google Scholar] [CrossRef]
  16. Sun, Z.; Yang, X.; Zhang, G.; Zheng, S.; Frost, R.L. A novel method for purification of low grade diatomite powders in centrifugal fields. Int. J. Miner. Process. 2013, 125, 18–26. [Google Scholar] [CrossRef] [Green Version]
  17. Batalović, V. Centrifugal separator, the new technical solution, application in mineral processing. Int. J. Miner. Process. 2011, 100, 86–95. [Google Scholar] [CrossRef]
  18. Kang, S.; Zhao, Y.; Wang, W.; Zhang, T.; Chen, T.; Yi, H.; Rao, F.; Song, S. Removal of methylene blue from water with montmorillonite nanosheets/chitosan hydrogels as adsorbent. Appl. Surf. Sci. 2018, 448, 203–211. [Google Scholar] [CrossRef]
  19. Petruk, W. Automatic Image Analysis for Mineral Beneficiation. JOM 1988, 40, 29–31. [Google Scholar] [CrossRef]
  20. Fandrich, R.; Gu, Y.; Burrows, D.; Moeller, K. Modern SEM-based mineral liberation analysis. Int. J. Min. Process. 2007, 84, 310–320. [Google Scholar] [CrossRef]
  21. Houta, N.; Lecomte-Nana, G.L.; Tessier-Doyen, N.; Peyratout, C. Dispersion of phyllosilicates in aqueous suspensions: Role of the nature and amount of surfactant. J. Colloid Interface Sci. 2014, 425, 67–74. [Google Scholar] [CrossRef] [PubMed]
  22. Yu, Y.; Ma, L.; Xu, H. DLVO theoretical analyses between montmorillonite and fine coal under different pH and divalent cations. Powder Technol. 2018, 330, 147–151. [Google Scholar] [CrossRef]
  23. Israelachvili, J.N. Intermolecular and Surface Forces, 3rd ed.; Academic Press: New York, NY, USA, 1985; p. 262. [Google Scholar]
  24. Berg, J.C. An Introduction to Interfaces & Colloids: The Bridge to Nanoscience; World Scientific: Singapore, 2010. [Google Scholar]
  25. Robinson, D. Measurement of the solid dielectric permittivity of clay minerals and granular samples using a time domain reflectometry immersion method. Vadose Zone J. 2004, 3, 705–713. [Google Scholar] [CrossRef]
  26. Marland, S.; Merchant, A.; Rowson, N. Dielectric properties of coal. Fuel 2001, 80, 1839–1849. [Google Scholar] [CrossRef]
  27. Kaya, A.; Yukselen, Y. Zeta potential of clay minerals and quartz contaminated by heavy metal. Can. Geotech. J. 2005, 42, 1280–1289. [Google Scholar] [CrossRef]
  28. Yukselen-Aksoy, Y.; Kaya, A. A study of factors affecting on the zeta potential of kaolinite and quartz powder. Environ. Earth Sci. 2011, 62, 697–705. [Google Scholar] [CrossRef]
  29. Rohem Peçanha, E.; da Fonseca de Albuquerque, M.D.; Antoun Simão, R.; de Salles Leal Filho, L.; de Mello Monte, M.B. Interaction forces between colloidal starch and quartz and hematite particles in mineral flotation. Colloid Surf. A Physicochem. Eng. Asp. 2019, 562, 79–85. [Google Scholar] [CrossRef]
  30. James, R.O.; Healy, T.W. Adsorption of hydrolyzable metal ions at the oxide—Water interface. II. Charge reversal of SiO2 and TiO2 colloids by adsorbed Co(II), La(III), and Th(IV) as model systems. J. Colloid Interface Sci. 1972, 40, 53–64. [Google Scholar] [CrossRef]
  31. Li, Z.-Y.; Xu, R.-K.; Li, J.-Y.; Hong, Z.-N. Effect of clay colloids on the zeta potential of Fe/Al oxide-coated quartz: A streaming potential study. J. Soils Sediments 2016, 16, 2676–2686. [Google Scholar] [CrossRef]
  32. Rodríguez, K.; Araujo, M. Temperature and pressure effects on zeta potential values of reservoir minerals. J. Colloid Interface Sci. 2006, 300, 788–794. [Google Scholar] [CrossRef] [PubMed]
  33. Espinozaortega, O. Role of Sodium Hexametaphosphate in the Flotation of Acanthite Fines from Finely Disseminated Ores. Sep. Sci. Technol. 2009, 44, 2971–2982. [Google Scholar]
  34. Zhang, T.; Vandeperre, L.J.; Cheeseman, C.R. Formation of magnesium silicate hydrate (M-S-H) cement pastes using sodium hexametaphosphate. Cem. Concr. Res. 2014, 65, 8–14. [Google Scholar] [CrossRef] [Green Version]
  35. Tiller, C.L.; O’Melia, C.R. Natural organic matter and colloidal stablility: Models and measurements. Colloid Surf. A Physicochem. Eng. Asp. 1993, 73, 89–102. [Google Scholar] [CrossRef]
Figure 1. XRD pattern of NPQ.
Minerals 09 00140 g001
Figure 2. (a) SEM image of NPQ, (b) SEM image of impurity adhering on quartz surface, (c) EDS of impurity.
Minerals 09 00140 g002
Figure 3. SEI image and spectrum of orthoclase in NPQ. (a) SEI image of quartz and orthoclase, (b) Energy spectrum of quartz, (c) Energy spectrum of orthoclase.
Minerals 09 00140 g003
Figure 4. SEI image and spectrum of hematite in NPQ. (a) SEI image of hematite, (b) Energy spectrum of hematite.
Minerals 09 00140 g004
Figure 5. Distribution ratio of Fe2O3 (A) and Al2O3 (B) in T1, T2 and concentrate (Con) at different experiment conditions.
Minerals 09 00140 g005
Figure 6. SEM images of concentrate and T2 in different conditions, (a,b) concentrate without scrubbing, (c,d) concentrate with scrubbing, (e,f) T2 of No. 2.
Minerals 09 00140 g006
Figure 7. Effect of pH on the removal of impurities in concentrate.
Minerals 09 00140 g007
Figure 8. Effect of SHMP on the removal efficiency of impurities in concentrate.
Minerals 09 00140 g008
Figure 9. The ζ potential of quartz (Q), hematite (H) and orthoclase (O) as a function of pH at constant ionic strength of 1.0 mM KNO3.
Minerals 09 00140 g009
Figure 10. Relationship between interaction energy of impurities with quartz and particles distance at different pH; (A) is the relationship of hematite with quartz; (B) is the relationship of orthoclase with quartz.
Minerals 09 00140 g010
Figure 11. The relationship between interaction energy of fine impurities and particles distances at pH 7.
Minerals 09 00140 g011
Figure 12. The relationship between interaction energy of H–H and particles distance at different pHs.
Minerals 09 00140 g012
Figure 13. Stability of slurry of T2 at different pHs.
Minerals 09 00140 g013
Table 1. Chemical analysis of the dry NPQ (wt %).
CompositionsSiO2Al2O3Fe2O3TiO2CaOMgOK2ONa2OL.O.I. a
Content (wt %)98.880.480.190.030.060.040.040.050.24
a Loss on ignition.
Table 2. Yields and contents of Fe2O3 and Al2O3 in different sizable of NPQ.
Particle Size/MeshYield (%)Content (%)
Fe2O3Al2O3
+1001.960.3010.862
−100~+2004.510.1320.157
−200~+32526.140.0400.031
−325sediments61.950.0530.043
suspensions5.442.5768.790
Table 3. Distribution of Al2O3 and Fe2O3 at different minerals in NPQ detected by MLA (%).
ImpuritiesHematiteOrthoclaseAnorthoseMicaTotal
Fe2O392.17007.83100
Al2O3064.4226.539.06100
Table 4. Experiments conditions and results.
No.RegulatorDosage /(g·t-1)ProductYield (%)Impurity Content (%)
Fe2O3Al2O3
1 /T16.470.1820.365
/T25.442.5517.76
Con88.090.0480.04
2 /T14.520.1730.311
/T25.852.8577.51
Con89.630.0200.033
500T14.330.1410.179
3NaOHT26.032.9487.602
Con89.640.0100.018
500T14.380.1480.169
4SHMPT26.022.9637.521
Con89.600.0100.024
Table 5. ζ potential of quartz, hematite and orthoclase at different dosage of SHMP at pH 7.
ζDosage of SHMP /g·t-1
010005000
Quartz−51.31−56.03−38.57
Hematite−27.01−61.83−51.23
Orthoclase−25.56−75.07−67.57

