Abstract
The main advantage of X-ray microcomputed tomography (µCT) as a non-destructive imaging tool lies in its ability to analyze the three-dimensional (3D) interior of a sample, therefore eliminating the stereological error exhibited in conventional two-dimensional (2D) image analysis. Coupled with the correct data analysis methods, µCT allows extraction of textural and mineralogical information from ore samples. This study provides a comprehensive overview on the available and potentially useful data analysis methods for processing 3D datasets acquired with laboratory µCT systems. Our study indicates that there is a rapid development of new techniques and algorithms capable of processing µCT datasets, but application of such techniques is often sample-specific. Several methods that have been successfully implemented for other similar materials (soils, aggregates, rocks) were also found to have the potential to be applied in mineral characterization. The main challenge in establishing a µCT system as a mineral characterization tool lies in the computational expenses of processing the large 3D dataset. Additionally, since most of the µCT dataset is based on the attenuation of the minerals, the presence of minerals with similar attenuations limits the capability of µCT in mineral segmentation. Further development on the data processing workflow is needed to accelerate the breakthrough of µCT as an analytical tool in mineral characterization.
1. Introduction
Following the widespread development of X-ray microcomputed tomography (µCT) in medical applications and in diverse industrial applications, potential applications of µCT have been reviewed within the geosciences [1,2], especially for mineral characterization [3,4]. Being a non-destructive technique, which allows for three-dimensional (3D) analysis of an object, µCT systems offer a new depth of information that has not been available with conventional two-dimensional (2D)-based microscopy analysis. Several studies have investigated the application of µCT in performing mineral characterization, which includes pore analysis [5,6,7,8,9,10], liberation and grain exposure analysis [11,12,13,14,15], crack and breakage analysis [14,16,17], as well as mineral segmentation analysis [3,17,18,19].
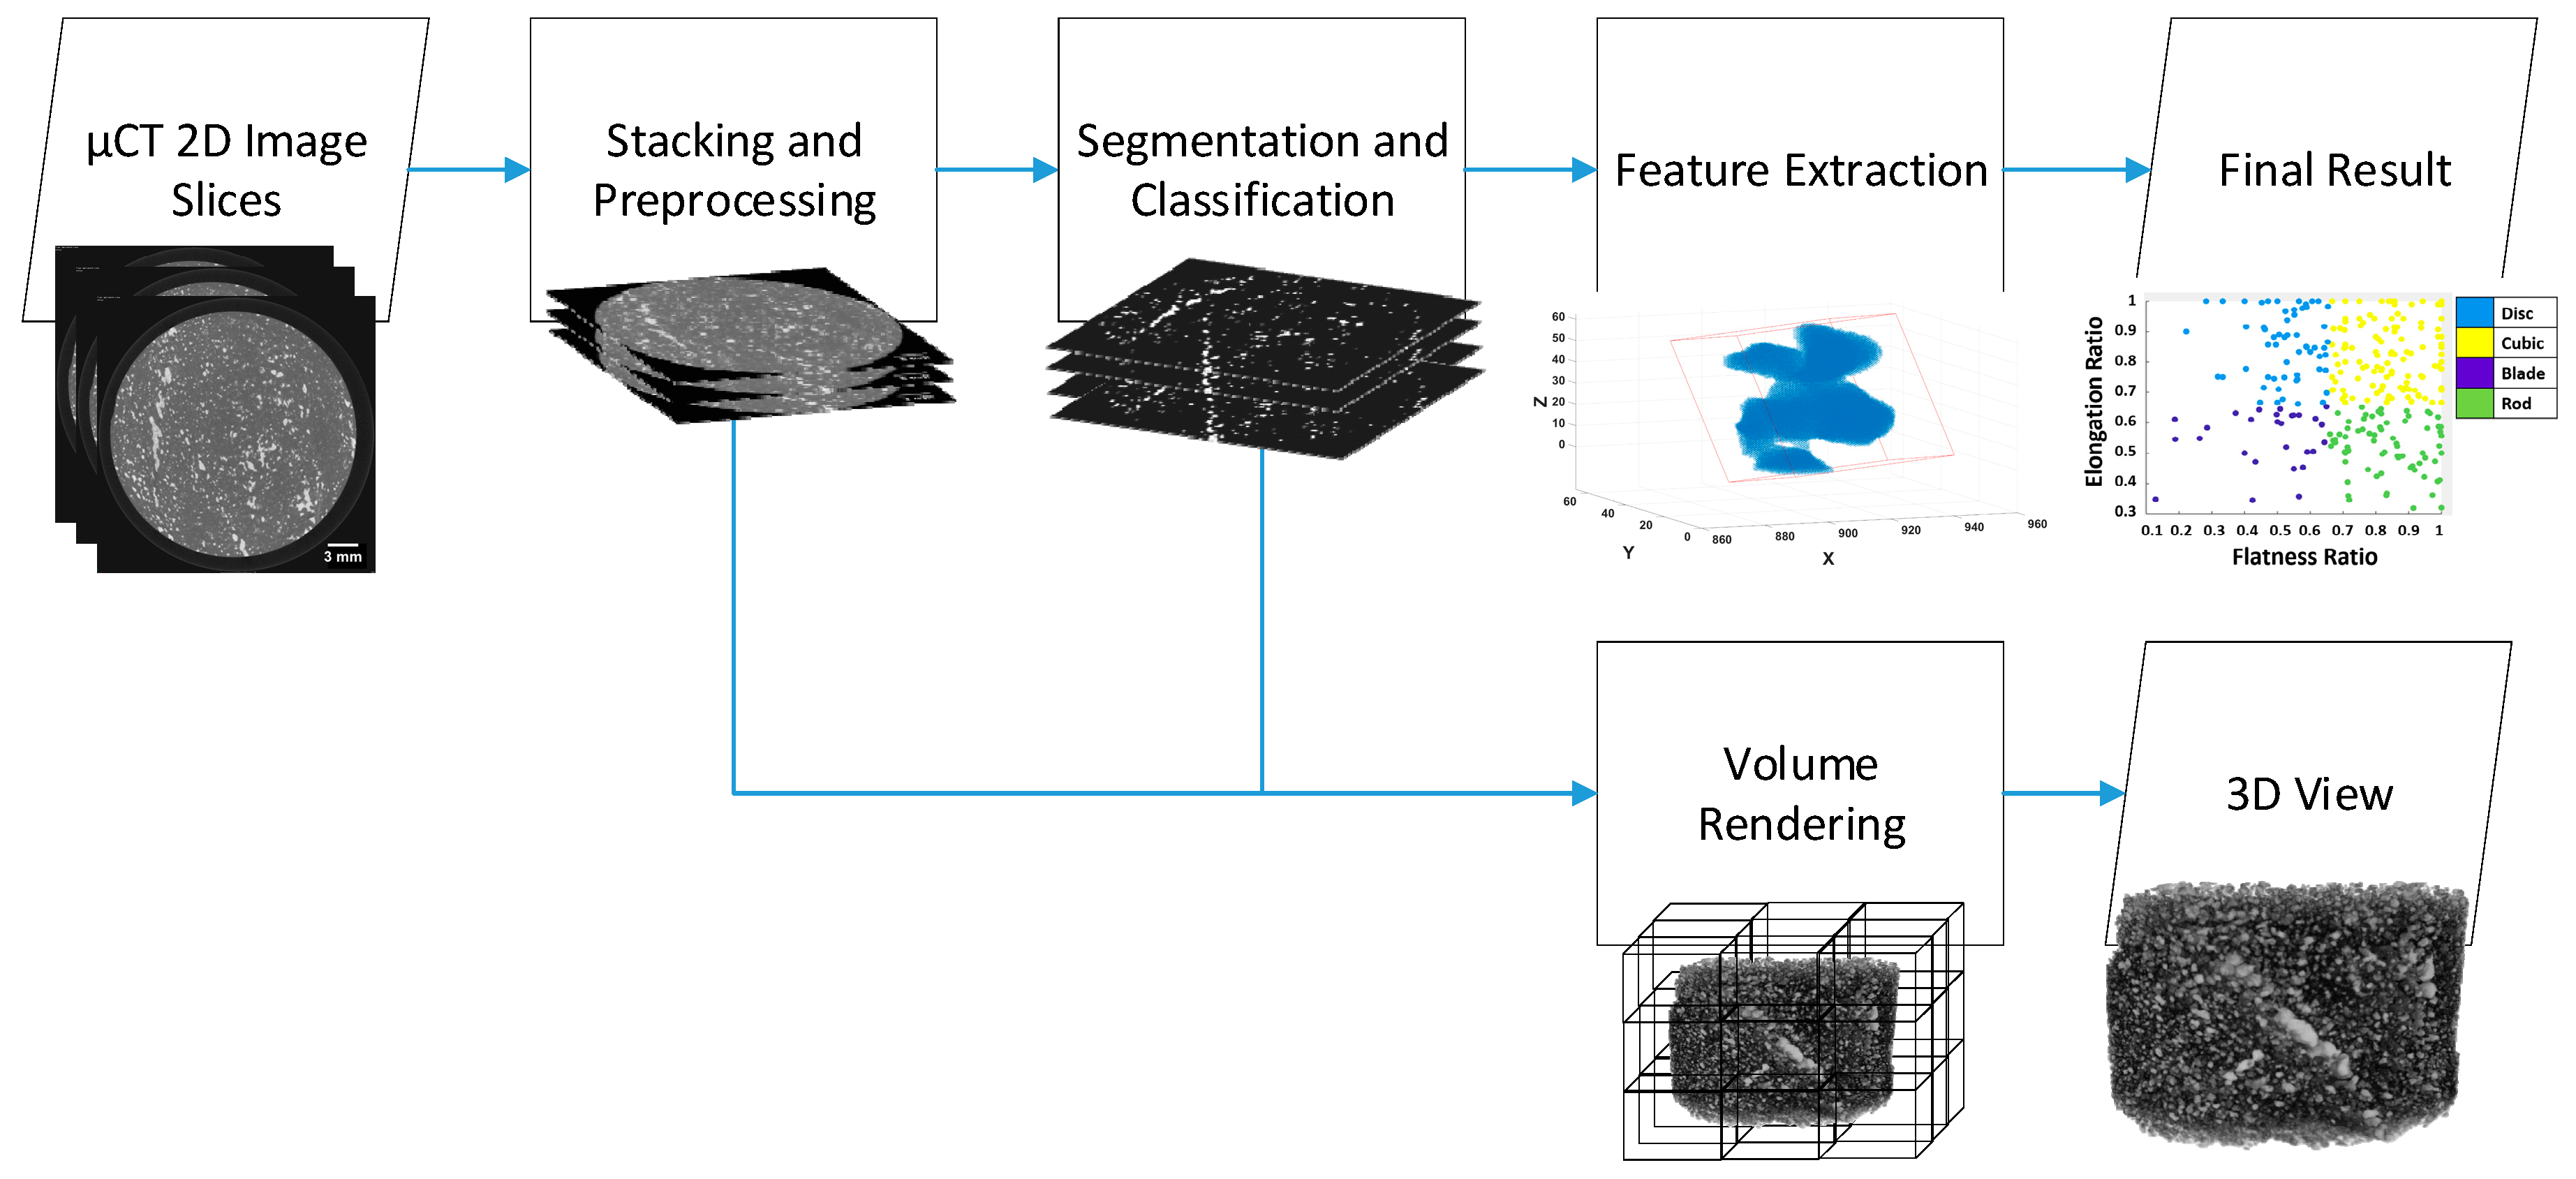
While work towards identifying further potential applications of µCT continues, several studies have also been focusing on development of data processing to better analyze µCT datasets [9,18,20,21,22,23,24,25,26]. A typical data processing tool of µCT images in relation to mineral characterization can be generalized into several steps that are illustrated in Figure 1.
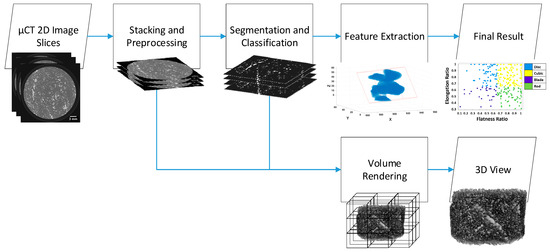
Figure 1.
Typical workflow involved in µCT data analysis for mineral characterization. The resulting 2D µCT slices are stacked and preprocessed into a 3D image. Segmentation and classification are performed so that a volume of interest (VOI) can be analyzed further. In relation to mineral characterization, this VOI usually represents a phase in the sample (an example here is the sulphide phase), so that features of that phase can be extracted (an example here is the grain shape). Volume rendering is done to produce a 3D view on a 2D display screen.
Many reviews have been conducted with regard to µCT applications [1,2,3,4,11]. Such reviews mostly analyze the applicability and performance of µCT systems for different cases of mineral analysis. Potential new applications were identified through addressing the advancement made in the µCT instruments, such as dual-energy µCT [1,17], in situ experiments during acquisition [27,28], the use of diffraction and phase contrast modes [29,30], as well as sub-micron resolution [1,31,32].
While the applicability and usage of µCT in mineral characterization has been reviewed, there seems to be lack of studies in evaluating the data analysis methods involved in processing µCT datasets. This review aims to address just that; it aims to thoroughly discuss various µCT data analysis methods, their limitations, as well as their application in mineral characterization. By exploring the data analysis methods, this review can be a reference in determining which data analysis methods shall be implemented in various cases of mineral characterization using µCT systems.
The primary sources of studies for this review are those that apply laboratory µCT systems in characterizing ore samples. Moreover, this review focuses mainly on absorption-contrast mode tomography, as this is the conventional mode in laboratory µCT systems. As the objective of this review is also to further explore potential data analysis methods that can be applied in mineral characterization, other µCT applications in similar materials, such as different types of rocks, sands, powders, and aggregates, are also considered. Some other materials that are less similar to ore samples, such as composites, soils, and artificial fibrous networks, are also evaluated. Medical application of µCT systems are not considered as the nature of the system is different compared to the one used in material science. The algorithms in each step shown in Figure 1 are systematically evaluated alongside examples of cases and applications.
2. µCT Measurement and Data Acquisition
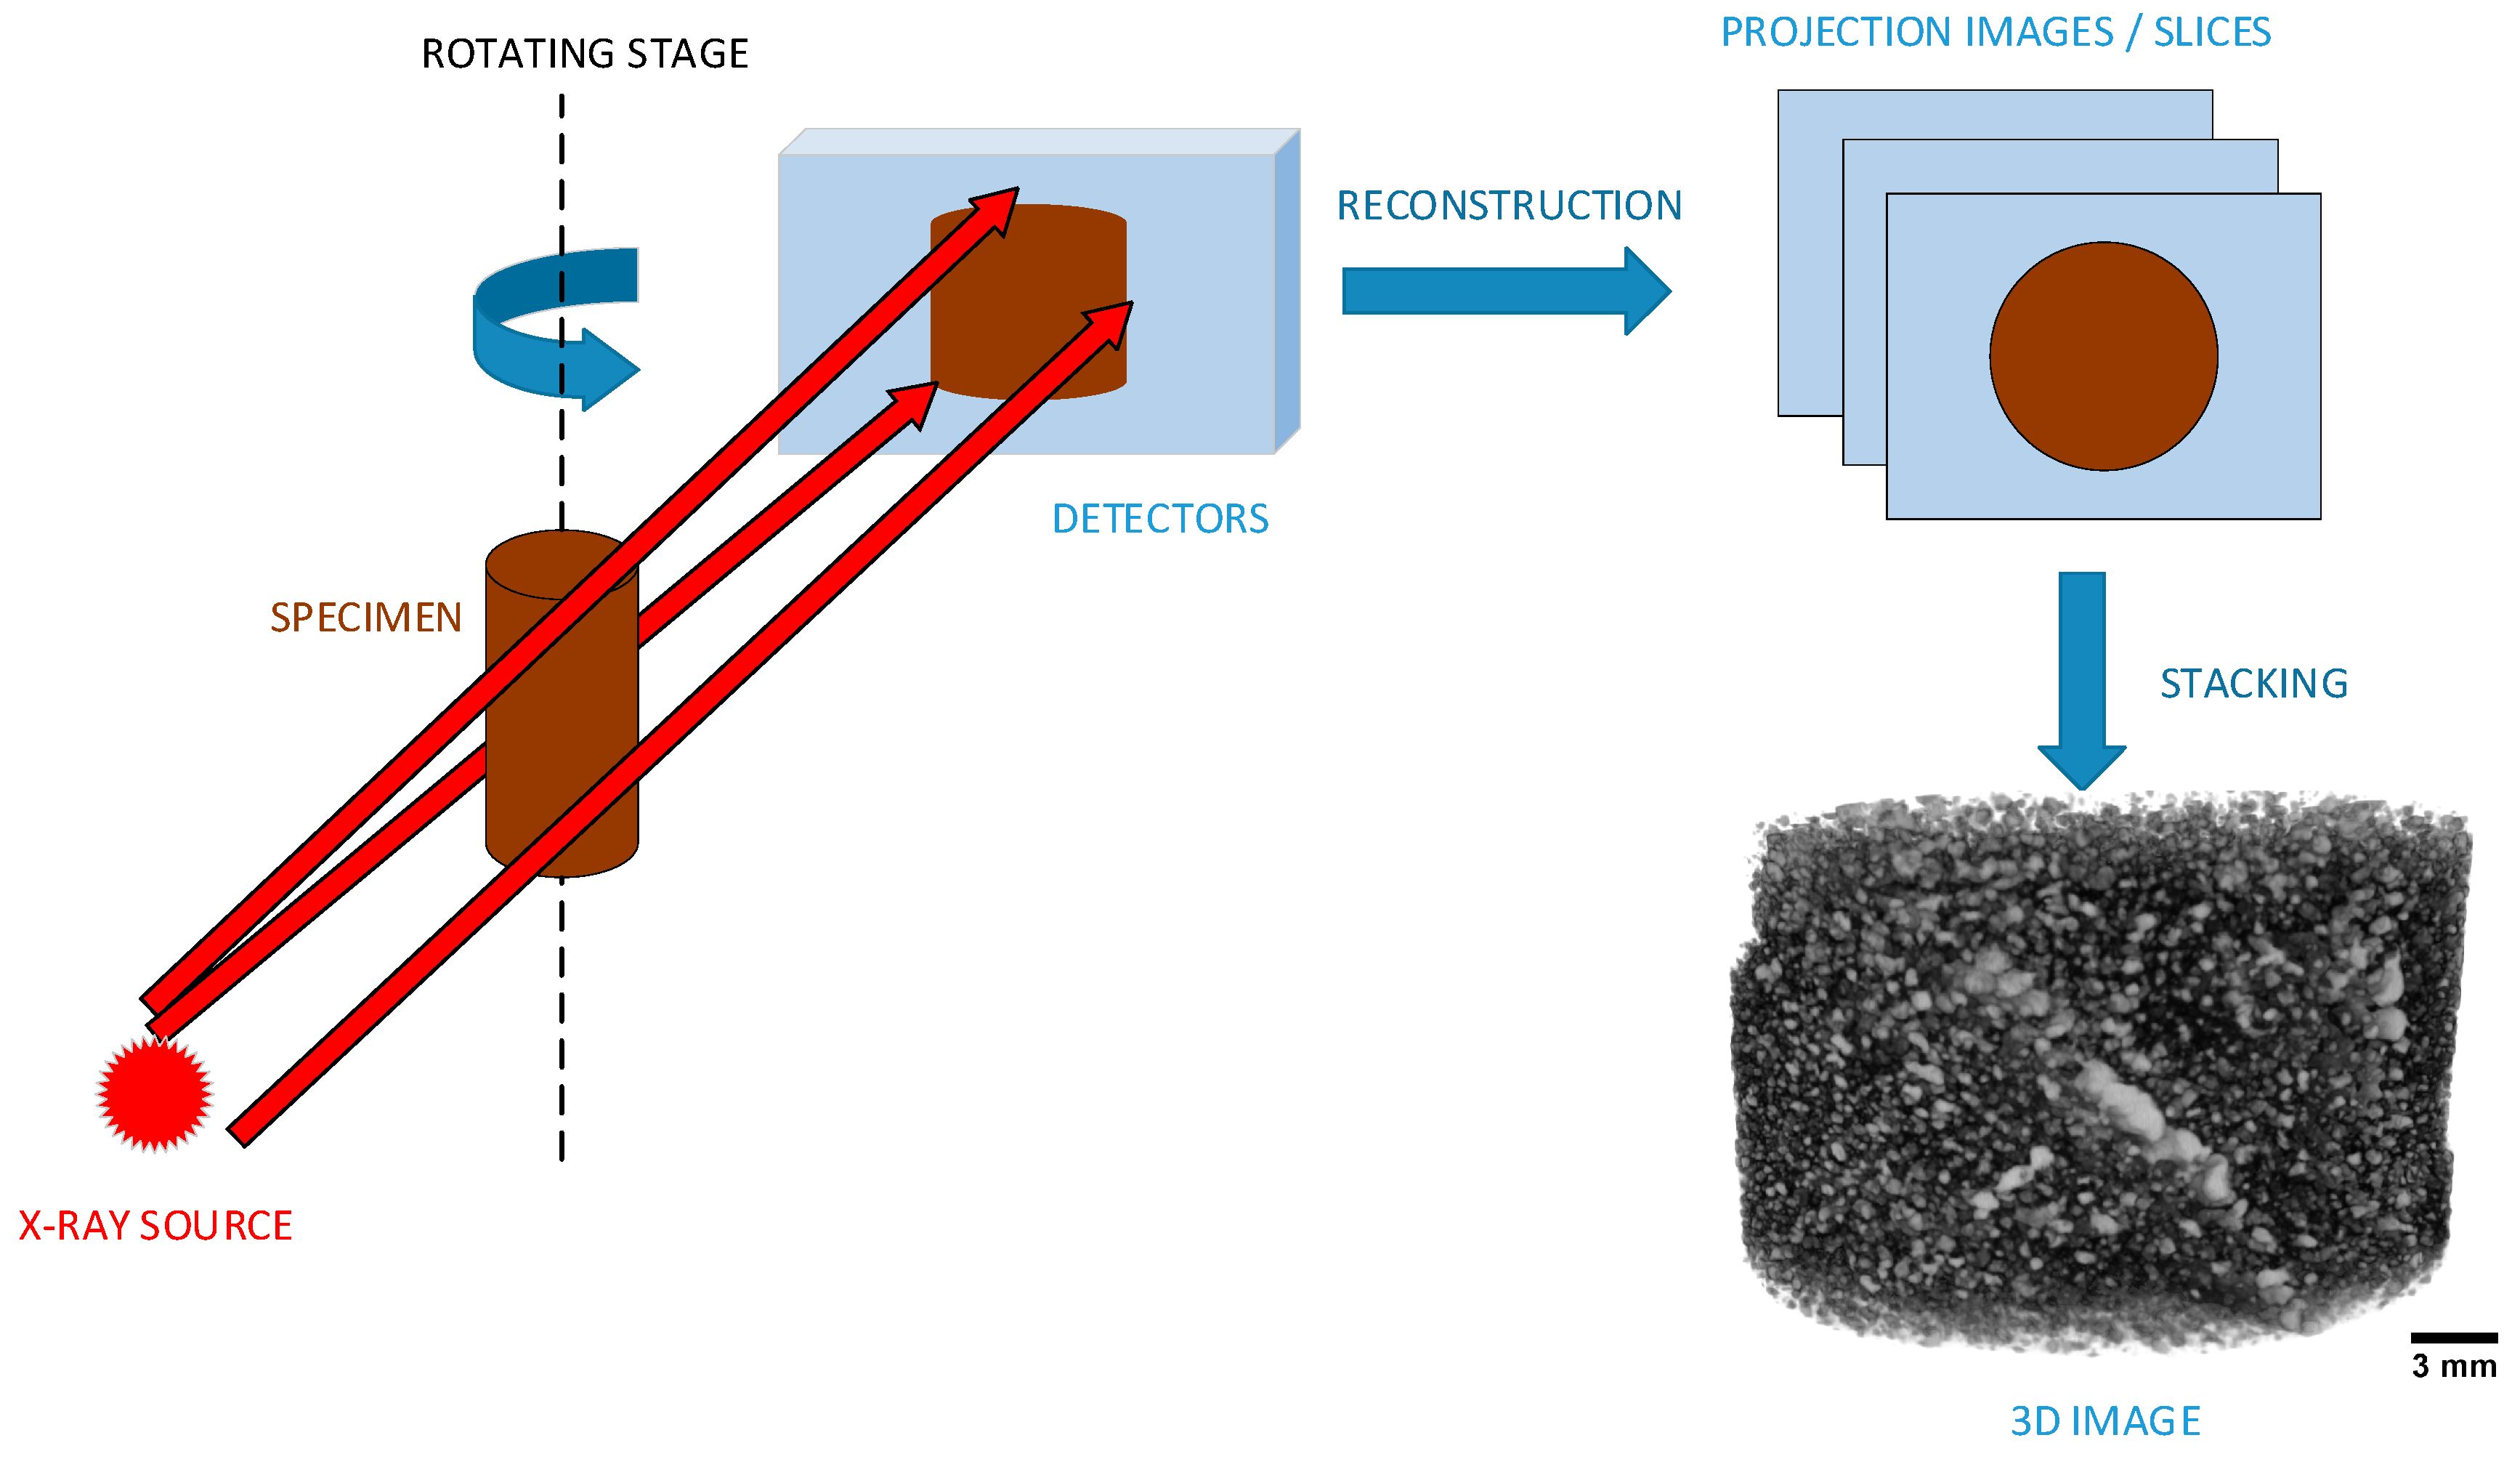
During acquisition, the sample for the µCT measurement is exposed to the incident X-ray beam and rotated through 180° to obtain a number of projections (typically between 600 to 3600 projections). These projections are then reconstructed to create 2D slices (projection images) of the measured volume. The pixels in the 2D slices retain spatial information about their originating volume elements (voxels) so that the slices could be stacked to recreate the 3D volume of the specimen. These 2D slices are also the “raw data” that could be put in the µCT data processing workflow in Figure 1. An illustrative image describing the processes involved in µCT measurement and data acquisition is shown in Figure 2.
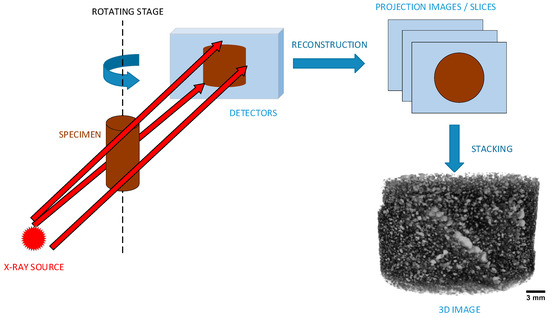
Figure 2.
Specimen analysis and data acquisition using µCT. The X-ray beam originates from a small focal spot and illuminates a planar detector. The specimen is fixed in a stage, and rotated to obtain several projections over a range of angles and positions. The 2D image slices are reconstructed from these projections, whereas afterwards it can be stacked and rendered to create the 3D volume for displaying purposes.
The µCT configuration shown in Figure 2 resembles the most widely used modern laboratory cone beam scanning configuration. Other configurations, such as fan beam, near-parallel beam, as well as synchrotron-based µCT, are not the main focus in this review; interested readers are referred to other reviews [1,3,33].
2.1. Measurements
The principle of µCT is similar to other X-ray based analysis, whereas it records the differences in X-ray attenuation by the object. Attenuation is described as the proportion of the X-ray that interacts with the material and represented by the gray intensities in the reconstructed slice images. The interaction between the material and the X-ray beam decreases the intensity of the X-ray as it passes through the volume. This decrease of intensity is described by the Beer–Lambert Law:
where is the intensity measured at the detector (units: mass time−3), is the intensity of original incident beam from the X-ray source, x is the length of the X-ray path within the material, and µ is the attenuation coefficient of the material (units: length−1), which depends on the material atomic number and density.
Due to the stage rotation, the beam angle (α) is varied, which in turn affects the attenuation coefficient. Deriving from Equation (1), the correlation between the beam angle and attenuation coefficient (µ) for a given length of X-ray path (L) is given below:
The attenuation coefficient is then related to its theoretical values for different ore minerals (µC). The theoretical values can be calculated as a function of the X-ray energy (ε, units: mass length2 time−2), and mineral density (ρ, units: mass length−3). Such calculation is given in Equation (3).
refers to the mass attenuation coefficient which depends on the X-ray energy used in the measurement. The dependency of on energy can be expressed by Equation (4) [34], in which a and b are the energy-dependent coefficients, and is the bulk atomic number of the material.
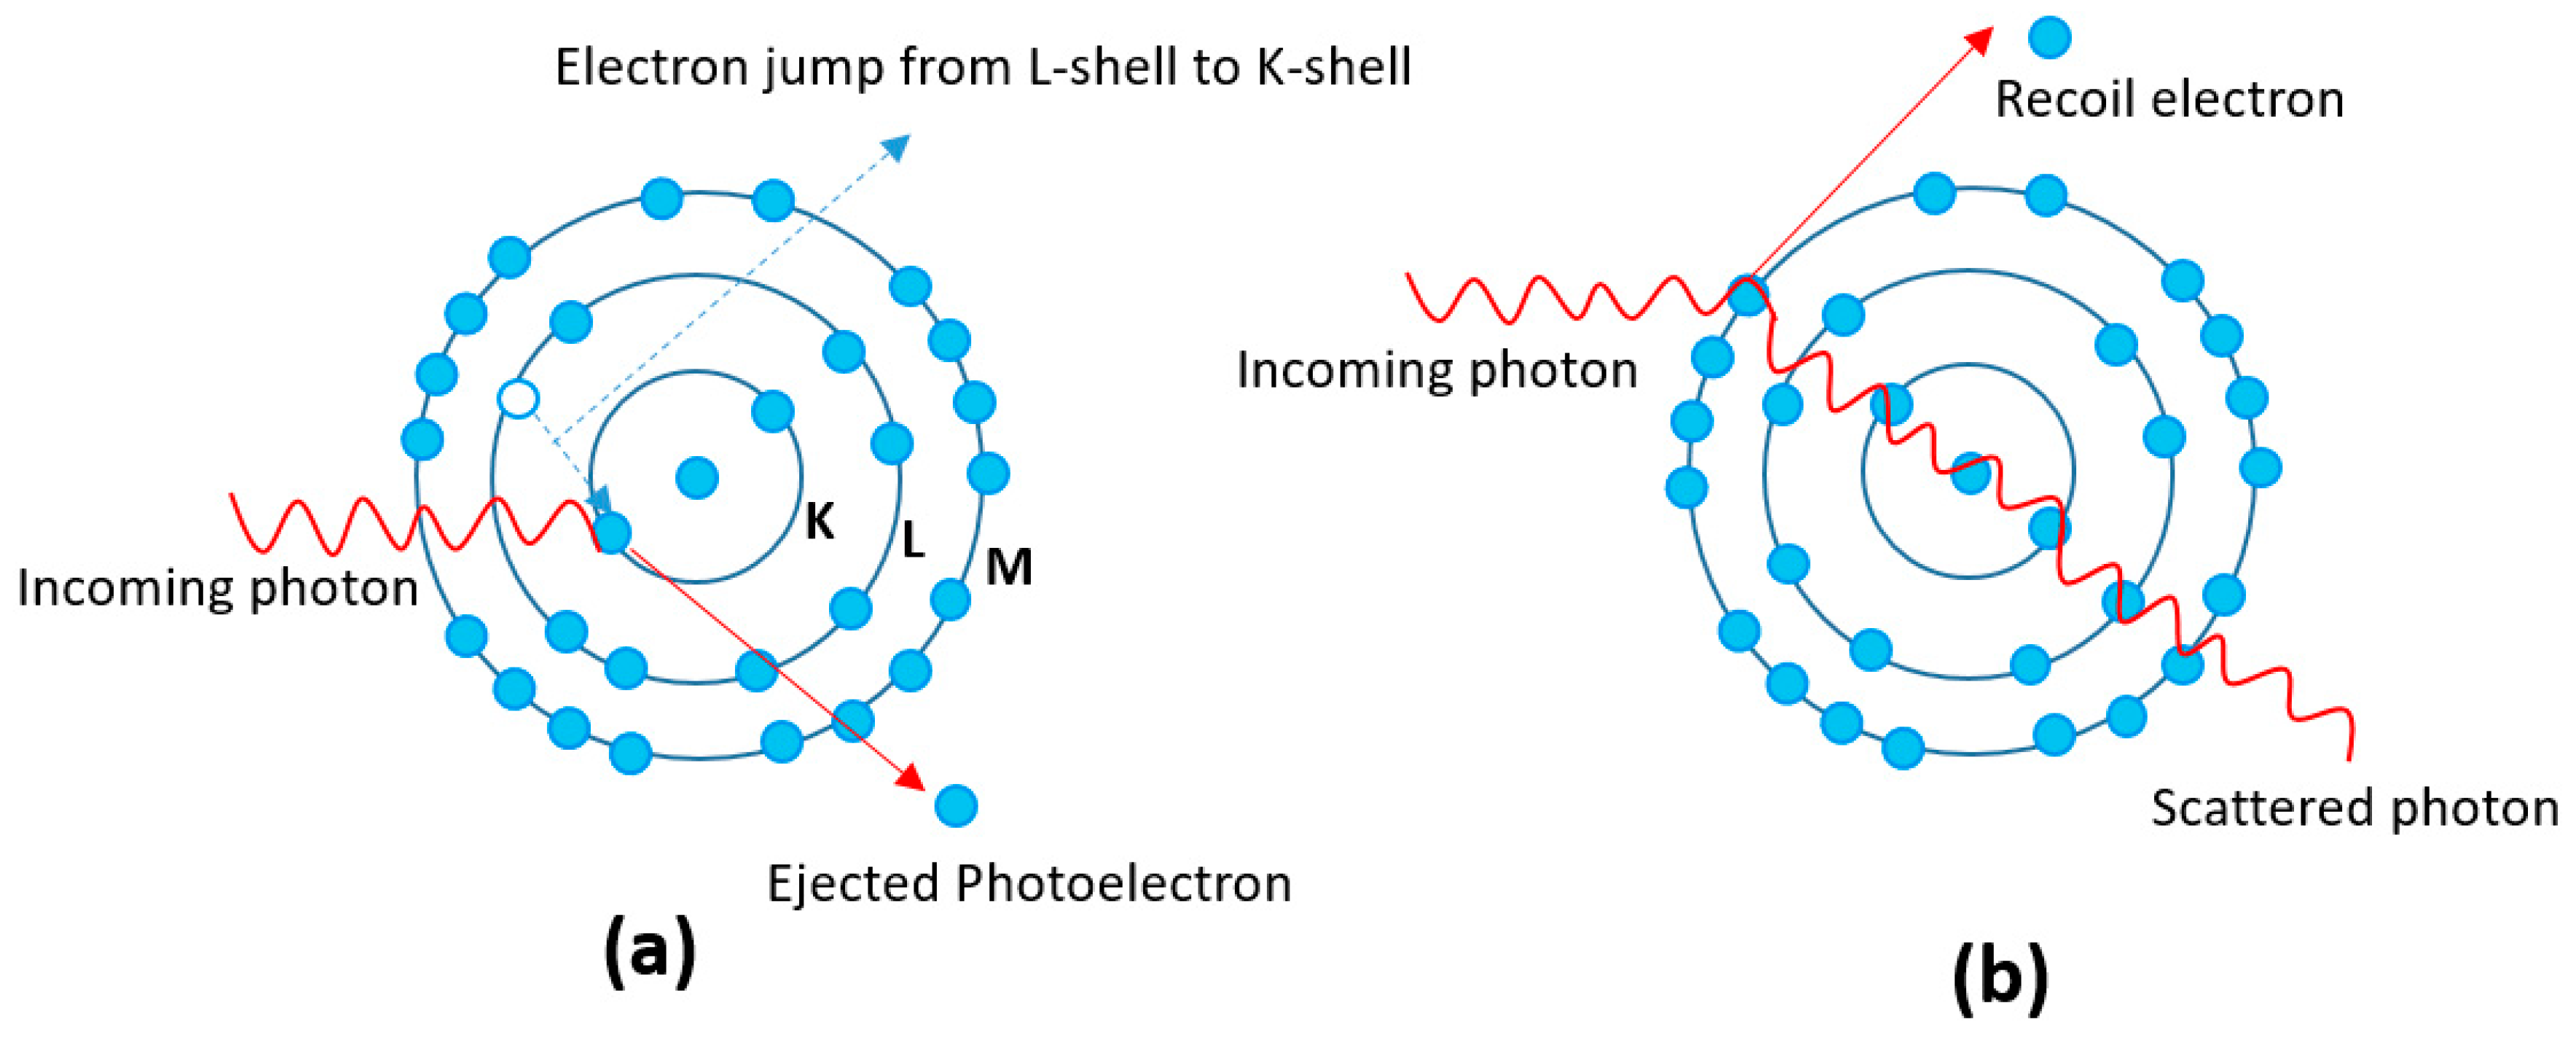
Depending on the energy spectrum, different attenuation mechanisms prevail. In lower energy spectra (50–100 keV), photoelectric absorption predominates, in which the incoming X-ray photon ejects the inner electron by occupying the inner shell of the atom. This imbalance causes the electron from the outer shell to jump to the inner shell. The resulting µ based on this mechanism is proportional to Z4–5. In the higher energy range (up to 5–10 MeV), Compton scattering is more prevalent, in which the incoming photon only interacts with the outer electron and deflects it to a different direction. This mechanism yields attenuation coefficient (µ) that is proportional to Z. As it suggests by the relation of µ with Z, photoelectric absorption is highly dependent on the atomic number of the material, while Compton scattering strongly depends on density of the material (it is less dependent on the atomic number) [35]. Both mechanisms are illustrated in Figure 3.
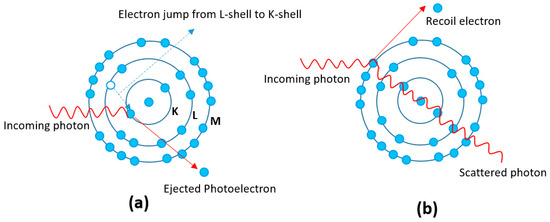
Figure 3.
Interaction of X-ray photons to the subjected atom, showing: (a) photoelectric absorption; and (b) Compton scattering.
The dependence of the X-ray attenuation coefficient to the energy spectrum poses a trade-off in differentiating mineral phases within the sample. Higher energy means a better penetrative capability of the X-ray beam which, in turn, results in a better signal-to-noise ratio, but it often becomes less sensitive in differentiating mineral phases in the rock sample. Decreasing the energy could overcome this limitation, but this also decreases the penetrative capability of the X-ray, therefore requiring longer exposure time to achieve good signal-to-noise ratio. This could further be explained by the circumstance that in lower energy spectra, the resulting µ is proportional to Z4–5, which means that it is much more sensitive to changes in the atomic number, therefore better in differentiating phases in the sample. This is compared to having higher energy spectra in which µ is only proportional to Z, which then the difference in µ is more driven by density differences between the materials due to Compton effect. This principle is the key in differentiating minerals using µCT; by using lower energy, contrasts between minerals with similar densities can be achieved as it is driven more by the difference in atomic number. The dependence of attenuation coefficient of minerals to the X-ray energy is available in some databases, such as XCOM, managed by National Institute of Science and Technology (NIST) [36].
In fact, several researchers have addressed this issue of differentiating minerals by optimizing the scanning conditions of the µCT system. The use of lower energy spectra was evaluated by Reyes et al. [18] in which, at 50 kV, copper sulphide minerals were able to be distinguished from pyrite, with the help of SEM-EDS measurement as reference data. Reduction of sample size was also evaluated [3,37], as lower energy means longer acquisition time; reducing sample size is an alternative way to achieve reasonable acquisition time while at the same time minimizing the beam hardening effect. Such an effect makes attenuation of the same minerals differ depending on the location within the sample, therefore limiting the accuracy of the mineral differentiation [18]. Kyle et al. [38] has demonstrated that at scanning energy of 180 keV, differentiation of chalcopyrite and bornite is possible using smaller cores (≤22 mm), while Bam et al. [37] have also demonstrated that, at similar energy level, the beam hardening effect is minimized when the apatite-magnetite core sample size is reduced to 17 mm.
A calibration step prior to µCT data acquisition can also be performed in order to distinguish between minerals. This can be achieved by measuring pure minerals with known density, so that correlation between the attenuation coefficient and density is obtained, or by using dual-energy scanning so that the density of the material can be obtained directly through the relation between attenuation coefficients in two different energy levels [17,39]. However, the latter case is known to be sensitive to noise [40]. Such calibration could also be performed after acquisition by correlating the µCT data to SEM-EDS data [18,19] or XRF mapping [41,42].
The spatial resolution of the µCT system is also critical to produce good results as well as good signal-to-noise ratios. Spatial resolution defines how the volume is discretized, i.e., the volume over which Equation (2) is integrated. In other words, this resolution is the size of the smallest detectable object with µCT. Typically, a µCT scanner would have spatial resolution ranging from 10–50 µm [43]. Some newer generations of cone beam µCT systems are even able to reach below 1 µm, or even further, which is often termed as sub-µCT [44]. It is worth noting that higher resolution will lead to better results, but longer exposure time is needed as a higher number of projections is required to achieve such high resolution. In order to reduce cost, samples are often scanned at a lower resolution first, then afterwards its region of interest is determined where high-resolution scanning is carried out.
Some artifacts could be present during µCT measurement and data acquisition. Artifacts are defined as part of the reconstructed µCT slice images which did not originate from the original sample. Artifacts could originate from the physical interaction between the materials and the X-ray beam, or from the scanning process (detectors). These artifacts have been thoroughly discussed by several other workers [3,37,45,46]. The artifacts that regularly occurred with industrial (non-medical) µCT system are summarized in Table 1.

Table 1.
Summary of artifacts that occur with an industrial µCT system.
It is worth noting that the artifacts and limitations described earlier are mostly found when using the laboratory based µCT configurations. For example, the beam hardening effect can be avoided by the use of a monochromatic (synchrotron) source [47]. A synchrotron source also offers higher photon flux, allowing more rapid acquisition time, less image noise, and higher spatial resolution in comparison with laboratory µCT systems.
Moreover, some of the issues of mineral differentiation with µCT can be alleviated by the use of other contrast modes such as diffraction-contrast tomography (DCT) and phase-contrast tomography (PCT), which is mainly available only in synchrotron sources. Both contrast modes have found applications mostly in analysis of microstructures in crystalline samples, as it allows the high contrast between phases [48,49,50,51,52,53]. Synchrotron systems also open up possibilities of complimentary tomography methods such as X-ray diffraction microtomography (XRD-CT) and X-ray Fluorescence microtomography (XRF-CT). XRD-CT finds applications mostly in evaluating crystalline materials [54,55], while XRF-CT could be used to detect small features, such as inclusions in geological samples [48,56].
While these properties of synchrotron µCT systems make it clearly superior to laboratory µCT system, the access to such systems is generally limited due to high operational costs [1]. The current technology of laboratory µCT systems has not yet met the level of synchrotron source [37], but recent developments have extended their capabilities further. For example, recent works [29,30,57] have demonstrated the possibilities to perform PCT and DCT with laboratory µCT systems.
2.2. Reconstruction
Reconstruction is the process of creating µCT image slices from the projections obtained from the µCT measurement. The projections from µCT measurements are reconstructed, mainly by solving Equation (2) for all angles and positions using appropriate mathematical transformations [23]. The most widely used reconstruction method in µCT systems is the filtered back projection (FBP), which is based on Radon transformation. In FBP, all the projection values from the measurement are placed back into the appropriate position in the X-ray path/line between the source and detectors depending on its acquisition angle (α).
Prior to the back projection, these values are convoluted with a filter to remove blurring. Mathematical derivations and detailed explanations of the FBP method are available elsewhere [58]. With the cone beam scanning configurations, modification from the traditional convolution filter and back-projection based method is needed. Most of the cone beam µCT systems make use of the FBP reconstruction methods developed by Feldkamp [59], i.e., the Feldkamp, Davis, Kress (FDK) method.
It can be concluded that back projection is accurate only if the projection values are precise and clear without any noise. In real applications, the measurements often result in a probability distribution of the projection values; a single projection value in a given position and angle is almost impossible to achieve. A direct back projection of such values could result in reconstruction artifacts in the final image.
The iterative reconstruction method is another reconstruction method that can overcome the limitations of FBP. The method allows input of prior information about the µCT system to the algorithm, improving the accuracy of the method. The method itself is based on iteratively forward projecting the image and back projecting the projection values until convergence. Usually an initial estimate about the image is produced and forward-projected to estimate the projection values. The projection values are then compared with the actual measurement. The initial image estimate is then improved based on the back-projection values. These procedures are repeated until a convergence between the actual and estimated projection values is achieved. While this method can overcome the noise limitations, it is well known to be computationally intensive and slow compared to the traditional back projection method. Several studies [60,61,62] have been conducted to improve this iterative method, mainly aiming to lower its computational cost.
After the reconstruction, the reconstruction values or CT numbers are obtained, in which such values correspond to the grayscales in the reconstructed images. These numbers are linearly related to the attenuation coefficients of the material in each position. In medical systems, a relative scaling of this CT number is used which often termed as the Hounsfield Units (HU). The scaling is based on the attenuation of water (assigned at 0 HU) and air (assigned at −1000 HU). In the case of ore samples, often time a mineral phase would not have a single CT value, rather it would have a distribution of CT values. This is mostly caused by natural variation of chemical composition in the rocks itself due to weathering, solid solutions, zoning, etc.
3. Pre-Processing
The projection images are then stacked into a 3D dataset, which is a stack of 2D slice images. The pre-processing step is usually necessary in order to prepare the dataset for the subsequent steps.
Filtering
Filters are mathematical algorithms that are implemented in each pixel and its neighbors. These filters typically attempt to replace any pixel value that is inconsistent with its neighbors. The simplest approach is by convoluting a kernel (matrix) to the image. The kernel holds some values that would modify the image, and depending on the values, several tasks, such as denoising, blurring, sharpening, and edge detection, can be performed. The dimension of the kernel can be two or three dimensions depending on the image. Examples of these filters are listed below:
- Denoising and blurring filters, such as Gaussian and mean filters. As the name suggests, the typical drawback of these filters is that it blurs the image, including the phase boundaries which are critical in the segmentation process. This drawback is avoided by using edge-preserving filters, such as median, non-local mean, and bilateral filters. Some researchers have applied variation of these filters in their specific cases of µCT analysis of rock samples [9,21,63].
- Sharpening and edge detection filters, such as Laplacian filters, Sobel, Canny filters, Robert, and Prewitt filters [64,65,66]. These filters are typically used in rock µCT analysis especially in crack and pore detection [8,67], watershed segmentation [68], as well as feature extraction for supervised classification [15,19,22].
4. Segmentation and Classification
Segmentation refers to the grouping of digital image into several segments by identification and isolation of pixels that have the same features into a single category [69]. There are many different image segmentation methods, and several investigators have made reviews about their performances and applications [70,71,72]. More than a hundred segmentation algorithms based on these methods have also been developed, with many of them combining two or more methods. In this paper, the discussion will focus on methods that have been applied in µCT data analysis of ore samples.
4.1. Histogram Analysis
The most common segmentation method is based on the histogram analysis of grayscale intensities of the pixels in the image; an example is shown in Figure 4. The histogram provides the distribution of the grayscale level of each pixels in the image, therefore giving an idea regarding the different phases contained in the image. By analyzing the histogram of an image, one can obtain global information about the grayscale levels in the image. The analysis itself can be varying, including geometrical shape analysis of the histogram, entropy analysis between two classes, histogram deconvolution, as well as similarity attributes within one classes [73,74]. Histogram analysis can be used for µCT volumes in cases such as background removal [75], and to some extent pore extraction from rocks [7,8,74].

Figure 4.
Histogram of gray values of a 2D slice. The two peaks indicate a clear threshold value for separating two classes, which in this case are the background (left peak) and the drill core (right peak). Note that further thresholding for the phases within the drill core would be challenging as it seems difficult to separate the right peak into several peaks (phases).
4.2. Thresholding
Thresholding is a common term to describe the introduction of threshold/limit value on an image, thereby segmenting the features that are below the threshold and others that are above the threshold value. The value is usually the grayscale intensity of the pixels. Thresholding is often used in the first step of image processing in order to extract the volume of interest from the whole volume. There are two major types of thresholding algorithms:
- Global thresholding, where the threshold value is determined from the entire image properties, for example by analyzing the whole histogram of the image as in Figure 4.
- Local thresholding, which means that instead of considering the whole image, only a certain part of the image is considered as a basis in setting a threshold value.
In the case of global thresholding, an optimal threshold value must be chosen in order to obtain a good result. Some algorithms exist that can optimize the threshold value based on the image input, one of them developed by Otsu [75]. It remains a widely used algorithm in setting a threshold value for 3D µCT image analysis [6,18,20,76,77], especially in terms of segmenting between pores/air and mineral matrix. The Otsu thresholding method is an effective way in differentiating mineral phases and the pore space, however it may not works perfectly when the sample is heterogeneous and the volume of interest (VOI) is large; such large volume shall be sub-sampled to produce a suitable VOI that represent the whole volume [6]. Additionally, Otsu thresholding might not work properly in cases where boundaries between high density/high atomic number and low density materials exist, as the boundaries may not be thresholded properly due to the partial volume effect [22].
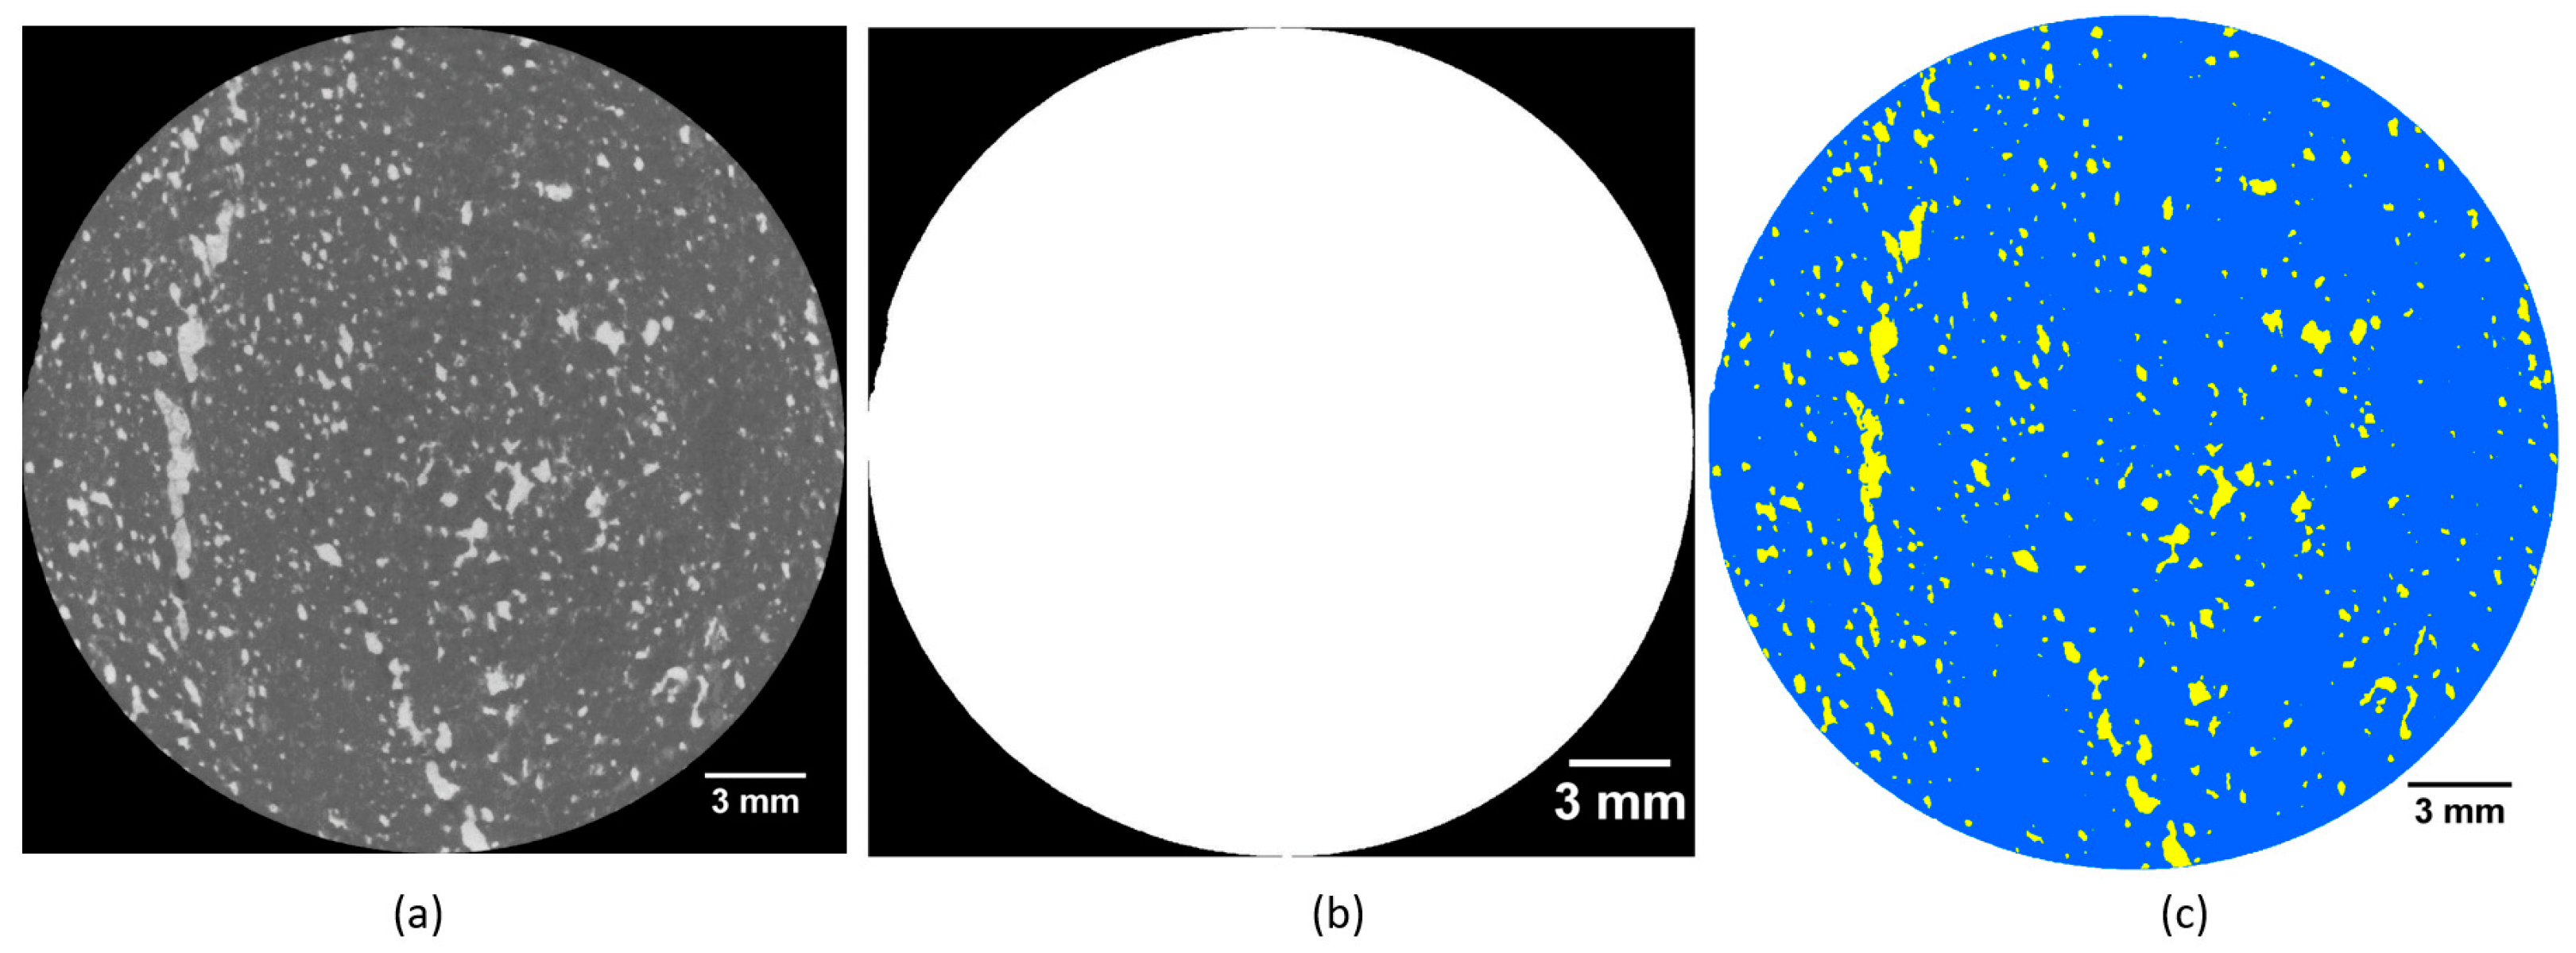
Otsu thresholding can also be extended to obtain multiple thresholds, so that more than two phases can be separated in the µCT volume [78,79]. An example of this is shown in Figure 5.
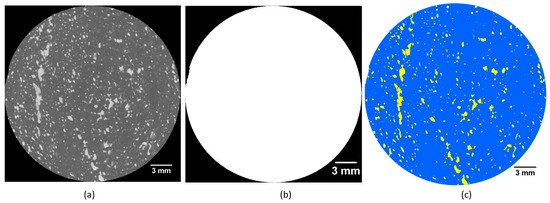
Figure 5.
Otsu thresholding, showing: (a) Original slice of drill core stack from µCT; (b) global thresholding with Otsu; and (c) multi-level thresholding with Otsu. It can be seen that directly using global thresholding will only intercept the drill core volumes from the background; multilevel thresholding is needed to extract the mineral grains from the drill core.
Another commonly used algorithm for determining a global threshold value is the maximum entropy algorithm [80]. This algorithm is mostly used in segmenting between the grains and mineral matrix [76,77]. In studies by Lin et al. [77], the Otsu algorithm was used to distinguish ore particles from the air, while the maximum entropy algorithm was used to identify the metal sulphide grains within the mineral matrix. The reasoning behind this was that the occurrences of metal sulphide in the matrix is minimum, so that the sulphide peaks could not be clearly identified in the histogram.
Local thresholding sets the value based on a local domain of voxels within a volume. This method is considered as a refinement of the global thresholding method based on local spatial information [7]. Deng et al. [26] applied an improved local thresholding algorithm that was capable of distinguishing between fractures and pores in rock matrix in a 3D µCT image. In his work, a fracture mask was initially created using connectivity operator in which local thresholding is performed within the mask. Based on local thresholding, a new fracture mask is obtained. This is repeated until the fracture mask volume is stabilized.
A gradient line computing the gradients of the image intensity intercepted by the line can be used also as a local domain where thresholds value should be based on. The threshold value is then based on the points where the calculated gradients are high, indicating the phase boundaries. Such a technique is referred to as gradient-based segmentation, and has been applied in mineral phase segmentation in µCT ore analysis [23]. Nevertheless, such a method would require the user to determine the locations of the lines to get them intercept as many phases as possible, thereby increasing the number of phases that can be segmented using the thresholds.
The eventual determination of a threshold value could also be done arbitrarily by the user. Arbitrary here means that the user visually estimates the threshold value. This could be done, for example, by visually determining the phase boundaries or taking the average grayscale values of the phases that have been visually determined by the user. Such a method has been implemented in porosity analysis, in which it was found that such method was in agreement with the experimental measurement [74]. The limitation of such a technique is that it is very subjective as the threshold determination depends very much on the user.
4.3. Region Growing
Another segmentation technique is the region growing method. The method is initialized by selecting a pixel, followed by the addition of the neighboring pixels to the initial pixel based on their similarity in grayscale values, thereby creating a region with similar grayscales. The process is repeated until all pixels can be categorized into a region. Grayscale intensities of the pixels are used as the similarity criteria [81,82] and, in other cases, gradients between neighboring pixels can also be used [23].
The region growing method is combined with edge detection in the widely used watershed segmentation. Watershed segmentation considers a grayscale image as a topographic surface, where the height of the surface is defined as the grayscale intensities of the image. The term “watershed” typically refers to a ridge that divides areas drained by different river system. This watershed line separates the catchment basins, which are typically the features that are segmented.
The common problem with watershed is the over segmentation, in which every regional minimum is transformed into its own basin, also segmenting features that are not of interest. Several researchers have developed a way to overcome this problem, including by introducing markers to the image [83,84], merging the regions [85], denoising and edge enhancement [86], as well as combining watershed segmentation with wavelet transformation [87] and the topological gradient approach [88].
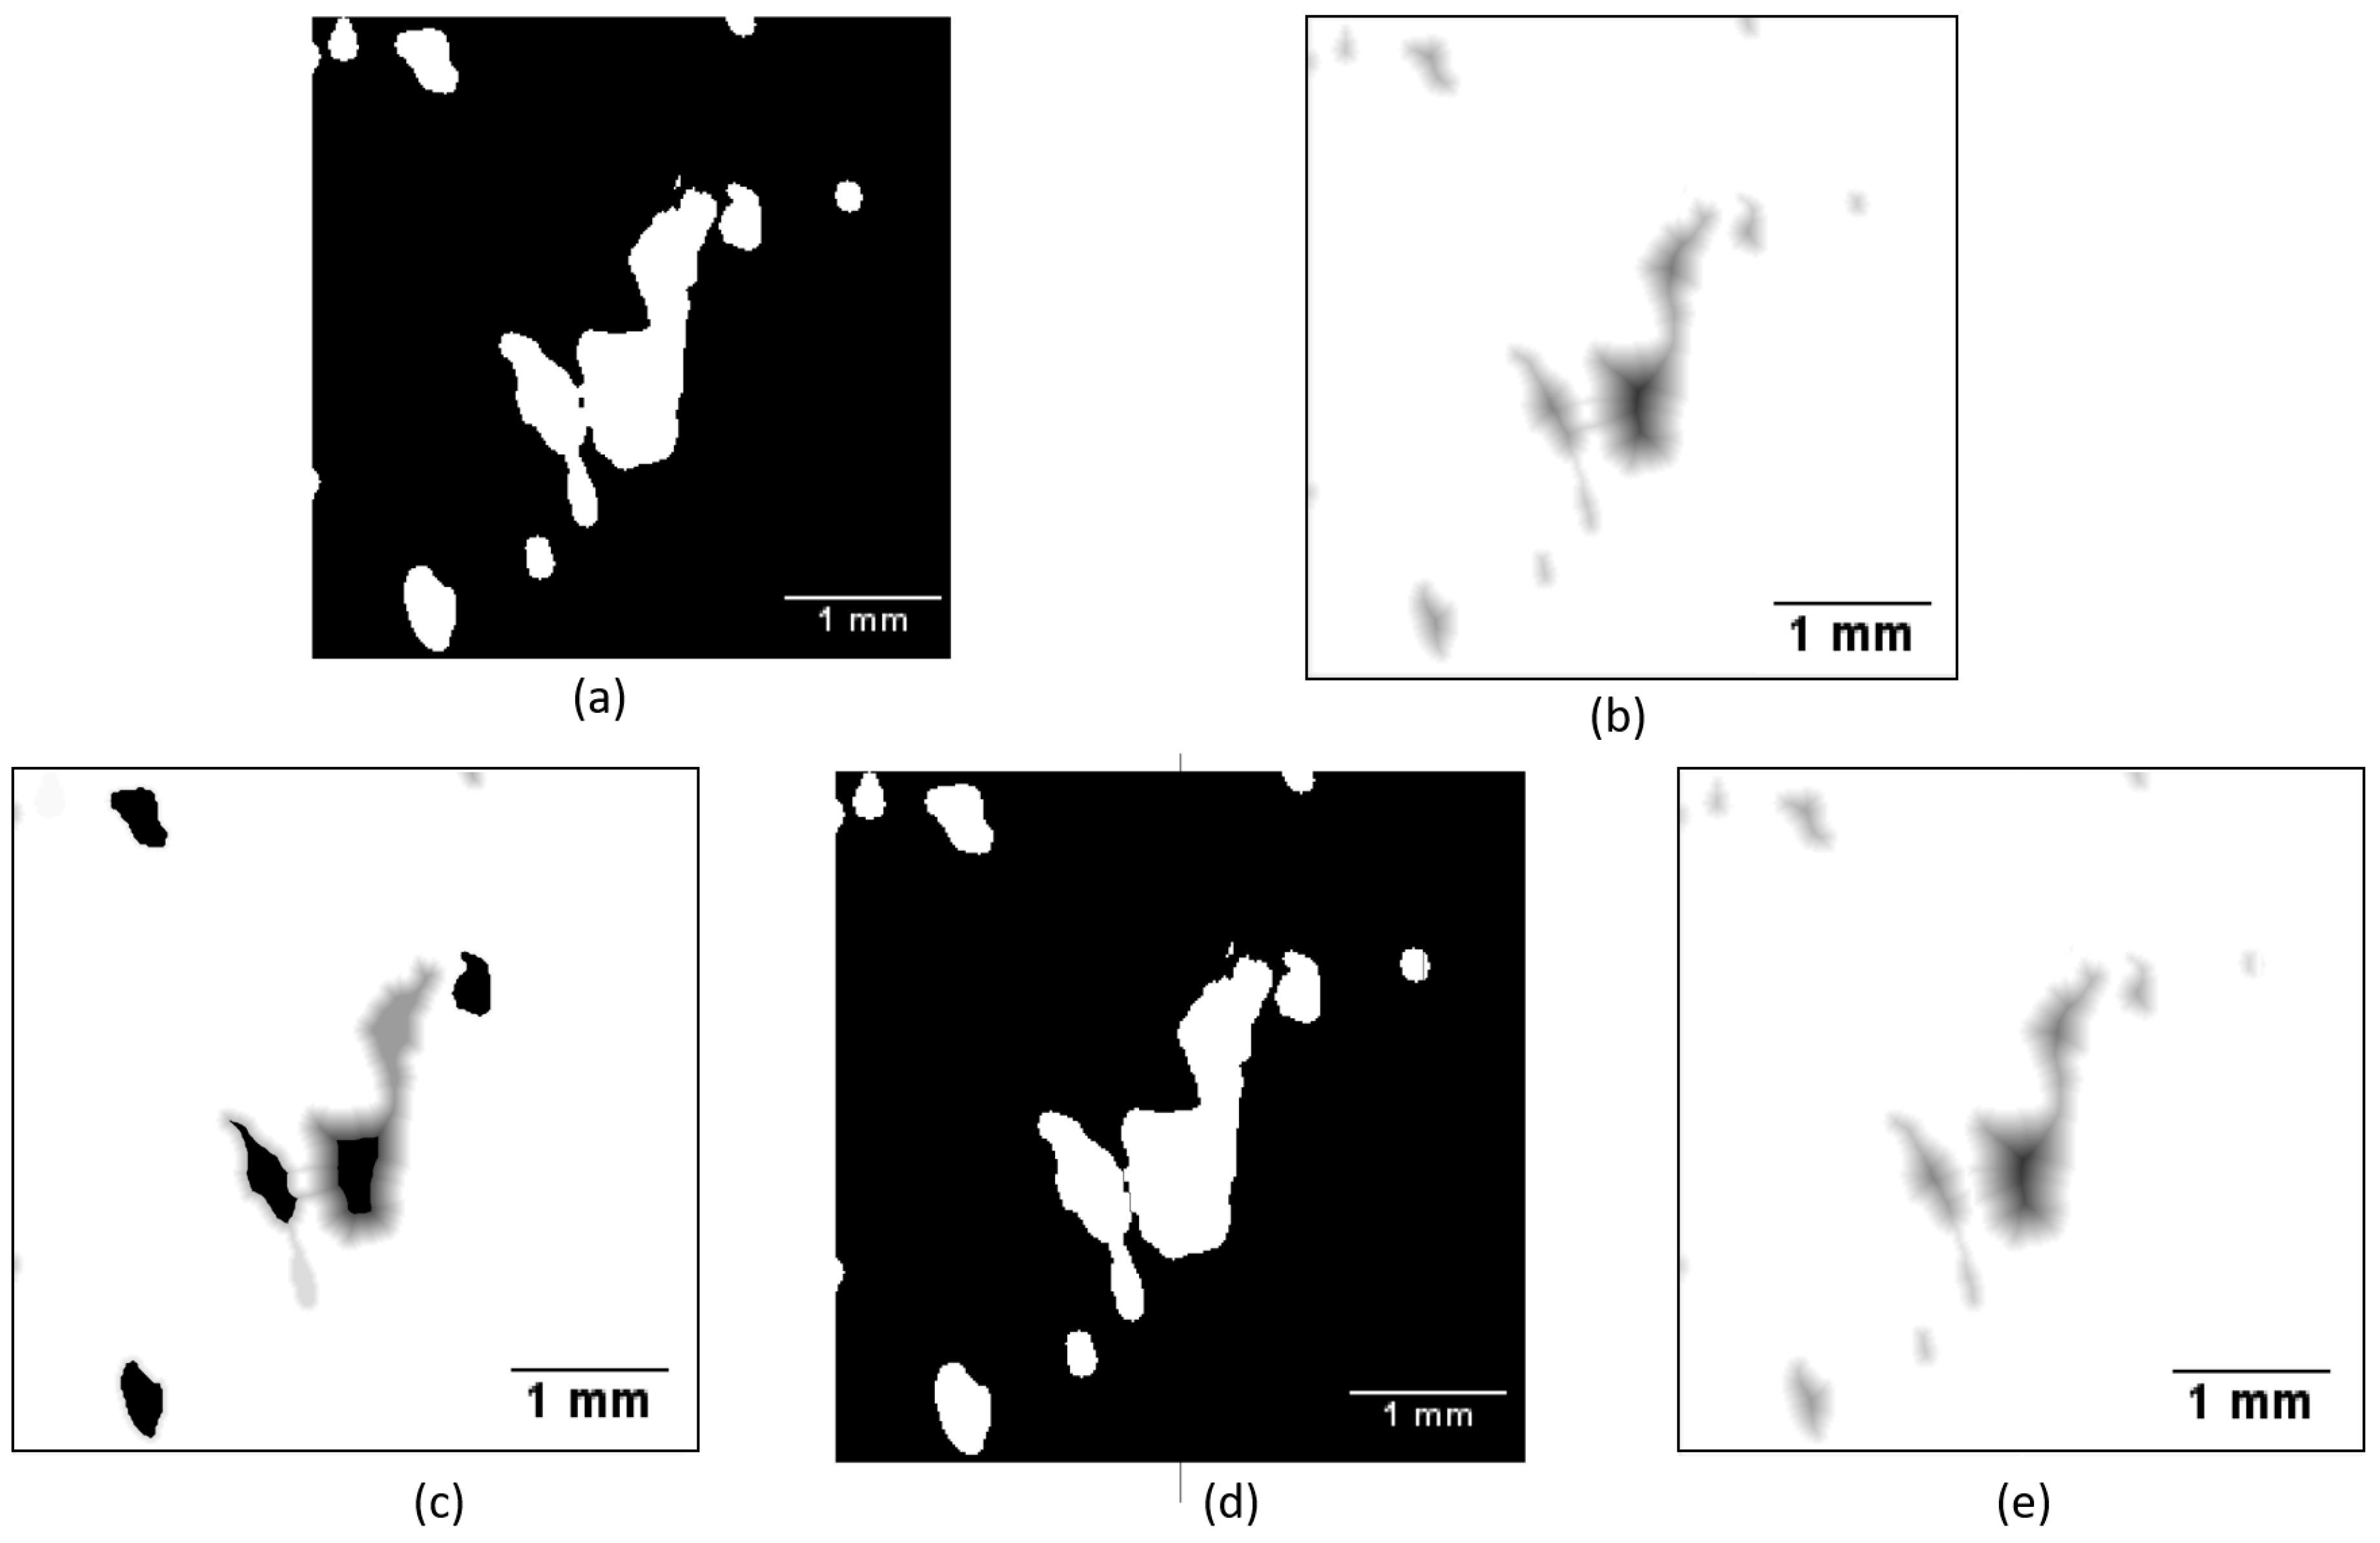
Marker-controlled watershed segmentation has been applied to 3D µCT images for several analyses by Miller et al. [22,89,90]. 3D watershed segmentation has been applied to different types of µCT image analysis, including coal washability analysis [89], air bubble sizes [90], as well as analysis of particle beds [22]. Wang et al. [22] identified that 3D watershed segmentation works best for mineral particles greater than the scale parameter (particle size/voxel size ratio of 30) and density lower than 4.0 g/cc. An example of marker-controlled watershed segmentation to separate touching grains is shown in Figure 6.
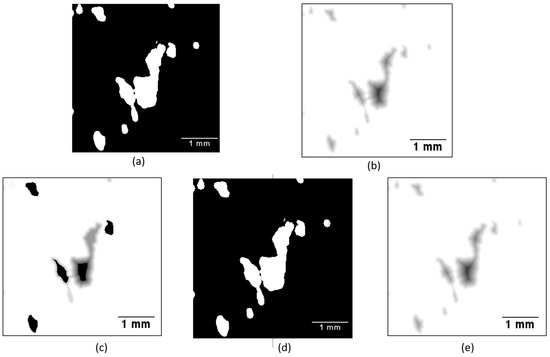
Figure 6.
Marker-controlled watershed segmentation process. (a) Binary image showing touching grains; (b) distance transformation of (a), showing two grains are connected with each other; (c) Markers are introduced by imposing a minima for each grain; (d) watershed segmentation of (c), showing a thin ridge is now formed between two grains; and (e) the distance transform of (d) showing the grains are no longer connected.
The markers introduced in Figure 6 were obtained by filtering out the minima that are less than a certain threshold value to avoid over-segmentation. Such a method has a clear drawback, if the grain sizes in the image are highly varied, it would be difficult to find a threshold value that could remove all unwanted minima without removing the minima of interest [91]. An alternative to such a technique is by taking into account the topography of the minima; instead of setting a threshold value on the minima, such a threshold value is set as a fraction of the zone around the minima [92]. The goal would then to find a fraction value (0 to 1) to set that zone fraction to be the same as the minima, i.e., to flatten down the basin zone to the level of its minima. The watershed transform would then consider the flattened basin to be part of the adjacent basin, therefore merging both basins to avoid over-segmentation. While such a procedure is less affected by grain size (basin depth), the procedure is still affected by the grain shape (basin topography), therefore making it unsuitable for highly elongated grains [91].
The major challenge with the previously described marker-controlled watershed segmentation is clear: it would be difficult to obtain a global threshold value that could balance between under-segmentation and over-segmentation. Kong and Fonseca [91] proposed an iterative technique based on information obtained at a local level. Initially the method used a similar method as in Figure 6, but then it is followed by iteratively performing watershed segmentation in each basin zone to identify potential new basins within the zone. This simply means that each segmentation is adapted according to the properties of each basin. The method has been demonstrated to be capable of segmenting grains with varying sizes and shapes.
4.4. Unsupervised Classification
Classification is defined as the partitioning of a set of elements into several clusters (or classes) based on their similarity [93]. In terms of image analysis, the sets of elements are the pixels in the image. Unsupervised classifications mean that the classification algorithm is automated by the computer, without any training or supervision from the users. However, users can have some degree of controls in this technique by specifying the number of classes, maximum iterations, as well as the endpoint of the classification (i.e., how much of the data that needs to be classified).
K-means clustering, is a clustering technique that segments the image in K numbers of clusters based on a certain criteria [94]. The K-means technique is one of the most commonly used technique in clustering of images, and it has been applied both in microscopic images [93,95], as well as 3D µCT images of rocks [25].
The K-means algorithm calculates the distance between pixel values and its nearest centroid of the cluster. This algorithm continues until the mean square root error of the distance reaches a minimum value, meaning that there are no more pixels that need to be assigned to the nearest clusters. The performance of K-means algorithm is very much affected by the initial selection of centroids as well as the selection of distance function. Poor selection of initial centroids will lead to the algorithm terminating without finding the global minimum of the objective function (after only finding a local minimum) [70]. Arthur and Vassilvitskii [96] have developed an algorithm that would improve the initial selection of centroids, by using a weighted probability distribution that is proportional to the distance between the newly selected centroid and the previous centroid. Their method is often referred to as K-means++. An example of a K-means segmented drill core volume, alongside with multi-level Otsu thresholding is shown in Figure 7.

Figure 7.
(a) Original drill core volume obtained from µCT; (b) multilevel Otsu thresholding, showing 10% of sulphide mineral grain content; and (c) K-means segmented image, showing 6.3% of sulphide mineral grains content. While the images look similar, there exists a relatively significant difference between the amount of grains segmented using both techniques.
K-means clustering has been applied in rock pore matrix analysis using µCT by Chauhan et al. (2016) [97]. Rock samples used were Andesite, Berea sandstone, as well as Rotliegend sandstone. In Chauhan’s work, the performance of K-means clustering was compared with other unsupervised algorithms, such as fuzzy-C means (FCM) and self-organized maps (SOM).
A fuzzy set is defined as a set of data with no distinctive boundary [72]. In contrast to K-means in which each pixel can only be a member of one cluster, a pixel in the FCM scheme can be a member of multiple clusters depending on the fuzzifier constant, in which it acts as a weighting factor in the calculation of the distance between pixels and their centroids. A larger constant would decrease the weight, leading to fuzzier classification. If the constant is decreased to its limit value of 1, the FCM scheme simplifies into K-means.
The performance evaluation of the classifier is based on the entropy and purity of the clusters. The entropy of a cluster defines how the pixel values are distributed within the K number of clusters—in other words how likely a pixel value is misplaced in another cluster. Meanwhile, purity refers to the frequency of the most common category in each cluster.
A clustering technique is good if the purity is high, while the entropy is low. In Chauhan’s study, the K-means clustering technique was found to outperform other unsupervised techniques in terms of both entropy and purity, as well as computational speed. Chauhan also found that the porosity value of the rock obtained from unsupervised classification corresponded well with the experimental values obtained from pycnometer measurements.
4.5. Supervised Classification
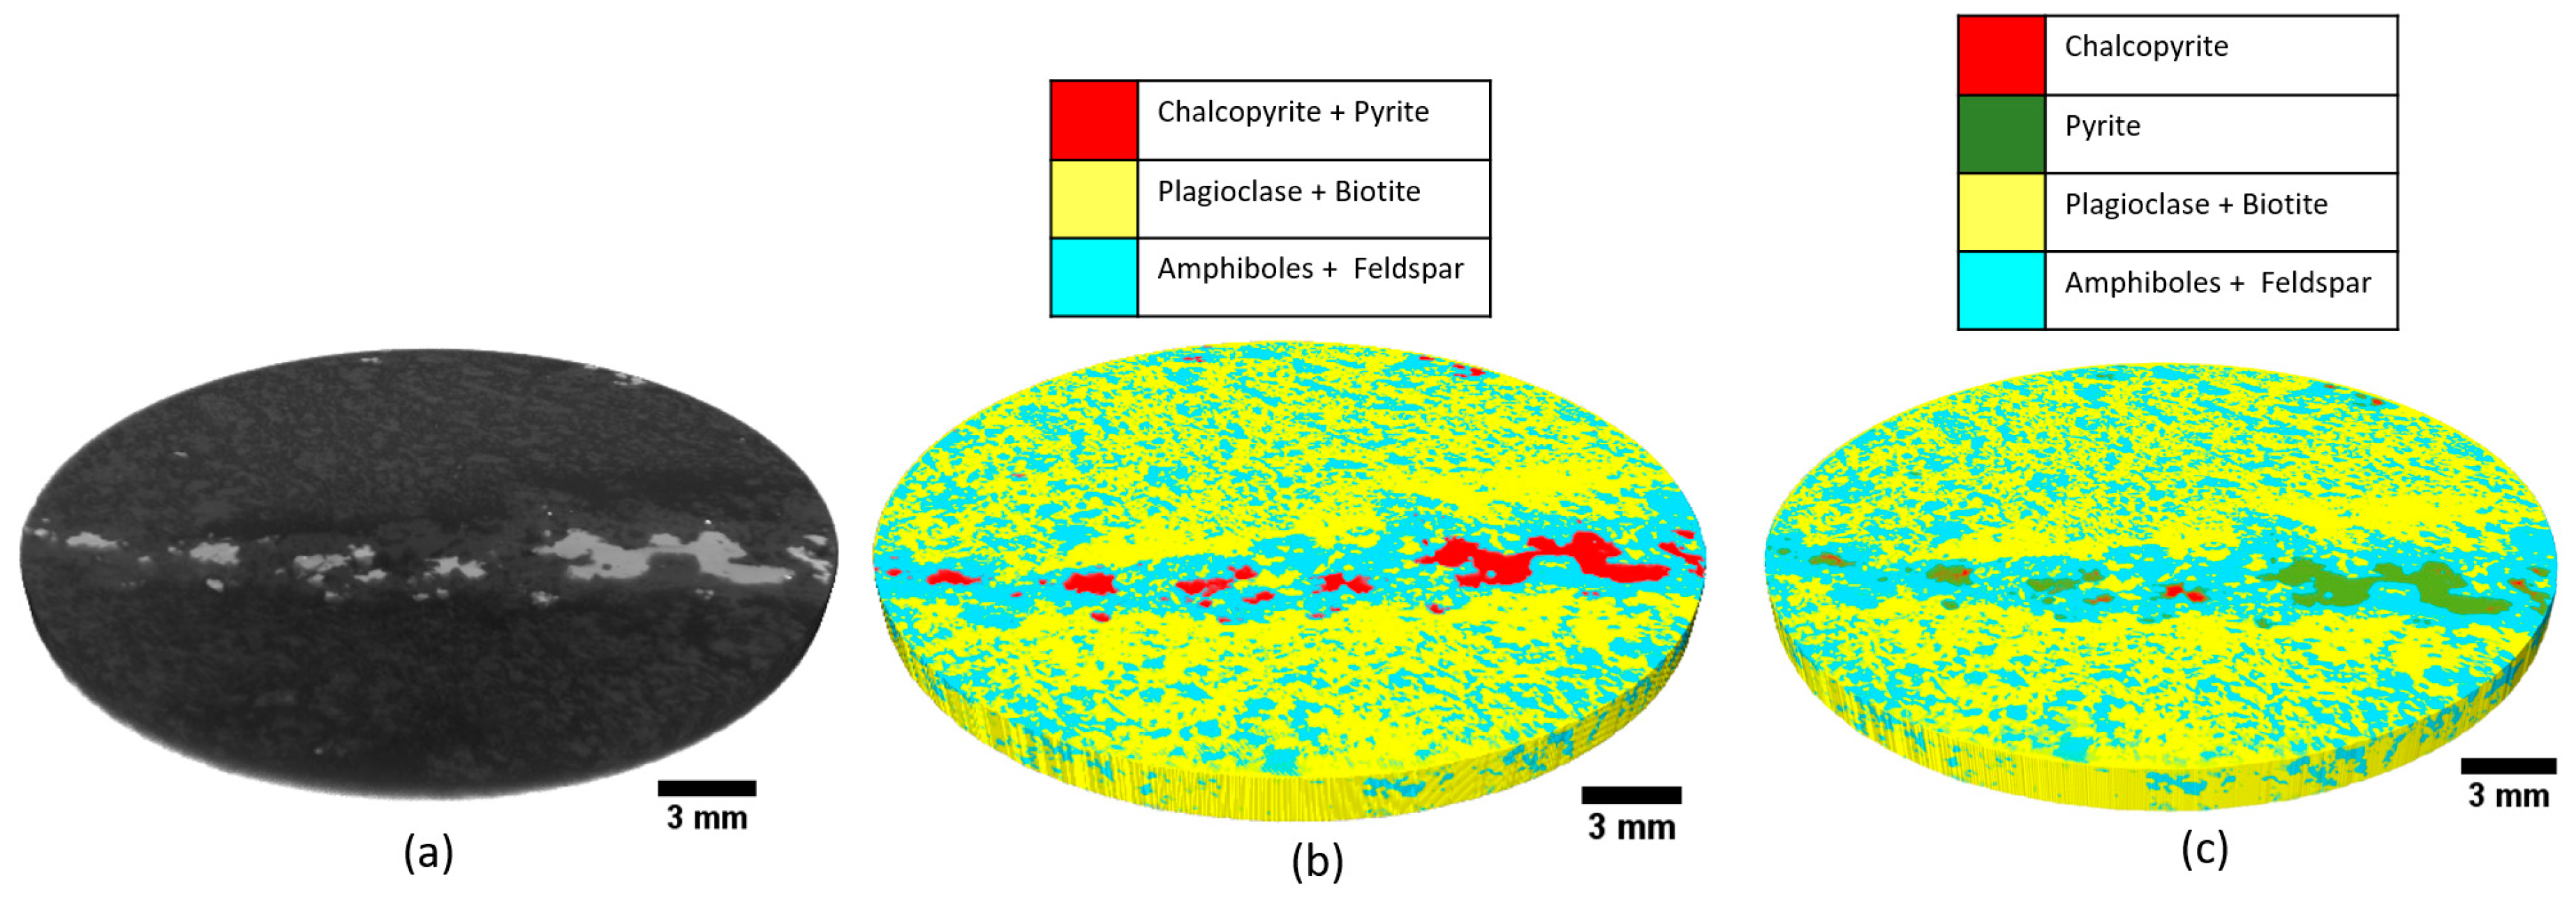
In a supervised classification technique, the user trains the computer to classify the image based on the training dataset. This can be done by selecting a sample of pixels and assigning them to a specific class, in which the computer will use this as a reference in classifying other images. Supervised classification has been used to some extent in rock µCT images [19,22,25,97]. Comparison of supervised and unsupervised classification is shown in Figure 8.
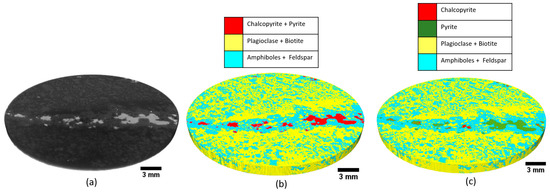
Figure 8.
(a) Original 3D data of the drill core; (b) unsupervised classification performed on the data; and (c) supervised classification performed on the data. In (b), both chalcopyrite and pyrite grains are regarded as one phase, i.e., unsupervised classification could not distinguish further between the phases. In (c) both phases could be segmented using supervised classification depending on how the user trains the classifier.
A classification tree is a supervised classification technique where the computer builds a decision tree with a binary test in each of the branches. This tree is grown until a certain point when no new information can be obtained from the training dataset. Random forest is then a technique where multiples of these classification trees are built based on different subsamples of the training data, allowing the building of classification trees based on different parts of the training data. Such a technique mainly aims to prevent overfitting of the trees to the training data; it ensures the generality of the classification tree. Random forest then classifies pixels by majority voting of the classification trees [98].
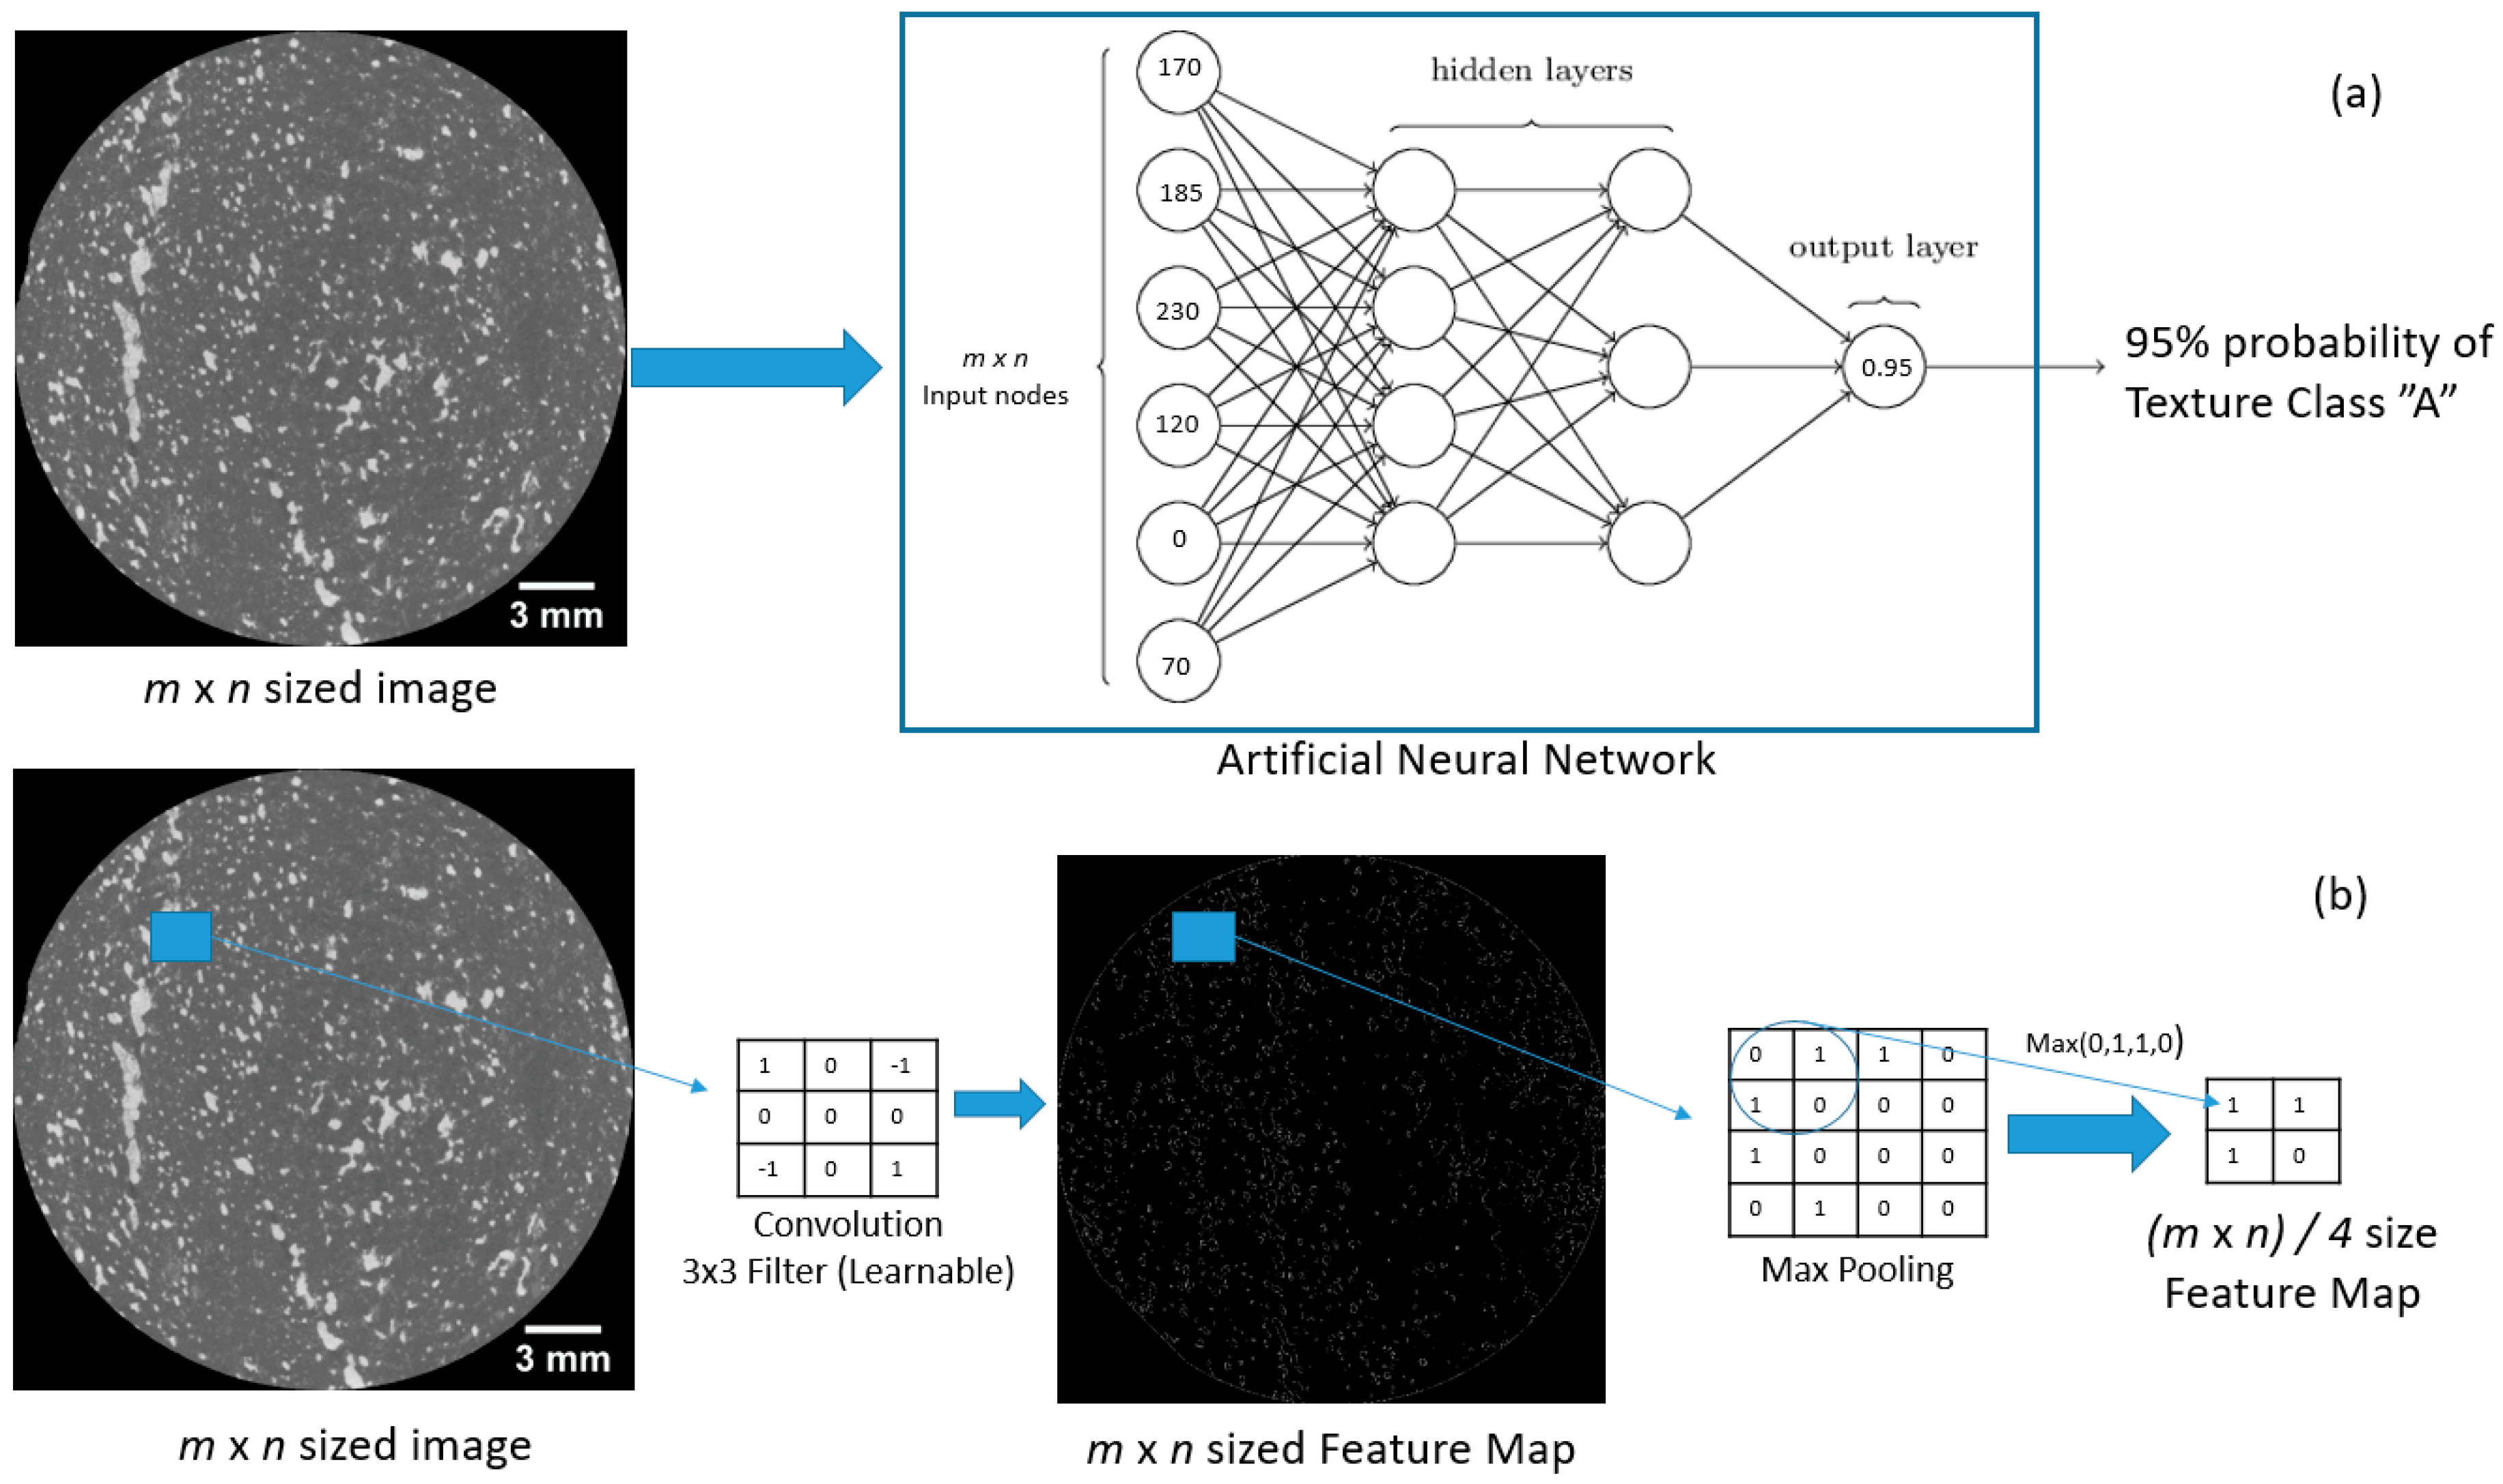
An artificial neural network (ANN) is simply a large number of simple and interconnected processors (neurons) working in parallel in a network [99]. The neurons simply calculate the probability of the image to be categorized as an object. This is done by assigning weights to the elements of the input image (the nodes) and summing those weighted elements, which then if the sum is higher than a certain threshold (or bias) it will be sent to the next layers. This is continued until the output layer, where it returns the probability of the input to be an object. During the training phase, the user inputs a training dataset for the network. The network then adjusts the weights of each nodes by computing the loss function which measures the difference between the true class of a pixel in the training set with the output value predicted by the network [100].
The main issues with ANNs are that they require a significantly larger amount nodes when larger images are fed and it is not translation-invariant (meaning that it depends on the orientation of the original training data). Convolutional neural networks (CNNs) are an alternative where the full-size image is convoluted first using several different filters to produce feature maps. The strength of a CNN is that, instead of using pre-defined filters, these filters could also be trained according to the user needs. In most cases the feature maps are then downsampled (pooling) so that the only the most important information of the feature maps is preserved and fed to the network. These sets of convolution and pooling can be repeated several times until small enough feature maps can be inputted to the network. There exist several convolutional neural network architectures that have been developed and trained, and can perform various image recognition tasks [101,102,103]. An illustration of a neural network and a convolutional neural network is shown in Figure 9.
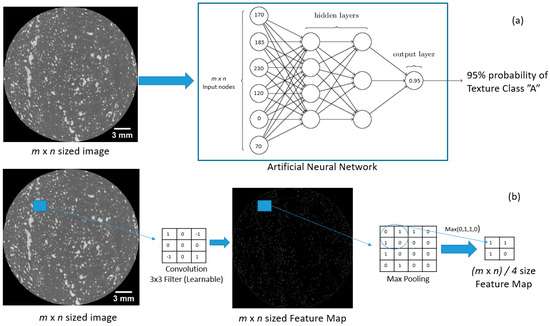
Figure 9.
(a) ANN applied on a µCT drill core slice images; (b) CNN applied on a µCT drill core slice images. In an ANN each pixel in the image is inputted directly, creating an m × n amount of input nodes, which is very large for typical µCT slice images. In a CNN the image is convoluted first with filters to produce feature maps. These filters can be more than one and are learnable during the training phase. The feature map is then pooled, for example by taking maximum values in a 2 × 2 neighborhood, so it is downsized by the factor of four. This scheme represents the neural network application in image recognition (recognizing the texture class of a drill core slice) while, for phase segmentation, the input can be changed to the mask image of each phase.
A support vector machine (SVM) [104] is a supervised classification technique that projects the training dataset to a feature space of higher dimension using a kernel function, so that the dataset can be segmented using a linear classifier [105]. The linear classifier is set so that it leaves the largest possible fraction of points of the same class in the same side while maximizing the distance between the different classes from the linear classifier [106].
The use of supervised classification in µCT data analysis has been limited, especially in ore mineral cases. Chauhan et al. [25,97] extensively explored different supervised classification techniques, such as ANN and least square–SVM in segmenting between rock matrix, minerals, and pores in an µCT image of Andesite rock sample. Cortina-Januchs et al. [107] used an ANN to classify pores in a µCT images of soil. Tiu [19] utilized a random forest classifier in the Trainable Weka Segmentation (TWS) tool [108] to classify mineral phases in a µCT image of a Cu-Au drill core samples. A random forest classifier is also used by Wang et al. [22], as the marker-controlled watershed segmentation did not perform well for fine and low density particles.
From Chauhan’s study, it was concluded that both ANN and LS–SVM classification techniques yielded a porosity analysis which is in a good agreement with experimental pycnometer measurements (relative differences of less than 1%). Furthermore, it was also concluded that LS–SVM is superior compared to ANN due to its capability in identifying generalized patterns. However, this is compromised by its extensive computational requirements, where LS–SVM took 10 times longer to process the same µCT dataset compared to the ANN.
Tiu [19] attempted to classify mineral phases in a µCT drill core image using a random forest classifier with different feature extraction algorithms (i.e., the convolution steps similar to CNN). Using a SEM-EDS mineral map as the training dataset, Tiu validated the resulting classification with the same 2D µCT slice that was analyzed by SEM-EDS. The differences between the mineral map obtained by SEM-EDS and the supervised classification was minimal, in which it underestimates chalcopyrite content by 0.2% and overestimates pyrite content by 0.2%. It was further added that the performance of such supervised classification techniques is heavily dependent on the training dataset, so care must be taken when applying such classifiers to an inherently different dataset.
In relation to the 3D watershed segmentation by Wang et al. [22], supervised classification was performed to overcome the limitations of the current watershed algorithm. Instead of using thresholding for extracting the particles from the background, a trainable feature based classification was employed using the TWS tool [108] which is based on a random forest classifier. It was found that around a 10–15% decrease in calculation error was obtained when the supervised classification was used instead of thresholding in the watershed segmentation.
5. Feature Extraction
The resulting data from segmentation is most often in the form of a labeled image, in which each label represents a segmented phase. These phases would have some features that a machine vision can extract. The process of feature extraction reduces the dataset into features of interest. Hence, such a process could also be called dimensionality reduction [109]. With a smaller dataset, the computational expense of the subsequent data processing can be reduced.
These features in terms of mineral characterization are often related to the textures of the ore minerals. Texture in terms of ore geology is referred as the relative size, shape, and spatial interrelationship between grains and internal features of grains in a rock. Size, shape, and orientation of the grains in minerals are referred as structural texture, while the spatial relation between the grains (pattern) are referred as stationary textures [110].
The concept of structural textures is quite easily understandable; by having grain shape, size, and orientation information of an ore, one could distinguish different types of ore texture. With the use of µCT, more accurate 3D information on these textures can be obtained as well as quantified through a variation of data analysis methods. On the other hand, stationary textures are often described qualitatively using experiences and textural archetypes. Recent developments are leaning towards the use of computer vision and image analysis techniques to quantitatively extract stationary textures of rocks [110,111,112,113]. Extending these techniques into 3D data would open up a new depth of information in describing texture of ore minerals.
5.1. Distance Transformation
Distance transform simply transforms a binary image into a function of the distance of each pixel to the nearest non-feature pixels (the zero-valued pixels in the binary image) [114]. Such transform function has been demonstrated to be extendable to 3D [115]. Distance transform has found many applications in relation to ore characterization with µCT, most notably in analyzing structures of pores, grains, and particles [22,116,117,118,119].
One application of distance transform in segmentation of touching particles and grains [22,118,119] has already been shown in Figure 6. With the information of the distance of each voxel to the background, one could estimate the center of each grain by taking the voxels with maximum distance value. Inverting the distance map would produce a minima at the center of the grains, which can then be used as a basis for specifying a marker for the watershed segmentation.
Distance transform is also important in evaluating surface exposure of mineral grains in a particle, which has been applied in µCT analysis of leaching experiments [117,119]. Mineral voxels that have low distance value (closer to surface) would be leached faster, i.e., the leaching kinetics and recovery is dependent on the position of the minerals relative to the surface. Throughout the leaching period, the number of mineral voxels would be decreased gradually due to dissolution, and this decrease could be used to evaluate the leaching recovery. Coupled with distance transformation, the dependency of leaching recovery to the mineral’s distance from the particle surface can be evaluated.
The shape and structure of a feature could also be evaluated with distance transformation. The skeleton of a feature could be defined as the ridges (local extrema) in a distance function. The skeleton is particularly useful when analyzing pore space and connectivity in a sample, which can be used to evaluate the permeability of the sample [6,120]. Evaluating the maximum inscribed sphere along these skeleton voxels allows comparison of surface topology between the feature and a sphere, giving an idea on the bluntness of the feature [116].
5.2. Mathematical Morphology
Mathematical morphology [121,122] is one of the tools that analyze the spatial structure of voxels in a 3D dataset. This technique usually takes binary image as an input, in which the structure of the volume of interest is analyzed. Morphological image analysis makes uses of a structuring element to extract morphological features of the image, in which the structuring elements are operated on the entire volume. Morphological image analysis has been used in various applications for µCT volumes, especially in quantifying size and structures of pores, grains, and particles in a sample [19,123,124,125,126].
The shape of the structuring elements defines what kind of features can be extracted from the volume. Furthermore, by manipulating the size of the structuring elements, the size function of the features could also be extracted. Morphological opening is an operation that removes any of the elements in the image that are smaller than the size of the structuring element. Morphological opening is then analogous to sieve analysis performed for powder samples, where particles smaller than the sieve are passed through the sieve. Sieves of increasing size are stacked vertically to get the size distribution. This is done in morphological image opening where the structuring element size is incrementally increased, which is often termed as granulometry by opening [121,122], compare Figure 10. This operation has been implemented in various µCT 3D volumes, including cellulosic fibrous network [124,125], as well as in ore samples [19,120].

Figure 10.
Granulometry by opening. A structuring element/sieve is operated on the stack of binary images, in which here represents the mineral grains in the ore sample. After operation, the grains smaller than the sieve are removed. The sieve size is then increased, and the distribution of the grains based on their sieve passing size is plotted. The structuring element in here is a stack of 2D structuring elements, mimicking a 3D structuring element.
Limitations do exist in granulometry, as it is highly dependent on the shape and size of the structuring elements and on how the features can be interpreted. Lux et al. [125] argued that in a fibrous network, the pore size distribution using granulometry does not correspond to actual respiratory pore sizes, but rather as a minimum distance between the fibers. Tiu [19] stated that the grains in the measurements are more defined as a set of voxels containing similar gray values as defined by the previous segmentation, so it is also highly dependent on how it was segmented previously. The shape of the structuring elements also defines the computational costs; spherical structuring element (which often describes grain and pore quite well), is quite computationally extensive as by increasing its radius, the voxels processed increased to the power of three of the incremental radius [123]. This for example can be overcome by using a 32-faced polyhedron, which could reasonably estimate the shape of a sphere [123].
Several other different tools exist in mathematical morphology. These tools allow textural extraction from the 3D dataset including:
- Local orientation of textures. This is achieved by opening of the image using a line structuring element and rotating the structuring element to get directional information of the image. Such information is useful to obtain information about the isotropy of textures. It has been used in analyzing 3D datasets of fibrous networks [125].
- Global orientation of textures. While the combination of local orientations could give a good estimation on the global orientation, methods for directly determining global orientation also exist. The mean intercept length (MIL) is the most popular method to obtain this information. It generates several parallel lines in a certain direction in which the number of intercepts of the lines with the textures can be used for estimating the orientation. Such a method has been used in analyzing orientation of pores and vesicles in CT images of volcanic rocks [10].
- Skeleton of the textures. In addition to using the distance transform, the skeleton of the texture could also be obtained by eroding the features up to a certain point where its homotopy is still preserved. Such a technique is often referred to as morphological thinning.
- Shape descriptors of textures through Minkowski functionals. The Minkowski functionals are geometric measures applied to binary structures, in which for n dimensional plane, n + 1 of such functional exists. Such functionals have been applied in 3D pore analysis of soil structure [126]. These functionals are:The zeroth functional, Equation (5), calculates the mass of the object:The first functional, Equation (6), is the integral over the surface of the unit. This is simply the total surface area of the object (units: length2):The second functional, Equation (7), is the mean curvature (units: length−1) of the surface area obtained from the previous functional. Both and define the minimum and maximum radius of the curvature:The third functional, Equation (8), is the total curvature, which can be used to measure the topological properties of the object (convex, concave, or saddle).
5.3. Computational Geometry
One of the key features of µCT is that it can extract the three-dimensional representation of the samples, i.e., it is not subject to stereological error as in 2D-based image analysis. This permits more accurate geometrical representations of the sample, which then can be further exploited in order to extract shape representations (sphericity, surface area, aspect ratio, etc.) of the sample. Computational geometry is a systematic study of algorithms and data structures for geometric objects [127], allowing users to extract features using the geometrical properties of the object.
The shapes of ore particles and grains are often irregular, i.e., a method is needed to approximate the shape of such objects using geometrical objects. One of the geometrical objects that can be used to approximate particles are a set of polygons. This can be achieved using the three major concepts in computational geometry: convex hull, Voronoi diagram, and Delaunay triangulation. Formal definitions of these concepts are available elsewhere [127], but essentially all of these concepts make uses of convex polygons in order to represent an object, i.e., the object is tessellated into a set of convex polygons so that the properties of the object can be approximated from the properties of the polygons. One of the properties that can be obtained is the surface area of the object, which is useful to deduce the sphericity of the object.
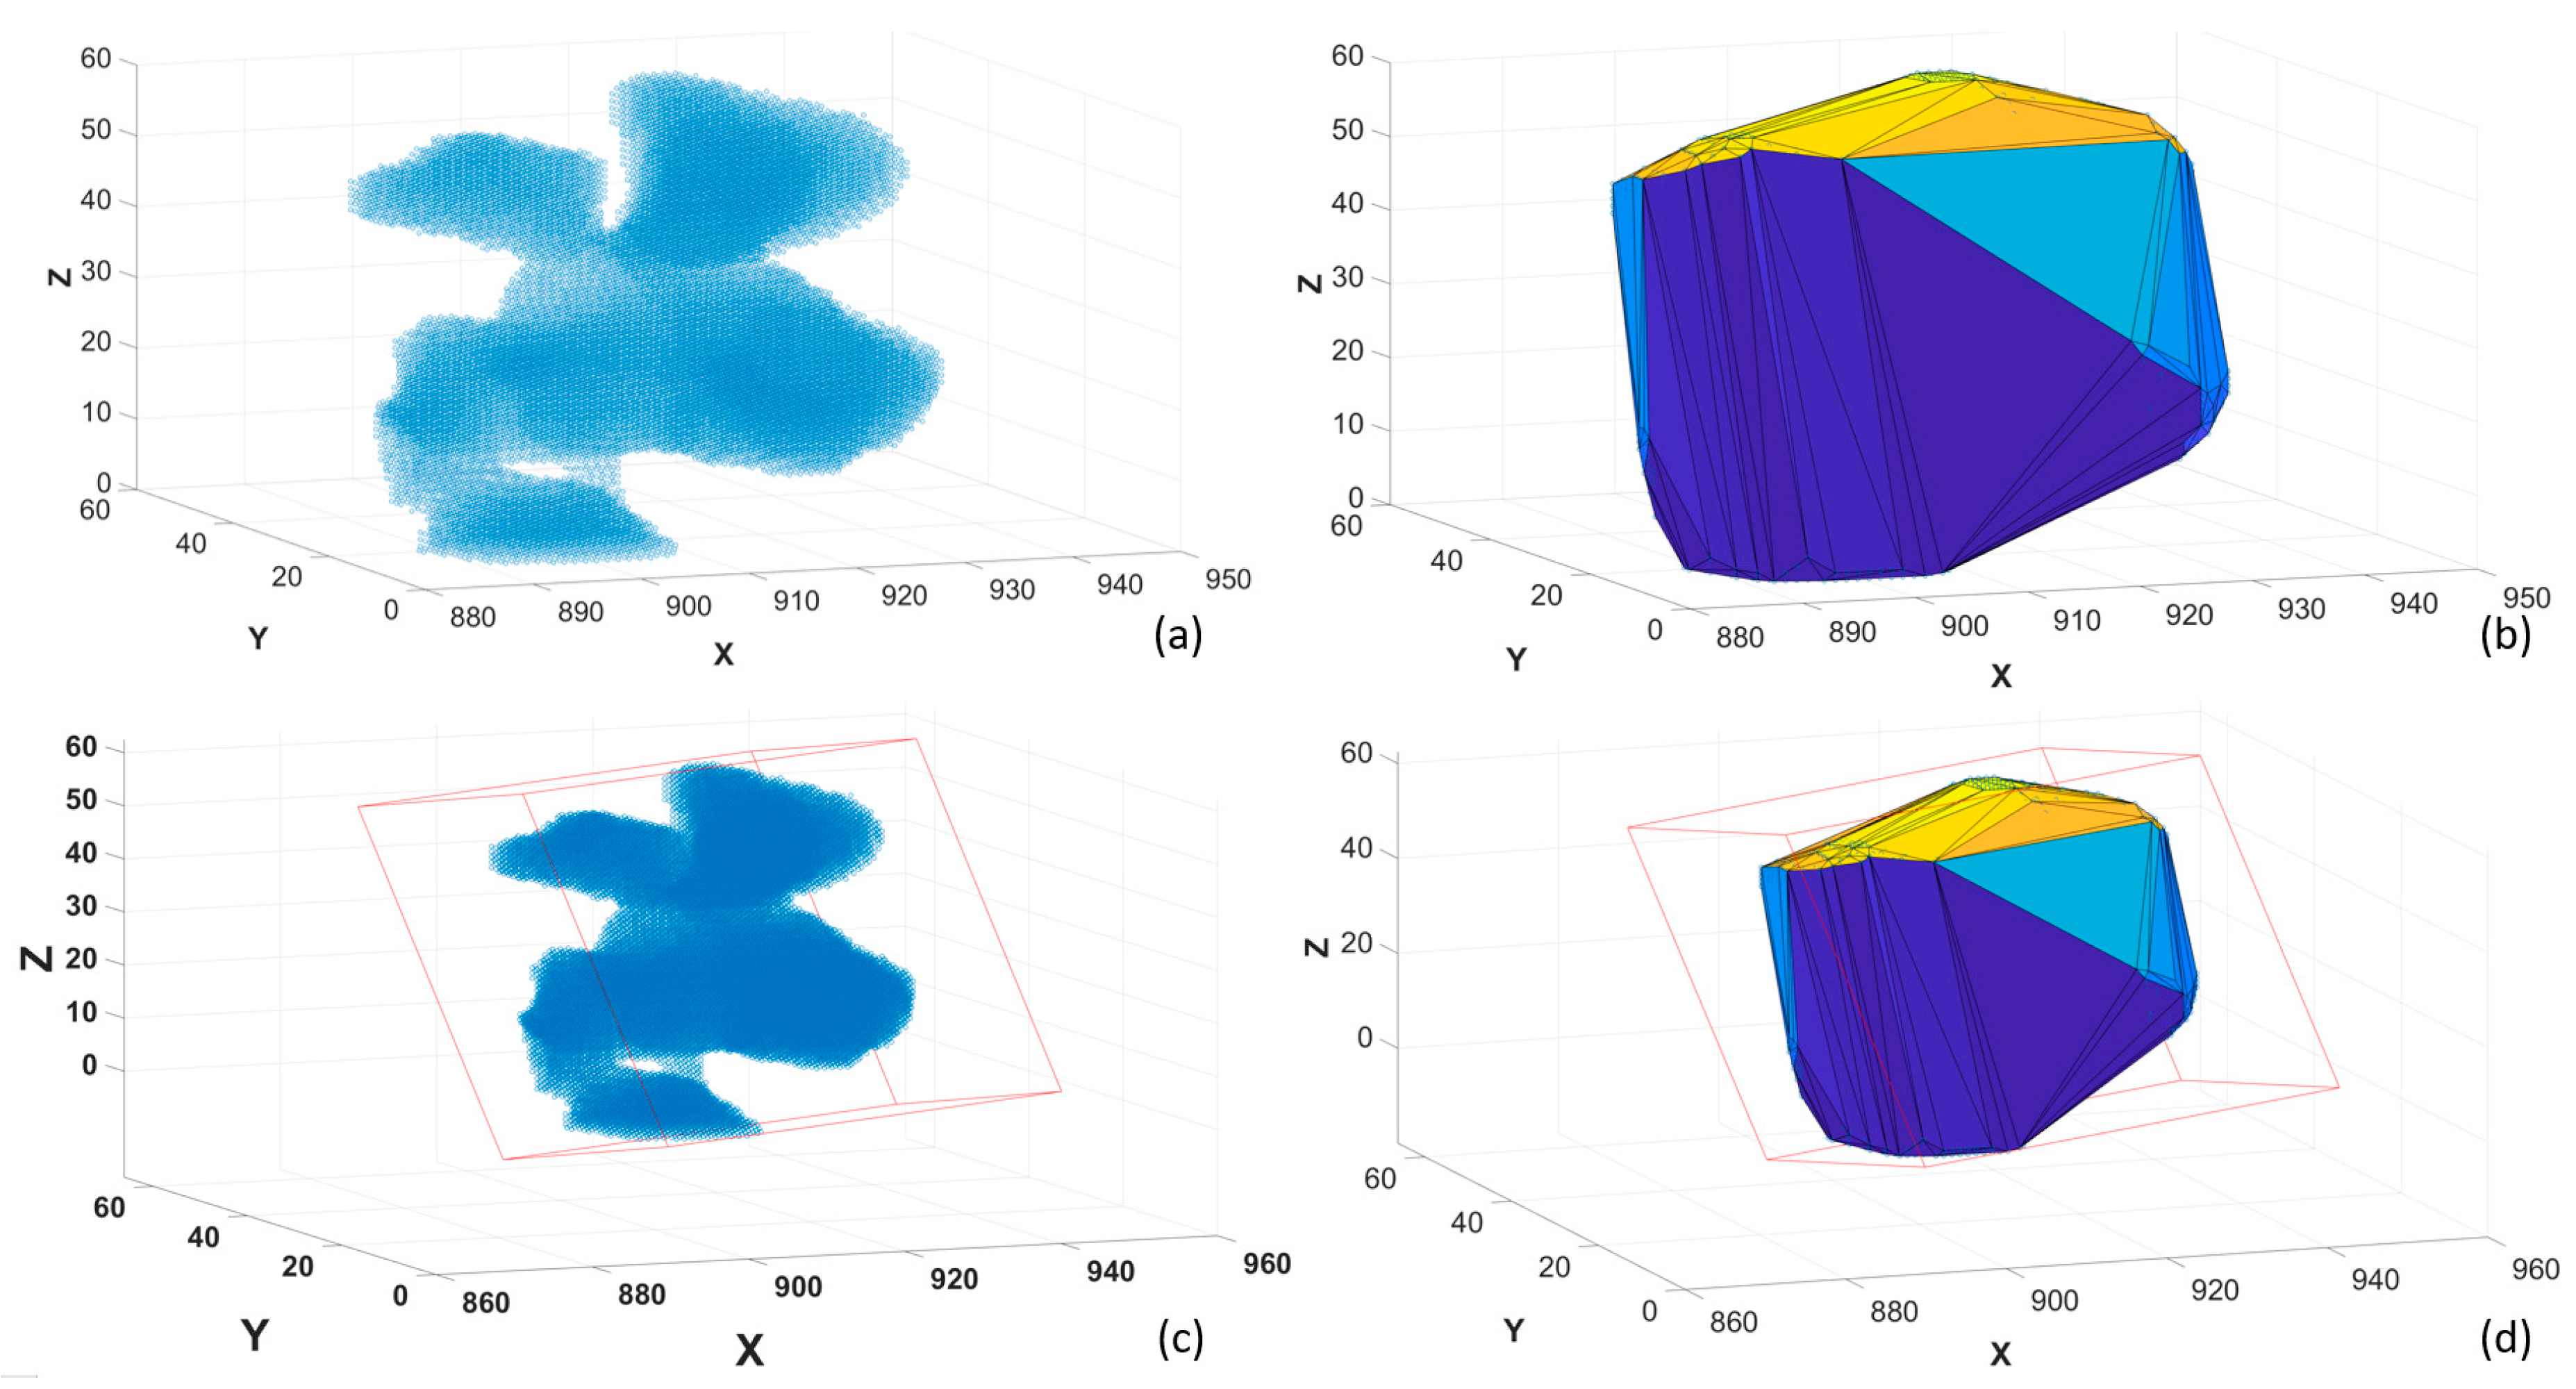
Another way is to create a geometrical object that would bound all parts of the irregular shape inside it. This bounding object can be minimized so that it could better represent the sample. In computational geometry this is termed the minimum bounding object problem, and the bounding object can be a sphere or a box. The properties of the bounding object can describe features of the shape bounded by it. Furthermore, many of shape descriptors can be calculated if the major, minor, and intermediate dimensions of the object is known, e.g., the aspect ratio, elongation index, and flatness index [118]. This is illustrated in Figure 11.
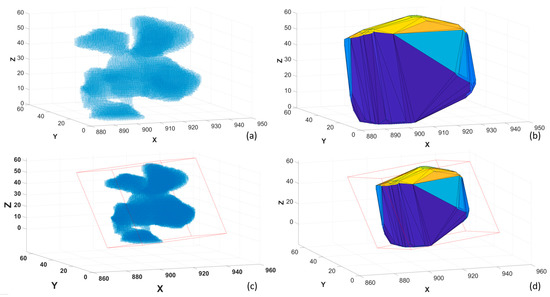
Figure 11.
Using geometry to extract shape features of a particle. (a) Scatter plots representing the particle; (b) convex hull of the particle; (c) minimum volume bounding box of the particle, which is the same as the bounding box for the convex hull (d). From the convex hull, convex surface area and solidity (ratio of convex volume and actual volume of a particle) can be obtained, while from the bounding box, major, intermediate, and minor dimensions of the particle can be obtained.
Computational geometry has been applied mainly in extracting shape parameters of a 3D volume obtained from µCT. Vecchio et al. [128] described the applications of bounding box in describing different types of particle shape, and the errors associated with it. Zhao et al. [118] investigated shape descriptors of a particle before and after fracture using convex hull of that particle, particularly its solidity. Pamukcu et al. [129] have used convex hulls to analyze glass inclusions in an igneous rock, in which it was stated such a method cannot properly describe non-convex inclusions. This limitation for non-convex particles is even illustrated in Figure 11, where the particle shown is non-convex, and the convex hull of the particle differs significantly from the original particle. In general, this is the main limitation of computational geometry; errors always arise when regular objects (polygons) are used to estimate an irregular object (rock particles, grains).
In addition to polygons, spheres have also been used in approximating size and shape. The maximum inscribed sphere has been used by Van Dalen et al. [130] to measure the local thickness of a particle. By inscribing a sphere in each point of a particle, the thickness of that point can be obtained by the diameter of the maximum inscribed sphere at that point. The maximum inscribed sphere applied in a 3D distance transform map has been used to generate a new shape descriptor for particles called the bluntness index [116]. The index was able to distinguish blunt particles (spheroid) and sharp particles (cuboid) at a resolution as low as 5000 voxels per particle. Other uses of spheres includes maximum equivalent sphere diameter in describing melt inclusion sizes in garnets [131] as well as evaluating platinum and precious metal grains in various types of Cu-sulphide texture [132].
5.4. Domain Transfer Function
As mentioned earlier, besides structural textures, stationary textures and patterns of the grains in the ore are also of interest. Stationary textures can be evaluated directly as the spatial relationship of the grayscale values of the voxels in the image, meaning that it does not require segmentation or classification of the mineral phases beforehand. On the other hand, such textures can also be evaluated as the spatial distribution of the mineral grains, which then would require segmentation between the mineral grains and the rock matrix prior to obtaining such distribution.
The spatial pattern of the phases can often be readily detectable by looking the image in another way, i.e., by transforming the image from spatial domain to frequency domain. Moreover, some mathematical operations are simpler in another domain, making the operation computationally less consumptive. This is the basic concept behind the Fourier series, in which it describes a function in a frequency domain through summation of simple sine waves. The Fourier series are especially well suited in analyzing the periodical nature of an image.
The Fourier method measures an object through a profile function, describing its radius in different angles from 0° to 360°, as shown in Equation (9), in which and are the Fourier coefficients:
The value of n represents the number of harmonics, and different values describe different properties (signatures) of the object, namely form/shape (n ≤ 4), angularity (5 ≤ n ≤ 25), and texture (26 ≤ n ≤ 180) [133]. In other words, two objects with similar shape will have the similar Fourier series at lower frequency harmonics (n ≤ 4), but at higher frequency (26 ≤ n ≤ 180), their Fourier series are not necessarily similar; they depend on the surface textures of the objects [134]. In a three-dimensional plane, the spherical harmonic series is used instead, which is analogous to the Fourier series in 2D case [135]. Spherical harmonics has found its application in three-dimensional µCT analysis of shape and surface textures of aggregate particles [134,135,136,137].
Wavelet transform has a concept similar to Fourier, differing that the function still retains some of its spatial information while having also some new information about its frequency. There are several different wavelet families, with each of them having its own functional properties [138]. Wavelets, especially the discrete wavelet transform, has find its application in image processing, especially in image compression [139] and removing noise [140,141]. A discrete function of can be represented as a weighted summation of wavelet function (mother wavelet) as well as the scaling function (father wavelet), displayed in Equation (10):
Wavelets have been used extensively in describing rock textures in 2D images [110,142,143,144], yet their use in 3D textural analysis is almost non-existent. In 3D µCT analysis, wavelets have also been used as an alternative for edge detection operators in measuring crack growth in rock CT volumes [67]. Similarly, Katunin et al. [145] used 3D wavelet transform to identify and classify different types of defects in composite structures.
The frequency information in an ore sample that is obtained by wavelet and Fourier analysis can offer a new type of information that could be useful in analyzing stationary textures, as it gives information on the spatial relationship of the phases in an ore, i.e., on how the phases are distributed over the space of the ore. Such information would be of utmost benefit when having 3D µCT data readily available.
5.5. Spatial Statistics and Co-Occurrence Matrices
Some textures have similar patterns that are observable across the whole volume. This makes the texture simpler to detect as it will have similar statistics across the volume. These kinds of textures can be addressed with spatial statistics as well as co-occurrence matrices. Local binary pattern, or LBP [146], is one of the algorithms that evaluates the variability of the image spatially by using kernel operators. In this algorithm, a 3 × 3 convolution kernel is operated on the image. The kernel performs comparison of each pixel with its 8-neighborhoods, and label them accordingly. If the center pixel is greater than its neighbors, it will be assigned label 1, otherwise 0. Afterwards, there will be a total of 28 possible combinations of the output, and the histogram of this output is plotted to obtain a textural descriptor. Despite its well-known application in describing textural features, LBP has mostly been used for medical CT images [147,148], and only recently it has been applied by Rahimov et al. for classifying different textures of CT image of carbonate rocks [149]. Rahimov’s work considered textural classes based on the spatial correlation between the pores of different sizes and the solid phases. A similar method could potentially be applied in classifying textures based on spatial relationship between mineral phases in the sample, which is more relevant in terms of mineral characterization.
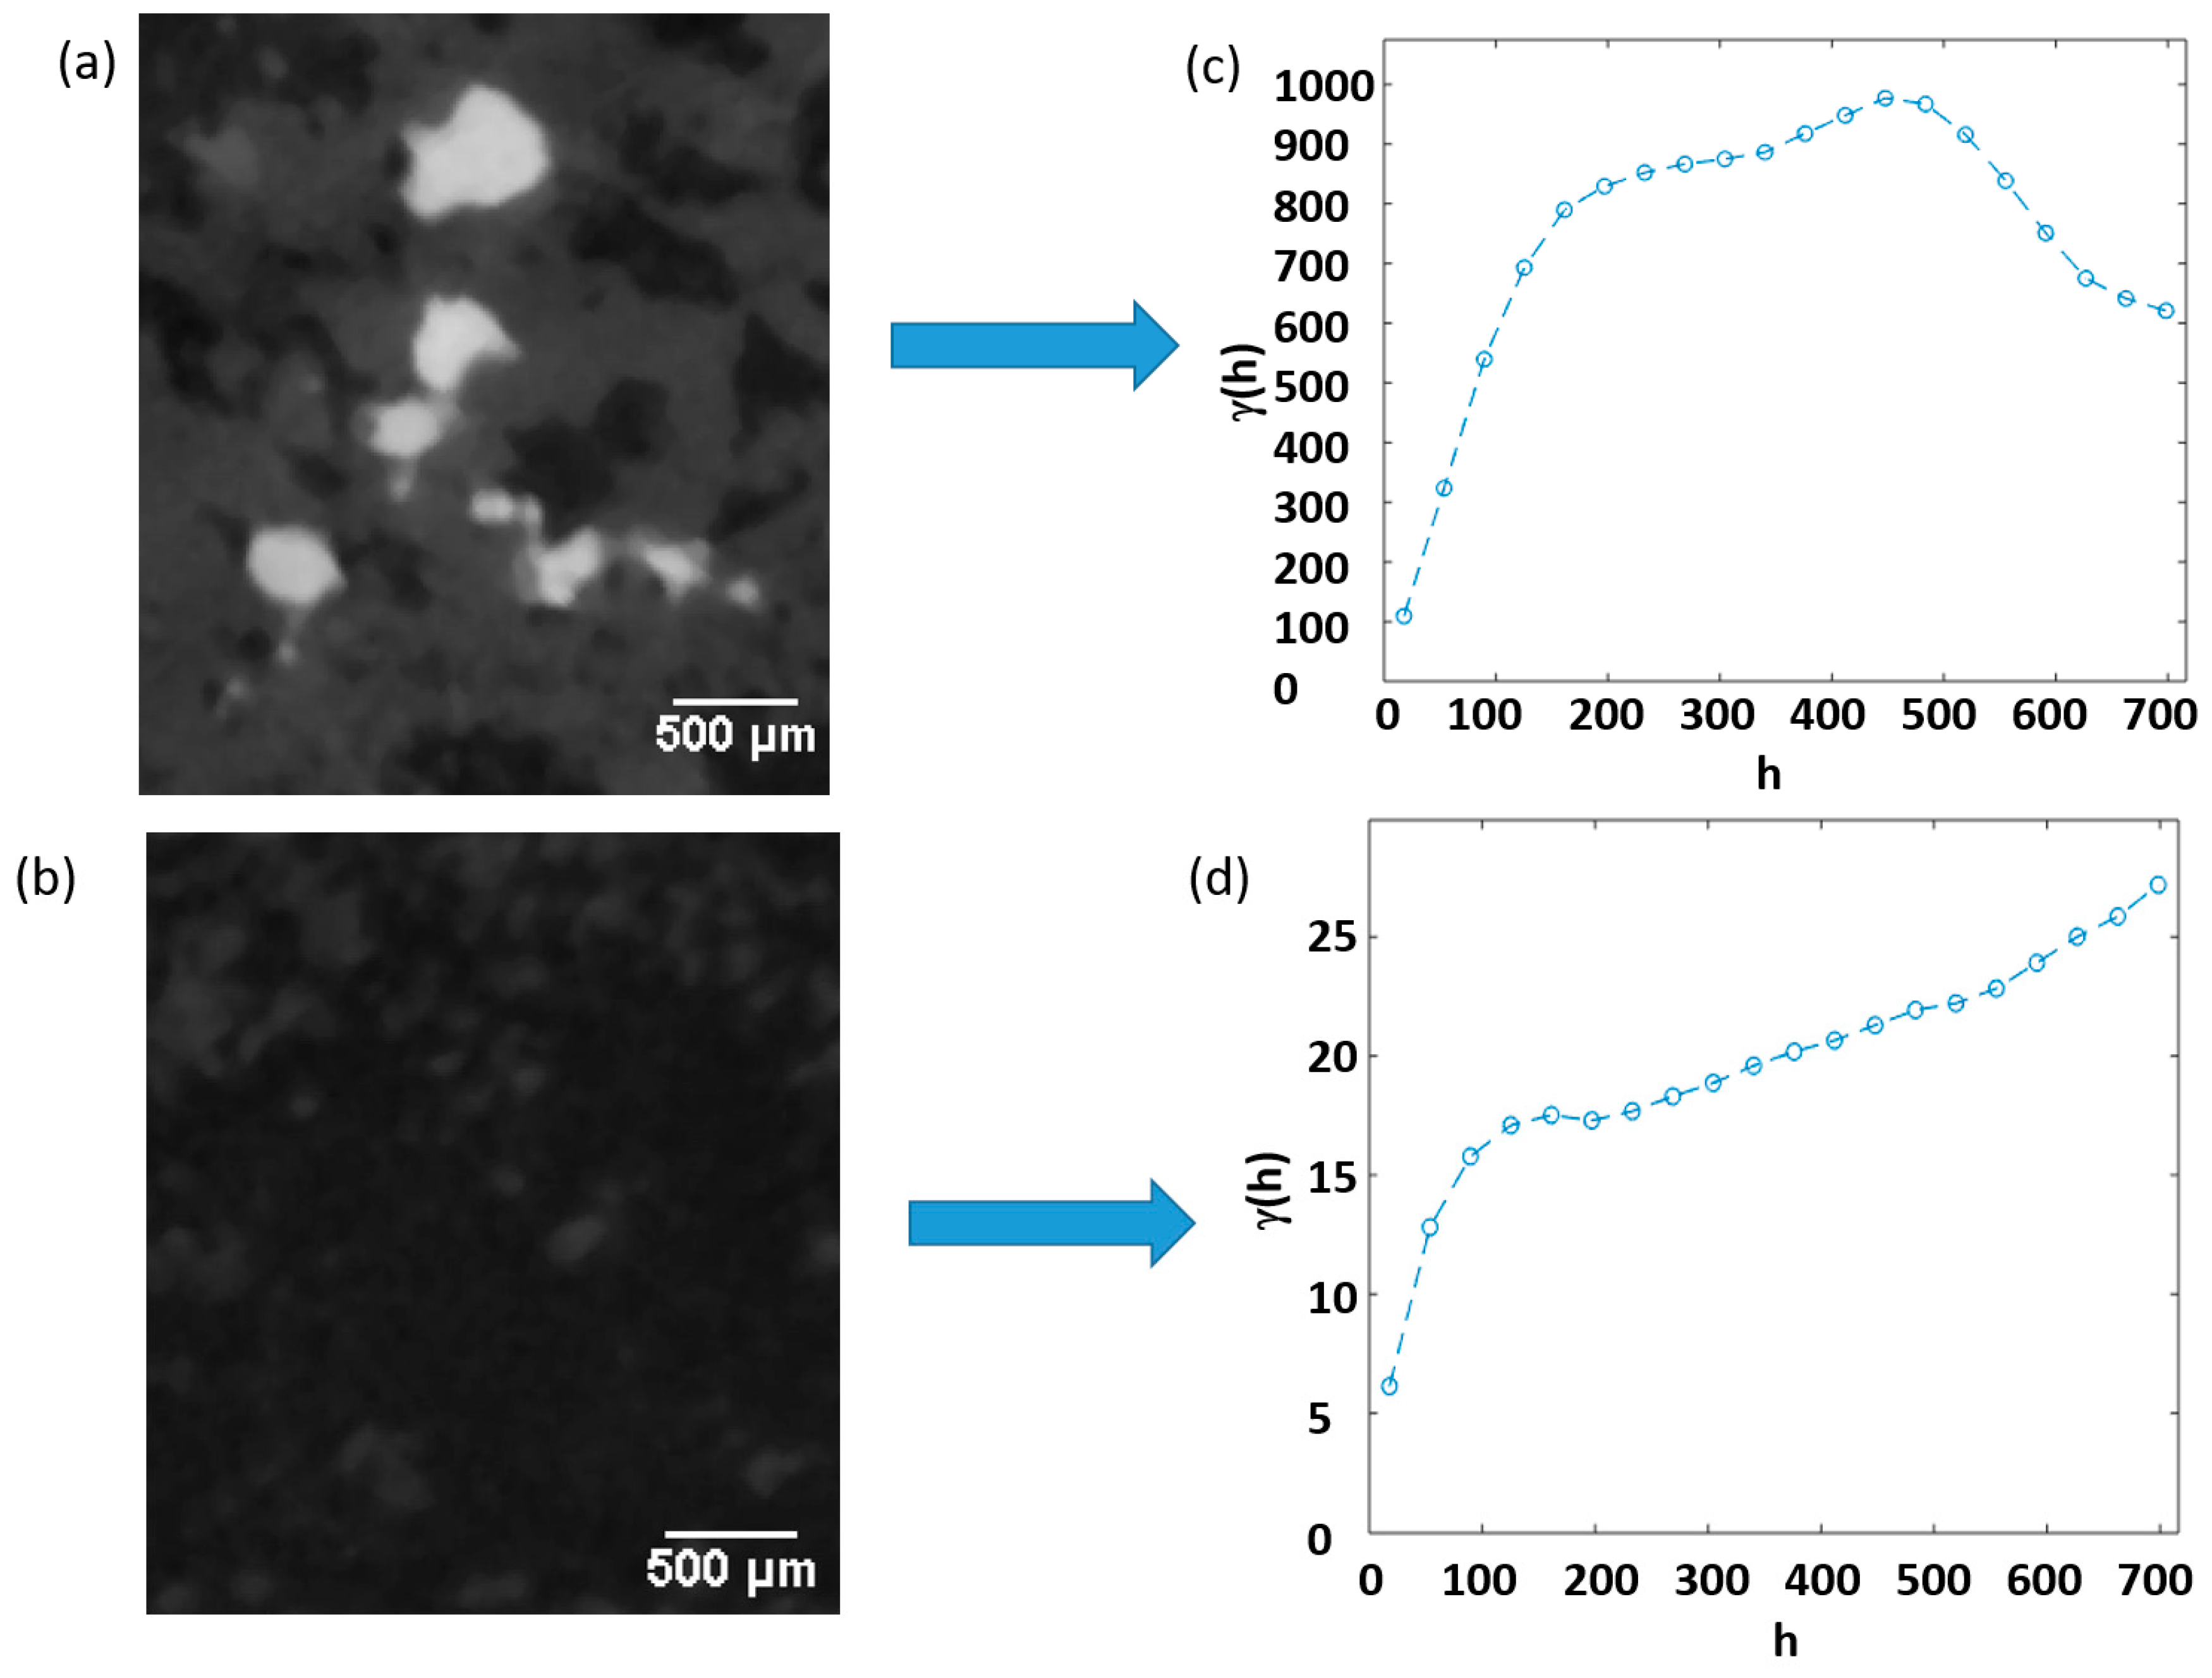
Spatial statistical tools such as co-variance and variograms can also be used to quantify stationary textures. Such tools define variability of two points in a texture, which is very useful when inferring the probability of the two points to belong to the same phase. It has also been used in 3D dataset of a fibrous network [125]. An example of these variograms is shown in Figure 12.
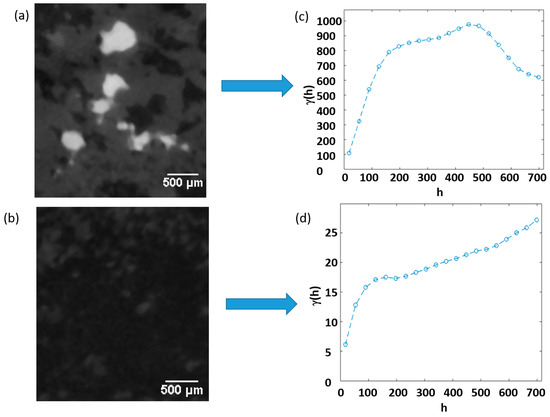
Figure 12.
Semi-variogram for different textures, computed using a total 10,000 points in the texture. The variogram explains the relation between the variance (γ(h)) against the distance of two points in the texture (h), grouped in a bin width of 20. Texture (a) is more varied than (b), which explains the higher variance in the variogram (c) in comparison to (d). The variogram of texture (a) exhibits a cyclic nature due to the somewhat periodical occurrence of sulphide phases. Texture (b) exhibits upward trend in variance due to occurrence of amphiboles (light grey) in the top part of the texture.
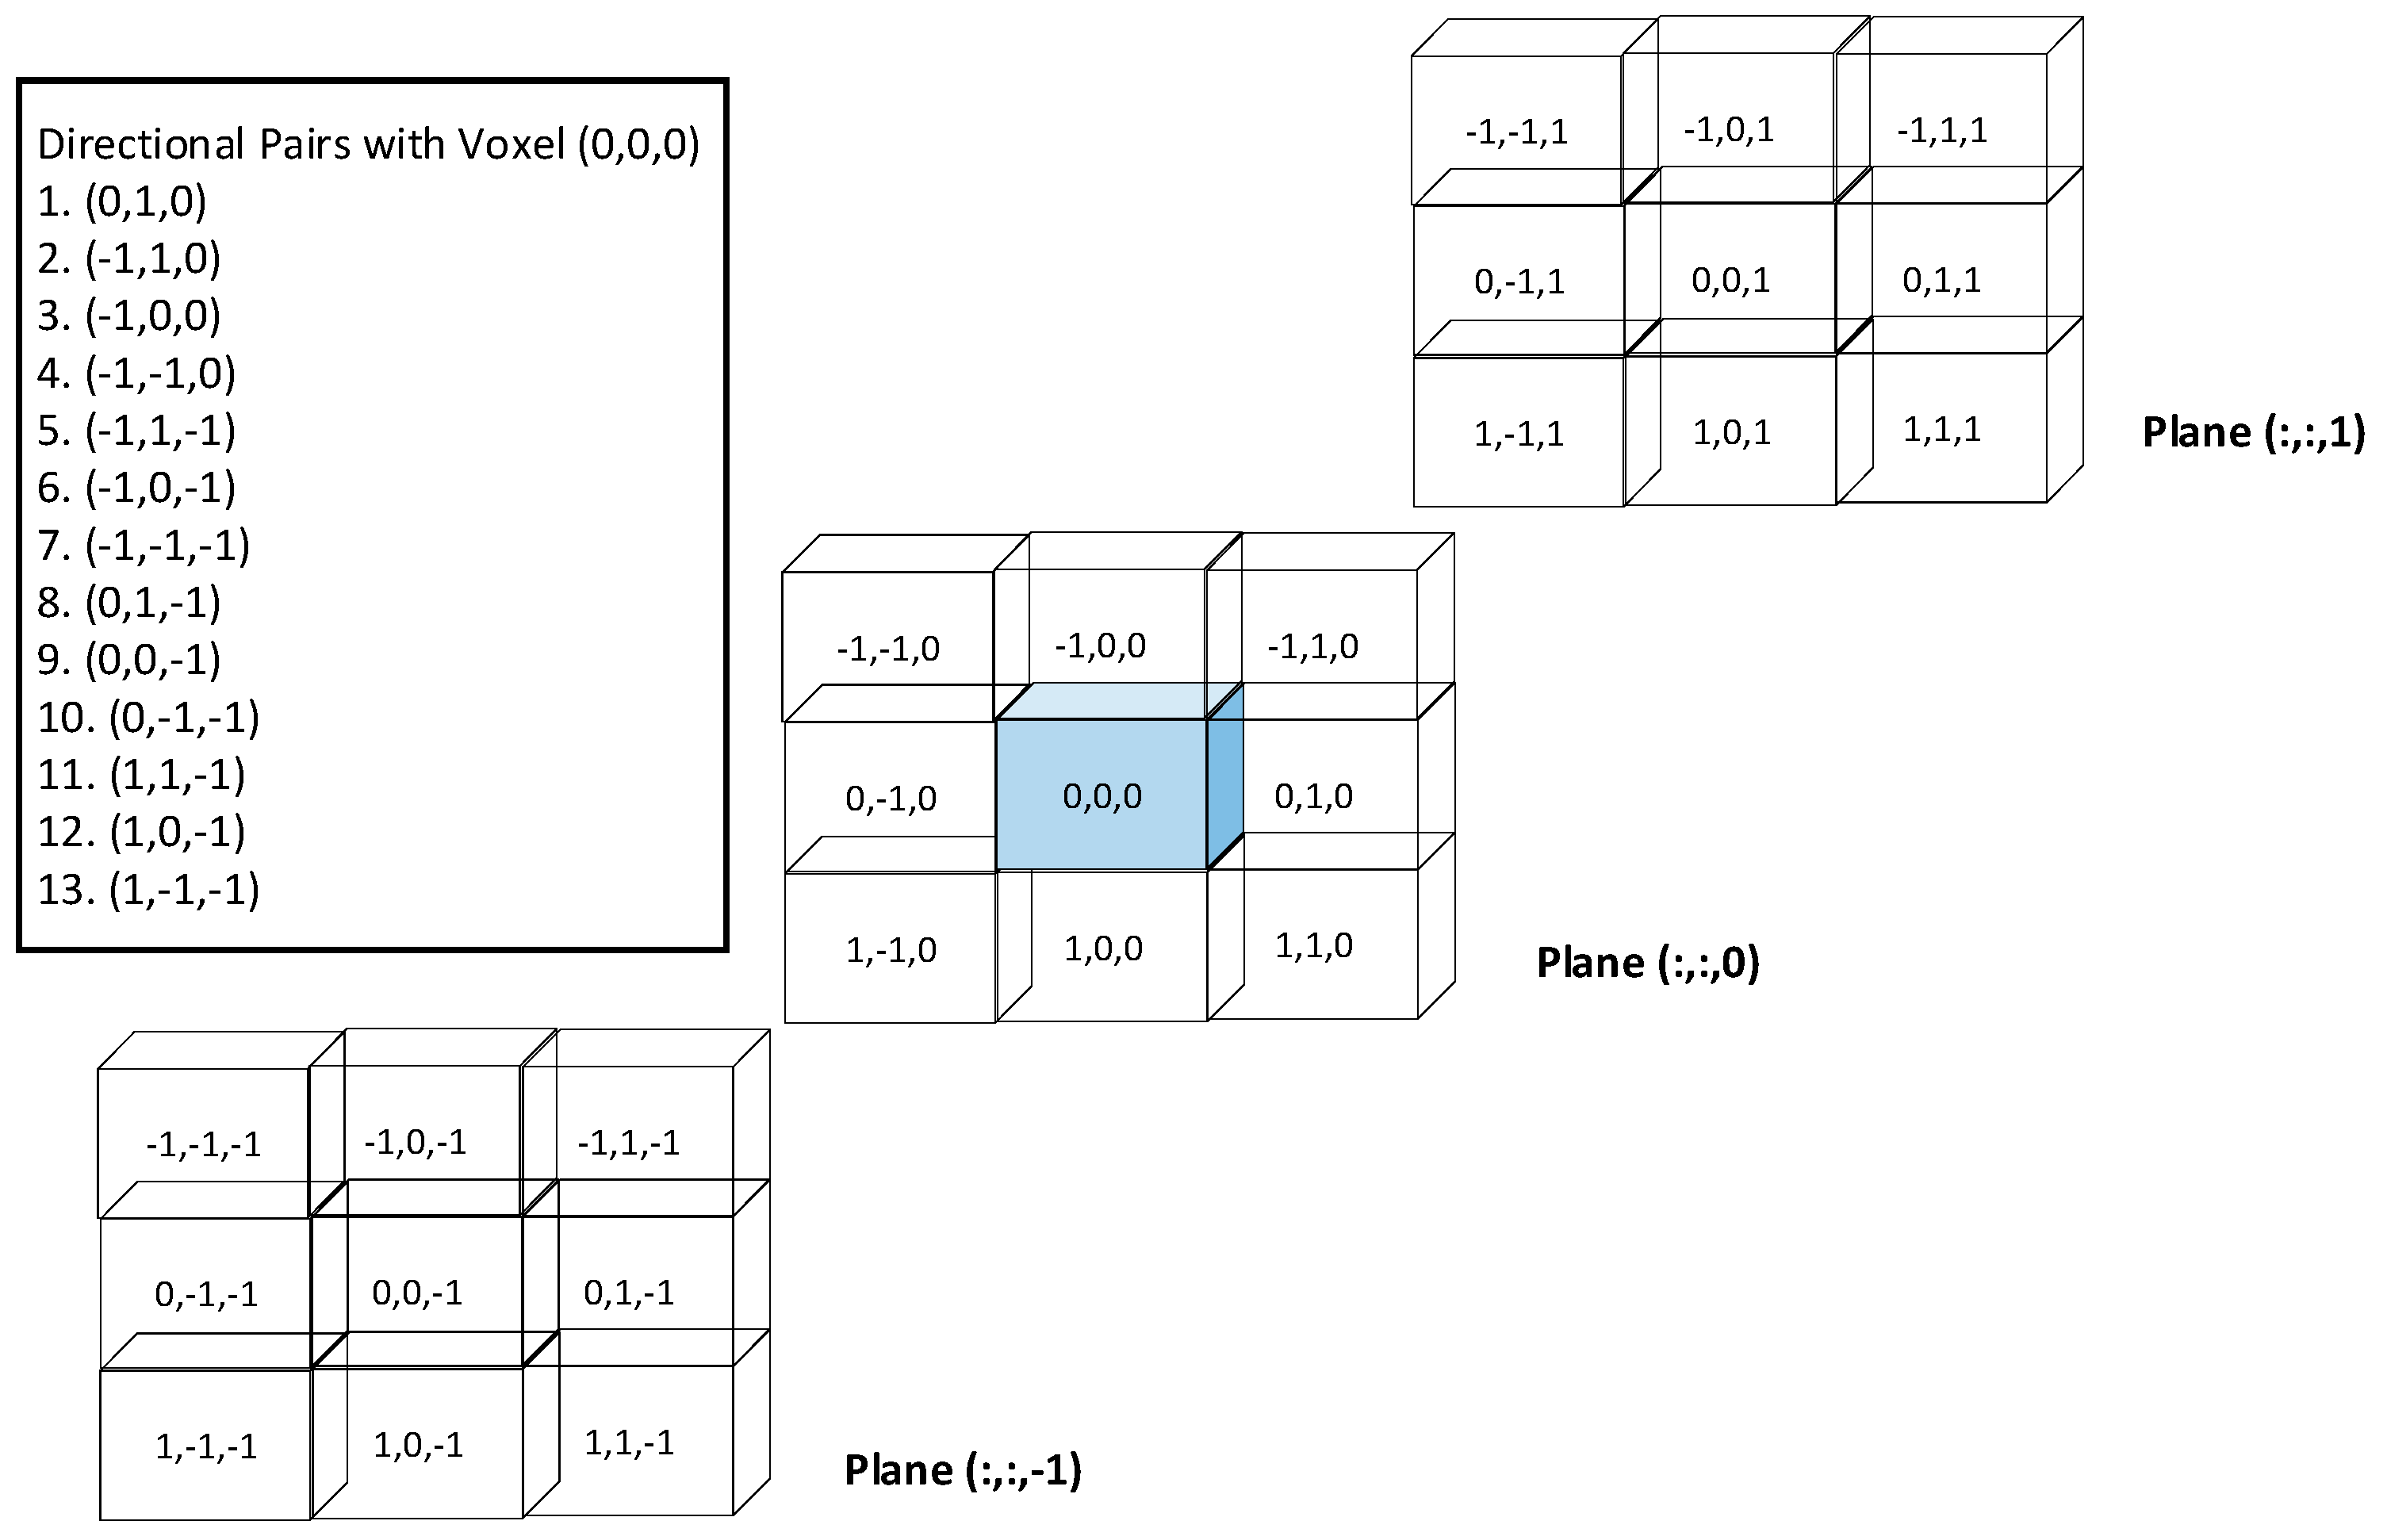
Co-occurrence and autocorrelation features are another approach to extract textures from an image. Gray level co-occurrence matrices (GLCM) [150] are a quite well known image processing technique that measures how the gray level varies between the neighboring pixels. A GLCM is composed of an n × n matrix, in which n is the number of possible grayscale values in an image, i.e., 256 for an eight-bit grayscale image. The matrix shows how many times a pair of voxel values co-exists in a neighborhood, as well as the directional adjacency of such pairs. In a 3D volume, a voxel would have 26 neighborhood voxels and 13 specific directions of voxel pairs. This is illustrated for a simple 3 × 3 × 3 volume in Figure 13.
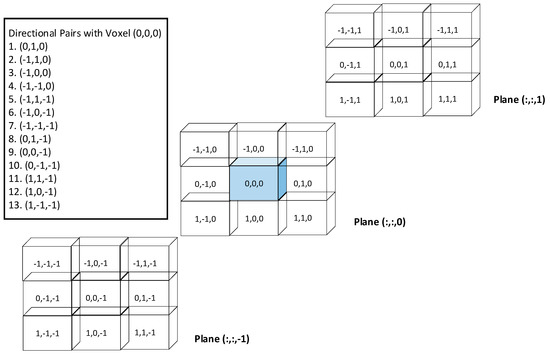
Figure 13.
Neighborhood and directional voxel pairs in relation to GLCM analysis, adapted from Jardine et al. [24]. All three planes are in a 26-connected neighborhood of voxels, in which there exist 13 unique directional pairs with the origin voxel (0, 0, 0). Keep in mind that mirrored direction does not count as a unique direction, e.g., direction (0, 1, 0) has the same direction with (0, −1, 0), direction (0, 0, −1) has the same as (0, 0, 1), and so on.
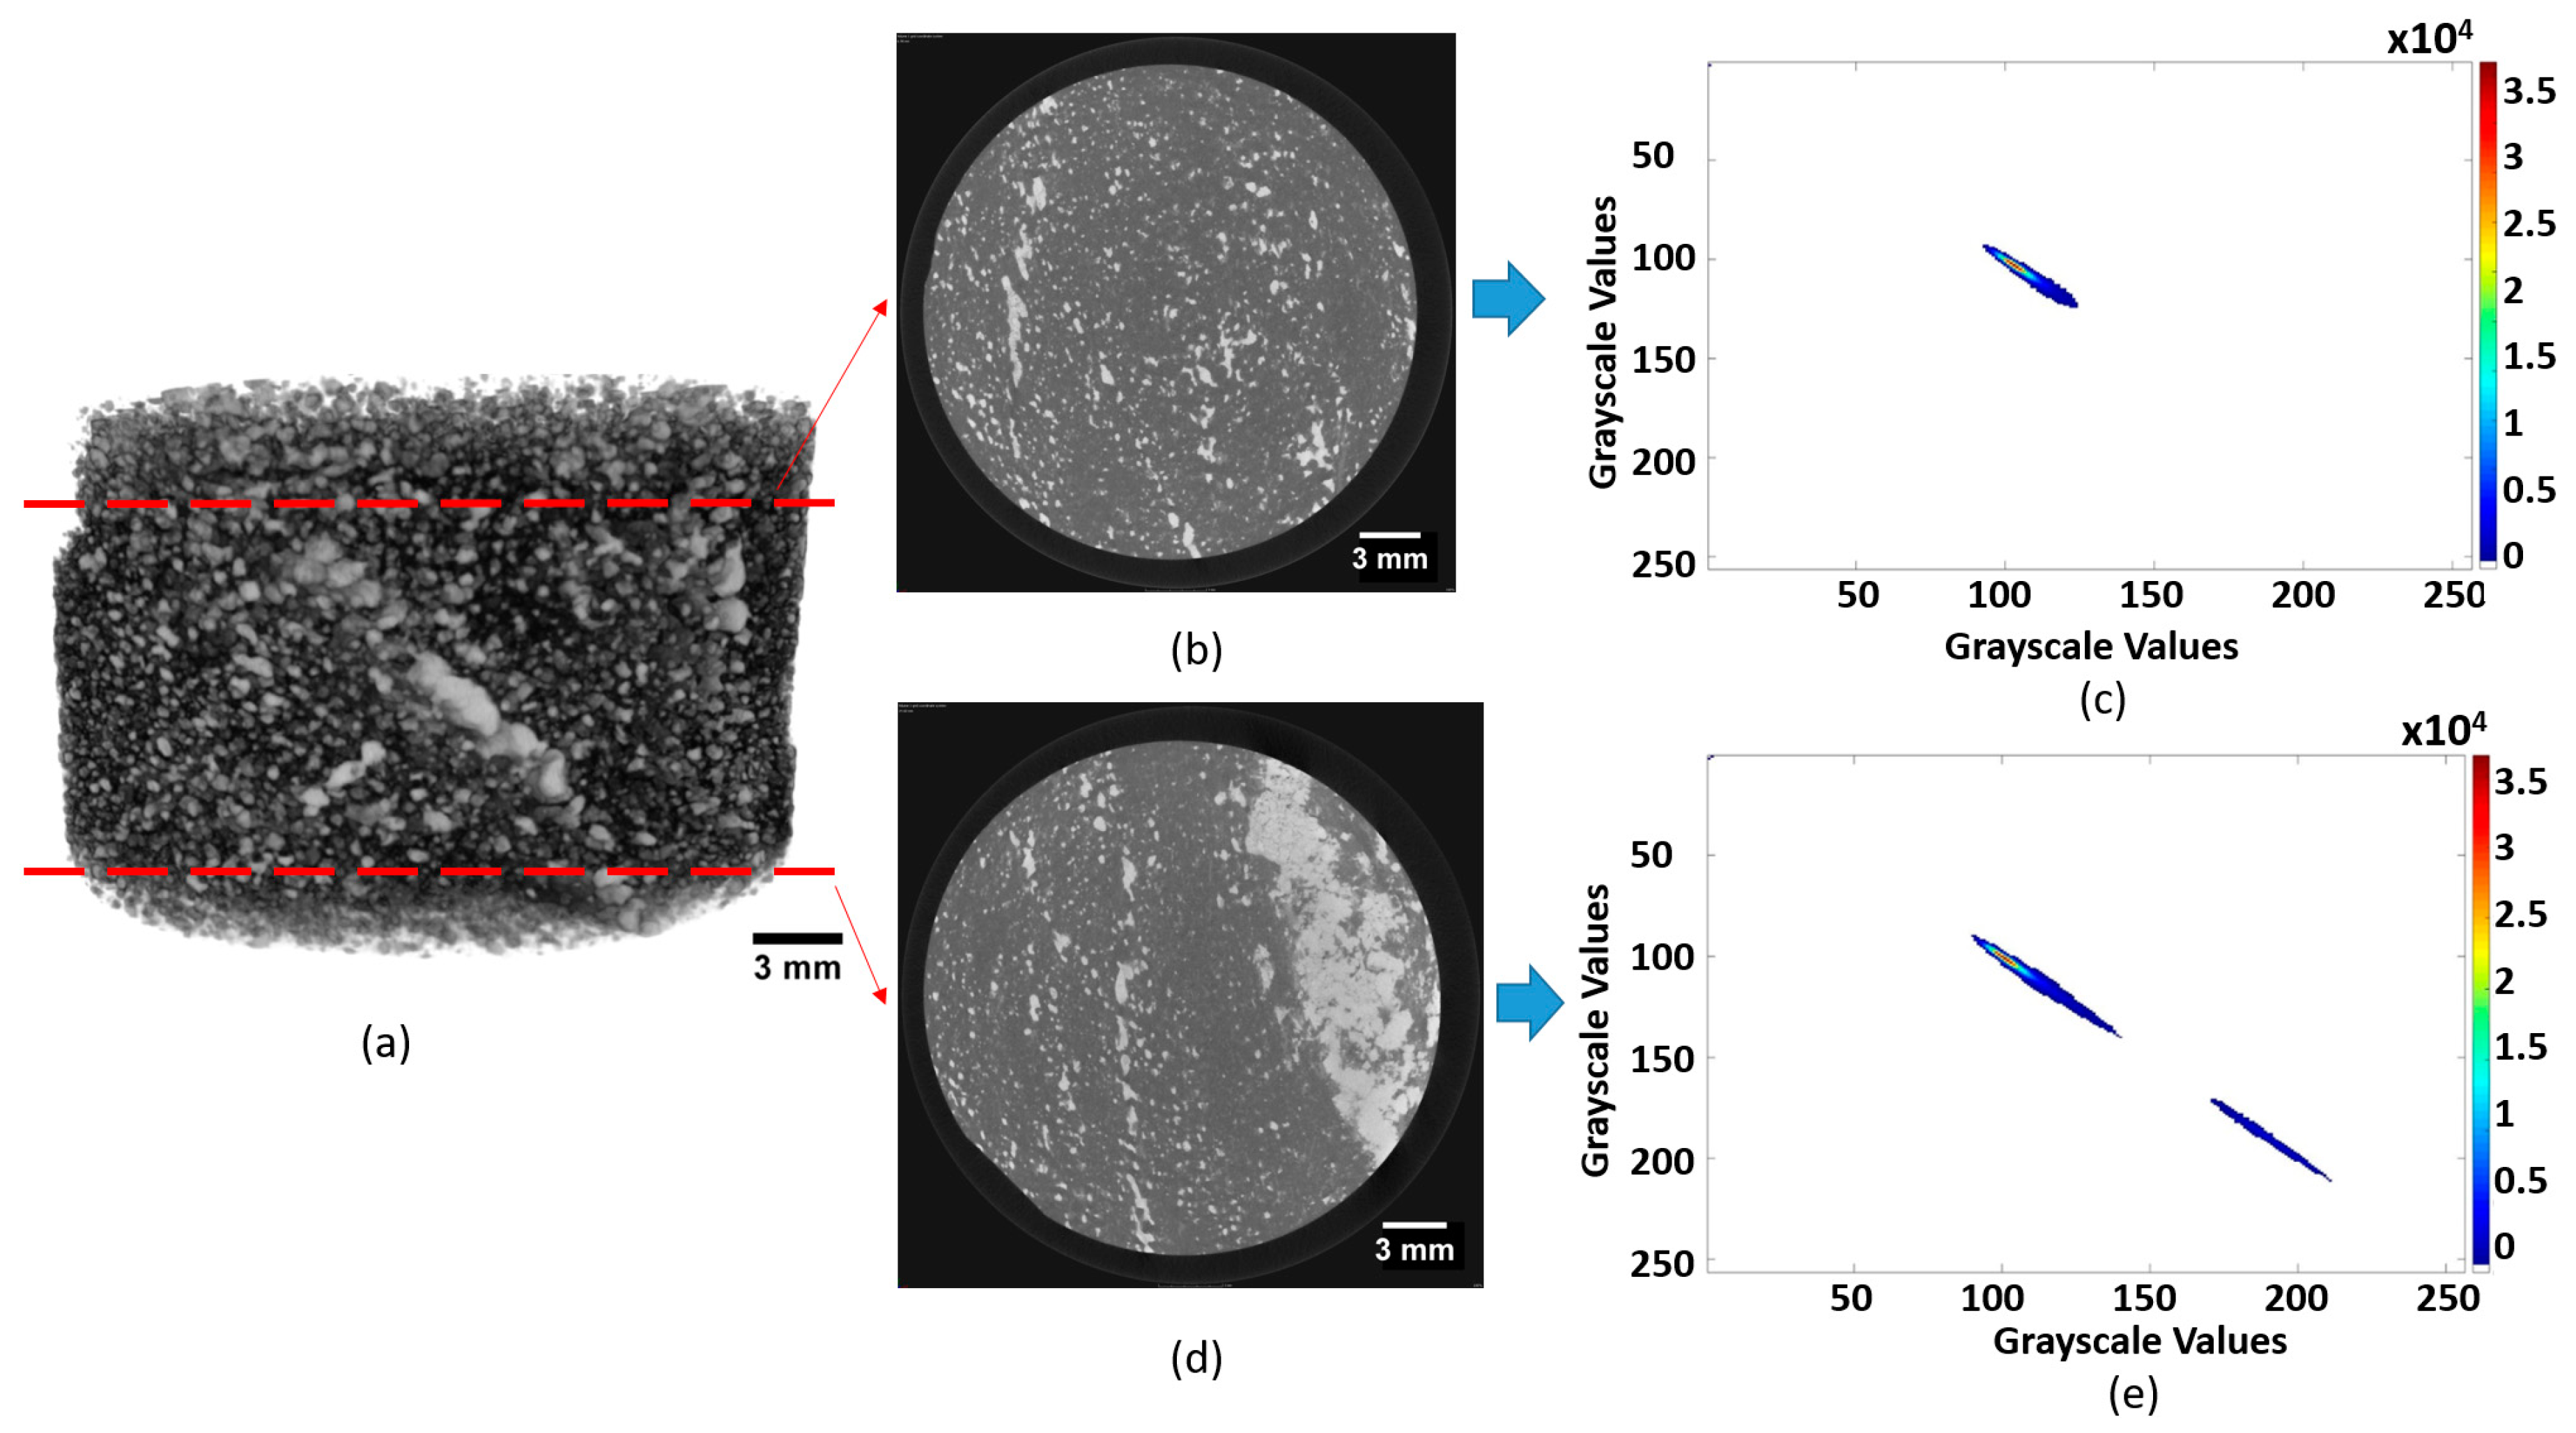
The GLCM of an ore sample can be analyzed as such, as it shows us the correlations between gray values in a given direction. It is able to show how often a gray value co-exist together with another gray values, thereby giving an idea of how the host rock phase (lower gray values) associate with its mineral grains (higher gray values). Such correlations are shown in Figure 14.
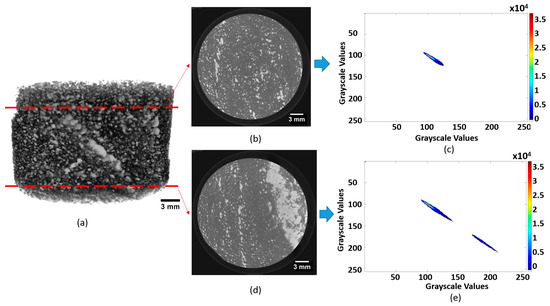
Figure 14.
Relation of GLCM matrix on direction 1 (0,1,0) to the texture of a drill core. (a) Drill core volume showing horizontal slices, (b,d). Horizontal slices of the drill core, (c,e), are the GLCM matrices as a heat map, alongside its legend showing red for high frequency and blue for low. The results clearly show difference in the GLCM as slice (d) has more sulphide mineralization as compared to slice (b). This can be seen as the higher correlation frequency between the brighter phases, which usually indicates the sulphide minerals.
Furthermore, the GLCM can also be quantified using the available 14 GLCM statistical parameters. Four of these parameters are related to stationary textures, namely energy, correlation, contrast, and homogeneity. The GLCM technique has recently been applied to 3D µCT drill core images [24], where it was shown that there exists correlations between various textures and their respective GLCM statistics. However, such statistics captured only the bulk mineralogy (stationary textures); structural textures, such as coarse versus fine grained, were not observed to be correlated with the statistics. Such a technique is also very much dependent on the voxel pair direction chosen when calculating the GLCM, especially in cases where the ore texture is anisotropic. In such cases, several voxel pair directions might be needed to adequately quantify the textural characteristic of the sample, which consequently increase the computational expense of the GLCM technique [24].
6. Summary of Data Analysis Methods
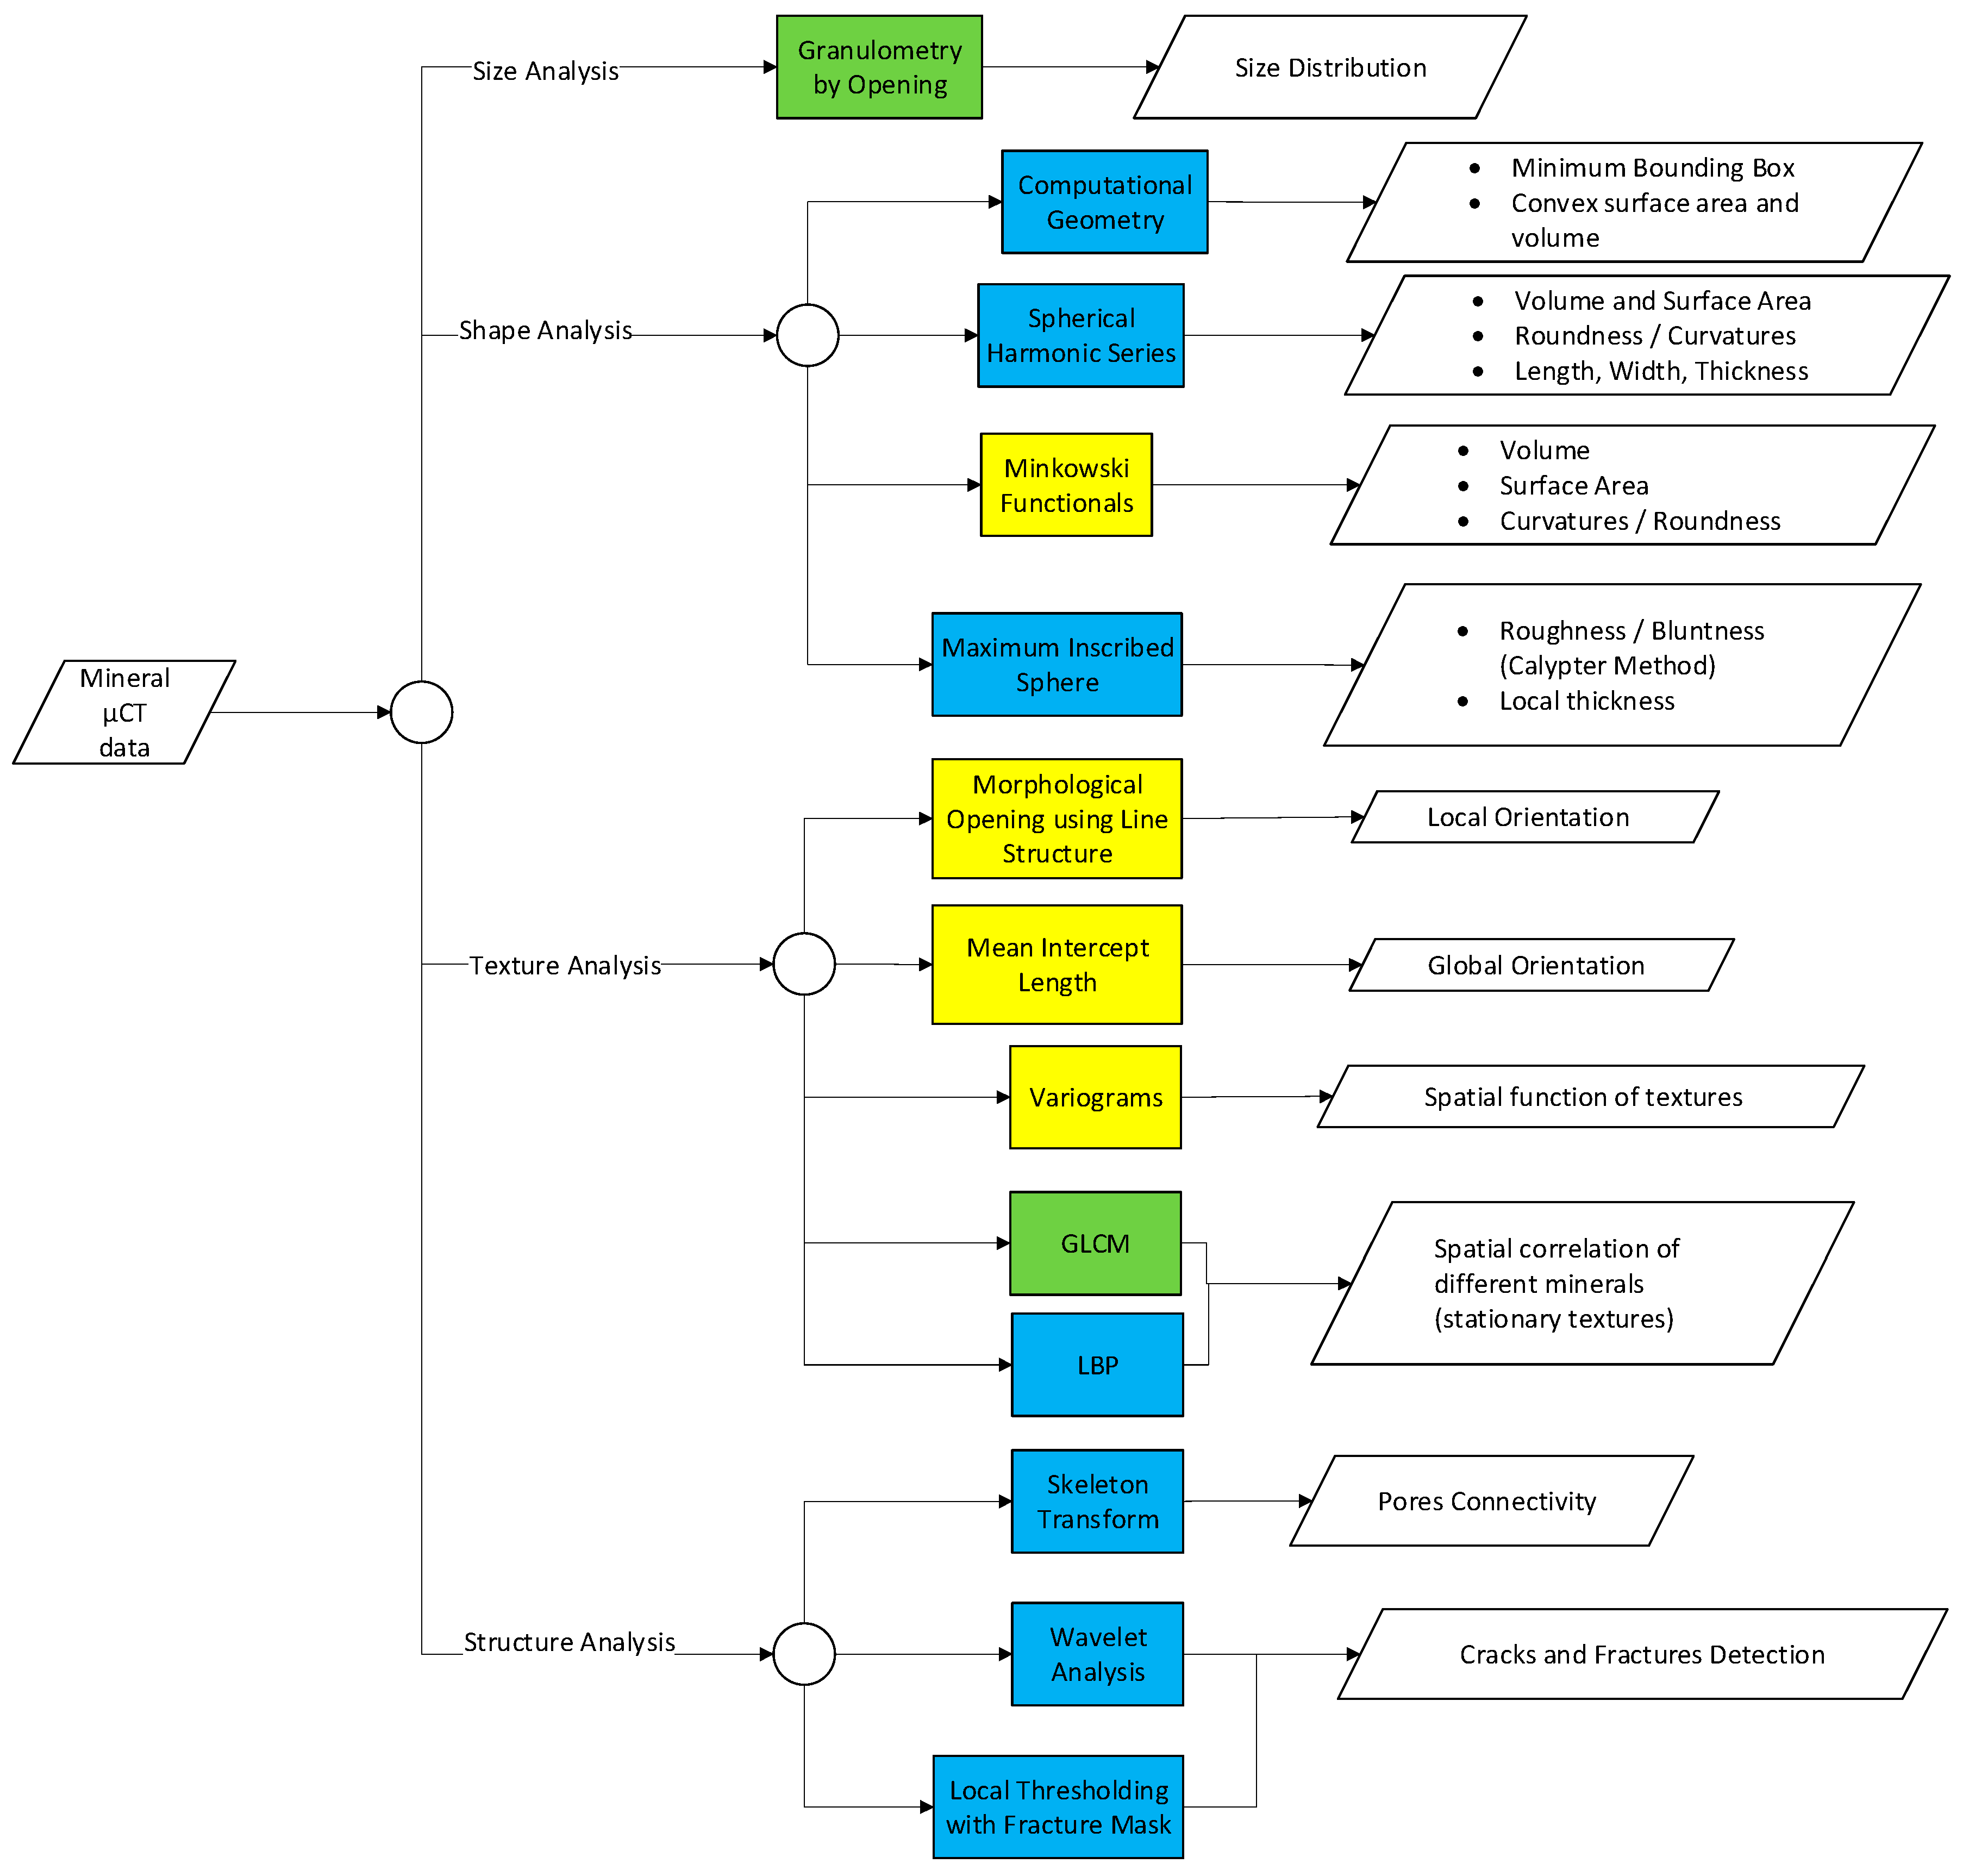
In this section, the methods that have been reviewed are summarized together with their related applications and case studies on mineral characterization. A flow diagram showing the applicability of these methods is shown in Figure 15.
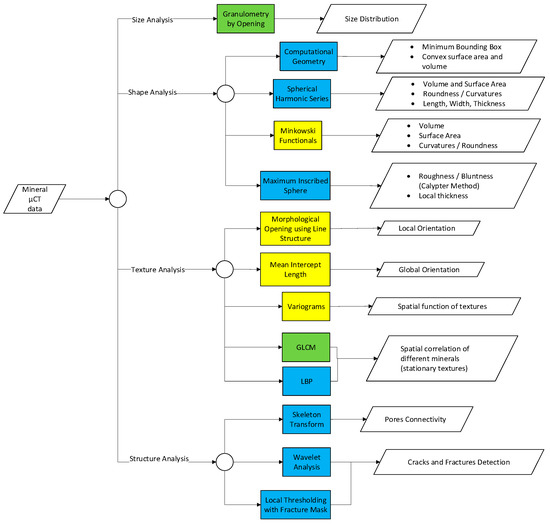
Figure 15.
Workflow showing different alternatives in characterization of ore sample using a µCT system and the resulting information. The colors indicate the applicability of the methods. Green indicates that the methods have been implemented for µCT analysis of ore samples. Blue is for methods that have not been implemented specifically for µCT mineral characterization but have been implemented for similar materials such as dirt particles, aggregates, metal powders, and rocks. Yellow is for methods that have only been implemented for µCT analysis of materials that have little similarity to ore samples, such as soil and fibrous networks.
- Cases such as grain, pore, or particle size distribution analysis with µCT have been evaluated. These cases are most conveniently addressed using granulometry by opening. Improvements toward computational speed of such methods in 3D datasets have mostly been addressed by modification of the structuring element used.
- Shape analysis using µCT is more common for particulate samples; less emphasis has been put on grain shape analysis of intact ore. In these cases, computational geometry has been used, but there is always an error associated with it. Spherical harmonic series is another alternative, but it is yet more complex due to its analytical approach. Minkowski functionals allow straightforward calculations of shape descriptors, but they are limited to surface properties and topology of the shape.
- Mineral phase segmentation can be addressed well using thresholding and unsupervised classification, provided that the target phases have enough attenuation contrasts. Additional measures must be taken when attempting to segment minerals with similar attenuations, in which such measures include dual energy µCT scanning, using lower voltage and smaller sample size, and using additional information acquired from another dataset (SEM-EDS, XRF). A more detailed summary on mineral phase segmentation with µCT is provided in Table 2.
 Table 2. Summary of phase segmentation techniques applied in mineral characterization using µCT system.
 - Stationary texture analysis in 3D has been addressed using kernel operators (such as LBP), covariance and variograms, as well as co-occurrence matrices (such as GLCM). Such techniques are potentially capable to quantify stationary textures. As these techniques rely on spatial statistics, it is restricted to textures with similar statistics across the volume (isotropic and homogenous textures). Textures with high variability across the volume might be difficult to be accurately represented. Wavelet techniques could be an alternative in texture analysis, but its current development is lagging behind, especially for 3D µCT datasets.
- Structural analysis, such as fractures, cracks, and pores, with µCT systems has also been evaluated by several researchers. The skeleton transform technique has been used in evaluating pore connectivity in a leaching column filled with ore particles. Cracks and fractures in a rock sample could be detected using wavelet analysis, or using local thresholding with a fracture mask. The latter technique has been shown to be capable of distinguishing fractures/cracks from pores.
7. Conclusions and Outlook
In general, the applications of µCT in mineral characterization are in still development. One key to improve the application of µCT systems is by developing the data processing workflow so that features of the samples can be extracted, described, and classified in an accurate and efficient manner. Several conclusions and outlooks can be drawn from this review:
- In general, size, shape, and structural analysis of ore samples using µCT have been evaluated extensively by several researchers, as these parameters are best analyzed in 3D. Various data analysis methods devoting to evaluate these parameters are available with varying degree of accuracy and complexity. In relation to mineral characterization, an adequate estimation of size and shape of particulate samples could be useful in evaluating the processing behavior of such ore samples (more relevant to the field of process mineralogy and geometallurgy). Estimation on cracks and pores would be a good addition, as it could affect mineral liberation during comminution.
- It can be suggested that the bottleneck of mineral characterization with µCT lies in the mineral segmentation and mapping. Most of the µCT applications in mineral characterization are highly limited to segmentation between the major phases, such as pores, gangues, and valuable minerals (high density phases). The establishment of µCT as a rapid, standalone, and automated mineralogical analysis is challenging, as the result of this study indicates that additional information (SEM-EDS, XRF, calibration with pure minerals, dual energy) are required to effectively segment between different mineral phases in the µCT dataset. Future works should also include how to effectively combine this additional information to the µCT data processing workflow.
- Mineral texture analysis using µCT is a potential yet to be explored. Textural analysis with µCT systems is more prevalent with cases of soil, fibrous materials, as well as aggregates. In such materials the notion of texture is mostly limited to structural textures, such as morphology, surface texture (topology), and orientation. While these types of textures can be of importance in mineral characterization, the stationary textures (spatial patterns of the mineral grains) are also of interest. Various techniques have been developed to extract and quantify 3D stationary textures of ore samples. However, such techniques are currently limited to the computational expense of processing the large 3D dataset; further development is needed to optimize the computational performances of such techniques.
Author Contributions
P.I.G. conducted the literature review and tested some of the methods to available µCT datasets. Y.G. mainly focused more on latest applications of µCT and its relation to mineral characterization. P.-H.K. mainly contributed to the theoretical framework in image processing. J.R. supervised the project and contributed mainly to the conclusion section.
Funding
This study has received funding from the European Union’s Horizon 2020 research and innovation program under grant agreement no. 722677, as part of the MetalIntelligence project (www.metalintelligence.eu).
Acknowledgments
The authors would like to thank Glacialle Tiu from Division of Geosciences and Environmental Engineering at Luleå University of Technology for providing the µCT dataset.
Conflicts of Interest
The authors declare no conflict of interest.
References
- Cnudde, V.; Boone, M.N. High-resolution X-ray computed tomography in geosciences: A review of the current technology and applications. Earth-Sci. Rev. 2013, 123, 1–17. [Google Scholar] [CrossRef]
- Mees, F.; Swennen, R.; Van Geet, M.; Jacobs, P. Applications of X-ray computed tomography in the geosciences. Geol. Soc. Lond. Spec. Publ. 2003, 215, 1–6. [Google Scholar] [CrossRef]
- Kyle, J.R.; Ketcham, R.A. Application of high resolution X-ray computed tomography to mineral deposit origin, evaluation, and processing. Ore Geol. Rev. 2015, 65, 821–839. [Google Scholar] [CrossRef]
- Miller, J.D.; Lin, C.L.; Cortes, A.B. A review of X-ray computed tomography and its applications in mineral processing. Miner. Procesing Extr. Metall. Rev. 1990, 7, 1–18. [Google Scholar] [CrossRef]
- Lin, C.L.; Miller, J.D. 3D characterization and analysis of particle shape using X-ray microtomography (XMT). Powder Technol. 2005, 154, 61–69. [Google Scholar] [CrossRef]
- Yang, B.; Wu, A.; Narsilio, G.A.; Miao, X.; Wu, S. Use of high-resolution X-ray computed tomography and 3D image analysis to quantify mineral dissemination and pore space in oxide copper ore particles. Int. J. Miner. Metall. Mater. 2017, 24, 965–973. [Google Scholar] [CrossRef]
- Iassonov, P.; Gebrenegus, T.; Tuller, M. Segmentation of X-ray computed tomography images of porous materials: A crucial step for characterization and quantitative analysis of pore structures. Water Resour. Res. 2009, 45. [Google Scholar] [CrossRef]
- Peng, R.; Yang, Y.; Ju, Y.; Mao, L.; Yang, Y. Computation of fractal dimension of rock pores based on gray CT images. Chin. Sci. Bull. 2011, 56, 3346. [Google Scholar] [CrossRef]
- Müter, D.; Pedersen, S.; Sørensen, H.O.; Feidenhans’l, R.; Stipp, S.L.S. Improved segmentation of X-ray tomography data from porous rocks using a dual filtering approach. Comput. Geosci. 2012, 49, 131–139. [Google Scholar] [CrossRef]
- Zandomeneghi, D.; Voltolini, M.; Mancini, L.; Brun, F.; Dreossi, D.; Polacci, M. Quantitative analysis of X-ray microtomography images of geomaterials: Application to volcanic rocks. Geosphere 2010, 6, 793–804. [Google Scholar] [CrossRef]
- Lin, C.L.; Miller, J.D. Cone beam X-ray microtomography for three-dimensional liberation analysis in the 21st century. Int. J. Miner. Process. 1996, 47, 61–73. [Google Scholar] [CrossRef]
- Miller, J.D.; Lin, C.L.; Garcia, C.; Arias, H. Ultimate recovery in heap leaching operations as established from mineral exposure analysis by X-ray microtomography. Int. J. Miner. Process. 2003, 72, 331–340. [Google Scholar] [CrossRef]
- Miller, J.D.; Lin, C.-L.; Hupka, L.; Al-Wakeel, M.I. Liberation-limited grade/recovery curves from X-ray micro CT analysis of feed material for the evaluation of separation efficiency. Int. J. Miner. Process. 2009, 93, 48–53. [Google Scholar] [CrossRef]
- Reyes, F.; Lin, Q.; Cilliers, J.J.; Neethling, S.J. Quantifying mineral liberation by particle grade and surface exposure using X-ray microCT. Miner. Eng. 2018, 125, 75–82. [Google Scholar] [CrossRef]
- Wang, Y.; Lin, C.L.; Miller, J.D. Quantitative analysis of exposed grain surface area for multiphase particles using X-ray microtomography. Powder Technol. 2017, 308, 368–377. [Google Scholar] [CrossRef]
- Garcia, D.; Lin, C.L.; Miller, J.D. Quantitative analysis of grain boundary fracture in the breakage of single multiphase particles using X-ray microtomography procedures. Miner. Eng. 2009, 22, 236–243. [Google Scholar] [CrossRef]
- Ghorbani, Y.; Becker, M.; Petersen, J.; Morar, S.H.; Mainza, A.; Franzidis, J.-P. Use of X-ray computed tomography to investigate crack distribution and mineral dissemination in sphalerite ore particles. Miner. Eng. 2011, 24, 1249–1257. [Google Scholar] [CrossRef]
- Reyes, F.; Lin, Q.; Udoudo, O.; Dodds, C.; Lee, P.D.; Neethling, S.J. Calibrated X-ray micro-tomography for mineral ore quantification. Miner. Eng. 2017, 110, 122–130. [Google Scholar] [CrossRef]
- Tiu, G. Classification of Drill Core Textures for Process Simulation in Geometallurgy: Aitik Mine, New Boliden. M.Sc. Thesis, Luleå University of Technology, Luleå, Sweden, 2017. [Google Scholar]
- Andrä, H.; Combaret, N.; Dvorkin, J.; Glatt, E.; Han, J.; Kabel, M.; Keehm, Y.; Krzikalla, F.; Lee, M.; Madonna, C. Digital rock physics benchmarks—Part I: Imaging and segmentation. Comput. Geosci. 2013, 50, 25–32. [Google Scholar] [CrossRef]
- Andrä, H.; Combaret, N.; Dvorkin, J.; Glatt, E.; Han, J.; Kabel, M.; Keehm, Y.; Krzikalla, F.; Lee, M.; Madonna, C. Digital rock physics benchmarks—Part II: Computing effective properties. Comput. Geosci. 2013, 50, 33–43. [Google Scholar] [CrossRef]
- Wang, Y.; Lin, C.L.; Miller, J.D. Improved 3D image segmentation for X-ray tomographic analysis of packed particle beds. Miner. Eng. 2015, 83, 185–191. [Google Scholar] [CrossRef]
- Godel, B. High-resolution X-ray computed tomography and its application to ore deposits: From data acquisition to quantitative three-dimensional measurements with case studies from Ni-Cu-PGE deposits. Econ. Geol. 2013, 108, 2005–2019. [Google Scholar] [CrossRef]
- Jardine, M.A.; Miller, J.A.; Becker, M. Coupled X-ray computed tomography and grey level co-occurrence matrices as a method for quantification of mineralogy and texture in 3D. Comput. Geosci. 2018, 111, 105–117. [Google Scholar] [CrossRef]
- Chauhan, S.; Rühaak, W.; Khan, F.; Enzmann, F.; Mielke, P.; Kersten, M.; Sass, I. Processing of rock core microtomography images: Using seven different machine learning algorithms. Comput. Geosci. 2016, 86, 120–128. [Google Scholar] [CrossRef]
- Deng, H.; Fitts, J.P.; Peters, C.A. Quantifying fracture geometry with X-ray tomography: Technique of Iterative Local Thresholding (TILT) for 3D image segmentation. Comput. Geosci. 2016, 20, 231–244. [Google Scholar] [CrossRef]
- Alikarami, R.; Andò, E.; Gkiousas-Kapnisis, M.; Torabi, A.; Viggiani, G. Strain localisation and grain breakage in sand under shearing at high mean stress: Insights from in situ X-ray tomography. Acta Geotech. 2015, 10, 15–30. [Google Scholar] [CrossRef]
- Dobson, J.K.; Harrison, T.S.; Lin, Q.; Ní Bhreasail, A.; Fagan-Endres, A.M.; Neethling, J.S.; Lee, D.P.; Cilliers, J.J. Insights into Ferric Leaching of Low Grade Metal Sulfide-Containing ores in an Unsaturated Ore Bed Using X-ray Computed Tomography. Minerals 2017, 7, 85. [Google Scholar] [CrossRef]
- King, A.; Reischig, P.; Adrien, J.; Peetermans, S.; Ludwig, W. Polychromatic diffraction contrast tomography. Mater. Charact. 2014, 97, 1–10. [Google Scholar] [CrossRef]
- Olivo, A.; Castelli, E. X-ray phase contrast imaging: From synchrotrons to conventional sources. La Rivista Del Nuovo Cimento 2014, 37, 467–508. [Google Scholar] [CrossRef]
- Dierick, M.; Van Loo, D.; Masschaele, B.; Van den Bulcke, J.; Van Acker, J.; Van Hoorebeke, L. Recent micro-CT scanner developments at UGCT. Nucl. Instrum. Methods Phys. Res. Sect. B Beam Interact. Mater. Atoms 2014, 324, 35–40. [Google Scholar] [CrossRef]
- Lau, S.H.; Miller, J.; Lin, C.-L. 3D Mineralogy, Texture and Damage Analysis of Multiphase Mineral Particles with a High Contrast, Submicron Resolution X-ray Tomography System; Xradia Inc.: Pleasanton, CA, USA, 2012; pp. 2726–2736. [Google Scholar]
- Fusseis, F.; Xiao, X.; Schrank, C.; De Carlo, F. A brief guide to synchrotron radiation-based microtomography in (structural) geology and rock mechanics. J. Struct. Geol. 2014, 65, 1–16. [Google Scholar] [CrossRef]
- Han, I.; Demir, L.; Şahin, M. Determination of mass attenuation coefficients, effective atomic and electron numbers for some natural minerals. Radiat. Phys. Chem. 2009, 78, 760–764. [Google Scholar] [CrossRef]
- Omoumi, P.; Becce, F.; Racine, D.; Ott, J.; Andreisek, G.; Verdun, F. Dual-Energy CT: Basic Principles, Technical Approaches, and Applications in Musculoskeletal Imaging (Part 1). Semin. Musculoskelet. Radiol. 2015, 19, 431–437. [Google Scholar] [CrossRef]
- Berger, M. XCOM: Photon Cross Sections Database. 2010. Available online: http//www.nist.gov/pml/data/xcom/index.cfm (accessed on 9 March 2019).
- Bam, L.C.; Miller, J.A.; Becker, M.; Basson, I.J. X-ray computed tomography: Practical evaluation of beam hardening in iron ore samples. Miner. Eng. 2019, 131, 206–215. [Google Scholar] [CrossRef]
- Kyle, J.R.; Mote, A.S.; Ketcham, R.A. High resolution X-ray computed tomography studies of Grasberg porphyry Cu-Au ores, Papua, Indonesia. Miner. Depos. 2008, 5, 519–532. [Google Scholar] [CrossRef]
- Van Geet, M.; Swennen, R.; Wevers, M. Quantitative analysis of reservoir rocks by microfocus X-ray computerised tomography. Sediment. Geol. 2000, 132, 25–36. [Google Scholar] [CrossRef]
- Van Geet, M.; Volckaert, G.; Roels, S. The use of microfocus X-ray computed tomography in characterising the hydration of a clay pellet/powder mixture. Appl. Clay Sci. 2005, 29, 73–87. [Google Scholar] [CrossRef]
- Lai, P.; Moulton, K.; Krevor, S. Pore-scale heterogeneity in the mineral distribution and reactive surface area of porous rocks. Chem. Geol. 2015, 411, 260–273. [Google Scholar] [CrossRef]
- Barnes, S.J.; Le Vaillant, M.; Lightfoot, P.C. Textural development in sulfide-matrix ore breccias in the Voisey’s Bay Ni-Cu-Co deposit, Labrador, Canada. Ore Geol. Rev. 2017, 90, 414–438. [Google Scholar] [CrossRef]
- Ducheyne, P.; Healy, K.; Hutmacher, D.W.; Grainger, D.W.; Kirkpatrick, C.J. Comprehensive Biomaterials II; Elsevier: Amsterdam, The Netherlands, 2017; ISBN 0081006926. [Google Scholar]
- Kastner, J.; Harrer, B.; Requena, G.; Brunke, O. A comparative study of high resolution cone beam X-ray tomography and synchrotron tomography applied to Fe- and Al-alloys. NDT E Int. 2010, 43, 599–605. [Google Scholar] [CrossRef]
- Boas, F.E.; Fleischmann, D. CT artifacts: Causes and reduction techniques. Imaging Med. 2012, 4. [Google Scholar] [CrossRef]
- Schwarz, T. Artifacts in CT. In Veterinary Computed Tomography; John Wiley & Sons, Ltd.: Hoboken, NJ, USA, 2011; pp. 35–55. ISBN 9781118785676. [Google Scholar]
- Wildenschild, D.; Vaz, C.M.P.; Rivers, M.L.; Rikard, D.; Christensen, B.S.B. Using X-ray computed tomography in hydrology: Systems, resolutions, and limitations. J. Hydrol. 2002, 267, 285–297. [Google Scholar] [CrossRef]
- Suuronen, J.-P.; Sayab, M. 3D nanopetrography and chemical imaging of datable zircons by synchrotron multimodal X-ray tomography. Sci. Rep. 2018, 8, 4747. [Google Scholar] [CrossRef] [PubMed]
- Sun, J.; Yu, T.; Xu, C.; Ludwig, W.; Zhang, Y. 3D characterization of partially recrystallized Al using high resolution diffraction contrast tomography. Scr. Mater. 2018, 157, 72–75. [Google Scholar] [CrossRef]
- Kikuchi, S.; Nonaka, K.; Asakawa, N.; Shiozawa, D.; Nakai, Y. Change of misorientation of individual grains in fatigue of polycrystalline alloys by diffraction contrast tomography using ultrabright synchrotron radiation. Procedia Struct. Integr. 2017, 3, 402–410. [Google Scholar] [CrossRef]
- Herbig, M.; King, A.; Reischig, P.; Proudhon, H.; Lauridsen, E.M.; Marrow, J.; Buffière, J.-Y.; Ludwig, W. 3-D growth of a short fatigue crack within a polycrystalline microstructure studied using combined diffraction and phase-contrast X-ray tomography. Acta Mater. 2011, 59, 590–601. [Google Scholar] [CrossRef]
- King, A.; Herbig, M.; Ludwig, W.; Reischig, P.; Lauridsen, E.M.; Marrow, T.; Buffière, J.Y. Non-destructive analysis of micro texture and grain boundary character from X-ray diffraction contrast tomography. Nucl. Instrum. Methods Phys. Res. Sect. B Beam Interact. Mater. Atoms 2010, 268, 291–296. [Google Scholar] [CrossRef]
- Toda, H.; Takijiri, A.; Azuma, M.; Yabu, S.; Hayashi, K.; Seo, D.; Kobayashi, M.; Hirayama, K.; Takeuchi, A.; Uesugi, K. Damage micromechanisms in dual-phase steel investigated with combined phase- and absorption-contrast tomography. Acta Mater. 2017, 126, 401–412. [Google Scholar] [CrossRef]
- Artioli, G.; Cerulli, T.; Cruciani, G.; Dalconi, M.C.; Ferrari, G.; Parisatto, M.; Rack, A.; Tucoulou, R. X-ray diffraction microtomography (XRD-CT), a novel tool for non-invasive mapping of phase development in cement materials. Anal. Bioanal. Chem. 2010, 397, 2131–2136. [Google Scholar] [CrossRef]
- Takahashi, H.; Sugiyama, T. Application of non-destructive integrated CT-XRD method to investigate alteration of cementitious materials subjected to high temperature and pure water. Constr. Build. Mater. 2019, 203, 579–588. [Google Scholar] [CrossRef]
- Laforce, B.; Masschaele, B.; Boone, M.N.; Schaubroeck, D.; Dierick, M.; Vekemans, B.; Walgraeve, C.; Janssen, C.; Cnudde, V.; Van Hoorebeke, L.; et al. Integrated Three-Dimensional Microanalysis Combining X-Ray Microtomography and X-Ray Fluorescence Methodologies. Anal. Chem. 2017, 89, 10617–10624. [Google Scholar] [CrossRef] [PubMed]
- Viermetz, M.; Birnbacher, L.; Willner, M.; Achterhold, K.; Pfeiffer, F.; Herzen, J. High resolution laboratory grating-based X-ray phase-contrast CT. Sci. Rep. 2018, 8, 15884. [Google Scholar] [CrossRef] [PubMed]
- Dudgeon, D.E.; Mersereau, R.M. Multidimensional Digital Signal Processing Prentice-Hall Signal Processing Series; Prentice-Hall: Englewood Cliffs, NJ, USA, 1984. [Google Scholar]
- Feldkamp, L.A.; Davis, L.C.; Kress, J.W. Practical cone-beam algorithm. J. Opt. Soc. Am. A 1984, 1, 612–619. [Google Scholar] [CrossRef]
- Lin, Q.; Andrew, M.; Thompson, W.; Blunt, M.J.; Bijeljic, B. Optimization of image quality and acquisition time for lab-based X-ray microtomography using an iterative reconstruction algorithm. Adv. Water Resour. 2018, 115, 112–124. [Google Scholar] [CrossRef]
- Zhuge, X.; Palenstijn, W.J.; Batenburg, K.J. TVR-DART: A More Robust Algorithm for Discrete Tomography From Limited Projection Data With Automated Gray Value Estimation. IEEE Trans. Image Process. 2016, 25, 455–468. [Google Scholar] [CrossRef]
- Myers, G.R.; Kingston, A.M.; Varslot, T.K.; Turner, M.L.; Sheppard, A.P. Dynamic tomography with a priori information. Appl. Opt. 2011, 50, 3685–3690. [Google Scholar] [CrossRef] [PubMed]
- Brabant, L.; Vlassenbroeck, J.; De Witte, Y.; Cnudde, V.; Boone, M.N.; Dewanckele, J.; Van Hoorebeke, L. Three-Dimensional Analysis of High-Resolution X-Ray Computed Tomography Data with Morpho+. Microsc. Microanal. 2011, 17, 252–263. [Google Scholar] [CrossRef] [PubMed]
- Canny, J. A computational approach to edge detection. IEEE Trans. Pattern Anal. Mach. Intell. 1986, 679–698. [Google Scholar] [CrossRef]
- Prewitt, J.M.S. Object enhancement and extraction. Pict. Process. Psychopictorics 1970, 10, 15–19. [Google Scholar]
- Sobel, I. An Isotropic 3x3 Image Gradient Operator. 2014. Available online: https://www.researchgate.net/publication/239398674_An_Isotropic_3x3_Image_Gradient_Operator (accessed on 14 March 2019).
- Chun, B.; Xiaoyue, L. The edge detection technology of CT image for study the growth of rock crack. In Proceedings of the 2009 ISECS International Colloquium on Computing, Communication, Control, and Management, Sanya, China, 8–9 August 2009; Volume 4, pp. 286–288. [Google Scholar]
- Schlüter, S.; Sheppard, A.; Brown, K.; Wildenschild, D. Image processing of multiphase images obtained via X-ray microtomography: A review. Water Resour. Res. 2014, 50, 3615–3639. [Google Scholar] [CrossRef]
- Martínez-Martínez, J.; Benavente, D.; Del Cura, M.A.G. Petrographic quantification of brecciated rocks by image analysis. Application to the interpretation of elastic wave velocities. Eng. Geol. 2007, 90, 41–54. [Google Scholar] [CrossRef]
- Kaur, D.; Kaur, Y. Various Image Segmentation Techniques: A Review. Int. J. Comput. Sci. Mob. Comput. 2014, 3, 809–814. [Google Scholar]
- Yogamangalam, R.; Karthikeyan, B. Segmentation techniques comparison in image processing. Int. J. Eng. Technol. 2013, 5, 307–313. [Google Scholar]
- Zaitoun, N.M.; Aqel, M.J. Survey on image segmentation techniques. Procedia Comput. Sci. 2015, 65, 797–806. [Google Scholar] [CrossRef]
- Sezgin, M.; Sankur, B. Survey over image thresholding techniques and quantitative performance evaluation. J. Electron. Imaging 2004, 13, 146–166. [Google Scholar]
- Kaczmarczyk, J.; Dohnalik, M.; Zalewska, J.; Cnudde, V. The Interpretation of X-ray Computed Microtomography Images of Rocks as an Application of Volume Image Processing and Analysis. 2010. Available online: https://biblio.ugent.be/publication/1020385/file/1020401.pdf (accessed on 14 March 2019).
- Otsu, N. A threshold selection method from gray-level histograms. IEEE Trans. Syst. Man. Cybern. 1979, 9, 62–66. [Google Scholar] [CrossRef]
- Lin, Q.; Barker, D.J.; Dobson, K.J.; Lee, P.D.; Neethling, S.J. Modelling particle scale leach kinetics based on X-ray computed micro-tomography images. Hydrometallurgy 2016, 162, 25–36. [Google Scholar] [CrossRef]
- Lin, Q.; Neethling, S.J.; Dobson, K.J.; Courtois, L.; Lee, P.D. Quantifying and minimising systematic and random errors in X-ray micro-tomography based volume measurements. Comput. Geosci. 2015, 77, 1–7. [Google Scholar] [CrossRef]
- Fan, S.-K.S.; Lin, Y. A multi-level thresholding approach using a hybrid optimal estimation algorithm. Pattern Recognit. Lett. 2007, 28, 662–669. [Google Scholar] [CrossRef]
- Huang, D.-Y.; Wang, C.-H. Optimal multi-level thresholding using a two-stage Otsu optimization approach. Pattern Recognit. Lett. 2009, 30, 275–284. [Google Scholar] [CrossRef]
- Kapur, J.N.; Sahoo, P.K.; Wong, A.K.C. A new method for gray-level picture thresholding using the entropy of the histogram. Comput. Vis. Graphics Image Process. 1985, 29, 273–285. [Google Scholar] [CrossRef]
- Gonzalez, R.C.; Woods, R.E. Digital Image Processing; Prentice Hall: Upper Saddle River, NJ, USA, 2002. [Google Scholar]
- Ketcham, R.A. Computational methods for quantitative analysis of three-dimensional features in geological specimens. Geosphere 2005, 1, 32–41. [Google Scholar] [CrossRef]
- Meyer, F.; Beucher, S. Morphological segmentation. J. Vis. Commun. Image Represent. 1990, 1, 21–46. [Google Scholar] [CrossRef]
- Wang, D.; Vallotton, P. Improved marker-controlled watershed segmentation with local boundary priors. In Proceedings of the 2010 25th International Conference of Image and Vision Computing New Zealand, Queenstown, New Zealand, 8–9 November 2010; pp. 1–6. [Google Scholar]
- Vincent, L.; Soille, P. Watersheds in digital spaces: An efficient algorithm based on immersion simulations. IEEE Trans. Pattern Anal. Mach. Intell. 1991, 6, 583–598. [Google Scholar] [CrossRef]
- Weickert, J. Efficient image segmentation using partial differential equations and morphology. Pattern Recognit. 2001, 34, 1813–1824. [Google Scholar] [CrossRef]
- Jung, C.R.; Scharcanski, J. Robust watershed segmentation using wavelets. Image Vis. Comput. 2005, 23, 661–669. [Google Scholar] [CrossRef]
- Belaid, L.J.; Mourou, W. Image segmentation: A watershed transformation algorithm. Image Anal. Stereol. 2011, 28, 93–102. [Google Scholar] [CrossRef]
- Lin, C.L.; Miller, J.D. Advances in X-ray computed tomography (CT) for improved coal washability analysis. In Proceedings of the 16th International Coal Preparation Congress, ICPC 2010, Lexington, KY, USA, 25–30 April 2010. [Google Scholar]
- Lin, C.L.; Videla, A.R.; Yu, Q.; Miller, J.D. Characterization and analysis of Porous, Brittle solid structures by X-ray micro computed tomography. JOM 2010, 62, 86–89. [Google Scholar] [CrossRef]
- Kong, D.; Fonseca, J. Quantification of the morphology of shelly carbonate sands using 3D images. Géotechnique 2017, 68, 249–261. [Google Scholar] [CrossRef]
- Shi, Y.; Yan, W.M. Segmentation of irregular porous particles of various sizes from X-ray microfocus computer tomography images using a novel adaptive watershed approach. Géotechnique Lett. 2015, 5, 299–305. [Google Scholar] [CrossRef]
- Baklanova, O.E.; Baklanov, M.A. Methods and Algorithms of Image Recognition for Mineral Rocks in the Mining Industry. In International Conference in Swarm Intelligence; Springer: Berlin/Heidelberg, Germany, 2016; pp. 253–262. [Google Scholar]
- Duran, B.S.; Odell, P.L. Cluster Analysis: A Survey; Springer Science & Business Media: Berlin/Heidelberg, Germany, 2013; Volume 100. [Google Scholar]
- Baklanova, O.E.; Shvets, O.Y. Methods and algorithms of cluster analysis in the mining industry: Solution of tasks for mineral rocks recognition. In Proceedings of the 2014 International Conference on Signal Processing and Multimedia Applications (SIGMAP), Vienna, Austria, 28–30 August 2014; pp. 165–171. [Google Scholar]
- Arthur, D.; Vassilvitskii, S. k-means++: The advantages of careful seeding. In Proceedings of the Eighteenth Annual ACM-SIAM Symposium on Discrete Algorithms; Society for Industrial and Applied Mathematics: Philadelphia, PA, USA, 2007; pp. 1027–1035. [Google Scholar]
- Chauhan, S.; Rühaak, W.; Anbergen, H.; Kabdenov, A.; Freise, M.; Wille, T.; Sass, I. Phase segmentation of X-ray computer tomography rock images using machine learning techniques: An accuracy and performance study. Solid Earth 2016, 7, 1125–1139. [Google Scholar] [CrossRef]
- Pal, M. Random forest classifier for remote sensing classification. Int. J. Remote Sens. 2005, 26, 217–222. [Google Scholar] [CrossRef]
- Hepner, G.; Logan, T.; Ritter, N.; Bryant, N. Artificial neural network classification using a minimal training set- Comparison to conventional supervised classification. Photogramm. Eng. Remote Sens. 1990, 56, 469–473. [Google Scholar]
- Koch, P.-H. Particle Generation for Geometallurgical Process Modeling. Ph.D. Thesis, Minerals and Metallurgical Engineering, Department of Civil, Environmental and Natural Resources Engineering, Luleå University of Technology, Luleå, Sweden, 2017. [Google Scholar]
- LeCun, Y.; Bottou, L.; Bengio, Y.; Haffner, P. Gradient-based learning applied to document recognition. Proc. IEEE 1998, 86, 2278–2324. [Google Scholar] [CrossRef]
- Krizhevsky, A.; Sutskever, I.; Hinton, G.E. Imagenet classification with deep convolutional neural networks. Advances in Neural Information Processing Systems. 2012, pp. 1097–1105. Available online: https://papers.nips.cc/paper/4824-imagenet-classification-with-deep-convolutional-neural-networks.pdf (accessed on 14 March 2019).
- Szegedy, C.; Liu, W.; Jia, Y.; Sermanet, P.; Reed, S.; Anguelov, D.; Erhan, D.; Vanhoucke, V.; Rabinovich, A. Going Deeper with Convolutions. 2014. Available online: https://arxiv.org/pdf/1409.4842.pdf (accessed on 14 March 2019).
- Vapnik, V.; Guyon, I.; Hastie, T. Support vector machines. Mach. Learn. 1995, 20, 273–297. [Google Scholar]
- Anthony, G.; Greg, H.; Tshilidzi, M. Classification of Images Using Support Vector Machines. 2007. Available online: https://arxiv.org/ftp/arxiv/papers/0709/0709.3967.pdf (accessed on 14 March 2019).
- Chapelle, O. Support Vector Machines et Classification D’Images. Master’s Thesis, Ecole Normale Supérieure de Lyon, Lyon, France, 1998. [Google Scholar]
- Cortina-Januchs, M.G.; Quintanilla-Dominguez, J.; Vega-Corona, A.; Tarquis, A.M.; Andina, D. Detection of pore space in CT soil images using artificial neural networks. Biogeosciences 2011, 8, 279–288. [Google Scholar] [CrossRef]
- Arganda-Carreras, I.; Kaynig, V.; Rueden, C.; Eliceiri, K.W.; Schindelin, J.; Cardona, A.; Sebastian Seung, H. Trainable Weka Segmentation: A machine learning tool for microscopy pixel classification. Bioinformatics 2017, 33, 2424–2426. [Google Scholar] [CrossRef]
- Wang, H.-Y.; Yang, Q.; Qin, H.; Zha, H. Dirichlet component analysis: Feature extraction for compositional data. In Proceedings of the 25th international conference on Machine Learning, Helsinki, Finland, 5–9 July 2008; pp. 1128–1135. [Google Scholar]
- Lobos, R.; Silva, J.F.; Ortiz, J.M.; Díaz, G.; Egaña, A. Analysis and Classification of Natural Rock Textures based on New Transform-based Features. Math. Geosci. 2016, 48, 835–870. [Google Scholar] [CrossRef]
- Parian, M.; Mwanga, A.; Lamberg, P.; Rosenkranz, J. Ore texture breakage characterization and fragmentation into multiphase particles. Powder Technol. 2018, 327, 57–69. [Google Scholar] [CrossRef]
- Pérez-Barnuevo, L.; Pirard, E.; Castroviejo, R. Textural descriptors for multiphasic ore particles. Image Anal. Stereol. 2012, 31, 175–184. [Google Scholar] [CrossRef]
- Zhang, J.; Subasinghe, N. Extracting ore texture information using image analysis. Trans. Inst. Min. Metall. Sect. C Miner. Process. Extr. Metall. 2012, 121, 123–130. [Google Scholar] [CrossRef]
- Borgefors, G. Distance transformations in digital images. Comput. Vis. Graphics Image Process. 1986, 34, 344–371. [Google Scholar] [CrossRef]
- Borgefors, G. Distance transformations in arbitrary dimensions. Comput. Vis. Graphics Image Process. 1984, 27, 321–345. [Google Scholar] [CrossRef]
- Pirard, E.; Califice, A.; Léonard, A.; Gregoire, M. Multiscale Shape Analysis of Particles in 3D Using the Calypter. 2009. Available online: https://orbi.uliege.be/bitstream/2268/22089/1/PUB_09_01_EP%203D%20calypter%20v21.pdf (accessed on 14 March 2019).
- Fagan-Endres, M.A.; Cilliers, J.J.; Sederman, A.J.; Harrison, S.T.L. Spatial variations in leaching of a low-grade, low-porosity chalcopyrite ore identified using X-ray μCT. Miner. Eng. 2017, 105, 63–68. [Google Scholar] [CrossRef]
- Zhao, B.; Wang, J.; Coop, M.R.; Viggiani, G.; Jiang, M. An investigation of single sand particle fracture using X-ray micro-tomography. Géotechnique 2015, 65, 625–641. [Google Scholar] [CrossRef]
- Lin, Q.; Neethling, S.J.; Courtois, L.; Dobson, K.J.; Lee, P.D. Multi-scale quantification of leaching performance using X-ray tomography. Hydrometallurgy 2016, 164, 265–277. [Google Scholar] [CrossRef]
- Wu, A.; Yang, B.; Xi, Y.; Jiang, H. Pore structure of ore granular media by computerized tomography image processing. J. Cent. South Univ. Technol. 2007, 14, 220–224. [Google Scholar] [CrossRef]
- Serra, J. Image Analysis and Mathematical Morphology; Academic Press, Inc.: Cambridge, MA, USA, 1983; ISBN 0126372403. [Google Scholar]
- Serra, J.; Soille, P. Mathematical Morphology and Its Applications to Image Processing; Springer Science & Business Media: Berlin/Heidelberg, Germany, 2012; Volume 2, ISBN 9401110409. [Google Scholar]
- Pierret, A.; Capowiez, Y.; Belzunces, L.; Moran, C.J. 3D reconstruction and quantification of macropores using X-ray computed tomography and image analysis. Geoderma 2002, 106, 247–271. [Google Scholar] [CrossRef]
- Faessel, M.; Delisée, C.; Bos, F.; Castéra, P. 3D Modelling of random cellulosic fibrous networks based on X-ray tomography and image analysis. Compos. Sci. Technol. 2005, 65, 1931–1940. [Google Scholar] [CrossRef]
- Lux, J.; Delisée, C.; Thibault, X. 3D characterization of wood based fibrous materials: An application. Image Anal. Stereol. 2011, 25, 25–35. [Google Scholar] [CrossRef]
- Vogel, H.-J.; Weller, U.; Schlüter, S. Quantification of soil structure based on Minkowski functions. Comput. Geosci. 2010, 36, 1236–1245. [Google Scholar] [CrossRef]
- De Berg, M.; Van Kreveld, M.; Overmars, M.; Schwarzkopf, O.C. Computational geometry. In Computational Geometry; Springer: Berlin/Heidelberg, Germany, 2000; pp. 1–17. [Google Scholar]
- Vecchio, I.; Schladitz, K.; Godehardt, M.; Heneka, M.J. 3D Geometric characterization of particles applied to technical cleanliness. Image Anal. Stereol. 2012, 31, 163–174. [Google Scholar] [CrossRef]
- Pamukcu, A.S.; Gualda, G.A.R.; Rivers, M.L. Quantitative 3D petrography using X-ray tomography 4: Assessing glass inclusion textures with propagation phase-contrast tomography. Geosphere 2013, 9, 1704–1713. [Google Scholar] [CrossRef]
- Van Dalen, G.; Koster, M.W. 2D & 3D Particle Size Analysis of Micro-CT Images; Unilever Research and Development Netherlands: Vlaardingen, The Netherlands, 2012. [Google Scholar] [CrossRef]
- Parisatto, M.; Turina, A.; Cruciani, G.; Mancini, L.; Peruzzo, L.; Cesare, B. Three-dimensional distribution of primary melt inclusions in garnets by X-ray microtomography. Am. Mineral. 2018, 103, 911–926. [Google Scholar] [CrossRef]
- Duran, C.J.; Barnes, S.J.; Pleše, P.; Kudrna Prašek, M.; Zientek, M.L.; Pagé, P. Fractional crystallization-induced variations in sulfides from the Noril’sk-Talnakh mining district (polar Siberia, Russia). Ore Geol. Rev. 2017, 90, 326–351. [Google Scholar] [CrossRef]
- Wang, L.B.; Frost, J.D.; Lai, J.S. Three-dimensional digital representation of granular material microstructure from X-ray Tomography imaging. J. Comput. Civ. Eng. 2004, 18, 28–35. [Google Scholar] [CrossRef]
- Masad, E.; Saadeh, S.; Al-Rousan, T.; Garboczi, E.; Little, D. Computations of particle surface characteristics using optical and X-ray CT images. Comput. Mater. Sci. 2005, 34, 406–424. [Google Scholar] [CrossRef]
- Garboczi, E.J. Three-dimensional mathematical analysis of particle shape using X-ray tomography and spherical harmonics: Application to aggregates used in concrete. Cem. Concr. Res. 2002, 32, 1621–1638. [Google Scholar] [CrossRef]
- Cepuritis, R.; Garboczi, E.J.; Jacobsen, S.; Snyder, K.A. Comparison of 2-D and 3-D shape analysis of concrete aggregate fines from VSI crushing. Powder Technol. 2017, 309, 110–125. [Google Scholar] [CrossRef]
- Garboczi, E.J.; Bullard, J.W. 3D analytical mathematical models of random star-shape particles via a combination of X-ray computed microtomography and spherical harmonic analysis. Adv. Powder Technol. 2017, 28, 325–339. [Google Scholar] [CrossRef]
- Nava, E. Wavelets: Theory and Applications; University of Malaga: Malaga, Spain, 2006. [Google Scholar]
- Mulcahy, C. Image compression using the Haar wavelet transform. Spelman Sci. Math. J. 1997, 1, 22–31. [Google Scholar]
- Antonini, M.; Barlaud, M.; Mathieu, P.; Daubechies, I. Image coding using wavelet transform. IEEE Trans. Image Process. 1992, 1, 205–220. [Google Scholar] [CrossRef]
- Walker, J.S. Wavelet-based image processing. Appl. Anal. 2006, 85, 439–458. [Google Scholar] [CrossRef]
- Lepistö, L.; Kunttu, I.; Visa, A. Rock image classification using color features in Gabor space. J. Electron. Imaging 2005, 14, 040503. [Google Scholar] [CrossRef]
- Tessier, J.; Duchesne, C.; Bartolacci, G. A machine vision approach to on-line estimation of run-of-mine ore composition on conveyor belts. Miner. Eng. 2007, 20, 1129–1144. [Google Scholar] [CrossRef]
- Perez, C.A.; Estévez, P.A.; Vera, P.A.; Castillo, L.E.; Aravena, C.M.; Schulz, D.A.; Medina, L.E.; Estévez, P.A.; Vera, P.A.; Castillo, L.E.; et al. Ore grade estimation by feature selection and voting using boundary detection in digital image analysis. Int. J. Miner. Process. 2011, 101, 28–36. [Google Scholar] [CrossRef]
- Katunin, A.; Dańczak, M.; Kostka, P. Automated identification and classification of internal defects in composite structures using computed tomography and 3D wavelet analysis. Arch. Civ. Mech. Eng. 2015, 15, 436–448. [Google Scholar] [CrossRef]
- Ojala, T.; Pietikäinen, M.; Harwood, D. A comparative study of texture measures with classification based on featured distributions. Pattern Recognit. 1996, 29, 51–59. [Google Scholar] [CrossRef]
- Sorensen, L.; Shaker, S.B.; De Bruijne, M. Quantitative analysis of pulmonary emphysema using local binary patterns. IEEE Trans. Med. Imaging 2010, 29, 559–569. [Google Scholar] [CrossRef]
- Murala, S.; Maheshwari, R.P.; Balasubramanian, R. Directional binary wavelet patterns for biomedical image indexing and retrieval. J. Med. Syst. 2012, 36, 2865–2879. [Google Scholar] [CrossRef]
- Rahimov, K.; AlSumaiti, A.M.; AlMarzouqi, H.; Jouini, M.S. Use of Local Binary Pattern in Texture Classification of Carbonate Rock Micro-CT Images. In Proceedings of the SPE Kingdom of Saudi Arabia Annual Technical Symposium and Exhibition, Dammam, Saudi Arabia, 24–27 April 2017. [Google Scholar]
- Haralick, R.M.; Shanmugam, K. Textural features for image classification. IEEE Trans. Syst. Man. Cybern. 1973, 3, 610–621. [Google Scholar] [CrossRef]
© 2019 by the authors. Licensee MDPI, Basel, Switzerland. This article is an open access article distributed under the terms and conditions of the Creative Commons Attribution (CC BY) license (http://creativecommons.org/licenses/by/4.0/).

