1. Introduction
Rare earth elements and yttrium (REY, or REE if Y is excluded) in coal and coal combustion products (CCPs), e.g., fly and bottom ash, have attracted much attention in recent years, not only because of the high international demand for these technologically important elements, but also because of the restrictions on export from China [
1,
2]. Seredin and Dai [
3] and Dai et al. [
4] have shown that coal has high potential as a REY source, given that the average concentration of REY oxides (REO) in world coal ash is 485 μg/g, which is half the cut-off grade of REO in CCPs (1000 μg/g). In some cases, CCPs contain >1000 μg/g REO; thus, they could constitute an economically viable source for REY extraction. Previous investigations have shown that some coals from China [
5,
6,
7], Russia [
3,
8], and the USA contain high concentrations of REY [
9,
10,
11], comparable to or even higher than those of conventional REY deposits [
3]. Other studies concerning REY resources [
12,
13], modes of REY occurrence in coal and CCPs [
14,
15], and extraction technology [
16] have also suggested the great potential of coal as REY source.
The REY (including Eu) concentration in coal and CCPs can be determined via several methods, including X-ray fluorescence spectrometry (XRF) [
17,
18], instrumental neutron activation analysis (INAA) [
19,
20,
21], laser-ablation inductively-coupled plasma mass spectroscopy (La-ICP-MS) [
22], sector-field inductively-coupled plasma mass spectroscopy ICP-MS [
23], laser-induced break-down spectrometry [
24,
25,
26], and quadrupole-based ICP-MS (ICP-Q-MS) [
4,
27]. Among these techniques, ICP-Q-MS has mostly been used for determination of REY concentrations in coal and CCPs. This is because of this method’s ability to rapidly, precisely, and accurately measure REY content at very low detection limits in liquid and solid samples, with relatively simple spectra and a wide linearity range [
14,
27,
28,
29]. However, in some cases, Eu concentrations in coal and CCPs cannot be accurately measured by the ICP-Q-MS. This difficulty is attributed to overlapping ion interference (such as those from M
+, MO
+, and/or MOH
+ ions) with Eu, which affects interpretation of the ICP-Q-MS spectra [
30,
31,
32,
33,
34,
35]. Because Ba concentrations in coal and CCPs are generally much higher than those of Eu [
4,
36], the most significant types of interference encountered for Eu in coal and CCPs are due to
135Ba
16O,
134Ba
16OH,
137Ba
16O, and/or
136Ba
16OH interfering with
151Eu and/or
153Eu. For example, the ratio of Ba vs. Eu for world coals is as high as ~882 (with an average concentration of 150 μg/g Ba and 0.47 μg/g Eu) [
36]. Therefore, as noted by Dai et al. [
4], Eu content values in coal and CCPs determined via ICP-Q-MS should be treated with great caution.
Recently, Yan et al. [
27] described a reliable analytical method to avoid Ba-based ion interference with Eu in coal, CCPs, and sedimentary rocks during ICP-Q-MS procedures, which was based on AG50W-X8 cation exchangeable chromatography. Yan et al. [
27] provided an estimated Ba/Eu threshold value of 1000 and demonstrated that the determined Eu concentration should not be used if the Ba/Eu ratio exceeds this threshold value and if no effective action has been taken to avoid Ba interference with Eu. However, the Ba/Eu threshold value estimated by Yan et al. [
27] is an approximation. In a different context, Loges et al. [
35] also suggested an experience-based threshold value, i.e., Ba/Eu > 1000, to exclude interference of Ba with Eu in ICP-Q-MS analyses of Eu content values; however, this is not an accurate estimation either. Determination of an accurate Ba/Eu threshold value is important not only to determine if coal can potentially be used as a REY source, but also to deduce the geological setting of coal formation using Eu as a reliable indicator.
In this paper, we propose a threshold value at which Ba interference with Eu has a meaningful effect on ICP-Q-MS results, which is determined via prediction models created using machine learning algorithms. All Eu and Ba training data employed in this study are from Yan et al. [
27]. Yan’s work [
27] has significantly diminished the inference of
137Ba
16O,
136Ba
17O,
135Ba
18O, and
134Ba
18OH on
153Eu in related samples. They used a Bio-Rad AG50W-x8 cation exchange resin to effectively separate Ba from digested solutions of related coal and CCP samples. The results as presented by Yan et al. [
27] showed that the determination of Ba and Eu in the National Institute of Standards Technology (NIST) standard references of coal and fly ash samples using this method is quite reliable. Also, Yan et al. [
27] showed that the detection limits for Ba and Eu are very low, 0.030 μg/L and 0.006 μg/L, respectively, and the determination coefficient of their calibration curves is >0.9999. Unlike other ICP-Q-MS data which were obtained based on non-separation between Ba and Eu in solutions digested from solid samples (e.g., coal samples in the U.S. Geological Survey’s WoCQI database, Palmer et al. [
37], and in other numerous published papers, for example but not limited to references [
38,
39,
40,
41,
42,
43,
44,
45,
46]), the data by Yan et al. [
27] provided a good opportunity for determining the threshold value using machine learning algorithms for Ba interference with Eu in coal and coal combustion products by ICP-Q-MS. However, there have been some studies to assess the interference of
135Ba
16O,
134Ba
16OH,
137Ba
16O, and/or
136Ba
16OH on
151Eu and/or
153Eu, e.g., determining the yield of Ba-based oxide and hydroxide ions using a single-element solution of Ba (e.g., 500 ng/mL Ba in BaCl
2 solution) and compare the yield of potential interfering irons (e.g.,
135Ba
16O) with the Eu ions (
151Eu) that has the same mass number in a single-element solution of Eu [
47,
48,
49]. A study by Dulski [
48] shows that that 1000 ng/g Ba could cause 0.22 ng/g Eu. Another approach to evaluating the degree of the interference is to analyze the correlation relation between Ba and Eu in the related samples, i.e., a linear Ba-Eu correlation indicating distinct interference of Ba with Eu [
50,
51,
52,
53,
54,
55,
56].
Classification and regression are two typical algorithms in machine learning [
57], with the difference between them being that their target variables are discrete and continuous, respectively [
58]. Here, we employ a model tree [
57] based on linear regression and a regression tree to construct prediction models for this interference. Based on analysis of Ba, Eu, and Ba/Eu, the target variables for Ba interference with Eu are found to be continuous. Thus, we adopt the regression method for prediction of Ba interference with Eu. Empirically, we find that it is difficult to precisely construct a global prediction model using linear regression because of the element data complexity. To overcome this problem, the models are adjusted to split the element data according to many partitions. In the case of the regression tree, classification and regression tree (CART) algorithms [
59] are then applied.
2. Proposed Machine Learning Models for Prediction of Ba Interference with Eu
In this study, machine learning algorithms were used to develop models of Ba interference with Eu in coal. Note that, when a pair of element datasets (e.g., and for Ba and Eu, respectively) is established, the interference between them is difficult to determine. Effective Ba-Eu interference prediction depends on various factors including the element concentration, element interference, and samples.
Here, three machine learning models were used to predict Ba interference with Eu, incorporating linear regression, regression trees, and model trees. The problem of threshold value identification can be represented as the problem of constructing a prediction model between a Ba interference with Eu dataset and Ba, Eu, and Ba/Eu ratio datasets , and respectively.
2.1. Linear Regression Model for Prediction of Ba Interference with Eu
2.1.1. Linear Regression Model
The
and
datasets used in this study were based on a number of coal and ash samples. Furthermore, based on experiments by Yan et al. [
27], we calculated
. The linear regression prediction model for Ba-Eu interference is:
Specifically, the target variable of Ba-Eu interference is related to the different element concentrations, i.e., , and . Linear regression for Ba-Eu interference predicts target interference values. In the model given in Equation (1), the vector is the regression weight. Regression is used to find and hence, the Ba-Eu interference values are predicted.
2.1.2. Ba-Eu Interference Prediction Error
The error is defined as the difference between the actual Ba interference with Eu
and
; i.e.,:
2.1.3. Machine Learning Process for Ba-Eu Interference Prediction
Training: First, all input concentrations of Ba, Eu, and the Ba/Eu ratio values (i.e.,
,
and
), and the interference values of Ba with Eu
are entered. All the input training element data values are prepared and converted into matrices. The interference error of the above elements can also be expressed in matrix notation, as:
This equation is solved using the ordinary least squares method. Hence, is predicted according to the best estimate based on the training element data values.
Prediction: Based on the training process described above, the prediction for Ba-Eu interference can be estimated from the formula:
2.2. Regression Tree Model for Prediction of Ba Interference with Eu
Regression Tree Model
The elements have many features, i.e.,
,
,
and
, and samples
and
. The linear regression model cannot achieve good fitting of
and
with
, as shown in
Figure 1; thus, a nonlinear model emerges. The nonlinear model partitions the element concentrations and Ba-Eu interference. Every partition can be constructed with linear regression models. Note that in
Figure 1, the
x-axis is the ratio of Ba vs. Eu in digested solutions derived from solid samples before Ba is separated from Eu in the solutions; and
y-axis is the Eu concentration contributed from Ba ions.
The steps of the CART algorithm for constructing the regression tree model for prediction of Ba interference with Eu are as follows. The extracted feature is Ba/Eu, i.e.,
. The extracted feature value is the interference of Ba with Eu, i.e.,
. For every
, binary splits are executed to yield two parts
. Then, for every feature in the two different parts,
is calculated based on Equation (5). The process surveys every feature and value to find the best split that minimizes the error:
where
and
are the feature value numbers in the different parts.
Based on the binary split process described above, for every feature , if the feature value is greater than the best split value, we traverse the left side of the regression tree, i.e., the left subtree . If the feature value is lower than the best split value, we traverse the right side of the regression tree, i.e., . For and , we survey every feature and feature value to find the best split until the minimum error is achieved (cf. Equation (5)). The binary split process is recursive for many iterations until the feature cannot be split; then, its feature value is the leaf node. Hence, the Ba interference with the Eu regression trees can be determined.
2.3. Model Tree
The model tree for prediction of Ba interference with Eu is based on the linear regression and regression tree models described above. The steps of the CART algorithm for this model tree are similar to those for the regression tree.
The feature and feature values extracted here are
and
, respectively. For every
, we execute binary splits that yield two parts
. Then, for every feature in the two different parts, we calculate
based on Equation (6). We repeat the process for every feature and every value to find the best split that minimizes the error; i.e.,:
Based on the binary split process above, for every feature , if the feature value is greater than the best split value, we traverse . If the feature value is lower than the best split value, we traverse . For and , we survey every feature and feature value to find the best split until the minimum error is achieved (cf. Equation (6)). The binary split process is recursive for many iterations until the feature cannot be split; then, its feature value is the leaf node. Hence, model trees for Ba interference with Eu can be formed. The difference between the regression tree and model tree is that the leaf nodes of the regression tree are constant sets with , but the leaf nodes of the model tree are linear model sets with .
2.4. Machine Learning Process for Ba-Eu Interference Prediction
Based on the constructed regression tree and model tree for Ba-Eu interference prediction, the proposed machine learning process is implemented as follows.
Training: All , , , and are entered.
Regression tree for prediction: After regression tree training, we perform binary splits to obtain
parts recursively, and obtain a prediction of the Ba-Eu interference
based on determination of the best split that minimizes the error:
Model tree for prediction: After the Ba-Eu interference model tree training, we execute binary splits to obtain
parts recursively, and obtain
based on determination of the best split that minimizes the error:
From the above analysis, the model tree for prediction of Ba interference with Eu is selected.
3. Results and Performance Evaluation
3.1. Simulation Setup
To implement the Ba-Eu interference prediction models and calculate the Ba/Eu threshold value, the Python programming language [
60] was used. The prediction models for the Ba interference with Eu were constructed as follows:
(1) All relevant element data were collected, as detailed in
Table 1 and
Table 2.
(2) All input element data were prepared. Note that all Ba, Eu and Ba/Eu concentrations were prepared in a standard Python format list.
(3) The element data were analyzed. Note that all input element data could be analyzed for feature selection. These features included , , , , and .
(4) The algorithm was trained. To achieve the target variable, i.e., the Ba interference with Eu, and the threshold points of the element, i.e., Ba/Eu, we implemented the model tree based on linear regression and the regression tree in Python.
(5) The algorithm was tested. That is, the performance of the interference prediction model obtained in the above step was tested.
3.2. Model Tree for Prediction of Ba Interference with Eu
The input element data sets were prepared as detailed in
Table 3. For execution of the model tree for element interference prediction in Python, two variables were necessary:
tolS and
tolN, the tolerance of the Ba-Eu interference error reduction and the minimum Ba related to Eu data instances in a split, respectively. Note that the model tree was sensitive to the
tolS and
tolN settings. and different settings yielded different prediction models.
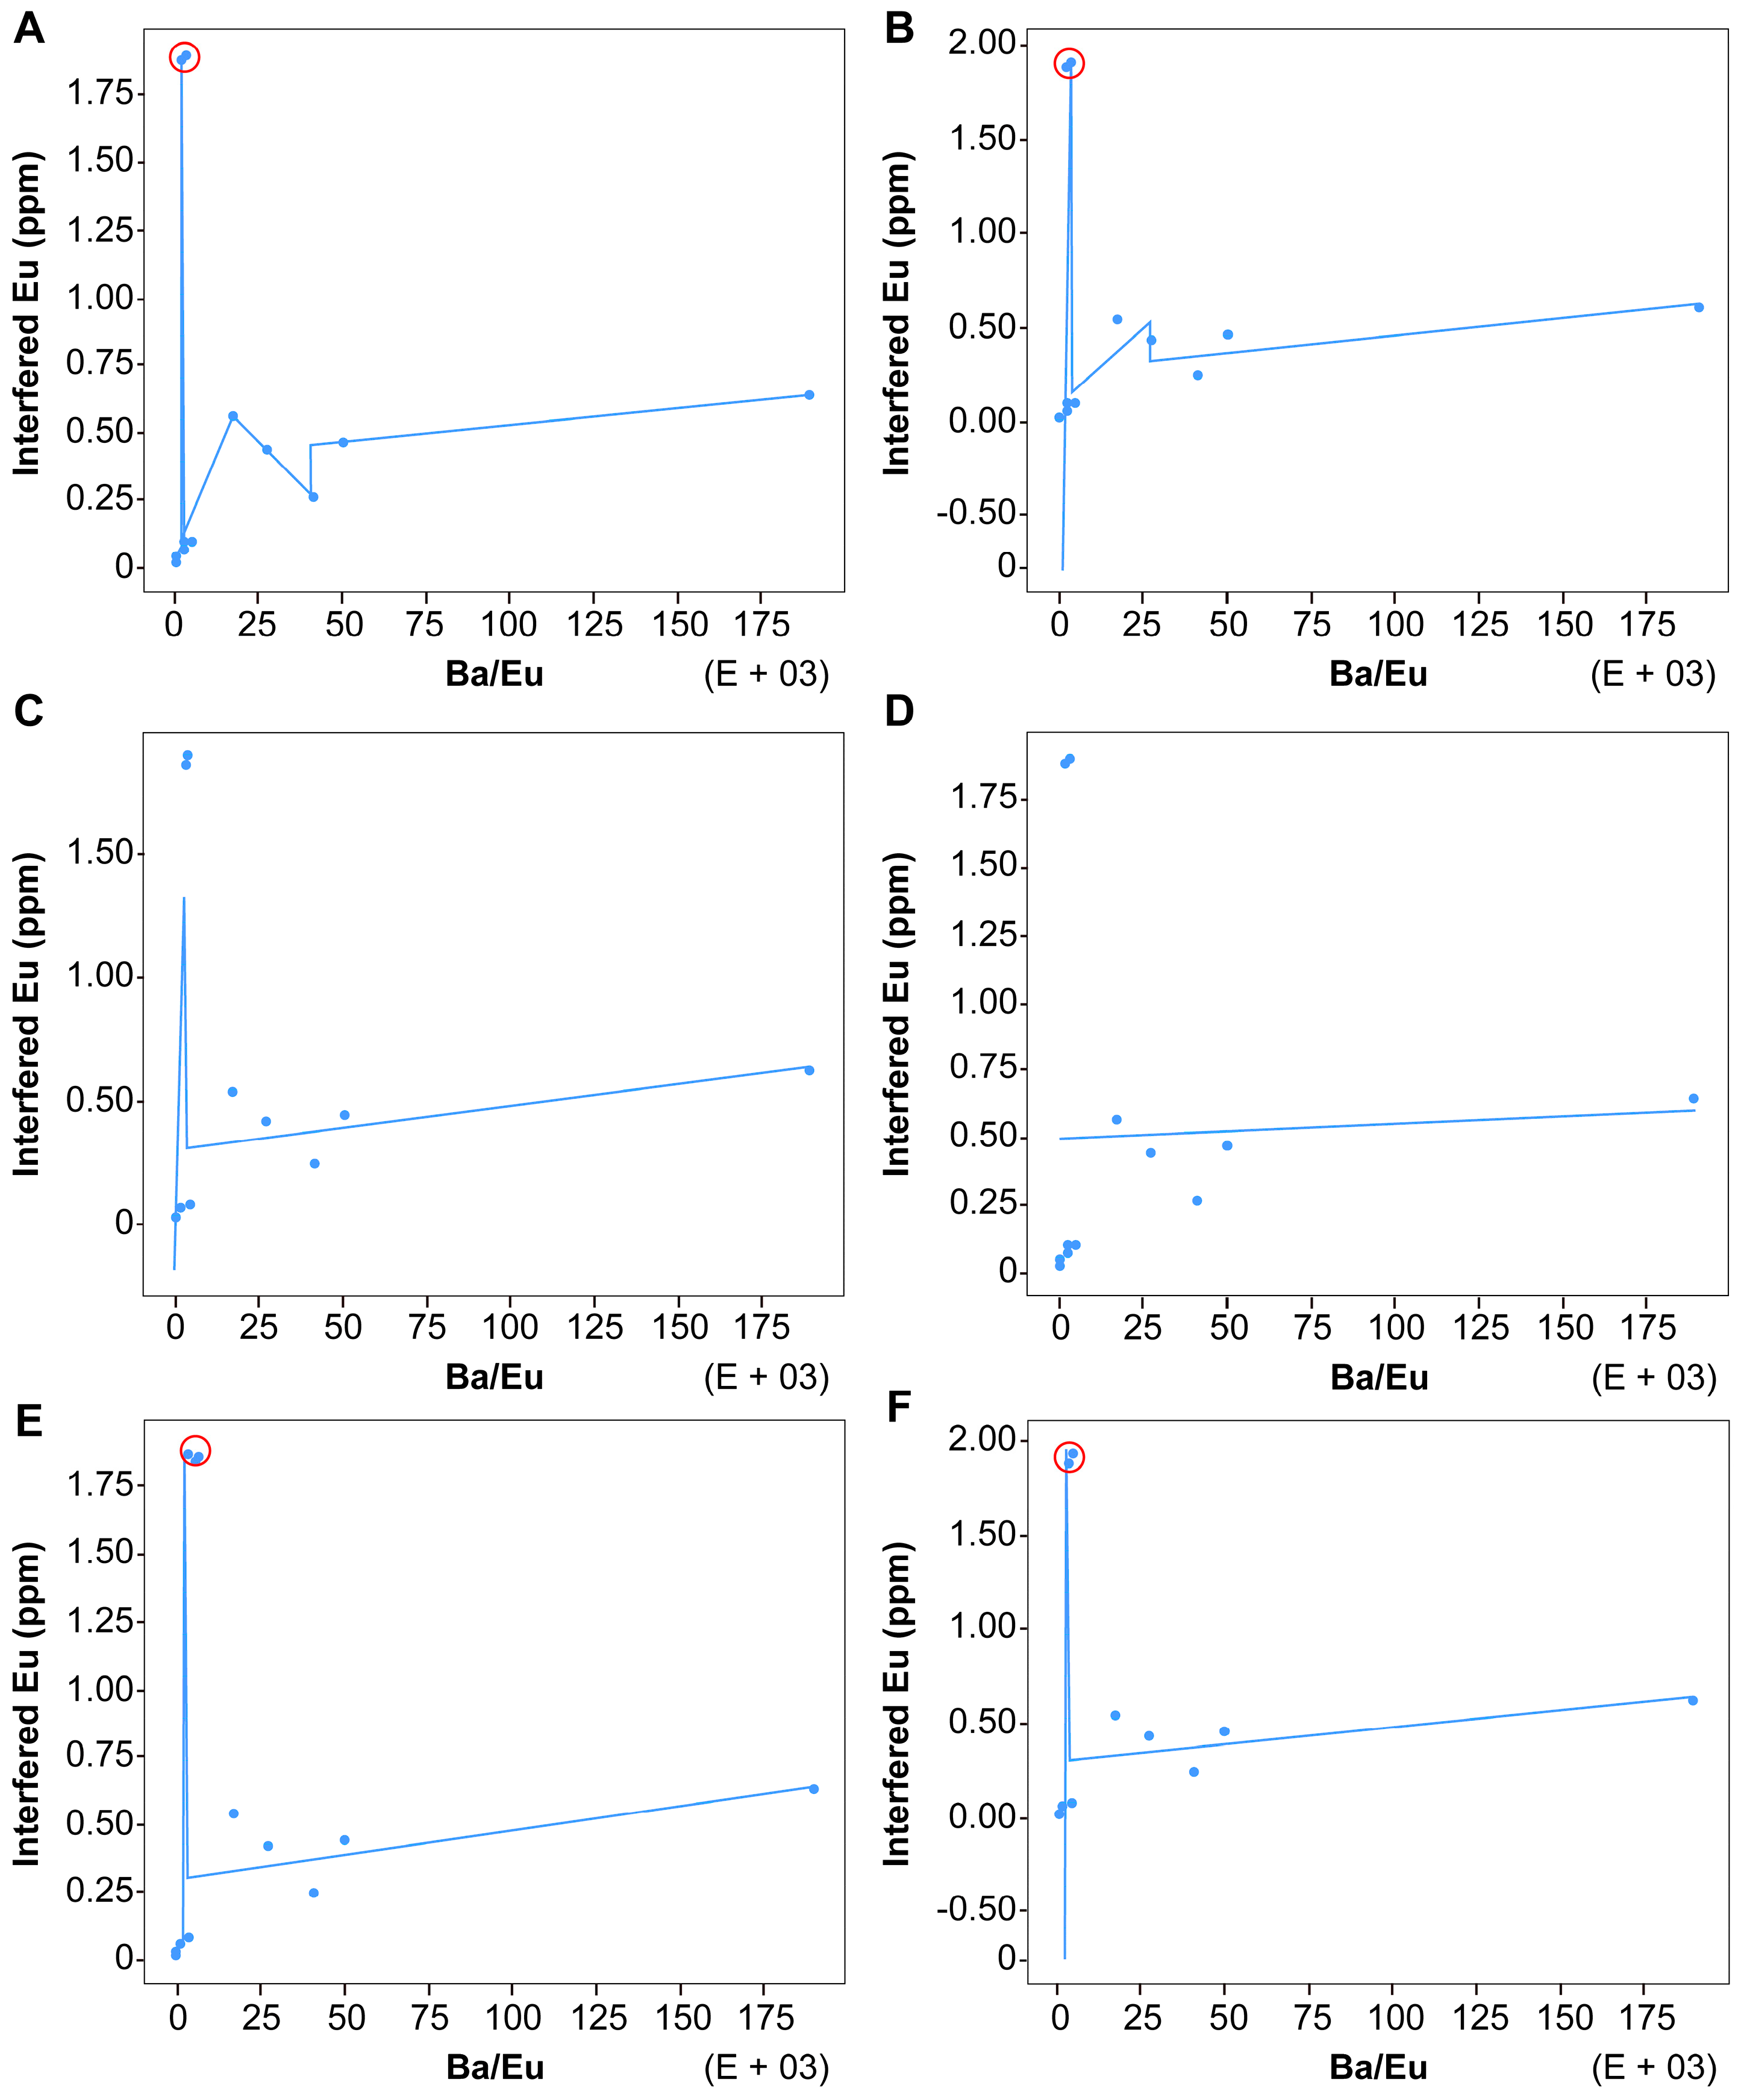
We performed model tree experiments for element interference prediction by inputting rare earth element data sets. All prediction models are detailed in
Table 4. For (
tolS,
tolN) = (0,1) and (0,2), the prediction model for Ba interference with Eu is shown in
Figure 2a. There are six split values: (1) when the Ba/Eu value is greater than 40,726.5, the Ba-Eu interference prediction model is a linear regression, where
(2) when the Ba/Eu value is less than 40,726.5 and greater than 17,344.79, the interference prediction model is a linear regression, with
(3) when the Ba/Eu value is less than 17,344.79 and greater than 2950, the interference prediction model is a linear regression, where
(4) when the Ba/Eu value is less than 2950 and greater than 2247.06, the interference prediction model is a linear regression, with
(5) when the Ba/Eu value is less than 2247.06 and greater than 10.88, the interference prediction model is a linear regression, with
and (6) when the Ba/Eu value is less than 10.88, the interference prediction model is a linear regression, where
.
For (
tolS,
tolN) = (0,3), the model trees for prediction of Ba interference with Eu are shown in
Figure 2b, having four split values: (1) when the Ba/Eu value is greater than 27,144.6, the interference prediction model is a linear regression, with
; (2) when the Ba/Eu value is greater than 2950 and less than 27,144.6, the interference prediction model is a linear regression, with
; (3) when the Ba/Eu value is less than 2950 and greater than 1938.06, the interference prediction model is a linear regression, where
; and (4) when the Ba/Eu value is less than 1938.06, the interference prediction model is a linear regression, where
.
For (
tolS,
tolN) = (0,4), (0,5), (0,6), (1,4), (1,5), (1,6), (2,4), (2,5), (2,6), the model trees for interference prediction of Ba on Eu are shown in
Figure 2c. (1) When the Ba/Eu value is less than 2950, the Ba interference with Eu prediction model is a linear regression, with
; (2) when the Ba/Eu value is greater than 2950 and less than 189,523, the interference prediction model is a linear regression, where
.
For (
tolS,
tolN) = (0,7,…,∞), (1,7,…,∞), (2,7,…,∞), (3,…,∞,1, …,∞), the model trees for prediction of Ba interference with Eu are shown in
Figure 2d.
For (
tolS,
tolN) = (1,1), (1,2), (2,1), and (2,2), the model trees for prediction of Ba interference with Eu are shown in
Figure 2e. (1) When the Ba/Eu value is greater than 2950, the interference prediction model is a linear regression, with
; (2) when the Ba/Eu value is less than 2950 and greater than 2247.06, the interference prediction model is a linear regression, where
; and (3) when the Ba/Eu value is less than 2247.06, the interference prediction model is a linear regression, with
.
For (
tolS,
tolN) = (1,3), (2,3), the model trees for prediction of Ba interference with Eu are shown in
Figure 2f. (1) When the Ba/Eu value is greater than 2950, the interference prediction model is a linear regression, with
; (2) when the Ba/Eu value is less than 2950 and greater than 1938.06, the interference prediction model is a linear regression, where
; and (3) when the Ba/Eu value is less than 1938.06, the interference prediction model is a linear regression, with
.
3.3. Results
For all the model trees of the Ba-Eu interference prediction model illustrated in
Figure 2, the training data sets of the Ba/Eu ratio and the Ba interference with Eu were scattered, as shown in
Figure 1. The points (2900,1.87) and (2950,1.88) were outliers from the other Ba/Eu ratio and Ba interference with Eu data points.
All prediction models with (tolS, tolN) = (0,1), (0,2), (0,3), (1,1), (1,2), (2,1), (2,2), (1,3), and (2,3) contained outlier points of (2950,1.88) and (2900,1.87). The prediction models with (tolS,tolN) = (0,7,…,∞), (1,7,…,∞), (2,7, …,∞), (3,…,∞,1,…,∞) yielded lower prediction accuracy; thus, these models were imprecise.
The optimal values of (tolS, tolN) for the prediction model of Ba interference with Eu were found to be (0,4), (0,5), (0,6), (1,4), (1,5), (1,6), (2,4), (2,5), and (2,6). When the Ba/Eu value was less than 2950, a linear regression was obtained for the interference prediction model, where . Further, when the Ba/Eu value was greater than 2950 and less than 189,523, the interference prediction model was found to be a linear regression, with . From the optimal models, a threshold point value of 363.0370538 could be determined. Note that, when the Ba/Eu value is 363.0370538, it is not necessary to consider the Ba interference with Eu; thus, the Eu values can be interpreted from the data for the investigated samples.
3.4. Performance Evaluation
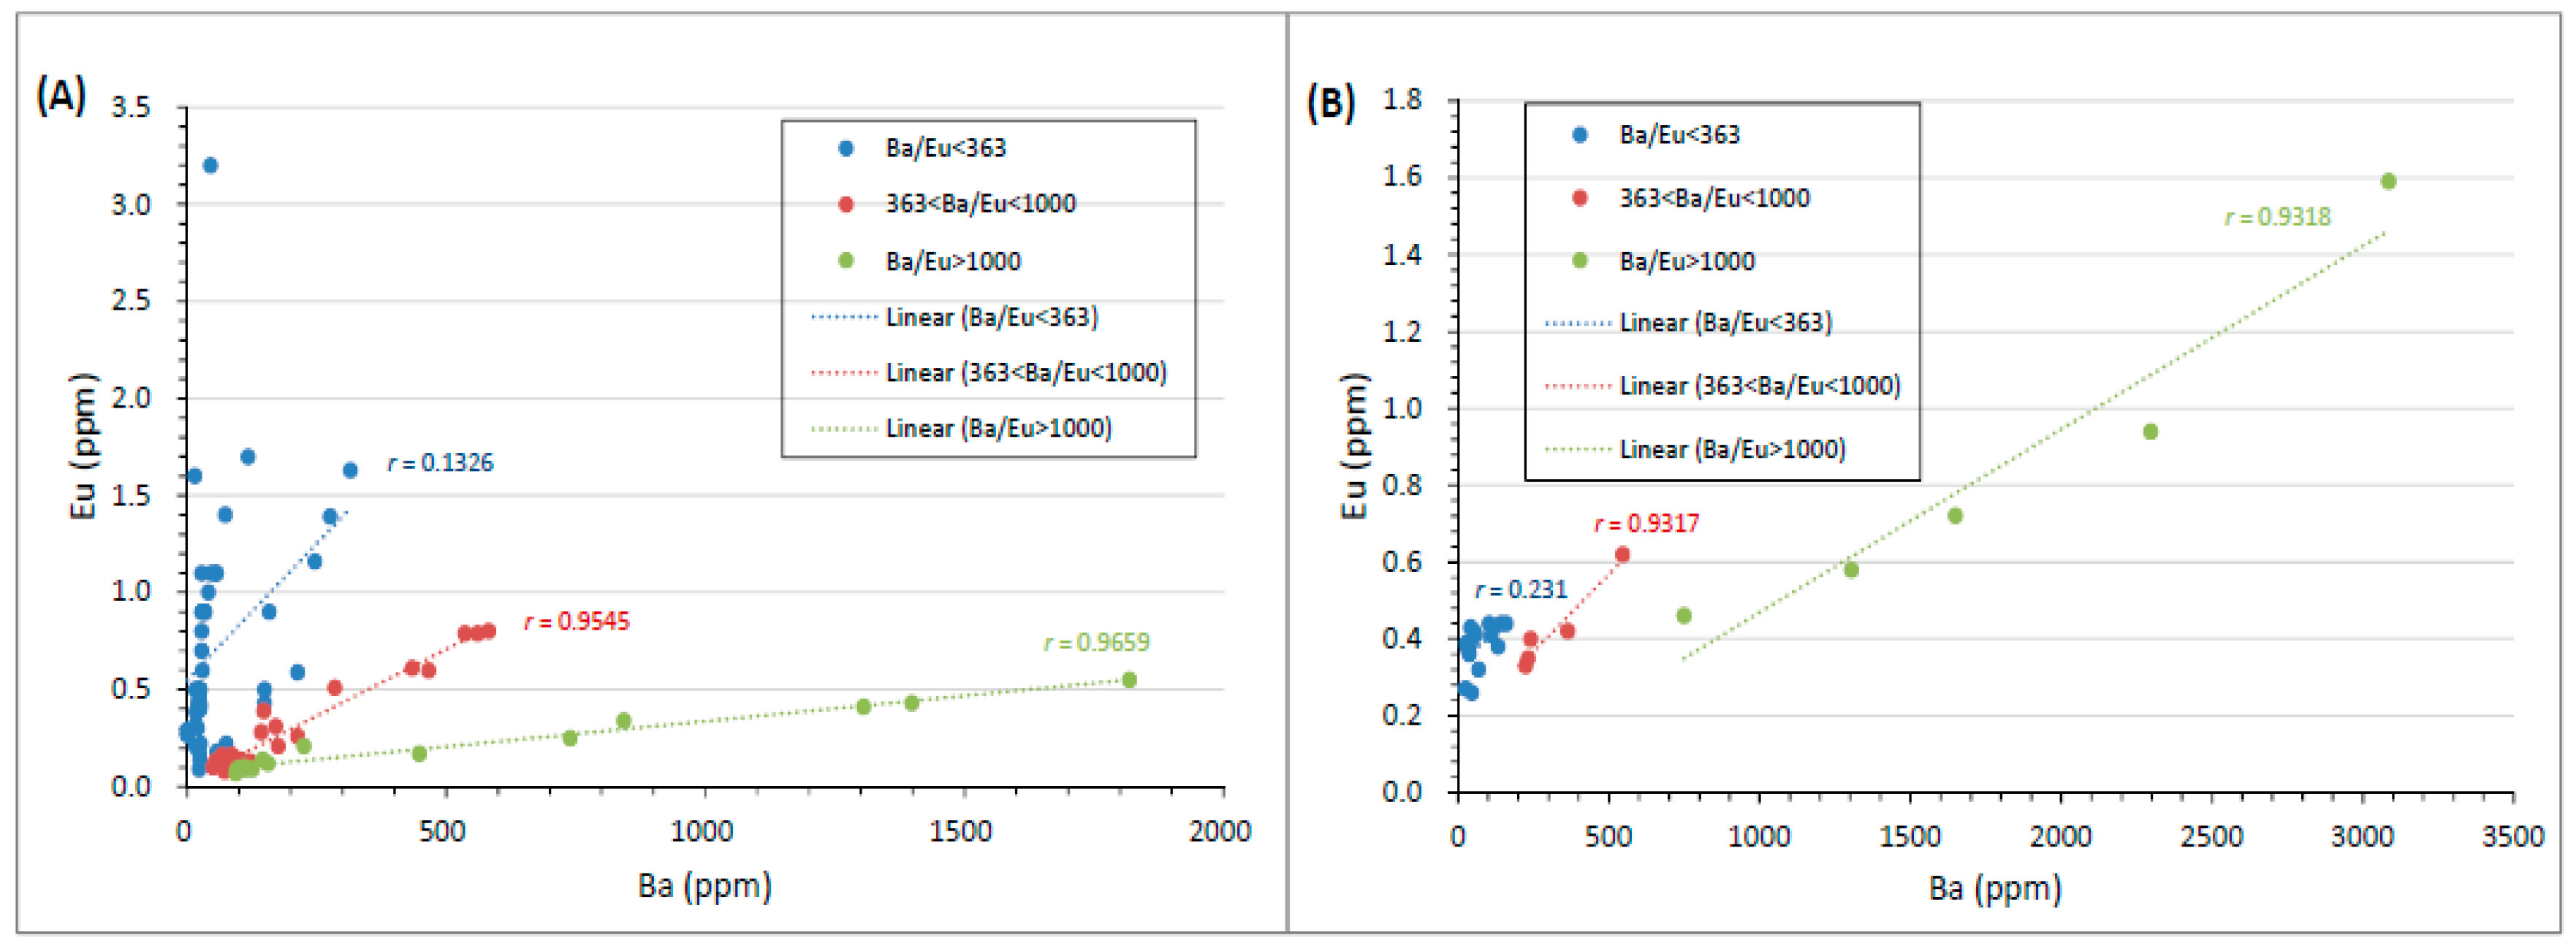
To verify the threshold value for Ba interference with Eu proposed in this paper, a wide dataset of Ba/Eu values covering 2–361 through 379–938 to 1042–3305 from previously published literature was used (
Table 5 and
Table 6) [
62,
64,
65]. The data for the testing were selected from Dai et al. [
62,
64] and Duan et al. [
65], because these data points were all obtained via ICP-Q-MS. Thus, the Ba concentrations were expected to interfere with the Eu concentrations in the samples if the Ba/Eu values exceeded the threshold value, either at 1000 (as proposed in previous works) or at 363 (as proposed in this study). A total of 41 coal bench samples from a boehmite-rich 36.37-m-thick Pennsylvanian coal seam in Inner Mongolia, northern China, were considered, which were reported by Dai et al. [
64]. A total of 60 coal bench samples from three Ge-rich Neogene coals from Lincang, Yunnan Province, southwestern China, were considered, which were reported by Dai et al. [
62]. Further, a total of 27 coal bench samples from Reshuihe, Zhenxiong, Yunnan Province, China, were considered, which were reported by Duan et al. [
65]. The test datasets presented in
Table 5 and
Table 6 could be classified into three groups: Ba/Eu < 363, Ba/Eu = 363–1000, and Ba/Eu > 1000. We compared the threshold value of 363 determined from our proposed model with the value of 1000 proposed by others (e.g., [
4,
27,
35]). Based on
Table 5, the correlation coefficient of Ba and Eu was 0.1326 and 0.9659 when Ba/Eu was < 363 and >1000, respectively. When Ba/Eu varied from 363 to 1000, the Ba and Eu correlation coefficient remained as high as 0.9545, as illustrated in
Figure 3A. Based on
Table 6, the correlation coefficient of Ba and Eu was 0.231 and 0.9318 when Ba/Eu was < 363 and >1000, respectively. When Ba/Eu varied from 363 to 1000, the Ba and Eu correlation coefficient remained as high as 0.9317, as illustrated in
Figure 3B. The distinctively different correlation coefficients for Ba and Eu in the different Ba/Eu ranges show that the threshold value of 363 is more accurate for determination of Ba interference with Eu than the previously proposed value of 1000.


