Abstract
First-principle calculations were used to investigate the surface structure and electronic properties of sulfide (pyrite, galena, and sphalerite) and oxide minerals (hematite, cerussite, and smithsonite). Surface relaxation and Femi energy, as well as projected DOS, are considered. Results show that the surface atoms of the sulfide minerals are more susceptible and more easily affected by the fracture bonds. The sulfide surfaces possess higher chemical potential than the corresponding oxide surfaces, and are more likely to be electron donors in reactions. The S 3p states are the mainly contributing states in the sulfide surface, while that in the oxide surface are O 2p states. The bonds of the sulfide surface have more covalent features and that of the oxide surface are ionic interactions. The O–M (M represents Fe, Pb or Zn) bonds are more stable, as the DOS of the oxide surfaces distribute in the lower energy range.
1. Introduction
Flotation is the most important and versatile mineral separation technique, which provides raw materials for our metallurgical and chemical industries [1]. For the nonferrous metals industry, flotation is an indispensable technique and usually used to enrich minerals, such as lead and zinc minerals. Comparatively speaking, the flotation operation of sulfide minerals is mature and has been well applied in plants around the world. The oxide minerals flotation is more difficult and complex than that of the corresponding sulfide minerals due to the surface hydrophilicity and electrostatic interaction [2]. However, the condition has become much more complicated with the depletion of the easy separation sulfide ore resources and the increasingly stringent environmental costs.
It is not a new topic that different surface properties lead to significant differences in flotation behaviors. The investigations about surface structure and properties of sulfide and oxide minerals are not rare, and corresponding papers include ultraviolet photoelectron spectroscopy (UPS) [3,4], Raman spectroscopy [5], scanning tunneling microscopy (STM) [3,6], time of flight secondary ion mass spectrometry, (ToF–SIMS) [6,7], x-ray photoelectron spectroscopy (XPS) [8,9,10,11], DFT studies [8,9,12,13,14], etc. Recently, reports with density functional theory method (DFT) triggered intense research in this area. G. U. von Oertzen and W. M. Skinner found that the quantum chemical simulation predicts an S 2p core level shift of 0.69 eV between the S bulk and S surface dimers, in good agreement with the 0.6 eV found in XPS measurements [15]. A series of studies by Chen et al. confirmed that the lattice defects in sulfide minerals surface have significant effect on the properties of flotation [16,17,18,19,20,21]. Cong Han et al. found that the O atom on the hemimorphite (110) surface exhibits stronger ability on impeding the collector bond with the Zn atoms than that on the smithsonite (101) surface [13]. The research by Feng et al. showed that the active sites on the cerussite (110) surface are Pb atoms, which mainly contribute by the Pb 6p orbital [9]. However, a comprehensive research about the different structure and electronic properties of sulfide and oxide minerals surfaces has not been conducted.
As the most common and important minerals, lead, zinc, and iron ore widely exist in various sulfide and oxide minerals, which are usually found in mixtures or in combination with other minerals, and their nature differences have troubled us for many years. In this paper, the comparative study of sulfide and oxide minerals surface is considered, and three groups of representative mineral surface models (pyrite (100) and hematite (001) surfaces, galena (100) and cerussite (110) surfaces, as well as sphalerite (110) and smithsonite (101) surfaces) are chosen [22,23,24,25,26]. The surface relaxation, Femi energy and projected density of states (projected DOS) are discussed. It is expected that this research is of high interest for understanding the surface structure and electronic properties of sulfide and oxide minerals, and providing the theoretical basis for surface interaction.
2. Computational Methods and Models
2.1. Computational Methods
All calculations were performed using the density-functional theory (DFT) with Cambridge Serial Total Energy Package [27]. Ultra-soft pseudo-potential was used to describe electron–ion interactions. The exchange correlation functional used in pyrite and smithsonite models was GGA-PBE and GGA-PW91 in hematite and galena models, and GGA-WC and GGA-RPBE in cerussite and sphalerite models, respectively. The plane-wave cutoff energy of 280 eV for pyrite, 220 eV for hematite and galena, 260 eV for cerussite and smithsonite, and 285 eV for sphalerite were used throughout. Monkhorst-Pack k-point sampling density for pyrite and galena was 2 × 2 × 1 mesh, 1 × 1 × 1 for hematite, cerussite, and smithsonite, and 2 × 3 × 1 for sphalerite. The Hubbard U value of 7.5 eV was adopted, and the spin-polarized in the pyrite and hematite models was chosen. The convergence tolerances for geometry optimization calculations were set to the maximum displacement of 0.002 Å, the maximum force of 0.05 eV∙Å−1, the maximum energy change of 2.0 × 10 −5 eV∙atom−1, and the maximum stress of 0.1 GPa, and the SCF convergence tolerance was set to be 2.0 × 10⁻⁶ eV∙atom−1. Valence electron configurations considered in the research were O 2s22p4, C s22p2, S 3s23p4, Fe 3d64s2, Pb 6s26p2, and Zn 3d104s2. The vacuum thickness in the surfaces was 10 angstroms, which could essentially meet the calculation.
2.2. Computational Models
The bulk models were optimized, and the results are in good agreement with the experimental results (see Table 1). The surface models were cleaved from the corresponding optimized bulk models and the most stable surface models were chosen.

Table 1.
The comparison between the lattice parameters of the optimized model and the experimental results of the bulk.
As shown in Figure 1a, pyrite (100) surface with twelve atomic layers is constructed and the coordination numbers of the exposed Fe and S atoms are five and three, respectively. Slab model with 18 atomic layers of hematite (001) surface is shown in Figure 1b. Each Fe atom of the surface coordinates with three adjacent O atoms, and the exposed O atom connects with the nearest three Fe atoms. Figure 1c shows the slab model of six atomic layers of galena (100) surface. The Pb atom of the surface bond with five S atoms, and the coordination number of the outmost S atom is also five. Figure 1d presents the 12 atomic layers of cerussite (110) surface, and the central Pb atom has a coordination number of four, while the O atom coordinates with adjacent four Pb atoms. As shown in Figure 1e, a sphalerite (110) surface with 10 atomic layers is built and each exposed Zn (S) coordinates with adjacent three S (Zn). For the smithsonite (101) surface (see Figure 1f), the exposed outer Zn atom coordinates with five O atoms and the O atom has a coordination number of two.
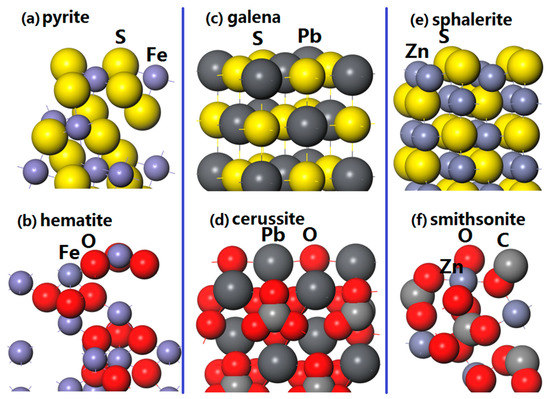
Figure 1.
Slabs of represent minerals surfaces: (a) Pyrite (100) surface; (b) hematite (001) surface; (c) galena (100) surface; (d) cerussite (110) surface; (e) sphalerite (110) surface; (f) smithsonite (101) surface.
3. Results and Discussions
3.1. Surface Relaxation
Surface atoms will rearrange themselves spontaneously when a new surface is cleaved, and this has been confirmed in many reports [28,29,30]. The atom displacements of different surfaces are presented in Table 2.
Table 2.
Atomic displacements of the minerals surface.
For the pyrite (100) surface, the Fe and S atoms converge heavily toward the bulk with the displacements of −4.83 pm and −8.72 pm in the z-direction. Meanwhile, the opposite level displacements indicate that the two atoms move away from each other in the x-y plane. Atomic displacements of the hematite (001) surface are more complex than that of the pyrite (100) surface. The movements of O atoms are −10.82~8.75 pm and −4.17~10.42 pm in the x and y directions. The Fe mainly shows convergence along the z direction with the shift of −55.03 pm, which corresponds to the fact that the three broken bonds of the Fe atom are z-axis of rotation.
Interestingly, the main displacement of atoms in the galena (100) surface is from the z direction, which is related to the unique crystal structure and the broken bonds along the z-direction. The corresponding values of S and Pb atoms are 20.56 pm and 15.24 pm, respectively, which confirms that the severe interlayer atomic interactions and reconstructions occur in the galena (100) surface. Although there are serious bonds breaking in the cerussite (110) surface and the coordination number of Pb is reduced from 7 to 4, the displacements of the Pb and O atoms are rather small and no apparent surface reconstruction is found, implying that the interaction of the O–Pb bond is very strong.
For the sphalerite (110) surface, serious reconstruction can be seen, and the Zn and S atoms are shifted heavily in three-dimensional space. Atomic movement of the S and Zn is as large as 44.20 pm and −22.91 pm in z-direction, while that along the x and y directions also reach about 10 pm respectively, indicating that the S–Zn bond is greatly affected in the (110) surface. In the smithsonite (101) surface, the displacement of each atom is very small and cannot cause remarkable change, though there exists small shift in the surface.
3.2. Femi Energy
The Femi level shows the filling capacity of electrons, which often represents electron or hole chemical potentials, and can be defined as Equation (1):
where μ represents chemical potentials, G is the Gibbs free energy, N refers to the sum of the electrons of the whole system, and T and p represent temperature and pressure of the system, respectively.
The Femi level can reveal the ability of redox of the microsystem and reports show it can be well agreement with standard potential [31]. The higher Fermi energy system is more likely to transfer electrons and lower its Femi level to make the system more stable. As shown in Table 3, the Femi levels of pyrite (100) surface and hematite (001) surface are 0.3687 eV and −2.469 eV, respectively, which means that the pyrite (100) surface has higher chemical potential, and the result is consistent with the measurement of redox potential [32]. For the galena and cerussite system, the Femi energy of the galena (100) surface is 3.957 eV and the corresponding value of the cerussite (110) surface is −0.881 eV, that is, cerussite (110) surface is not as easy to transfer electrons as galena (100) surface, which was proven by Herrera-Urbinaa et al. with the pulp redox potential research [33]. Meanwhile, the Femi energy of the smithsonite (101) surface is also lower than that of the sphalerite (110) surface, indicating that the sphalerite surface has advantage as electron donors in chemical reaction, and this has been reported in many papers [34,35].
Table 3.
The calculated Femi level of the minerals surface.
3.3. Surface Electronic Structure
3.3.1. Surface Properties of Pyrite (100) and Hematite (001) Surfaces
The projected DOSs of S and Fe atoms in the pyrite (100) surface are presented in Figure 2. For the S center, the S–Fe broken bond shows the largest component along the z-direction. Strong splits occur in the S 3p states, the 3px, 3py, and 3pz states are rather different. The 3pz state has more distributions in the upper valence band, and its peaks at −2.25 eV, −0.81 eV, and −0.12 eV are much higher. In the Fe center, the Fe 3px, 3py, and 3pz are also different, and the 3pz state possesses sharp peaks at 0.76 eV, 4.88 eV, and 5.61 eV. The Fe 3d states are divided into three groups, the 3dx2−y2, the 3dz2, and the 3dxy–3dxz–3dyz states. The 3dxy–3dxz–3dyz states are slightly split below Femi level and dominate the VBM, while the CBM are mainly contributed by 3dz2 state. The 3dx2−y2 state is not split, however, the 3dz2 states has more distributions near Femi level, which is proven by the fact that there has high activity along z-direction in the dangling bond.
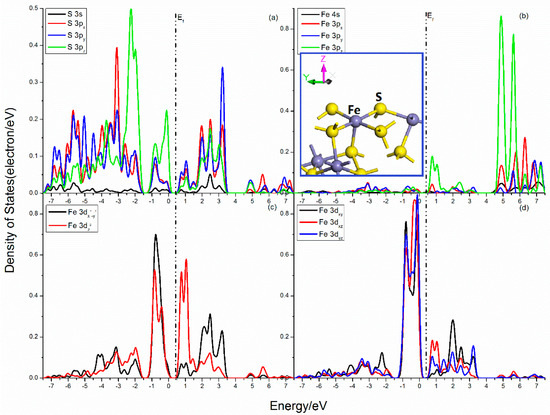
Figure 2.
Projected DOSs of S and Fe atoms of pyrite (100) surface: (a) S 3s, 3px, 3py and 3pz states; (b) Fe 4s, 3px, 3py and 3pz states; (c) Fe 3dx2–y2 and 3dz2 states; (d) Fe 3dxy, 3dxz and 3dyz states.
The overlaps between S and Fe atoms are mainly from the contribution of S 3p and Fe 3p, 3d states. The bonding interactions are in the range of −7.5 to −1.50 eV, which is contributed by S 3p (3px, 3py and 3pz) and Fe 3dx2−y2, 3dz2, as well as 3dxy states. Significant antibonding areas are found near Femi level, and the interaction of S 3pz and Fe 3dxy, 3dxz, and 3dyz states are very strong in the range from −1.25 to 0 eV, while the mixings of the S 3s, 3p, and Fe 3pz, 3dz2, and 3dxz states are in the range from 0.37 to 1.50 eV. Meanwhile, complex mixings are found in the conduction band areas far away from Femi level.
Figure 3 shows the projected DOSs of O and Fe atoms for hematite (001) surface. The O 2p states show obvious localization, and can be divided into two parts, the 2px, 2py states and 2pz state. The 2px, 2py states are slightly disturbed and their curves seem to be similar, while the 2pz state is heavily split and its peak at −5.5eV is sharp. There are three O–Fe bonds broken in the Fe atom and the interactions of the other O–Fe bonds become strong. As shown in Figure 3b, the Fe 3pz state is split heavily below the Femi level and shows apparent difference with the other two 3p states in the range from −7.0 to −3.0 eV. The octahedron field is destroyed, and the 3d states are divided into three parts (Figure 3c,d), the 3dx2−y2 and 3dxy states, the 3dxz and 3dyz states, and the 3dz2 state. The 3dx2−y2 and 3dxy states mainly distribute in high energy with the peaks at −9.3 eV, −8.85 eV, −5.6 eV, and −4.45 eV, the 3dxz and 3dyz states shows a slight split and their peaks are mainly in the range from −9.5 to −4.0eV, while the 3dz2 state is split heavily and its curve is in lower energy with remarkable peaks at −9.65 eV, −7.30 eV, and −6.5 eV.
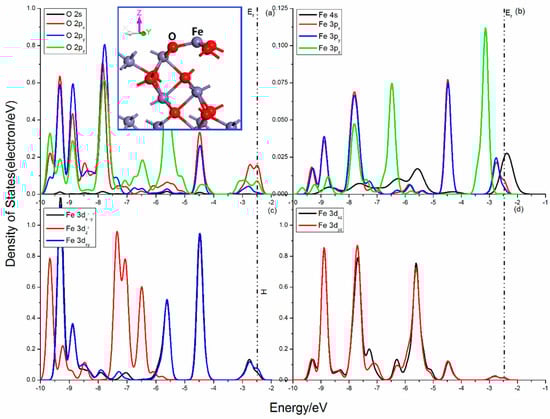
Figure 3.
Projected DOSs of O and Fe for hematite (001) surface: (a) O 2s, 2px, 2py and 2pz states; (b) Fe 4s, 3px, 3py and 3pz states; (c) Fe 3dx2–y2, 3dz2 and 3dxy states; (d) Fe 3dxz and 3dyz states.
The Femi level situates at −2.469 eV. The interactions of O and Fe are mainly in the valence band areas, and the sharp mixing peaks attributing to O 2p and Fe 3p, 3d, and 4s orbitals show more characteristic of localization. Significant bonding interactions are located in the range from −8.25 to −7.25 eV, from −6.25 to −4.75 eV and from −3.5 to −2.0 eV, which is contributed by O 2p and 3dzx, 3dzy states, O 2pz, and Fe 3dx2−y2, 3dxy, 3dyz, 3dxz, states as well as O 2px, 2pz, and Fe 3dx2−y2, 3dxy states.
3.3.2. Surface Properties of Galena (100) and Cerussite (110) Surfaces
Figure 4 shows the projected DOSs of S and Pb atoms in the galena (100) surface. For the central S atom, the only broken bond is along the z-direction, which has less influence on the x-y plane. For the S 3p states, the 3px and 3py states have little split and are equivalent states, as they show the same feature, while the 3pz state is significantly split and its peaks in the upper valence band is quite high and sharp, indicating its great activity. The bond breakage in the Pb center is similar to that in the S atom. The Pb 6s state is broadened and more delocalization, and its curves cover in the range from −7.5 eV to −5.0 eV and from 3.5 eV to 6.7 e V. Three Pb 6p states show same curve outlines, which means that the 6px, 6py, and 6pz states are also degenerate orbitals, and their DOS are located in the range from −0.75 eV to 2.10 eV and from 5.50 eV to 7.30 eV.
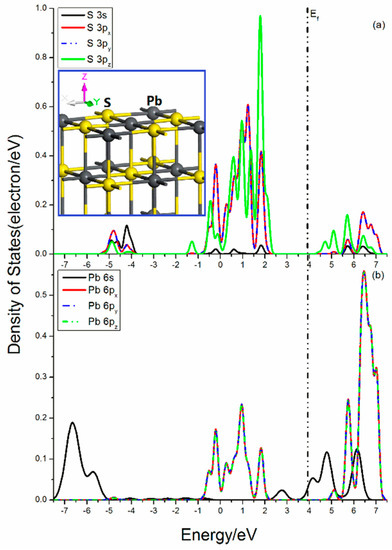
Figure 4.
Projected DOSs of S and Pb of galena (100) surface: (a) S 3s, 3px, 3py and 3pz states; (b) Pb 6s, 6px, 6py and 6pz states.
The interactions between S and Pb are mainly from the contribution of the S 3s, 3p, and Pb 6p states. The bonding mixings distribute in the range from −0.75 eV to 2.10 eV, while the antibonding interactions are located in the energy range from 5.50 eV to 7.30 eV. In addition, there still exist unpaired Pb 6s states near Femi level.
Figure 5 shows the projected DOSs of O and Pb atoms in the cerussite (110) surface. There is only one O–Pb bond broken in the O center. The O 2p states are disturbed heavily, and the 2px, 2py, and 2pz states show rather different distributions. There are significantly peaks contributed by 2py and 2pz states near Femi level, which implies the activity in the x and z direction. The broken O–Pb bonds in the Pb atoms is 3. It is found that the splitting of Pb 6s states is not so significant with three apparent DOS peaks in the range from −10 eV to −6.25 eV. The Pb 6px, 6py, and 6pz states are notably split and the peaks from 2px, 2py, and 2pz states show different distributions, and the 2pz state has a peak near Femi level, but not that high and sharp.
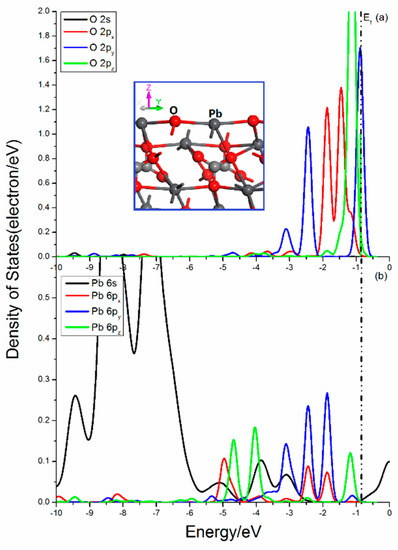
Figure 5.
Projected DOSs of O and Pb of cerussite (110) surface: (a) O 2s, 2px, 2py and 2pz states; (b) Pb 6s, 6px, 6py and 6pz states.
The bonding and antibonding interactions are mainly contributed by O 2p and Pb 6p states in the range from −10 to 0.5 eV. The bonding mixing peaks attributing by O 2p and Pb 6p states in the upper valence band near Femi level are very strong. Meanwhile, the obvious localization of the O 2p and Pb 6p states indicate that the interaction of O and Pb has more ionic bond characteristics.
3.3.3. Surface Properties of Sphalerite (110) and Smithsonite (101) Surfaces
The projected DOSs of S and Zn atoms in the sphalerite (101) surface are shown in Figure 6. The broken S–Zn bond of the S atom make the S 3p orbitals no longer balanced. As shown in Figure 6a, there are significant split of the S 3p states, and the 3py state shows a dramatic difference with the 3px and 3pz states. For the 3px and 3pz states, their curves cover from −5.5 to 1.0 eV and the important peaks scatter in the range from −0.25 to 1.0 eV. Meanwhile, the DOS of 3py state expands from −5.0 to 1.5 eV and its sharp peaks locate in the range from −3.0 to −1.0 eV and from 1.0 to 1.5 eV. For the Zn center, the sp3 hybrid orbitals are unbalanced, which will cause a series of changes of the electronic cloud distribution. Figure 6b shows obvious divisions of the Zn 3p states. The Zn 3px, 3pz states present continuous distribution in the range from −2.0 eV to 1.0 eV. The split Zn 3py states seems apparent difference and its DOS curve continuous from −1.8 eV to 1.5 eV, with a sharp peak next to Femi level. The five Zn 3d states exhibit great difference, but have little effect on the S–Zn bonds.
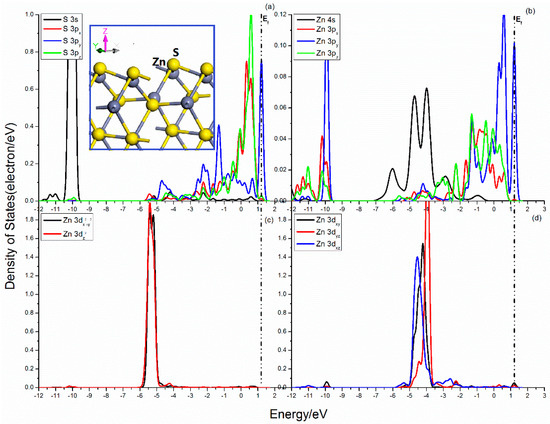
Figure 6.
Projected DOSs of S and Zn of sphalerite (110) surface: (a) S 3s, 3px, 3py and 3pz states; (b) Zn 4s, 3px, 3py and 3pz states; (c) Zn 3dx2–y2 and 3dz2 states; (d) Zn 3dxy, 3dxz and 3dyz states.
The bonding and antibonding interactions are distributed in the range from −12.0 to 1.5 eV. The bonding interactions among S 3s, 3p, and Zn 3p states are provided by S 3s and Zn 3px, 3py, 3pz states in the range from −12.0 eV to −9.7 eV and S 3px, 3py, 3pz and Zn 3px, 3py, 3pz states in the energy range from −3.0 eV to 1.25 eV.
The Projected DOSs of O and Zn atoms in the smithsonite (101) surface are shown in Figure 7. Compared with the sphalerite (110) surface, the DOSs of smithsonite (101) surface shows more electron distribution in the lower energy area. The three curves of the O 2p states are quite different, which indicates that they are split heavily. The 2px state expands and becomes wider, while the 2py and 2pz seems more localization, the peaks of the 2pz state in the Femi energy are sharp. The Zn center shows a sp3 hybrid orbitals, when the O–Zn bond is broken, the corresponding electron cloud interactions will change. Figure 7b shows the 3px, 3py, and 3pz states scatter in the range from -11.5 to 0.5 eV, and seldom DOS distributes near Femi level except for the tiny peaks attributing to 3px and 3pz states. Meanwhile, the five 3d states are split significantly, and show complex differentiation in the range from −12.5~−10 eV and from −9.5 to −2.5 eV.
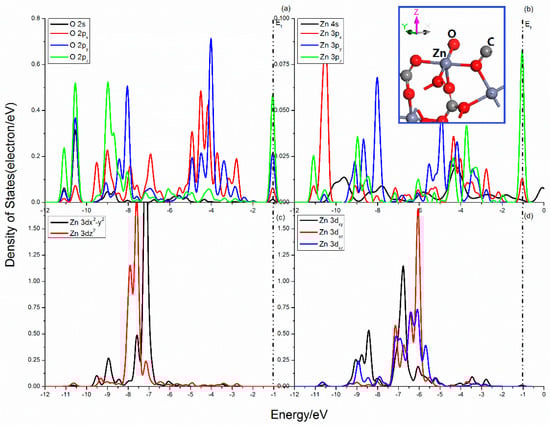
Figure 7.
Projected DOS of O and Zn of smithsonite (101) surface: (a) O 2s, 2px, 2py and 2pz states; (b) Zn 4s, 3px, 3py and 3pz states; (c) Zn 3dx2–y2 and 3dz2 states; (d) Zn 3dxy, 3dxz and 3dyz states.
The complex interactions of O and Zn atoms mainly attribute to O 2p and Zn 3p and 3d states in the range from −11.5 to −0.5 eV. The bonding states locate in the range from −11.5 to −10.25 eV, from −9.75 to −8.5 eV, and −5.5 to 1.25 eV, and contribute by O 2s, 2p and Zn 3p, 3d states, O 2p and Zn 3p, 3dx2-y2, and 3dxy states, and O 2p and Zn 3px, 3pz, and 3dxy states.
4. Conclusions
This study focuses on surface electronic structures of sulfide and oxide minerals. Three pairs of different minerals are presented and the conclusions can be summarized as follows:
(1) The direction and magnitude of the atomic displacements are affected by the surface broken bonds. Generally speaking, the atomic displacements of the sulfide surfaces is larger than that of the oxide surfaces, and the atoms of the sulfide minerals surfaces are more likely to reconstruct.
(2) Femi energy analysis shows that the Femi level of the oxide surfaces is generally less than zero, while that of the sulfide surfaces are positive numbers, which means that the sulfide surfaces possess higher chemical potential and are more likely to be electron donors in reactions.
(3) The projected DOSs investigation shows that the outer electrons are easily affected, and the density of states in the direction of broken bonds show significant splits, especially for their p and d states. The S 3p states are the mainly contributing states in the sulfide surface, while that in the oxide surface are O 2p states. The bonds of the sulfide surface have more covalent features and that of the oxide surface are ionic interactions. The DOSs of the oxide surfaces are distributed in the lower energy range, which indicates that the bond interactions of oxide surfaces are more stable.
Author Contributions
Conceptualization and scheme, J.C.; Data curation, Y.Z. and W.C.; Formal analysis, W.C.; Investigation, W.C., Y.Z., J.C., C.Z., Y.L. and Y.C.; Project administration, J.C.; Software, M.-H.L.; Writing—original draft, W.C.
Funding
This research is financially supported by the Natural Science Foundation of China (No. 51574092, 51874106) and the Found of State Key Laboratory of Mineral Processing (BGRIMM-KJSKL-2017-03).
Conflicts of Interest
The authors declare no conflict of interest.
References
- Lakshmanan, V.I.; Roy, R.; Ramachandran, V. Innovative process development in metallurgical industry: Concept to commission; Springer: Cham, Switzerland, 2016; pp. 1–140. [Google Scholar] [CrossRef]
- Zhao, L.I.; Chen, M.; Huang, P.W.; Zhang, Q.W.; Song, S.X. Effect of grinding with sulfur on surface properties and floatability of three nonferrous metal oxides. Trans. Nonferr. Met. Soc. China 2017, 27, 2474–2480. [Google Scholar]
- Kraushofer, F.; Jakub, Z.; Bichler, M.; Hulva, J.; Drmota, P.; Weinold, M.; Schmid, M.; Setvin, M.; Diebold, U.; Blaha, P.; et al. Atomic-Scale Structure of the Hematite α-Fe2O3(1102) “R-Cut” Surface. J. Phys. Chem. C 2018, 122, 1657–1669. [Google Scholar] [CrossRef] [PubMed]
- Muscat, J.; Klauber, C. A combined ab initio and photoelectron study of galena (PbS). Surf. Sci. 2001, 491, 226–238. [Google Scholar] [CrossRef]
- Leiro, J.A.; Mattila, S.S.; Laajalehto, K.J. XPS study of the sulphur 2p spectra of pyrite. Surf. Sci. 2003, 547, 157–161. [Google Scholar] [CrossRef]
- Becker, U.; Rosso, K.M.; Hochella, M.F. The proximity effect on semiconducting mineral surfaces: A new aspect of mineral surface reactivity and surface complexation theory? Geochim. Cosmochim. Acta 2001, 65, 2641–2649. [Google Scholar] [CrossRef]
- Mcfadzean, B.; Mhlanga, S.S.; O’Connor, C.T. The effect of thiol collector mixtures on the flotation of pyrite and galena. Miner. Eng. 2013, 50, 121–129. [Google Scholar] [CrossRef]
- Zheng, X.; Pan, X.; Nie, Z.; Yang, Y.; Liu, L.; Yang, H.; Xia, J. Combined DFT and XPS Investigation of Cysteine Adsorption on the Pyrite (1 0 0) Surface. Minerals 2018, 8, 366. [Google Scholar] [CrossRef]
- Feng, Q.; Wen, S.; Deng, J.; Zhao, W. Combined DFT and XPS investigation of enhanced adsorption of sulfide species onto cerussite by surface modification with chloride. Appl. Surf. Sci. 2017, 425, 8–15. [Google Scholar] [CrossRef]
- Harmer, S.L.; Goncharova, L.V.; Kolarova, R.; Lennard, W.N.; Muñoz-Márquez, M.A.; Mitchell, I.V.; Nesbitt, H.W. Surface structure of sphalerite studied by medium energy ion scattering and XPS. Surf. Sci. 2007, 601, 352–361. [Google Scholar] [CrossRef]
- Boulton, A.; Fornasiero, D.; Ralston, J. Characterisation of sphalerite and pyrite flotation samples by XPS and ToF-SIMS. Int. J. Miner. Process. 2003, 65, 205–219. [Google Scholar] [CrossRef]
- Kiejna, A.; Pabisiak, T. Effect of substrate relaxation on adsorption energies: The example of α-Fe2O3(0001) and Fe3O4(111). Surf. Sci. 2019, 679, 225–229. [Google Scholar] [CrossRef]
- Han, C.; Li, T.; Zhang, W.; Zhang, H.; Zhao, S.; Ao, Y.; Wei, D.; Shen, Y. Density Functional Theory Study on the Surface Properties and Floatability of Hemimorphite and Smithsonite. Minerals 2018, 8, 542. [Google Scholar] [CrossRef]
- Ke, B.; Li, Y.; Chen, J.; Zhao, C.; Chen, Y. DFT study on the galvanic interaction between pyrite (100) and galena (100) surfaces. Appl. Surf. Sci. 2016, 367, 270–276. [Google Scholar] [CrossRef]
- von Oertzen, G.U.; Skinner, W.M.; Nesbitt, H.W. Ab initioand x-ray photoemission spectroscopy study of the bulk and surface electronic structure of pyrite (100) with implications for reactivity. Phys. Rev. B 2005, 72, 235427. [Google Scholar] [CrossRef]
- Long, X.; Chen, J.; Chen, Y. Adsorption of ethyl xanthate on ZnS(110) surface in the presence of water molecules: A DFT study. Appl. Surf. Sci. 2016, 370, 11–18. [Google Scholar] [CrossRef]
- Jianhua, C.; Baolin, K.; Lihong, L.; Yuqiong, L. DFT and experimental studies of oxygen adsorption on galena surface bearing Ag, Mn, Bi and Cu impurities. Miner. Eng. 2015, 71, 170–179. [Google Scholar] [CrossRef]
- Chen, J.; Ke, B.; Lan, L.; Li, Y. Influence of Ag, Sb, Bi and Zn impurities on electrochemical and flotation behaviour of galena. Miner. Eng. 2015, 72, 10–16. [Google Scholar] [CrossRef]
- Chen, J.; Li, Y.; Zhao, C. First principles study of the occurrence of gold in pyrite. Comput. Mater. Sci. 2014, 88, 1–6. [Google Scholar] [CrossRef]
- Chen, Y.; Chen, J.; Guo, J. A DFT study on the effect of lattice impurities on the electronic structures and floatability of sphalerite. Miner. Eng. 2010, 23, 1120–1130. [Google Scholar] [CrossRef]
- Chen, Y.; Chen, J. The first-principle study of the effect of lattice impurity on adsorption of CN on sphalerite surface. Miner. Eng. 2010, 23, 676–684. [Google Scholar] [CrossRef]
- Hosseini Anvari, M.; Liu, Q.; Xu, Z.; Choi, P. Line tensions of galena (001) and sphalerite (110) surfaces: A molecular dynamics study. J. Mol. Liq. 2017, 248, 634–642. [Google Scholar] [CrossRef]
- Feng, Q.; Wen, S.; Deng, J.; Zhao, W. DFT study on the interaction between hydrogen sulfide ions and cerussite (110) surface. Appl. Surf. Sci. 2017, 396, 920–925. [Google Scholar] [CrossRef]
- Chen, J.; Long, X.; Ye, C. Comparison of Multilayer Water Adsorption on the Hydrophobic Galena (PbS) and Hydrophilic Pyrite (FeS2) Surfaces: A DFT Study. J. Phys. Chem. C 2014, 118, 11657–11665. [Google Scholar] [CrossRef]
- Shen, Y.Y.; Zhang, X.D.; Zhang, D.C.; Zhang, L.H.; Liu, C.L. (101)-oriented ZnO nanoparticles fabricated in Si (100) by Zn ion implantation and thermal oxidation. Mater. Lett. 2011, 65, 3323–3326. [Google Scholar] [CrossRef]
- Boily, J.-F.; Chatman, S.; Rosso, K.M. Inner-Helmholtz potential development at the hematite (α-Fe2O3) (001) surface. Geochim. Cosmochim. Acta 2011, 75, 4113–4124. [Google Scholar] [CrossRef]
- Clark, S.J.; Segall, M.D.; Pickard, C.J.; Hasnip, P.J.; Probert, M.I.J.; Refson, K.; Payne, M.C. First principles methods using CASTEP. Z. für Krist. Cryst. Mater. 2005, 220, 567–570. [Google Scholar] [CrossRef]
- Bentarcurt, Y.L.; Calatayud, M.; Klapp, J.; Ruette, F. Periodic density functional theory study of maghemite (001) surface. Structure and electronic properties. Surf. Sci. 2018, 677, 239–253. [Google Scholar] [CrossRef]
- Chen, J.-H.; Long, X.-H.; Zhao, C.-H.; Kang, D.; Guo, J. DFT calculation on relaxation and electronic structure of sulfide minerals surfaces in presence of H2O molecule. J. Cent. South Univ. 2014, 21, 3945–3954. [Google Scholar] [CrossRef]
- Zhang, J.-M.; Pang, Q.; Xu, K.-W.; Ji, V. First-principles study of the (110) polar surface of cubic PbTiO3. Comput. Mater. Sci. 2009, 44, 1360–1365. [Google Scholar] [CrossRef]
- Chen, J. The Solid Physics of Sulphide Minerals Flotation; Central South University Press: Changsha, China, 2015. [Google Scholar]
- Zhang, S.; Cao, Y. Measure of Redox Potential of Sedimentary Hematite, Siderite and Pyrite and Its Geochemical Significance. J. China Univ. Min. Technol. Chin. Ed. 1992, 2, 59–64. (In Chinese) [Google Scholar]
- Herrera-Urbina, R.; Sotillo, F.J.; Fuerstenau, D.W. Effect of sodium sulfide additions on the pulp potential and amyl xanthate flotation of cerussite and galena. Int. J. Miner. Process. 1999, 55, 157–170. [Google Scholar] [CrossRef]
- Balichard, K.; Nyikeine, C.; Bezverkhyy, I. Nanocrystalline ZnCO3—A novel sorbent for low-temperature removal of H2S. J. Hazard. Mater. 2014, 264, 79–83. [Google Scholar] [CrossRef] [PubMed]
- Holuszko, M.E.; Franzidis, J.P.; Manlapig, E.V.; Hampton, M.A.; Donose, B.C.; Nguyen, A.V. The effect of surface treatment and slime coatings on ZnS hydrophobicity. Miner. Eng. 2008, 21, 958–966. [Google Scholar] [CrossRef]


© 2019 by the authors. Licensee MDPI, Basel, Switzerland. This article is an open access article distributed under the terms and conditions of the Creative Commons Attribution (CC BY) license (http://creativecommons.org/licenses/by/4.0/).