1. Introduction
The ability of cells to move within different environments is crucial in a diverse array of processes. For instance, during development, the coordinated movement of cells of different origin is fundamental for both shaping the growing embryo and organogenesis: migratory defects at all stages may in fact lead to severe malformations [
1]. In mature organisms, immune cells are mobilized from the bloodstream to enter sites of infection, and then into the lymph nodes for effector functions [
2]. Moreover, the migration of epithelial cells and fibroblasts is vital for proper wound healing and the repair of basement membranes and connective tissues. In pathological conditions, cell migration is involved in chronic inflammatory diseases, such as arteriosclerosis, and in cancer invasion and metastasization [
3]. The process of cell migration is finally exploited in biomedical engineering applications for the regeneration of various tissues, such as cartilage, skin, or peripheral nerves in vivo or in vitro [
4,
5,
6,
7].
The migratory efficacy of cells is determined, to a large extent, by their capacity to squeeze through strictly confined environments. For instance, tissue membranes and vessel walls, as well as dense regions of structural extracellular matrices (ECMs), represent physical barriers characterized by significantly small openings and pores [
8,
9]. Under these conditions, cells can achieve substantial movement by degrading/modifying their surroundings to create sufficient space, for example, by the secretion of matrix metalloproteinases (MMPs) or by squeezing to fit through the available space [
10,
11,
12]. In the latter option, the elasticity of the cell becomes an important factor. In this respect, the cytoplasm is very flexible and can undergo large deformations. On the other hand, the voluminous nucleus is much stiffer: it is therefore a hampering factor for cell movement [
13,
14,
15,
16].
The relation between cell mobility and remodeling ability is efficiently studied with two experimental systems. On the one hand, cultured cells are stimulated to move in engineered fibrous scaffolds, which mimic highly confined in vivo connective tissues [
17]. On the other hand, they are seeded and allowed to locomote within microfluidic-based devices, characterized by the presence of constrictions formed by fixed and insoluble polymeric structures (e.g., extended walls or arrays of pillars) [
18,
19,
20,
21].
Such a second type of experimental system, in particular, in the design version proposed by Denais and coworkers in [
19] and by Davidson and colleagues in [
18], was here reproduced and simulated using an extended Cellular Potts model (CPM, [
22,
23,
24,
25,
26,
27]). This is a grid-based Monte Carlo technique that employs a stochastic energy minimization principle to determine system evolution. The approach proposed in this work is similar to those proposed in [
28,
29,
30], which employed a compartmental representation of cells to analyze selected aspects of their movement within matrix environments. However, it is characterized by some relevant novelties and features, namely:
The definition of a Boltzmann law for lattice updates specific for each type of proposed cell dynamics (e.g., cytosolic extension or retraction, and nucleus deformation);
An analysis of the forces that act on the nuclear envelope at different stages of individual locomotion;
A continuous and close feedback and feedforward between computational and experimental results, in a perspective of a data-driven model refinement.
In this respect, as an outcome, we focused on experimentally addressable characteristics of cell shape and locomotion (e.g., the velocity and transit time within a constriction, and nucleus deformation ratio). In particular, we predicted how these quantities were affected by selected manipulations either of cell properties or of channel layout. In this respect, we successfully replicated most of the experimental results proposed in the two reference papers [
18,
19]. For the sake of completeness, we investigated the rationale underlying the few discrepancies that emerged between the computational and in vitro outcomes.
The rest of the paper is organized as follows. In
Section 2, we clarify the assumptions on which our approach was based and describe each model component. In this part of the work, we also introduce and provide an estimation of the model parameters and define how we quantified and characterized cell movement. The computational findings are then presented in
Section 3, where we separately deal with simulations relative to the channel layouts proposed in [
18,
19], respectively. Finally, the proposed results are discussed in the last
Section 4, which also contains some hints for future perspectives.
2. Mathematical Model
The Cellular Potts model (CPM) is a grid-based stochastic approach that realistically preserves the identity of cell-scale elements and describes their behavior and mutual interactions in energetic terms and constraints. An extended version of the CPM was employed here to schematically reproduce cell migratory behavior within the two types of microfluidic-based devices developed in [
18,
19]. As shown in
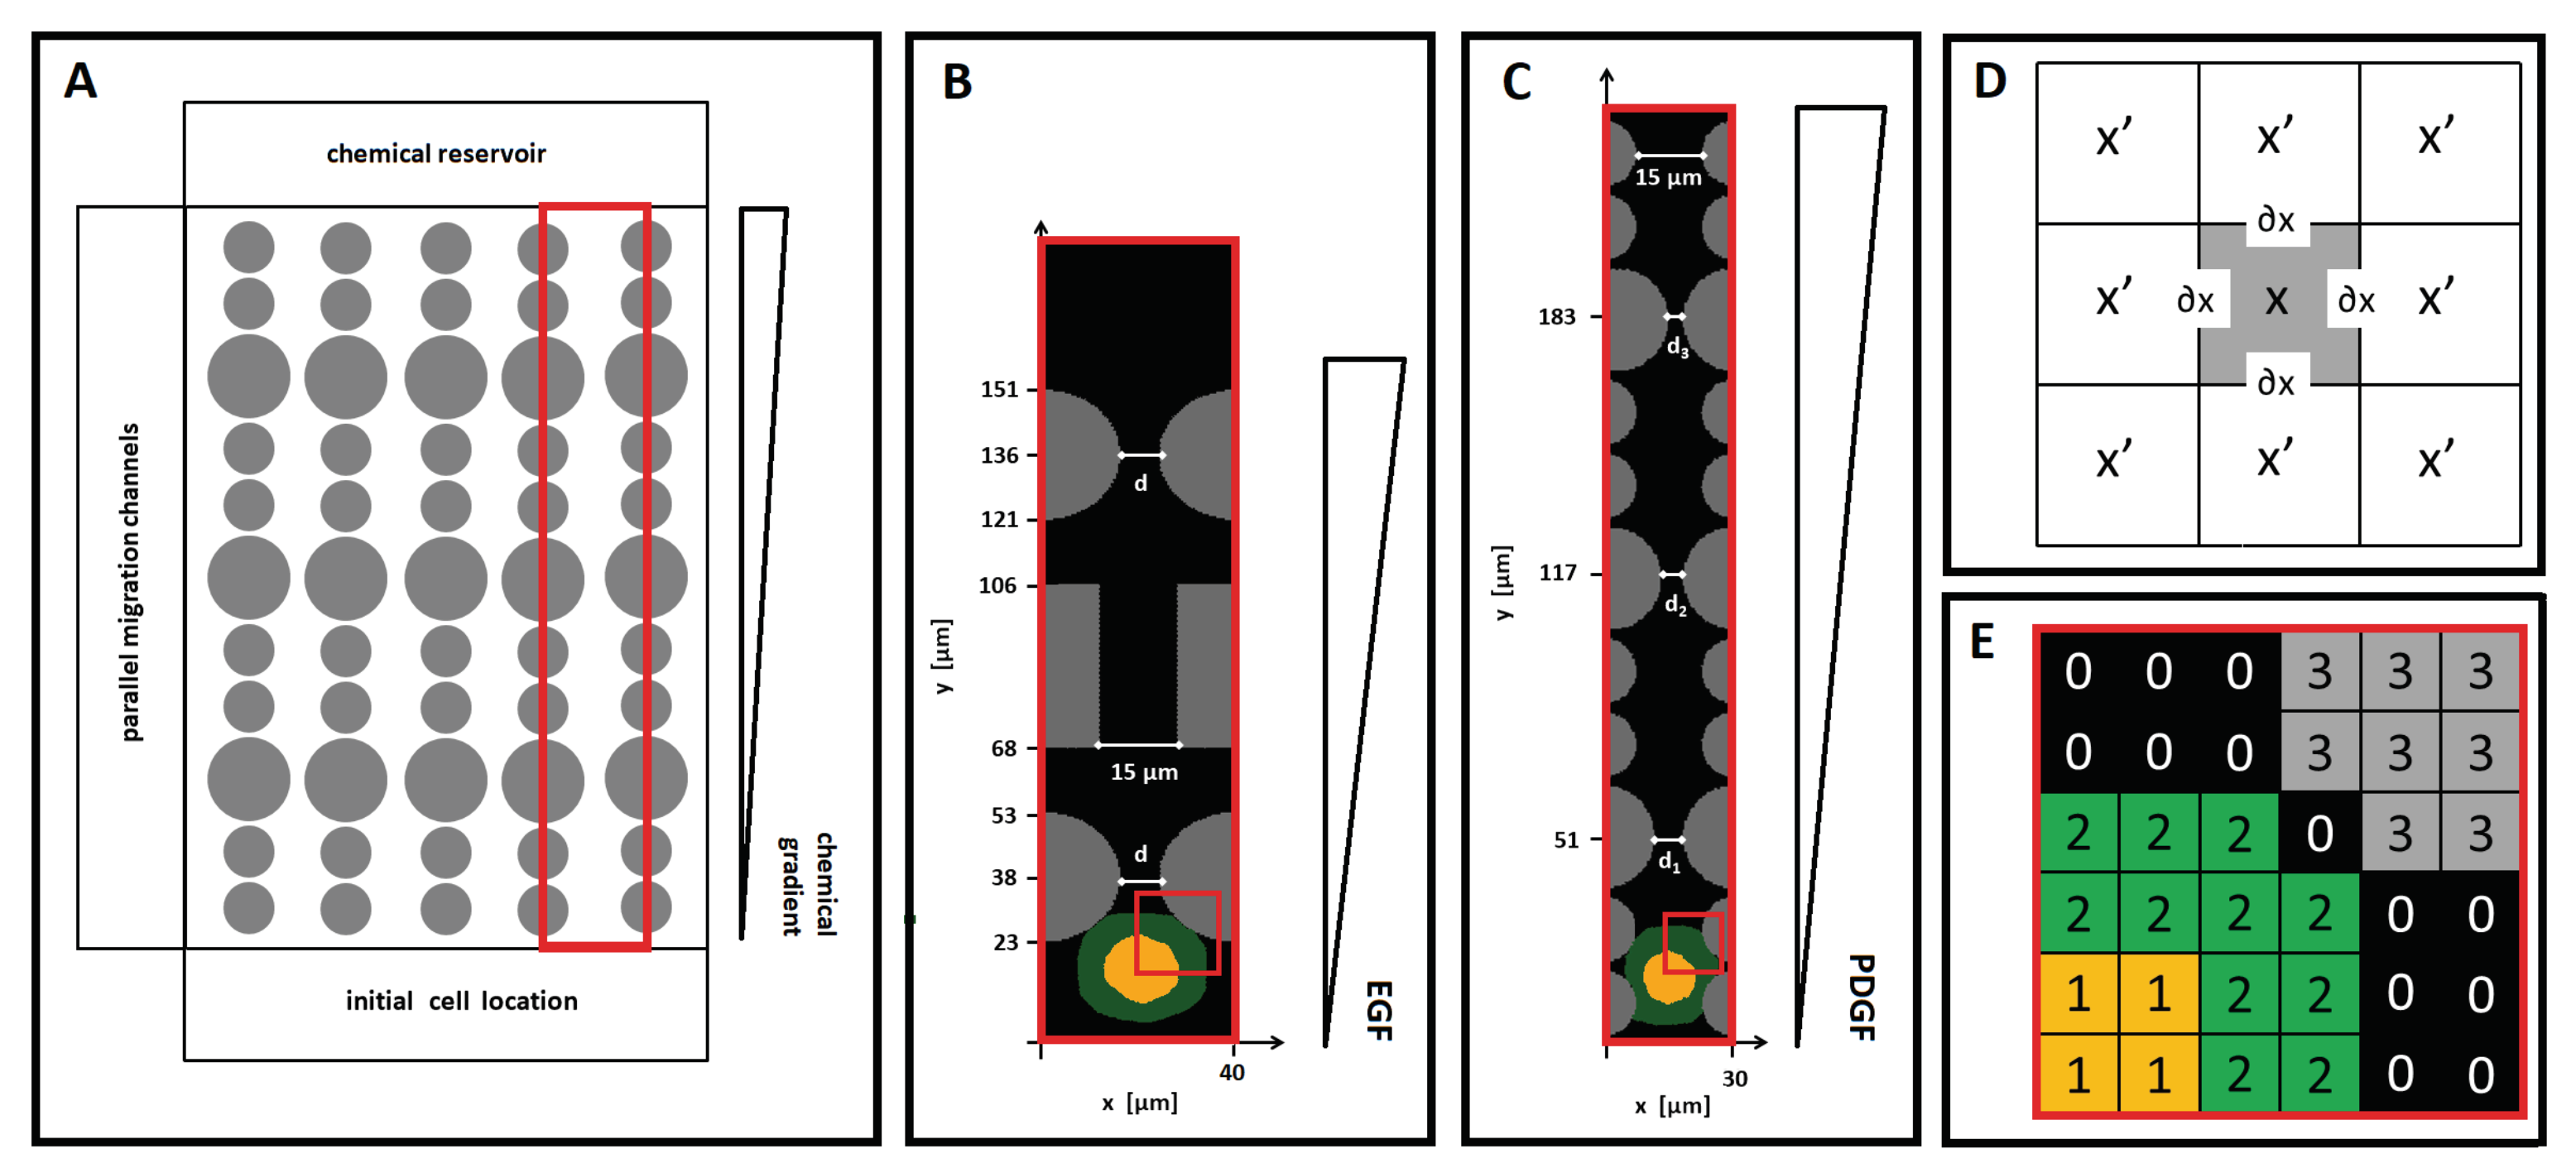
Figure 1A, both experimental systems are composed of dozens of arrays of aligned polymeric pillars, which form a series of parallel channels. Such structural elements are fixed and represent a constriction for cell movement because they limit the free space and form bottlenecks: their dimensions and distributions can be varied to mimic different patterns of spatial limitations. An extended group of cells, initially disposed just outside the entrance of the channels, then individually moves up to a chemical gradient, which is established by the diffusion of a molecular factor from a sink reservoir located on the opposite side of the devices; see, again,
Figure 1A.
In order to reduce the computational complexity of the problem, a two-dimensional CPM domain
is used to reproduce a planar section of a single migratory channel, taken as representative of each of the two reference devices; see
Figure 1B,C. In both cases,
is a regular lattice, formed by identical square grid sites that, with an abuse of notation, are identified by their center
. Each grid site is assigned a unique index, i.e., an integer number
, that can be interpreted as a degenerate
spin, a name originally inherited from statistical physics [
31,
32]. The border of a lattice site
is identified as
, and one of its neighbors, as
, while its overall Moore neighborhood is identified as
, i.e.,
is a neighbor of
; see
Figure 1D. The subdomains of contiguous sites with identical spin form discrete objects
(e.g.,
), which have an associated type
.
A single representative cell is then included in
. Following the approach proposed in [
27], the simulated agent, labeled by the integer
, is defined as a compartmentalized element. It is composed of two subregions, which, in turn, are classical CPM objects
: the nucleus, a central cluster
of type
N, and the surrounding cytosol
of type
= C; see
Figure 1E. Both cell compartments share, as an additional attribute, the individual identification number
. In other words, the entire cell is identified by
, whereas its internal compartments are identified by the pairs
(the nucleus) and
(the cytoplasm).
The extracellular environment is then differentiated into a polymeric component,
P, and a medium component,
M, as done in [
30,
33,
34]. The polymeric state is assigned to identify the rigid pillars forming the migratory channel. In particular, each of them is a disconnected CPM element
, identified by its own identification number
(since
-values
are used for the intracellular compartments; see above). The dimensions and positions of such structures are specified later on. The medium-like state instead identifies the free surface of the microchannel, i.e., where the cell moves and the chemical substances diffuse: it is conventionally assumed to be a single object
isotropically distributed throughout the simulation domain, as shown in panel (E) of
Figure 1.
Cell movement results from an iterative and stochastic minimization of a free energy, defined by a
Hamiltonian functional
H (whose components are defined below). The employed algorithm consists of a series of elementary steps of a modified Metropolis method for Monte Carlo–Boltzmann dynamics [
25,
35], which is able to implement the natural exploratory behavior of biological individuals. Procedurally, at each time step
t, called a Monte Carlo step (MCS, the basic unit of time of the model), a lattice site
(
for
) belonging to a cell compartment
is selected at random and attempts to copy its spin,
, into one of its unlike neighbors,
(
for
), also randomly selected. In particular, if
and
, the cell is protruding, i.e., extending its motile membrane structures within the extracellular space, whereas if
and
, the cell is retracting. Finally, if
and
or if
and
, the cell is reorganizing, i.e., it is undergoing internal remodeling. Polymeric pillars are instead fixed and immutable, i.e., they are not allowed to move or be deformed by the cell. The proposed trial of spin update is finally accepted with a Boltzmann-like probability function
, whose form is slightly changed here with respect to the general version given in [
27]:
In Equation (
1),
is the net difference of the system energy due to the proposed change of domain configuration, whereas the parameter
is a Boltzmann temperature that accounts for the trial cell behavior. The retraction/protrusion dynamics are in fact dictated by the intensity and the frequency of plasma membrane (PM) ruffles, which, on a molecular level, are determined by polarization/depolarization processes in the actin cytoskeleton (refer to [
36,
37,
38] and references therein). Cell internal reorganization instead depends on the agitation rate for the nuclear cluster. According to the above considerations, we indeed have
with the stochastic law regulating cell movement that can be finally specified as
In particular, we set a sufficiently high
since cells moving in confined environments are widely shown to have an active fluid-like cytoplasm. A lower
is instead fixed since the nucleus does not have active movement dynamics (i.e., self-propulsion), but it only displaces passively, i.e., is dragged by the surrounding cytoskeleton elements; see, also, [
39] for a more detailed mechanical explanation.
Remark. The acceptance probability resulting from Equations (
2) and (
3) differs from the general version given in [
27], and used in [
28,
29,
30], as a consequence of the fact that the Boltzmann temperature
T depends both on the type of moving cell compartment, as in our previous papers, and on the characteristics of the target grid element. According to us, this is a significant improvement of the CPM algorithm. For instance, it allows differentiating cases of the same cell cytosolic element that tries either to extend in the free extracellular domain or to occupy the space belonging to the nucleus. In fact, in the former case, the possibility of cell morphological updates is biologically determined by the cytoskeletal agitation rate (i.e., by a determinant of the source site), whereas, in the latter case, it relies on the resistance to movement exerted by the stiff organelle (i.e., on a determinant of the target site). The transition probability functions employed in our previous papers did not allow capturing such aspects.
The
Hamiltonian functional establishing the system energy is then given by the sum of three contributions:
is the general extension of Steinberg’s differential adhesion hypothesis (DAH) [
25,
40,
41]. In particular, it is differentiated in the contributions due to either the generalized contact tension between the nucleus and the cytoplasm within the cell, or the effective adhesion between the migrating individual and an extracellular component:
where
and
are two neighboring sites (i.e.,
) and
and
, two neighboring elements.
is instead intended as the border of
(i.e.,
). The coefficients
Js ∈
are the binding forces per unit area and are obviously symmetric w.r.t. their indices. In particular,
implicitly models the forces exerted by intermediate actin filaments and microtubules to anchor the nucleus to the cell cytoskeleton. In the perspective of energy minimization,
is set to prevent cell fragmentation, as done in [
28,
29,
30].
and
, in principle, evaluate the heterophilic contact interactions between the cell and the extracellular elements: however, both are here fixed equal to zero. This choice, successfully employed in [
29,
39], was made to directly analyze the influence of cell deformability on the motile behavior. The experimental literature also demonstrates that most cell lines display a sustained ameboid movement, characterized by a poorly adhesive mode, when crawling in confined environments [
21,
42,
43].
models the geometrical attributes of the subcellular compartments, which are written as nondimensional relative deformations in the following quadratic form:
Such an energy term indeed depends on the actual surface and perimeter of the subcellular units, i.e.,
and
, respectively, as well as on the corresponding target quantities, i.e.,
and
, respectively, which are here assumed to be characteristic of the relaxed/initial individual configuration.
and
represent, instead, mechanical moduli in units of energy: in particular,
refer to surface changes of the subcellular compartments, while
relate to their deformability/elasticity, i.e., to the ease with which they are able to remodel, changing their perimeter. Both parameters are here taken to be constant: however, they may vary in time as a consequence, for example, of intracellular chemical dynamics, as commented on in the conclusive section of the work.
The fluctuations of the cell surface are kept negligible by setting high constant values
. This choice was based on the assumptions that the migrating cell has an adequate amount of nutrients to avoid volume loss and that it does not significantly grow during movement, as confirmed by experimental images in [
18,
19]. A low
then allows the large cytosolic deformations experimentally observed in the cases of cell movement in confined environments. Empirical evidence also shows that the nucleus is able (when needed) to undergo morphological reorganization but to a lower extent than the surrounding cytosolic compartment. Accordingly, we opted to set
.
reproduces the effect of cell preferential migration towards zones with higher concentrations of a diffusing chemoattractant, which was constantly used in the experiments to obtain a sustained cell movement [
18,
19]. Such an energy contribution was implemented by a local linear-type relation of the form that was firstly used in [
44] to reproduce Dictyostelium discoideum aggregation and then constantly adopted in most CPM-based approaches:
where
and
are, respectively, the source and the final lattice site randomly selected during a trial update in an MCS and
, where
is a nonlocal measure of the molecular substance sensed by the moving cell site, since
c denotes the chemical concentration; see Equation (
9). Finally,
represents the strength of the chemotactic response: in particular, we set
Equation (
8) implies that only cytosolic dynamics are affected by molecular signals. Finally, the full expression and activity of cell chemical receptors was set by a high
.
Evolution of the molecular variable. According to the experimental designs in [
18,
19], we assume that the virtual molecular substance is released (i.e., produced) at a constant rate from the top edge of the domain (denoted as
), homogeneously, and constantly diffuses and decays, being eventually taken up by the cell. In mathematical terms, we have the following reaction–diffusion (RD) law:
where
is the Kronecker delta. Equation (
9) indeed states that the chemical substance (i) diffuses only through the domain grid sites not occupied by the cell or by a rigid pillar, (ii) locally decays everywhere, and (iii) undergoes consumption only at the domain grid sites occupied by a cell compartment. In particular, cell chemical absorption follows a piecewise-linear approximation of a Michaelis–Menten law. This simplification is realistic since cells’ capacity to internalize diffusing substances is limited. We finally set
, as the natural decay of a molecule is typically negligible compared to the cell uptake. We remark that Equation (
9) neglects the diffusion of the chemical
within the cell after its uptake: such dynamics would imply the definition of specific coefficients, i.e., characterizing the diffusion of the substance within each of the two intracellular compartments. However, the inclusion of this aspect would not have had an impact on the topic of our study, which was, rather, the dependence of the migratory potential of an individual on its remodeling ability.
3. Results
Model parameters and computational details. The characteristic size (lateral edge) of the domain grid sites is hereafter denoted by
and was fixed equal to 0.5 µm. The temporal resolution of the model was, as seen, the MCS, which was constantly set to correspond to 2 s, as previously done in [
28,
29,
30]. The PDE for the evolution of the chemical factors was numerically solved with a finite difference scheme on a grid with the same spatial resolution as
, characterized by 30 diffusion steps per MCS. This temporal scale was sufficiently small to guarantee the stability of the numerical method.
In all the simulations, the representative motile cell was initially seeded at the bottom region of the channel, displaying a nonpolarized morphology, with a perimeter and surface given by
, for
, respectively. In particular, its initially round nucleus lay in the center of the individual. All the forthcoming computational realizations started with 100 annealed MCSs to have a realistic arrangement of the cell body within the structure. Such system configuration updates obeyed the following rule:
During such annealed MCSs, chemical kinetics did not occur yet. The entire set of model parameters, labeled as
, can be divided in two groups:
is composed of coefficients that directly relate to biological quantities and therefore depend on the specific experimental system. In this respect, the cell dimensions and channel measures were derived from images and movies presented in [
18,
19] (both in the text and in the Supplementary Material). The kinetic coefficients of the chemicals used in that work were instead evaluated using data from the literature. In particular, the maximal cell uptake was calculated as in [
33,
39]. The chemotactic response
was finally established by comparing experimental and numerical cell velocities in open spaces (i.e., in regions of the channels far from structural constrictions). The parameters belonging to
, listed in
Table 1, are instead more technical and do not depend on the specific empirical device. In this respect, they were taken from previous published CPMs dealing with cell migration within two- and three-dimensional matrix environments. However, preliminary simulations showed that the behavior of the model proposed in this paper was fairly robust in large regions of the parameter space around this estimate.
Quantification of the numerical results. The position of the cell at any time t was established by the position of its center of mass . Coherently, the position of its nucleus was established by the position of its center of mass .
A cell was denoted as invasive if at least one of its membrane sites touched the top border of the domain. It was denoted as invasive with respect to a constriction if the center of mass of its nucleus passed the midpoint of that constriction.
The instantaneous directional velocity of the cell at a given location along the representative microchannel was defined as where is such that and MCS (2 s). Similarly, the instantaneous directional velocity of the nucleus was given by
Morphological changes of the nucleus were quantified by its
deformation ratio. This was given, for any given location
within the representative microchannel, by the ratio between its geometrical moments of inertia evaluated with respect to the horizontal and vertical axes that passed through its center of mass, i.e.,
where
has the same meaning as before. In particular,
corresponded to an almost round shape of the nucleus, whereas
(or ≫1) corresponded to its horizontal (or vertical) elongation.
The transit time of the cell within a constriction was evaluated as the period of time from its first to its last contact with one of the two pillars that formed that constriction.
We finally calculated the
force acting on any nuclear border site by adapting the algorithmic procedure described and employed in [
45]. In particular, we started with the consideration that local forces can be related to the negative gradient of the
Hamiltonian H, i.e.,
being a generic lattice site. We then employed a centered approximation to the first partial derivative, also observing that the nuclear cluster could extend or retract in any of the two principal directions by a small step
(the characteristic size of the domain grid elements). As a result, we obtained that, for each
such that
,
where
includes only the energetic contributions relative to the organelle and
denotes the one-site-large possible variation of its extension along the horizontal axis. The
y-component of the force analogously read as
3.1. Cell Motion between Structural Elements with Different Geometries
In this section, we specifically focus on cell migration within a channel representative of the device developed in [
19]. In this respect, the simulation lattice
was formed by 80 × 400 (respectively, in
x and
y) sites, which corresponded to an experimental domain of 40 m × 200 m. As shown in
Figure 1B, it contained only three pairs of pillars. The distance between the rectangular elements was kept fixed and equal to 15 µm, whereas the distance between the two pairs of round pillars, hereafter denoted by
d, was varied in the different simulation settings. All the performed simulations lasted
MCSs (≈600 min). The estimate of the model parameters belonging to
here refers to breast cancer cells and to epidermal growth factor (EGF), in accordance with the experimental materials used in [
19] (cf.
Table 2). In particular, the cell had an initial nuclear diameter
µm and an overall size equal to 24 µm.
Table 2.
Values of the model parameters whose estimates relate to the experimental system proposed in [
19]. They belong to the set
defined in Equation (
11).
Table 2.
Values of the model parameters whose estimates relate to the experimental system proposed in [
19]. They belong to the set
defined in Equation (
11).
| Cell dimensions | Value | Reference(s) |
| Initial surface of the nucleus | µm2 | [19] |
| Initial perimeter of the nucleus | µm | [19] |
| Initial surface of the cytosol | µm2 | [19] |
| Initial perimeter of the cytosol | µm | [19] |
| Device dimensions | Value | Reference(s) |
| Horizontal width | 40 µm | [19] |
| Vertical length | 200 µm | [19] |
| Width between each pair of rectangular structures | 15 µm | [19] |
| Width between each pair of round structures | d (variable) | [19] |
| Coefficients of EGF kinetics | Value | Reference(s) |
| EGF diffusion rate | cm2s−1 | [46] |
| EGF decay rate | s−1 | [47] |
| EGF production rate | h−1 | [47] |
| EGF internalization rate | s−1 | [48] |
| Maximal EGF internalization | µM s−1 | Estimated as in [33,39] |
| Cell chemotactic strength | µM−1 | Fitting with empirical measures in [19] |
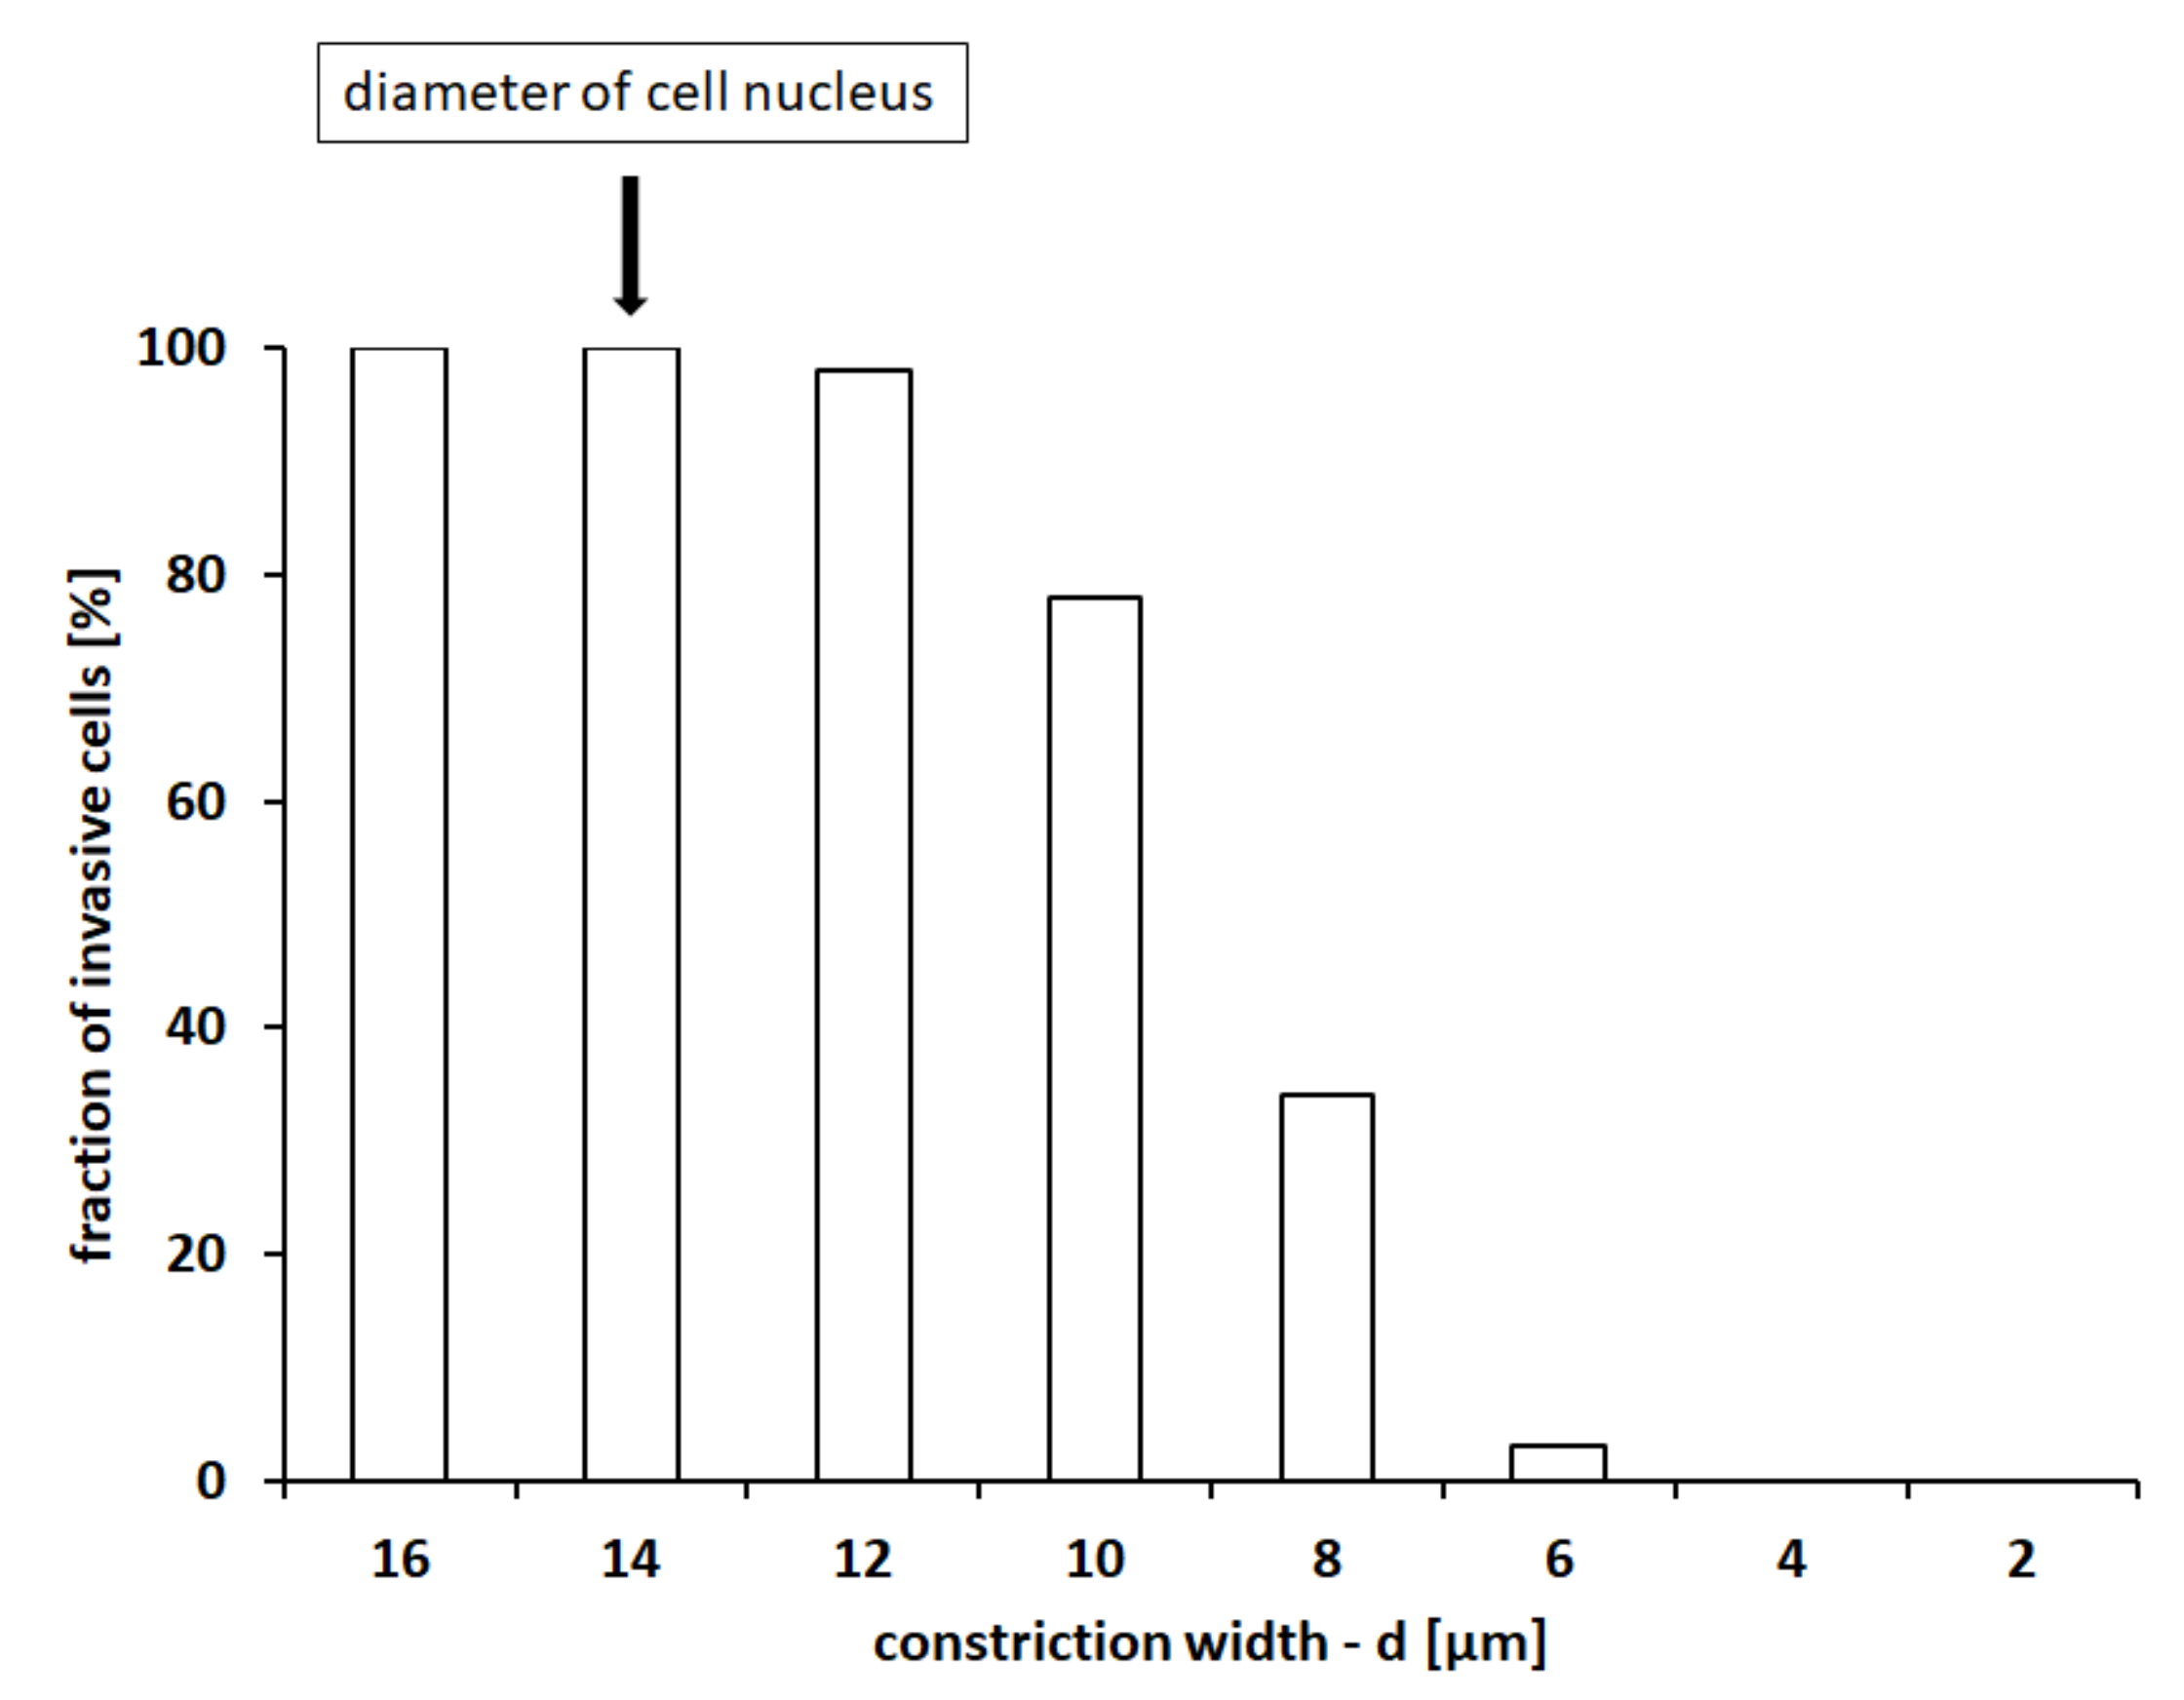
As shown in
Figure 2, when the constriction between the round pillars was large enough (i.e.,
µm, so that
), the cell was constantly able to crawl along the entire structure, guided by the chemical signals. Reductions of
d then resulted in decrements in the cell invasive capacity, which was completely lost when
d fell below 4 µm (i.e., for
).
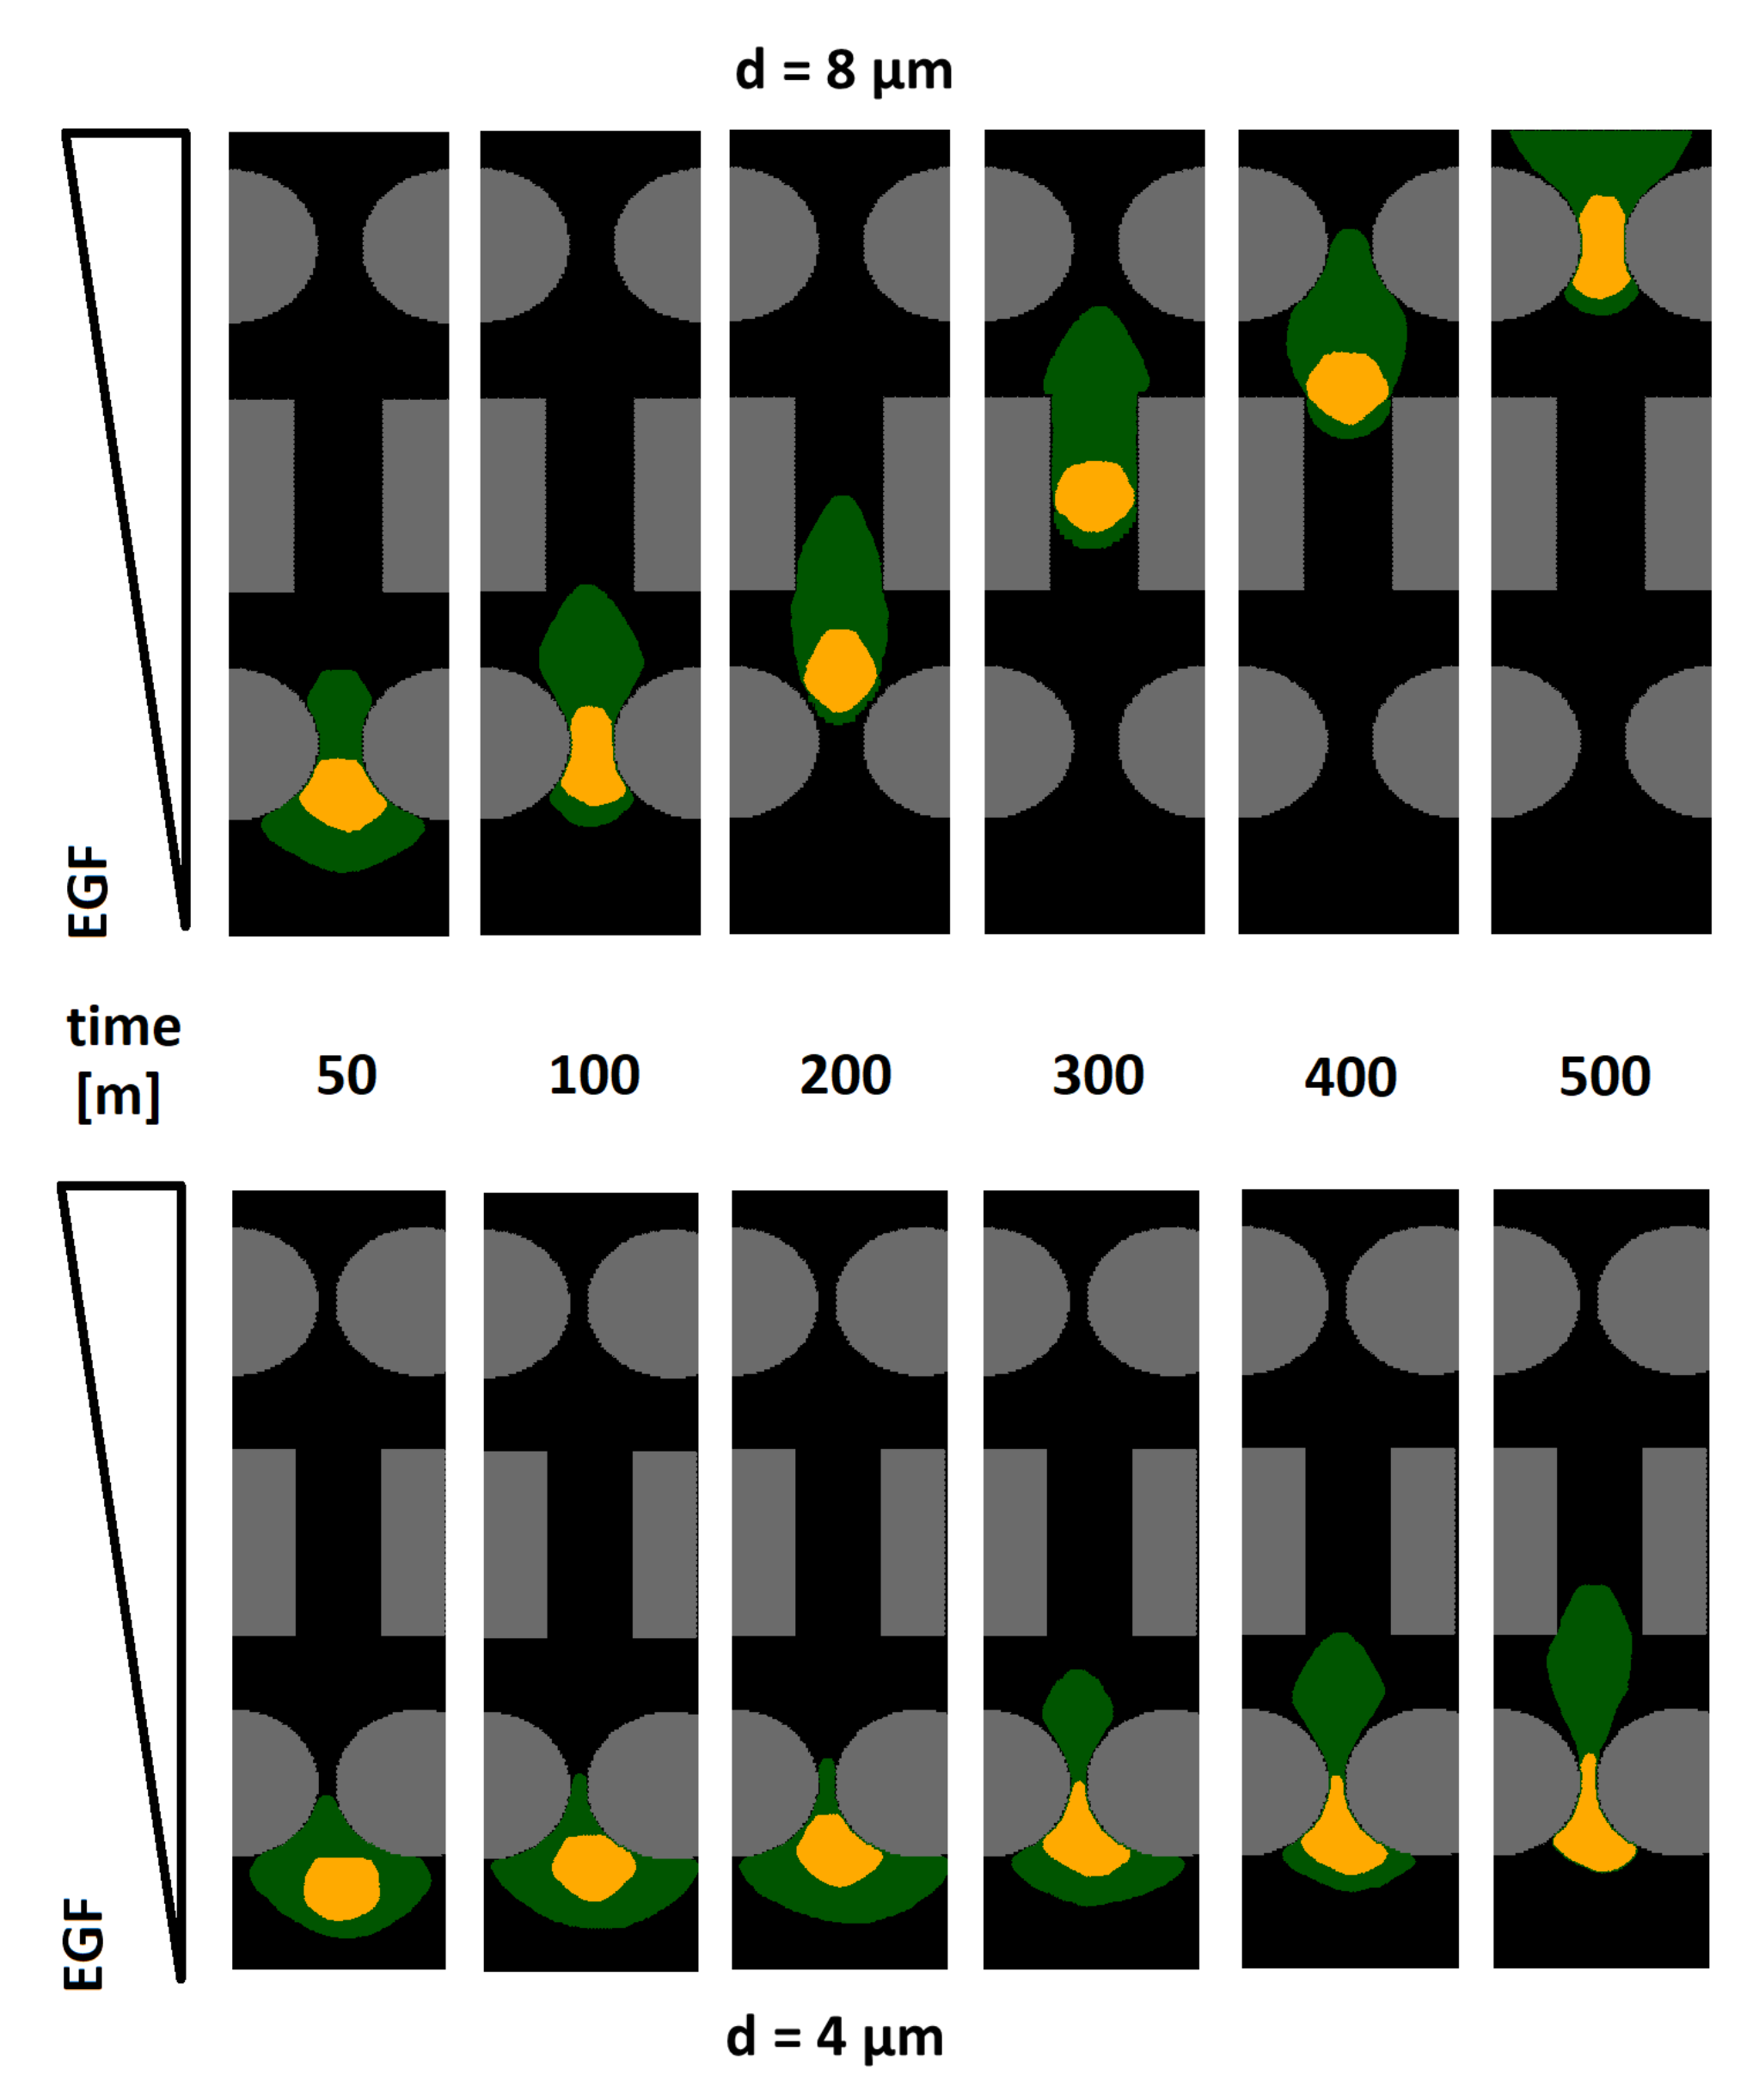
The top panels in
Figure 3 show the cell dynamics in the case of complete channel invasion. First, a long and thin cytoplasmic pseudopodium emerged at the front of the cell, towards the chemical source, and infiltrated between the first pair of round pillars. Such a membrane protrusion then dragged the rest of the cell to enter the pore. In particular, the nucleus adopted a cigar-like shape to overcome the spatial constriction, which was possible since it had a certain degree of elasticity.
When the cell had passed the first pair of round elements, it relaxed, and its nucleus stabilized in a quasi-spheroidal shape. A constant sustained migration was then maintained by the individual along the rectangular structures: the space between them did not in fact require further morphological deformation. Both cell compartments had to finally squeeze again when the individual approached the second pair of round pillars.
From a modeling perspective, the migratory behavior of the virtual cell was the result of a sequence of action/reaction mechanisms. First, the exogenous chemical stimulus caused the border sites of the cell cytosol to locally protrude in the direction of increasing EGF gradients, with a speed of protrusion that was approximately proportional to the modulus of the local chemotactic strength . Dragged by the leading front, the overall cytosolic region then moved forward (eventually deforming) and pulled onto the nucleus with the same force, transmitted by the contact energy . However, as a consequence of the higher rigidity and lower motility (i.e., and , respectively), the nuclear cluster took more time to deform and displace than the surrounding compartment and, therefore, constantly lay at the trailing part of the individual body.
Such a mechanistic explanation is consistent with experimental and modeling observations presented in [
49]. Therein, the authors in fact comment that a cell usually translocates almost the entire cytosol before effective nuclear transmigration, mainly in the case of small-enough pores. They also claim that the hourglass shape adopted by the nucleus in the case of passage within small constrictions is due to the pulling forces exerted by the frontal actomyosin networks. The pushing from the rear part of the cytoskeleton would instead result in an inverted bolt shape, which would not allow successful individual passage within the pore.
As captured in
Figure 3 (bottom panels), in the case of small-enough interpillar distances
d, the front end of the cell cytoplasm extended, as usual, between the first pair of round structures. However, the deformability of the nucleus was no longer sufficient for it to pass through such a confined space. The cell therefore remained stuck, being unable to invade.
These results are indicative of the fact that the presence of the voluminous nucleus represents a steric hindrance for the entire cell and that the degree of nuclear deformability determines its capacity to move within confined spaces. Our numerical outcomes are in remarkable agreement with the experimental evidence provided in the reference work [
19]. Denais and coworkers in fact demonstrated that cells of different lineages can pass within subnuclear constrictions by only temporarily rupturing the integrity of the nuclear envelope (NE), so that the organelle becomes as fluid as the cytoplasm. Interestingly, the nuclear membrane can be restored during migration: this is the reason why subsequent NE ruptures are observed within the same cell.
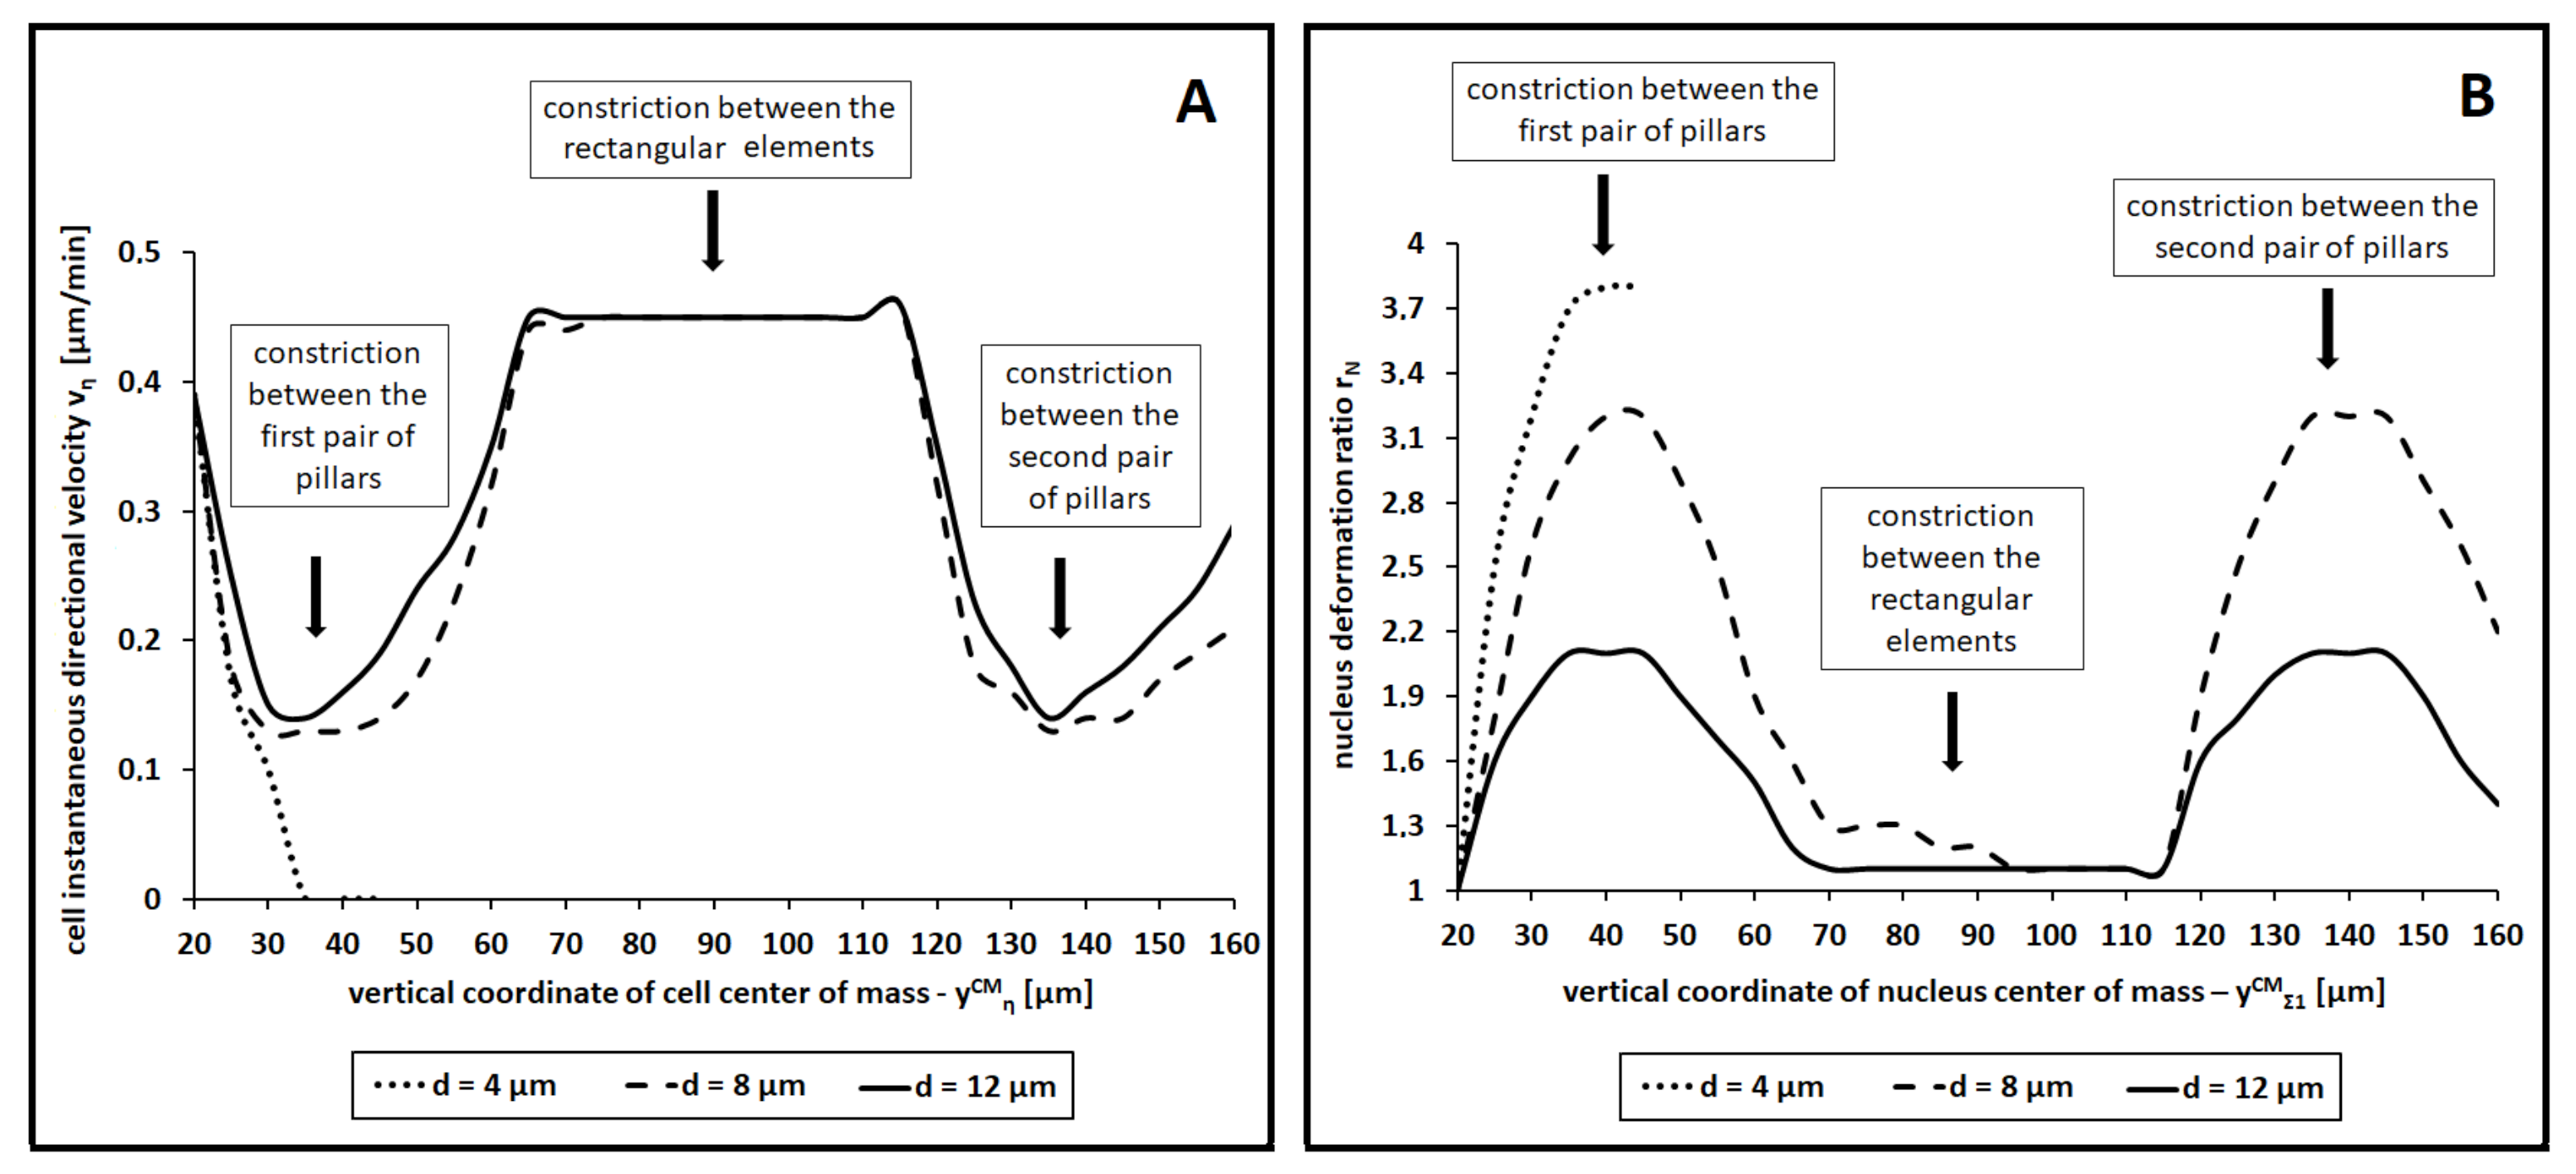
Cell speed and nucleus deformation have complementary behavior, as shown by their time evolution plotted in
Figure 4 (for three representative values of
d). In the case of complete channel invasion (for
and 12 µm, i.e., for
and
), the cell reached and maintained its maximal velocity when crawling between the rectangular elements, whose spacing required minimal nuclear deformation (i.e.,
). The cell speed was instead reduced in the proximity of the pairs of round pillars. In particular, the closer they were to each other, the more time the cell took to pass the constriction (and then to relax), as a consequence of the necessarily larger nuclear deformations. Finally, in the case of minimal space between the round structures (for
µm, i.e., for
), the nuclear deformation quickly went to a maximum threshold, whereas the cell speed dropped to almost zero (the cell remained stuck).
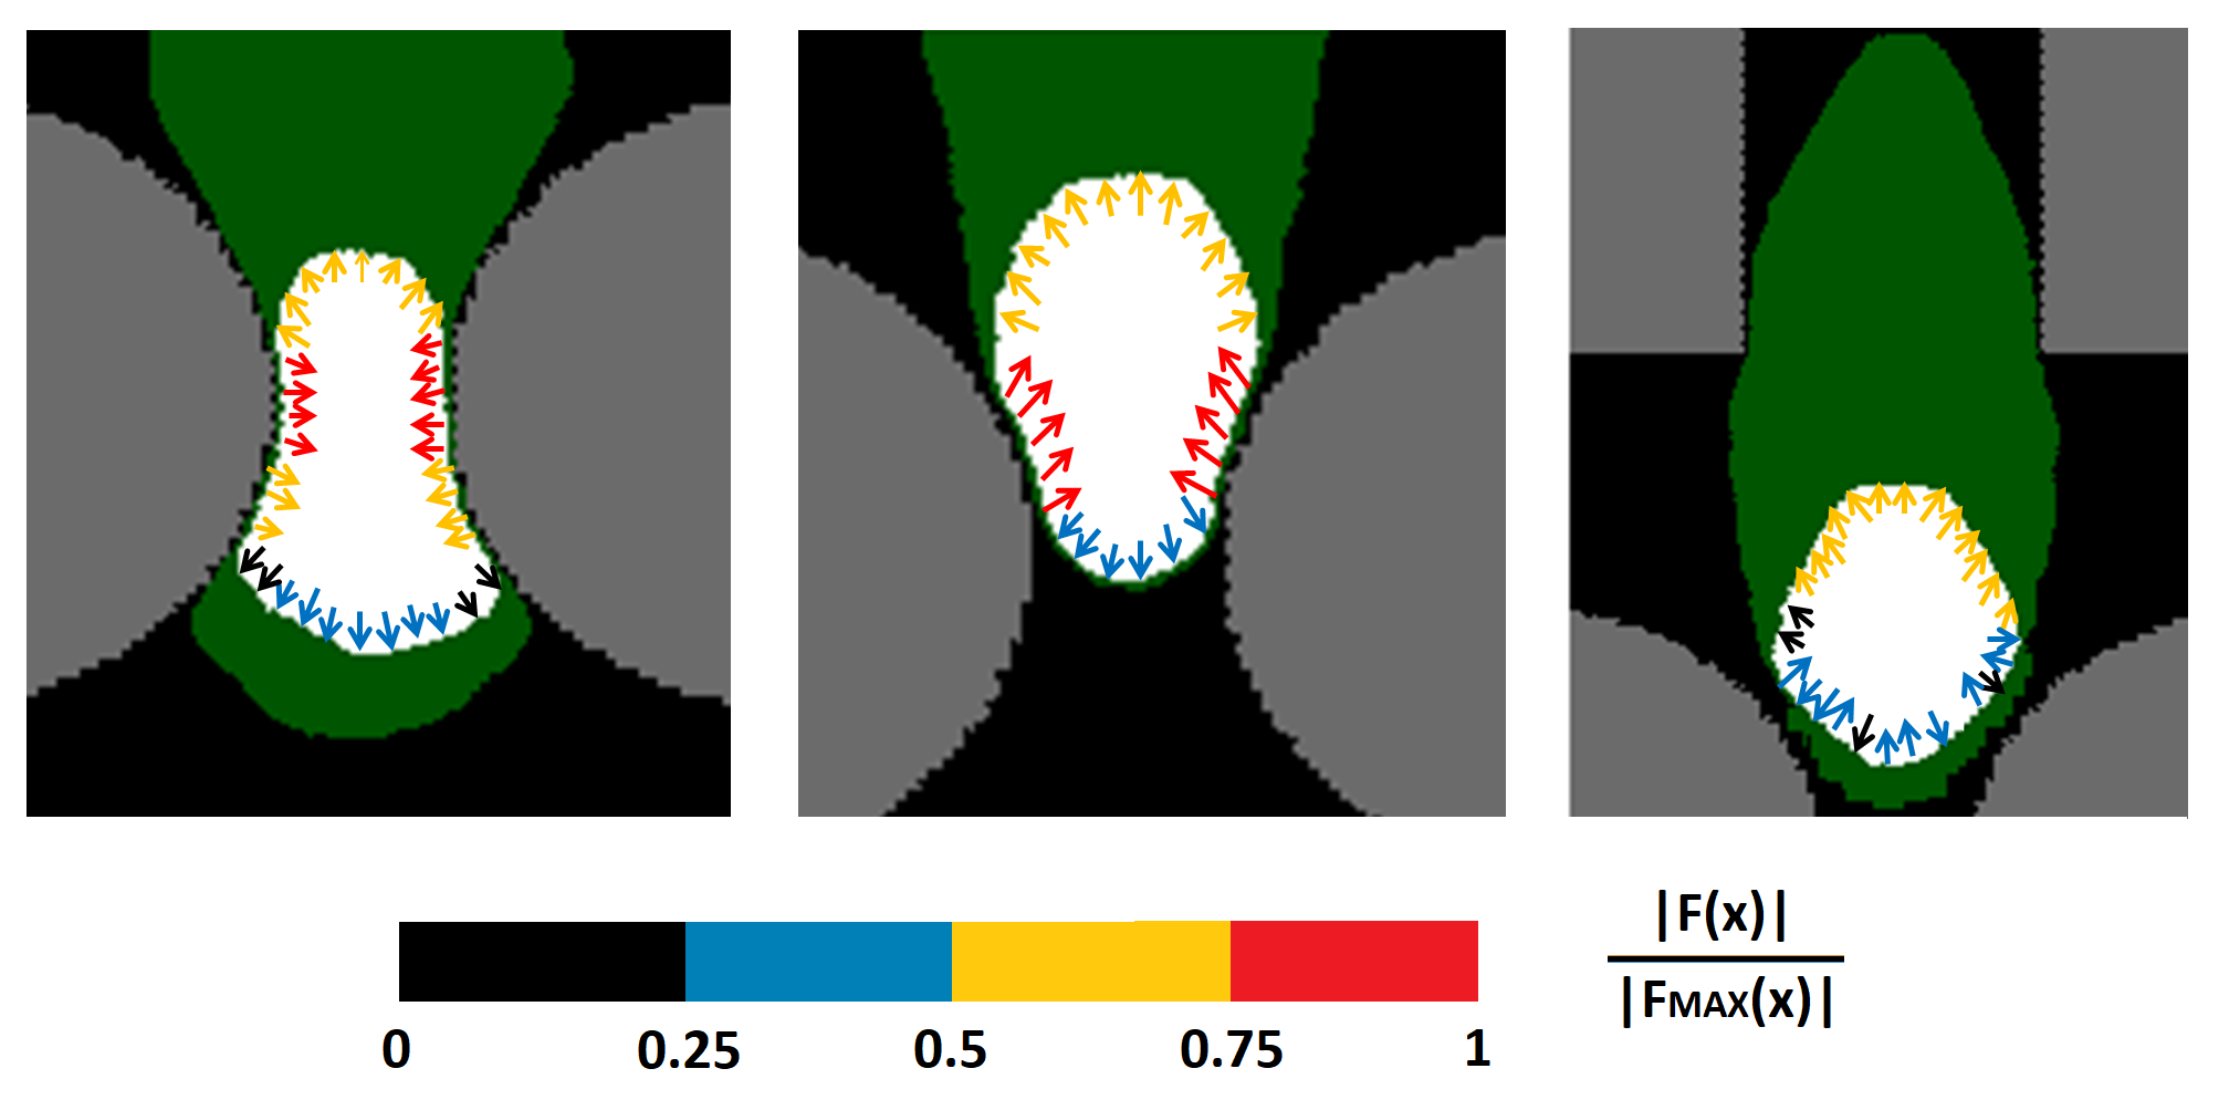
We then turned to analyze the force field at the nuclear boundary at different stages of cell migration. As shown in
Figure 5 (left panel), when the nucleus was squeezing through a constriction, its side edges were characterized by significant inward stresses. Outward forces were instead active at the trailing and leading borders, due to the fact that it had to preserve its surface without perimeter shrinking. As soon as the nucleus had overcome the midpoint of the constriction, the inward stresses momentarily pointed almost towards the top edge of the domain, thereby acting as an instantaneous push for cell movement (see the middle panel in
Figure 5). Finally, when the cell crawled within the rectangular elements, its nucleus was in a rounded relaxed configuration. In particular, its leading edge was subjected to cytosolic adhesive-based dragging forces, whereas its lateral and trailing borders were subjected only to the forces necessary to keep the surface constant while maximizing the contact with the surrounding cell compartment; see
Figure 5 (right panel).
Our numerical outcomes are in remarkable agreement with the analysis of the spatial distribution of nuclear envelope ruptures provided in [
49] in the case of breast adenocarcinoma cells. Cao and colleagues, in fact, showed that, when a malignant individual is passing within a small pore, damage mainly occurs at the front and at the back edge of the nuclear envelope (NE), due to the significant tension. In particular, higher chances of ruptures characterize the leading border, since it is even more stretched than the trailing part. These authors also observed that NE buckling is instead located at the side regions of the organelle, i.e., those subjected to compression. Our results are also in line with those obtained in [
45], where static CPM cells were shown to have inward forces at boundary convex sites and outward forces at concave border grid elements.
3.2. Cell Movement between Round Pillars with Different Spacing
Focusing on the microfluidic device used in [
18], the CPM lattice
had 60 × 468 (respectively, in
x and
y) grid elements that replicated a 30 µm × 234 µm representative channel. The polymeric pillars located in the structure were round, with a diameter of either 15 or 30 µm. The space between pairs of smaller elements was kept fixed and equal to 15 µm, whereas the distances between the three couples of larger pillars were identified by
(with
) and varied to reproduce different channel designs; see
Figure 1C. All the forthcoming simulations lasted nearly 24 h (4.3 ×
MCSs), in accordance with the temporal scale of the corresponding experiments in [
18].
The biologically related parameters, i.e., those grouped in
in Equation (
11), here refer to human fibroblasts and to platelet-derived growth factor (PDGF), in accordance with the materials mainly used in [
18] (refer, also, to the Supplementary Material). They are summarized in
Table 3. In particular, the cell nucleus had an initial diameter
µm, while the extension of the overall individual amounted to 28 µm. We finally remark that the CPM technical parameters, i.e., those included in the set
introduced in Equation (
11), were kept unaltered with respect to the values fixed in the previous section and listed in
Table 1. In particular, we maintained
.
We first assessed the effectiveness of chemotactic-driven cell migration in the case of a channel design characterized by a sequence of constrictions with decreasing widths (
µm,
µm, and
µm, which resulted in
,
, and
). Such a domain layout was used hereafter unless explicitly said. As it is possible to see in
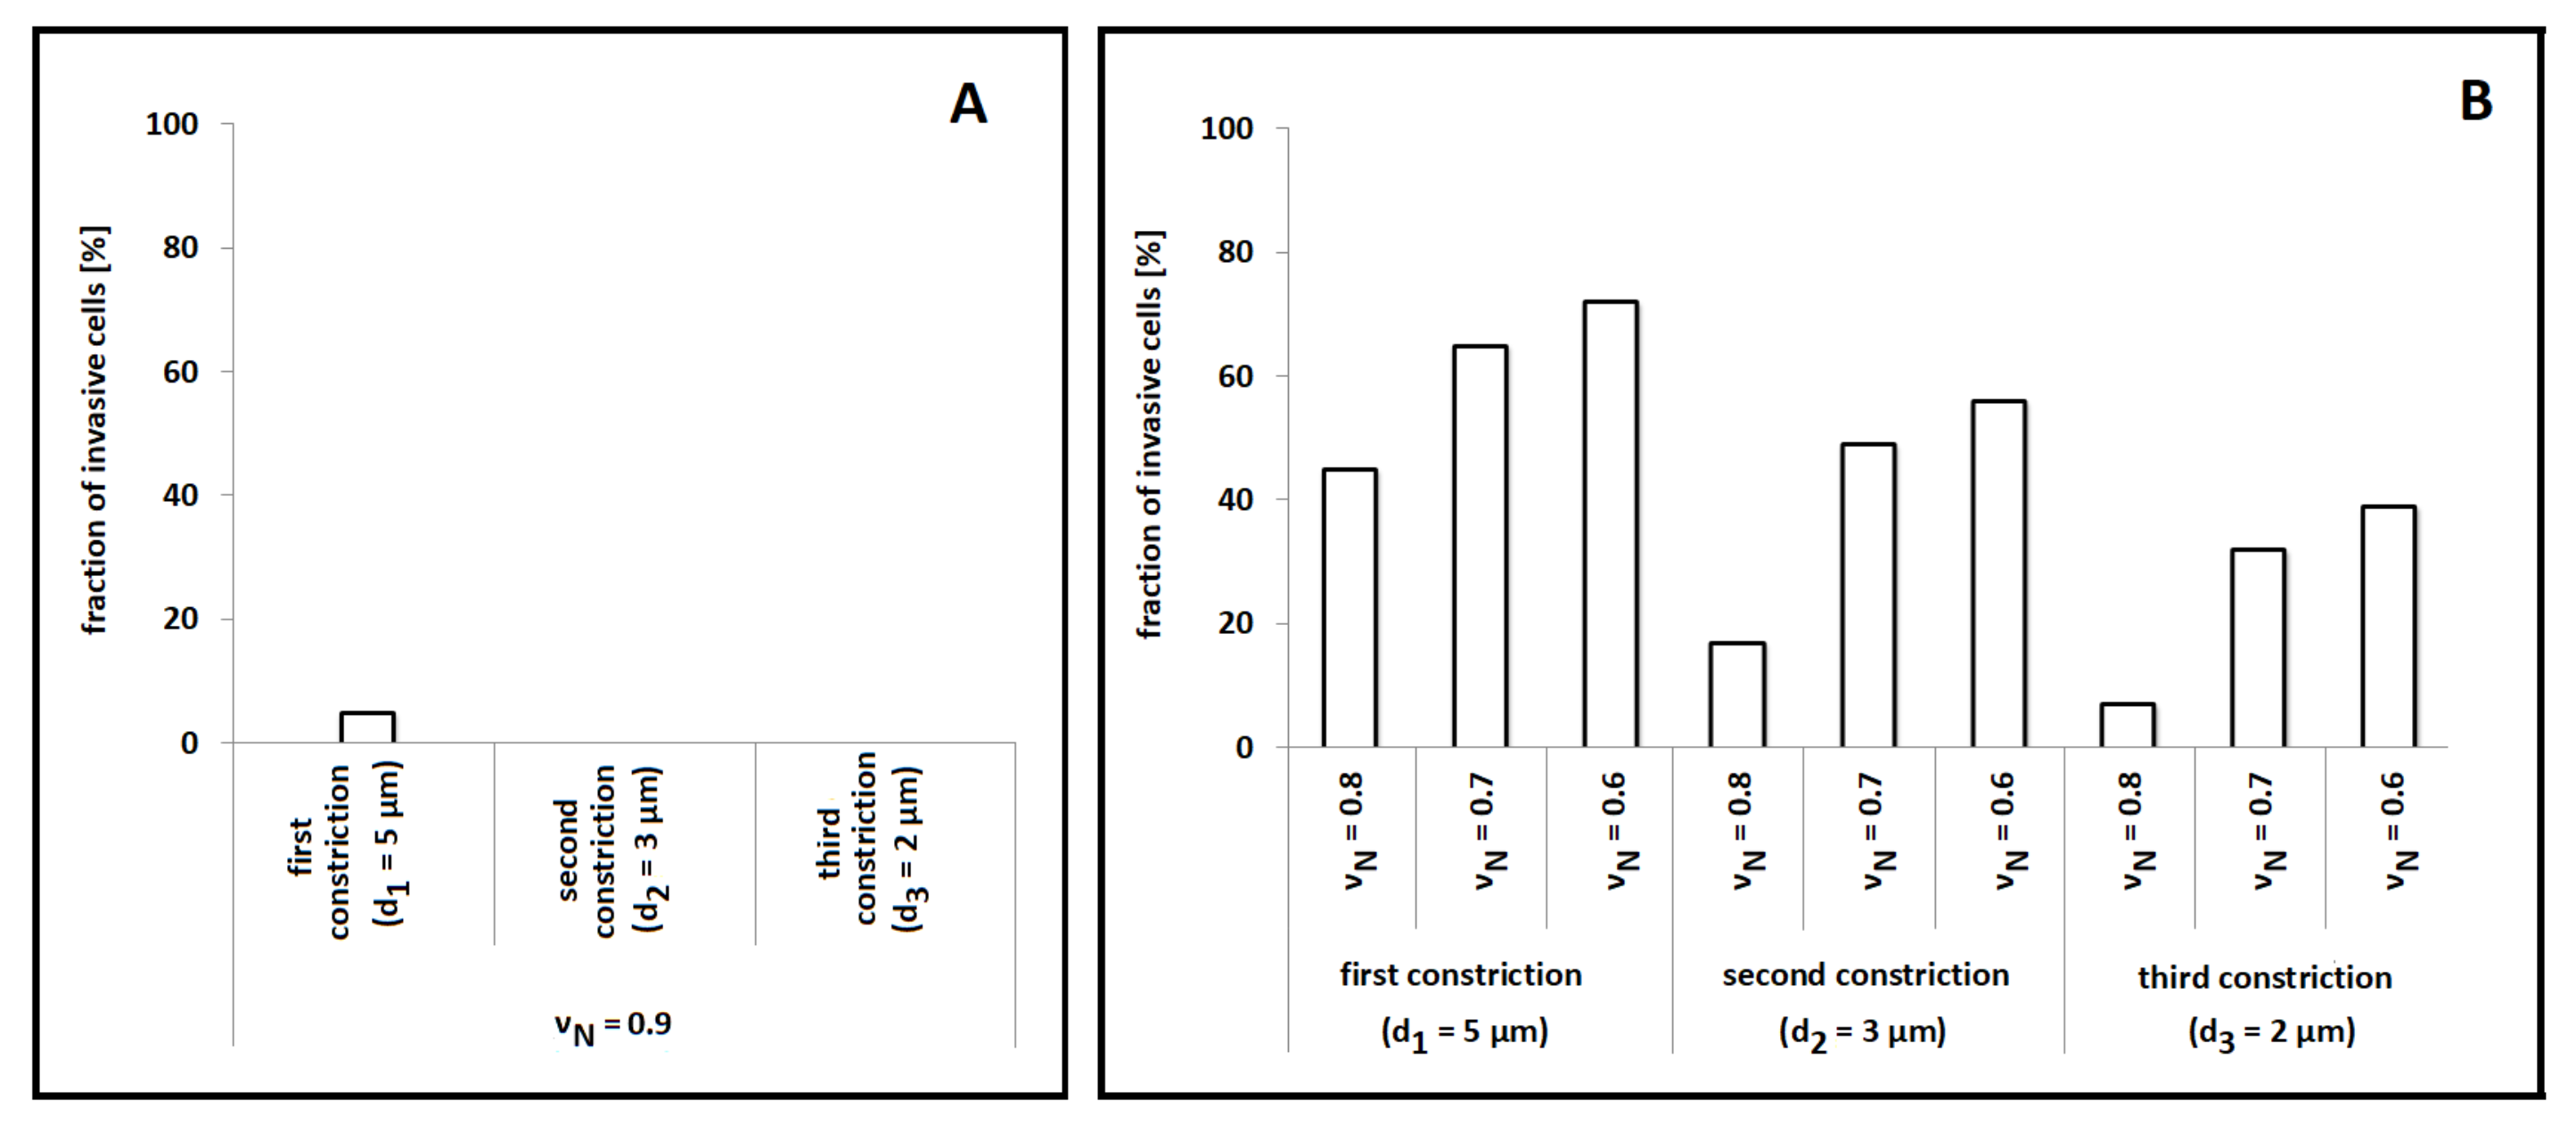
Figure 6A, the virtual cell was constantly unable to invade the entire structure: it in fact overcame the first (largest) constriction only in a few cases. Such numerical results are not surprising if compared with those summarized in
Figure 2. In fact, glioblastoma cells and fibroblasts (used as representative cell lines for the simulations of this and of the previous section, respectively) have almost the same dimensions (compared to the spacing between the pairs of rigid pillars), and their characteristic model parameters were kept unchanged. However, this set of numerical outcomes disagrees with the corresponding empirical evidence. As shown in the Supplementary Figure S4b in [
18], a significant number of experimental cells (i.e., nearly 40%) are able to penetrate the entire channel, in the case of stable chemical gradients. The underlying reason relies on the fact that the cell lines used in [
18] have a more deformable nucleus than those used in [
19] and simulated in the previous section, as a consequence of their deficiency of lamins A and C. These molecules are, in fact, the primary components of the nuclear lamina, the dense protein meshwork underlying the nuclear membrane that has been largely shown to determine the stiffness of the organelle [
19,
50,
51,
52]. To have a closer replication of the in vitro evidence in [
18], we indeed reduced the rigidity of the nucleus of our virtual cell by decreasing the corresponding parameter
, which, however, had to remain larger than
. As shown in
Figure 6B, a remarkable data fitting was obtained when
.
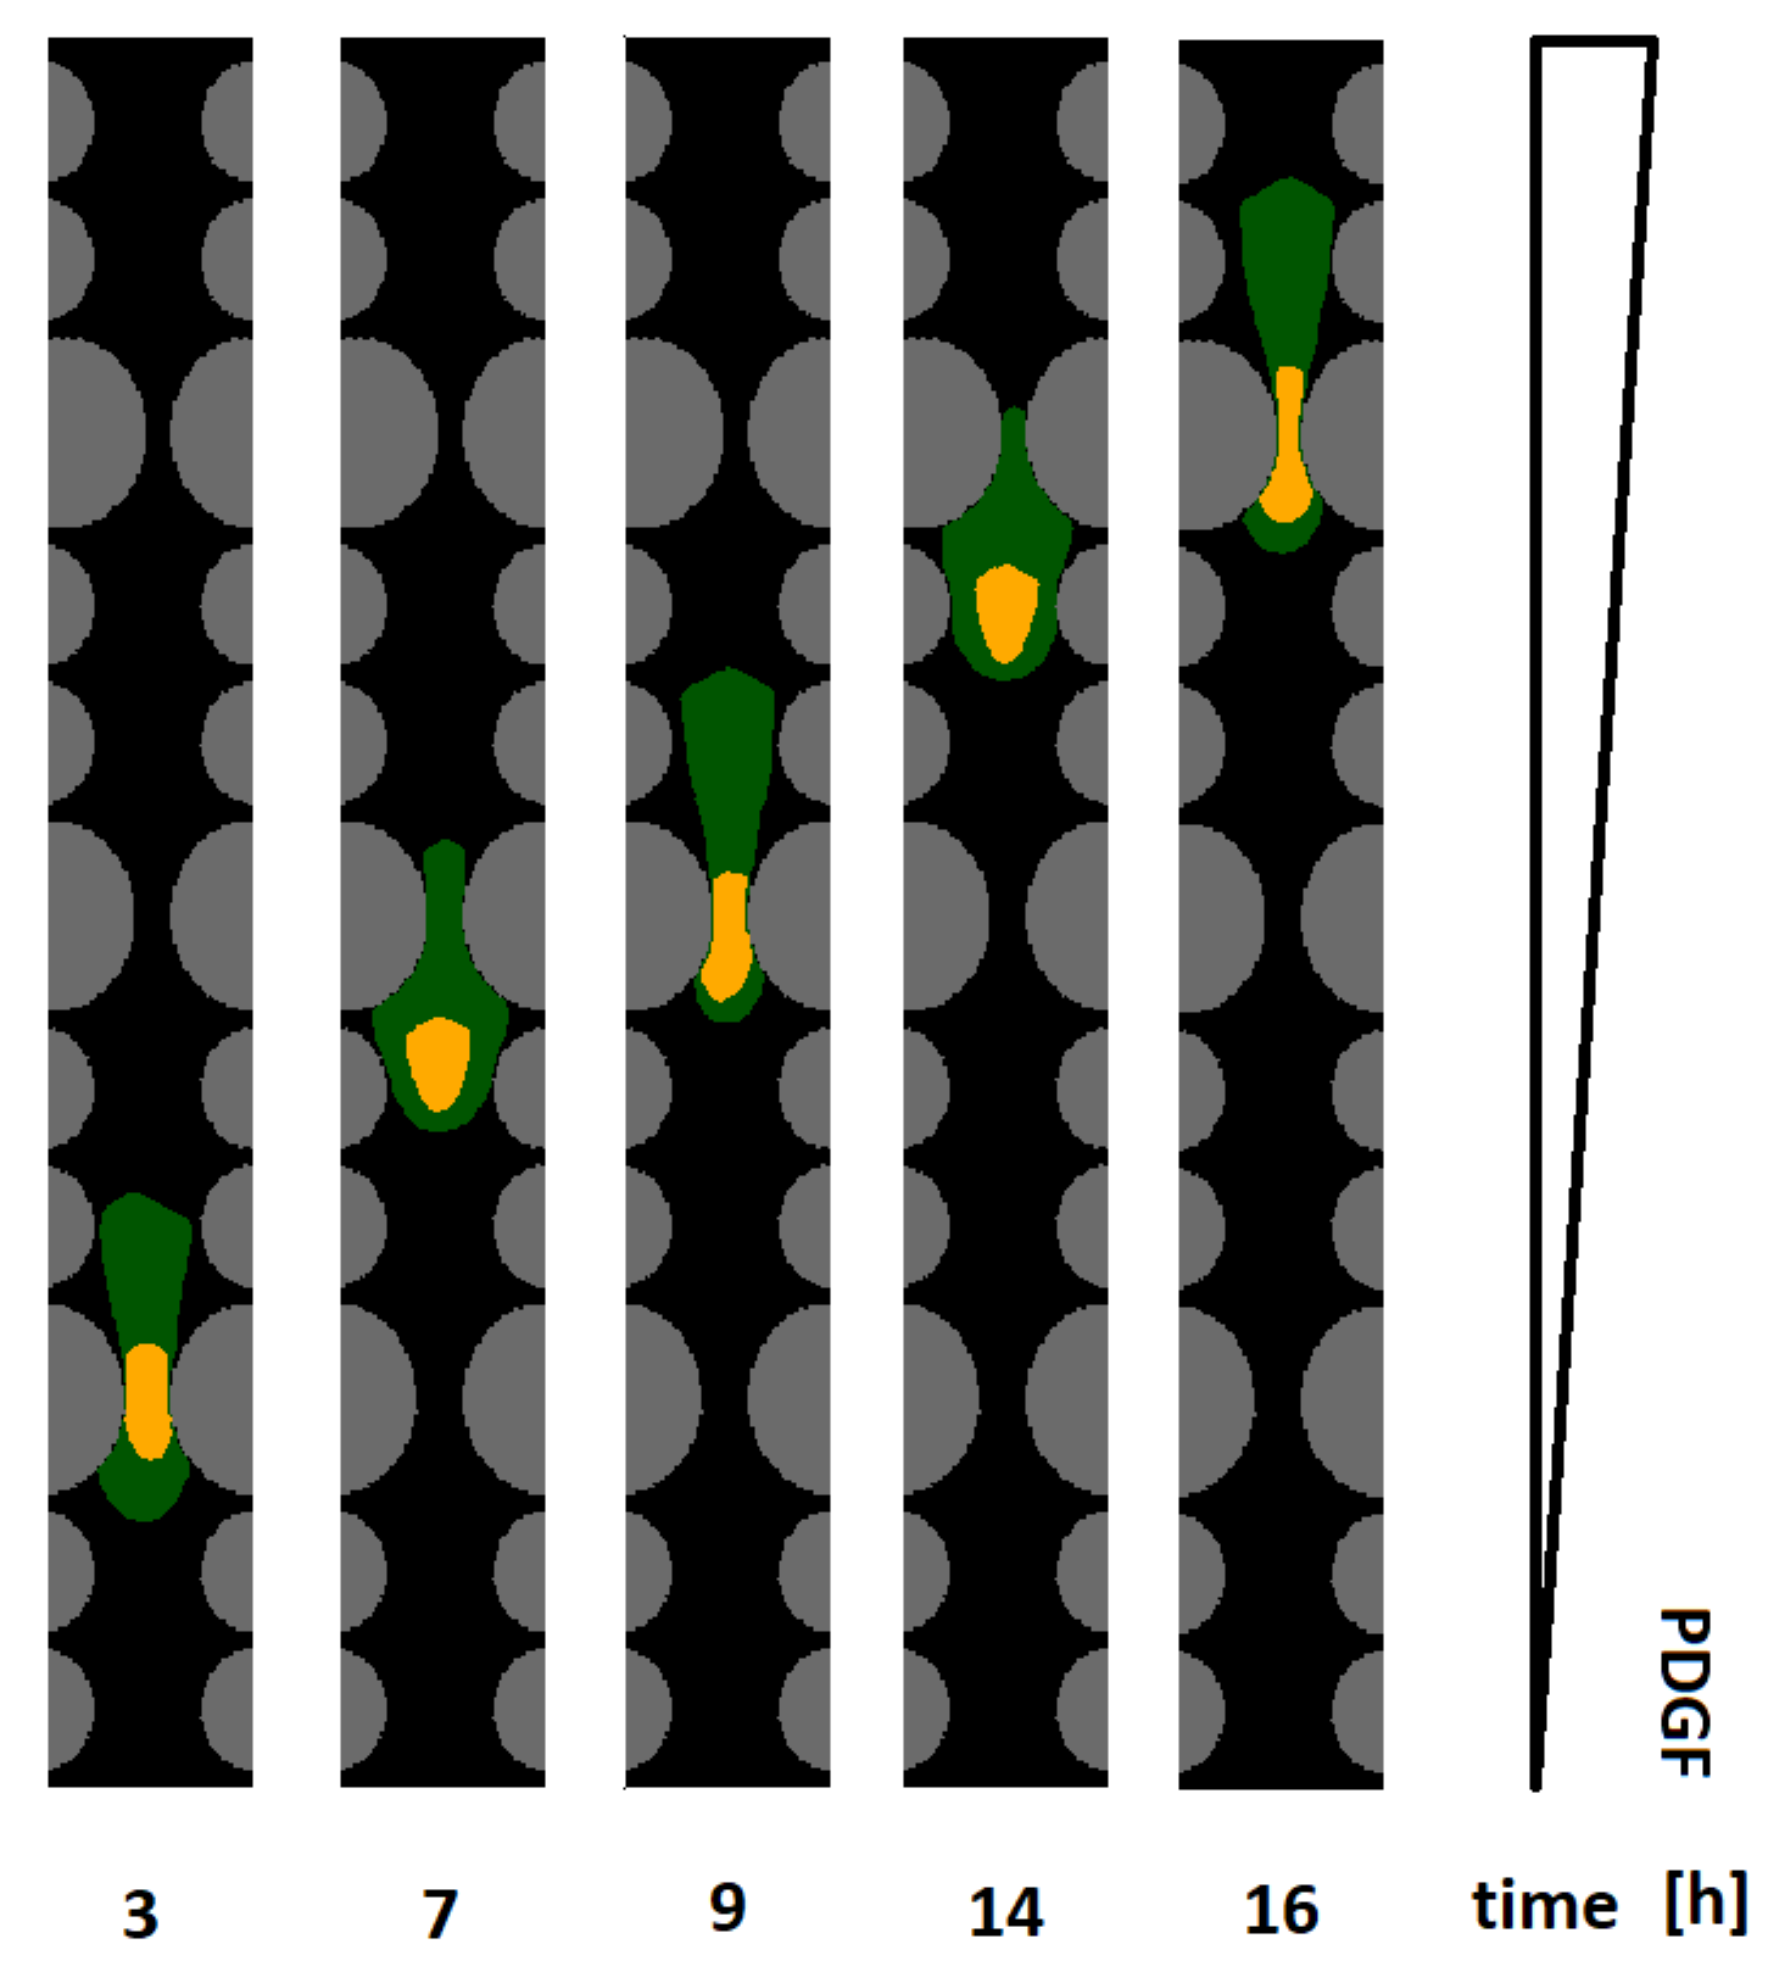
A representative time sequence of a cell able to invade the entire channel, owing to the increased nuclear elasticity, is then proposed in
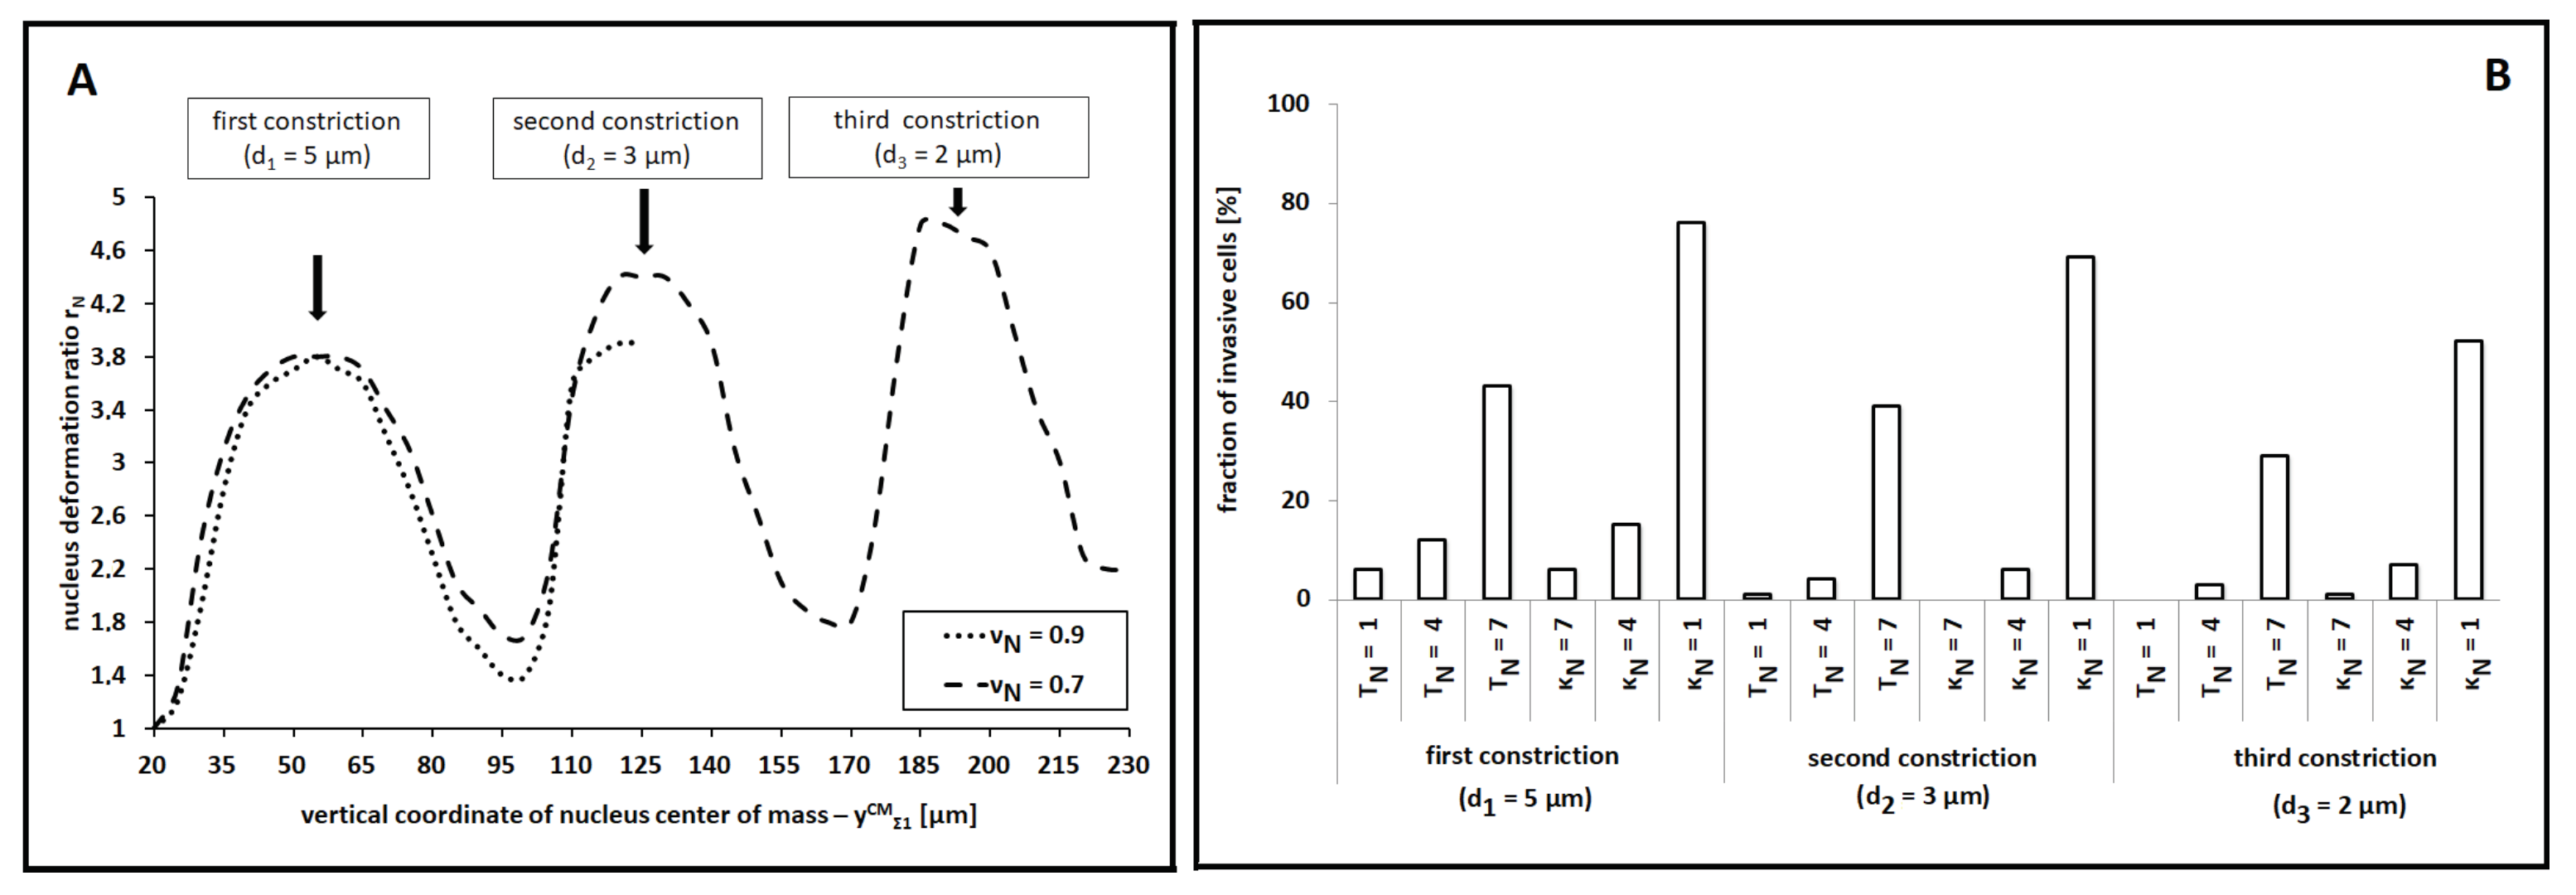
Figure 7: it clearly shows the enhanced nuclear squeezing necessary to promote full invasion. A definitive confirmation in this respect is provided by
Figure 8A, which quantifies the nucleus remodeling for different values of
. From the same graph, we observe a residual deformation of the organelle after its passage through a constriction, as also captured in
Figure 4B.
With a predictive perspective, we then asked if cell migratory behavior could be promoted by variations of other biophysical determinants of the nucleus. In this respect, we no longer reduced the rigidity of the organelle (we kept a high
) but independently enhanced either its motility or its compressibility (which meant, in this context, the possibility of reducing its surface) by altering
or
, respectively. Some reasonable parameter constraints (i.e.,
and
) were, however, maintained. As shown in
Figure 8B, significant increments in cell invasive potential were observed only for substantial variations of the two coefficients (i.e., of at least one order of magnitude from their default values employed up to that point and listed in
Table 1). However, such parametric changes led to unrealistic cell dynamics: too high values of
, in fact, resulted in implausibly high cell and nuclear velocities, whereas too high values of
allowed an unreasonable shrinking of the organelle (that, in a realistic scenario, would cause the pathological death of the individual).
These results are experimentally confirmed in [
18], where the invasive cells were not observed to undergo significant volumetric changes when passing through small constrictions. Substantial variations in nuclear shape not accompanied by similar changes in nuclear volume were also captured in [
49] in the case of breast adenocarcinoma cells. Analogously, in [
13], glioma cell lines were shown to transmigrate through narrow locations in a brain model in vivo, thereby increasing their metastatic potential, by only a significant squeezing of their nucleus due to a recruitment of nonmuscle myosin II (NMMII). Moreover, very recently, Irimia and Toner, in [
53], demonstrated that the directional persistence of cancer cells in microsized structures is completely dependent on the steric hindrance represented by the presence of a rigid and voluminous nucleus.
We further quantified the migration profile of a cell with an enhanced nuclear elasticity (i.e., with
). As shown in panel (A) of
Figure 9, an asymmetry emerged between the velocity of the overall cell,
, and the velocity of its organelle,
. On one hand, as expected, the cell had a maximal speed when crawling between the pairs of smaller pillars. Velocity reductions were instead observed when it approached and passed between the three pairs of larger pillars: in particular, the decrements depended on the width of the constrictions. On the other hand, the speed of the nucleus (i) was constant in the case of locomotion within larger spaces, (ii) completely stalled as a constriction impeded its forward movement, (iii) reached an instantaneous peak once the center of the intracellular compartment had passed the midpoint of the pore, and (iv) finally decreased back to the regime value. The underlying rationale, supported by the numerical results summarized in
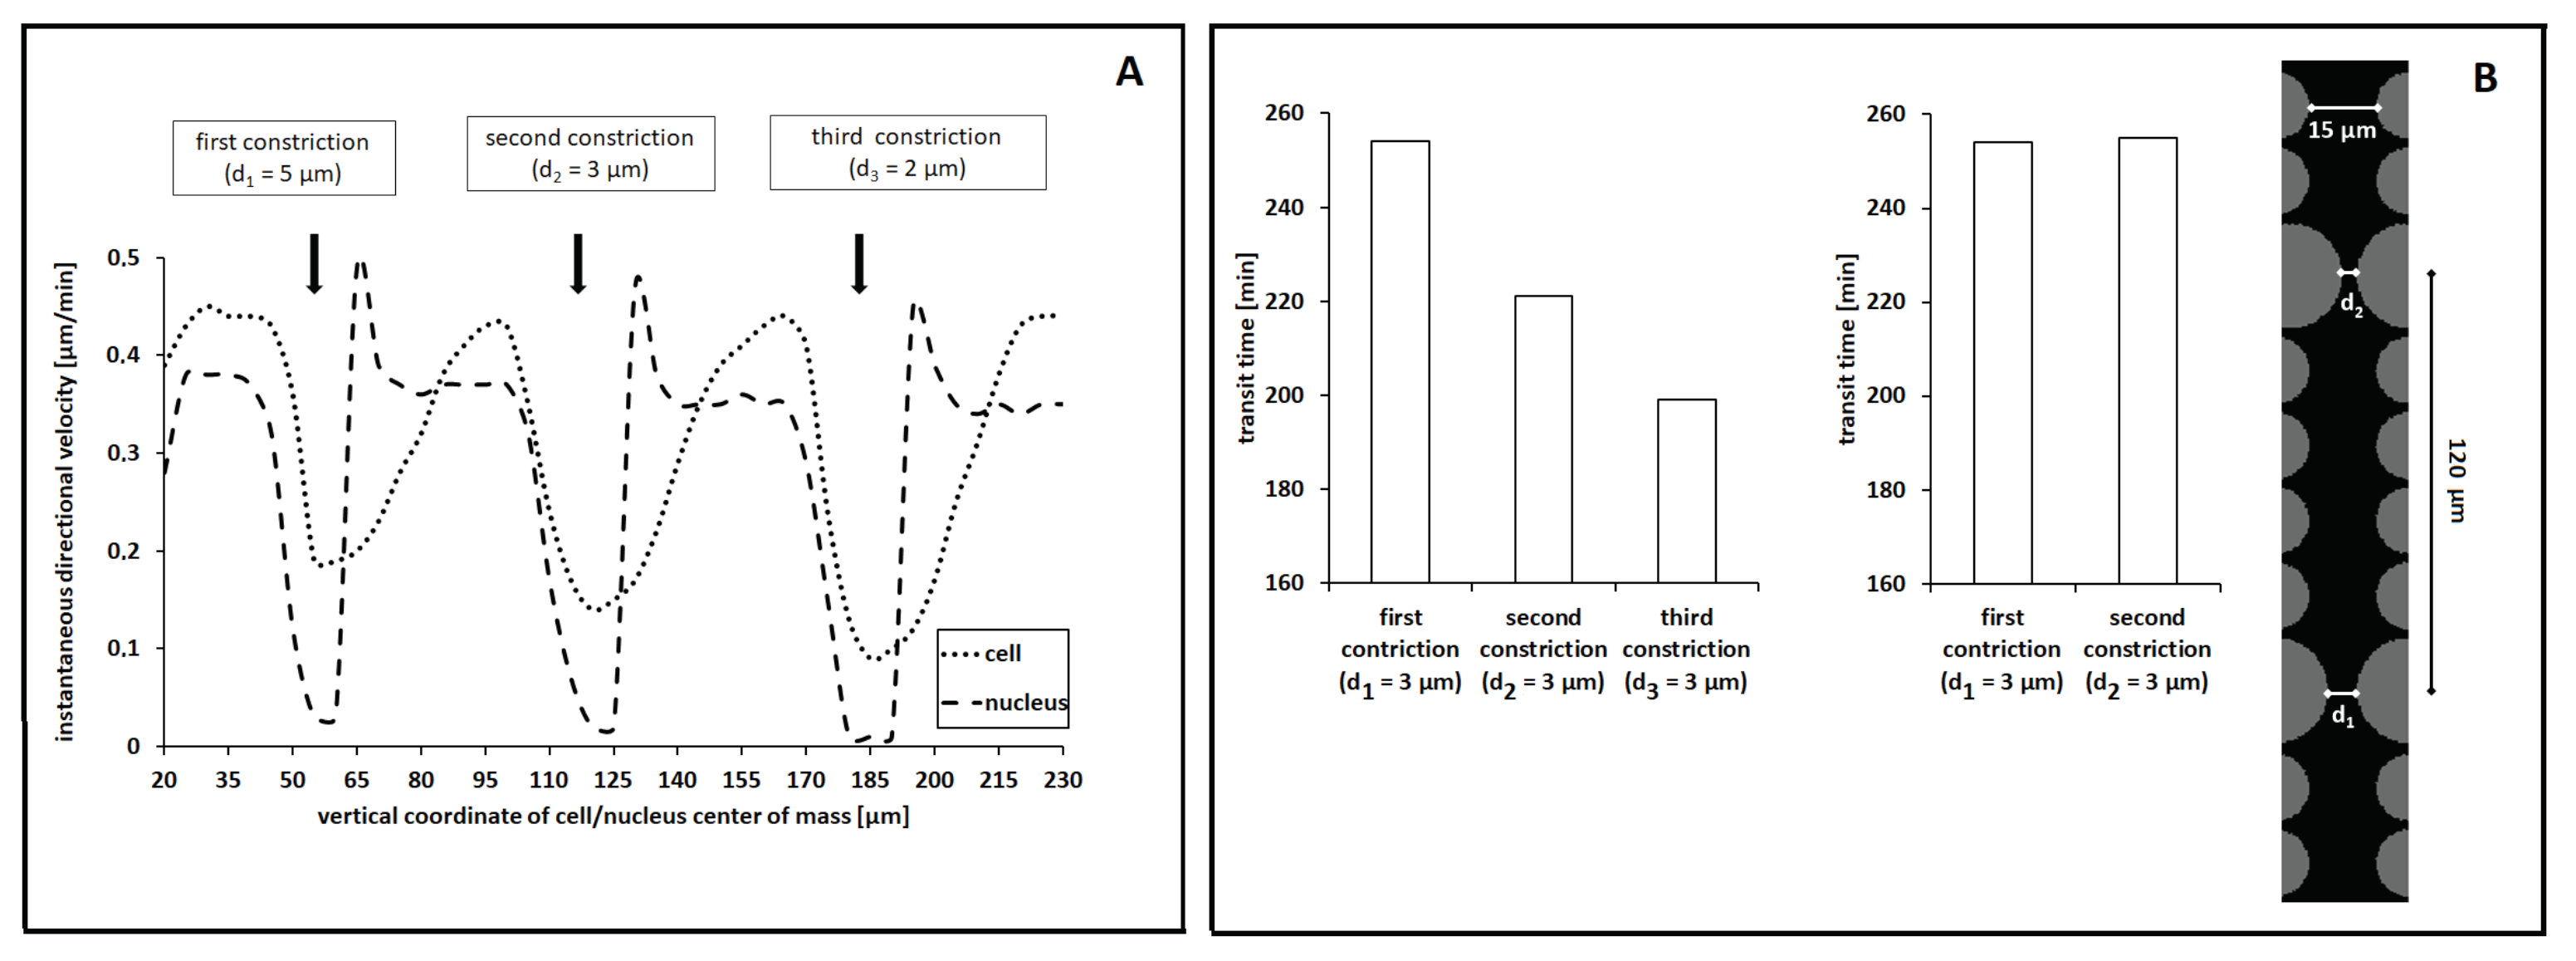
Figure 5 (middle panel), is the following: once the organelle had passed the midpoint of a constriction, the lateral inward compressive forces temporarily aligned in the direction of cell movement. An instantaneous push then emerged, which allowed the nucleus to rapidly slip out from the constriction.
We then assessed whether successful passages through subsequent equal constrictions facilitated cell migration. We indeed compared the transit time within each pore in the case of a channel characterized by
µm (i.e., by
). Additionally, in this case, we fixed
. As it is possible to see from
Figure 9B (left graph), the virtual cell showed a trend towards faster dynamics in the case of transmigration between the second and the third pair of large pillars. A possible explanation relies on the residual deformation that characterized the nucleus after its passage within a constriction, as previously captured in
Figure 5B and
Figure 9A.
To further support this hypothesis, we ran a series of simulations based on a channel characterized by two 3 µm-wide constrictions that were separated by nearly 120 µm (i.e., by a sufficient spacing for the nucleus to relax and recover its original shape; see the inset in
Figure 9B). The rest of the parameter settings were kept unaltered, with
. As shown in
Figure 9B (right graph), the transit time was the same for the passage within both pores. Such computational outcomes support our prediction but are in partial contrast with the corresponding experimental evidence. In [
18], the authors in fact claim that the facilitated cell movement observed in the case of subsequent constrictions is not due to temporary residual nuclear deformations, since a reduction in the transit time was also captured in the case of spaced-enough pores. They indeed suggest that migrating cells may undergo long-lasting biochemical adaptations such as, for instance, further degradation of lamin proteins or reorganization of the cytoskeletal elements to which the nucleus is anchored. In this respect, Cao and coworkers, in [
49], found that (i) the nuclei of lamin A/C-deficient cells (as those used in [
18]) behave as plastic materials undergoing large irreversible deformation in the case of passages within small pores and that (ii) the nuclei of malignant cells with expressed and active A/C lamins are instead characterized by the coexistence of elastic dynamics in their envelopes and of plastic dynamics in their interiors. Such two competing effects often result in an ellipsoidal configuration of the nucleus after the exit from a pore, which is then followed by its relaxation towards a more round shape (as captured by our model).
4. Discussion
The analysis of the mechanisms underlying cell migration within confined environments has recently become a major topic in experimental research, due to cell migration’s recognized importance in physiopathological phenomena and its exploitation for tissue engineering. In this respect, an increasing number of in vitro models have been developed: they mainly consist of the use either of matrix scaffolds, which mimic in vivo fibrous connective tissues, or of micropatterned devices characterized by predefined channel-like structures.
The resulting evidence has, first, provided insight into selected adhesive and proteolytic mechanisms that motile individuals activate to achieve efficient locomotion in narrow spaces. Furthermore, it has been largely shown that pivotal regulators of cell movement, and, therefore, potential targets for pharmacological interventions in human diseases, are represented by the elastic properties of the cell and of its internal organelles. More specifically, experimental outcomes have revealed the implications of nuclear deformation capacity in the migratory behavior of the overall individual (see, for example, [
13,
14,
15,
16,
20,
21,
53]).
However, despite the development of such a variety of empirical approaches, little has been done, to our knowledge, from a theoretical point of view, except for a pair of chemomechanical approaches [
49,
54]. We recently tackled this shortcoming by a series of ad hoc versions of the Cellular Potts model (CPM), which analyzed selected aspects of single cell locomotion within matrix environments [
28,
29,
30]. As a common feature of the proposed approaches, the moving individuals have been represented as physical objects compartmentalized into the nucleus and cytoplasm, whereas the extracellular domain has been, in turn, differentiated into a medium and a polymeric component. In particular, the introduction of distinct subcellular units has been a fundamental aspect for achieving a detailed description of cell motile behavior within structures of microsized dimensions.
Such models were, here, improved by (i) the use of a tailored Boltzmann transition probability, able to account for the specific type of cell configuration update (i.e., the retraction/extension of the cytosol or reorganization of the nuclear cluster), and (ii) the definition of a procedure to evaluate the force field that acted on the nuclear boundary during the different phases of cell migration.
The resulting CPM was then employed to reproduce the experimental systems used in [
18,
19], which consisted of microfluidic-based devices composed of dozens of arrays of polymeric pillars with different geometries and dimensions.
Taken together, our results first confirm that mobile cells are able to overcome the effects of size exclusion in the case of small-enough pores by only a substantially high deformability of their nucleus, in accordance with a wide range of empirical studies, e.g., [
10,
13,
14,
15,
16,
18,
19] and references therein. The proposed numerical outcomes further reveal that, during the passage within a constriction, (i) inward stresses are active along the compressed side edges of the organelle and (ii) outward forces act at its leading and trailing borders. Interestingly, our simulations also showed that, as soon as the nucleus had overcome the midpoint of a pore, inward forces temporarily aligned with the direction of cell movement, representing, therefore, an instantaneous push for nuclear locomotion. This, according to us, is the rationale underlying the peak in the nuclear velocity that was experimentally captured in [
18].
We also observed that passages within successive constrictions were facilitated by residual nuclear deformation. This result, as commented in the text, is in contrast with the corresponding empirical evidence in [
18]: such a discrepancy may be due to the fact CPM objects have a full elastic behavior, whereas biological cells can instead undergo long-lasting biochemical adaptations that impact the deformation capacity of their internal organelles, an aspect not included in the CPM used here.
Summing up, our computational results are mostly characterized by a remarkable agreement with their experimental counterparts, representing further complementary determinations as well. In the case of discrepancy between numerical and empirical outcomes, we either adapted our approach in order to tackle the issue or found out a plausible underlying rationale.
Of course, a more realistic reproduction of the proposed experimental settings would be obtained by three-dimensional simulations. This computational refinement would allow having a closer
quantitative comparison between in vitro and in silico results, mainly in terms of observables such as the cell and nuclear speed and time taken by the cell to squeeze between channel constrictions. In this respect, it is reasonable to hypothesize that the displacement and the deformation of a 3D cell body would be slower than the corresponding 2D dynamics. However, the
qualitative fitting of our results w.r.t. their empirical counterparts would not change. In fact, the cells seeded within the microfluidic devices used in [
18,
19] did not experience spatial limitations in the direction orthogonal to the plane of movement, as the rigid pillars (and, therefore, the entire channels) seemed to be “tall” enough to allow a comfortable arrangement of the cell body in this respect. This aspect is confirmed by the fact that, in the experimental images and videos, the cells were constantly adherent to the substrate and subjected only to lateral deformations. For the sake of completeness, we finally remark that a 3D extension of the model would be straightforward: it would only amount to a revision of the parameter estimates, whereas the main aspects of the proposed approach (i.e., the tailored Boltzmann probability, the terms in the Hamiltonian and the law regulating the chemical kinetics) would not require any modification.
Despite the limitations typical of the theoretical modeling, it would be biologically relevant to apply our approach to scenarios not strictly related to experimental assays. First, our study may contribute to a more detailed understanding of how cancer cells invade surrounding confined tissues, permeating through the stroma and eventually entering the vasculature. In fact, these processes mainly involve the ability of single metastatic malignant cells to squeeze and crawl within confined environments with a limited space available due to the presence of dense matrices and cell linings.
It would also be interesting to analyze if the relation between nuclear deformability and cell invasive potential varies, in terms of relevance, in the case of collective migration, which is typically involved in most in vivo phenomena. In these cases, a differentiation may in fact occur among individuals within the same ensemble, such as the emergence of tip and stalk cells during angiogenic processes, which may imply differentiated motile phenotypes [
55,
56].
The proposed approach could be finally applied to the design of synthetic implant materials, i.e., acellular scaffolds with optimal values of pore size that may accelerate cell in-growth, critical for regenerative treatments [
4,
5,
57].
However, to increase the realism of the future model applications, some mechanisms/processes, here disregarded but that play a major role in establishing cell migratory ability, should be included, such as (i) matrix digestion and deposition by moving individuals, which alter the surrounding space by opening paths, generating traction, increasing adhesion, and contact guidance, and (ii) possible pressure-driven displacements of tissue walls, which result in an adjustment of the geometry of the surrounding environment that may facilitate individual locomotion [
56].
A significant model improvement would finally amount to the inclusion of intracellular chemical pathways, triggered by external stimuli of distinct natures. For instance, chemotactic substances (e.g., EGF and PDGF) typically activate PM receptors and therefore initiate downstream cascades that involve the biosynthesis, in the sub-plasma-membrane regions, of molecular mediators such as PI3K and MAPK [
58]. Such molecules in turn induce the production of small GTPases [
59], which are able to regulate several cell responses, including adhesion, migration, and, eventually, proliferation (which is not relevant for our study). From a modeling perspective, one could first focus on a subgroup of these endogenous chemicals and describe their interconnected kinetics by a system of PDEs, solved within the cytosolic compartment of the virtual cell. Constitutive laws should then be set to establish the dependence of CPM parameters, such as the Boltzmann temperatures
T and the mechanical moduli
and
(i.e., those that describe cell properties), on the amount and the distribution of the endogenous chemicals included in the picture. We employed such a strategy to analyze the role of intracellular calcium signals, stimulated by an exogenous chemoattractant, in the process of vascular formation; see [
39,
60].
Intracellular pathways can be also activated by mechanical stimuli. In this respect, it would be relevant to relate lamin dynamics, which, as seen, regulate nuclear deformability, to the intensity of the stresses to which the nuclear envelope is subjected (that can be measured in terms of the moduli of the forces and or of the deformation ratio ). Coherently, the parameter should be defined as a function of the actual amount of lamins present within the cell.
Molecular inside-out signaling also occurs between moving cells and ECM elements, which are able to change the activity of intracellular molecular motors such as the already-cited GTP proteins, thereby mediating cytoskeletal contractility (Rac and Rho) [
11].
It is useful to remark that the inclusion of one or more of the above-described intracellular dynamics is facilitated by the compartmentalization approach at the basis of our cell representation: it in fact allows a proper localization of the endogenous pathways of interest. However, we have to underline that such model refinements would be computationally expensive (especially in the case of the inclusion of complex-enough chemical cascades).


