Volatility Co-Movement between Bitcoin and Stablecoins: BEKK–GARCH and Copula–DCC–GARCH Approaches
Abstract
:1. Introduction
- (1)
- How can stablecoins stabilize cryptocurrencies? What potential role will stablecoins perform in the violent price fluctuations in conventional cryptocurrencies?
- (2)
- How do they play the roles of the gold- or USD-pegged stablecoins as safe-havens, diversifiers, or hedges against conventional cryptocurrencies during the financial crisis?
2. Literature Review
3. Methodology and Econometric Model
3.1. Range-Based Volatility for Various Variance Estimators
3.2. The BEKK–GARCH Model with Low, High, and Closing Prices
3.3. The Copula–DCC–GARCH Model
3.4. VAR Granger-Causal Perspective
4. Empirical Results and Portfolio Implications
4.1. Data Description and Results Analysis
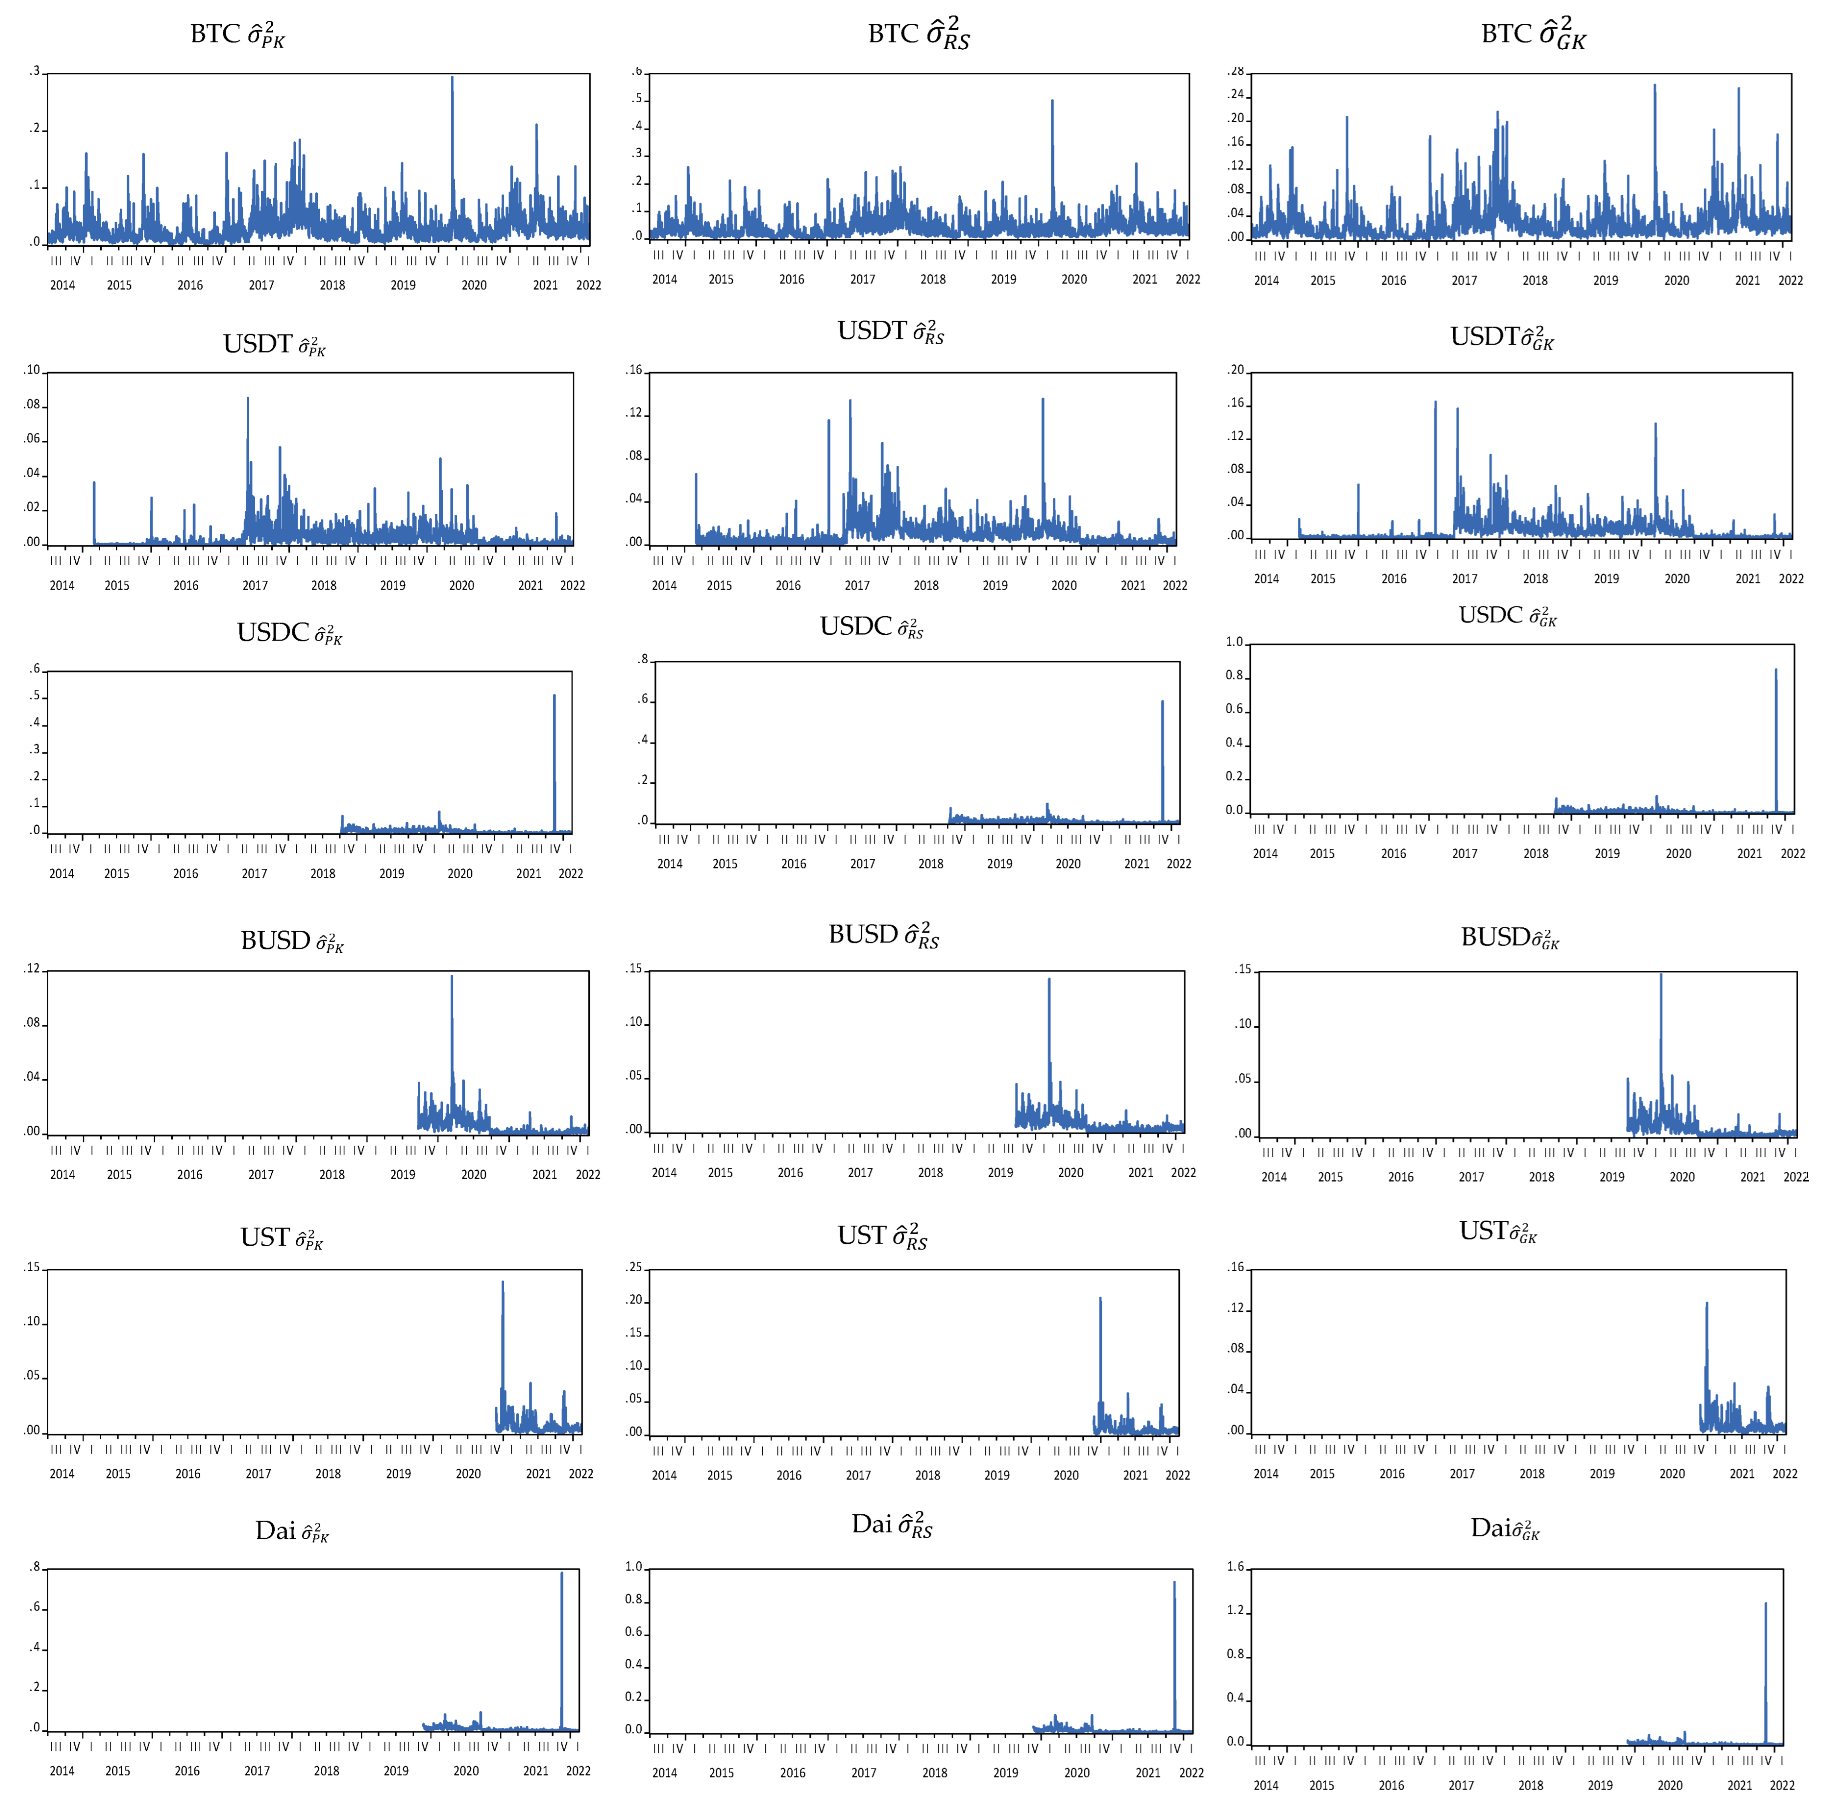
4.2. Results of Range-Based Volatility Approaches
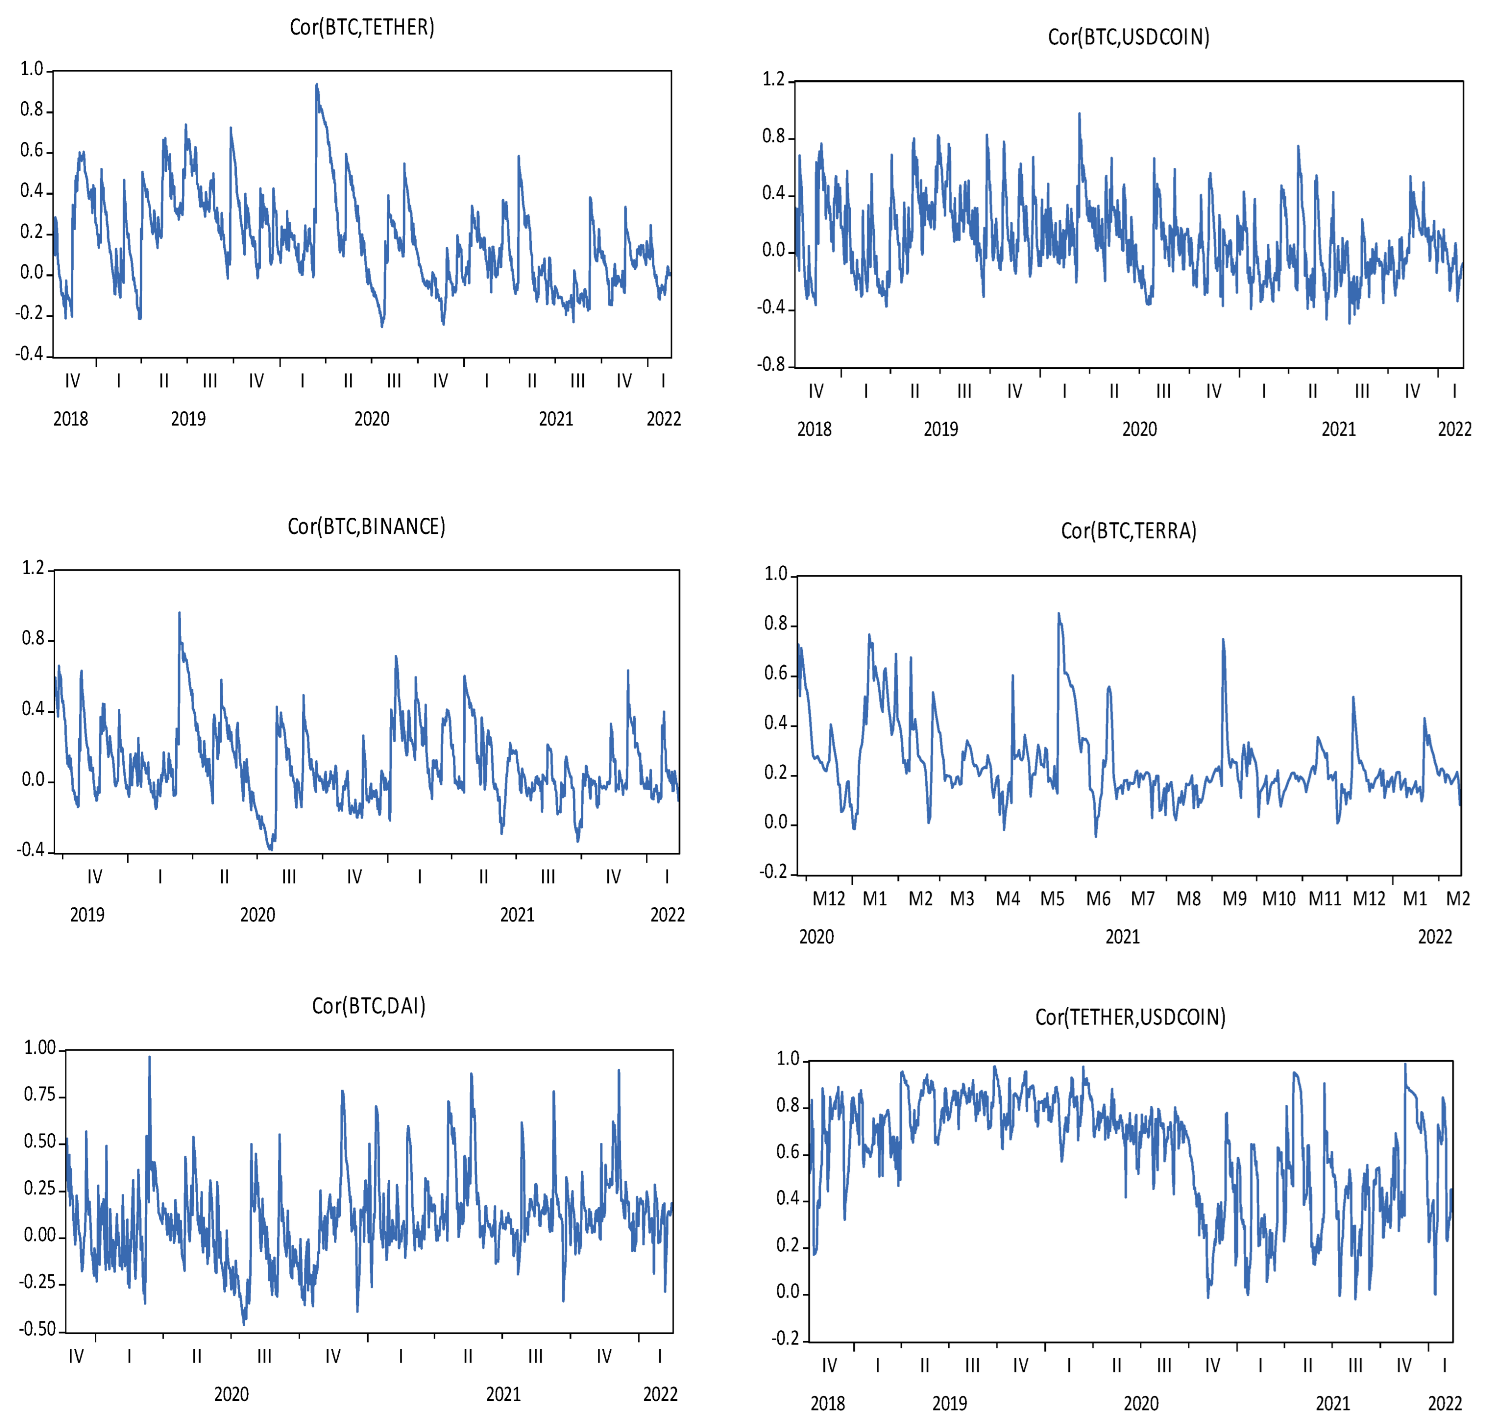
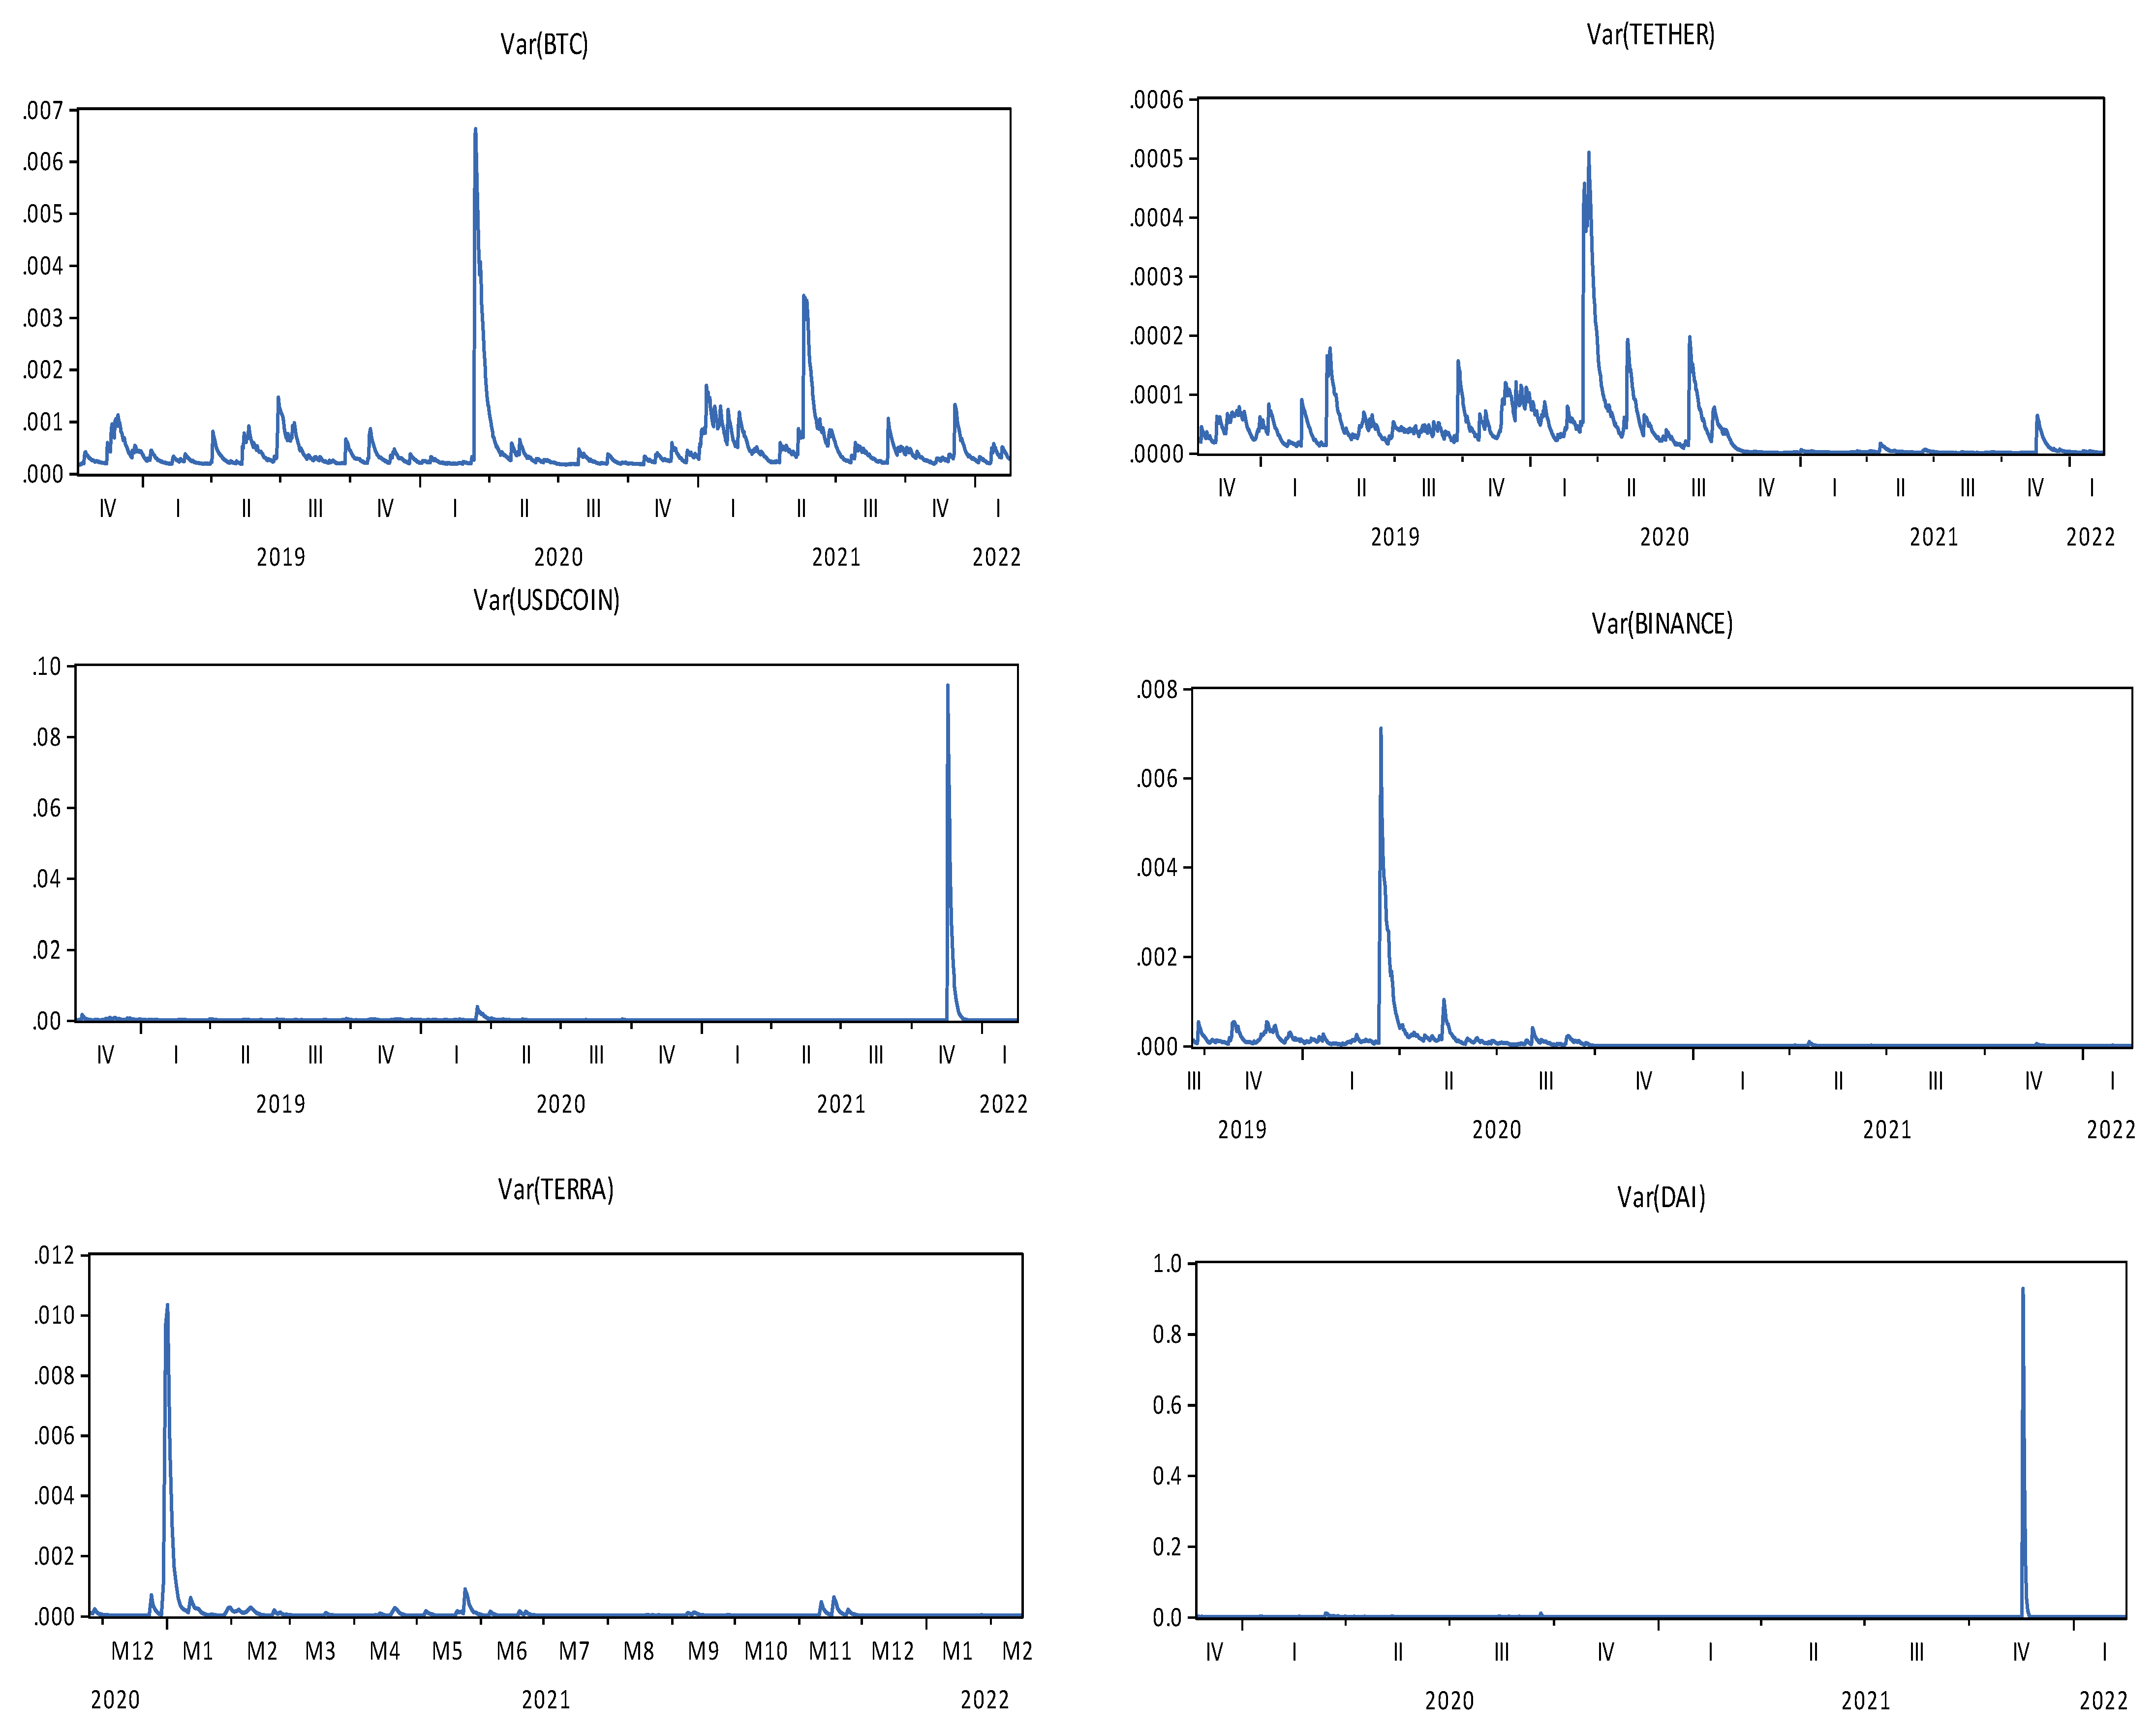
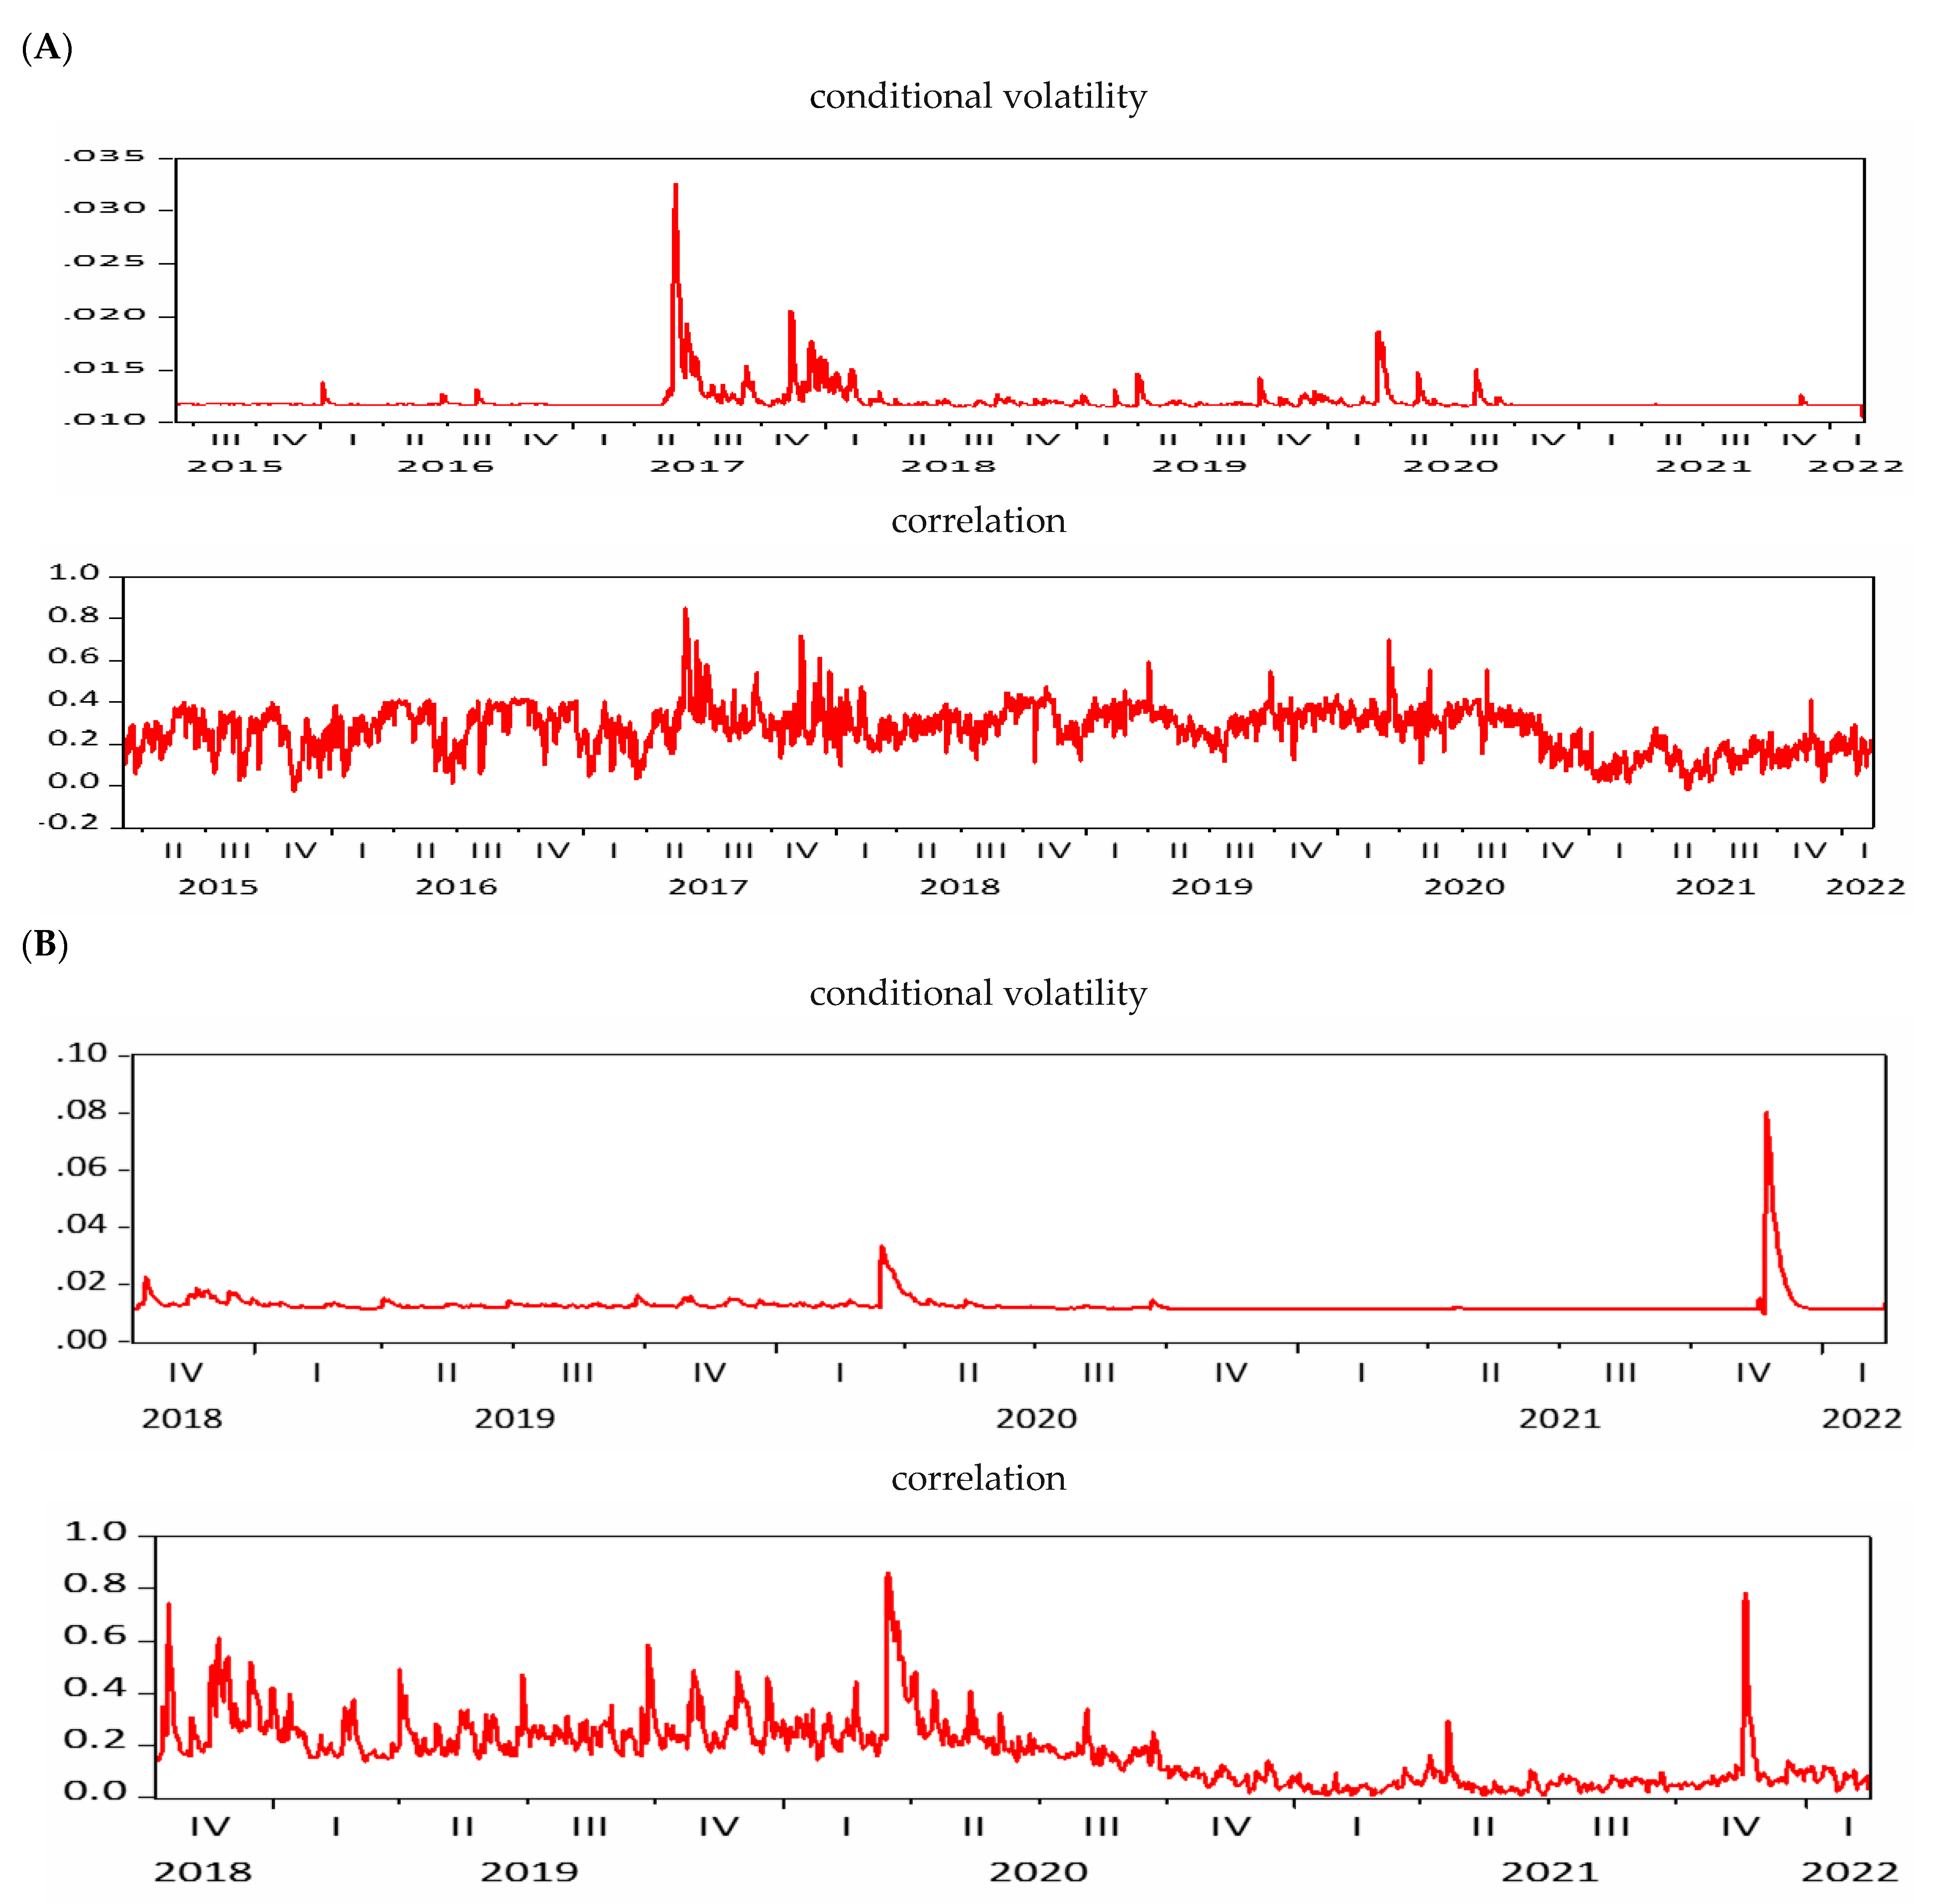
4.3. The BEKK–GARCH Model Results
| BTC | USDT | USDC | |||||||
| Mean | 0.027852 | 0.039245 | 0.026614 | 0.003601 | 0.008880 | 0.007804 | 0.006659 | 0.008199 | 0.008770 |
| Median | 0.021601 | 0.029224 | 0.020030 | 0.001627 | 0.006115 | 0.003756 | 0.004761 | 0.005316 | 0.006336 |
| Maximum | 0.293944 | 0.502468 | 0.260957 | 0.085431 | 0.135782 | 0.165381 | 0.513387 | 0.852999 | 0.604452 |
| Minimum | 0.001509 | 0.002208 | 0.00000 | 0.00000 | 0.00000 | 0.00000 | 0.00000 | 0.00000 | 0.00000 |
| Std. Dev. | 0.024004 | 0.035389 | 0.024461 | 0.005599 | 0.010579 | 0.011057 | 0.016240 | 0.025962 | 0.019211 |
| Skewness | 2.629541 | 2.805815 | 3.057525 | 4.288796 | 3.808302 | 4.657458 | 25.18825 | 28.40215 | 24.75231 |
| Kurtosis | 15.66039 | 19.39226 | 18.48525 | 36.56806 | 30.51883 | 46.13120 | 775.5576 | 916.5785 | 756.4662 |
| Jarque-Bera | 21824.92 | 34860.31 | 32188.31 | 127091.2 | 86319.75 | 206145.8 | 30643454 | 42835202 | 29149533 |
| Probability | 0.0000 *** | 0.0000 *** | 0.0000 *** | 0.0000 *** | 0.0000 *** | 0.0000 *** | 0.0000 *** | 0.0000 *** | 0.0000 *** |
| ADF Prob. | 0.000 *** | 0.000 *** | 0.000 *** | 0.000 *** | 0.000 *** | 0.000 *** | 0.000 *** | 0.0001 *** | 0.000 *** |
| Observations | 2787 | 2541 | 1227 | ||||||
| BUSD | UST | DAI | |||||||
| Mean | 0.005365 | 0.007254 | 0.006639 | 0.006856 | 0.009021 | 0.008113 | 0.008600 | 0.011459 | 0.010367 |
| Median | 0.002472 | 0.004455 | 0.003222 | 0.004513 | 0.006033 | 0.005369 | 0.003829 | 0.005728 | 0.004364 |
| Maximum | 0.116571 | 0.142981 | 0.147835 | 0.139373 | 0.207474 | 0.127793 | 0.784088 | 0.923166 | 1.294481 |
| Minimum | 0.00000 | 8.28E-05 | 0.000000 | 0.000000 | 0.000761 | 0.000231 | 0.00000 | 8.29E-05 | 0.000173 |
| Std. Dev. | 0.007848 | 0.009522 | 0.009652 | 0.010094 | 0.014627 | 0.010172 | 0.029895 | 0.035559 | 0.048217 |
| Skewness | 5.831186 | 6.171779 | 5.831963 | 7.907933 | 9.580432 | 5.761683 | 22.11235 | 21.38384 | 23.87537 |
| Kurtosis | 65.26500 | 70.74781 | 65.83852 | 89.76793 | 118.6213 | 54.09976 | 560.7605 | 535.2409 | 622.9322 |
| J.-B. | 147141.2 | 173878.1 | 149773.3 | 145204.5 | 256394.8 | 51220.84 | 10656834 | 9705600 | 13160374 |
| Probability | 0.0000 *** | 0.0000 *** | 0.0000 *** | 0.0000 *** | 0.0000 *** | 0.0000 *** | 0.0000 *** | 0.0000 *** | 0.0000 *** |
| ADF Prob. | 0.000 *** | 0.000 *** | 0.000 *** | 0.000 *** | 0.000 *** | 0.000 *** | 0.000 *** | 0.001 *** | 0.000 *** |
| Observations | 880 | 448 | 817 | ||||||
4.4. VAR Granger Causality Test Results
| BTC-USDT | BTC-USDC | BTC-BUSD | BTC-UST | BTC-DAI | ||||||
|---|---|---|---|---|---|---|---|---|---|---|
| Parameter | Coeff. | p-Value | Coeff. | p-Value | Coeff. | p-Value | Coeff. | p-Value | Coeff. | p-Value |
| Conditional | mean | |||||||||
| μ | 0.00073 | 0.000 *** | 0.00146 | 0.000 *** | 0.00104 | 0.000 *** | 0.00326 | 0.000 *** | 0.00168 | 0.000 *** |
| ϕi | 0.00014 | 0.9396 | −0.00047 | 0.0173 ** | −0.00264 | 0.1122 | 0.02362 | 0.0011 *** | −0.00019 | 0.5559 |
| u | ||||||||||
| Conditional | variance | |||||||||
| c11 | 1.98 × 10⁻⁵ | 0.000 *** | 1.89 × 10⁻⁵ | 0.0001 *** | 1.46 × 10⁻⁵ | 0.002 *** | 0.00012 | 0.1854 | 0.0163 | 0.000 *** |
| c12 | −1.86 × 10⁻⁷ | 0.2196 | −4.48 × 10⁻⁷ | 0.4467 | −1.397 × 10⁻⁷ | 0.5259 | 8.15 × 10⁻⁶ | 0.1515 | 0.2752 | 0.000 *** |
| c22 | 5.65 × 10⁻⁸ | 0.000 *** | 4.767 × 10⁻⁷ | 0.000 *** | 7.76 × 10⁻⁸ | 0.004 *** | 9.75 × 10⁻⁶ | 0.0801 | 1.12 × 10⁻⁶ | 0.000 *** |
| α11 | 0.0607 | 0.000 *** | 0.083 | 0.000 *** | 0.0391 | 0.000 *** | 0.13378 | 0.0038 *** | 0.2738 | 0.000 *** |
| α12 | 0.0948 | 0.000 *** | 0.26914 | 0.000 *** | 0.1197 | 0.000 *** | 0.25731 | 0.12392 | 1.2316 | 0.000 *** |
| α22 | 0.1482 | 0.000 *** | 0.87104 | 0.000 *** | 0.3673 | 0.000 *** | 0.49485 | 0.0009 *** | 0.9714 | 0.10523 |
| β11 | 0.9031 | 0.000 *** | 0.87421 | 0.000 *** | 0.9104 | 0.000 *** | 0.81946 | 0.000 *** | 0.909397 | 0.10066 |
| β12 | 0.8949 | 0.000 *** | 0.68456 | 0.000 *** | 0.8242 | 0.000 *** | 0.66368 | 0.000 *** | 0.874962 | 0.06280 |
| β22 | 0.8867 | 0.000 *** | 0.53607 | 0.000 *** | 0.7462 | 0.000 *** | 0.53756 | 0.000 *** | 0.5947 | 0.000 *** |
| Durbin-Watson stat. | 0.8115 | 1.3655 | 1.16120 | 1.5853 | 1.5647 | |||||
| Schwarz criterion | −22.921 | −13.364 | −14.113 | −13.439 | −13.282 | |||||
| Log likelihood | 14129.27 | 8239.93 | 6250.68 | 3046.99 | 5459.43 | |||||
| Q2 (h) | 17.052 | 12.028 | 187.953 | 11.478 | 9.221 | |||||
| (0.5195) | (0.444) | (0.000 +) | (0.0217) | (0.684) | ||||||
| BTC-USDT | BTC-USDC | BTC-BUSD | BTC-UST | BTC-DAI | ||||||
|---|---|---|---|---|---|---|---|---|---|---|
| Parameter | Coeff. | p-Value | Coeff. | p-Value | Coeff. | p-Value | Coeff. | p-Value | Coeff. | p-Value |
| a | 0.0036 | 0.0000 *** | 0.0067 | 0.0000 *** | 0.0054 | 0.0000 *** | 0.0049 | 0.0000 *** | 0.0086 | 0.0000 *** |
| b | 0.4079 | 0.0050 *** | 0.1353 | 0.0000 *** | 0.2967 | 0.0918 * | 0.2538 | 0.0011 *** | 0.0787 | 0.0000 *** |
| c | 0.001882 | 0.0000 *** | 0.001479 | 0.0000 *** | 0.000504 | 0.0000 *** | 0.000569 | 0.0001 *** | 0.000271 | 0.0000 *** |
| α | 0.878333 | 0.0000 *** | 0.686432 | 0.0000 *** | 0.877398 | 0.0000 *** | 0.574520 | 0.0000 *** | 0.820375 | 0.0000 *** |
| β | 0.090530 | 0.0000 *** | 0.256479 | 0.0000 *** | 0.106864 | 0.0000 *** | 0.399782 | 0.0021 *** | 0.275693 | 0.0000 *** |
| Log likelihood | 12861.02 | 5128.84 | 4547.35 | 2138.93 | 3627.32 | |||||
| Unconditional correlations | 0.4312 | 0.1331 | 0.3094 | 0.2664 | 0.0638 | |||||
4.5. Robustness Test
| Dependent Variable: BTC | |||
| Excluded | Chi-sq | df | Prob. |
| USDT | 0.822534 | 2 | 0.6628 |
| USDC | 0.145836 | 2 | 0.9297 |
| BUSD | 7.261248 | 2 | 0.0265 |
| UST | 1.533981 | 2 | 0.4644 |
| DAI | 0.204514 | 2 | 0.9028 |
| All | 10.78848 | 10 | 0.3742 |
| Dependent Variable: USDT | |||
| Excluded | Chi-sq | df | Prob. |
| BTC | 4.429129 | 2 | 0.1092 |
| USDC | 10.61064 | 2 | 0.0050 * |
| BUSD | 14.12211 | 2 | 0.0009 * |
| UST | 10.78127 | 2 | 0.0046 * |
| DAI | 7.878435 | 2 | 0.0195 |
| All | 68.78196 | 10 | 0.0000 |
| Dependent Variable: USDC | |||
| Excluded | Chi-sq | df | Prob. |
| BTC | 0.714031 | 2 | 0.6998 |
| USDT | 1.171648 | 2 | 0.5566 |
| BUSD | 1.814377 | 2 | 0.4037 |
| UST | 0.142163 | 2 | 0.9314 |
| DAI | 0.545036 | 2 | 0.7615 |
| All | 3.698988 | 10 | 0.9599 |
| Dependent Variable: BUSD | |||
| Excluded | Chi-sq | df | Prob. |
| BTC | 6.120387 | 2 | 0.0469 |
| USDT | 2.271693 | 2 | 0.3212 |
| USDC | 4.761130 | 2 | 0.0925 |
| UST | 1.800812 | 2 | 0.4064 |
| DAI | 3.509030 | 2 | 0.1730 |

5. Conclusions
Author Contributions
Funding
Institutional Review Board Statement
Informed Consent Statement
Data Availability Statement
Acknowledgments
Conflicts of Interest
References
- Sidorenko, E.L. Stablecoin as a new financial instrument. In Digital Age: Chances, Challenges and Future; Ashmarina, S., Vochozka, M., Mantulenko, V., Eds.; Springer International Publishing: Cham, Switzerland, 2020; pp. 54–96. [Google Scholar]
- Wang, G.J.; Ma, X.Y.; Wu, H.Y. Are stablecoins truly diversifiers, hedges, or safe havens against traditional cryptocurrencies as their name suggests? Res. Int. Bus. Financ. 2020, 54, 101225. [Google Scholar] [CrossRef]
- Xie, Y.; Kang, S.B.; Zhao, J. Are stablecoins safe havens for traditional cryptocurrencies? An empirical study during the COVID-19 pandemic. Appl. Financ. Lett. 2021, 10, 2–9. [Google Scholar] [CrossRef]
- Ito, K.; Mita, M.; Ohsawa, S.; Tanaka, H. What is Stablecoin? A Survey on Its Mechanism and Potential as Decentralized Payment Systems. Int. J. Serv. Knowl. Manag. 2020, 4, 71–86. [Google Scholar] [CrossRef]
- Lyons, R.K.; Viswanath-Natraj, G. What Keeps Stablecoins Stable? (No. w27136); National Bureau of Economic Research: Cambridge, MA, USA, 2020. [Google Scholar]
- Griffin, J.M.; Shams, A. Is Bitcoin really untethered? J. Financ. 2020, 75, 1913–1964. [Google Scholar] [CrossRef]
- Wei, W.C. The impact of Tether grants on Bitcoin. Econ. Lett. 2018, 171, 19–22. [Google Scholar] [CrossRef]
- Kristoufek, L. On the role of stablecoins in the cryptoassets pricing dynamics. Financ. Innov. 2022, 8, 37. [Google Scholar] [CrossRef]
- Lyons, R.K.; Viswanath-Natraj, G. Stable Coins Don’t Inflate Crypto Markets VOX CEPR Policy Portal. 2020. Available online: https://voxeu.org/article/stable-coins-dont-inflate-crypto-markets (accessed on 5 December 2020).
- Hoang, L.T.; Baur, D.G. How stable are stablecoins? Eur. J. Financ. 2021. [Google Scholar] [CrossRef]
- Grobys, K.; Junttila, J.; Kolari James, W.; Sapkota, N. On the stability of stablecoins. J. Empir. Financ. 2021, 64, 207–223. [Google Scholar] [CrossRef]
- Baba, Y.; Engle, R.F.; Kraft, D.F.; Kroner, K.F. Multivariate Simultaneous Generalized ARCH (Working Paper); Department of Economics, University of California at San Diego: San Diego, CA, USA, 1990. [Google Scholar]
- Engle, R.F.; Kroner, K.F. Multivariate simultaneous generalized ARCH. Econom. Theory 1995, 11, 122–150. [Google Scholar] [CrossRef]
- Fiszeder, P. Low and high prices can improve covariance forecasts: The evidence based on currency rates. J. Forecast. 2018, 37, 641–649. [Google Scholar] [CrossRef]
- Tan, S.K.; Chan, J.S.K.; Ng, K.H. On the speculative nature of cryptocurrencies: A study on Garman and Klass volatility measure. Financ. Res. Lett. 2020, 32, 101075. [Google Scholar] [CrossRef]
- Brandt, M.W.; Diebold, F.X. A No-Arbitrage Approach to Range-Based Estimation of Return Covariances and Correlations. J. Bus. 2006, 79, 61–74. [Google Scholar] [CrossRef]
- Li, H.; Hong, Y. Financial volatility forecasting with range-based autoregressive volatility model. Financ. Res. Lett. 2011, 8, 69–76. [Google Scholar] [CrossRef]
- Fiszeder, P.; Fałdziński, M.; Molnár, P. Range-based DCC models for covariance and value-at-risk forecasting. J. Empir. Financ. 2019, 54, 58–76. [Google Scholar] [CrossRef]
- Molnár, P. High-low range in GARCH models of stock return volatility. Appl. Econ. 2016, 48, 4977–4991. [Google Scholar] [CrossRef]
- Jacob, J. Estimation and forecasting of stock volatility with range-based estimators. J. Futures Mark. 2008, 28, 561–581. [Google Scholar] [CrossRef]
- Todorova, N.; Husmann, S. A comparative study of range-based stock return volatility estimators for the German market. J. Futures Mark. 2012, 32, 560–586. [Google Scholar] [CrossRef]
- Bauwens, L.; Hafner, C.M.; Laurent, S. Handbook of Volatility Models and Their Applications; Wiley: Hoboken, NJ, USA, 2012. [Google Scholar]
- Block, A.S.; Righi, M.B.; Schlender, S.G.; Coronel, D.A. Investigating dynamic correlation between crude oil and fuels in non-linear framework: The financial and economic role of structural breaks. Energy Econ. 2015, 49, 23–32. [Google Scholar] [CrossRef]
- Mensi, W.; Hammoudeh, S.; Nguyen, D.K.; Yoon, S.M. Dynamic spillovers among major energy and cereal commodity prices. Energy Econ. 2014, 43, 225–243. [Google Scholar] [CrossRef]
- Parkinson, M. The extreme value method for estimating the variance of the rate of return. J. Bus. 1995, 53, 61–65. [Google Scholar] [CrossRef]
- Garman, M.B.; Klass, M.J. On the estimation of security price volatilities from historical data. J. Bus. 1980, 53, 67–78. [Google Scholar] [CrossRef]
- Rogers LC, G.; Satchell, S.E. Estimating variance from high, low and closing prices. Ann. Appl. Probab. 1991, 1, 504–512. [Google Scholar] [CrossRef]
- Katsiampa, P. Volatility co-movement between Bitcoin and Ether. Financ. Res. Lett. 2019, 30, 221–227. [Google Scholar] [CrossRef] [Green Version]
- Engle, R.F. Dynamic conditional correlation—A simple class of multivariate GARCH models. J. Bus. Econ. Stat. 2002, 20, 339–350. [Google Scholar] [CrossRef]
- Righi, M.; Ceretta, P. Global risk evolution and diversification: A Copula- DCC- GARCH model approach. Rev. Bras. Financ. 2012, 10, 529–550. [Google Scholar] [CrossRef]
- Chen, K.S.; Huang, Y.C. Detecting Jump Risk and Jump-Diffusion Model for Bitcoin Options Pricing and Hedging. Mathematics 2021, 9, 2567. [Google Scholar] [CrossRef]
- Zięba, D.; Kokoszczyński, R.; Śledziewska, K. Shock transmission in the cryptocurrency market. Is Bitcoin the most influential? Int. Rev. Financ. Anal. 2019, 64, 102–125. [Google Scholar] [CrossRef]
- Katsiampa, P.; Corbet, S.; Lucey, B. Volatility spillover effects in leading cryptocurrencies: A BEKK-MGARCH analysis. Financ. Res. Lett. 2019, 29, 68–74. [Google Scholar] [CrossRef] [Green Version]
- Kristoufek, L. Tethered, or Untethered? On the interplay between stablecoins and major cryptoassets. Financ. Res. Lett. 2021, 43, 101991. [Google Scholar] [CrossRef]
| # Rank | Name | Ticker | Coinmark | Price | 24 h % | 7 d % | Market Cap |
|---|---|---|---|---|---|---|---|
| 1 | Bitcoin | BTC |  | $44,575.2 | 9.65% | 5.45% | $845,117,683,687 |
| 3 | Tether | USDT |  | $1.00 | 0.01% | 0.01% | $78,515,395,493 |
| 5 | USD Coin | USDC |  | $0.9998 | 0.06% | 0.03% | $52,536,446,749 |
| 13 | Binance USD | BUSD |  | $1.00 | 0.06% | 0.00% | $17,805,102,313 |
| 17 | Terra USD | UST |  | $0.9999 | 0.08% | 0.21% | $11,619,278,219 |
| 19 | Dai | DAI |  | $0.9993 | 0.05% | 0.03% | $10,373,205,726 |
Publisher’s Note: MDPI stays neutral with regard to jurisdictional claims in published maps and institutional affiliations. |
© 2022 by the authors. Licensee MDPI, Basel, Switzerland. This article is an open access article distributed under the terms and conditions of the Creative Commons Attribution (CC BY) license (https://creativecommons.org/licenses/by/4.0/).
Share and Cite
Chen, K.-S.; Chang, S.-H. Volatility Co-Movement between Bitcoin and Stablecoins: BEKK–GARCH and Copula–DCC–GARCH Approaches. Axioms 2022, 11, 259. https://doi.org/10.3390/axioms11060259
Chen K-S, Chang S-H. Volatility Co-Movement between Bitcoin and Stablecoins: BEKK–GARCH and Copula–DCC–GARCH Approaches. Axioms. 2022; 11(6):259. https://doi.org/10.3390/axioms11060259
Chicago/Turabian StyleChen, Kuo-Shing, and Shen-Ho Chang. 2022. "Volatility Co-Movement between Bitcoin and Stablecoins: BEKK–GARCH and Copula–DCC–GARCH Approaches" Axioms 11, no. 6: 259. https://doi.org/10.3390/axioms11060259
APA StyleChen, K.-S., & Chang, S.-H. (2022). Volatility Co-Movement between Bitcoin and Stablecoins: BEKK–GARCH and Copula–DCC–GARCH Approaches. Axioms, 11(6), 259. https://doi.org/10.3390/axioms11060259


