Article

Computational Study of Shocked V-Shaped N2/SF6 Interface across Varying Mach Numbers

by
Salman Saud Alsaeed
1 and
Satyvir Singh
2,3,*
1
Department of Mathematics, College of Science, Jouf University, Sakaka P.O. Box 2014, Saudi Arabia
2
Applied and Computational Mathematics, RWTH Aachen University, 52062 Aachen, Germany
3
Department of Mathematics, Graphic Era Deemed to Be University, Dehradun 248002, India
*
Author to whom correspondence should be addressed.
Axioms 2024, 13(10), 700; https://doi.org/10.3390/axioms13100700
Submission received: 20 July 2024 / Revised: 26 September 2024 / Accepted: 2 October 2024 / Published: 9 October 2024
(This article belongs to the Special Issue Recent Progress in Computational Fluid Dynamics)

Abstract

:
The Mach number effect on the Richtmyer–Meshkov instability (RMI) evolution of the shocked V-shaped N 2 / SF 6 interface is numerically studied in this research. Four distinct Mach numbers are taken into consideration for this purpose: M s = 1.12 , 1.22 , 1.42 , and 1.62. A two-dimensional space of compressible two-component Euler equations is simulated using a high-order modal discontinuous Galerkin approach to computational simulations. The numerical results show good consistency when compared to the available experimental data. The computational results show that the RMI evolution in the shocked V-shaped N 2 / SF 6 interface is critically dependent on the Mach number. The flow field, interface deformation, intricate wave patterns, inward jet development, and vorticity generation are all strongly impacted by the shock Mach number. As the Mach number increases, the V-shaped interface deforms differently, and the distance between the Mach stem and the triple points varies depending on the Mach number. Compared to lower Mach numbers, higher ones produce larger rolled-up vortex chains. A thorough analysis of the Mach number effect identifies the factors that propel the creation of vorticity during the interaction phase. Moreover, kinetic energy and enstrophy both dramatically rise with increasing Mach number. Lastly, a detailed analysis is carried out to determine how the Mach number affects the temporal variations in the V-shaped interface’s features.

1. Introduction

When a shock wave accelerates an interface between two fluids of differing densities, it causes shocked hydrodynamics instability, also referred to as the Richtmyer–Meshkov instability (RMI) [1,2]. This causes lighter fluids to penetrate the heavier fluid and heavier fluid to penetrate the lighter fluid, forming bubbles and spikes that might ultimately result in turbulence [3,4]. The primary mechanism controlling the RMI is the baroclinic vorticity deposition, resulting from the mismatch between the local density gradient ( ρ ) at the interface and the pressure gradient ( p ) across the shock, or ρ × p 0 . Richtmyer [1] first investigated the RMI theoretically, and Meshkov [2] later validated it experimentally in a planar geometry. Under impulsive conditions, it is commonly regarded as a particular instance of the Rayleigh–Taylor instability (RTI) [5,6]. Many scientific fields, including inertial confinement fusion (ICF), supernova explosions, ejecta, material strength, chemical reactions, solar prominence, and ionospheric fluxes, depend on an understanding of the RMI mechanism [7,8,9,10]. It amplifies the initial perturbations at the contact and accelerates the mixing process. In the case of ICF, for example, RMI-induced mixing between the frozen deuterium–tritium fuel and the ablative outer layer lowers the temperature and pressure in the fuel target, which lowers the fusion yield [8]. On the other hand, an RMI-induced fuel and air mixture improves supersonic combustion performance [9]. In recent decades, RMI has received a lot of attention, which has led to the release of several thorough reviews on the subject [11,12,13].
The RMI on a variety of complex shocked density inhomogenous shapes—such as polygonal, spherical, elliptical, single, and multi-mode interfaces—has garnered a lot of interest in the past few decades. Numerous computational and experimental investigations have been carried out on the RMI growth on these kinds of inhomogenous forms. Haas and Sturtevant conducted a thorough experimental investigation on shocked cylindrical/spherical gas bubbles [14]. In a divergent shock-refraction setup, the physics of a shocked spherical bubble was experimentally investigated by Ranjan et al. [15]. Shocked gas bubbles were studied numerically by Quirk and Karni [16], building on the experimental results of Haas and Sturtevant. A numerical investigation of the impact of shock Mach number on the flow physics of shocked cylindrical helium bubbles was carried out by Bagabir and Drikakis [17]. A numerical research on the major impact of diffusive and viscous factors on a shocked heavy cylindrical bubble was conducted by Shankar et al. [18]. The behavior of shocked cylindrical bubbles under thermal non-equilibrium conditions in diatomic and polyatomic gases was studied numerically by Singh et al. [19]. Following that, Singh and colleagues [20] conducted a numerical investigation into the flow physics of shocked elliptical interfaces, with a focus on the impact of aspect ratio on flow morphology. Examining the RMI evolution resulting from the interplay of polygonal bubbles and shock waves has attracted more attention recently [21,22,23,24,25,26,27]. With their transmitted shock waves, reflections, reciprocal shock collisions, and regular and irregular refractions, these polygonal shapes produce more complex flow fields.
The major goal of theoretical RMI investigations is to estimate the interface growth rate using models—such as linear and nonlinear ones—developed for a single-mode sinusoidal interface [28,29,30]. Studies on the expansion of mixing width and the development of turbulent mixing parameters are also frequently conducted using numerical simulations [31,32,33]. Thornber et al. [34] used large-eddy simulations to study the impact of various 3D multi-mode starting conditions on the RMI development. Using large-eddy simulations, Lombardini et al. [35] investigated the RMI evolution of single-shock-driven mixing and suggested that, for high-enough incident Mach numbers, a two-gas mixing layer eventually evolves to a fully developed turbulent flow at a late time, with a power law-governed Kolmogorov-like inertial subrange. Mohaghar and colleagues [36] conducted an experimental investigation to measure the impact of starting conditions on the evolution of the RMI. They specifically looked at how incident shock strength affected the mixing transition. Results for the early- and late-time behaviors of the RMI were presented by Probyn et al. [37] from a thorough set of computations of two-dimensional single-mode RMI. Rare studies on the RMI’s physical mechanisms for the interface with a big initial perturbation amplitude have been published in the meantime.
In RMI research, an inclined interface, or equivalently, a V-shaped interface, creates ideal conditions for investigating shock refraction because it maintains a uniform incident angle along the entire interface edge. The interaction at the inclined gas–gas contact produces a complicated wave pattern that can be broadly divided into regular and irregular systems. Shock tube experiments were used in the groundbreaking work of Jahn [38] to study shock refraction–reflection phenomena at interfaces between air and CH 4 or air and CO 2 . Shock refraction–reflection at interfaces with inclined angles—either “fast-slow” or “slow-fast”—was investigated in further research [39,40,41,42,43] for a range of gas combinations. These studies demonstrated that for a given gas mixture, variations in the incident angle resulted in varying refraction patterns while keeping the incident shock strength constant. Additionally, several irregular refraction patterns were produced by varying incidence shock strengths. The development of a Mach stem identified irregular refraction systems in the “fast-slow” scenario [39], whereas the presence of bound and free precursor shocks identified irregular and regular refraction systems in the “slow-fast” scenario [41]. McFarland and co-authors [44,45,46,47,48,49] published a number of studies on the RMI of an inclined interface that took into account the effects of the initial shock strength, Atwood number, inclination angles, and re-shock using theoretical, experimental, and numerical methods. A shocked “V”-shaped air/ SF 6 gaseous interface was the subject of experimental study by Luo et al. [50], with the effects of the initial interface amplitude over the wavelength on the mixing width being the main findings. Later, to examine the impact of starting conditions, particularly the initial amplitude, on the flow characteristics, Zhai et al. [51] experimentally studied the RMI evolution on a shocked “V”-shaped air/helium gaseous interface. The RMI of the V-shaped light–heavy configuration was numerically explored by Wang et al. [52], with a focus on the effects of the oblique angle and Mach number on the flow patterns and the linear growth rate of the interface development. Recently, Alsaeed and Singh [53] performed numerical simulations on the shock wave interaction with a V-shaped heavy/light interface and explored the impact of vertex angles, shock Mach numbers, and Atwood numbers on the flow physics of the V-shaped interface.
Many physical elements, including the initial interface disturbance, the Atwood number, and the Mach number, influence the RMI evolution of the shocked gas interface flow. Among these features is the Mach number ( M s ), which is widely acknowledged as a key determinant in the development of the RMI and turbulence mixing. This study uses numerical simulations to construct a structured framework and revisits the experimental work on the shocked V-shaped contact performed by Luo et al. [50]. This paradigm aims to improve the understanding and examination of how the Mach number affects the development of RMI and the associated mechanisms of vorticity formation. As far as the authors are aware, no prior study has looked at how the Mach number affects the RMI evolution of the V-shaped N 2 / SF 6 interface. The Mach number effect on flow structure, wave patterns, vorticity generation, kinetic energy and enstrophy progression, and interface features is the primary focus of this work. Furthermore, the goal of this work is to further our understanding of the RMI evolution of inclined interfaces with Mach number effects.
A higher-order modal discontinuous Galerkin approach is used to simulate a two-dimensional system of compressible two-component Euler equations for RMI modeling. The remaining parts of this paper are organized as follows: problem setup and governing equations are illustrated in Section 2. The utilized numerical method, validation, and mesh convergence are described in Section 3. The numerical results and the corresponding discussions for the Mach number effects on the V-shaped N 2 / SF 6 interface are presented in Section 4. Finally, the concluding remarks of this paper are outlined in Section 5.

2. Problem Setup and Governing Equations
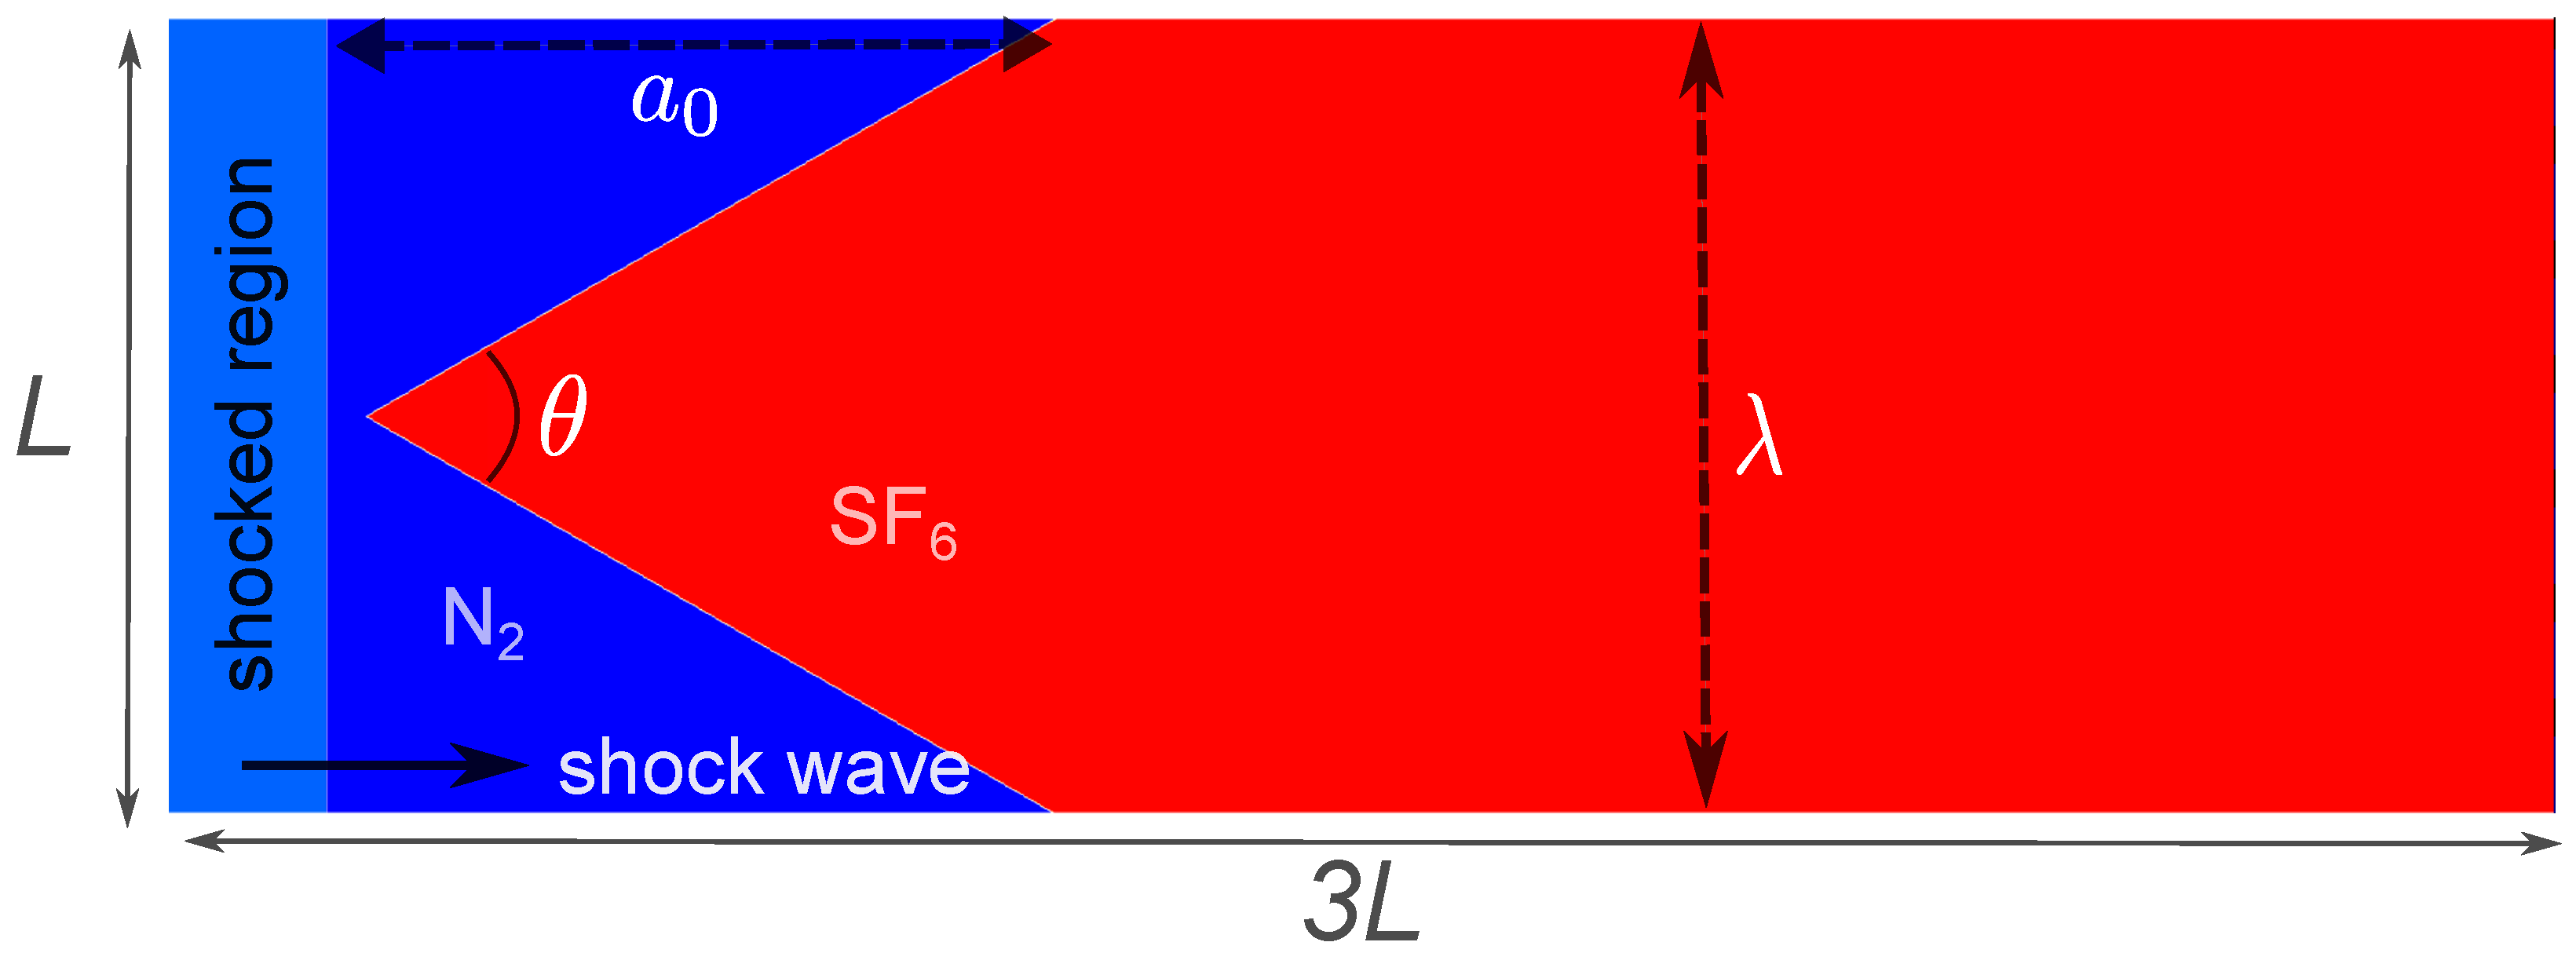
2.1. Problem Setup

Figure 1 illustrates the problem configuration involving a shocked V-shaped interface. The numerical simulations are conducted within a rectangular domain measuring [ 0 , L ] × [ 0 , 3 L ] with L = 100 mm. A V-shaped N 2 / SF 6 interface is located at the downstream region of the shock, with the left end being 5 mm away from the incident shock (IS) wave flowing from left to right along the x-direction and placed in the N 2 gas. The IS wave’s starting distance from the domain’s left boundary is 20 mm. Interestingly, the Mach number M s characterizes the IS wave. The complete extent of the V-shaped interface, which is twice the typical amplitude of a single-mode interface, is defined as the starting amplitude ( a 0 ) in the current configuration. The V-shaped interface’s wavelength ( λ ) is determined by taking λ = L . The vertex angle of the V-shaped interface is θ . The relationship between a 0 , λ , and θ for this V-shaped geometry is a 0 / λ = 1 / 4 tan ( θ / 2 ) . z = L / 8 + L / 2 tan ( θ / 2 ) gives the location of the V-shaped interface. We take θ = 60 as the vertex angle for numerical simulations. The top, bottom, and right boundaries serve as outlets in this computational domain, while the left boundary serves as an inflow boundary. Around the V-shaped N 2 / SF 6 interface, the starting pressure and temperature are given as P 0 = 101,325 Pa and T 0 = 273 K, respectively. The physical characteristics of these gases are summarized in Table 1.

2.2. Governing Equations

In the present study, the two-component compressible Euler equations are numerically solved in the following conservative form [27]:
U t + F 1 ( U ) x + F 2 ( U ) y = 0 ,
where the conservative vector U 5 and the inviscid flux vectors F 1 ( U ) 5 × 1 and F 2 ( U ) 5 × 1 in the x- and y-directions, respectively, are given by
U = ρ ρ u ρ v ρ E ρ ϕ , F 1 ( U ) = ρ u ρ u 2 + p ρ u v ( ρ E + p ) u ρ ϕ u , F 2 ( U ) = ρ v ρ u v ρ v 2 + p ( ρ E + p ) v ρ ϕ v .
Here, ρ , u, v, p, ϕ , and E are the mass density, velocity components in the x- and y-directions, the pressure, the mass fraction, and the energy, respectively. E can be calculated as
ρ E = p γ m i x 1 + 1 2 ( u 2 + v 2 ) ,
The specific heat ratio of the mixture is depicted by the symbol γ m i x . With ρ denoting the mixture density and R denoting the mixture-specific gas constant, respectively, the mixture’s equation of state is P = ρ R T . The assumed characteristics of both gas components include thermal equilibrium and calorie perfection, with specific heats at constant pressure C p 1 , C p 2 , specific heats at constant volume C v 1 , C v 2 , and specific heat ratios γ 1 , γ 2 . Calculating a mixture’s specific heat ratio is as simple as
γ m i x = C p 1 ϕ 1 + C p 2 ϕ 2 C v 1 ϕ 1 + C v 2 ϕ 2 ,
where ϕ 1 and ϕ 2 = 1 ϕ 1 represent the mass fractions of the SF 6 and N 2 gases, respectively.

2.3. Initial Conditions

We set an ambient condition on the right side of the shock wave to start the numerical calculations. On the left side of the shock wave, we compute the primitive variables using the conventional Rankine–Hugoniot conditions. The following is the expression for the conventional Rankine–Hugoniot criteria for calculations involving primitive variables:
M 2 2 = 1 + ( γ 1 ) 2 M s 2 γ M s 2 ( γ 1 ) 2 , p 2 p 1 = 1 + γ M s 2 1 + γ M 2 2 , ρ 2 ρ 1 = γ 1 + ( γ + 1 ) p 2 p 1 γ + 1 + ( γ 1 ) p 2 p 1 .
Here, the shock Mach number is indicated by M s , while the shock wave’s left and right sides are indicated by the subscripts 1 and 2, respectively. Four distinct Mach numbers M s = 1.12 , 1.22 , 1.42 , 1.62 are taken into account for the numerical simulations in this study.

3. Numerical Method, Validation, and Mesh Convergence

3.1. Numerical Method
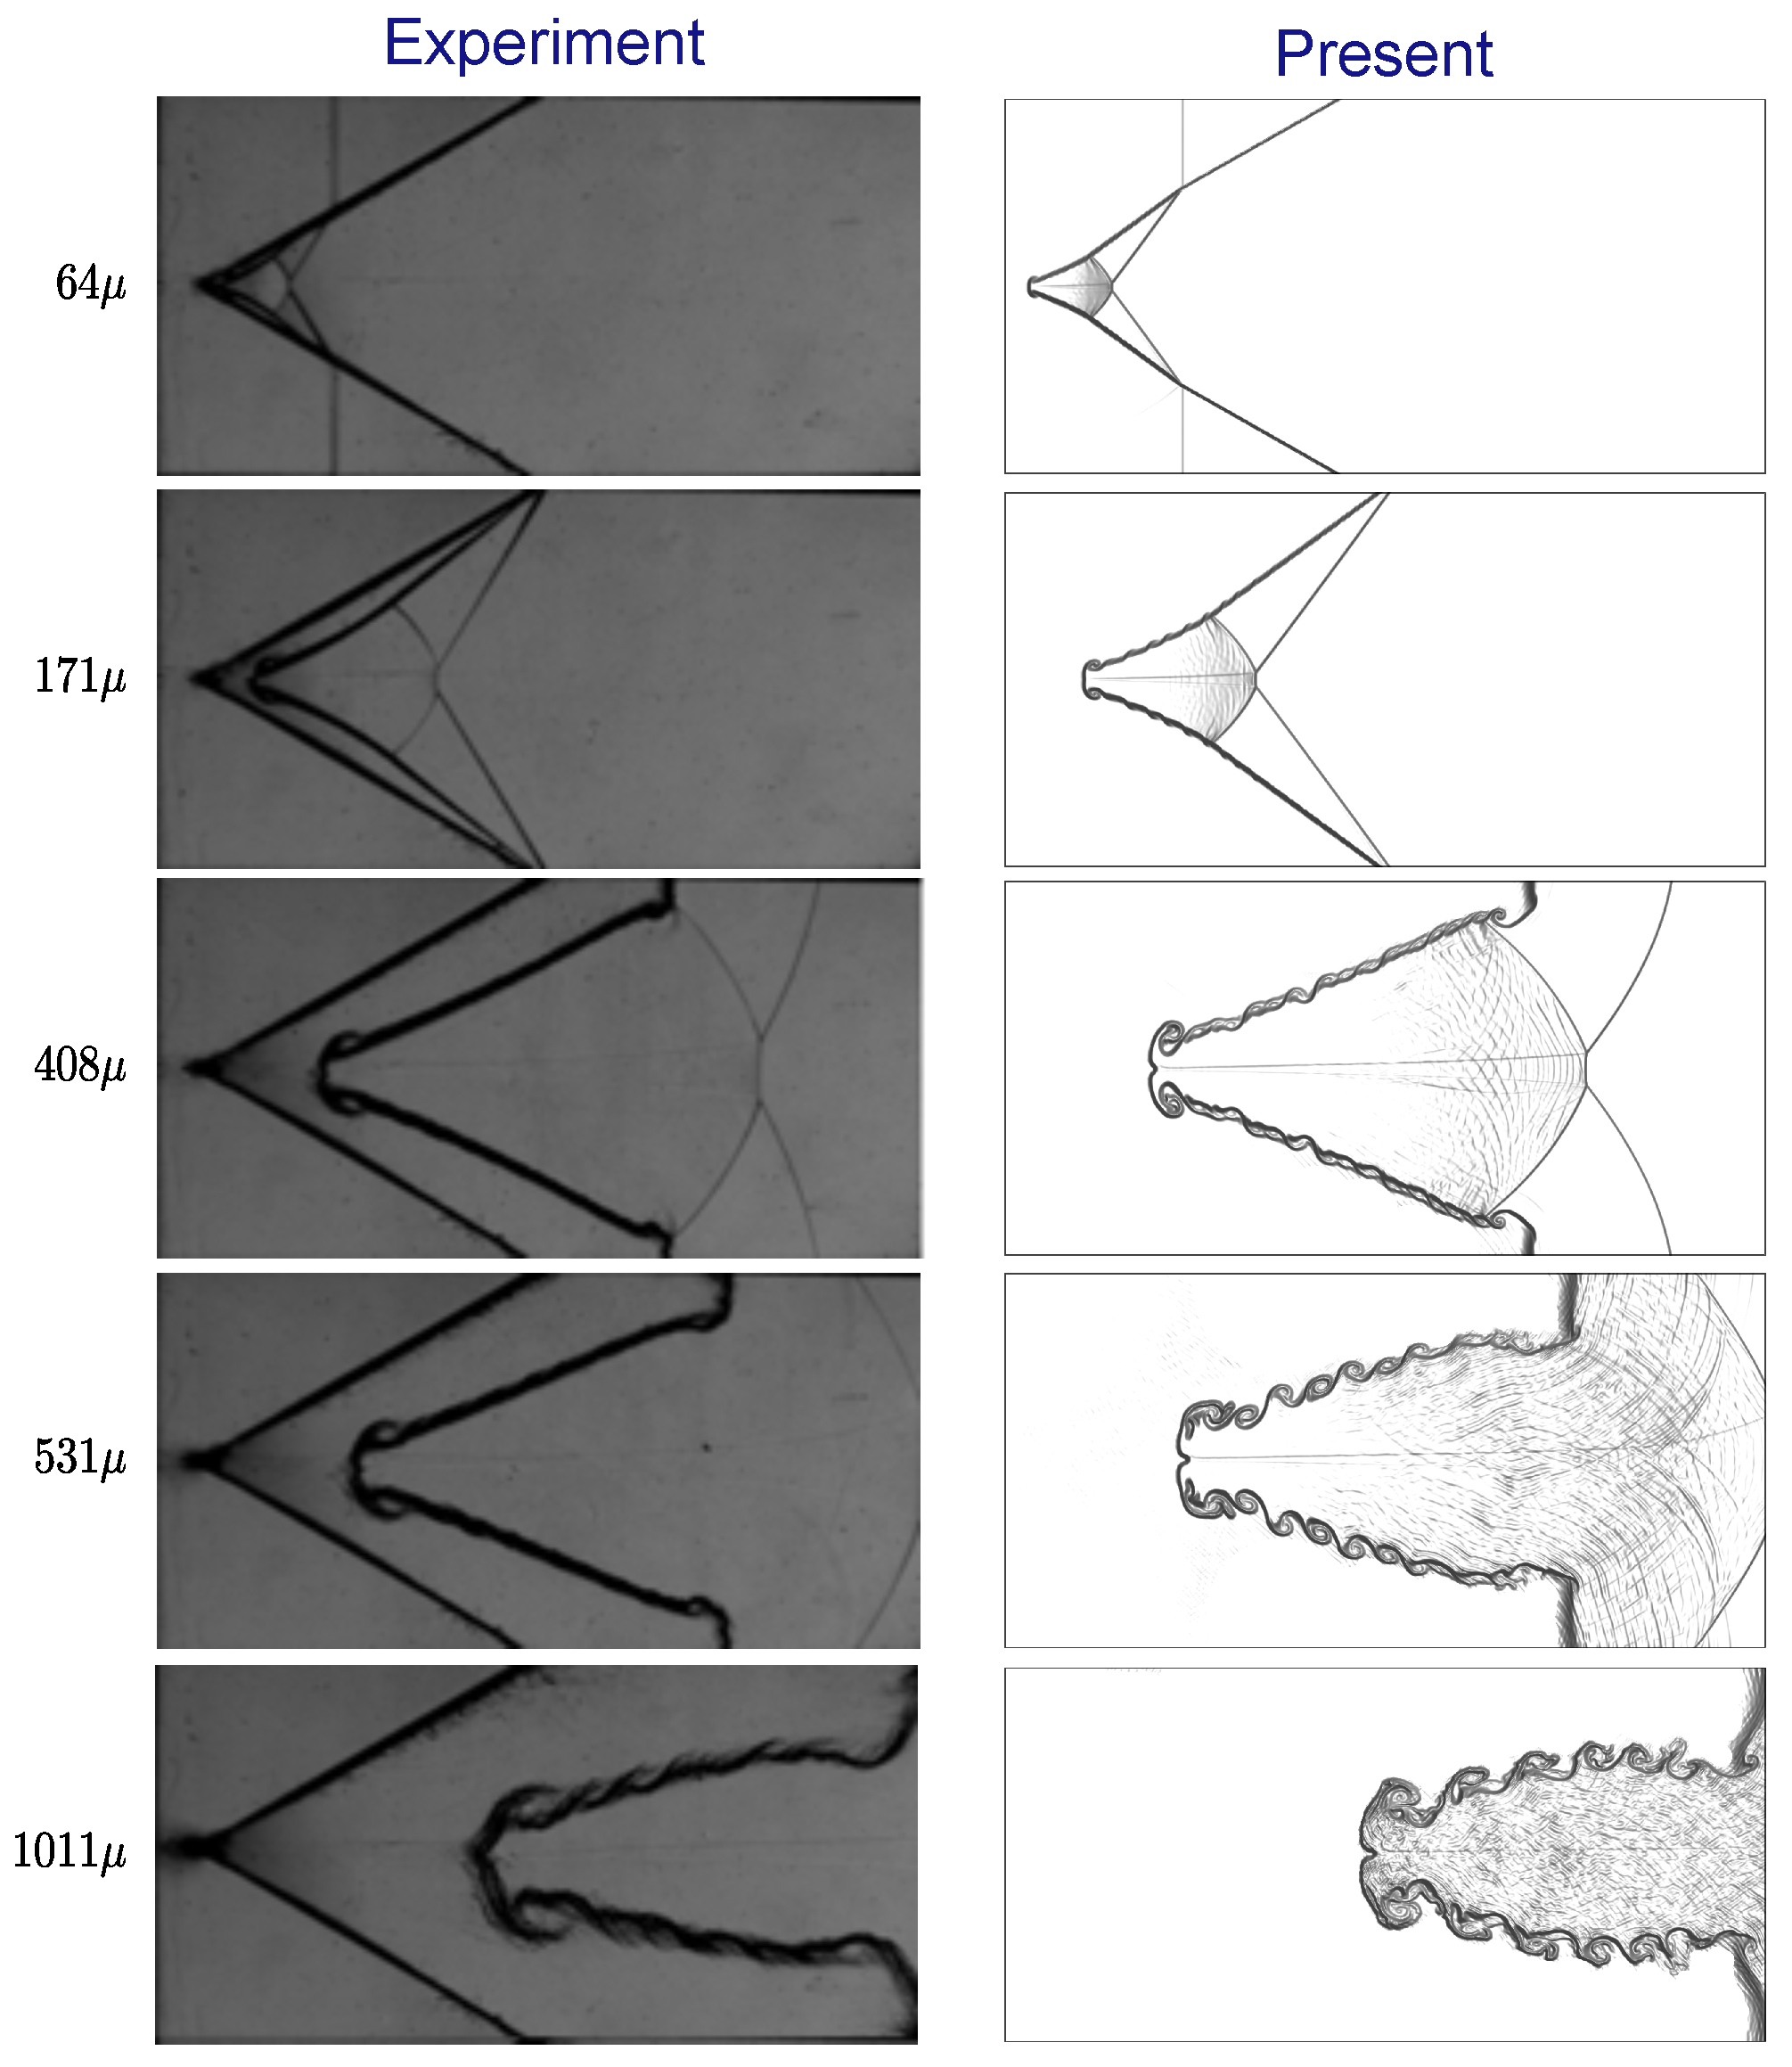
Investigating RMI through physical experiments poses significant challenges due to the transient nature of the flows, the difficulty in precisely characterizing initial interface conditions, and the complexity of acquiring measurements with quantified uncertainties. In this context, using high-fidelity simulations is crucial for obtaining reliable quantitative predictions of RMI. These simulations, which utilize advanced numerical techniques and high-resolution computational schemes, provide valuable insights into the fundamental mechanisms driving RMI and its impact on various physical systems. The discontinuous Galerkin (DG) methods have become increasingly popular in computational fluid dynamics, especially for solving complex systems of partial differential equations [54,55]. The DG technique is distinguished by its capacity to handle complex geometries, attain high-order precision, guarantee local conservation, efficiently utilize parallel computation, and control discontinuities by combining essential elements of both finite element and finite volume approaches.
An in-house designed modal DG solver [20] is utilized in this work to solve the two-dimensional system of two-component compressible Euler equations (Equation (1)). The computational domain is applied with scaled Legendre polynomial functions, which are separated into non-overlapping rectangular components. The Gauss–Legendre quadrature rule is applied for both volume and flux integration. For two-component flows, the HLLC scheme is used to calculate numerical fluxes at the elemental interfaces. A third-order accurate scaled Legendre polynomial expansion is used to approximate the solutions in the finite element space. Using an explicit third-order accurate strong stability preserving Runge–Kutta scheme, time integration is performed. Furthermore, to reduce nonphysical oscillations in the computational solutions, a high-order moment limiter suggested by Krivodonova is employed.

3.2. Validation

The computational model and the developed DG solver were validated and confirmed against a number of shocked gas bubble flow issues in our earlier research [25,26]. The computation findings are compared in this work with those obtained from trials conducted by Luo et al. [50], where a V-shaped air/ SF 6 interface was taken into consideration. A shock Mach number of M s = 1.2 and a vertex angle of θ = 60 were used in the experimental investigation. The Schlieren image comparison between our present results and the experimental results of Luo et al. [50] is displayed in Figure 2. Our findings show that the propagating shock wave consistently distorts the V-shaped interface, which exhibits interface and complex wave pattern alterations comparable to those observed in the related experiment. Furthermore, the time variation of the upstream interface displacement ( D s ) is shown in Figure 3. The locations of D s are accurately replicated by the simulation and closely match the experimental data [50].

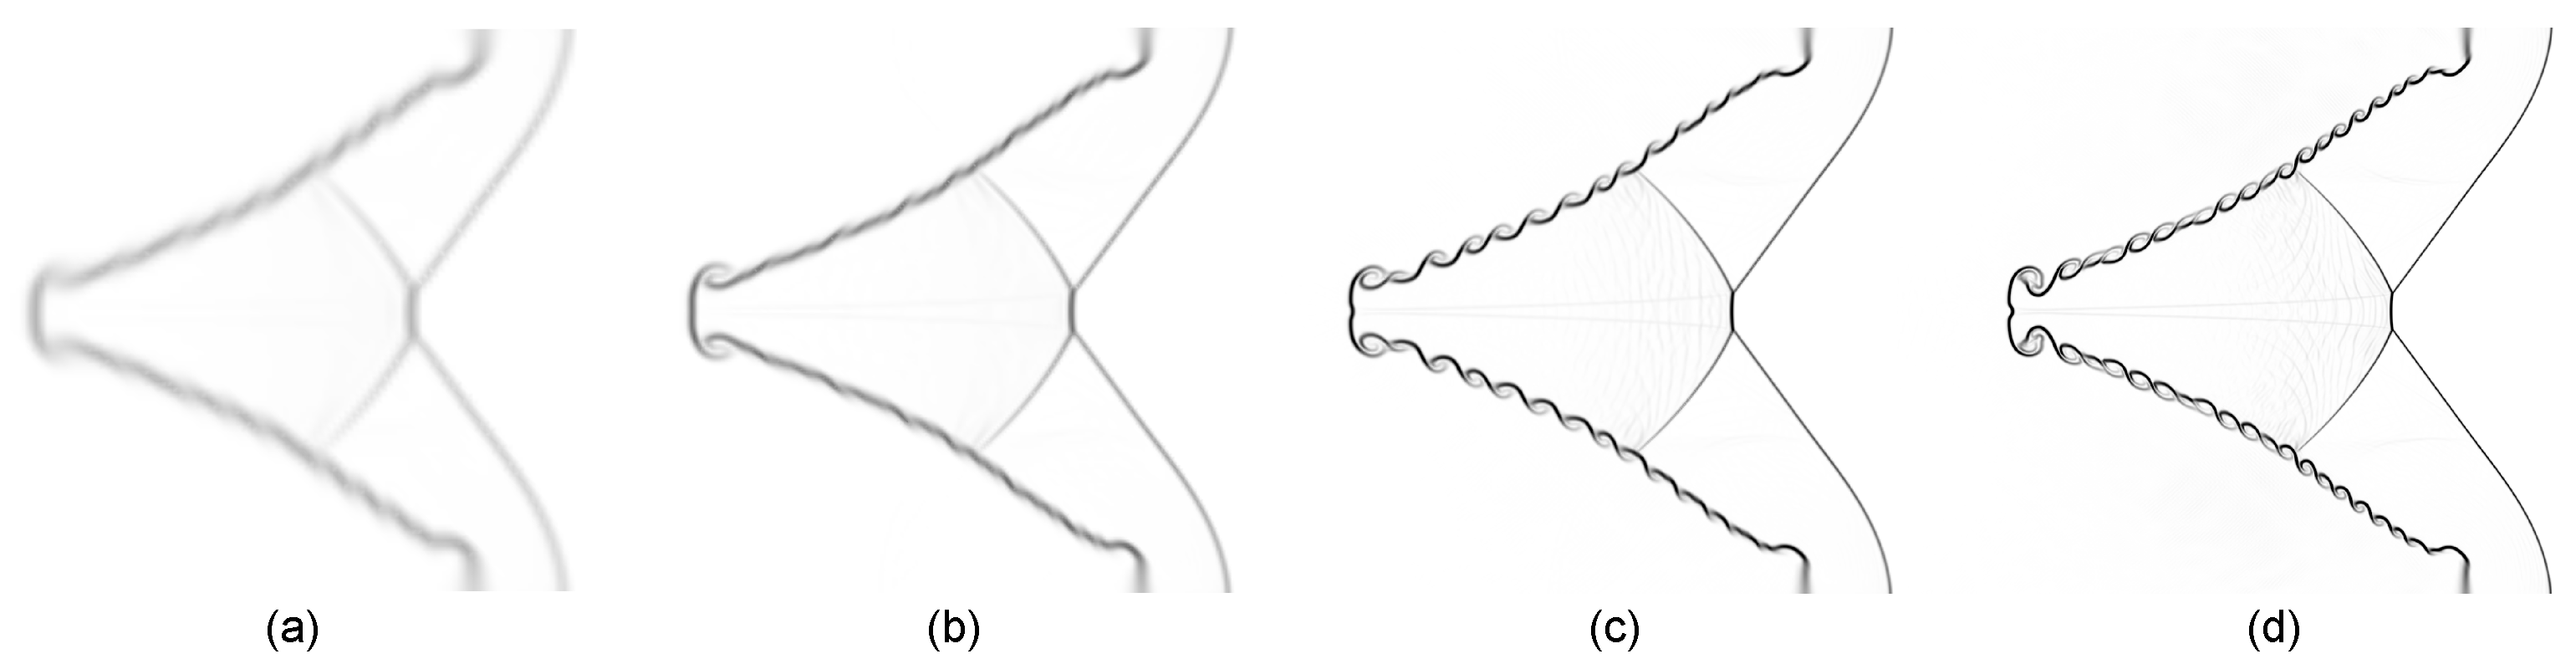
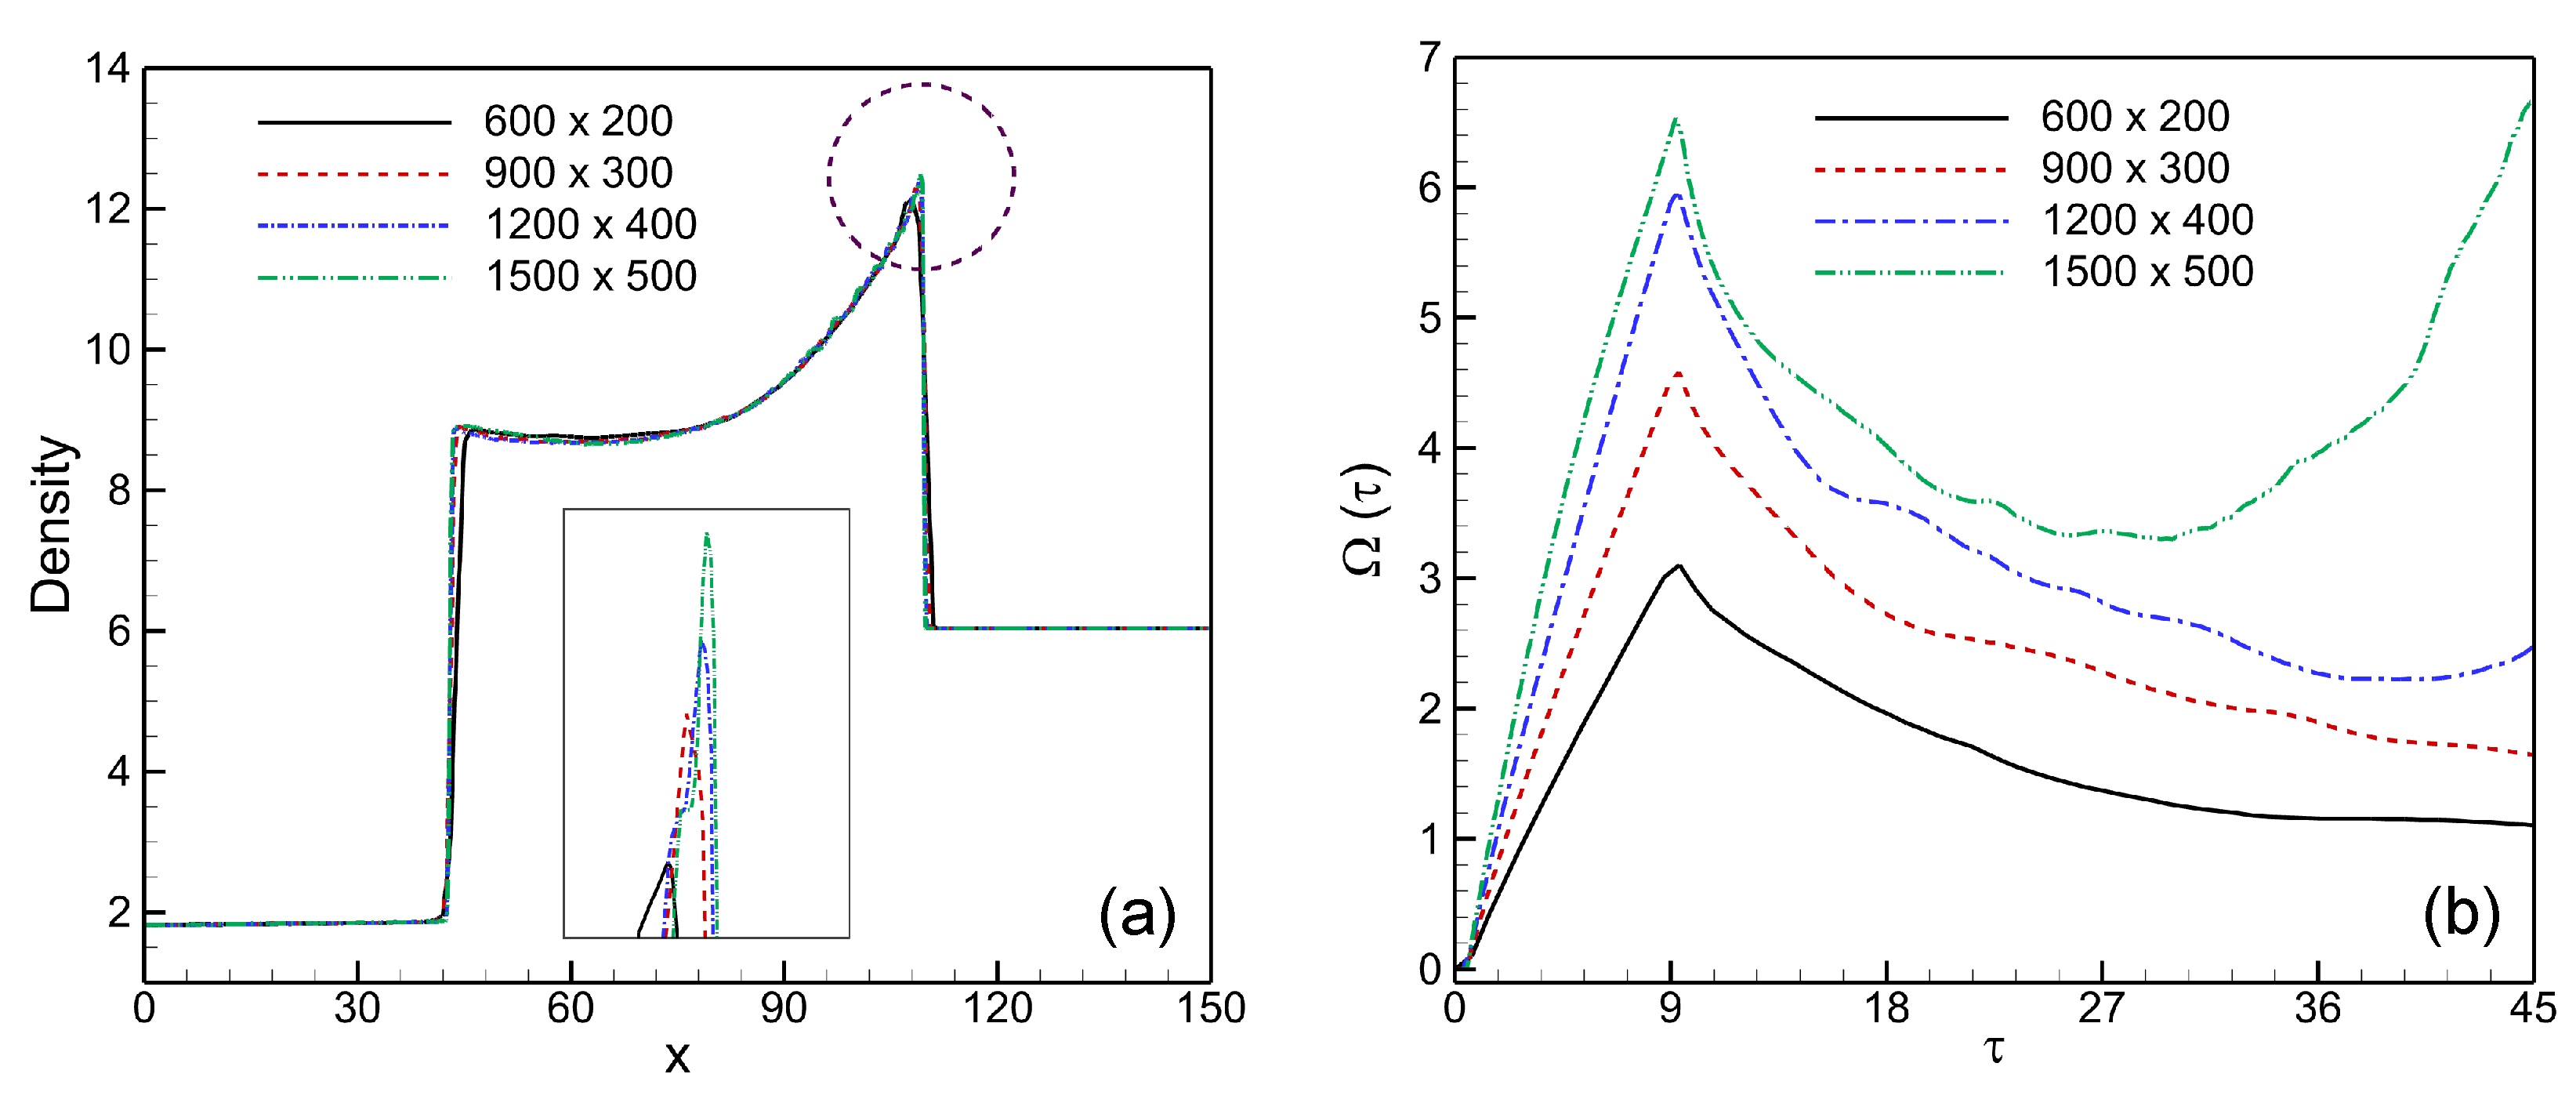
3.3. Mesh Convergence

Normalized time is used in the following simulations to display flow morphology snapshots. The characteristic time t 0 = λ / W i is used to standardize the actual computational time. In this case, τ = t / t 0 = t W i / λ , where W i is the IS wave velocity and λ is the V-shaped interface’s initial wavelength. Numerical Schlieren images, which depend on the density gradient magnitude s = | ρ | , are used to visualize the numerical results.
To accurately reflect the intricate flow field structure of the RMI flows, a mesh convergence analysis is carried out. One test case on the shocked V-shaped N 2 / SF 6 interface with M s = 1.22 is calculated. In order to perform this, a third-order accurate modal DG solver was used in conjunction with four different grid configurations: 600 × 200 , 900 × 300 , 1200 × 400 , and 1500 × 500 . The numerical Schlieren images of a shocked V-shaped N 2 / SF 6 interface at time τ = 15 are shown in Figure 4. When the shock wave completely compresses its volume as it passes through the V-shaped N 2 / SF 6 interface, a divergent form is produced. A pair of major vortex rings are also produced by the flow field at the upstream corner of the V-shaped N 2 / SF 6 interface. The detection of Kelvin–Helmholtz instability (KHI) in terms of rolled-up small-scale vortices on the V-shaped interface is one of the primary variations among the four testing instances. As the grid fineness rises, the interface sharpens and the KHI at the interface becomes more noticeable. Furthermore, Figure 5 illustrates the mesh sensitivity by providing the density and enstrophy profiles along the center-line ( y = 50 mm ) of the computed V-shaped interface. The results demonstrate that density dissipation decreases with increasing grid resolution while enstrophy amount increases in value. The “ 1500 × 500 ” grid points are used for all numerical computations, as per the discussion above.

3.4. Error Estimation

Determining the accuracy and error accumulation during large-scale simulations of complex combustion gas dynamics in unsteady-state flows is crucial. Error typically depends on the amount of time steps, grid resolution, and numerical scheme correctness. Smirnov et al. introduced a numerical approach [56,57] to assess the error accumulation and simulation precision for such problems.
In the one-dimensional case S 1 , the relative error of integration is proportional to the mean ratio of the cell size Δ L to the domain size L 1 in the direction of integration in the power, and it depends on the accuracy of the scheme:
S 1 Δ L L 1 k + 1 .
For a uniform grid, S 1 ( 1 / N 1 ) k + 1 , where N 1 is the number of cells in the direction of integration and k is the order of accuracy of the numerical scheme. The errors provided by Equation (8) in two directions are summed up:
S e r r i = 1 2 S i .
The allowable value of the total error S m a x is typically 1–5% because the initial and boundary conditions are usually not known with a higher degree of accuracy. As a result, the following inequality should be satisfied:
S e r r · n S m a x ,
where n is the number of time steps. The maximal allowable number of time steps can then be determined by the following formula:
n m a x = S m a x S e r r 2 .
and the reliability of the results can be defined as
R s = n m a x n .
With varying grid resolutions, Table 2 forecasts the buildup of errors for the current DG system. The ultimate simulation time is set to 4, and the permissible error is deemed to be 5%. It is evident that mistakes rise quickly for the coarse grid and fall with increasing grid resolution. As scheme precision and grid resolution rise, so does the results’ reliability. All the results show that the computational model is very dependable for the current simulations; however, this does not hold true for extended simulation times.

4. Results and Discussion: Mach Number Effects on V-Shaped N 2 / SF 6 Interface

The impacts of Mach numbers on the RMI development in the shocked V-shaped N 2 / SF 6 interface are examined in this section. Emphasis is placed on the impact of Mach number on the evolution of enstrophy and kinetic energy, wave patterns, vorticity formation, and interface features. Four different Mach numbers are chosen for the computational simulations, including two weak shock cases ( M s = 1.12 , 1.22 ) and two strong shock cases ( M s = 1.42 , 1.62 ), in order to study the effects of the Mach numbers on the shocked V-shaped N 2 / SF 6 interface.

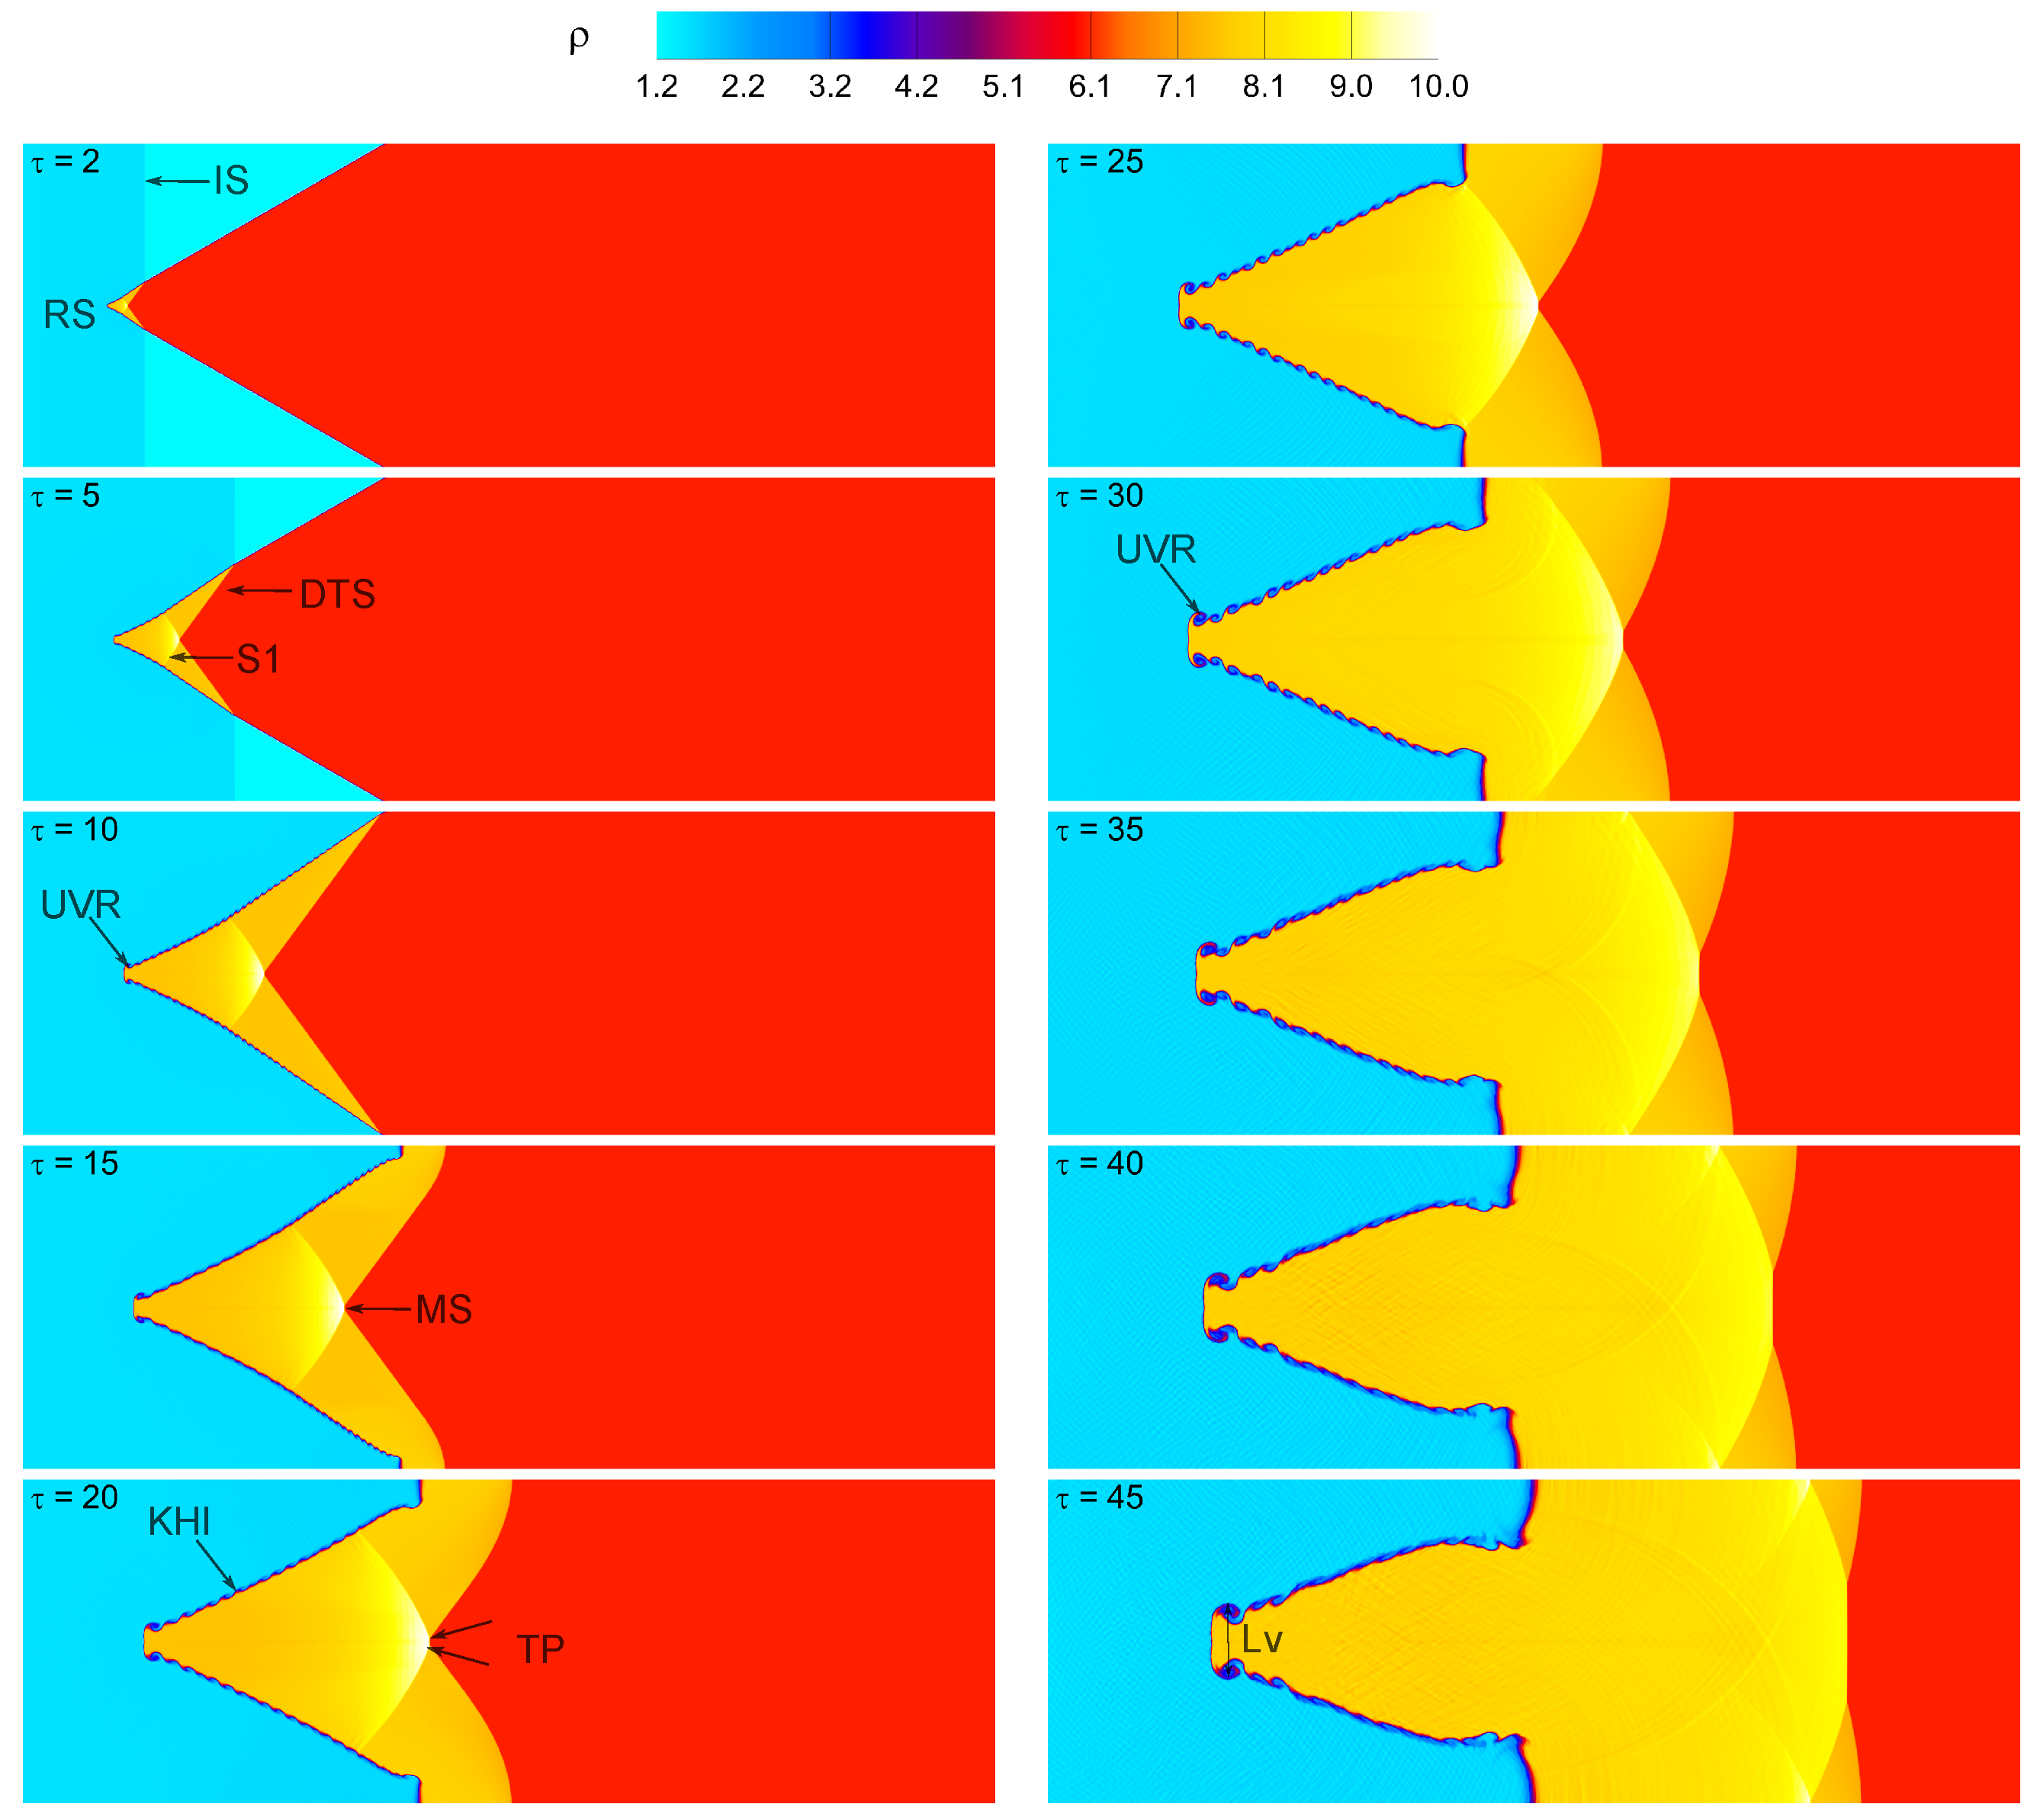
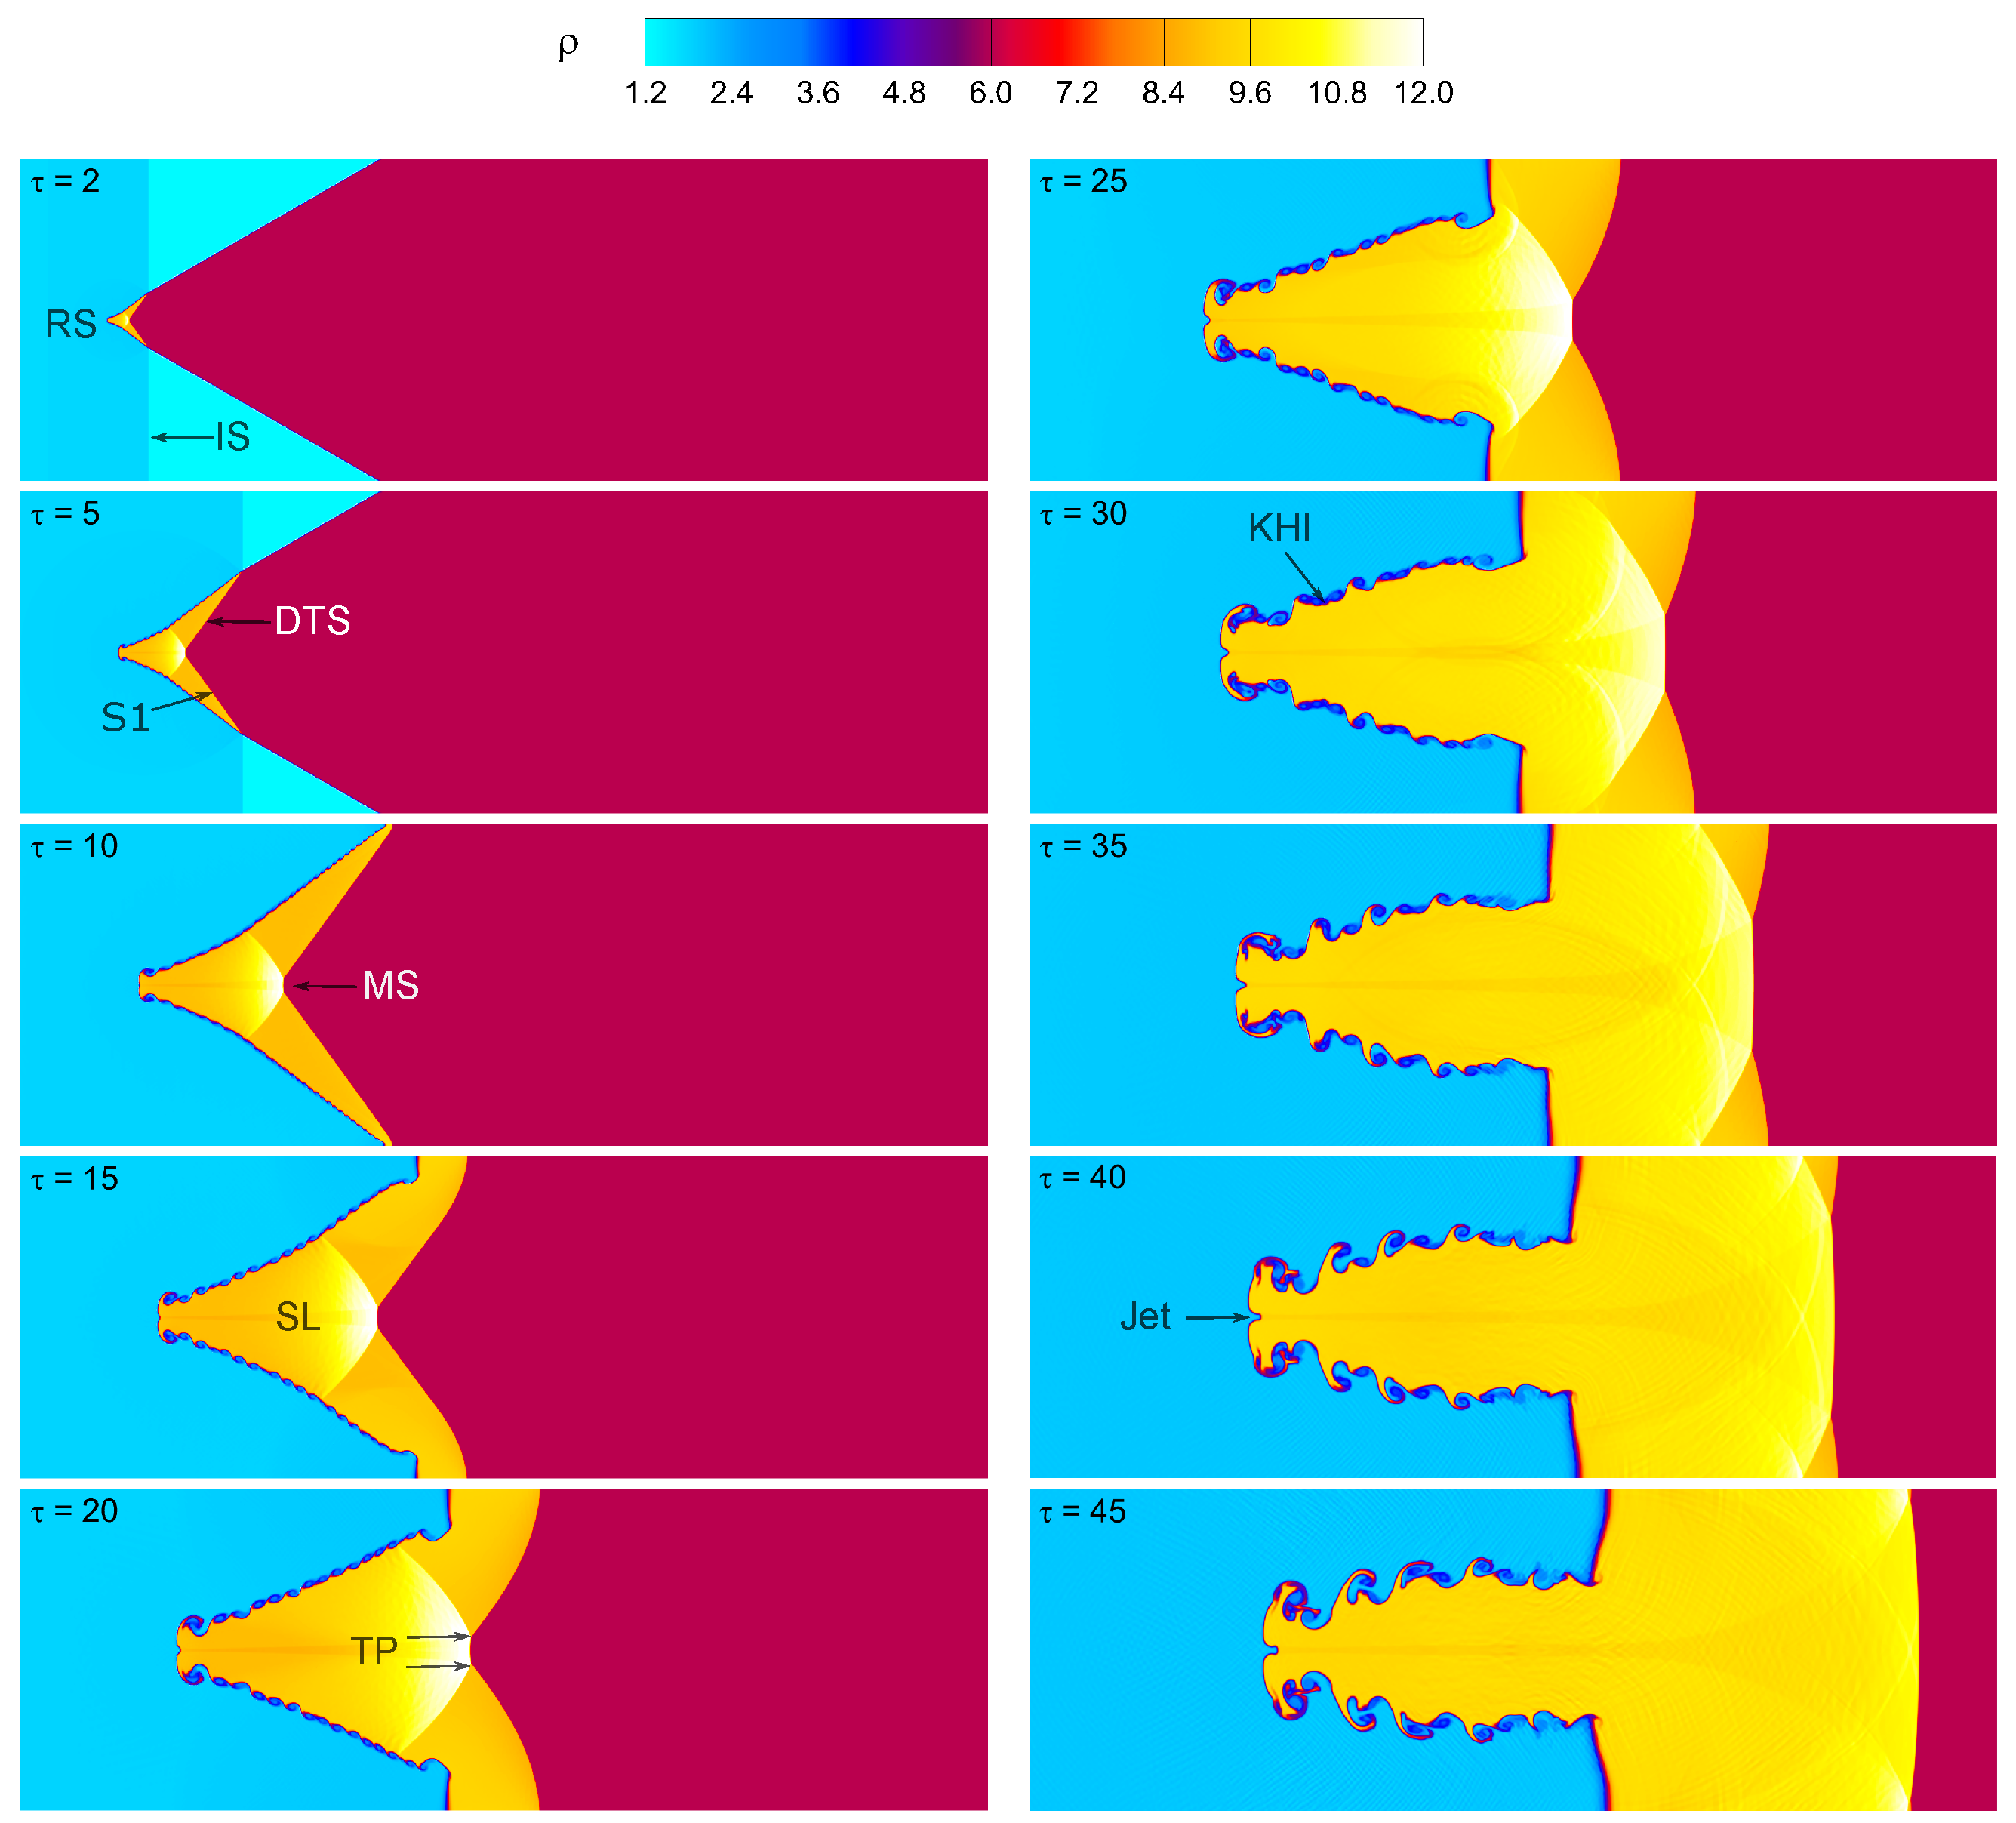
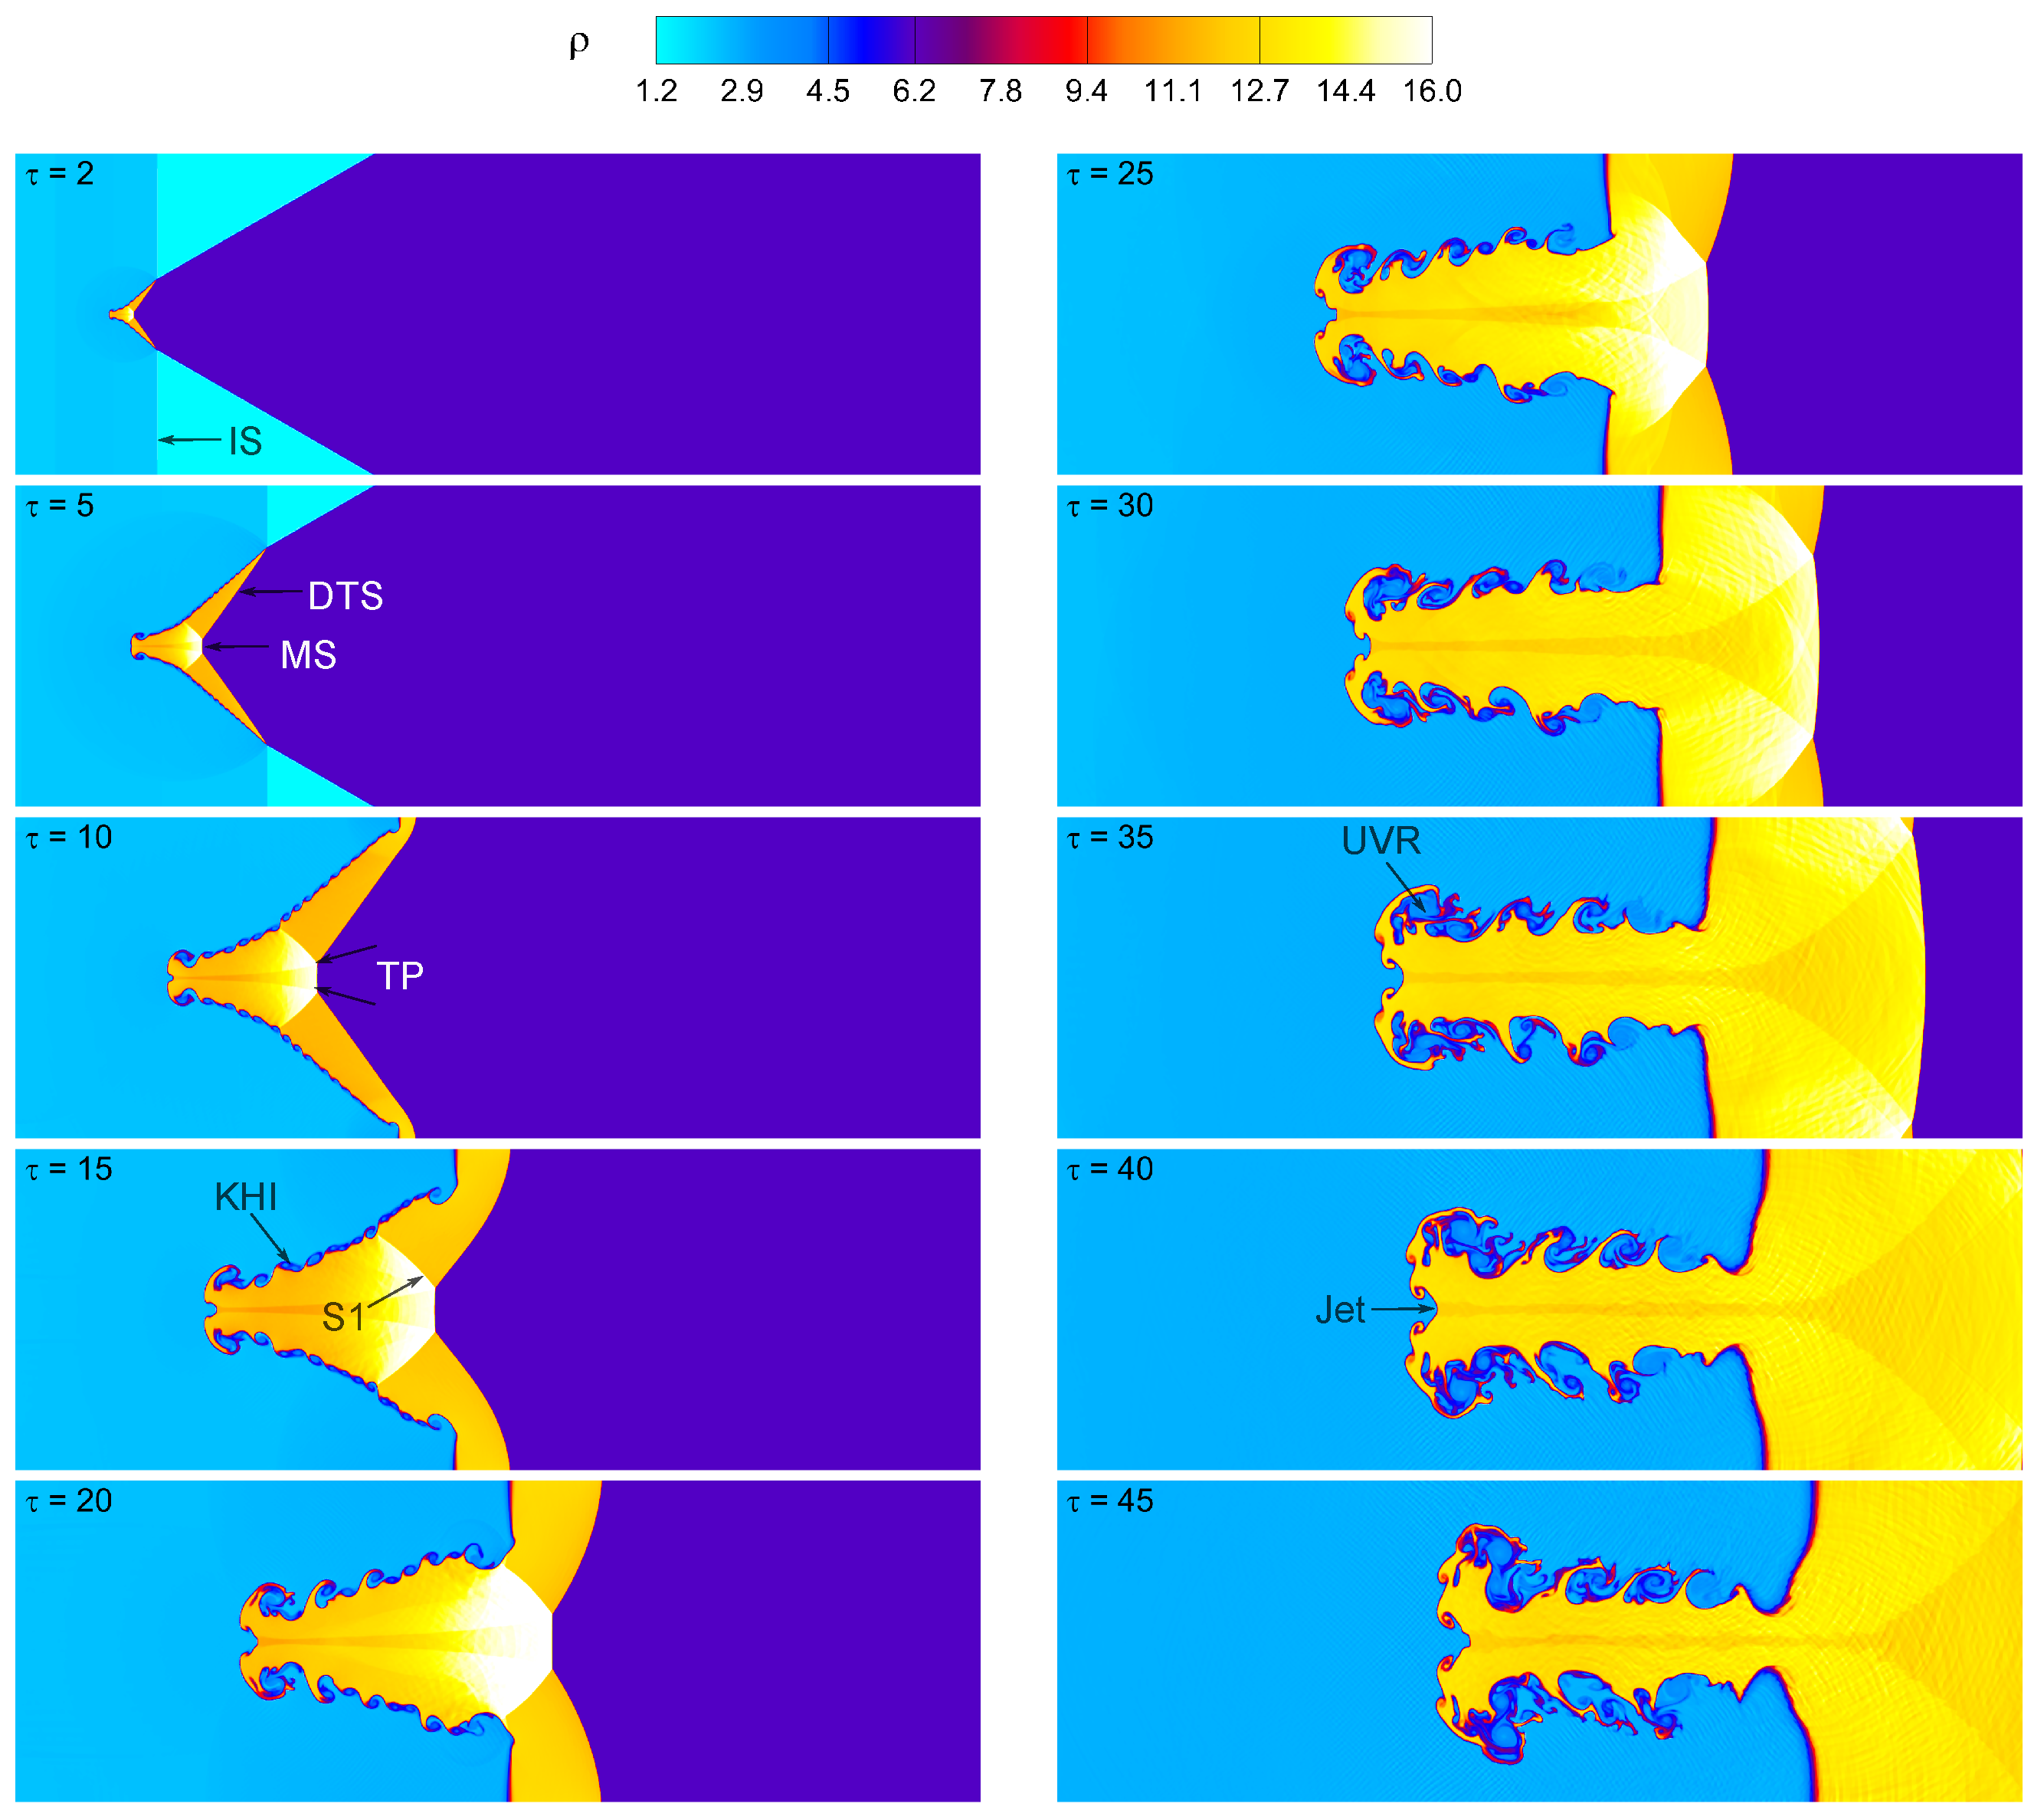
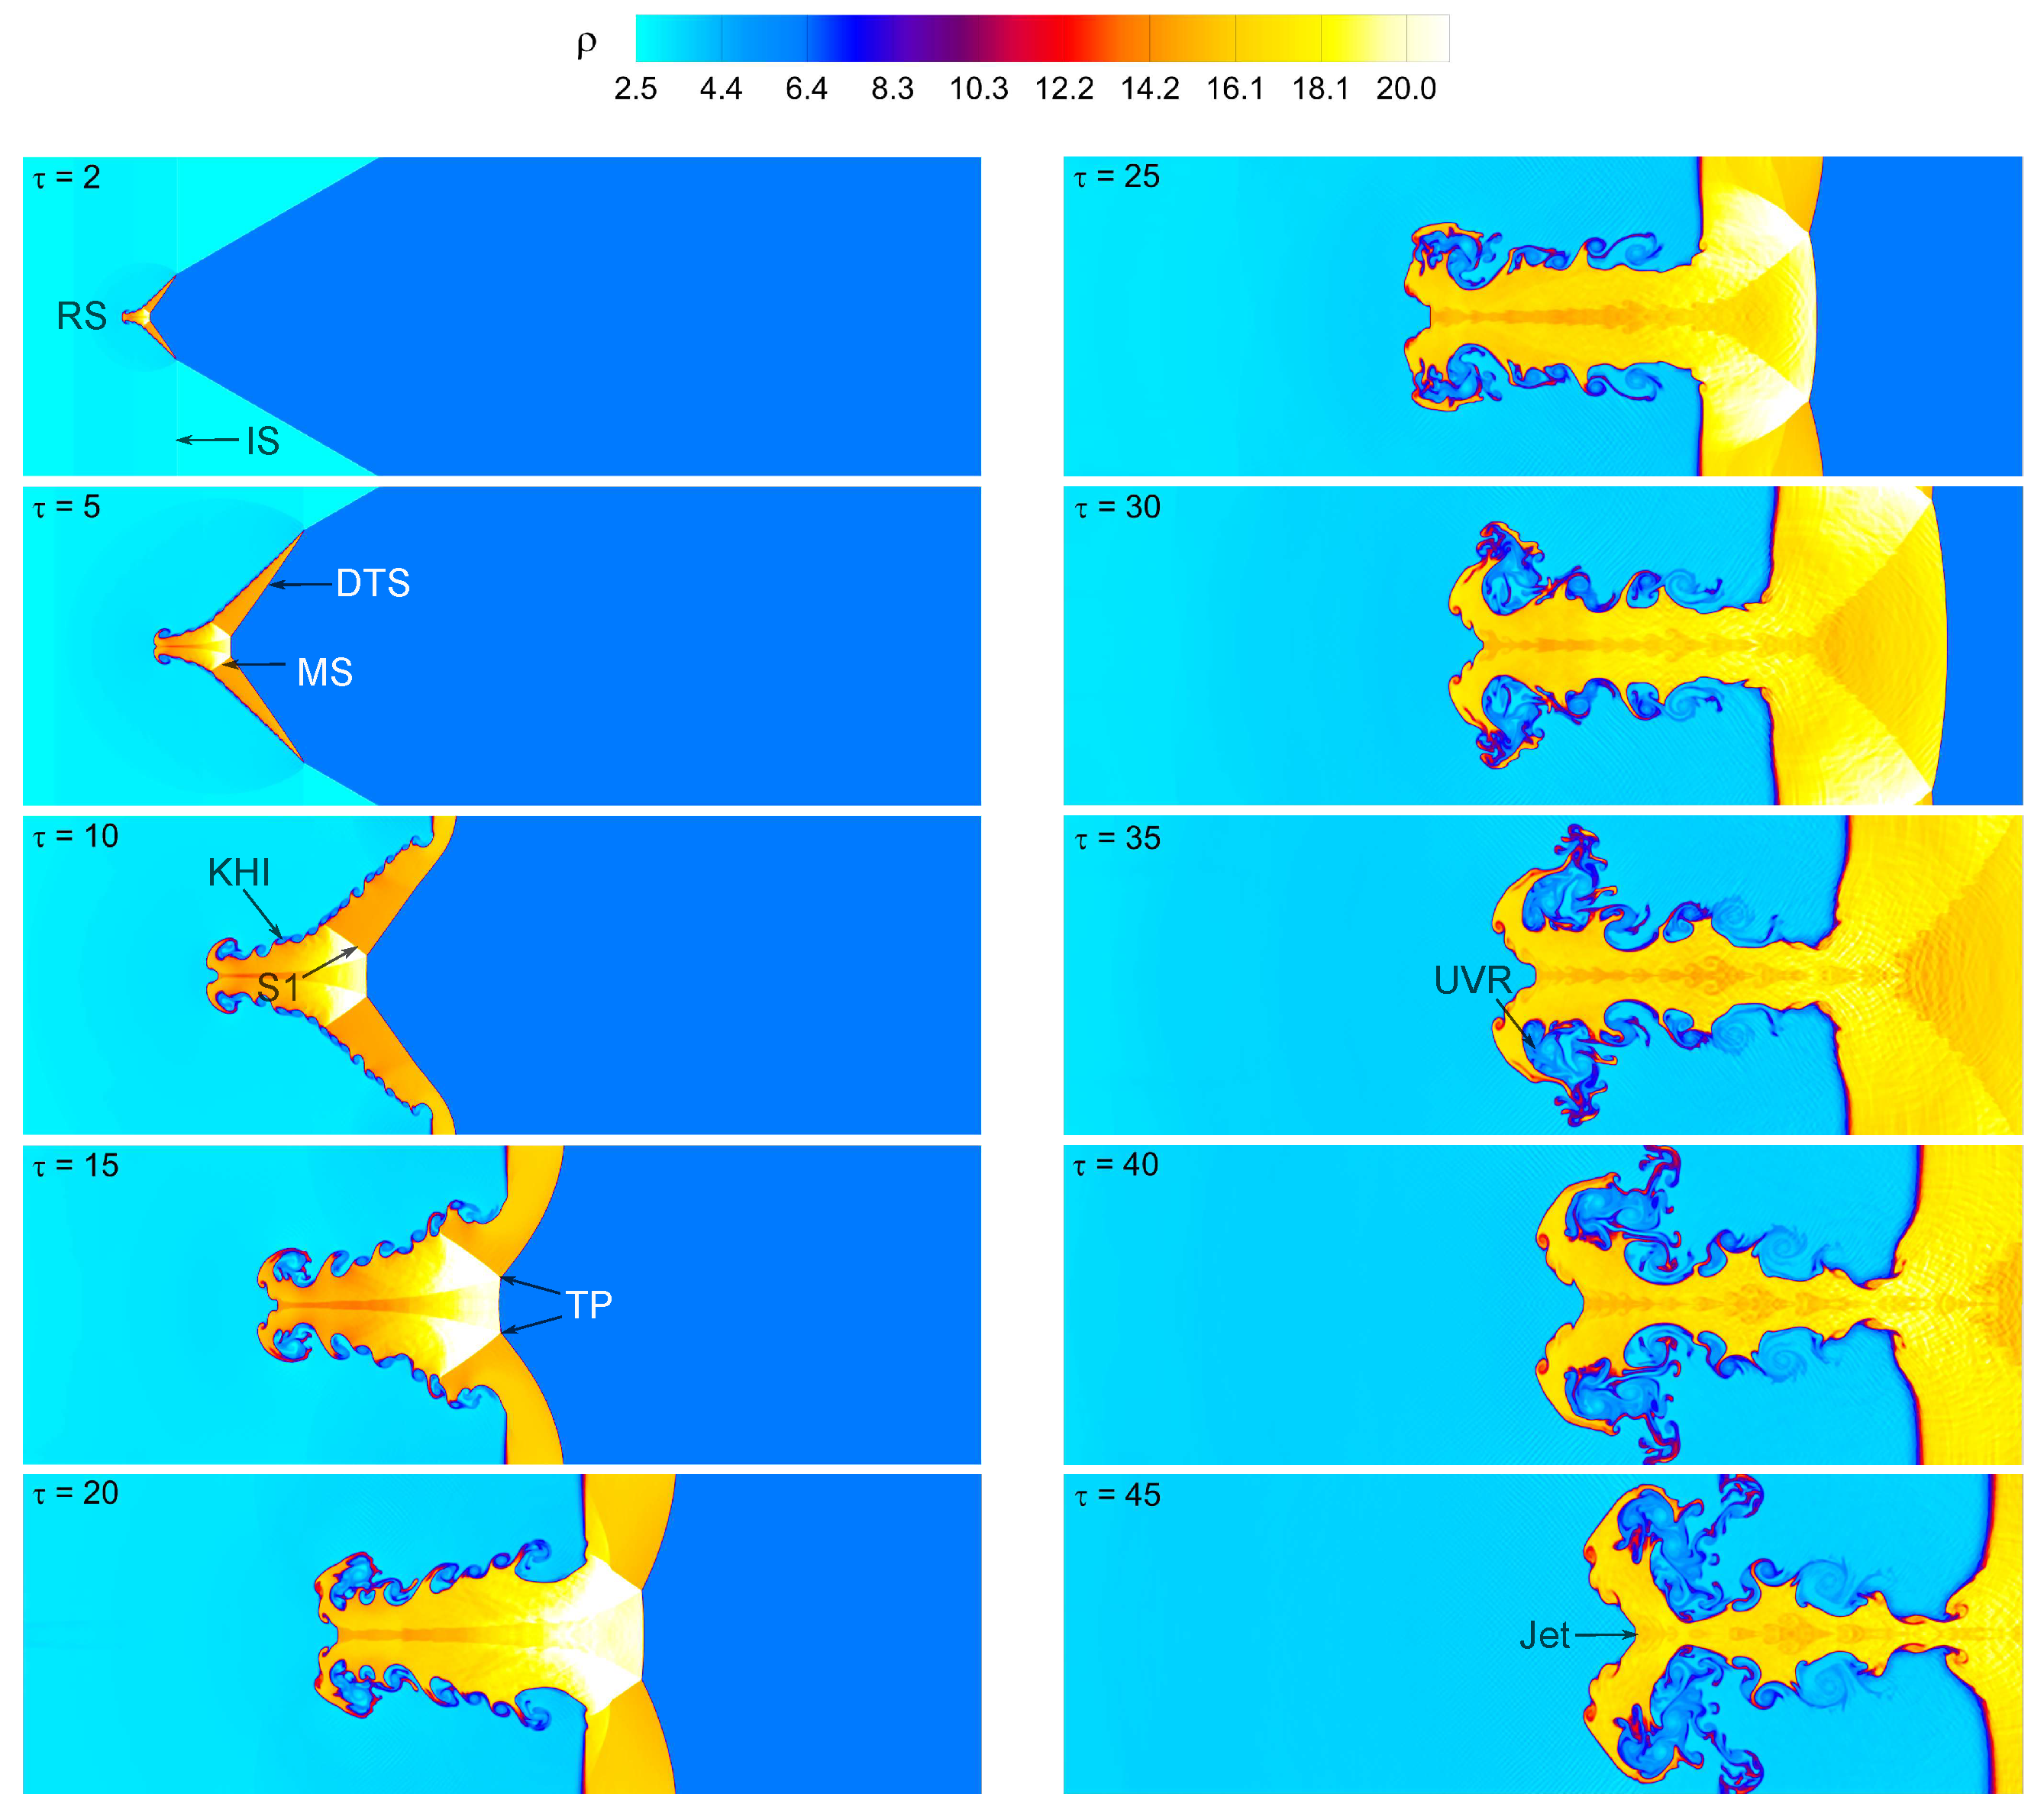
4.1. Visualization of Flow Fields and Wave Patterns

Figure 6, Figure 7, Figure 8 and Figure 9 depict the time evolution of the density contours in the shocked V-shaped N 2 / SF 6 interface at four distinct Mach numbers: M s = 1.12 , 1.22 , 1.42 , and 1.62. The incident shock (IS) wave always causes a planar direct transmitted shock (DTS) wave to travel in SF 6 gas and a reflected shock (RS) wave to move upward in N 2 gas when it meets the inclined N 2 / SF 6 interface. The refracted shocks (S1) from the two upstream oblique interfaces almost touch directly because of the short DTS wave front inside the inclined N 2 / SF 6 interface, as illustrated in Figure 6. They develop at an angle between the symmetric line (SL) and the shock front. The DTS wave travels along the interface at a somewhat slower pace than the IS wave from the N 2 gas due to the lower sound speed of the SF 6 gas. A strong local pressure and density gradient misalignment causes the formation of baroclinic vorticity, which, in turn, causes the creation of an upstream vortex ring (UVR) at the leading edge. As the IS wave passes between the top and bottom contacts of the V-shaped interface, uneven refraction occurs. The term “mach refraction reflection” (MRR) [39] refers to such an uneven refraction wave pattern. The transmitted shock then reacts with the refracted shock waves to form a triple point (TP) and a Mach stem (MS) within the SF 6 gas. Over time, the majority of the wave moves ahead of the V-shaped interface. Due to the Kelvin–Helmholtz instability during the development of the flow fields, various small-scale vortex forms are observed on the leeward side contact. Their modest size rises with time, making these rolled-up vortices more visible close to the bubble–gas contact. As a bubble and ambient gases mix turbulently, the flow fields become increasingly complex over time. They are entirely controlled by the inward jet and the vortex rings that are formed (t = 20–25).
As seen in Figure 9, it is discovered that a high Mach number results in a higher interaction between the shock and V-shaped interface. Additionally, the distortion of the V-shaped interface increases and becomes more substantial as the Mach number increases. Notably, as Figure 8 and Figure 9 illustrate, the created UVR structure at M s = 1.62 is the longest of the four situations, necessitating a more in-depth analysis. The compression phenomenon is more powerful in the cases of M s = 1.42 and 1.62 than it is in the cases of M s = 1.12 and 1.22 , as shown in Figure 6 and Figure 7. As a result, the created wave patterns get increasingly complicated, and the V-space interface is substantially smaller. Furthermore, because of the baroclinic vorticity deposition, the rolled-up vortices become noticeably larger and stronger at high Mach numbers. These vortices are particularly noticeable at the interface where the surrounding gas and the V-shaped interface meet. Remarkably, in the case of strong Mach numbers ( M s = 1.62 ), one ambient inward Jet is detected at the upstream center of the V-shaped interface. Additionally, we study the impact of boundary conditions (such as outflow, symmetry, and no-slip wall) on the computed flow morphology and spatially integrated fields of a shocked V-shaped N 2 / SF 6 interface at the highest Mach number M s = 1.62 , as illustrated in Appendix A.
The Mach number effects on the interface deformation history of the shocked V-shaped N 2 / SF 6 interface are shown in Figure 10. This broadens the scope of our investigation into the impacts of the Mach numbers. The frontal portion of the V-shaped interface is crushed in that direction after going through the IS wave. As soon as the IS wave strikes the upstream part of the V-shaped interface at the beginning of the contact, the compression phenomenon begins. Because of the action of the IS wave, the upstream side pushes forward in the early instants in all Mach numbers. With time, the top and bottom downstream corners of the V-shaped interface fold forward toward the axis, assuming a convergent configuration. The baroclinic vorticity causes a small rolled-up upstream vortex pair (UVR) to form at the frontal part of the V-shaped interface. The rolled-up UVR continues to enlarge with time. Compared to higher Mach numbers, the magnitude of these rolled-up vortices on the interface is less in the case of M s = 1.12 . At all four Mach numbers, the rolled-up vortex rings and inward N 2 jet offer total control over the flow field of the shocked V-shaped N 2 / SF 6 interface.

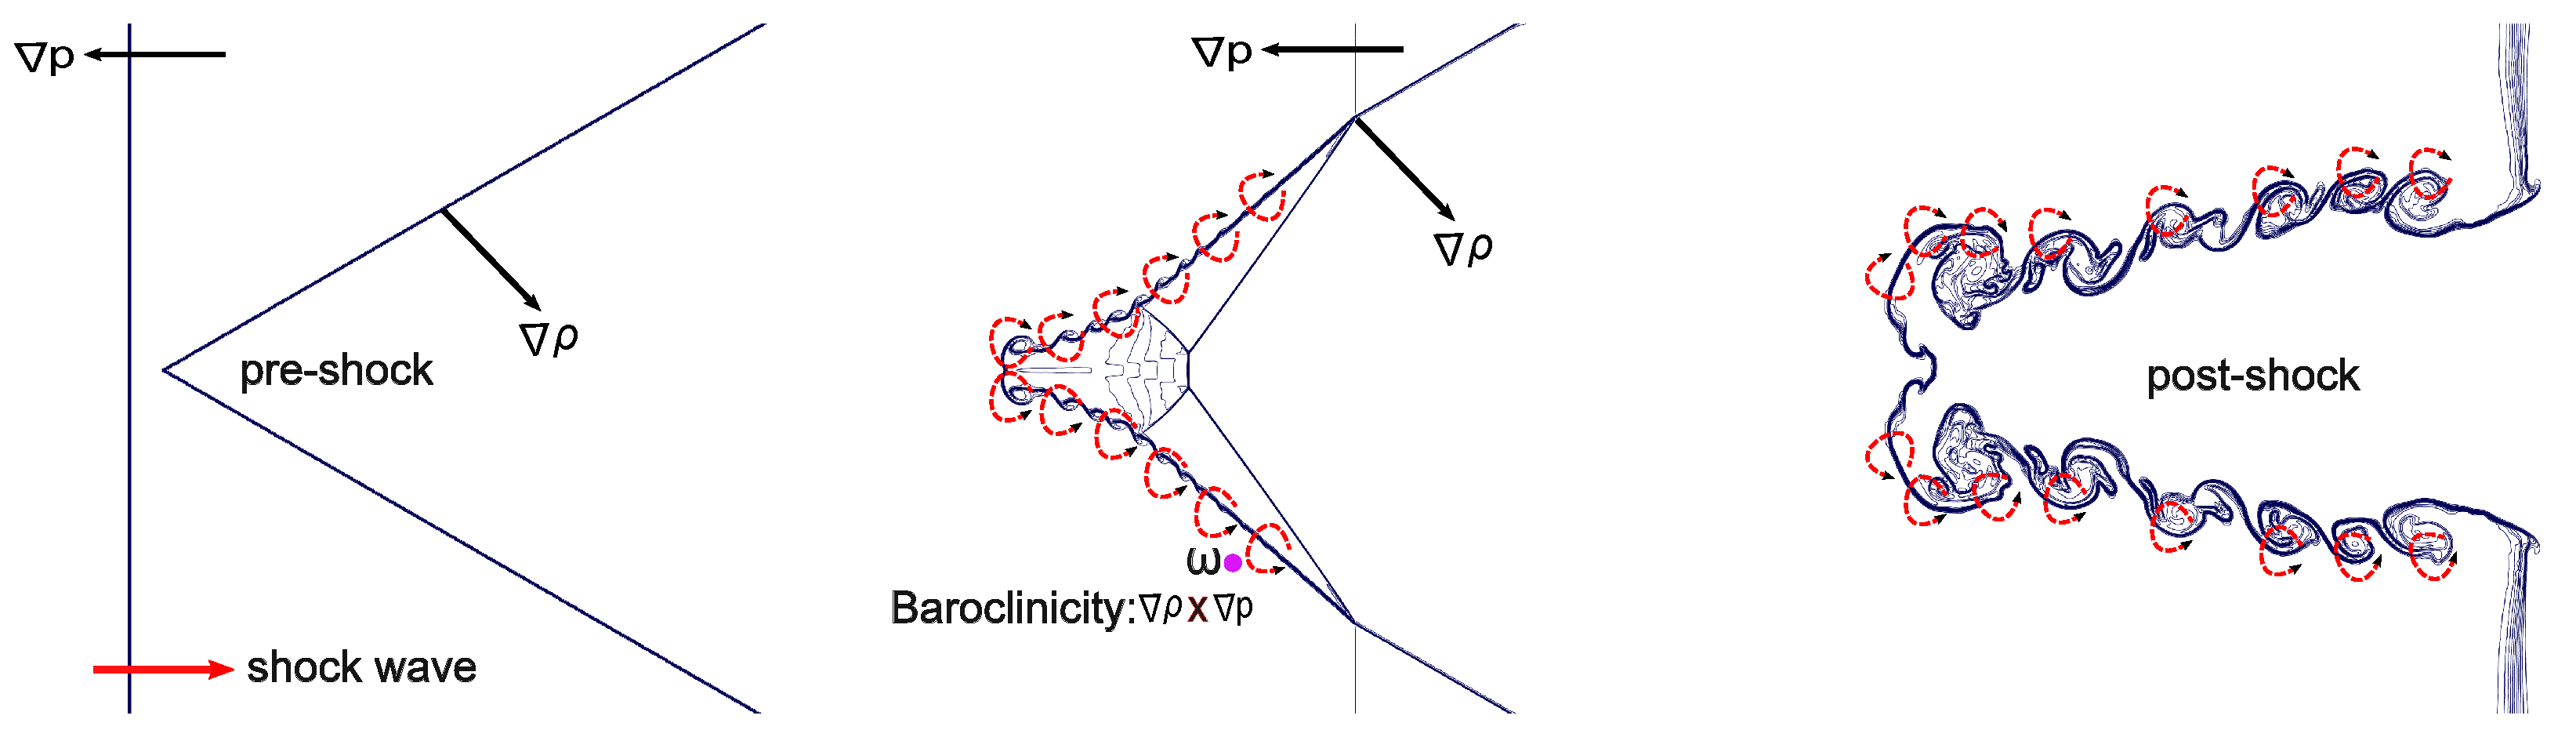
4.2. Vorticity Generation Mechanism

The vorticity transport equation (VTE) is useful for understanding how shock wave interactions with density interfaces generate vorticity, which is important for RMI development. For compressible Euler flows, the VTE is written as follows:
D ω D τ = ( ω · ) u ω ( · u ) + 1 ρ 2 ( ρ × p ) .
In this case, the term on the left denotes the material derivatives, which are made up of the total of the convection component, ω c = ( u · ) ω , and the unsteady component, ω t = ω / t . The first term on the right represents the stretching of the vorticity resulting from changes in the flow’s velocity gradient, which is not present in turbulent flows that are two-dimensional. The following expression represents the stretching of vorticity due to flow compressibility. Finally, baroclinic vorticity, which is the third term, is important for producing small-scale vortical structures near the gas–gas interface.
One important factor in the formation of RMI is the deposition of baroclinic vorticity on the shocked gas contact. Figure 11 schematically depicts the vorticity creation during the first phase of the shocked V-shaped N 2 / SF 6 interface. In shocked interface flows, the pressure gradient dominates the plane IS wave whereas the density gradient dominates the V-shaped interface. As the IS wave passes over the V-shaped interface, baroclinic vorticity is generated and distributed along the interface. The mismatch between the pressure ( p ) and density ( ρ ) gradients, i.e., ρ × p 0 , which leads to baroclinic vorticity, is a key factor in the creation of RMI flows. The V-shaped interface does not significantly change when it passes over the IS wave. Furthermore, a Mach reflection occurs through the inclined interfaces when the IS wave interacts with the V-shaped interface via the Mach stem. Thus, the Mach stem’s contribution to the pressure gradient in the vorticity production causes the baroclinic vorticity to be gradually activated over the V-shaped interface. Moreover, these vortices dominate the shocked gas interface fluxes.
The Mach number effects on the vorticity distribution of the shocked V-shaped N 2 / SF 6 interface at various time instants ( τ = 5 , 10 , 20 , 30 ) are shown in Figure 12. Everywhere, the vorticity is zero during the early stages of interaction. Early on in the IS wave’s passage over the V-shaped interface, the discontinuity between SF 6 gas and ambient gas is where the baroclinic vorticity is primarily deposited locally on the interface. It is possible to see that the top and bottom of the V-shaped interface, where the pressure and density gradients are not orthogonal, are where the vorticity is largest. In contrast, it is 0 where the density and pressure gradients are collinear at the interface along the interface’s axis. Considerable positive vorticity and negative vorticity are created on the upper and bottom contacts. As illustrated in the figures, the upper vortex rings (UVR) at the interface corner likewise exhibit notable vorticity production. It is evident from Figure 12a–d that a significant amount of both negative and positive vorticity forms at the interface’s top and lower horizontal sides, respectively. There is a tiny amount of both positive vorticity and negative vorticity on the top and bottom of the V-shaped interface. Furthermore, a tiny amount of vorticity, either positive or negative, is also seen at the inward jet head on the upper or lower plane of the left upstream side. The increased inward jet movement caused by this positive (negative) vorticity on the upper (lower) jet head suggests a connection between vorticity deposition and jet formation. During the interaction process, a notable gap in vorticity production is observed for the various shock Mach numbers in the shocked V-shaped N 2 / SF 6 interface. As Figure 12a illustrates, for M s = 1.12 , a minor amount of vorticity is created around the rolled-up vortices on the V-shaped interface. Based on Mach numbers, these rolled-up vortices are more prominent, as Figure 12c,d demonstrate. In conclusion, when rolled-up vortices occur, the formation of vorticity is the main process at high Mach numbers.
To further enhance our understanding of the vorticity generation in the shocked V-shaped interface, three significant spatial integrated fields are introduced: average vorticity, dilatational, and baroclinic vorticity production terms. The definition of these spatially integrated fields is
ω a v ( τ ) = D | ω | d x d y D d x d y ,
ω d i l ( τ ) = D ω ( · u ) d x d y D d x d y ,
ω b a r ( τ ) = D 1 ρ 2 ( ρ × p ) d x d y D d x d y ,
where D represents the entire computational domain.
Figure 13 illustrates the effects of the Mach number on the spatially integrated fields of baroclinic vorticity production, dilatational vorticity production, and average vorticity production in the shocked V-shaped N 2 / SF 6 interface. When the incident and reflected shock waves crash with the bubble, as shown in Figure 10, the spatially integrated fields at M s = 1.12 are the smallest of the four shock Mach numbers. The improvement of these fields is substantial at M s = 1.62 . The spatially integrated fields rise with time for all four Mach numbers, suggesting that the ambient gas is entrained more and more into the distorted V-shaped N 2 / SF 6 interface. More specifically, as Figure 13a illustrates, the average vorticity value increases when the incident and reflected shock waves contact the bubbles. The V-shaped interface’s average vorticity intensity may eventually decrease as a result of the higher vorticities’ promotion of gas mixing both inside and outside the interface, which speeds up energy transmission and consumption. Interestingly, during the interaction, both vorticity production terms reach considerable values. As illustrated in Figure 13b, the plot of the dilatational vorticity generation term displays locally stretched structures around the vortex core as a result of compressibility effects from small regions of compression and expansion. Figure 13c illustrates how the misalignment of pressure and density gradients is represented by the plot of the baroclinic vorticity production term, which indicates the vorticity created by contact discontinuities and reflected shock structures. The mixing of ambient gas with the SF 6 interface is facilitated by the vorticities created by the shock wave–V-shaped interface contact. The spatially integrated fields exhibit their maximum development rate when the reflected shock waves strike the warped bubble once more, showing markedly increased vorticities during this time. After that, the flow field’s growth rate decreases. Consequently, a straightforward non-monotonic link between the vorticity production terms and the surrounding gas is seen in the evolution of the spatially integrated fields.

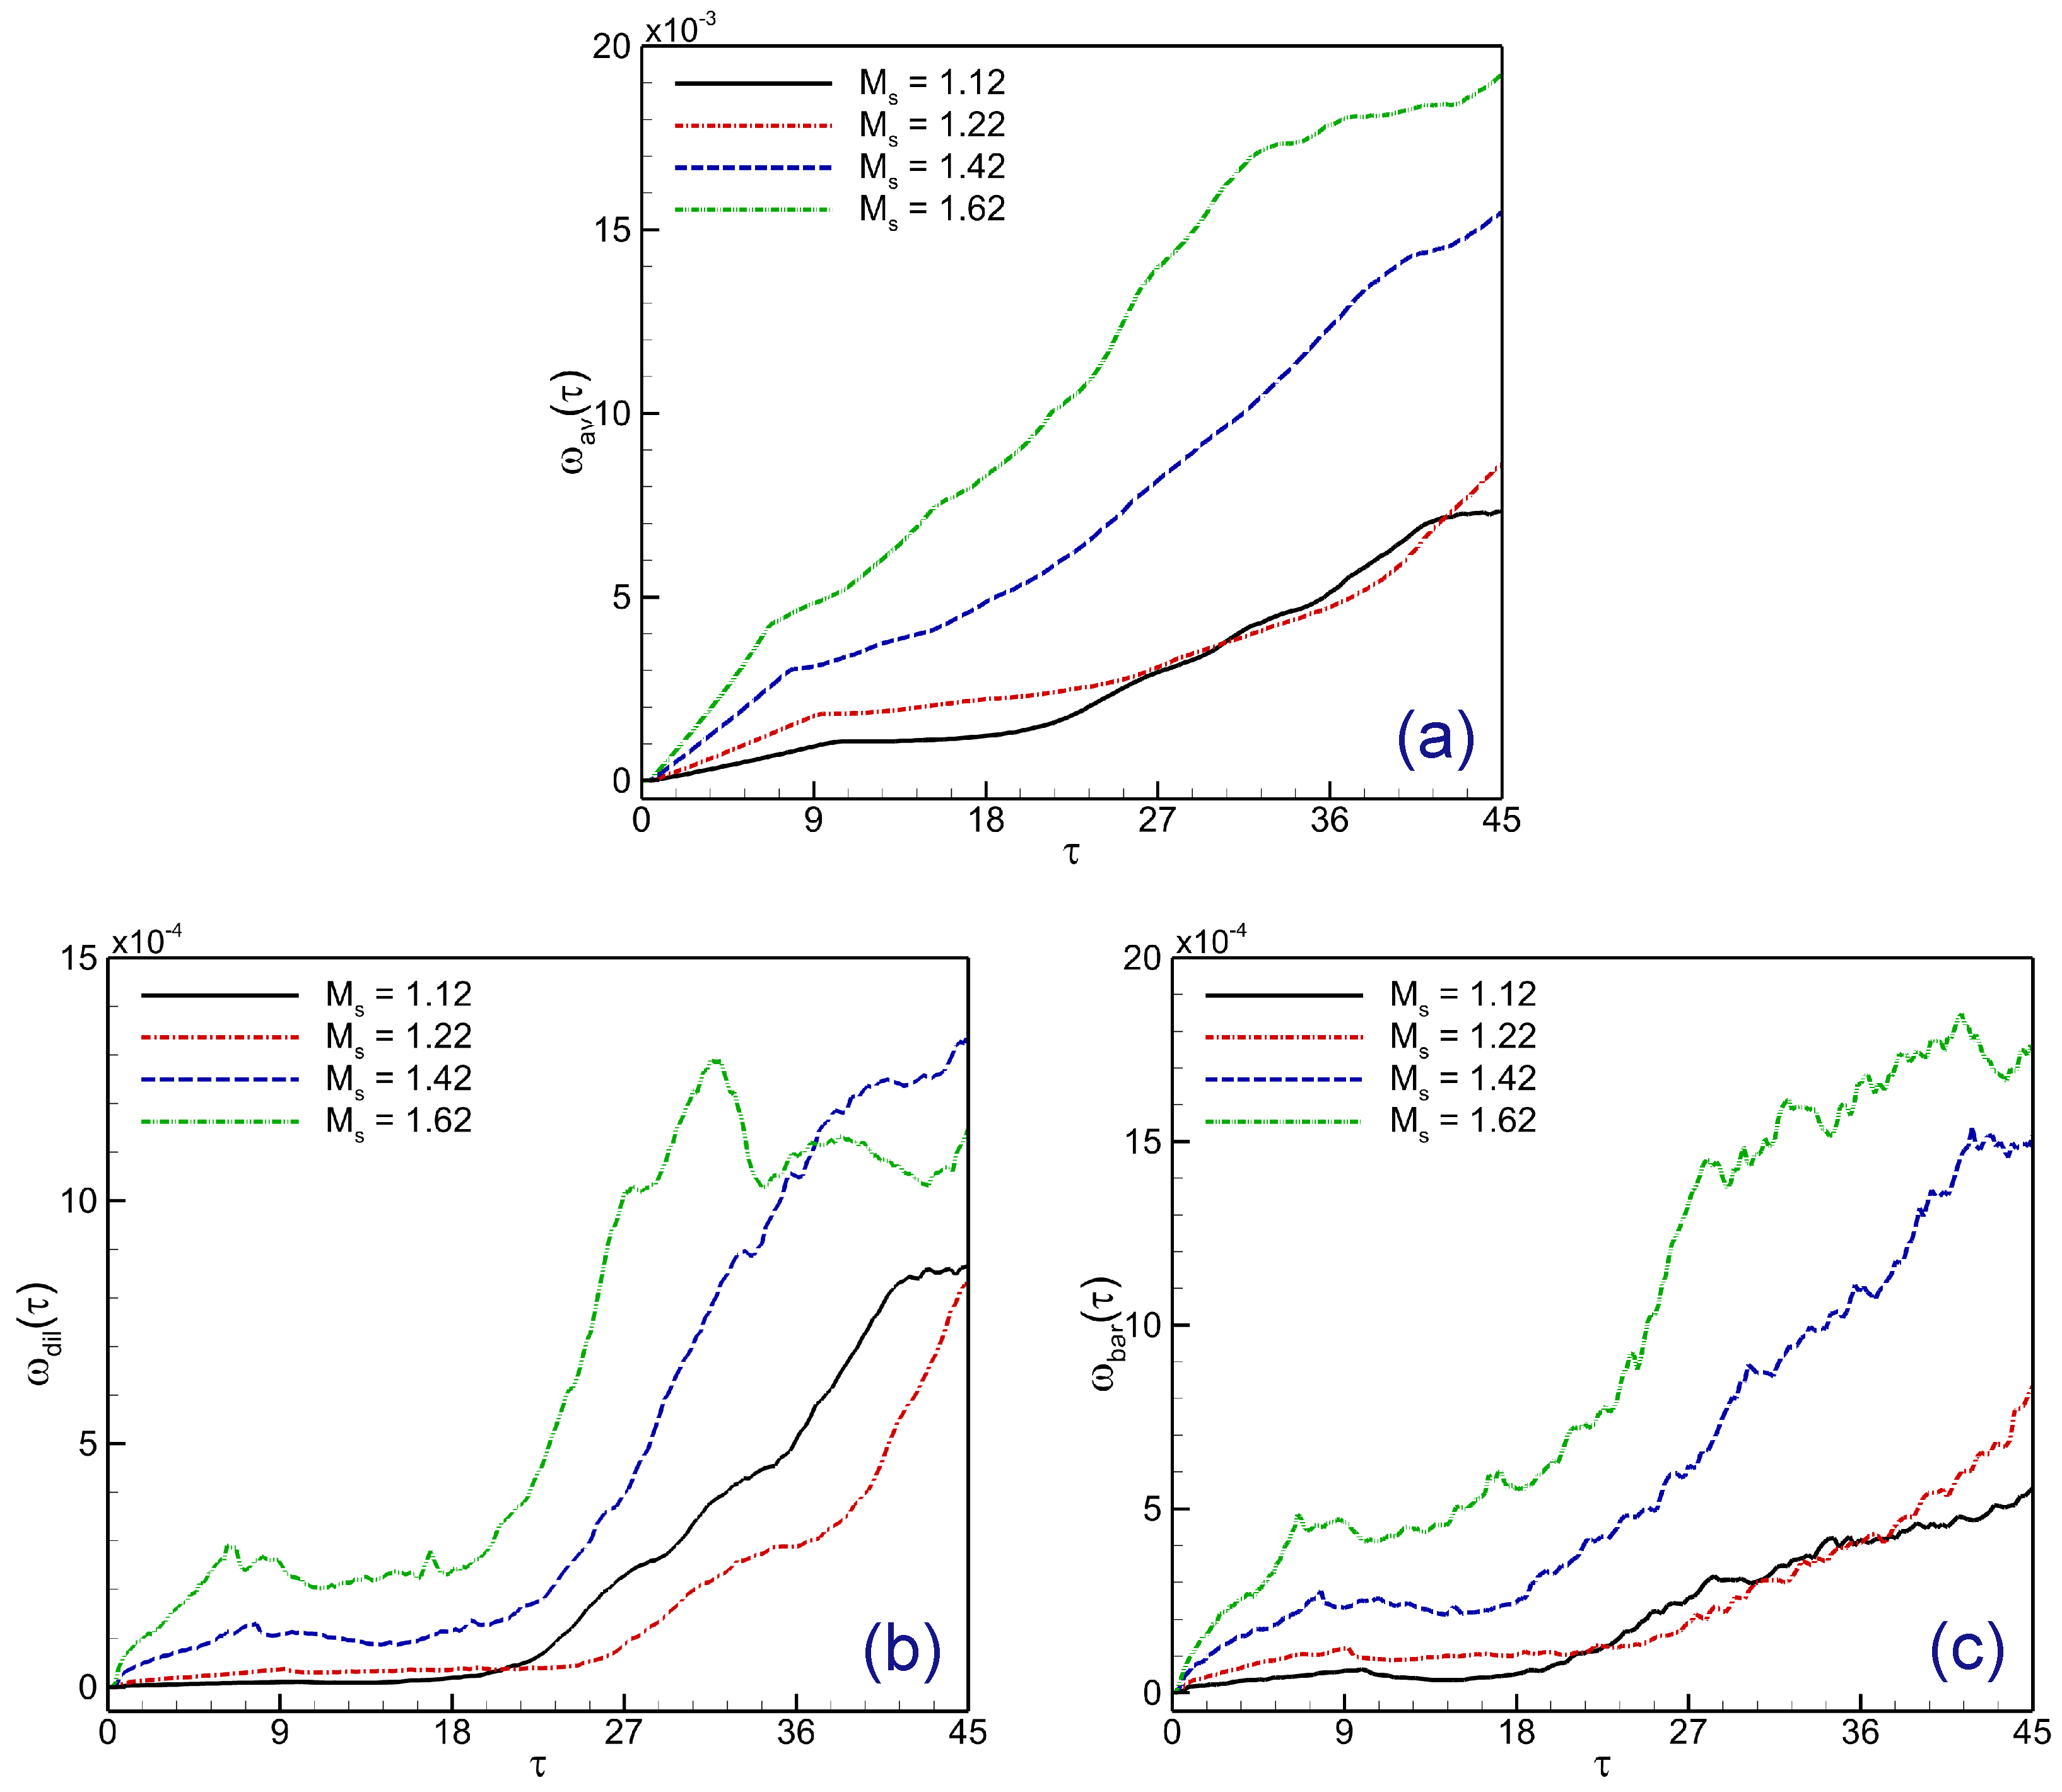
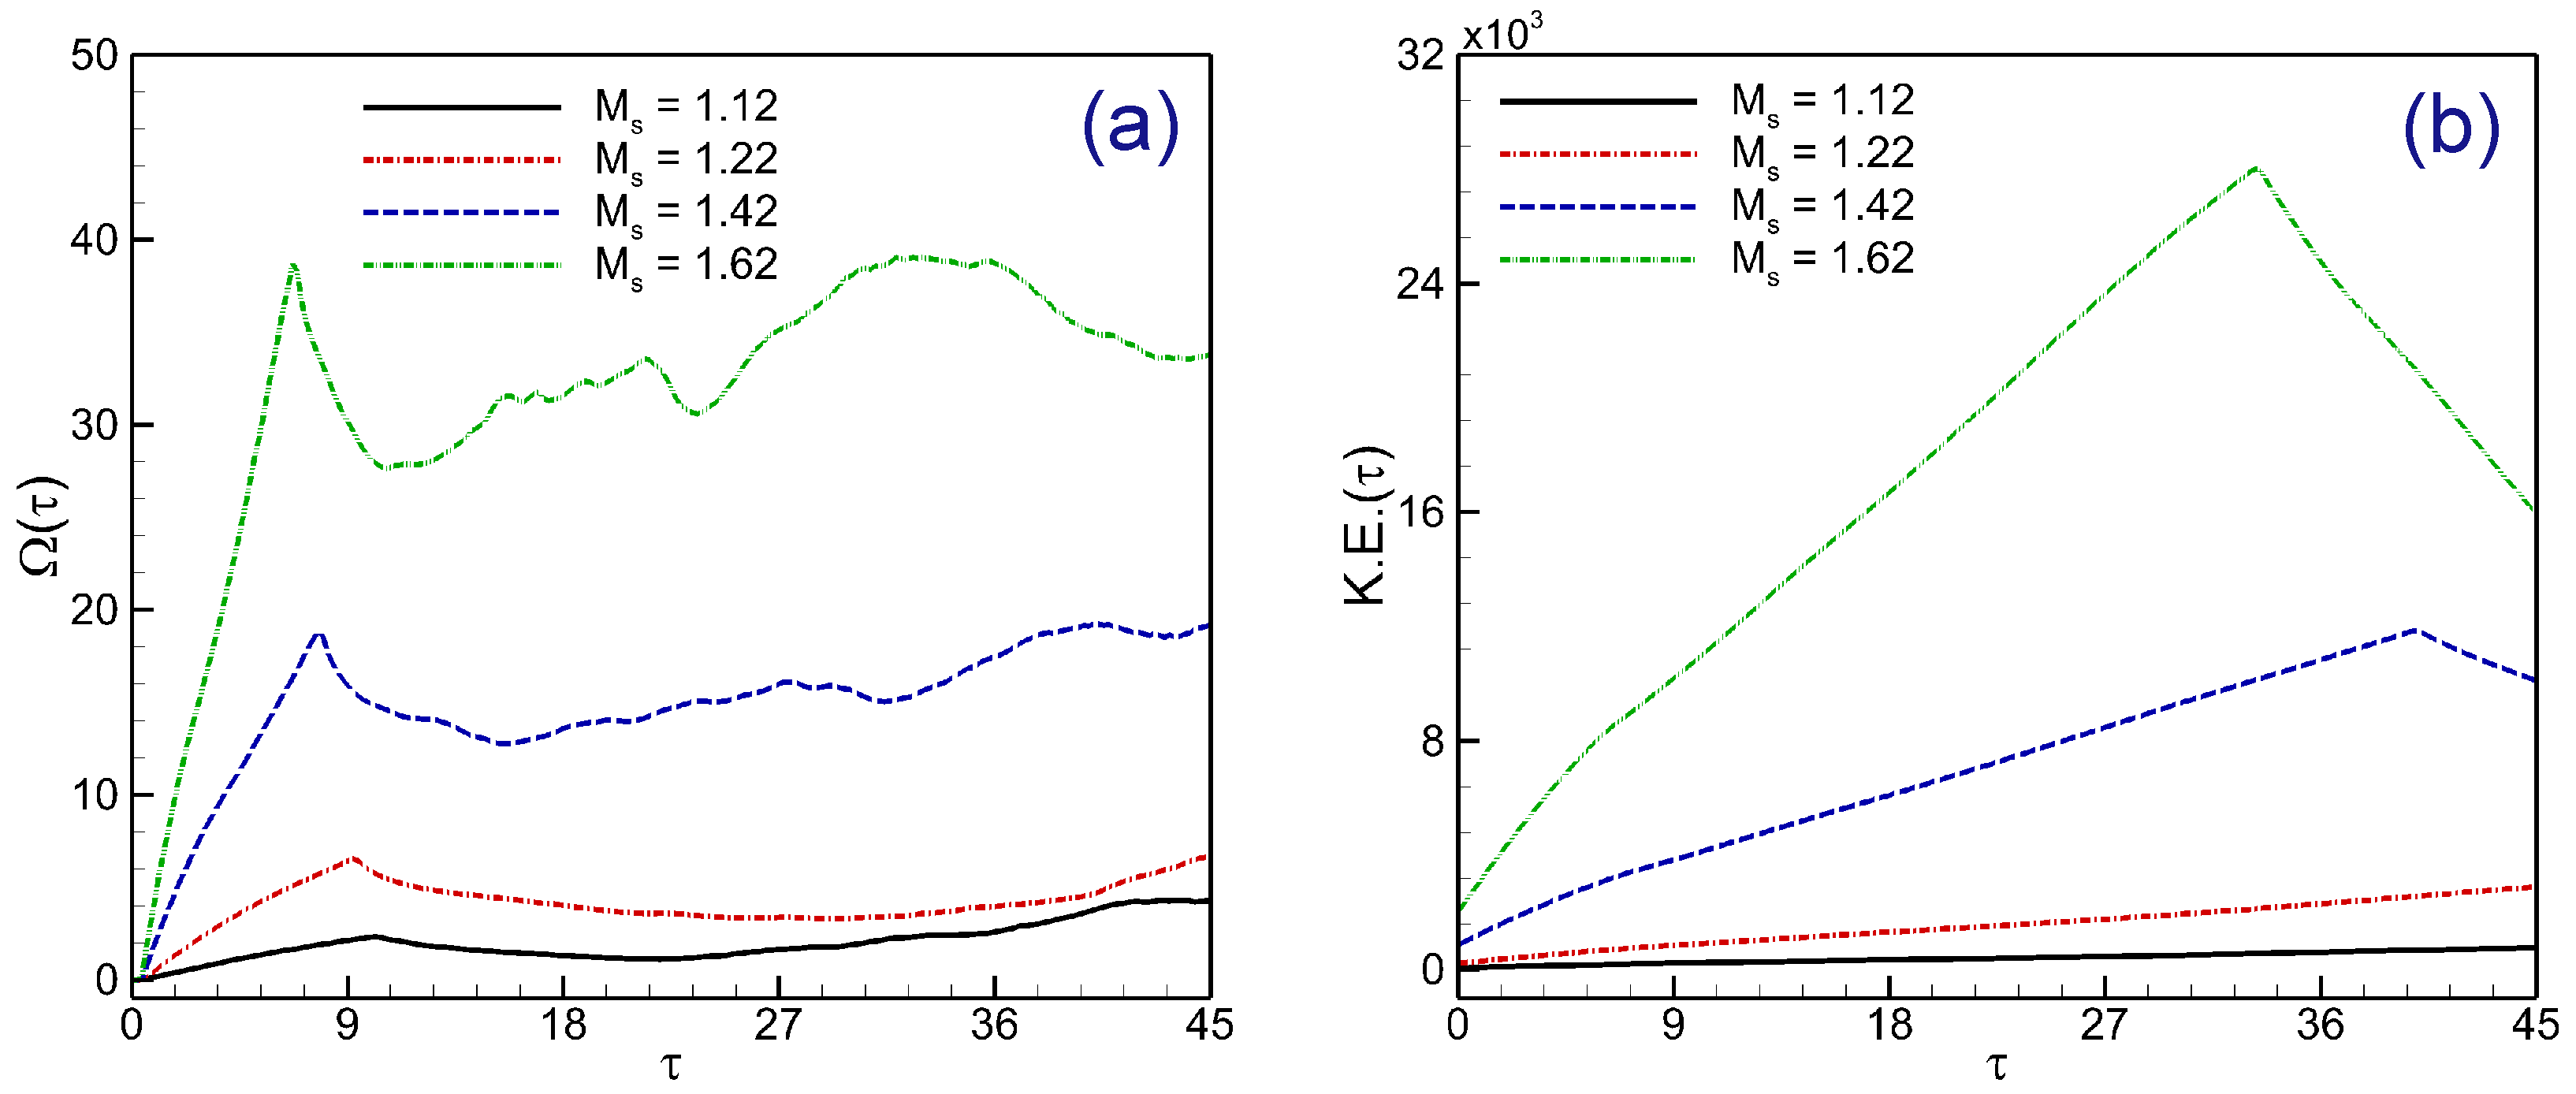
4.3. Mechanism of Enstrophy and Kinetic Energy Evolution

To further investigate the impact of Mach number on the physical processes occurring in the shocked V-shaped N 2 / SF 6 interface, we examine the evolution of enstrophy and kinetic energy. In the study of vortex dynamics, enstrophy is a physical parameter that is used to evaluate the intensity of vorticity within a flow field. It is calculated as the fluid flow’s area integral of vorticity square.
Ω ( τ ) = 1 2 D ω 2 d x d y .
However, a compressible flow’s kinetic energy offers crucial insights into the dynamics and behavior of fluids at different pressure and temperature levels. The time evolution of the kinetic energy (K.E.), defined as follows, is represented by the spatial integral of the velocity vector square in the flow field.
K . E . ( τ ) = 1 2 D ρ u 2 d x d y .
Here, we consider ρ = ρ SF 6 for computing the kinetic energy of the shocked V-shaped N 2 / SF 6 interface.
Figure 14 shows the Mach number effects on the kinetic energy distribution and enstrophy of the shocked V-shaped N 2 / SF 6 interface at τ = 10 . Following the encounter, the kinetic energy and enstrophy at different Mach numbers differ significantly. Enstrophy and kinetic energy inside the rolled-up vortices (UVR) of the deformed bubble interface are observed in substantial amounts. The flow fields of these values are much improved at high Mach numbers in comparison to low Mach numbers. The spatially integrated fields of the enstrophy and kinetic energy with time are shown in Figure 15 to help explore the Mach number effects further. A timeline of enstrophy’s progression is presented in Figure 15a. Up until the shock wave reaches the upstream pole of the V-shaped contact, there is no enstrophy. The creation of baroclinic vorticity causes it to rise as the shock wave passes. The enstrophy increases at the V-shaped contact where the IS and RS waves impinge. As a result, as illustrated in Figure 15a, the increased vorticities encourage the mixing of gases within and outside the gas interface, speeding up energy transfer and consumption. This can eventually reduce the enstrophy intensity in the V-shaped interface region. Every Mach number exhibits the same phenomenon. Stronger shock waves cause more enstrophy; hence, the only difference in overall enstrophy levels is observed. Additionally, Figure 15b shows the plotted evolution of the kinetic energy, which varies and depends on Mach numbers. It is clear that when Mach numbers increase, kinetic energy increases significantly.

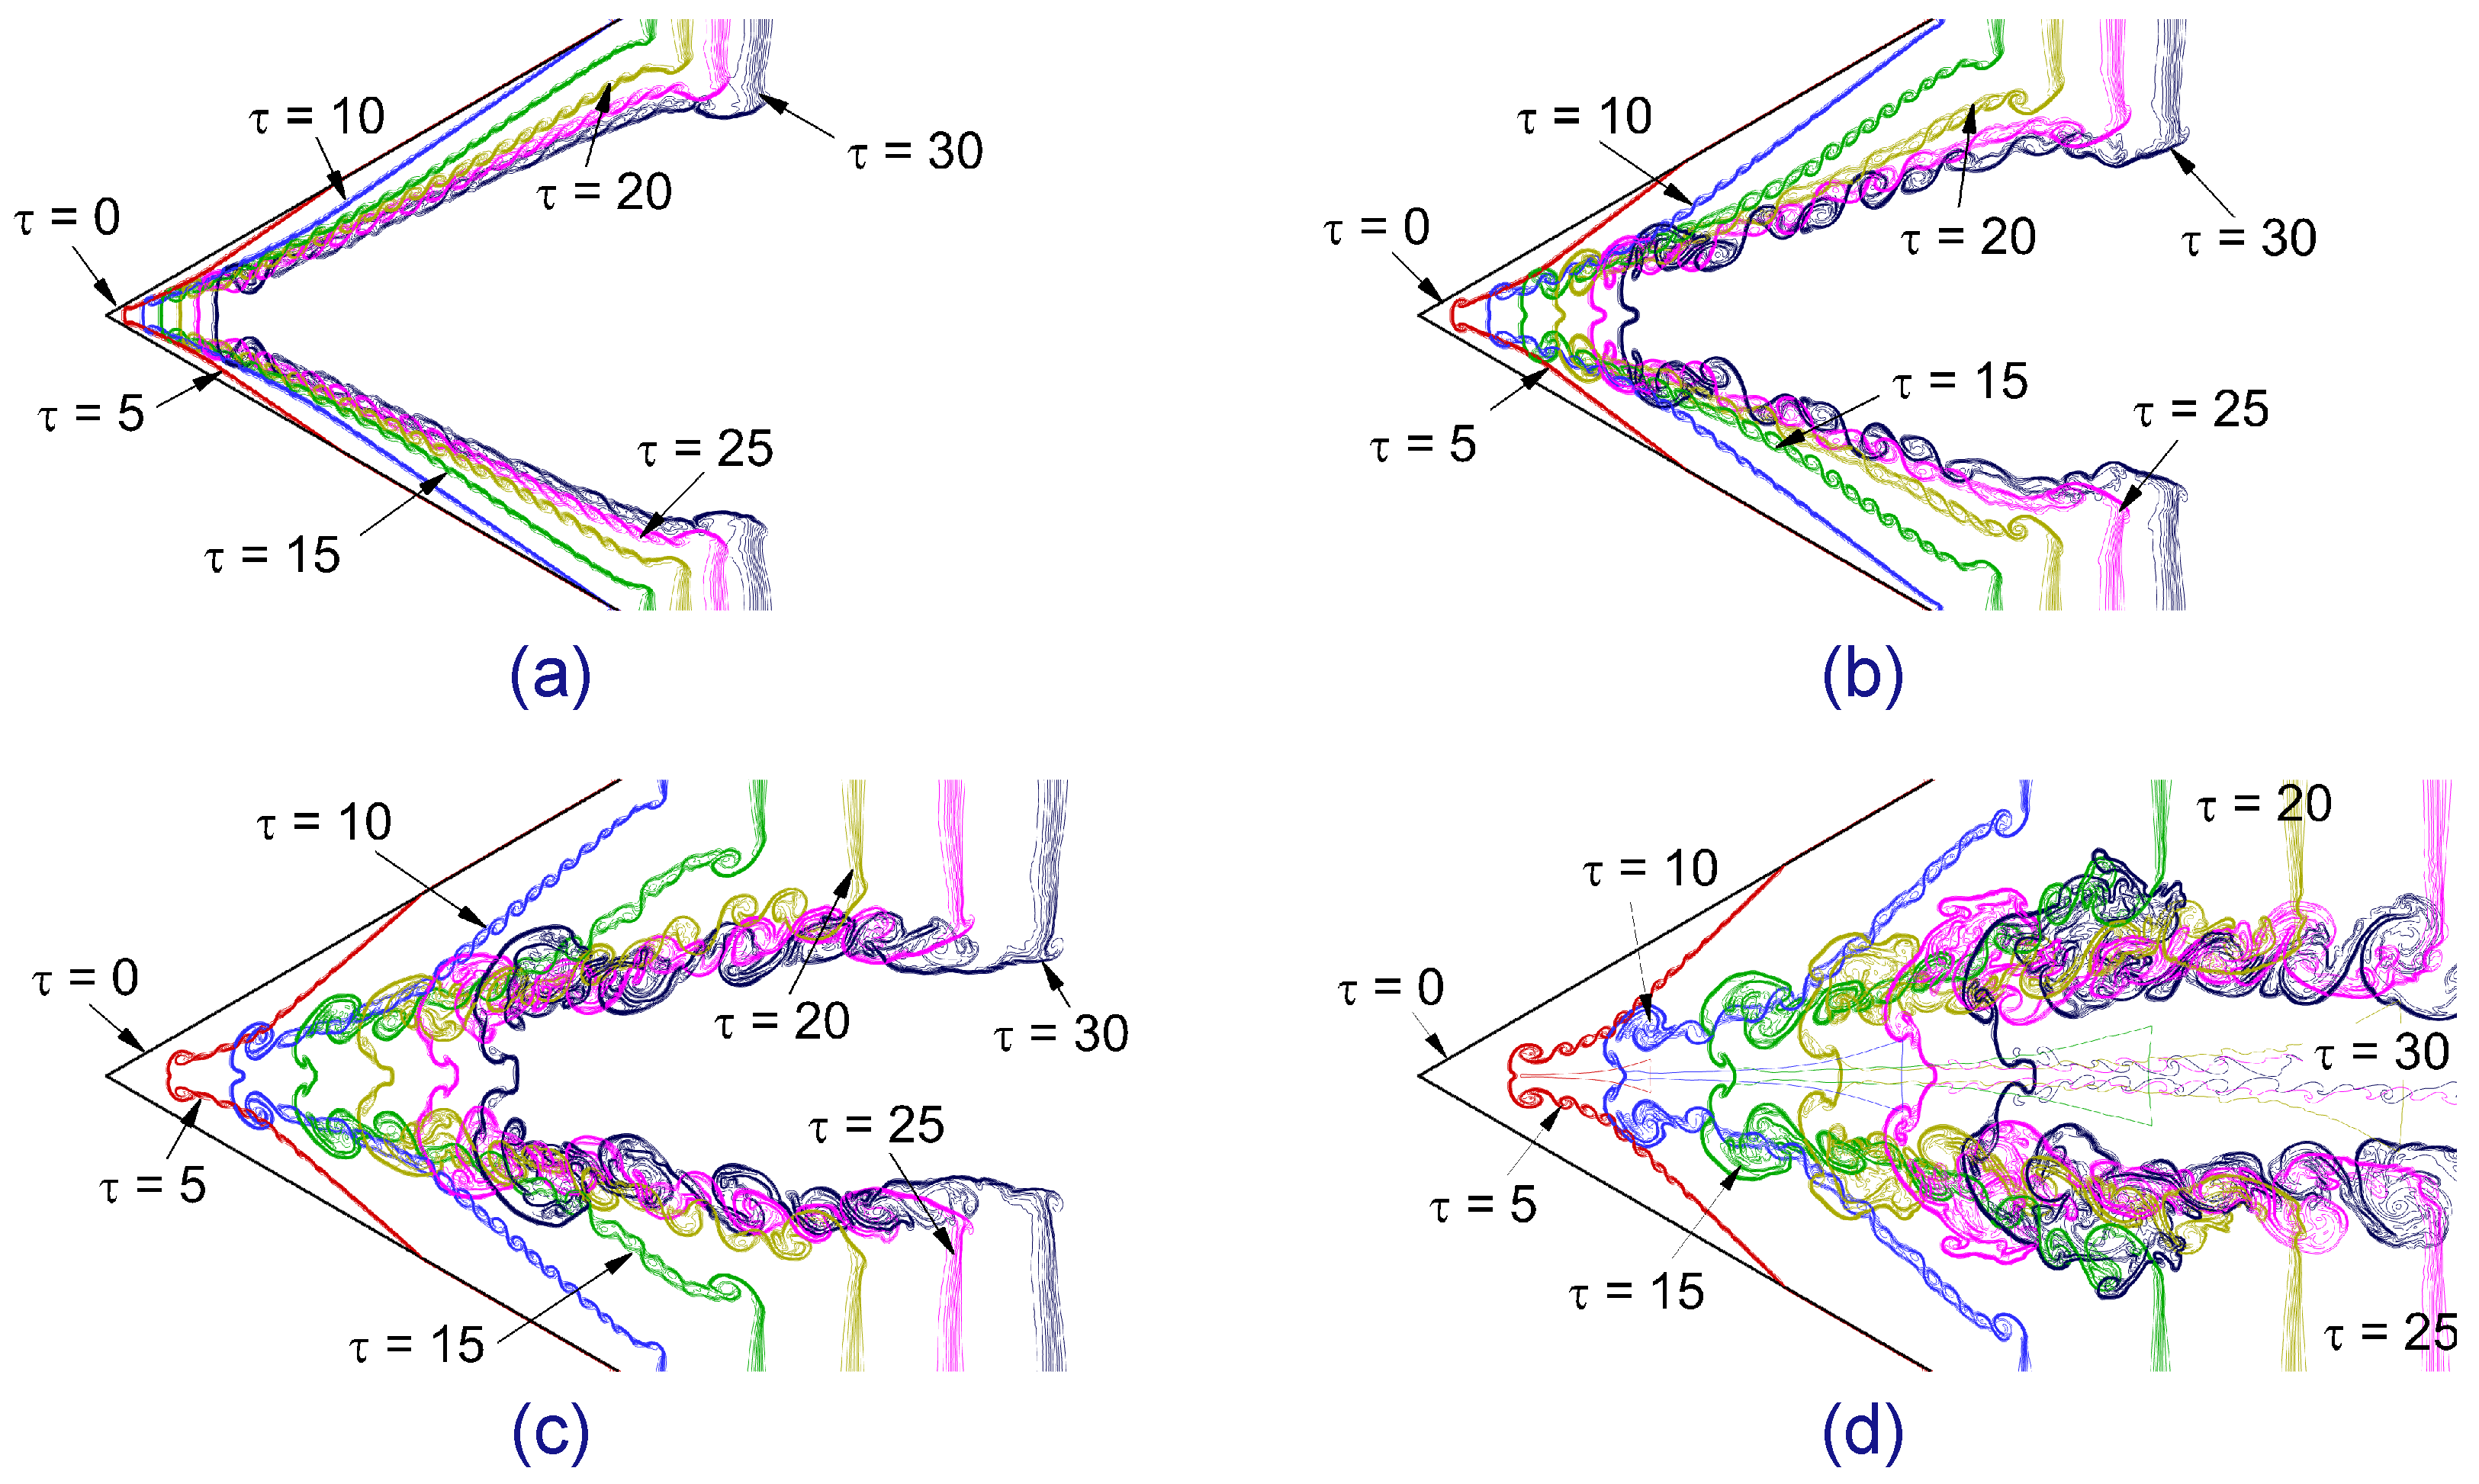
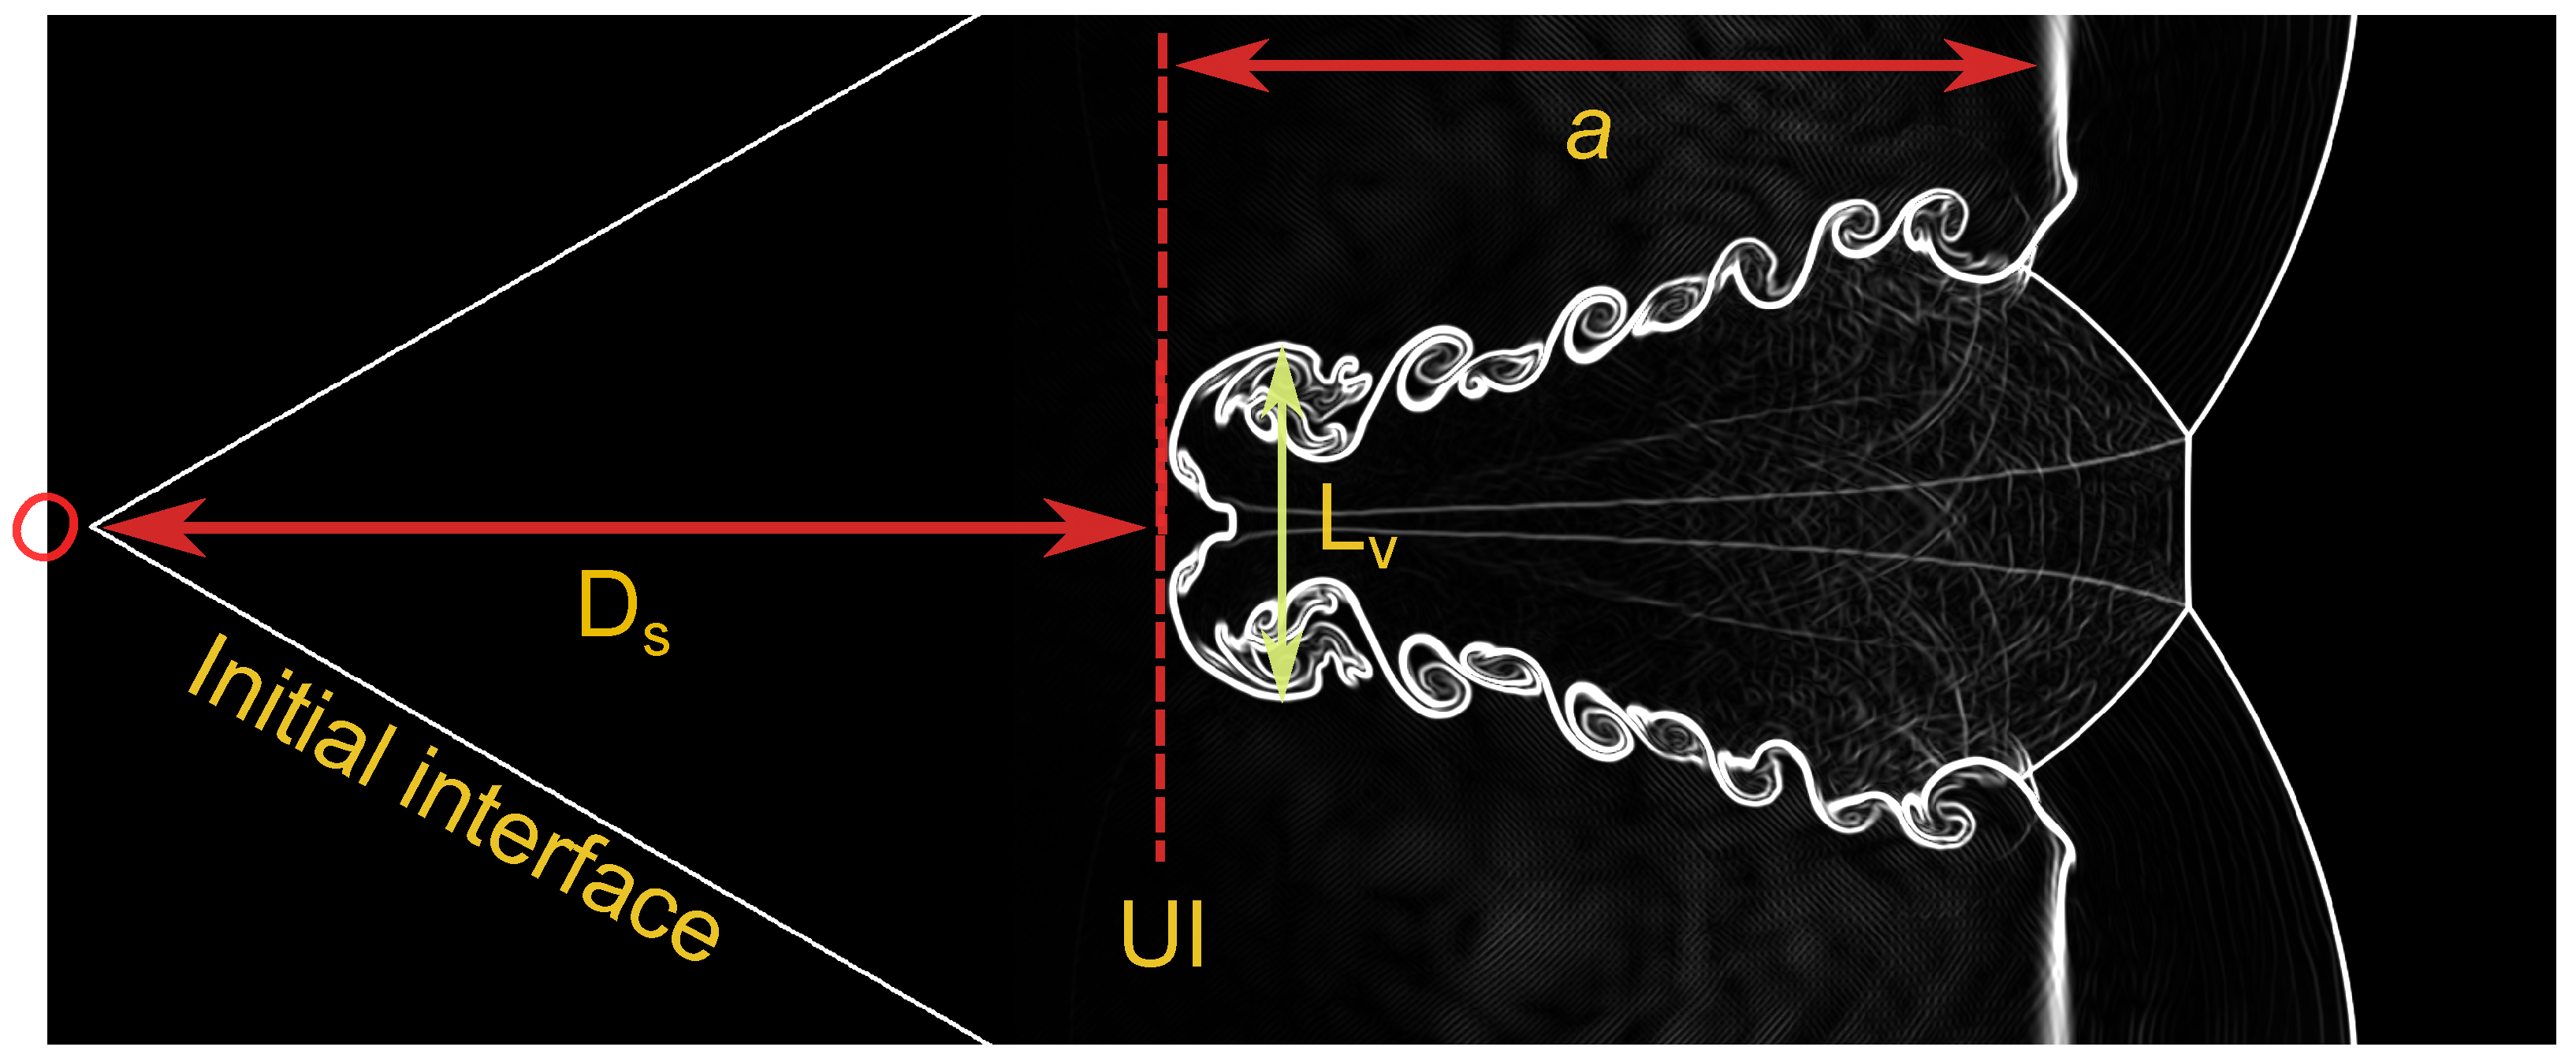
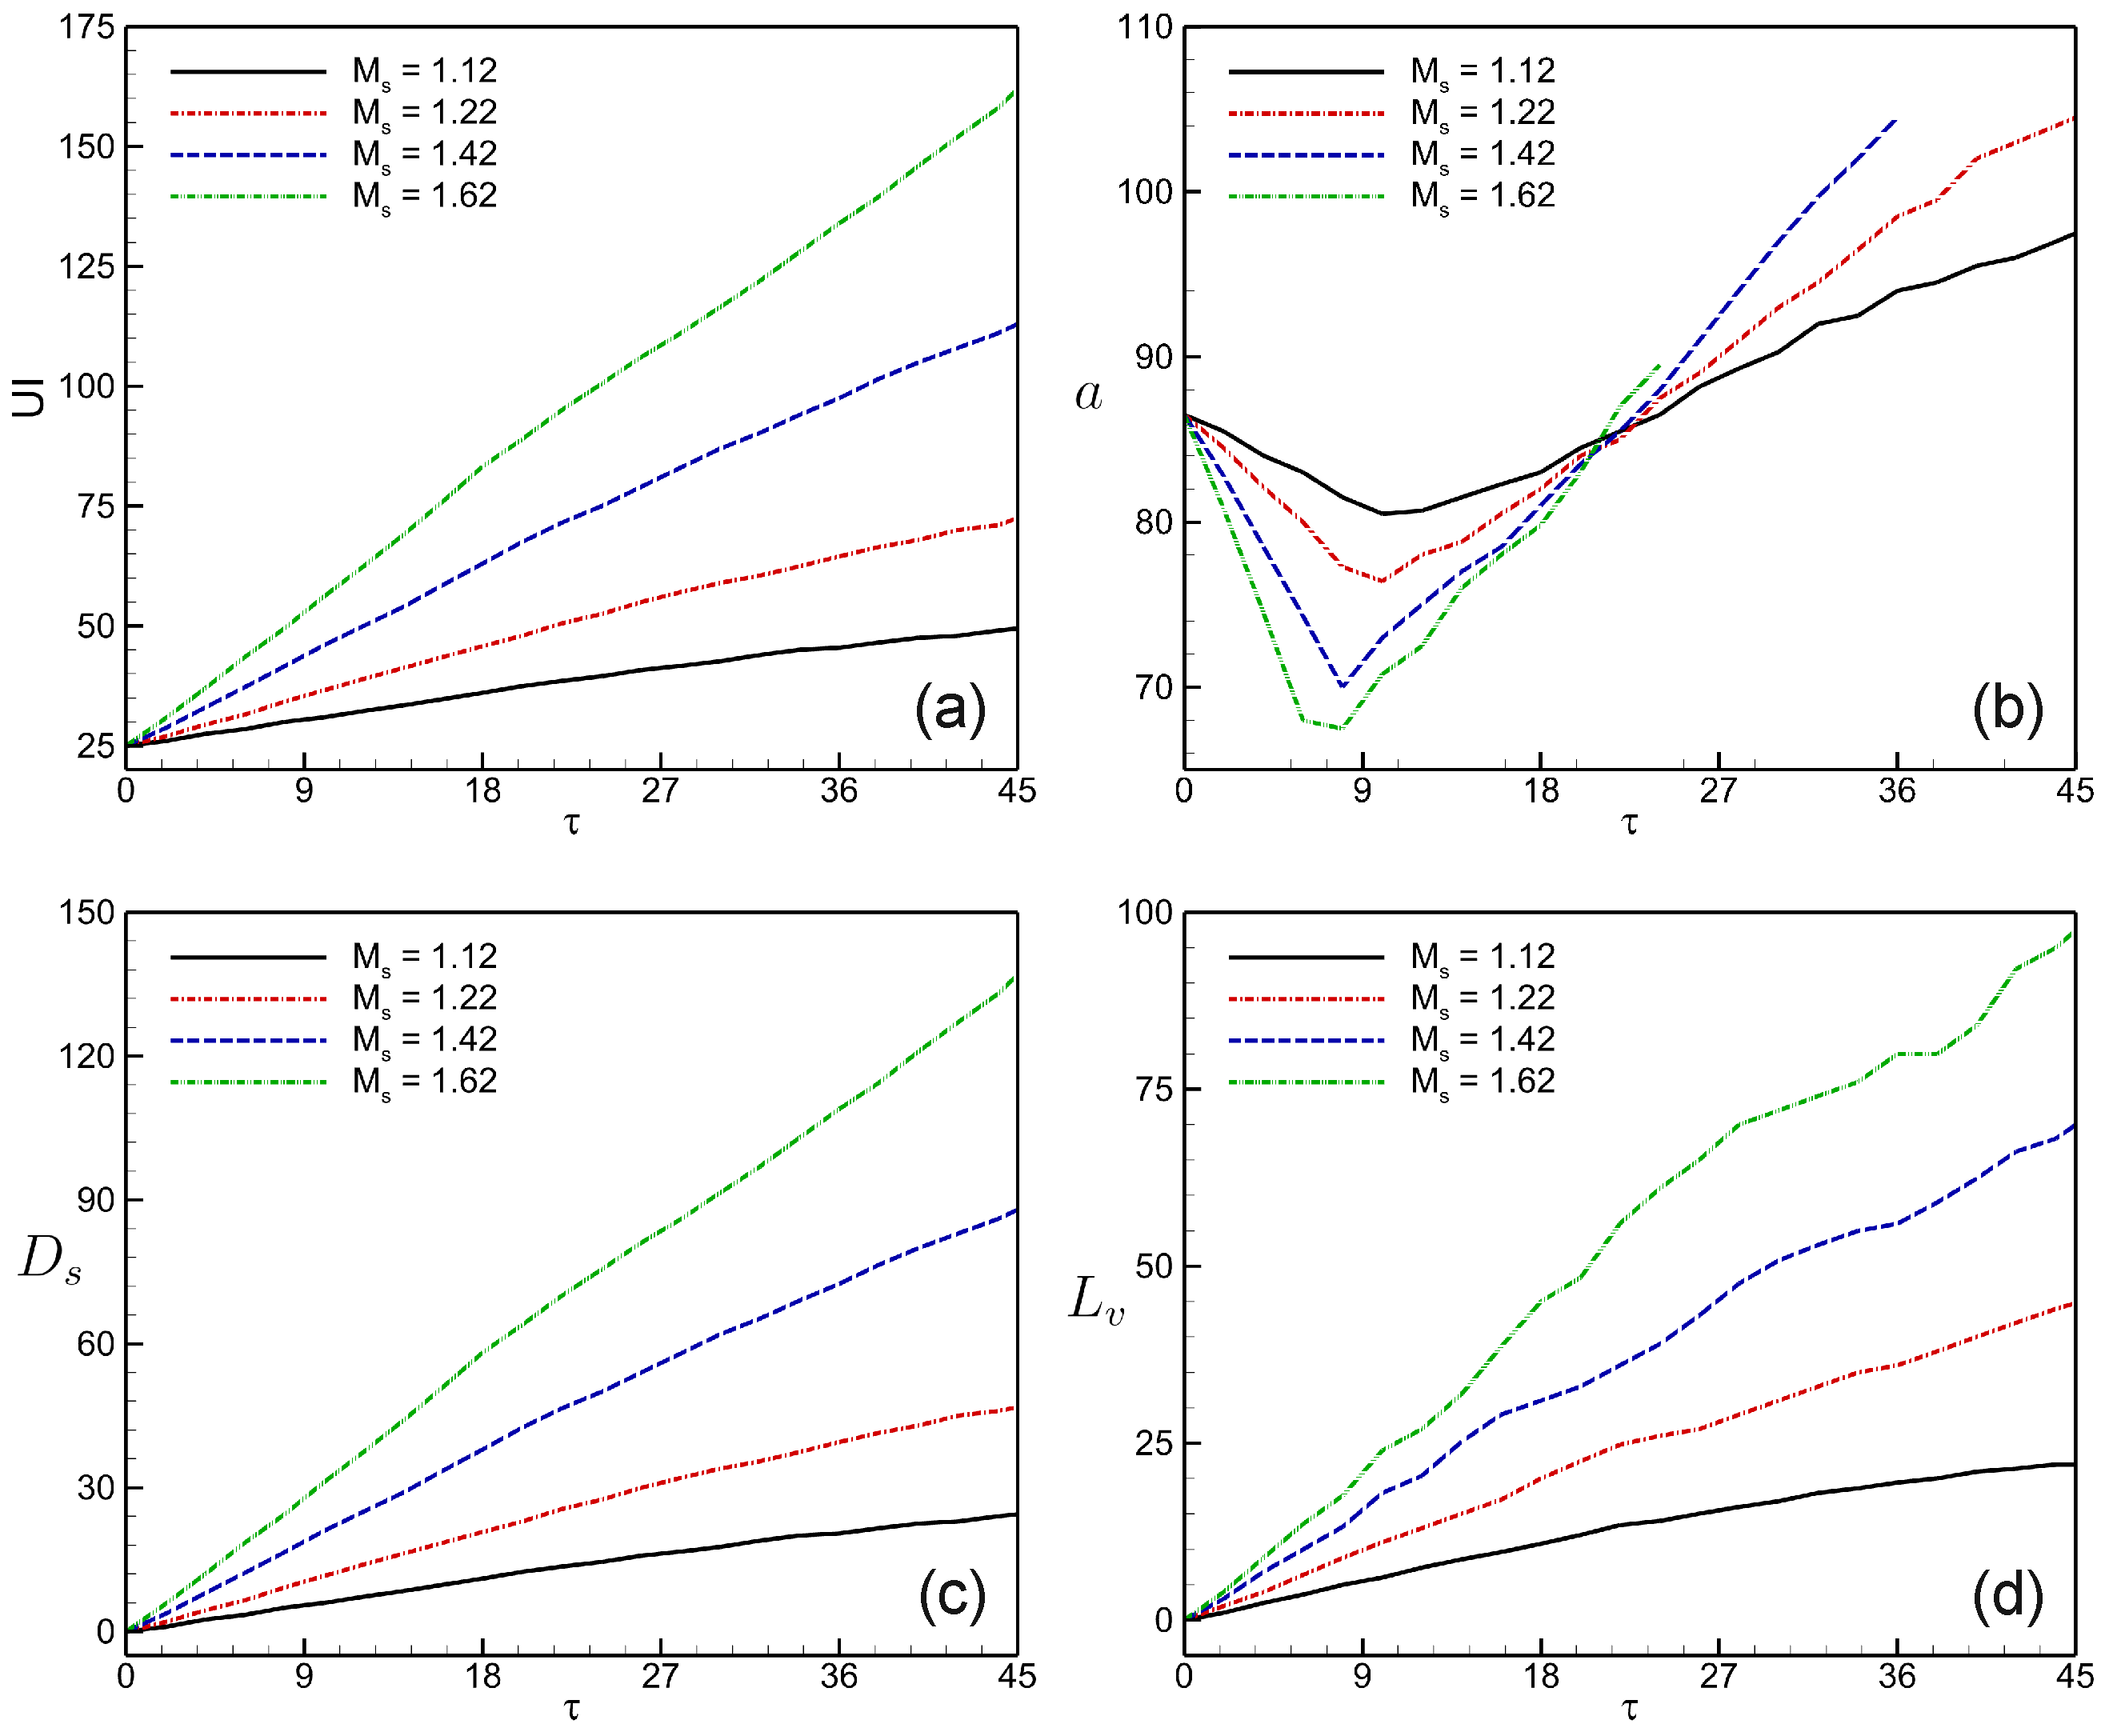
4.4. Interface Features

This section concludes with a quantitative study of the interface feature of the shocked V-shaped N 2 / SF 6 interface. As seen in Figure 16, these interface properties include the evolving interface amplitude (a), vortex spacing ( L v ), displacement of the upstream interface (UI), and displacement of the upstream interface ( D s ).
Figure 17 illustrates the Mach number influence on the temporal variations of the L v , a, D s , and UI interface deformation parameters of the computed shocked V-shaped N 2 / SF 6 interface following IS wave impingement. The early behavior of the upstream interface (UI) in the V-shaped interface is comparable for all four Mach numbers, as shown in Figure 17a. Then, it picks up speed, most likely due to rarefaction waves created when the shock wave makes contact with the downstream contact. The V-shaped interface’s UI value at high Mach numbers is higher than at low Mach numbers due to strong compression effects. Based on observations, the UI displacement is shown to be larger at M s = 1.62 and to decrease at M s = 1.12 . The width of the evolving interface amplitude (a) shortens fast in the early phases of interaction due to compression caused by the passage of the IS wave, as seen in Figure 17b. For shock mach numbers M s = 1.12 , 1.22 , 1.42 , and 1.62, the interface amplitude length approaches a minimal value approximately at τ = 7 , 9 , 12 , and 15, respectively. Due to the continuous rotation of the vortex rings (UVR), the small shock Mach number ( M s = 1.12 ) experiences a modest growth in temporal variations of interface amplitude after the compression phase, while the high Mach numbers ( M s = 1.42 , 1.62 ) experience a rapid growth in temporal variations of interface amplitude length. It is interesting to note that the vortex pair’s continual rotation causes the upstream interface ( D s ) and upstream vortex spacing ( L v ) to shift continuously. Figure 17c,d demonstrate that the highest D s and a values are produced by a higher Mach number ( M s = 1.62 ) , whilst the minimum D s and a values are produced by a lower Mach number ( M s = 1.12 ) .

5. Concluding Remarks

This work presents a numerical investigation of the influence of Mach number on the evolution of Richtmyer–Meshkov instability (RMI) in the shocked V-shaped N 2 / SF 6 interface. Four distinct Mach numbers are taken into consideration in the analysis: M s = 1.12, 1.22, 1.42, and 1.62. The impacts are investigated with respect to kinetic energy, interface characteristics, enstrophy, flow-field visualizations, and vorticity creation. An explicit modal discontinuous Galerkin approach is used to solve a two-dimensional system of unstable compressible two-component Euler equations in order to produce high-resolution numerical simulations of the RMI evolution. The numerical results show good consistency when compared to the available experimental data.
The numerical results show that the interface instability and mixing characteristics in the shocked V-shaped N 2 / SF 6 interface are highly sensitive to the shock strength. Higher Mach numbers amplify the interface’s deformation, leading to increased mixing and more pronounced instability features, while lower Mach numbers result in relatively stable and less disturbed interfaces. As the shock Mach number increases, the V-shaped interface deforms differently, and the distance between the shock front and the triple points varies as well. Furthermore, compared to lower Mach numbers, higher Mach numbers produce larger rolled-up vortex chains. The driving factors behind the generation of vorticity throughout the contact process are revealed by a thorough examination of the effects of shock Mach numbers. The dynamics of the shock-shaped N 2 / SF 6 interface must be understood in terms of vorticity. Higher shock Mach numbers are reported to increase vorticity in the V-shaped interface region, especially when incident and reflected shock waves are interacting with the interface. Moreover, kinetic energy and enstrophy both dramatically rise with increasing shock Mach numbers. Finally, a detailed analysis is conducted regarding the influence of Mach number on the time-variations of the V-shaped interface features. Interestingly, the numerical results underscore the importance of considering the Mach number when analyzing and design systems involving shock wave interactions with gas interfaces. The ability to predict and control the instability and mixing behavior of these interfaces has wide-ranging implications for improving the efficiency, safety, and performance of various practical systems operating under high-speed conditions.
The purpose of this work was to investigate how the shocked V-shaped N 2 / SF 6 interface is affected by Mach number with regard to RMI evolution. Notably, RMI evolution may be strongly influenced by the contact of a planar shock wave with a V-shaped N 2 /He interface. Furthermore, it is anticipated that RMI flows will be significantly impacted by re-shock conditions on the V-shaped N 2 /He interface. Future work is expected to build on this work by examining the RMI evolution in flows that involve the V-shaped N 2 /He interface or more complex interface shapes under re-shock circumstances. This study may be further refined to improve our understanding of Mach number impacts in real-world applications.

Author Contributions

Conceptualization, S.S.; Software, S.S.; Validation, S.S.; Formal analysis, S.S.A. and S.S.; Investigation, S.S.A. and S.S.; Writing—original draft, S.S.A. and S.S.; Visualization, S.S.; Funding acquisition, S.S.A. All authors have read and agreed to the published version of the manuscript.

Funding

This research is funded by the Deanship of Graduate Studies and Scientific Research at Jouf University through the Fast-Track Research Funding Program.

Data Availability Statement

The original contributions presented in the study are included in the article, further inquiries can be directed to the corresponding author.

Conflicts of Interest
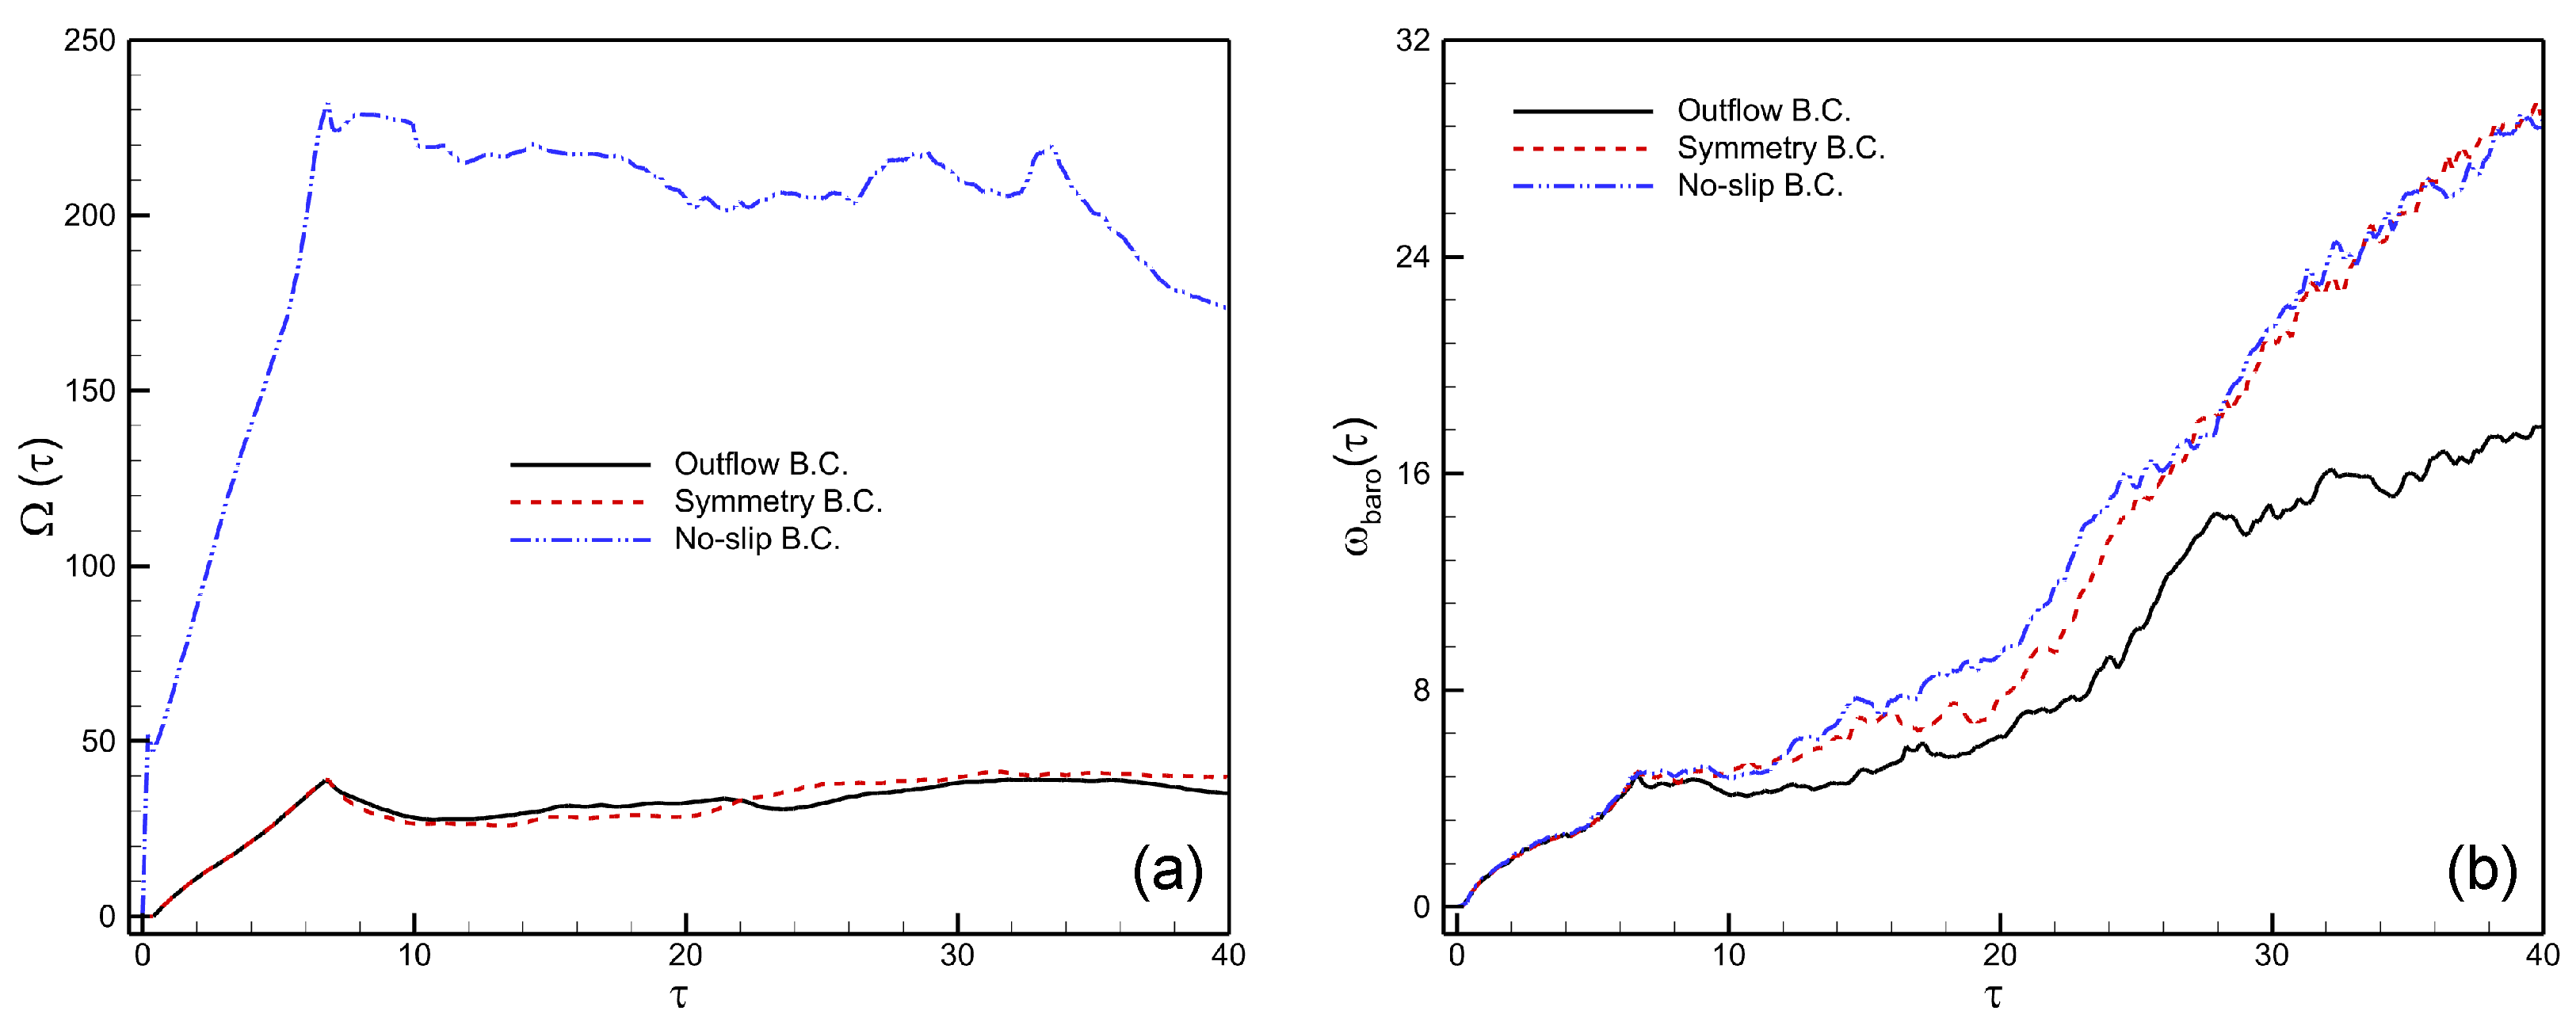
The authors declare no conflicts of interest.

Appendix A

Appendix Effect of Boundary Conditions

In this section, we investigate the effects of three boundary conditions, including outflow, symmetry, and no-slip wall, on the computed flow fields and spatially integrated fields of a shocked V-shaped N 2 / SF 6 interface at the highest Mach number M s = 1.62 . The implementation details of these boundary conditions within the DG framework can be found in Refs. [54,58,59]. Generally, these boundary conditions play a critical role in determining the behavior and evolution of the shocked gas layer in computational simulations. Figure A1 illustrates the effects of these boundary conditions on the time evolution of density contours in a shocked V-shaped N 2 / SF 6 interface. The outflow boundary helps maintain shock instability and allows for unimpeded flow expansion, crucial for accurately modeling the shocked gas layer over time, as shown in Figure A1a. The symmetry boundaries enforce reflection and constrain the flow evolution to symmetrical patterns, influencing the structure and interactions within the shocked gas layer, as shown in Figure A1b. The no-slip wall boundary introduces velocity shear effects and complex interactions between shocks and solid surfaces, affecting the development of boundary layers and the overall dynamics of the shocked gas layer, as shown in Figure A1c. Furthermore, Figure A2 illustrates the effects of these boundary conditions on spatially integrated fields of enstrophy and the baroclinic vorticity production term in the shocked V-shaped N 2 / SF 6 interface. It can be seen that the no-slip boundary enhances the values of these quantities.
Figure A1. Effect of boundary condition on the shocked V-shaped N 2 / SF 6 interface at M s = 1.62 : temporal evolution of density contours at (a) outflow, (b) symmetry, and (c) wall no-slip boundary conditions.
Axioms 13 00700 g0a1
Figure A2. Effect of boundary condition on the shocked V-shaped N 2 / SF 6 interface at M s = 1.62 : spatially integrated fields of (a) enstrophy and (b) baroclinic vorticity production term.
Axioms 13 00700 g0a2

References

  1. Richtmyer, R.D. Taylor instability in shock acceleration of compressible fluids. Commun. Pure Appl. Math. 1960, 13, 297–319. [Google Scholar] [CrossRef]
  2. Meshkov, E.E. Instability of the interface of two gases accelerated by a shock wave. Fluid Dyn. 1969, 4, 101. [Google Scholar] [CrossRef]
  3. Livescu, D. Turbulence with large thermal and compositional density variations. Annu. Rev. Fluid Mech. 2020, 52, 309–341. [Google Scholar] [CrossRef]
  4. Zhou, Y.; Williams, R.J.; Ramaprabhu, P.; Groom, M.; Thornber, B.; Hillier, A.; Mostert, W.; Rollin, B.; Balachandar, S.; Powell, P.D.; et al. Rayleigh–Taylor and Richtmyer-Meshkov instabilities: A journey through scales. Physica D 2021, 423, 132838. [Google Scholar] [CrossRef]
  5. Rayleigh, L. Investigation of the character of the equilibrium of an incompressible heavy fluid of variable density. Proc. Lond. Math. Soc. 1883, 14, 170–177. [Google Scholar] [CrossRef]
  6. Taylor, G. The instability of liquid surfaces when accelerated in a direction perpendicular to their planes. I. Proc. R. Soc. Lond. A 1950, 201, 192–196. [Google Scholar]
  7. Arnett, W.D.; Bahcall, J.N.; Kirshner, R.P.; Woosley, S.E. Supernova 1987A. Ann. Rev. Astron. Astrophys. 1989, 2, 629–700. [Google Scholar] [CrossRef]
  8. Lindl, J.; Landen, O.; Edwards, J.; Moses, E.; NIC Team. Review of the national ignition campaign 2009–2012. Phys. Plasmas 2014, 21, 020501. [Google Scholar] [CrossRef]
  9. Yang, J.; Kubota, T.; Zukoski, E.E. Applications of shock-induced mixing to supersonic combustion. AIAA J. 1993, 31, 854–862. [Google Scholar] [CrossRef]
  10. Zeng, W.G.; Pan, J.H.; Sun, Y.T.; Ren, Y.X. Turbulent mixing and energy transfer of reshocked heavy gas curtain. Phys. Fluids 2021, 30, 064106. [Google Scholar] [CrossRef]
  11. Brouillette, M. The Richtmyer-Meshkov instability. Annu. Rev. Fluid Mech. 2002, 34, 445. [Google Scholar] [CrossRef]
  12. Zhou, Y. Rayleigh–Taylor and Richtmyer–Meshkov instability induced flow, turbulence, and mixing. I. Phys. Rep. 2017, 720, 1–136. [Google Scholar]
  13. Zhou, Y. Rayleigh–Taylor and Richtmyer–Meshkov instability induced flow, turbulence, and mixing. II. Phys. Rep. 2017, 723, 1–160. [Google Scholar]
  14. Haas, J.F.; Sturtevant, B. Interaction of weak shock waves with cylindrical and spherical gas inhomogeneities. J. Fluid Mech. 1987, 181, 41–76. [Google Scholar] [CrossRef]
  15. Ranjan, D.; Niederhaus, J.H.J.; Oakley, J.G.; Anderson, M.H.; Bonazza, R.; Greenough, J.A. Shock-bubble interactions: Features of divergent shock-refraction geometry observed in experiments and simulations. Phys. Fluids 2008, 20, 036101. [Google Scholar] [CrossRef]
  16. Quirk, J.J.; Karni, S. On the dynamics of a shock-bubble interaction. J. Fluid Mech. 1996, 318, 129–163. [Google Scholar] [CrossRef]
  17. Bagabir, A.; Drikakis, D. Mach number effects on shock-bubble interaction. Shock Waves 2001, 11, 209. [Google Scholar] [CrossRef]
  18. Shankar, S.K.; Kawai, S.; Lele, S.K. Two-dimensional viscous flow simulation of a shock accelerated heavy gas cylinder. Phys. Fluids 2011, 23, 024102. [Google Scholar] [CrossRef]
  19. Singh, S.; Battiato, M.; Myong, R.S. Impact of the bulk viscosity on flow morphology of shock-bubble interaction in diatomic and polyatomic gases. Phys. Fluids 2021, 33, 066103. [Google Scholar] [CrossRef]
  20. Singh, S.; Msmali, A.H.; Nelson, M.I. Unfolding of shocked hydrodynamic instability at SF6 elliptical interface: Physical insights from numerical simulations. Comput. Fluids 2024, 277, 106304. [Google Scholar] [CrossRef]
  21. Zhai, Z.; Wang, M.; Si, T.; Luo, X. On the interaction of a planar shock with a light polygonal interface. J. Fluid Mech. 2014, 757, 800. [Google Scholar] [CrossRef]
  22. Luo, X.; Wang, M.; Si, T.; Zhai, Z. On the interaction of a planar shock with an SF6 polygon. J. Fluid Mech. 2015, 773, 366. [Google Scholar] [CrossRef]
  23. Igra, D.; Igra, O. Shock wave interaction with a polygonal bubble containing two different gases, a numerical investigation. J. Fluid Mech. 2020, 889, A26. [Google Scholar] [CrossRef]
  24. Singh, S. Contribution of Mach number to the evolution of the Richtmyer-Meshkov instability induced by a shock-accelerated square light bubble. Phys. Rev. Fluids 2021, 6, 104001. [Google Scholar] [CrossRef]
  25. Singh, S.; Battiato, M. Numerical simulations of Richtmyer-Meshkov instability of SF6 square bubble in diatomic and polyatomic gases. Comput. Fluids 2022, 242, 105502. [Google Scholar] [CrossRef]
  26. Singh, S.; Torrilhon, M. On the shock-driven hydrodynamic instability in square and rectangular light gas bubbles: A comparative study from numerical simulations. Phys. Fluids 2023, 35, 012117. [Google Scholar] [CrossRef]
  27. Singh, S. Investigation of aspect ratio effects on flow characteristics and vorticity generation in shock-induced rectangular bubble. Eur. J. Mech. B/Fluids 2023, 101, 131. [Google Scholar] [CrossRef]
  28. Fraley, G. Rayleigh–Taylor stability for a normal shock wave–density discontinuity interaction. Phys. Fluids 1986, 29, 376–386. [Google Scholar] [CrossRef]
  29. Mikaelian, K.O. Growth rate of the Richtmyer-Meshkov instability at shocked interfaces. Phys. Rev. Lett. 1993, 71, 2903–2906. [Google Scholar] [CrossRef]
  30. Mikaelian, K.O. Richtmyer–Meshkov instability of arbitrary shapes. Phys. Fluids 2005, 17, 034101. [Google Scholar] [CrossRef]
  31. Luo, T.; Wang, J. Effects of Atwood number and stratification parameter on compressible multi-mode Rayleigh–Taylor instability. Phys. Fluids 2021, 33, 115111. [Google Scholar] [CrossRef]
  32. Thornber, B.; Drikakis, D.; Youngs, D.; Williams, R. Growth of a Richtmyer-Meshkov turbulent layer after reshock. Phys. Fluids 2011, 23, 095107. [Google Scholar] [CrossRef]
  33. Tritschler, V.K.; Olson, B.J.; Lele, S.K.; Hickel, S.; Hu, X.Y.; Adams, N.A. On the Richtmyer–Meshkov instability evolving from a deterministic multimode planar interface. J. Fluid Mech. 2014, 755, 429–462. [Google Scholar] [CrossRef]
  34. Thornber, B.; Drikakis, D.; Youngs, D.L.; Williams, R.J.R. The influence of initial conditions on turbulent mixing due to Richtmyer–Meshkov instability. J. Fluid Mech. 2010, 654, 99–139. [Google Scholar] [CrossRef]
  35. Lombardini, M.; Pullin, D.I.; Meiron, D.I. Transition to turbulence in shock-driven mixing: A Mach number study. J. Fluid Mech. 2012, 690, 203–226. [Google Scholar] [CrossRef]
  36. Mohaghar, M.; Carter, J.; Pathikonda, G.; Ranjan, D. The transition to turbulence in shock-driven mixing: Effects of Mach number and initial conditions. J. Fluid Mech. 2016, 871, 595–635. [Google Scholar] [CrossRef]
  37. Probyn, M.G.; Williams, R.J.R.; Thornber, B.; Drikakis, D.; Youngs, D.L. 2D single-mode Richtmyer–Meshkov instability. Phys. D Nonlinear Phenom. 2021, 418, 132827. [Google Scholar] [CrossRef]
  38. Jahn, R.G. The refraction of shock waves at a gaseous interface. J. Fluid Mech. 1956, 1, 457–489. [Google Scholar] [CrossRef]
  39. Abd-El-Fattah, A.M.; Henderson, L.F. Shock waves at a fast-slow gas interface. J. Fluid Mech. 1978, 86, 15–32. [Google Scholar] [CrossRef]
  40. Abd-El-Fattah, A.M.; Henderson, L.F. The refraction of a plane shock wave at a gas interface. J. Fluid Mech. 1978, 86, 15. [Google Scholar] [CrossRef]
  41. Abd-El-Fattah, A.M.; Henderson, L.F. Shock waves at a slow-fast gas interface. J. Fluid Mech. 1978, 89, 79. [Google Scholar] [CrossRef]
  42. Abd-El-Fattah, A.M.; Henderson, L.F.; Lozzi, A. Precursor shock waves at a slow—Fast gas interface. J. Fluid Mech. 1976, 76, 157. [Google Scholar] [CrossRef]
  43. Henderson, L.F.; Colella, P.; Puckett, E.G. On the refraction of shock waves at a slow—Fast gas interface. J. Fluid Mech. 1991, 224, 1. [Google Scholar] [CrossRef]
  44. McFarland, J.A.; Greenough, J.A.; Ranjan, D. Computational parametric study of a Richtmyer-Meshkov instability for an inclined interface. Phys. Rev. E 2011, 84, 026303. [Google Scholar] [CrossRef]
  45. McFarland, J.A.; Greenough, J.A.; Ranjan, D. Investigation of the initial perturbation amplitude for the inclined interface Richtmyer–Meshkov instability. Phys. Scr. 2013, 155, 014014. [Google Scholar] [CrossRef]
  46. McFarland, J.A.; Greenough, J.A.; Ranjan, D. Simulations and analysis of the reshocked inclined interface Richtmyer–Meshkov instability for linear and nonlinear interface perturbations. J. Fluids Eng. 2014, 136, 071203. [Google Scholar] [CrossRef]
  47. McFarland, J.A.; Reilly, D.; Black, W.; Greenough, J.A.; Ranjan, D. Modal interactions between a large-wavelength inclined interface and small-wavelength multimode perturbations in a Richtmyer-Meshkov instability. Phys. Rev. E 2014, 92, 013023. [Google Scholar] [CrossRef]
  48. McFarland, J.A.; Reilly, D.; Creel, S.; McDonald, C.; Finn, T.; Ranjan, D. Experimental investigation of the inclined interface Richtmyer–Meshkov instability before and after reshock. Exp. Fluids 2014, 55, 1640–1653. [Google Scholar] [CrossRef]
  49. Reilly, D.; McFarland, J.A.; Mohaghar, M.; Ranjan, D. The effects of initial conditions and circulation deposition on the inclined-interface reshocked Richtmyer–Meshkov instability. Exp. Fluids 2015, 56, 168–183. [Google Scholar] [CrossRef]
  50. Luo, X.; Dong, P.; Si, T.; Zhai, Z. The Richtmyer–Meshkov instability of a ‘V’ shaped air/SF6 interface. J. Fluid Mech. 2016, 802, 186–202. [Google Scholar] [CrossRef]
  51. Zhai, Z.; Dong, P.; Si, T.; Luo, Z. The Richtmyer-Meshkov instability of a “V” shaped air/helium interface subjected to a weak shock. Phys. Fluids 2016, 28, 082104. [Google Scholar] [CrossRef]
  52. Wu-Wang, H.; Liu, C.; Xiao, Z. Parametric effects on Richtmyer–Meshkov instability of a V-shaped gaseous interface within linear stage. Phys. Fluids 2024, 36, 024114. [Google Scholar] [CrossRef]
  53. Alsaeed, S.S.; Singh, S. Numerical study of shock wave interaction with V-Shaped heavy/light interface. Mathematics 2024, 12, 3131. [Google Scholar] [CrossRef]
  54. Singh, S. Development of a 3D Discontinuous Galerkin Method for the Second-Order Boltzmann-Curtiss Based Hydrodynamic Models of Diatomic and Polyatomic Gases. Ph.D. Thesis, Gyeongsang National University, Jinju-si, Republic of Korea, 2018. [Google Scholar]
  55. Singh, S.; Karchani, A.; Chourushi, T.; Myong, R.S. A three-dimensional modal discontinuous Galerkin method for the second-order Boltzmann-Curtiss-based constitutive model of rarefied and microscale gas flows. J. Comput. Phys. 2022, 457, 111052. [Google Scholar] [CrossRef]
  56. Smirnov, N.N.; Betelin, V.B.; Shagaliev, R.M.; Nikitin, V.F.; Belyakov, I.M.; Deryuguin, Y.N.; Aksenov, S.V.; Korchazhkin, D.A. Hydrogen fuel rocket engines simulation using LOGOS code. Int. J. Hydrogen Energy 2014, 39, 10748. [Google Scholar] [CrossRef]
  57. Smirnov, N.N.; Betelin, V.B.; Nikitin, V.F.; Stamov, L.I.; Altoukhov, D.I. Accumulation of errors in numerical simulations of chemically reacting gas dynamics. Acta Astronaut. 2015, 117, 338. [Google Scholar] [CrossRef]
  58. Karchani, A. Discontinuous Galerkin Methods for the Second-Order Boltzmann-Based Hydrodynamic Models. Ph.D. Thesis, Gyeongsang National University, Jinju-si, Republic of Korea, 2017. [Google Scholar]
  59. Chan, J.; Lin, Y.; Warburton, T. Entropy stable modal discontinuous Galerkin schemes and wall boundary conditions for the compressible Navier-Stokes equations. J. Comput. Phys. 2022, 448, 110723. [Google Scholar] [CrossRef]
Figure 1. Schematic diagram of the problem configuration for the shocked V-shaped interface. The solid arrow illustrates the direction of shock wave propagation. θ , λ , a 0 denote the vortex angle, initial interface wavelength, and initial interface amplitude of the V-shaped interface.
Axioms 13 00700 g001
Figure 2. Comparison of numerical Schlieren images between the experiment “Reproduced with permission from [50], Cambridge University Press, 2016” and the present results for a shocked V-shaped air/ SF 6 interface at M s = 1.2 and vertex angle θ = 60 .
Axioms 13 00700 g002
Figure 3. Comparison of time variation of the upstream interface displacement between the experiment “Reproduced with permission from [50], Cambridge University Press, 2016” and the present numerical results for a shocked V-shaped air/ SF 6 interface at M s = 1.2 and vertex angle θ = 60 .
Axioms 13 00700 g003
Figure 4. Numerical Schlieren images of shocked V-shaped N 2 / SF 6 interface at τ = 15 with four grid resolutions: (a) 600 × 200 , (b) 900 × 300 , (c) 1200 × 400 , and (d) 1500 × 500 grid points.
Axioms 13 00700 g004
Figure 5. Profiles of (a) density along the center-line ( y = 50 mm ) at τ = 15 and, (b) time evolution of enstrophy for the computed shocked V-shaped N 2 / SF 6 interface with four grid resolutions.
Axioms 13 00700 g005
Figure 6. Mach number effect on the shocked V-shaped N 2 / SF 6 interface: time evolution of density contours at M s = 1.12 . IS, incident shock; RS, reflected shock; DTS, direct transmitted shock; S1, new shock; UVR, upper vortex ring; KHI, Kelvin–Helmholtz instability; Lv, vertex spacing; MS, Mach stem; and TP, triple point.
Axioms 13 00700 g006
Figure 7. Mach number effect on the shocked V-shaped N 2 / SF 6 interface: time evolution of density contours at M s = 1.22 . The symbols are the same as those indicated in Figure 6.
Axioms 13 00700 g007
Figure 8. Mach number effect on the shocked V-shaped N 2 / SF 6 interface: time evolution of density contours at M s = 1.42 . The symbols are the same as those indicated in Figure 6.
Axioms 13 00700 g008
Figure 9. Mach number effect on the shocked V-shaped N 2 / SF 6 interface: time evolution of density contours at M s = 1.62 . The symbols are the same as those indicated in Figure 6.
Axioms 13 00700 g009
Figure 10. Mach number effects on the shocked V-shaped N 2 / SF 6 interface at critical moments: interface deformation history at (a) M s = 1.12 , (b) M s = 1.22 , (c) M s = 1.42 , and (d) M s = 1.62 .
Axioms 13 00700 g010
Figure 11. Schematic diagram of vorticity generation in the shocked V-shaped light/heavy interface.
Axioms 13 00700 g011
Figure 12. Mach number effects on the shocked V-shaped N 2 / SF 6 interface: time evolution of vorticity contours at (a) M s = 1.12 , (b) M s = 1.22 , (c) M s = 1.42 , and (d) M s = 1.62 .
Axioms 13 00700 g012
Figure 13. Mach number effect on the shocked V-shaped N 2 / SF 6 interface: spatially integrated fields of (a) average vorticity, (b) dilatational vorticity, and (c) baroclinic vorticity production terms.
Axioms 13 00700 g013
Figure 14. Mach effect on the shocked V-shaped N 2 / SF 6 interface: contours of (a) enstrophy and (b) kinetic energy at τ = 10 .
Axioms 13 00700 g014
Figure 15. Mach effect on the shocked V-shaped N 2 / SF 6 interface: spatially integrated fields of (a) enstrophy and (b) kinetic energy.
Axioms 13 00700 g015
Figure 16. Diagrammatic representation of the deformation parameters in the shocked V-shaped N 2 / SF 6 interface: UI, upstream interface; a, evolving interface amplitude; D s , displacement of the upstream interface; O, position of initial interface and L v , vortex spacing.
Axioms 13 00700 g016
Figure 17. Mach effect on the shocked V-shaped N 2 / SF 6 interface: temporal variations of the (a) upstream interface (UI), (b) evolving interface amplitude (a), (c) displacement of the upstream interface ( D s ), and (d) vortex spacing ( L v ).
Axioms 13 00700 g017
Table 1. Physical characteristics of used gases at P 0 = 101,325 Pa and T 0 = 293 K.
GasDensity
( ρ , kg · m 3 )
Heat Ratio
( γ )
Sound Speed
( c , m · s 1 )
N 2 1.251.40352
SF 6 6.031.09135
Table 2. Error estimation.
Allowable Error (%)Grid ResolutionTime SimulatedNumber of Time StepsAccumulated ErrorAllowable Number of Time StepsReliability ( R s = n max / n )
5 300 × 100 481 9.30 × 10 4 286833
5 600 × 200 4177 3.41 × 10 5 2.11 × 10 6 1.17 × 10 4
5 900 × 300 4270 1.89 × 10 5 6.79 × 10 6 2.49 × 10 4
5 1200 × 400 4369 1.19 × 10 5 1.72 × 10 7 4.61 × 10 4
5 1500 × 500 4463 9.01 × 10 6 3.01 × 10 7 6.55 × 10 4
Disclaimer/Publisher’s Note: The statements, opinions and data contained in all publications are solely those of the individual author(s) and contributor(s) and not of MDPI and/or the editor(s). MDPI and/or the editor(s) disclaim responsibility for any injury to people or property resulting from any ideas, methods, instructions or products referred to in the content.

