


A New Hybrid Approach for Clustering, Classification, and Prediction of World Development Indicators Combining General Type-2 Fuzzy Systems and Neural Networks


Abstract
1. Introduction
2. Basic Concepts
2.1. Neural Networks
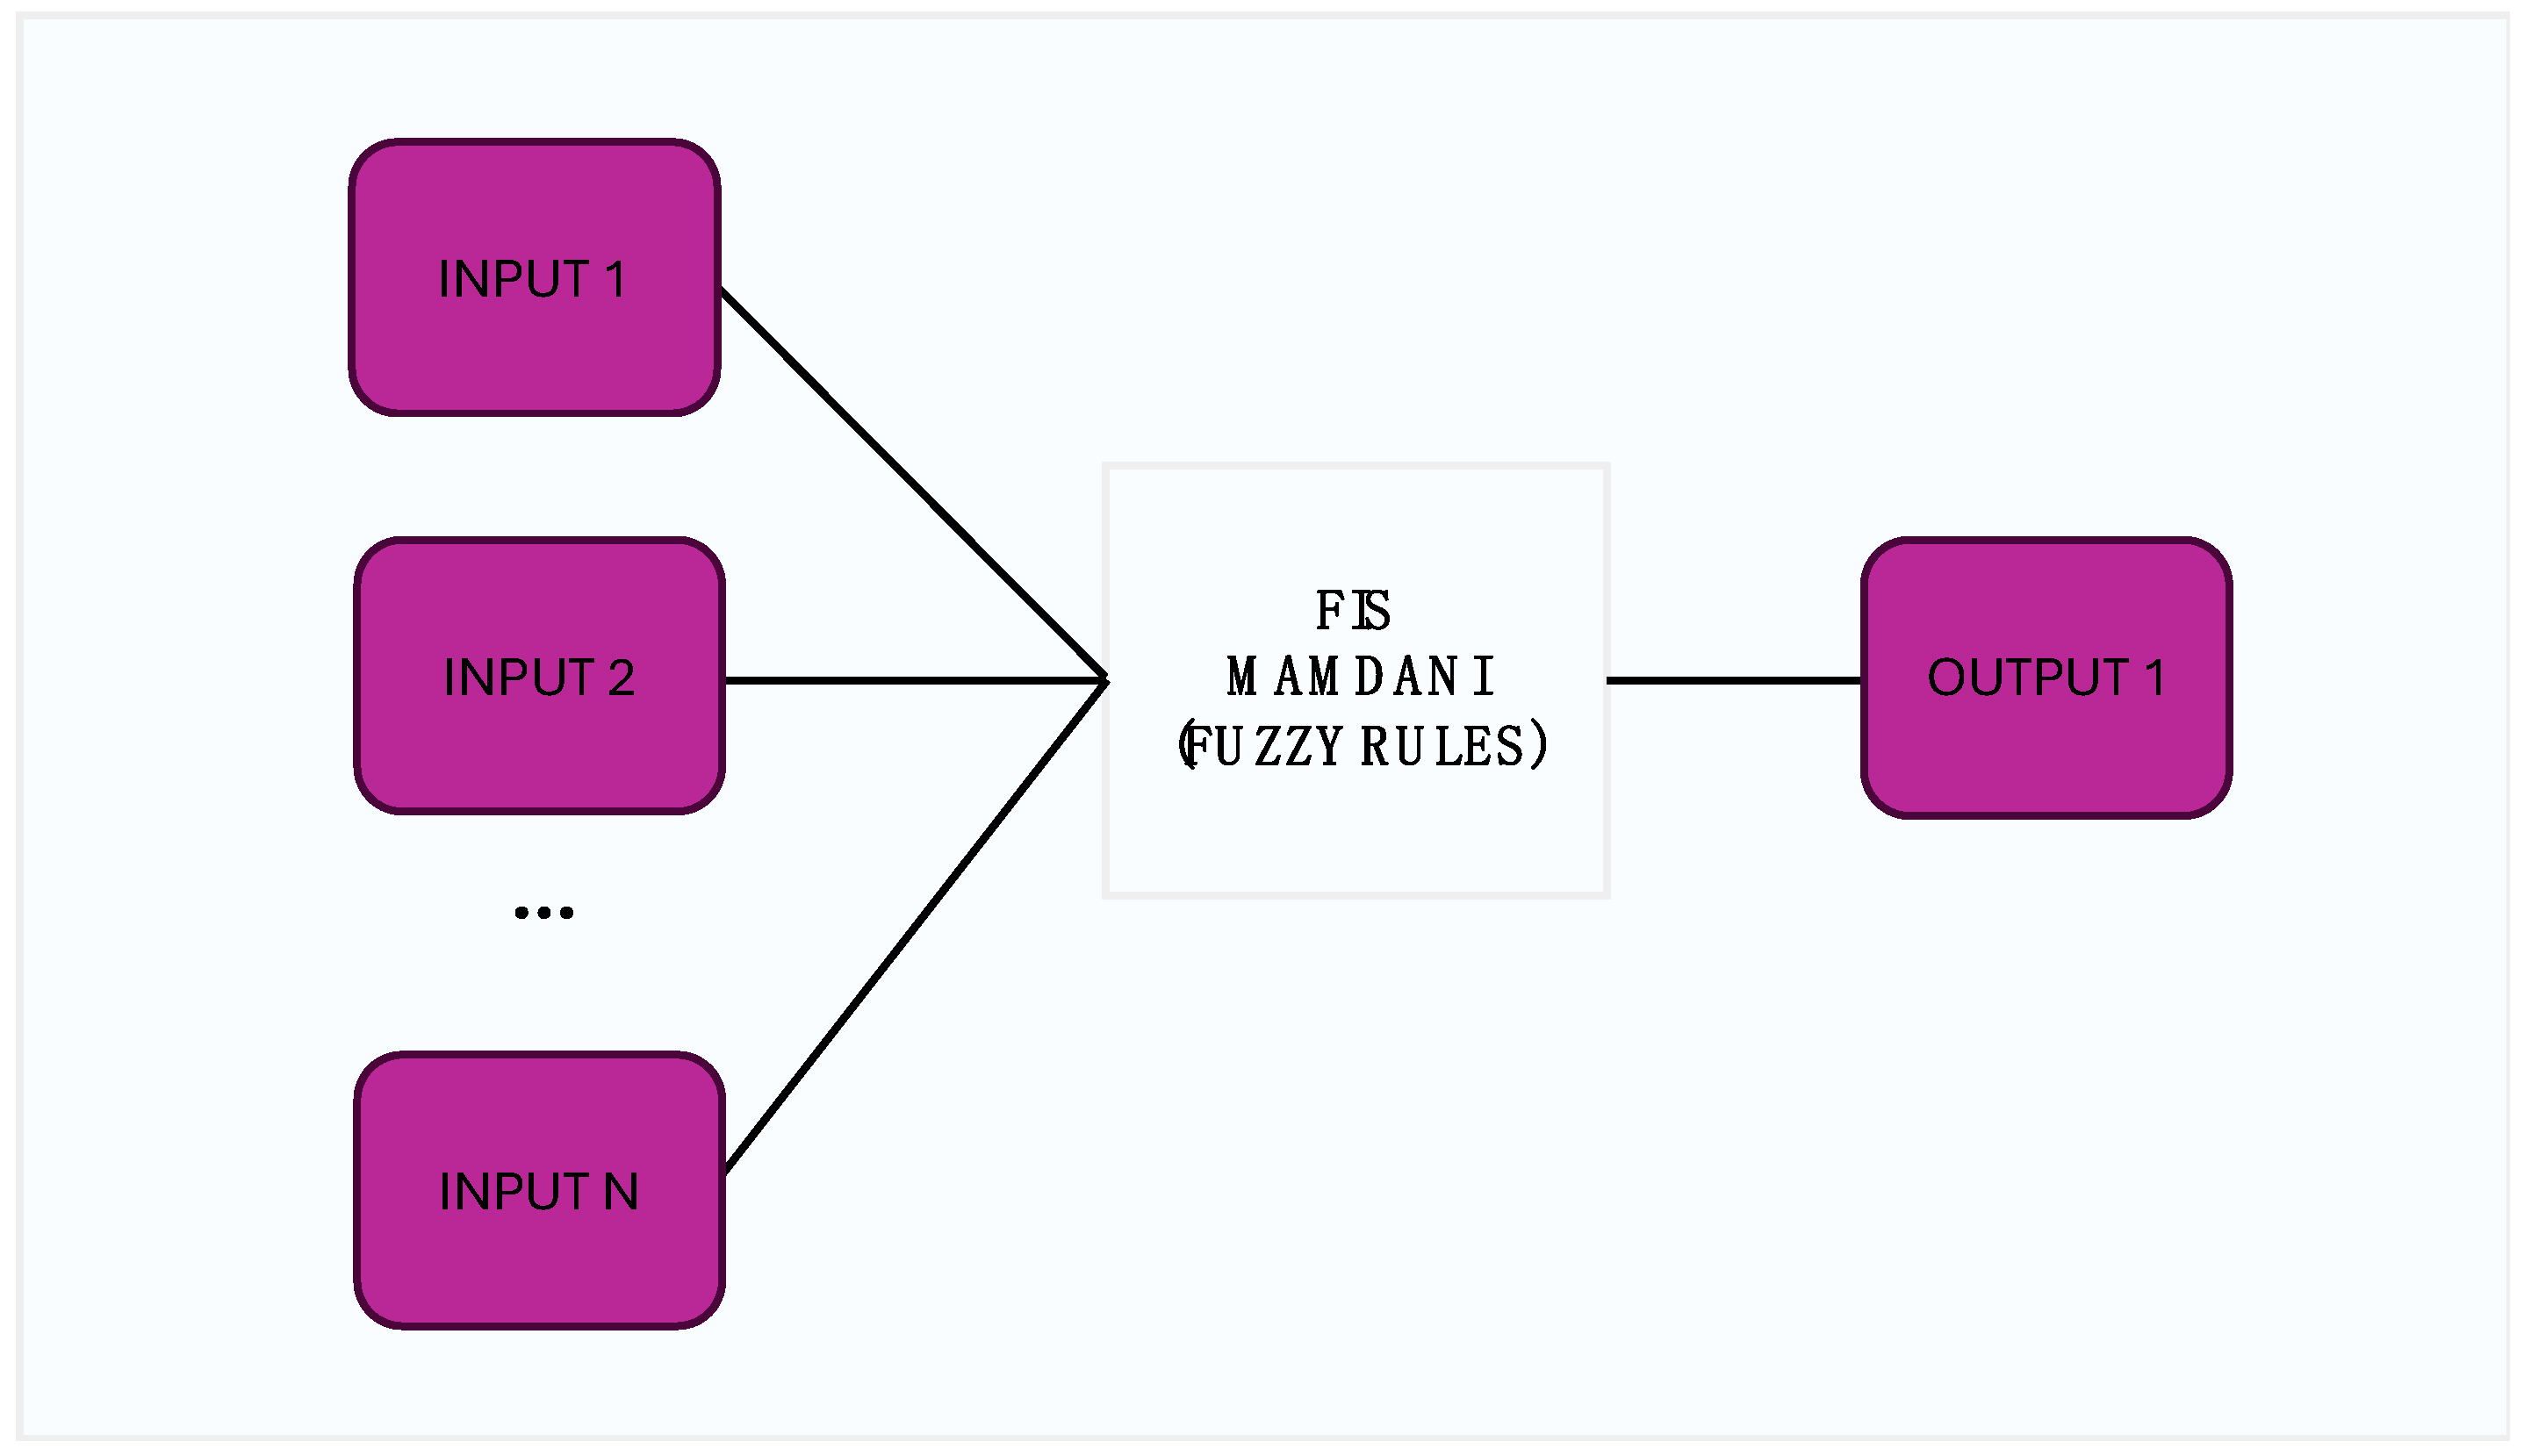
2.2. Type-2 Fuzzy Systems
3. Problem Description
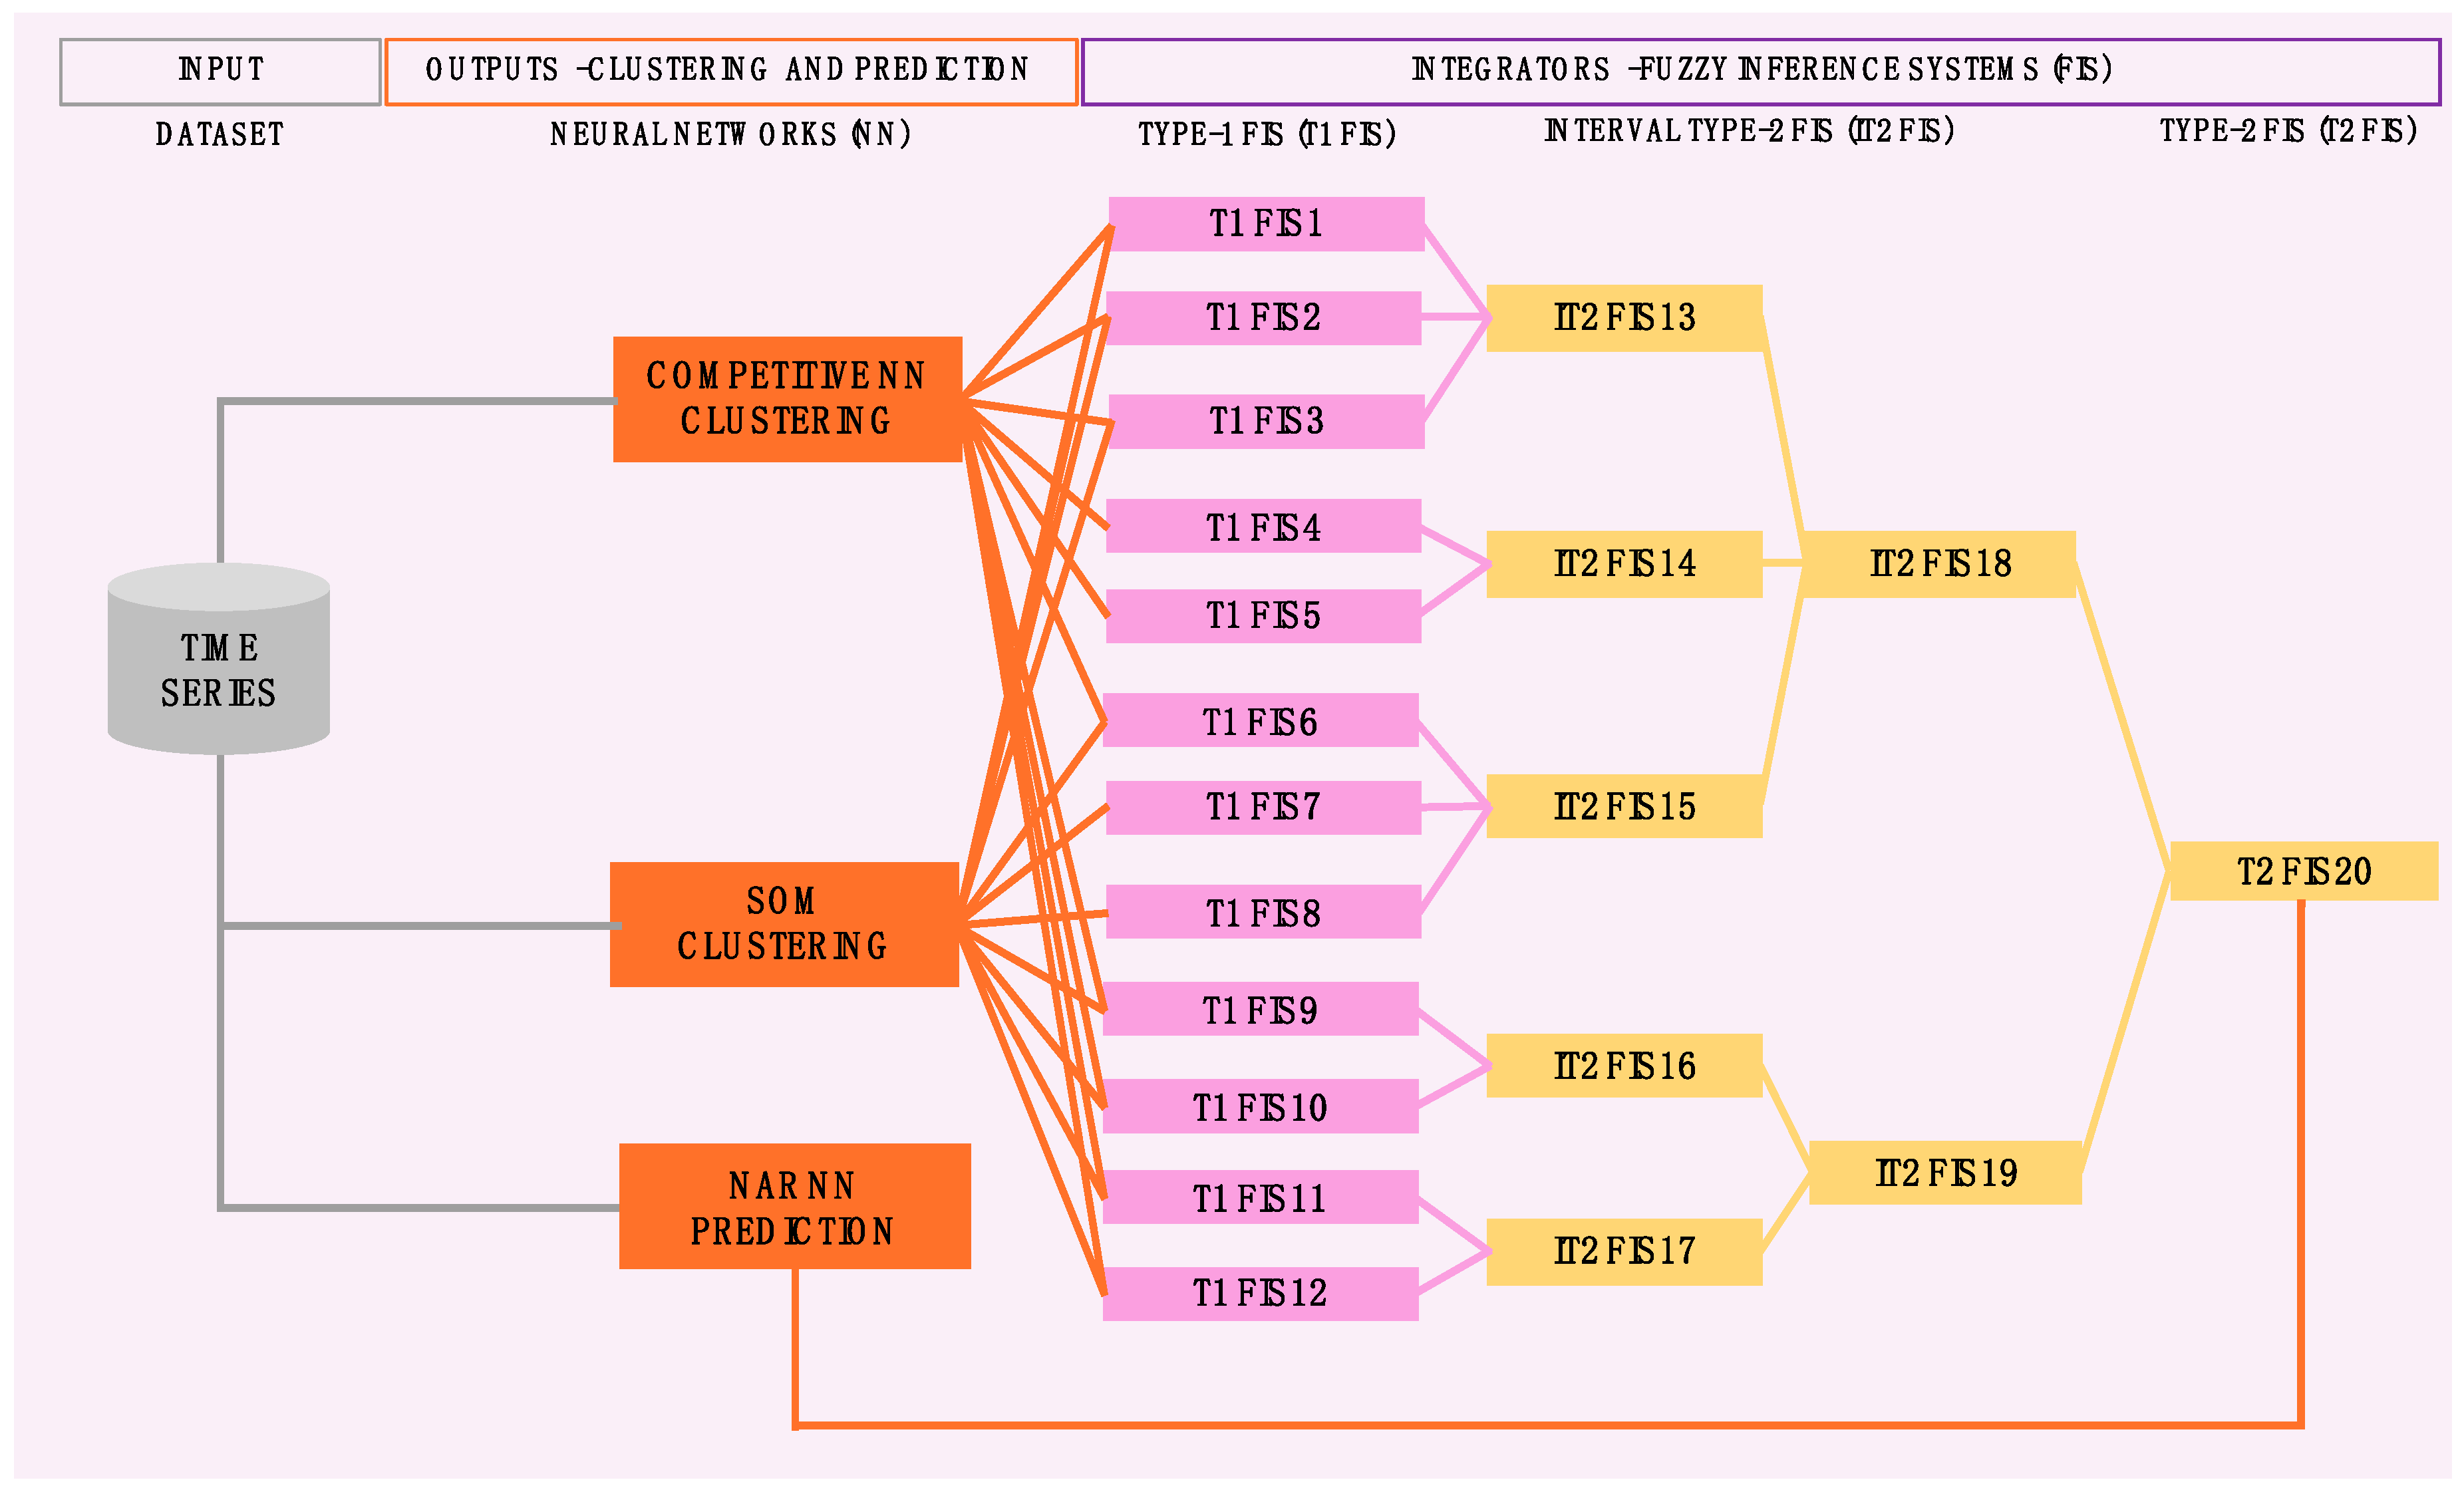
4. Method
5. Experimental Results
6. Discussion of Results
7. Conclusions
Author Contributions
Funding
Institutional Review Board Statement
Data Availability Statement
Acknowledgments
Conflicts of Interest
References
- Azzabi, L.; Azzabi, D.; Kobi, A. The Multi-Criteria Approach Decision. In The Multi-Criteria Approach for Decision Support; International Series in Operations Research & Management Science; Springer: Cham, Switzerland, 2020; Volume 300, pp. 1–23. [Google Scholar] [CrossRef]
- Zhao, S.; Dong, Y.; Martíne, L.; Pedrycz, W. Analysis of Ranking Consistency in Linguistic Multiple Attribute Decision Making: The Roles of Granularity and Decision Rules. IEEE Trans. Fuzzy Syst. 2022, 30, 2266–2278. [Google Scholar] [CrossRef]
- Morente-Molinera, J.; Wang, Y.; Gong, Z.A. Morfeq; R. Al-Hmouz; E. Herrera-Viedma. Reducing Criteria in Multicriteria Group Decision-Making Methods Using Hierarchical Clustering Methods and Fuzzy Ontologies. IEEE Trans. Fuzzy Syst. 2022, 30, 1585–1598. [Google Scholar] [CrossRef]
- Yao, J.; Lu, B.; Zhang, J. Multi-Step-Ahead Tool State Monitoring Using Clustering Feature-Based Recurrent Fuzzy Neural Networks. IEEE Access 2021, 9, 113443–113453. [Google Scholar] [CrossRef]
- Ziro, A.; Toibayeva, S.; Gnatyuk, S.; Imanbayev, A.; Iavich, M.; Zhaybergenova, Z. Research of the Information Security Audit System in Organizations. In Proceedings of the 2023 IEEE International Conference on Smart Information Systems and Technologies (SIST), Astana, Kazakhstan, 4–6 May 2023; pp. 440–444. [Google Scholar] [CrossRef]
- Alenazy, S.M.; Alenazy, R.M.; Ishaque, M. Governance of Information Security and Its Role in Reducing the Risk of Electronic Accounting Information System. In Proceedings of the 2023 1st International Conference on Advanced Innovations in Smart Cities (ICAISC), Jeddah, Saudi Arabia, 23–25 January 2023; pp. 1–5. [Google Scholar] [CrossRef]
- Singh, K.; Richa, P.D.; Chaturvedi, V.M.; Kumar, P.; Malik, S. Application of Internet of Things and Machine Learning in Improving Supply Chain Financial Risk Management System. In Proceedings of the 2023 2nd International Conference on Automation, Computing and Renewable Systems (ICACRS), Pudukkottai, India, 11–13 December 2023; pp. 1115–1121. [Google Scholar] [CrossRef]
- Guo, B.; Zhao, W.; Chen, P.; Zhang, C.; Sun, Z.; Feng, W. Research on the Application Risk of Computer Network Security Technology. In Proceedings of the 2023 International Conference on Networking, Informatics and Computing (ICNETIC), Palermo, Italy, 29–31 May 2023; pp. 36–39. [Google Scholar] [CrossRef]
- Li, W.; Di, L.; Zheng, T.; Zhang, J.; Yi, B. Research on design and optimization of shared data privacy protection scheme based on multi-party security computing. In Proceedings of the 2023 IEEE 6th International Conference on Information Systems and Computer Aided Education (ICISCAE), Dalian, China, 23–25 September 2023; pp. 306–309. [Google Scholar] [CrossRef]
- Dombi, J.; Csiszár, O. Introduction—Aggregation and Intelligent Decision. In Explainable Neural Networks Based on Fuzzy Logic and Multi-Criteria Decision Tools. Studies in Fuzziness and Soft Computing; Springer: Cham, Switzerland, 2021; Volume 408, pp. ix–xi. [Google Scholar] [CrossRef]
- Rahman, M.M.; Shakeri, M.; Khatun, F.; Tiong, S.K.; Alkahtani, A.A.; Samsudin, N.A.; Amin, N.; Pasupuleti, J.; Hasan, M.K. A comprehensive study and performance analysis of deep neural network-based approaches in wind time-series forecasting. J. Reliab. Intell. Environ. 2022, 9, 183–200. [Google Scholar] [CrossRef]
- Wang, H.; Huang, X.; Gao, S.; Yang, Z.; Gao, T.; Zhao, Q.; Ding, H. Electric vehicle charging load clustering and load forecasting based on long short term memory neural network. In Proceedings of the 2022 IEEE 5th International Electrical and Energy Conference (CIEEC), Nangjing, China, 27–29 May 2022; pp. 3196–3200. [Google Scholar] [CrossRef]
- Siłka, J.; Wieczorek, M.; Woźniak, M. Recurrent neural network model for high-speed train vibration prediction from time series. Neural Comput. Appl. 2022, 34, 13305–13318. [Google Scholar] [CrossRef]
- Egrioglu, E.; Bas, E. A new hybrid recurrent artificial neural network for time series forecasting. Neural Comput. Appl. 2023, 35, 2855–2865. [Google Scholar] [CrossRef]
- Ding, X.; Hao, K.; Cai, X.; Tang, S.; Chen, L.; Zhang, H. A Novel Similarity Measurement and Clustering Framework for Time Series Based on Convolution Neural Networks. IEEE Access 2020, 8, 173158–173168. [Google Scholar] [CrossRef]
- Yan, J.; Zhang, C.; Li, Y. A clustering method for power time series curves based on improved self-organizing mapping algorithm. In Proceedings of the 2023 IEEE 3rd International Conference on Electronic Technology, Communication and Information, ICETCI, Changchun, China, 26–28 May 2023; Institute of Electrical and Electronics Engineers Inc.: Piscataway, NJ, USA, 2023; pp. 451–455. [Google Scholar] [CrossRef]
- González, B.; Valdez, F.; Melin, P.; Prado-Arechiga, G. Fuzzy logic in the gravitational search algorithm for the optimization of modular neural networks in pattern recognition. Expert Syst. Appl. 2015, 42, 5839–5847. [Google Scholar] [CrossRef]
- Ramirez, M.; Melin, P. A New Interval Type-2 Fuzzy Aggregation Approach for Combining Multiple Neural Networks in Clustering and Prediction of Time Series. Int. J. Fuzzy Syst. 2023, 25, 1077–1104. [Google Scholar] [CrossRef]
- Xu, S.; Li, W.; Zhu, Y.; Xu, A. A novel hybrid model for six main pollutant concentrations forecasting based on improved LSTM neural networks. Sci. Rep. 2022, 12, 14434. [Google Scholar] [CrossRef] [PubMed]
- Kan, V.; Alsova, O. Forecasting Meteorological Indicators Based on Neural Networks. In Proceedings of the 2022 IEEE International Multi-Conference on Engineering, Computer and Information Sciences (SIBIRCON), Yekaterinburg, Russia, 11–13 November 2022; pp. 1620–1625. [Google Scholar] [CrossRef]
- Wu, J.L.; Lu, M.; Wang, C.Y. Forecasting metro rail transit passenger flow with multiple-attention deep neural networks and surrounding vehicle detection devices. Appl. Intell. 2023, 53, 18531–18546. [Google Scholar] [CrossRef] [PubMed]
- Soto, J.; Melin, P.; Castillo, O. Time series prediction using ensembles of ANFIS models with genetic optimization of interval type-2 and type-1 fuzzy integrators. Int. J. Hybrid. Intell. Syst. 2016, 11, 211–226. [Google Scholar] [CrossRef]
- Minrong, L.; Xuerong, X. TRNN: An efficient time-series recurrent neural network for stock price prediction. Inf. Sci. 2024, 657, 119951. [Google Scholar] [CrossRef]
- Ali, M.; Syed, M.A.; Khalid, M. NARX Recurrent Neural Network Based Short Term Residential Load Forecasting Considering the Effects of Multiple Weather Features. In Proceedings of the 2022 IEEE IAS Global Conference on Emerging Technologies (GlobConET), Arad, Romania, 20–22 May 2022; pp. 557–561. [Google Scholar] [CrossRef]
- Chacon, H.D.; Kesici, E.; Najafirad, P. Improving Financial Time Series Prediction Accuracy Using Ensemble Empirical Mode Decomposition and Recurrent Neural Networks. IEEE Access 2020, 8, 117133–117145. [Google Scholar] [CrossRef]
- Sohrabi, F.; Reza, M.; Mirabbasi, R.; Tahroudi, M. Daily solar radiation estimation in Belleville station, Illinois, using ensemble artificial intelligence approaches. Eng. Appl. Artif. Intell. 2023, 120, 105839. [Google Scholar] [CrossRef]
- Pan, X.; Wang, Y.; He, S.; Chin, K. A Dynamic Programming Algorithm Based Clustering Model and Its Application to Interval Type-2 Fuzzy Large-Scale Group Decision-Making Problem. IEEE Trans. Fuzzy Syst. 2022, 30, 108–120. [Google Scholar] [CrossRef]
- Mohammadzadeh, A.; Castillo, O.; Band, S.S.; Mosavi, A. A Novel Fractional-Order Multiple-Model Type-3 Fuzzy Control for Nonlinear Systems with Unmodeled Dynamics. Int. J. Fuzzy Syst. 2021, 23, 1633–1651. [Google Scholar] [CrossRef]
- Melin, P.; Sanchez, D.; Monica, J.C.; Castillo, O. A Optimization using the firefly algorithm of ensemble neural networks with type-2 fuzzy integration for COVID-19 time series prediction. Soft Comput. 2023, 27, 3245–3282. [Google Scholar] [CrossRef] [PubMed]
- Zhang, Z. Trapezoidal interval type-2 fuzzy aggregation operators and their application to multiple attribute group decision making. Neural Comput. Appl. 2018, 29, 1039–1054. [Google Scholar] [CrossRef]


| No. | Variable Code | Variable Name | Period |
|---|---|---|---|
| 1 | TSS1 | Access to electricity | 2000–2021 |
| 2 | TSS2 | Birth rate | 1990–2021 |
| 3 | TSS3 | Death rate | 1990–2021 |
| 4 | TSS4 | Life expectancy at birth (female) | 2000–2021 |
| 5 | TSS5 | Life expectancy at birth | 1990–2021 |
| 6 | TSS6 | Life expectancy birth (male) | 1960–2021 |
| 7 | TSS7 | Population growth | 1960–2022 |
| 8 | TSS8 | Population | 1960–2022 |
| 9 | TSS9 | Population (female) | 1960–2022 |
| 10 | TSS10 | %Population (female) | 1960–2022 |
| 11 | TSS11 | Population (male) | 1960–2022 |
| 12 | TSS12 | %Population (male) | 1960–2022 |
| No. | Region Code | Region Name | Total Countries |
|---|---|---|---|
| 1 | R1 | East Asia and Pacific | 35 |
| 2 | R2 | Europe and Central Asia | 53 |
| 3 | R3 | Latin America and Caribbean | 41 |
| 4 | R4 | Middle East and North Africa | 20 |
| 5 | R5 | North America | 3 |
| 6 | R6 | South Asia | 8 |
| 7 | R7 | Sub-Saharan Africa | 48 |
| Fuzzy Rules | Antecedents | Consequent | |
|---|---|---|---|
| Input_1 | Input_2 | Output_1 | |
| 1 | LWW | LWW | LWW |
| 2 | LWW | MDD | MDD |
| 3 | LWW | HGG | MDD |
| 4 | MDD | LWW | MDD |
| 5 | MDD | MDD | MDD |
| 6 | MDD | HGG | HGG |
| 7 | HGG | LWW | MDD |
| 8 | HGG | MDD | HGG |
| 9 | HGG | HGG | HGG |
| Fuzzy Rules | Antecedents | Consequent | ||
|---|---|---|---|---|
| Input_1 | Input_2 | Input_3 | Output_1 | |
| 1 | LWW | LWW | LWW | LWW |
| 2 | LWW | MDD | LWW | LWW |
| 3 | LWW | HGG | LWW | MDD |
| 4 | LWW | LWW | MDD | LWW |
| 5 | LWW | MDD | MDD | MDD |
| 6 | LWW | HGG | MDD | MDD |
| 7 | LWW | LWW | HGG | MDD |
| 8 | LWW | MDD | HGG | MDD |
| 9 | LWW | HGG | HGG | HGG |
| 10 | MDD | LWW | LWW | LWW |
| 11 | MDD | MDD | LWW | MDD |
| 12 | MDD | HGG | LWW | MDD |
| 13 | MDD | LWW | MDD | MDD |
| 14 | MDD | MDD | MDD | MDD |
| 15 | MDD | HGG | MDD | HGG |
| 16 | MDD | LWW | HGG | MDD |
| 17 | MDD | MDD | HGG | HGG |
| 18 | MDD | HGG | HGG | HGG |
| 19 | HGG | LWW | LWW | MDD |
| 20 | HGG | MDD | LWW | MDD |
| 21 | HGG | HGG | LWW | HGG |
| 22 | HGG | LWW | MDD | MDD |
| 23 | HGG | MDD | MDD | HGG |
| 24 | HGG | HGG | MDD | HGG |
| 25 | HGG | LWW | HGG | HGG |
| 26 | HGG | MDD | HGG | HGG |
| 27 | HGG | HGG | HGG | HGG |
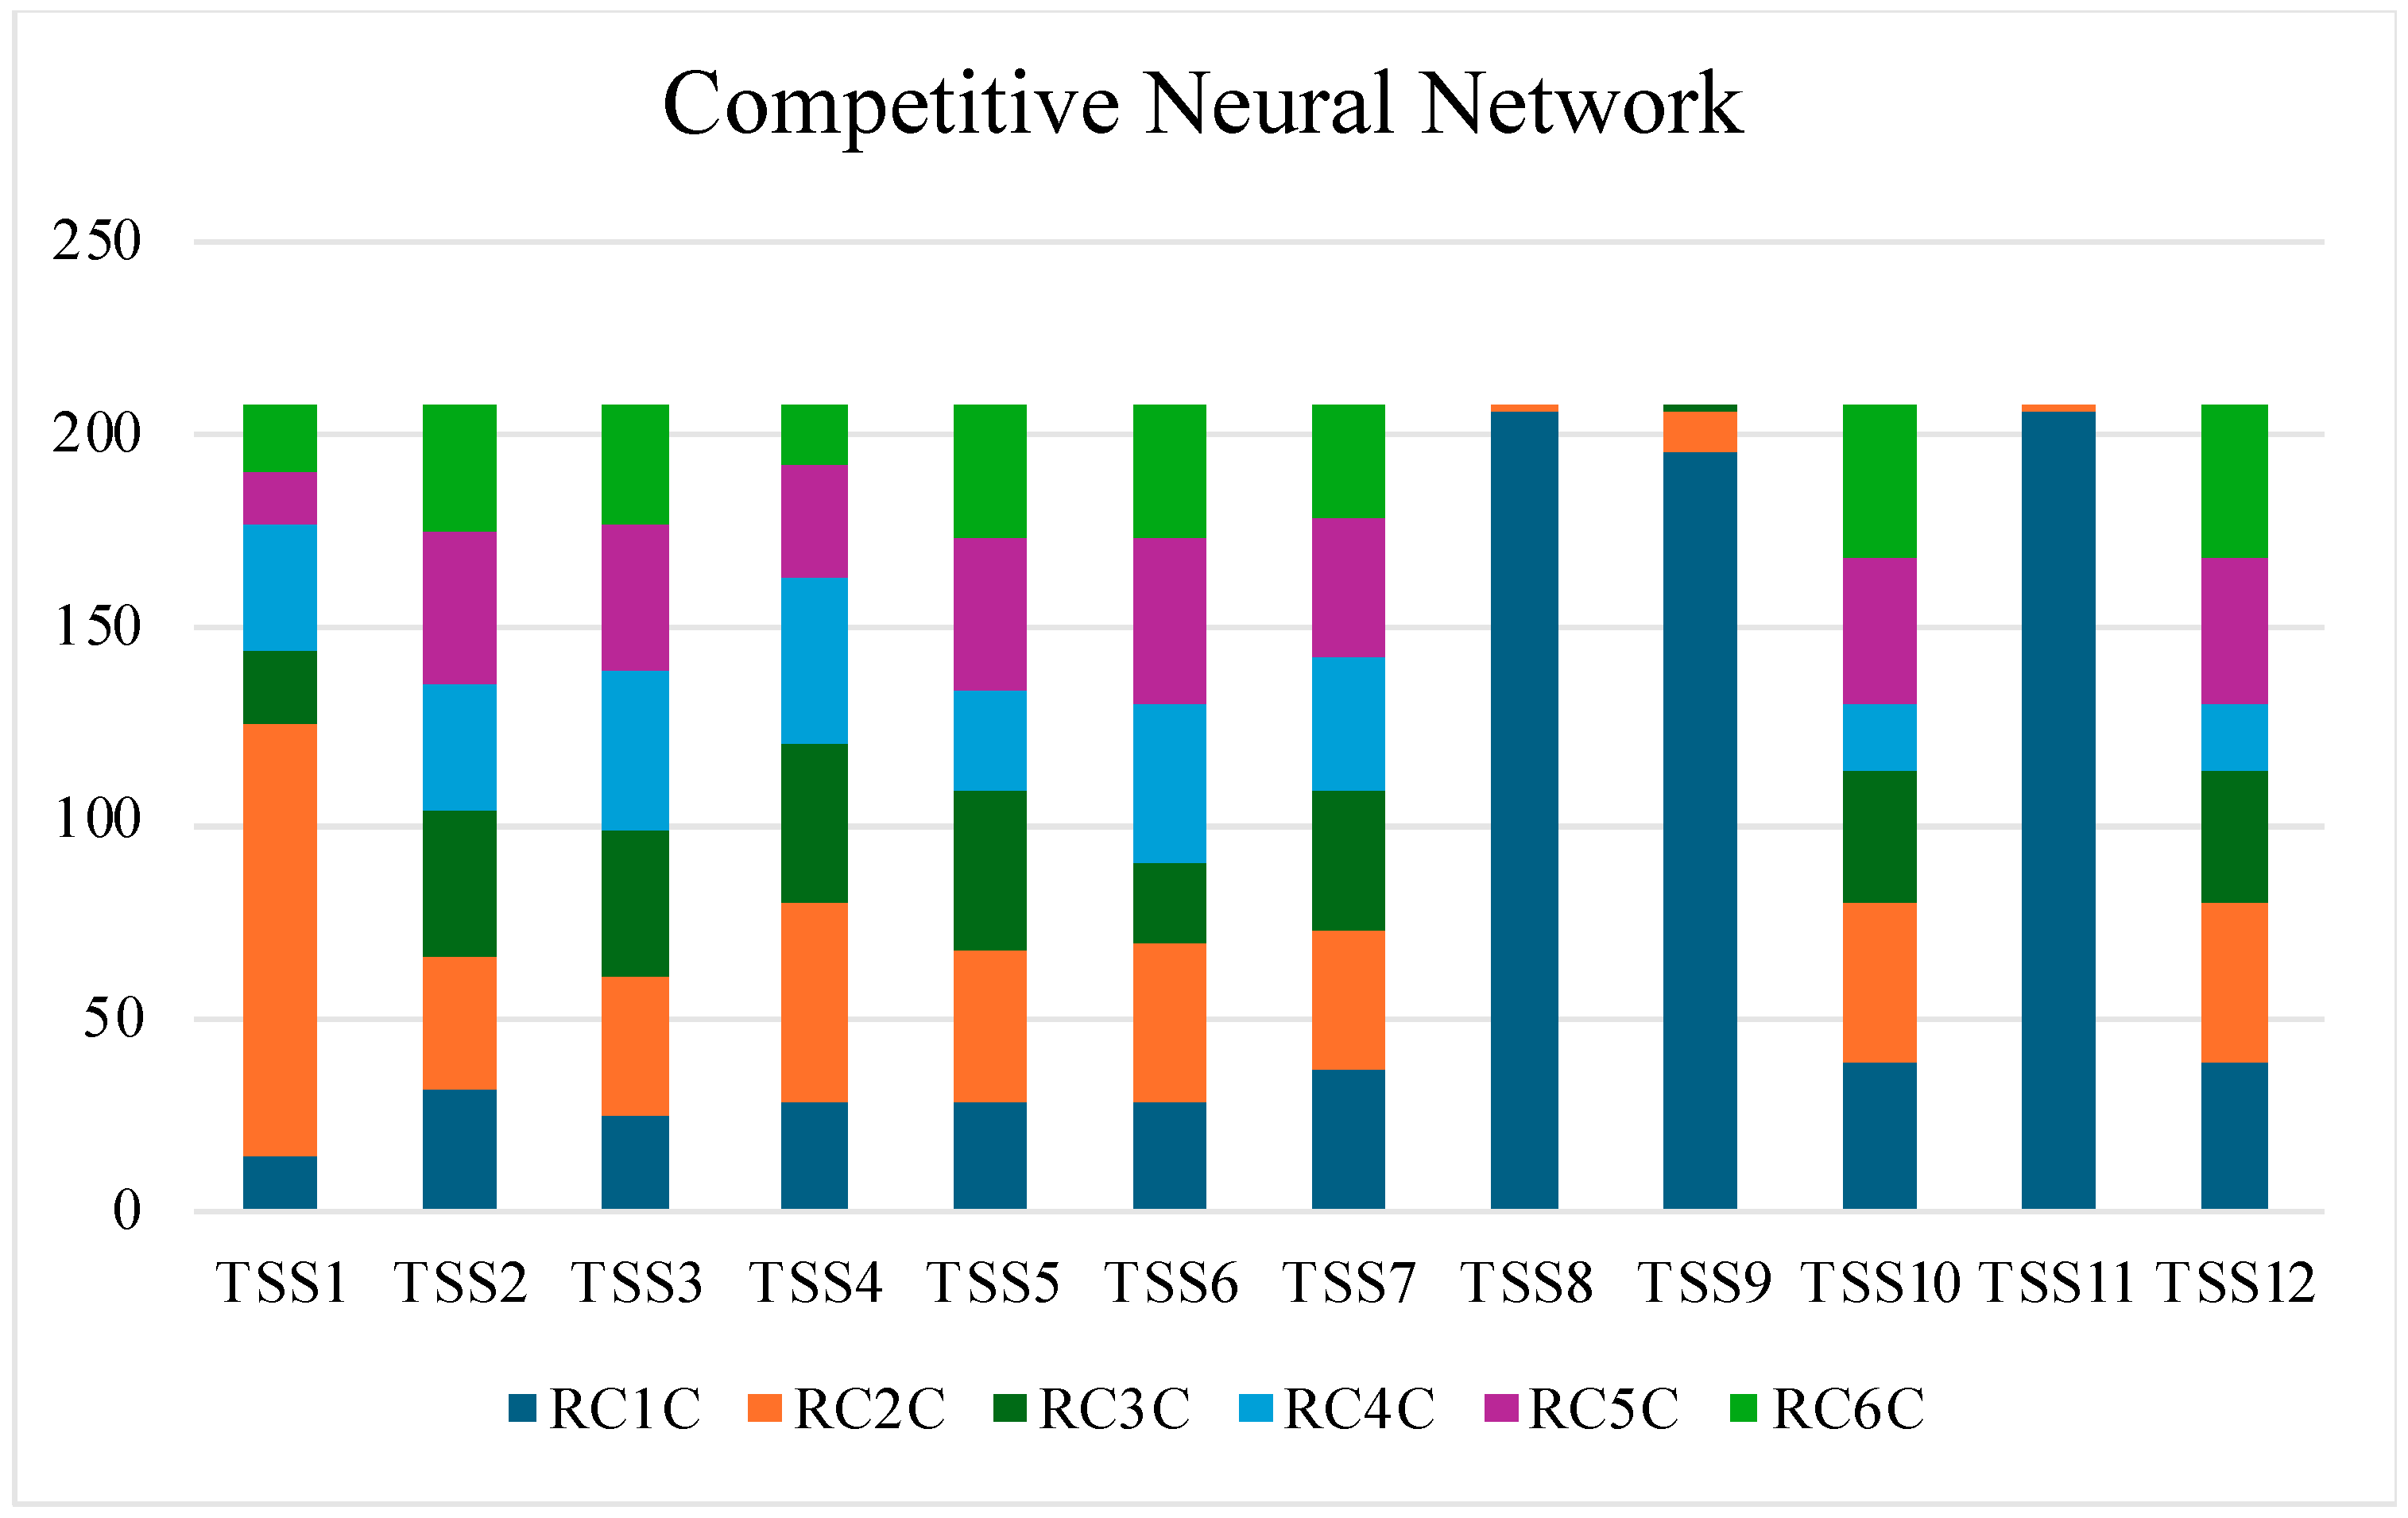
| Variable | RC1C | RC2C | RC3C | RC4C | RC5C | RC6C |
|---|---|---|---|---|---|---|
| TSS1 | 15 | 111 | 18 | 33 | 14 | 17 |
| TSS2 | 31 | 35 | 38 | 32 | 40 | 32 |
| TSS3 | 25 | 36 | 38 | 40 | 38 | 31 |
| TSS4 | 28 | 52 | 41 | 42 | 30 | 15 |
| TSS5 | 29 | 39 | 41 | 25 | 40 | 34 |
| TSS6 | 29 | 40 | 21 | 40 | 43 | 35 |
| TSS7 | 36 | 36 | 37 | 33 | 36 | 30 |
| TSS8 | 206 | 2 | 0 | 0 | 0 | 0 |
| TSS9 | 196 | 10 | 2 | 0 | 0 | 0 |
| TSS10 | 39 | 41 | 34 | 16 | 38 | 40 |
| TSS11 | 206 | 2 | 0 | 0 | 0 | 0 |
| TSS12 | 38 | 41 | 34 | 17 | 39 | 39 |
| Variable | RC1S | RC2S | RC3S | RC4S | RC5S | RC6S |
|---|---|---|---|---|---|---|
| TSS1 | 18 | 112 | 21 | 22 | 17 | 18 |
| TSS2 | 26 | 26 | 42 | 21 | 33 | 60 |
| TSS3 | 2 | 16 | 68 | 22 | 64 | 36 |
| TSS4 | 32 | 63 | 40 | 30 | 42 | 1 |
| TSS5 | 27 | 50 | 66 | 25 | 39 | 1 |
| TSS6 | 32 | 44 | 50 | 44 | 37 | 1 |
| TSS7 | 60 | 57 | 28 | 57 | 5 | 1 |
| TSS8 | 35 | 140 | 11 | 8 | 2 | 12 |
| TSS9 | 37 | 147 | 7 | 2 | 14 | 1 |
| TSS10 | 98 | 10 | 75 | 4 | 19 | 2 |
| TSS11 | 33 | 140 | 13 | 8 | 2 | 12 |
| TSS12 | 101 | 10 | 72 | 4 | 19 | 2 |
| FIS | Type-1 | |||||||||||
|---|---|---|---|---|---|---|---|---|---|---|---|---|
| Inputs | TSS1 | TSS2 | TSS3 | TSS4 | TSS5 | TSS6 | TSS7 | TSS8 | TSS9 | TSS10 | TSS11 | TSS12 |
| Outputs (Subregion) | T1 FIS1 | T1 FIS2 | T1 FIS3 | T1 FIS4 | T1 FIS5 | T1 FIS6 | T1 FIS7 | T1 FIS8 | T1 FIS9 | T1 FIS10 | T1 FIS11 | T1 FIS12 |
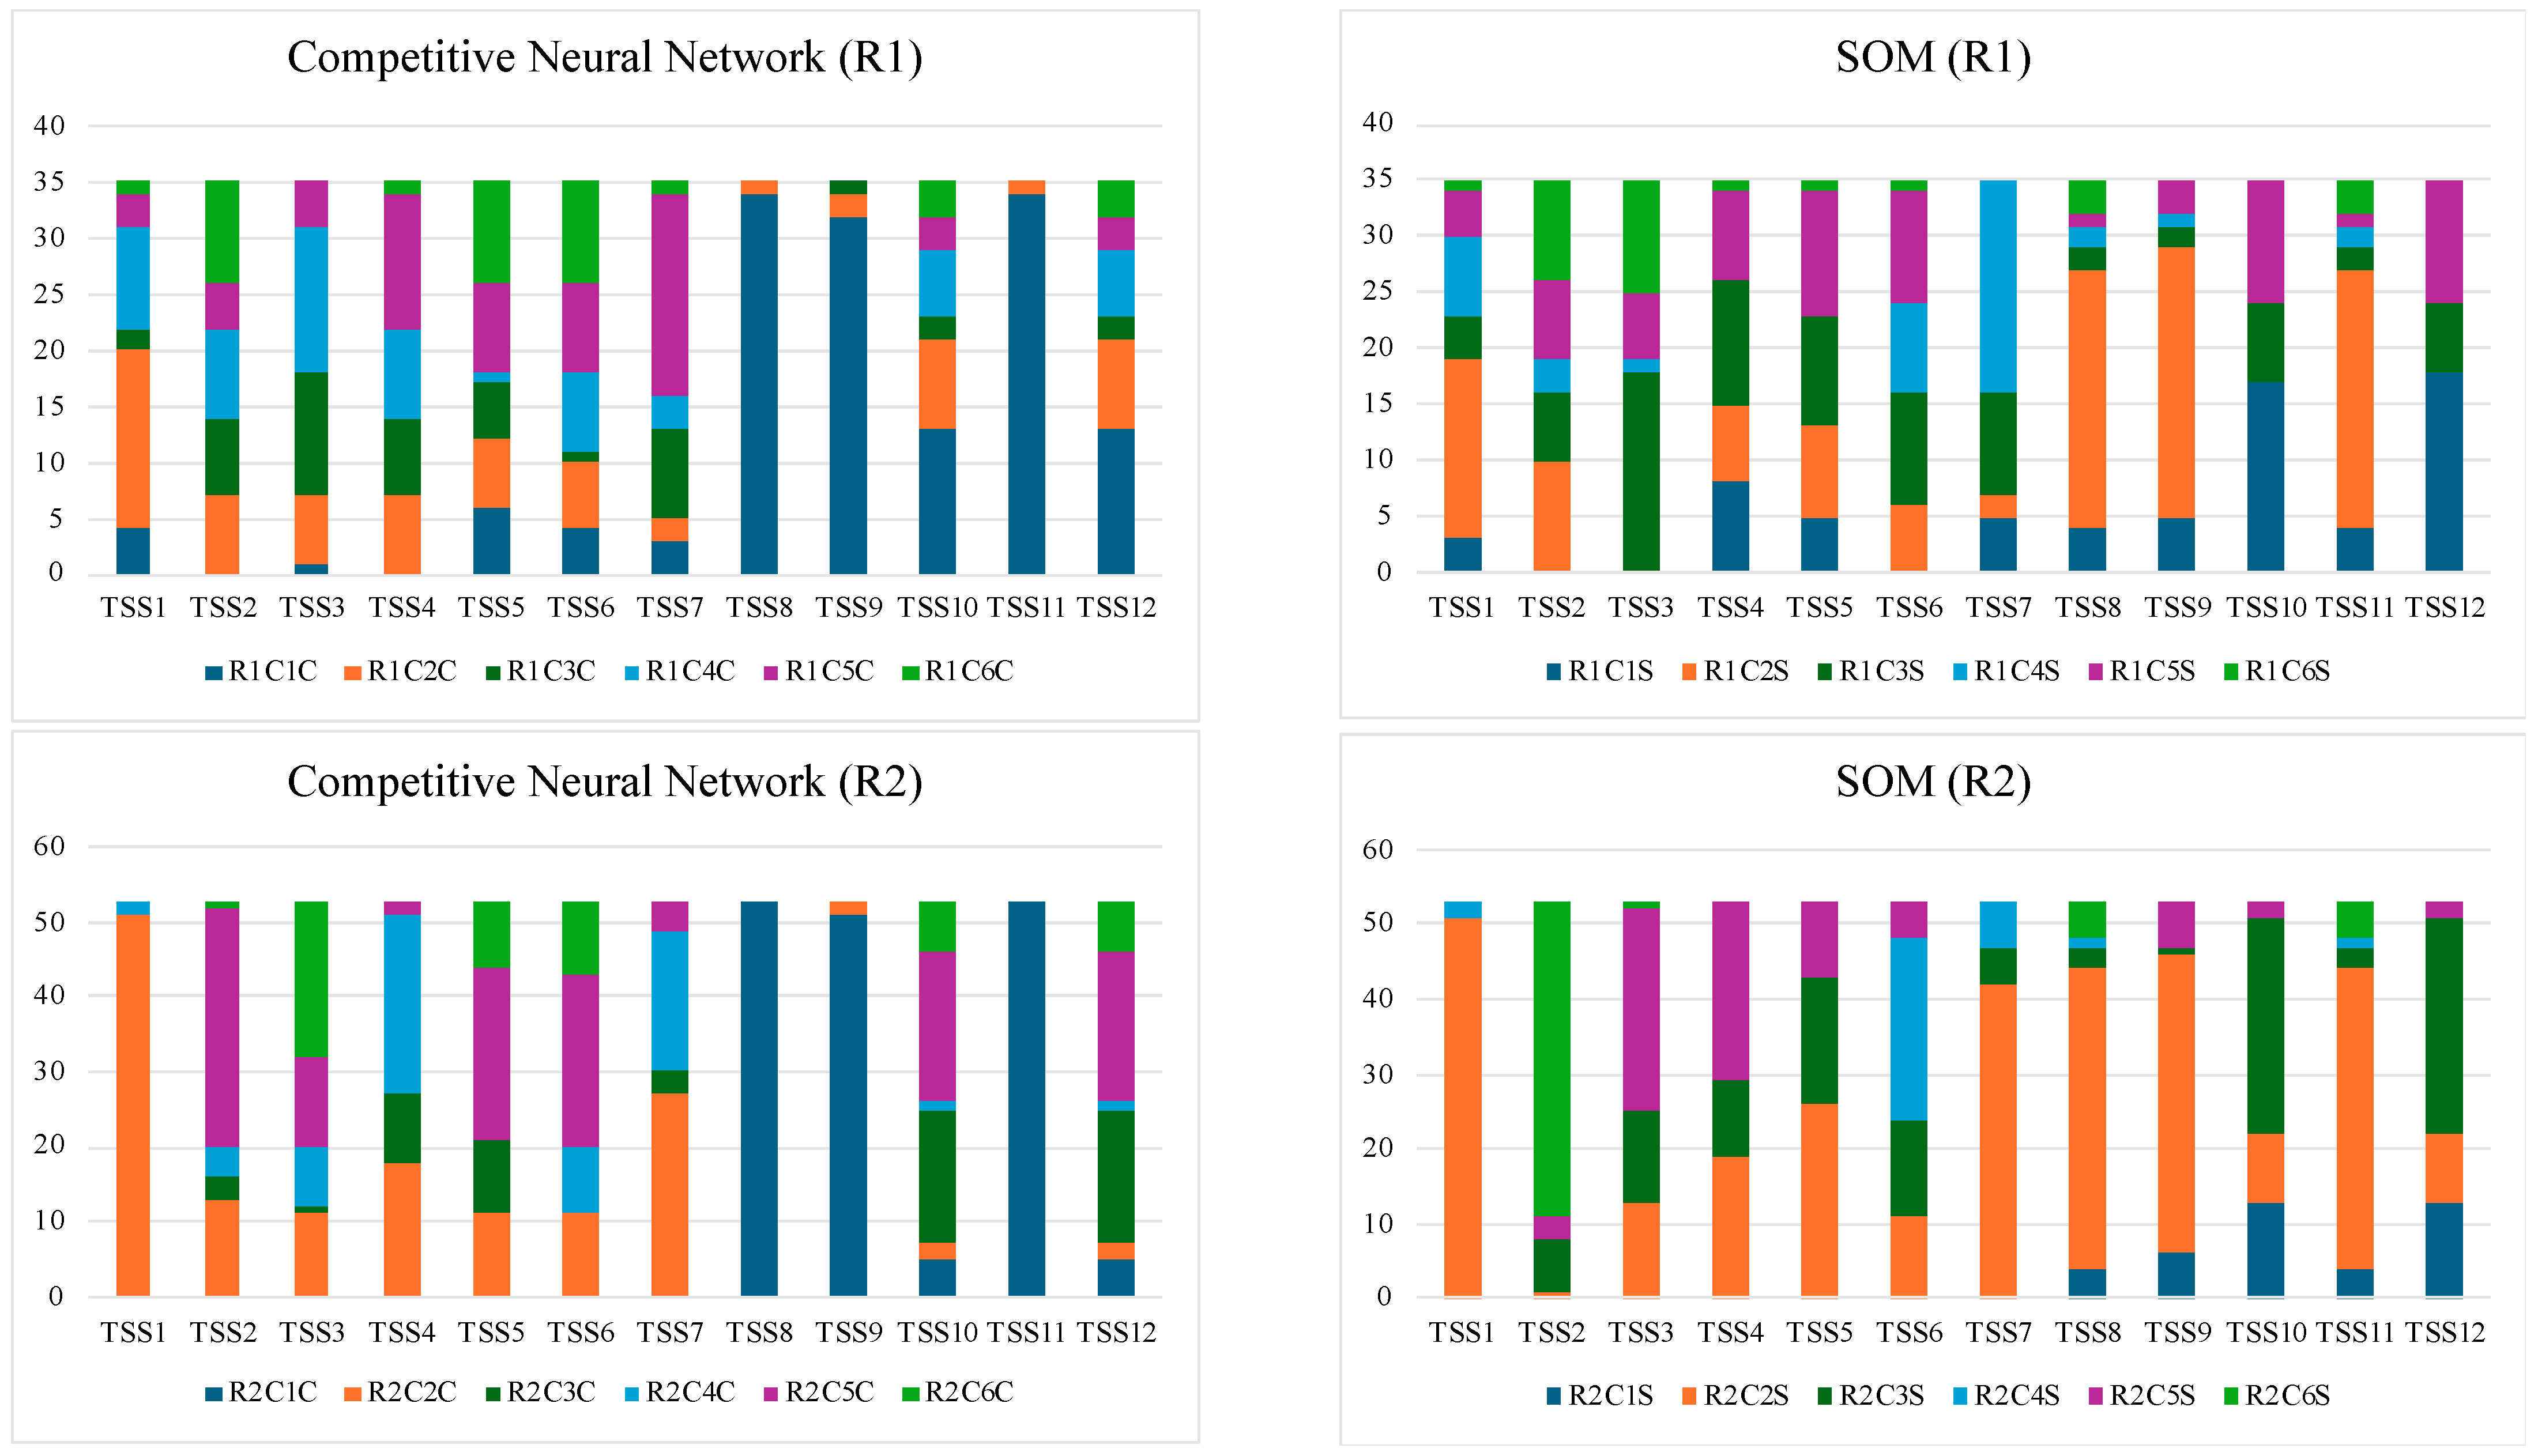
| R1_R1 | 20 | 6 | 4 | 7 | 11 | 6 | 7 | 29 | 29 | 16 | 29 | 16 |
| R1_R2 | 3 | 18 | 27 | 19 | 14 | 15 | 15 | 5 | 5 | 13 | 5 | 13 |
| R1_R3 | 12 | 11 | 4 | 9 | 10 | 14 | 13 | 1 | 1 | 6 | 1 | 6 |
| R2_R1 | 51 | 3 | 4 | 19 | 11 | 10 | 27 | 47 | 46 | 15 | 47 | 15 |
| R2_R2 | 0 | 18 | 29 | 10 | 33 | 15 | 23 | 6 | 6 | 37 | 6 | 37 |
| R2_R3 | 2 | 32 | 20 | 24 | 9 | 28 | 3 | 0 | 1 | 1 | 0 | 1 |
| R3_R1 | 24 | 10 | 11 | 22 | 15 | 16 | 11 | 39 | 39 | 20 | 39 | 20 |
| R3_R2 | 2 | 30 | 25 | 13 | 20 | 19 | 25 | 2 | 1 | 21 | 2 | 21 |
| R3_R3 | 15 | 1 | 5 | 6 | 6 | 6 | 5 | 0 | 1 | 0 | 0 | 0 |
| R4_R1 | 16 | 4 | 1 | 11 | 8 | 6 | 3 | 18 | 18 | 7 | 18 | 7 |
| R4_R2 | 1 | 13 | 18 | 7 | 8 | 7 | 9 | 2 | 2 | 6 | 2 | 6 |
| R4_R3 | 3 | 3 | 1 | 2 | 4 | 7 | 8 | 0 | 0 | 7 | 0 | 7 |
| R5_R1 | 3 | 0 | 2 | 1 | 0 | 0 | 1 | 2 | 2 | 2 | 2 | 2 |
| R5_R2 | 0 | 1 | 1 | 0 | 3 | 0 | 2 | 1 | 0 | 1 | 1 | 1 |
| R5_R3 | 0 | 2 | 0 | 2 | 0 | 3 | 0 | 0 | 1 | 0 | 0 | 0 |
| R6_R1 | 2 | 2 | 1 | 3 | 2 | 2 | 1 | 5 | 5 | 4 | 5 | 4 |
| R6_R2 | 1 | 5 | 4 | 5 | 1 | 4 | 4 | 2 | 2 | 2 | 2 | 1 |
| R6_R3 | 5 | 1 | 3 | 0 | 5 | 2 | 3 | 1 | 1 | 2 | 1 | 3 |
| R7_R1 | 10 | 26 | 4 | 11 | 19 | 31 | 30 | 46 | 45 | 17 | 46 | 17 |
| R7_R2 | 19 | 11 | 25 | 24 | 4 | 14 | 15 | 2 | 3 | 31 | 2 | 31 |
| R7_R3 | 19 | 11 | 19 | 13 | 25 | 3 | 3 | 0 | 0 | 0 | 0 | 0 |
| FIS | Type-1 | ||||
|---|---|---|---|---|---|
| Inputs | T1 FIS1 T1 FIS7 T1 FIS8 | T1 FIS2 T1 FIS3 | T1 FIS4 T1 FIS5 T1 FIS6 | T1 FIS9 T1 FIS11 | T1 FIS10 T1 FIS12 |
| Outputs (Subregion) | T1_IR1 | T1_IR2 | T1_IR3 | T1_IR4 | T1_IR5 |
| R1_R1 | 0 | 0 | 0 | 0 | 0 |
| R1_R2 | 6 | 0 | 0 | 2 | 0 |
| R1_R3 | 29 | 35 | 35 | 33 | 35 |
| R2_R1 | 0 | 0 | 0 | 0 | 0 |
| R2_R2 | 4 | 0 | 0 | 2 | 0 |
| R2_R3 | 49 | 53 | 53 | 51 | 53 |
| R3_R1 | 0 | 0 | 0 | 0 | 0 |
| R3_R2 | 7 | 0 | 1 | 2 | 0 |
| R3_R3 | 34 | 41 | 40 | 39 | 41 |
| R4_R1 | 1 | 0 | 0 | 0 | 0 |
| R4_R2 | 3 | 0 | 1 | 1 | 0 |
| R4_R3 | 16 | 20 | 19 | 19 | 20 |
| R5_R1 | 0 | 0 | 0 | 0 | 0 |
| R5_R2 | 0 | 0 | 0 | 1 | 0 |
| R5_R3 | 3 | 3 | 3 | 2 | 3 |
| R6_R1 | 1 | 0 | 1 | 0 | 0 |
| R6_R2 | 0 | 0 | 0 | 0 | 0 |
| R6_R3 | 7 | 8 | 7 | 8 | 8 |
| R7_R1 | 4 | 0 | 6 | 0 | 0 |
| R7_R2 | 13 | 4 | 6 | 3 | 0 |
| R7_R3 | 31 | 44 | 36 | 45 | 48 |
| FIS | Interval Type-2 | ||||
|---|---|---|---|---|---|
| Inputs | T1 FIS1 T1 FIS7 T1 FIS8 | T1 FIS2 T1 FIS3 | T1 FIS4 T1 FIS5 T1 FIS6 | T1 FIS9 T1 FIS11 | T1 FIS10 T1 FIS12 |
| Outputs (Subregion) | IT2_IR1 | IT2_IR2 | IT2_IR3 | IT2_IR4 | IT2_IR5 |
| R1_R1 | 0 | 0 | 0 | 0 | 0 |
| R1_R2 | 21 | 31 | 6 | 11 | 21 |
| R1_R3 | 14 | 4 | 29 | 24 | 14 |
| R2_R1 | 0 | 0 | 0 | 0 | 0 |
| R2_R2 | 49 | 34 | 11 | 13 | 41 |
| R2_R3 | 4 | 19 | 42 | 40 | 12 |
| R3_R1 | 0 | 0 | 1 | 0 | 0 |
| R3_R2 | 25 | 37 | 16 | 9 | 27 |
| R3_R3 | 16 | 4 | 24 | 32 | 14 |
| R4_R1 | 1 | 0 | 1 | 0 | 0 |
| R4_R2 | 12 | 19 | 8 | 8 | 10 |
| R4_R3 | 7 | 1 | 11 | 12 | 10 |
| R5_R1 | 0 | 0 | 0 | 0 | 0 |
| R5_R2 | 2 | 1 | 0 | 2 | 1 |
| R5_R3 | 1 | 2 | 3 | 1 | 2 |
| R6_R1 | 1 | 0 | 1 | 0 | 0 |
| R6_R2 | 0 | 6 | 1 | 5 | 4 |
| R6_R3 | 7 | 2 | 6 | 3 | 4 |
| R7_R1 | 7 | 0 | 12 | 0 | 0 |
| R7_R2 | 16 | 38 | 1 | 18 | 37 |
| R7_R3 | 25 | 10 | 35 | 30 | 11 |
| FIS | Interval Type-2 | Interval Type-2 | Interval Type-2 | Generalized Type-2 |
|---|---|---|---|---|
| Inputs | T1_IR1 T1_IR2 | T1_IR3 T1_IR4 T1_IR5 | IT2_R1 IT2_R2 | IT2_R1 IT2_R2 |
| Outputs (Subregion) | IT2_R1 | IT2_R2 | IT2_RG | T2_RG |
| R1_R1 | 0 | 1 | 2 | 1 |
| R1_R2 | 35 | 33 | 33 | 33 |
| R1_R3 | 0 | 1 | 0 | 1 |
| R2_R1 | 0 | 0 | 3 | 0 |
| R2_R2 | 53 | 53 | 50 | 53 |
| R2_R3 | 0 | 0 | 0 | 0 |
| R3_R1 | 0 | 0 | 3 | 0 |
| R3_R2 | 41 | 41 | 38 | 41 |
| R3_R3 | 0 | 0 | 0 | 0 |
| R4_R1 | 1 | 2 | 2 | 1 |
| R4_R2 | 18 | 18 | 18 | 18 |
| R4_R3 | 1 | 0 | 0 | 1 |
| R5_R1 | 0 | 0 | 0 | 0 |
| R5_R2 | 3 | 3 | 3 | 3 |
| R5_R3 | 0 | 0 | 0 | 0 |
| R6_R1 | 1 | 1 | 1 | 1 |
| R6_R2 | 7 | 7 | 7 | 7 |
| R6_R3 | 0 | 0 | 0 | 0 |
| R7_R1 | 10 | 9 | 5 | 8 |
| R7_R2 | 34 | 39 | 43 | 37 |
| R7_R3 | 4 | 0 | 0 | 3 |
| FIS | Type-1 (T1)/Interval Type-2 (IT2) | |||||||||
|---|---|---|---|---|---|---|---|---|---|---|
| Inputs | T1 FIS1 T1 FIS7 T1 FIS8 | T1 FIS2 T1 FIS3 | T1 FIS4 T1 FIS5 T1 FIS6 | T1 FIS9 T1 FIS11 | T1 FIS10 T1 FIS12 | |||||
| Outputs (Regions) | T1_IR1 | IT2_IR1 | T1_IR2 | IT2_IR2 | T1_IR3 | IT2_IR3 | T1_IR4 | IT2_IR4 | T1_IR5 | IT2_IR5 |
| R1 | 6 | 9 | 0 | 0 | 7 | 15 | 0 | 0 | 0 | 0 |
| R2 | 33 | 125 | 4 | 166 | 8 | 43 | 11 | 66 | 0 | 141 |
| R3 | 169 | 74 | 204 | 42 | 193 | 150 | 197 | 142 | 208 | 67 |
| FIS | Interval Type-2 | Generalized Type-2 |
|---|---|---|
| Inputs | IT2_R1 IT2_R2 | IT2_R1 IT2_R2 |
| Outputs (Regions) | IT2_RG | T2_RG |
| R1 | 16 | 12 |
| R2 | 192 | 191 |
| R3 | 0 | 5 |
| Variable | Average %RMSE | Best %RMSE | Worst %RMSE |
|---|---|---|---|
| TSS1 | 0.000027798 | 0.000013944 | 0.000048778 |
| TSS2 | 0.000026712 | 0.000014912 | 0.000043324 |
| TSS3 | 0.000064301 | 0.000038295 | 0.000111326 |
| TSS4 | 0.000016197 | 0.000008287 | 0.000030772 |
| TSS5 | 0.000012526 | 0.000006770 | 0.000020071 |
| TSS6 | 0.000014930 | 0.000008680 | 0.000028881 |
| TSS7 | 0.000134383 | 0.000084544 | 0.000201535 |
| TSS8 | 0.000105706 | 0.000022670 | 0.000287229 |
| TSS9 | 0.000091964 | 0.000025740 | 0.000286967 |
| TSS10 | 0.000002059 | 0.000001169 | 0.000003839 |
| TSS11 | 0.000110160 | 0.000024207 | 0.000252354 |
| TSS12 | 0.000002194 | 0.000001190 | 0.000003500 |
| Variable | Average %RMSE | Best %RMSE | Worst %RMSE |
|---|---|---|---|
| TSS1 | 0.000420807 | 0.000092340 | 0.000949776 |
| TSS2 | 0.000130195 | 0.000052815 | 0.000245523 |
| TSS3 | 0.000332452 | 0.000167022 | 0.000591463 |
| TSS4 | 0.000066602 | 0.000019978 | 0.000165994 |
| TSS5 | 0.000137332 | 0.000070974 | 0.000296870 |
| TSS6 | 0.000146327 | 0.000071138 | 0.000393558 |
| TSS7 | 0.001108667 | 0.000573669 | 0.002632906 |
| TSS8 | 0.000886138 | 0.000215622 | 0.002840459 |
| TSS9 | 0.000851274 | 0.000180802 | 0.003587455 |
| TSS10 | 0.000004522 | 0.000002657 | 0.000008226 |
| TSS11 | 0.000960787 | 0.000170907 | 0.002616553 |
| TSS12 | 0.000005042 | 0.000002598 | 0.000007630 |
Disclaimer/Publisher’s Note: The statements, opinions and data contained in all publications are solely those of the individual author(s) and contributor(s) and not of MDPI and/or the editor(s). MDPI and/or the editor(s) disclaim responsibility for any injury to people or property resulting from any ideas, methods, instructions or products referred to in the content. |
© 2024 by the authors. Licensee MDPI, Basel, Switzerland. This article is an open access article distributed under the terms and conditions of the Creative Commons Attribution (CC BY) license (https://creativecommons.org/licenses/by/4.0/).
Share and Cite
Ramírez, M.; Melin, P.; Castillo, O. A New Hybrid Approach for Clustering, Classification, and Prediction of World Development Indicators Combining General Type-2 Fuzzy Systems and Neural Networks. Axioms 2024, 13, 368. https://doi.org/10.3390/axioms13060368
Ramírez M, Melin P, Castillo O. A New Hybrid Approach for Clustering, Classification, and Prediction of World Development Indicators Combining General Type-2 Fuzzy Systems and Neural Networks. Axioms. 2024; 13(6):368. https://doi.org/10.3390/axioms13060368
Chicago/Turabian StyleRamírez, Martha, Patricia Melin, and Oscar Castillo. 2024. "A New Hybrid Approach for Clustering, Classification, and Prediction of World Development Indicators Combining General Type-2 Fuzzy Systems and Neural Networks" Axioms 13, no. 6: 368. https://doi.org/10.3390/axioms13060368
APA StyleRamírez, M., Melin, P., & Castillo, O. (2024). A New Hybrid Approach for Clustering, Classification, and Prediction of World Development Indicators Combining General Type-2 Fuzzy Systems and Neural Networks. Axioms, 13(6), 368. https://doi.org/10.3390/axioms13060368