Abstract
Integrated energy system (IES) is an important direction for the future development of the energy industry, and the stable operation of the IES can ensure heat and power supply. This study established an integrated system composed of an IES and advanced adiabatic compressed air energy storage (AA-CAES) to guarantee the robust operation of the IES under failure conditions. Firstly, a robust operation method using the AA-CAES is formulated to ensure the stable operation of the IES. The method splits the energy release process of the AA-CAES into two parts: a heat-ensuring part and a power-ensuring part. The heat-ensuring part uses the high-temp tank to maintain the balance of the heat subnet of the IES, and the power-ensuring part uses the air turbine of the first stage to maintain the balance of the power subnet. Moreover, another operation method using a spare gas boiler is formulated to compare the income of the IES with two different methods under failure conditions. The results showed that the AA-CAES could guarantee the balance of heat subnet and power subnet under steady conditions, and the dynamic operation income of the IES with the AA-CAES method was a bit higher than the income of the IES with the spare gas boiler method.
1. Introduction
With the continuous development of the economy, society’s demand for energy is increasing. In the traditional energy industry, each energy network’s single operation and centralized energy supply mode are difficult to link with different energy sources [1], and they cannot improve overall energy efficiency [2]. With the progress of renewable energy sources such as wind power and hydropower, the ability to absorb renewable energy has become an important goal for future energy systems [3,4]. In this context, integrated energy system (IES) has become one of the most important trends in the future energy field [5,6,7].
IES includes a variety of energy networks such as natural gas, heat, and power. The connection and mutual coupling between different subnetworks improve overall efficiency but put forward higher requirements for the system’s stability [8]. Only one single energy network will be affected when a traditional energy system fails, but when an IES fails, the coupling between different energy networks will lead to cascading failures [9]. For example, a natural gas network and a power network are coupled through a gas turbine, and the failure of the natural gas network may cause the failure of the power network as the gas turbine fails. Therefore, to ensure the safe and stable operation of IES, it is necessary to research the fault response and robust operation methods of IES.
For the failure of IES, Li et al. [10] analyzed the reliability of an IES under three different operation objectives and verified the reasonability of the proposed indices and flexible scheduling of energy flow. Moslehi et al. [11] built a three-dimensional matrix to combine failures and different operational periods to realize the quantification of failure loss in IES. Benjamin et al. [12] defined a novel criticality index as the ratio of the output change to the capacity of the failed component. The computation of the criticality index makes it convenient to develop risk mitigation measures. Dehghani et al. [13] studied the impact of false data injection attack on distributed generation systems. The result showed that the attack on loads and prices would lead to serious damage to the network as well as economic losses. The above research studies mainly focused on evaluating the reliability of IES and quantifying the possible impact of failures. The elimination of the impact was achieved by adjusting the equipment in IES without considering the possibility of using external equipment. This paper aims to find a way to eliminate the influence of failures in IES through the access of external equipment.
As a new energy storage system, compressed air energy storage (CAES) has wind power absorption, electricity storage, and thermal energy storage capabilities [14,15,16]. At present, the ability of CAES to mitigate electricity scarcity has been proven [17], and CAES’s cogeneration will not affect electric power generation [18]. The similar multi-energy flow structure of CAES and IES makes CAES one of the best choices to eliminate the influence of failures in IES. In the various types of CAES, adiabatic compressed air energy storage (A-CAES) is proven to have the highest energy storage efficiency [19] because the compression process is adiabatic. The number of compressor stages also has an impact on the performance of CAES [20,21], and less compression is suggested for a large heating supply [22]. The integration of thermal energy storage (TES) and A-CAES improves the power and energy densities of the system [23,24], and the integrated system is called advanced adiabatic compressed air energy storage (AA-CAES).
In terms of joint operation of AA-CAES and IES, current research mainly focuses on the integrated system’s operation optimization and structure improvement. The economic advantages of the joint operation of CAES and IES have been proven [25]. Capacity optimization [26], emission reduction [27], and cost optimization [28] become the improvement targets of the CAES and IES joint system. The integrated system of AA-CAES and IES has better performance under variable working conditions [29,30]. Although the advantages of AA-CAES in improving the economics of IES have been demonstrated, the role that AA-CAES can play in realizing the robust operation of IES has not been involved.
In this paper, an integrated system composed of an IES and an AA-CAES is proposed. Two models to simulate possible failures in the IES are established, one pump failure model to simulate equipment failures and one gas pipeline failure model to simulate network failures. A robust operation method using AA-CAES is designed to maintain the balance of subnets in the IES. In this method, the energy release process of the AA-CAES is split into a heat-ensuring part which uses the high-temp tank to keep the balance of the heat subnet, and a power-ensuring part which uses the first stage of the air turbine to keep the balance of the power subnet. In order to verify the feasibility and economic efficiency of the AA-CAES method in ensuring the robust operation of the IES, two simulations are carried out in Apros (dynamic process simulation software). The first simulation is carried out under steady conditions, and the effectiveness of the AA-CAES method is verified by comparing the IES output values before and after applying the AA-CAES method during the failure period. The second simulation is carried out under dynamic conditions, and the incomes of the IES during the failure period are compared after applying the AA-CAES method and another method that uses a spare boiler instead of AA-CAES.
2. Operation Models for IES
2.1. IES Composition
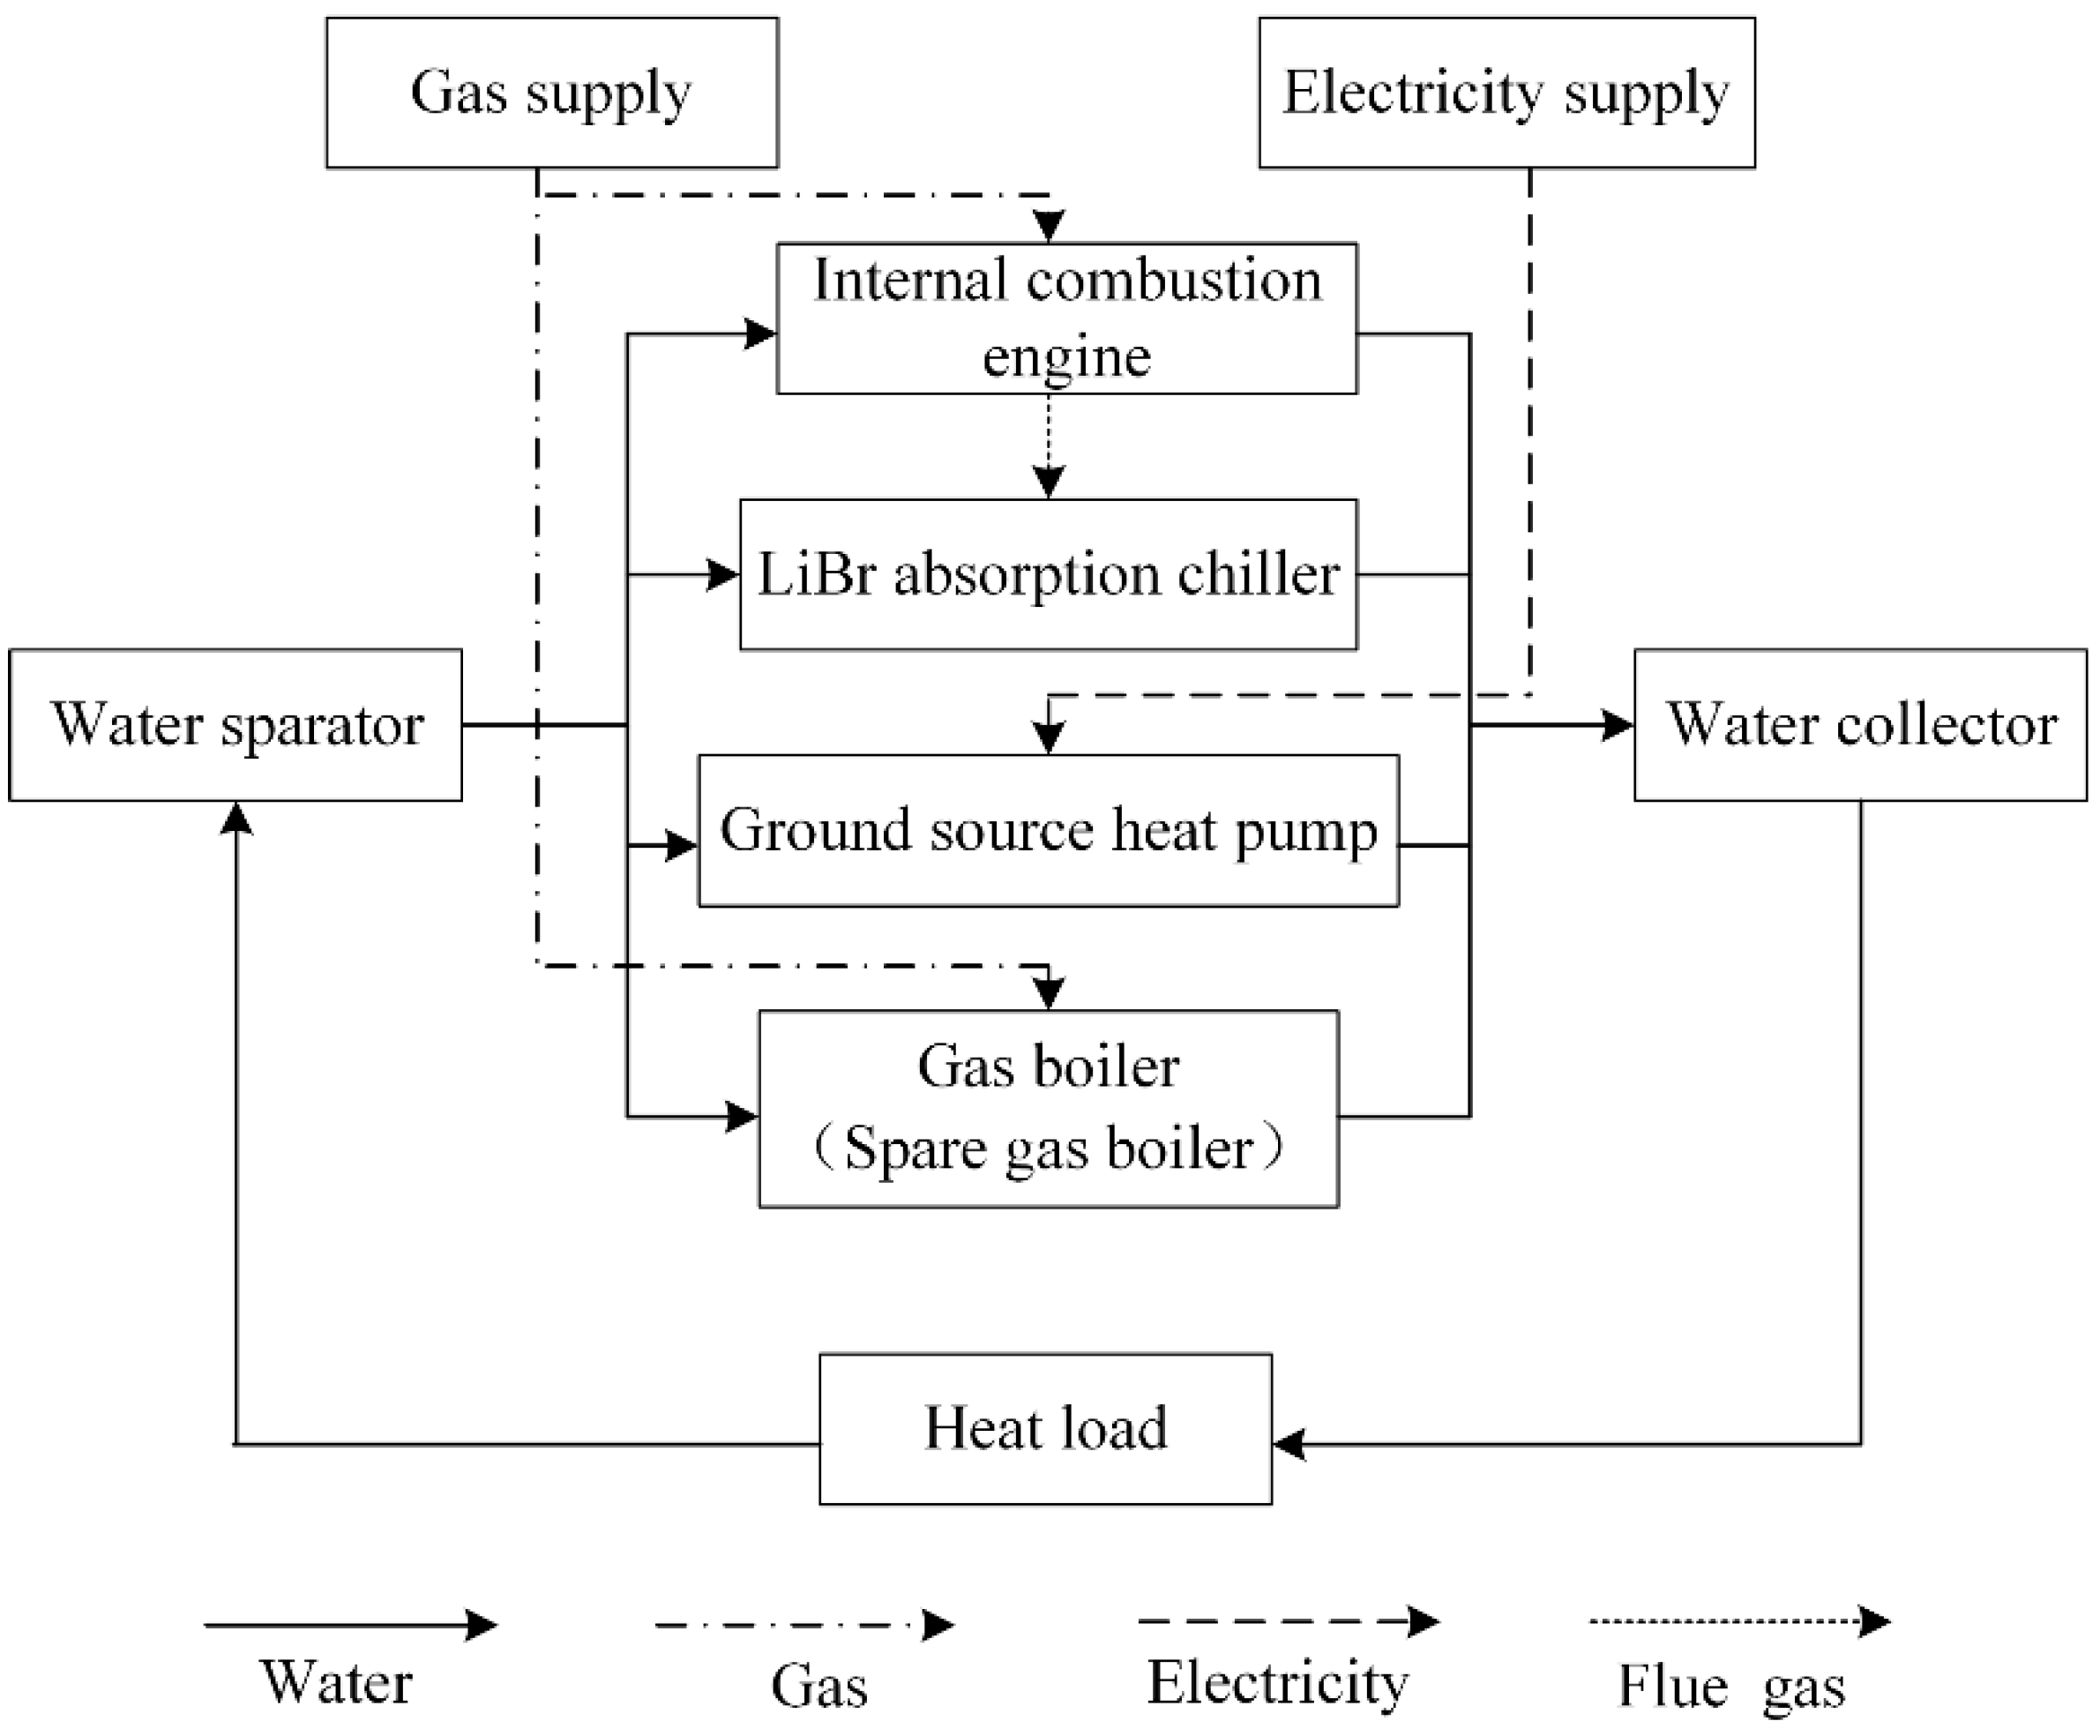
Figure 1 shows a representative IES consisting of a gas internal combustion engine equipped with a cylinder liner cooler, a lithium bromide (Li-Br) absorption chiller, a gas boiler, a spare gas boiler, a ground source heat pump (GSHP), a water collector, and a water separator. The gas internal combustion engine burns natural gas to drive the generator. The absorption chiller uses the flue gas to heat water. Meanwhile, the cylinder liner cooler exchanges thermal energy between water and the high-temperature cylinder liner. The GSHP heats water by consuming electricity generated by the generator. The gas boiler heats water by burning natural gas and the spare gas boiler is closed under design conditions. The heated water is collected by the water collector and supplied to the heat demand. After the water temperature decreases, the water flows back to each piece of equipment through the water separator to realize the whole cycle. When the power output of the generator cannot meet the demand of the GSHP, the IES can purchase electricity from the external network to ensure sufficient heat output. The equipment parameters of the IES are shown in Table 1.

Figure 1.
Equipment composition of IES.

Table 1.
Equipment parameters of IES.
2.2. Thermodynamic Model
The gas internal combustion engine and the Li-Br absorption chiller form a combined heat and power (CHP) system. According to the conservation of energy, the mathematical model of the CHP system is as follows [31]:
where is the low calorific value of natural gas, kJ/Nm3; is the natural gas intake of the system, m3/h; is the percentage of flue gas heat; is the percentage of jacket water heat; is the jacket water heat, kJ/h; is the gas heat, kJ/h; is the energy efficiency ratio of Li-Br absorption chiller; is the heating power of internal combustion engine, kW; is the electric power of internal combustion engine, kW; is electric efficiency of the internal combustion engine.
The mathematical model of the gas boiler is as follows [32]:
where is the heat power of gas boiler, kJ/h; is the consumption of natural gas, m3/h; is the efficiency of gas boiler.
By consuming a small amount of high-grade energy, the GSHP can realize the energy transfer from the low-temperature heat source to the high-temperature heat source. The mathematical model of the GSHP is as follows [33]:
where is the power of GSHP, kW; is the heating efficiency ratio; is the heating power, kW; is the absorbed heat from the ground source, kJ/h; is the inlet (outlet) temperature on the load side, K; is the inlet (outlet) temperature on the ground source side, K; is the water mass flow on source (load) side, kg/h; is the fluid-specific heat on source (load) side, kJ/(kg·K); is the minimum power of GSHP, kW; is the maximum power of GSHP, kW.
3. The Proposed Robust Operation of IES
3.1. Modeling of IES Failure
Water pumps play a key role in the stable operation of IES as an important fluid component [34]. When a water pump fails, it is usually manifested as a decrease in the pump’s head. The pressure difference between the front and rear of the pump cannot be maintained in a normal state and the flow through the pump decreases. After preliminary research, a failure model of the circulating pump in the Li-Br absorption chiller is proposed. The similarity law of pump [35] is as follows:
where is the flow, m3/h; is the head, m; is the speed, r/min; subscripts 1 and 2 represent conditions 1 and 2.
From Equation (12), the change of pump speed will cause the change in the head. Because of this, a speed control system for the circulating pump is established. The pump failure is simulated by adjusting the speed of the pump, thereby realizing the dynamic simulation of the automatic occurrence and elimination of the failure.
As shown in Figure 1, the IES has three energy subnetworks: natural gas, heat, and power. The natural gas subnetwork supplies natural gas to the CHP system and the gas boiler to heat water. Due to the coupling between the subnetworks, when the natural gas subnetwork fails, it will affect the power subnetwork and cause cascading failures of heating. Therefore, a leakage failure model of the natural gas subnetwork is built. According to the hole model of pipelines, the relationship between the leakage flow and the hole diameter is as follows [36]:
where is mass discharge rate, kg/s; is hole area, m2; is Mach number of the flow; is pressure, Pa; is molecular weight, kg/kmol; is the ideal gas constant, J/kmol·K; is temperature, K; is the ratio of specific heats.
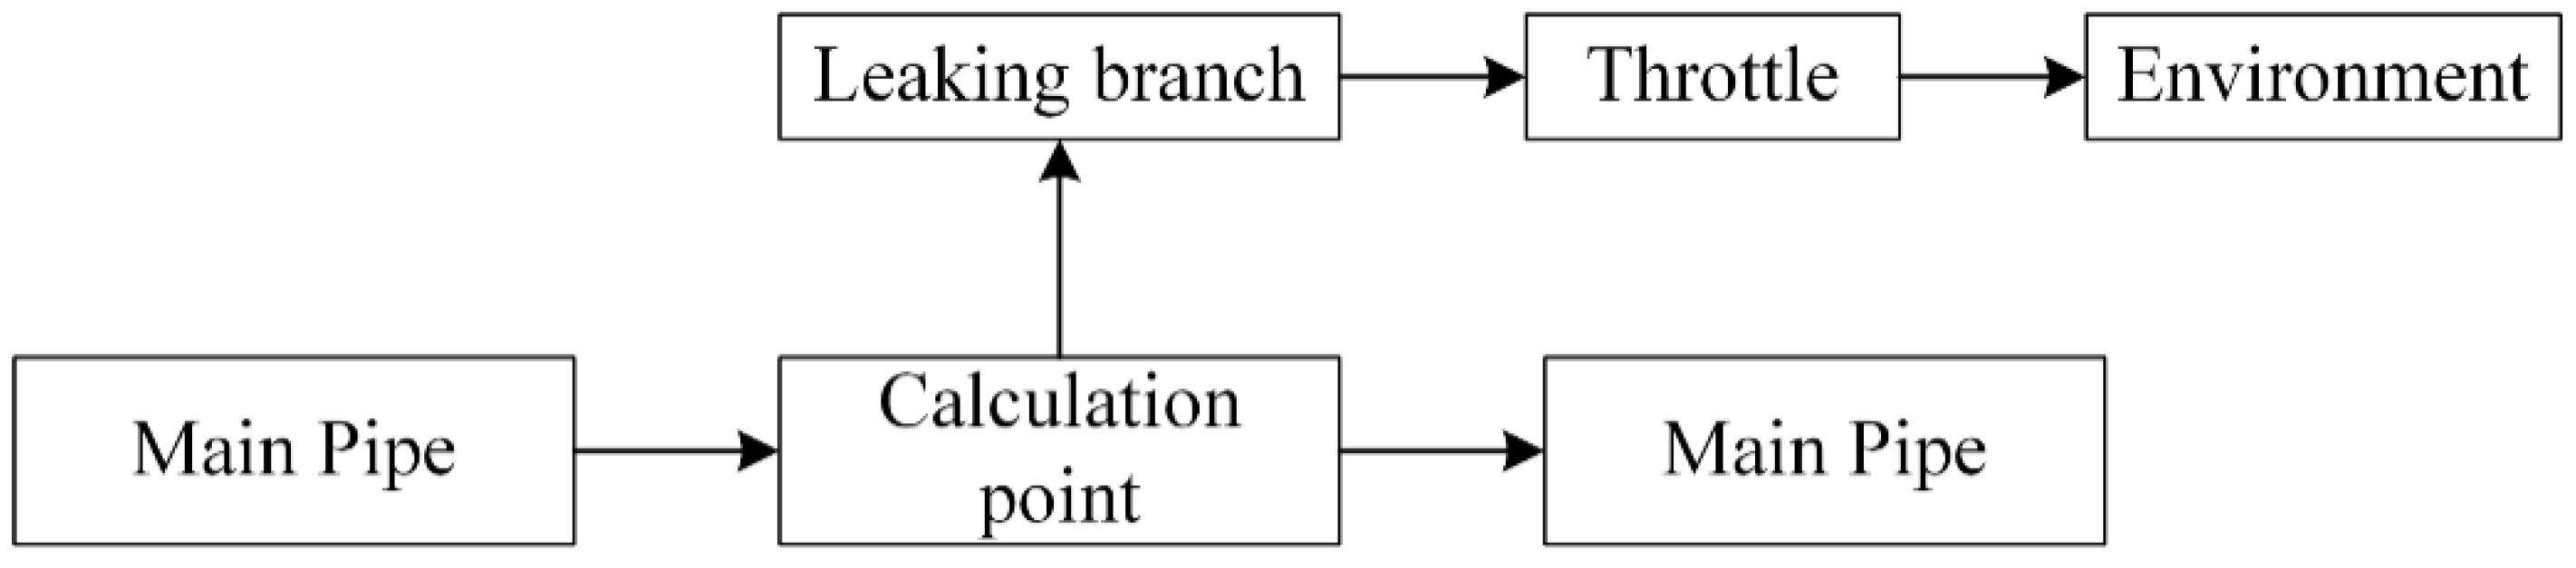
After considering the pipeline and the hole’s diameter, the leakage flow is set to be 30% of the normal flow. The leakage holes are set on the supply branches of the CHP system and the gas boiler. Due to the lack of pipeline leakage module in Apros software, a pipeline branch model is established to realize the impact of pipeline failures on the output of the IES. The model is shown in Figure 2.
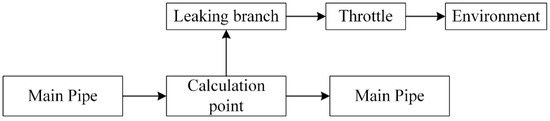
Figure 2.
Pipeline leakage model in IES.
The pipeline leakage model uses the throttle model to simulate the leakage of the main pipe. The diameter of the leaking branch and the hole in the throttle are set to ensure the leakage flow is 30% of the normal flow.
3.2. Our Robust Operation Method
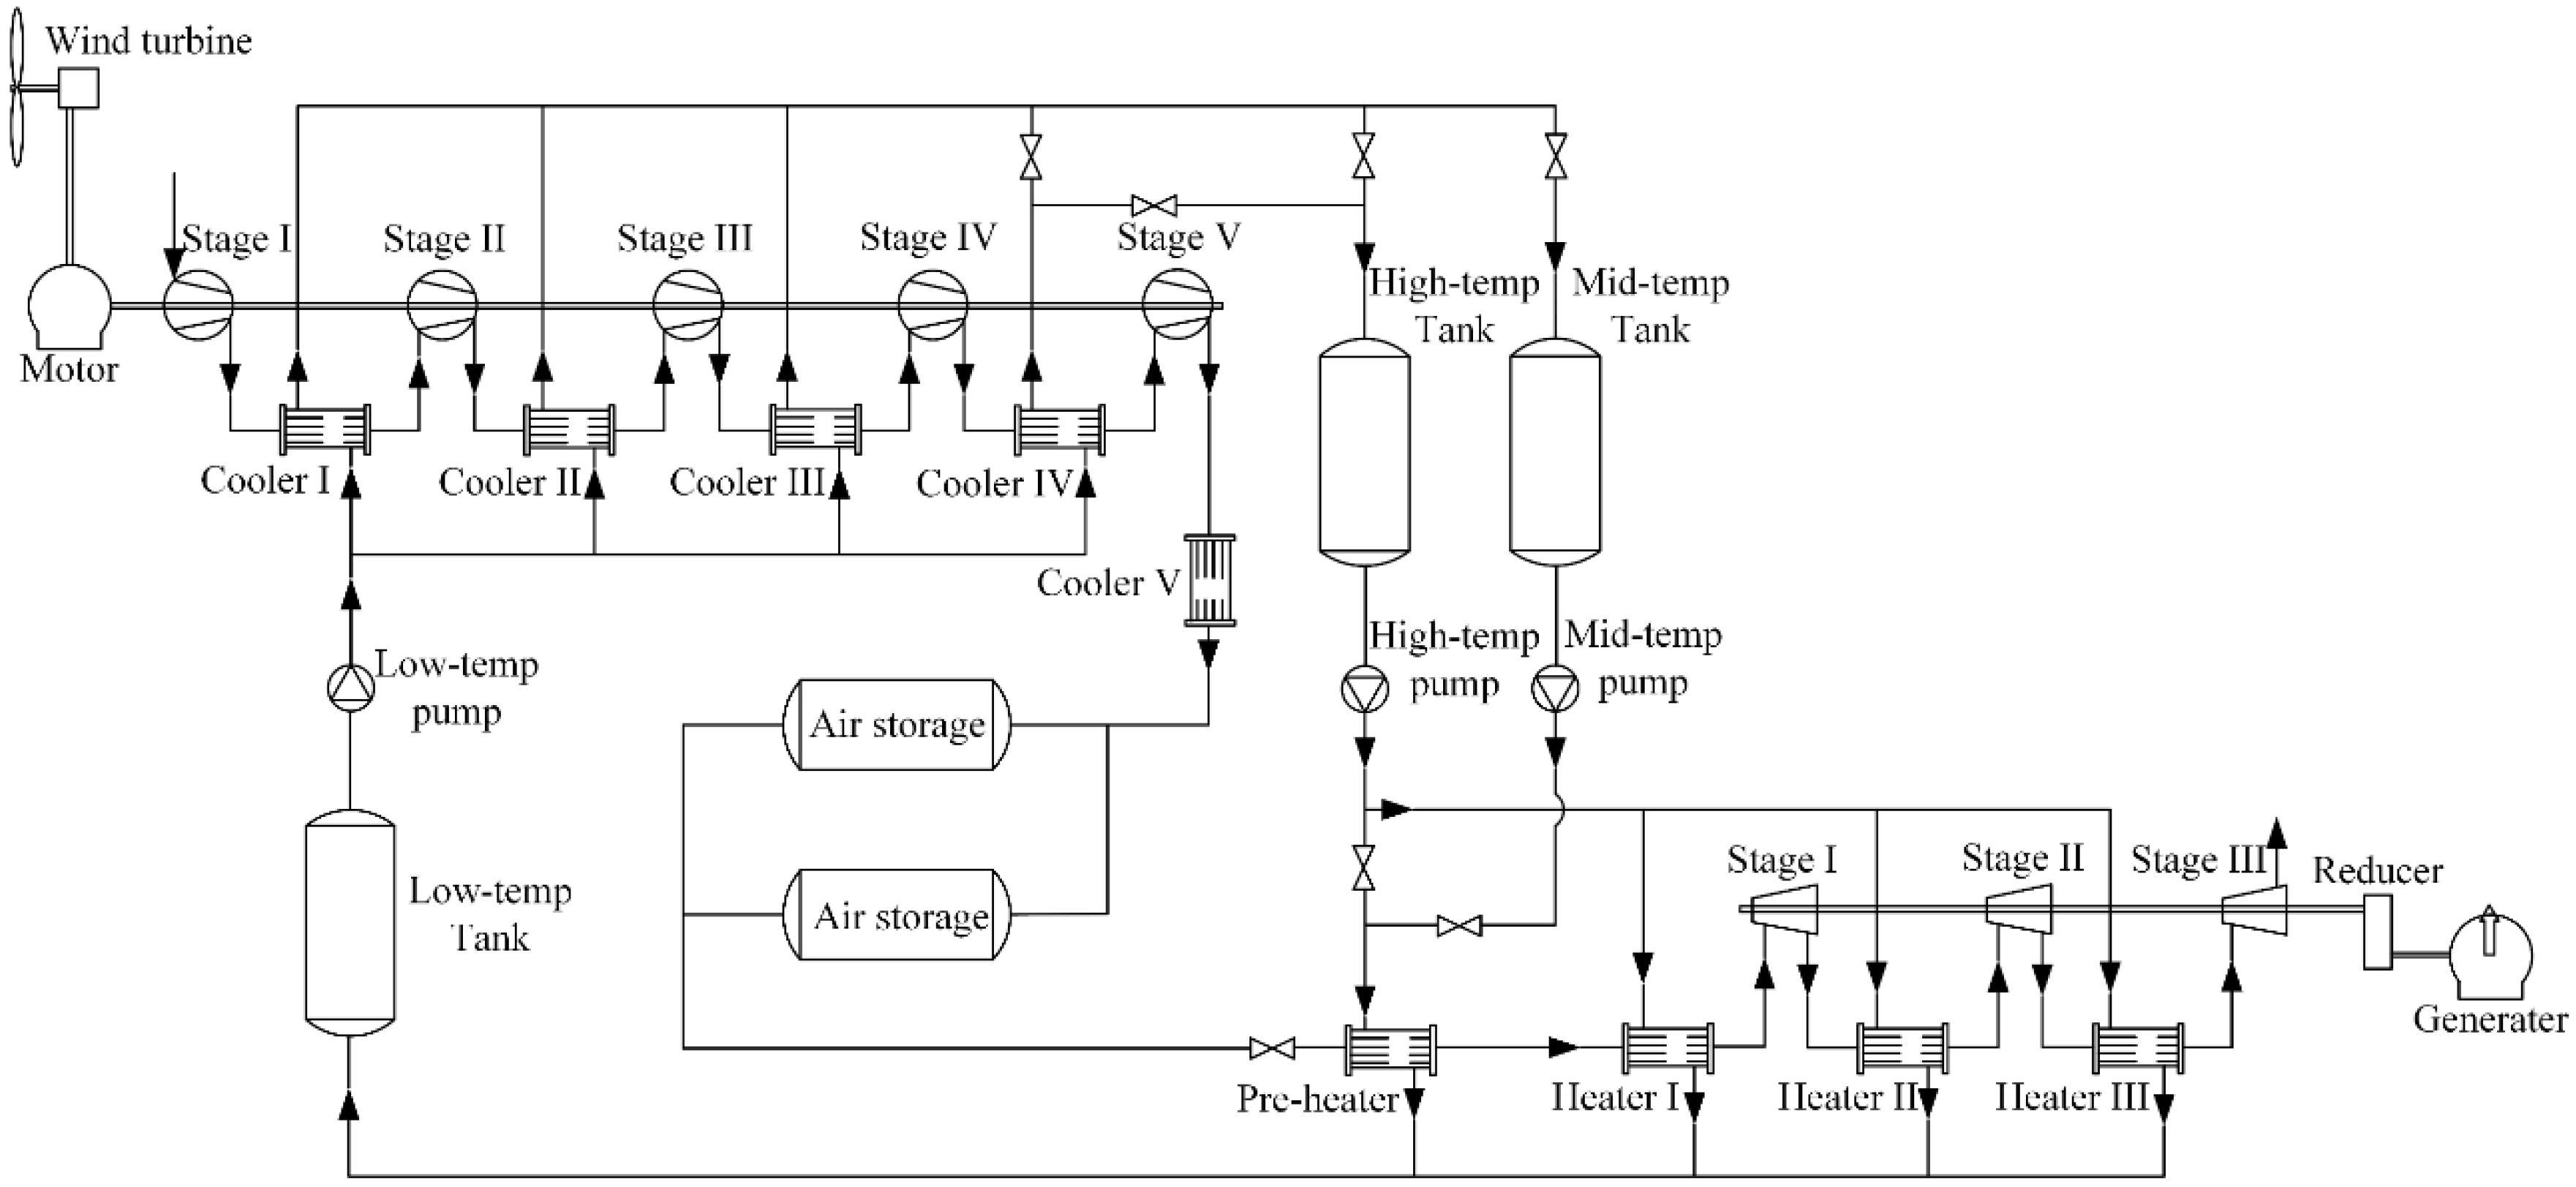
An integrated system composed of the IES and an AA-CAES is built to ensure the normal operation of the IES under failures. The equipment parameters of the AA-CAES are from TICC-500 [37]. The model of TICC-500 is shown in Figure 3. The equipment parameters are shown in Table 2.

Figure 3.
Model of TICC-500.
Table 2.
Equipment parameters of TICC-500.
The operation process of the AA-CAES can be divided into two parts: an energy store process and an energy release process. During the energy store process, the motor powered by a wind turbine drives a five-stage compressor to generate high-pressure air, and the air is stored in two air storages. Between each compressor stage, the compression heat is used to heat water that flows from the low-temp tank and is stored in the high-temp tank and the mid-temp tank. The compression heat of the last stage is discarded as it cannot heat water to the fixed temperature. During the energy release process, a three-stage air turbine uses the air to drive the generator to generate power after being slowed down by the decelerator. The intake air temperatures of the three stages in the air turbine are all designed as 100 degrees, and the air is heated in four heaters by the water stored in the high-temp tank and the mid-temp tank. After being used to heat the air, the water flows back to the low-temp tank to complete the whole cycle.
Since the stable operation of the IES under failure conditions requires simultaneous protection of power and heat subnetworks, a robust operation method using AA-CAES is formulated, as shown in Figure 4.
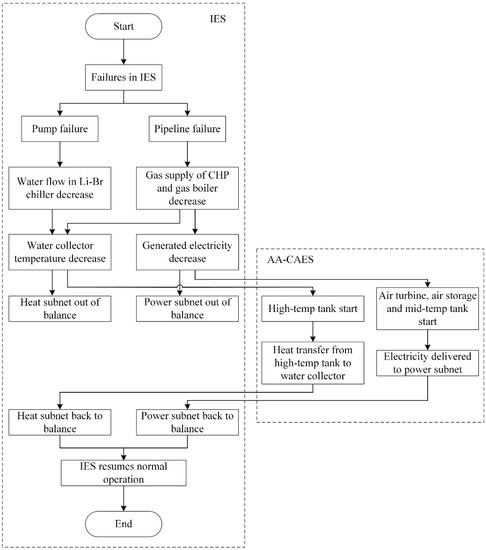
Figure 4.
A schematic diagram of robust operation method.
The energy release process of AA-CAES is split into two parts: a heat supply part and a power supply part. In the heat supply part, the water stored in the high-temp tank is used to heat the water from the water collector then flows back to the low-temp tank to complete the cycle. Meanwhile, the water in the mid-temp tank is used to heat the air in the pre-heater to ensure the fixed intake air temperature of the air turbine. In the power supply part, only the first stage of the air turbine is used to power the generator since the high-temp tank has been used. The control system monitors the temperature of the water collector and the shaft power of the CHP system to determine when to start the energy release process of the AA-CAES.
In the calculation process of the AA-CAES method, a one-dimensional unsteady homogeneous flow model is used [38]. The equation system of the model is solved using an implicit backward Euler method with a SIMPLER algorithm [39]. The proposed AA-CAES method is considered to have O (n2) computational complexity [40].
4. Simulations and Analysis of Results
The AA-CAES model and the IES model are built in Apros. To simplify the models, the assumptions of the IES model are listed in Table 3, and the assumptions of the AA-CAES model are listed in Table 4.
Table 3.
IES model assumptions.
Table 4.
AA-CAES model assumptions.
Model validation of the AA-CAES and the IES is designed to verify the accuracy of the two models. Two simulations are carried out to verify the effectiveness of the proposed AA-CAES method in balancing heat subnet and power subnet under steady conditions and economic advantages under dynamic conditions by recording the system response under failures and robust operation methods. The first simulation shows the response of IES under two failures and the response after the AA-CAES method is enabled. The second simulation compared the income of the IES with the AA-CAES method and spare gas boiler method under dynamic operation and pipeline failure conditions. The computer’s CPU used for the simulations is E5-2630 V3, and the software used is Apros 6.09.
4.1. Model Validation
4.1.1. AA-CAES Model
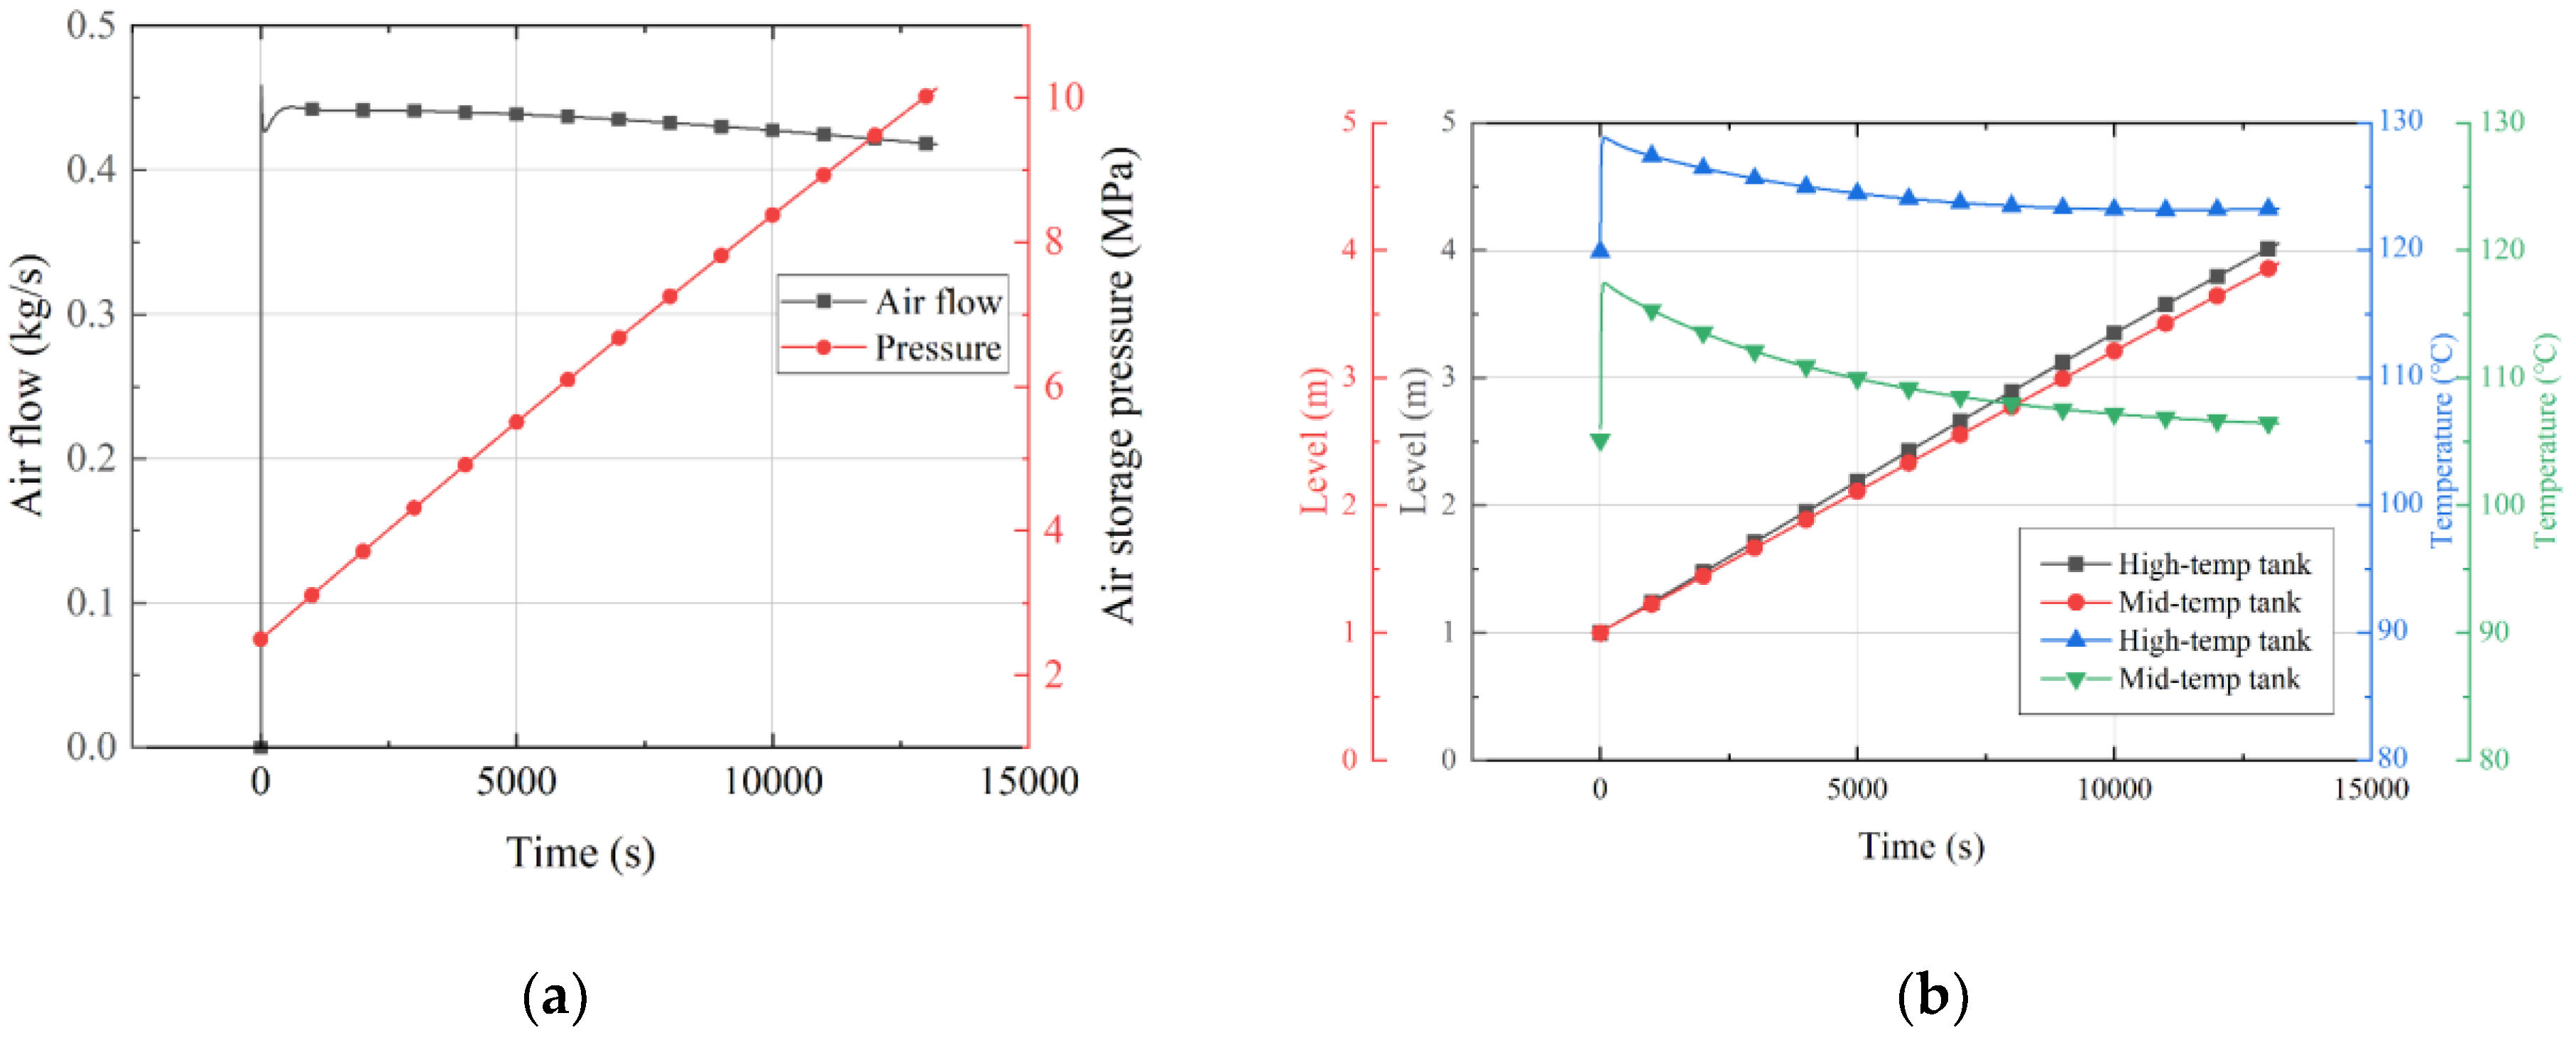
Figure 5 shows the result of the AA-CAES model’s energy storage process. The mass flow of the air is set to 1667 kg/h to match the design value of TICC-500. The initial pressure of the air storage was set to 2.5 MPa to match the lower limit of the air storage pressure. Figure 5a shows that the air storage pressure rises linearly during the energy storage process, consistent with the experimental results of TICC-500 [37]. Due to the lack of experimental parameters of the tanks, it is hard to verify whether the simulated value of the high-temp tank and the mid-temp tank is consistent with the experimental value. However, Figure 5b shows that the high-temp tank and the mid-temp tank already have the heating capacity, so it can be considered that the AA-CAES model has been verified.
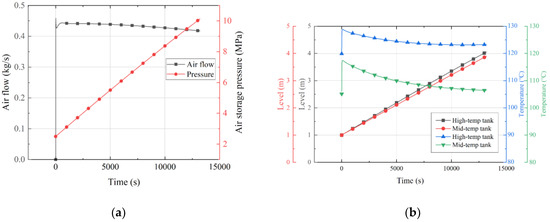
Figure 5.
Energy storage process of the AA-CAES model. (a) air storage; (b) tanks.
4.1.2. IES Model
Figure 6 shows the result of the IES model’s dynamic operation. The power of the CHP system and the gas boiler is set to maximum, and the power of the GSHP is controlled to meet the heat demand. The results show that the error between the heat supply of the IES model and the actual heat supply is less than 10%. After removing the period when the heat supply changes drastically, the error of the IES model is less than 5%. The accuracy of the IES model has been verified.
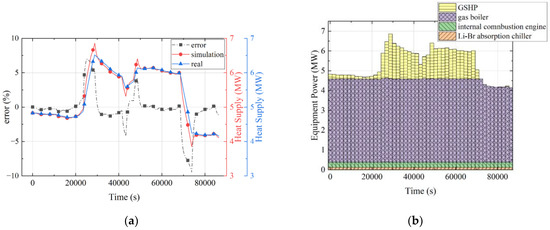
Figure 6.
Dynamic operation of the IES model. (a) heat load; (b) equipment power.
4.2. Simulation of IES under Steady Conditions
The heat demand of the IES is 7 MW, and all equipment runs at designed power. The power generated has a surplus of 89 kW under steady conditions. The temperature of the water collector is recorded from “Temperature” of “Horizontal Tank” in Apros software, the heat supply of the IES is recorded from “Average heat flow on tube surfaces” of “Counter Current Heat Exchanger”, and the power of the purchased electricity is recorded from “Produced active power” of “Elec. Generator”.
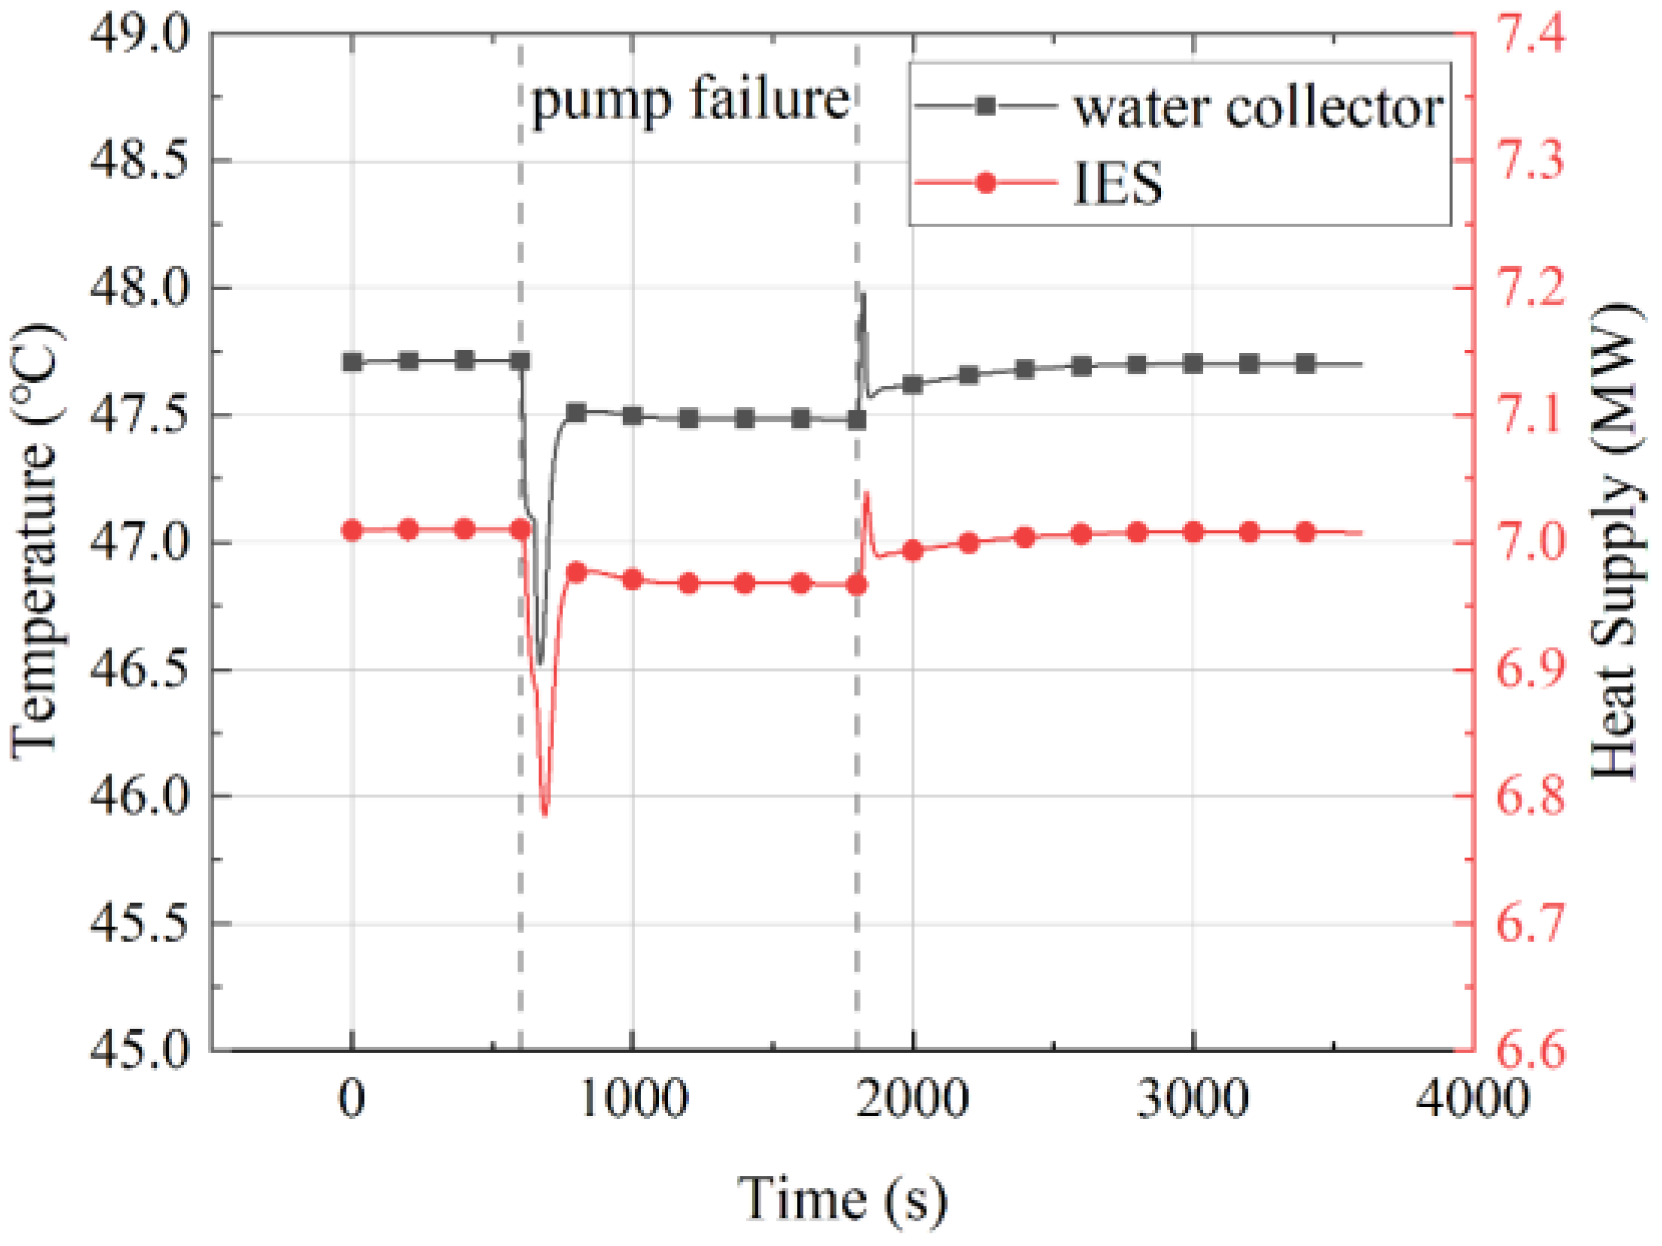
Figure 7 shows the heat and power subnetworks response of the IES during the pump failure period. The failure was set to 600 s to ensure the failure occurs in the IES during stable operation, and the total simulation time was 3600 s. During the pump failure period, the flue gas generated by the CHP system cannot be used to heat water. Therefore, the temperature of the water collector decreased from 47.7 °C to 45.6 °C, which reduces the heat supply from 7 MW to 6.62 MW. Since the CHP system generates electricity, the pump failure had no impact on the power subnetwork. The negative electricity purchase in Figure 7b indicates a surplus of electricity in the IES, and there is no need to purchase electricity from the external network.
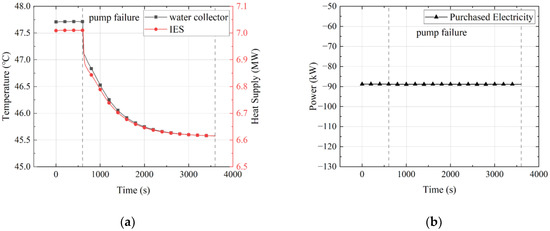
Figure 7.
Response of the IES during pump failure period. (a) heat subnet; (b) power subnet.
Figure 8 shows the heat and power subnetworks response of the IES with AA-CAES method during the pump failure period. The failure was set to appear in the 600 s and was eliminated in the 1800 s to meet the maximum energy release period of the AA-CAES, and the total simulation time is 3600 s. When the pump failure was detected, the high-temperature water stored in the high-temp tank of the AA-CAES released to heat the water in the water collector of the IES to maintain the normal heat supply. The water collector temperature was kept above 47.5 °C and the heat supply was kept above 6.95 MW during the failure period. After the failure, the temperature of the water collector rose, the AA-CAES was closed, and the IES returned to a stable operation state. The integration of the IES and the AA-CAES kept the balance of the heat subnetwork, ensuring that the pump failure will not have an excessive impact on the IES.
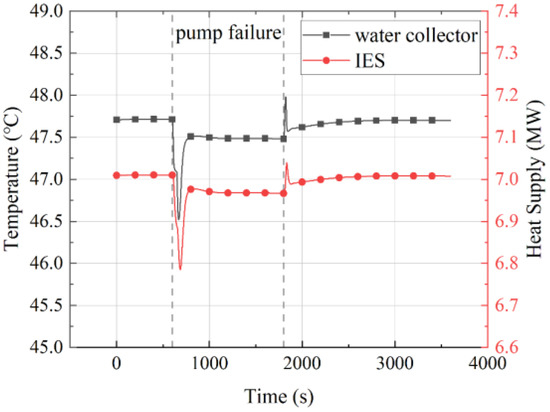
Figure 8.
Heat subnet response of the IES with the AA-CAES method.
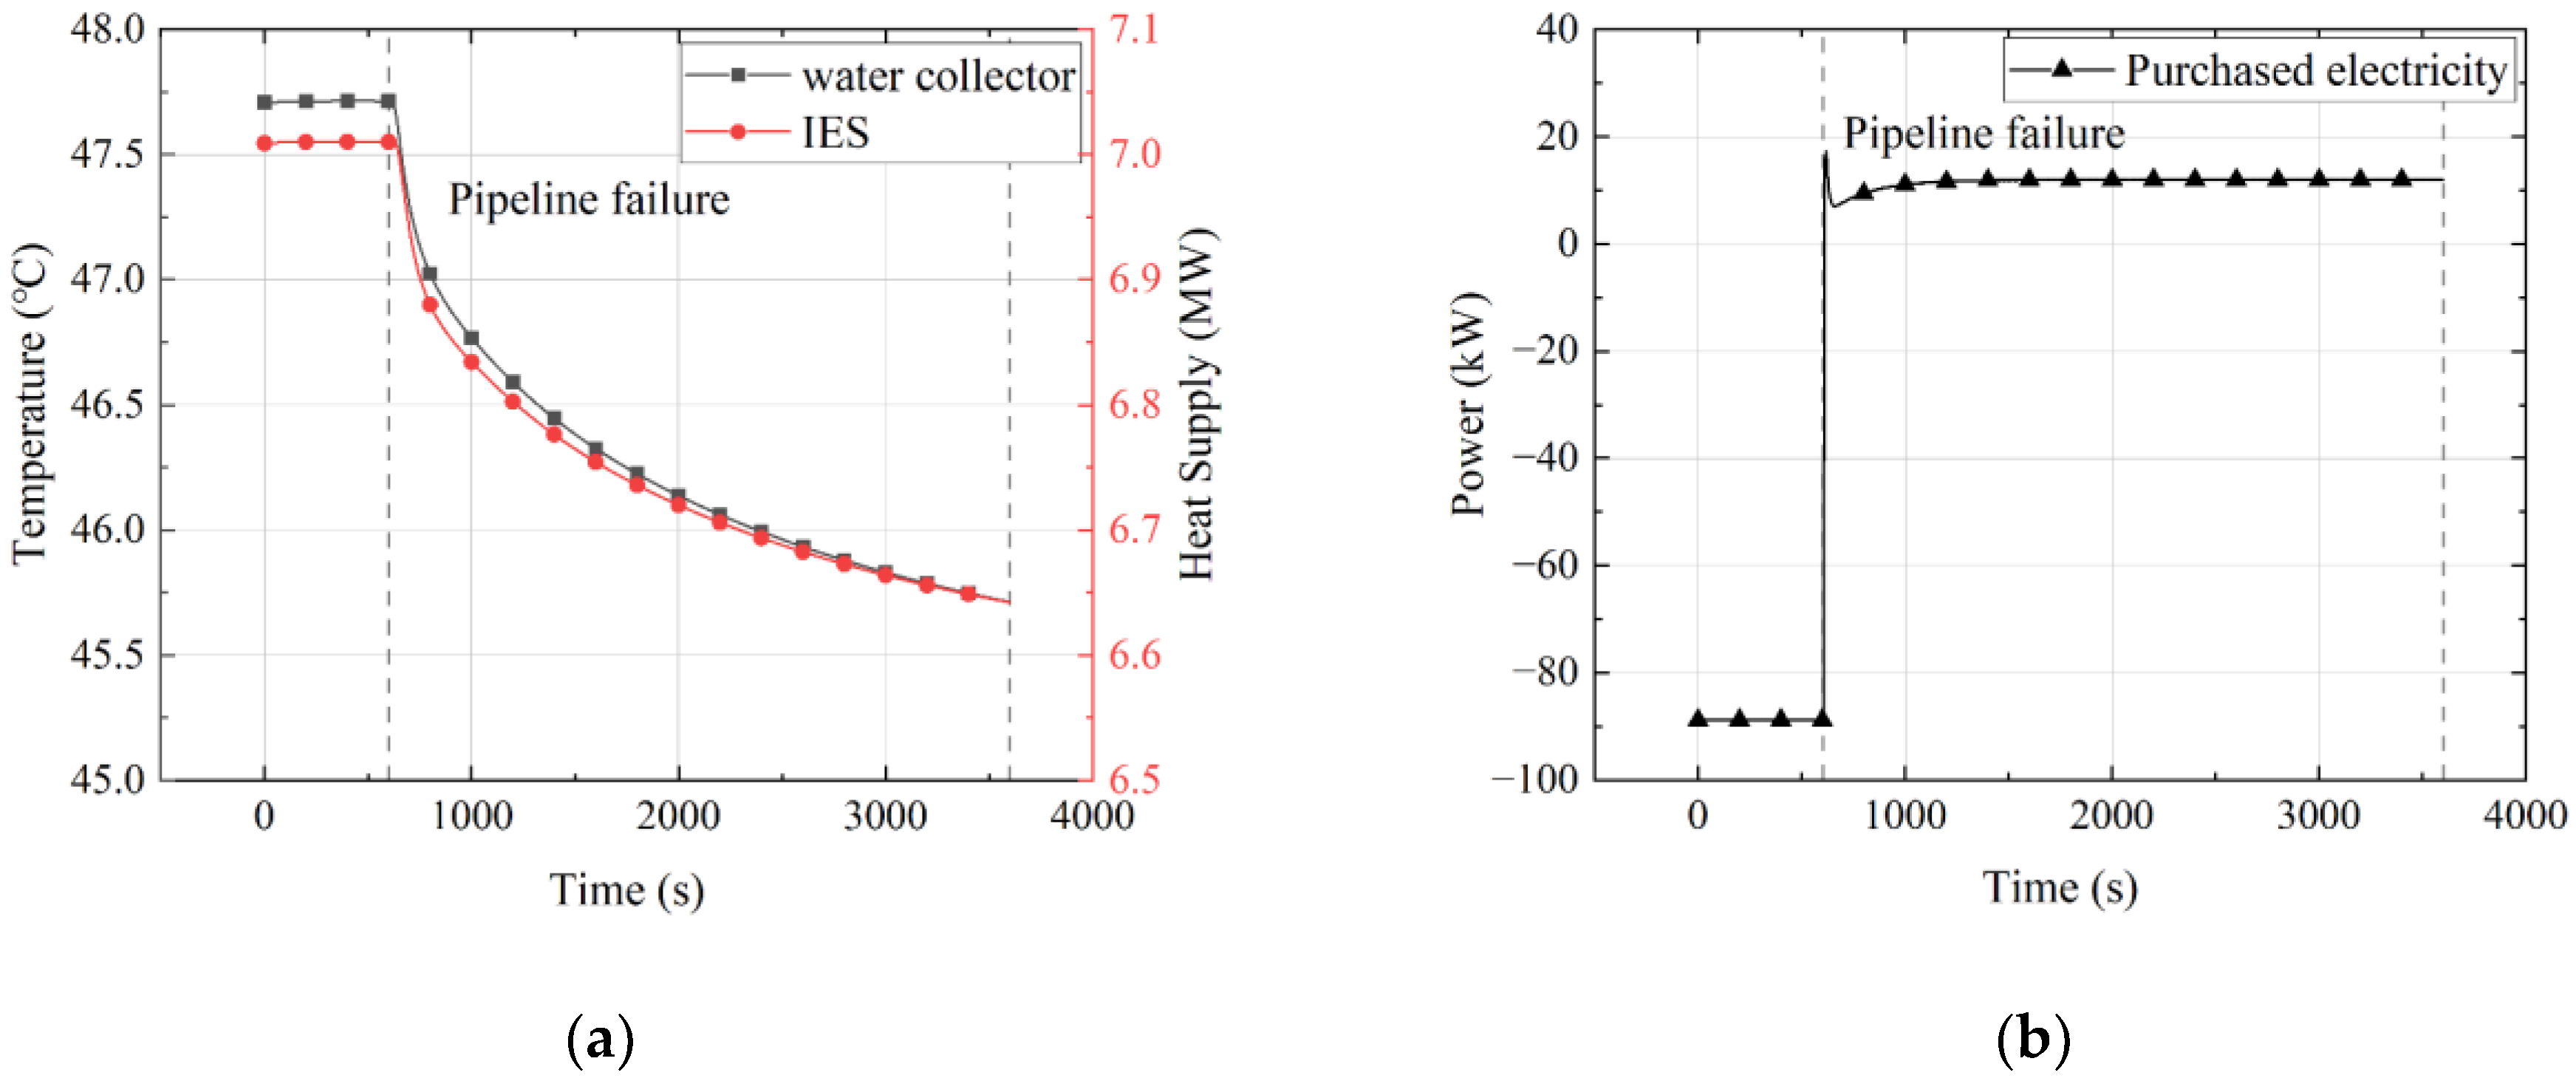
Figure 9 shows the heat and power subnetworks response of the IES during the pipeline failure period. The failure was set to 600 s, and the total simulation time was 3600 s. Unlike the pump failure, the pipeline failure caused a reduction in the fuel of the gas boiler and the CHP system, which led the temperature of the water collector to decrease from 47.7 °C to 45.7 °C and heat supply to reduce from 7 MW to 6.65 MW. The IES purchased 10 kW from the external network to keep the balance of the power subnet.
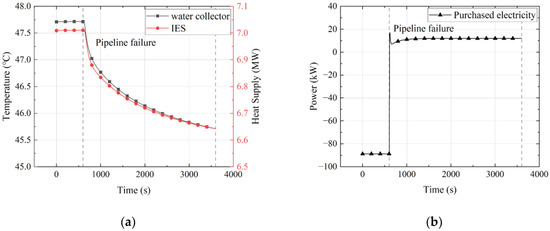
Figure 9.
Response of the IES during pipeline failure period. (a) heat subnet; (b) power subnet.
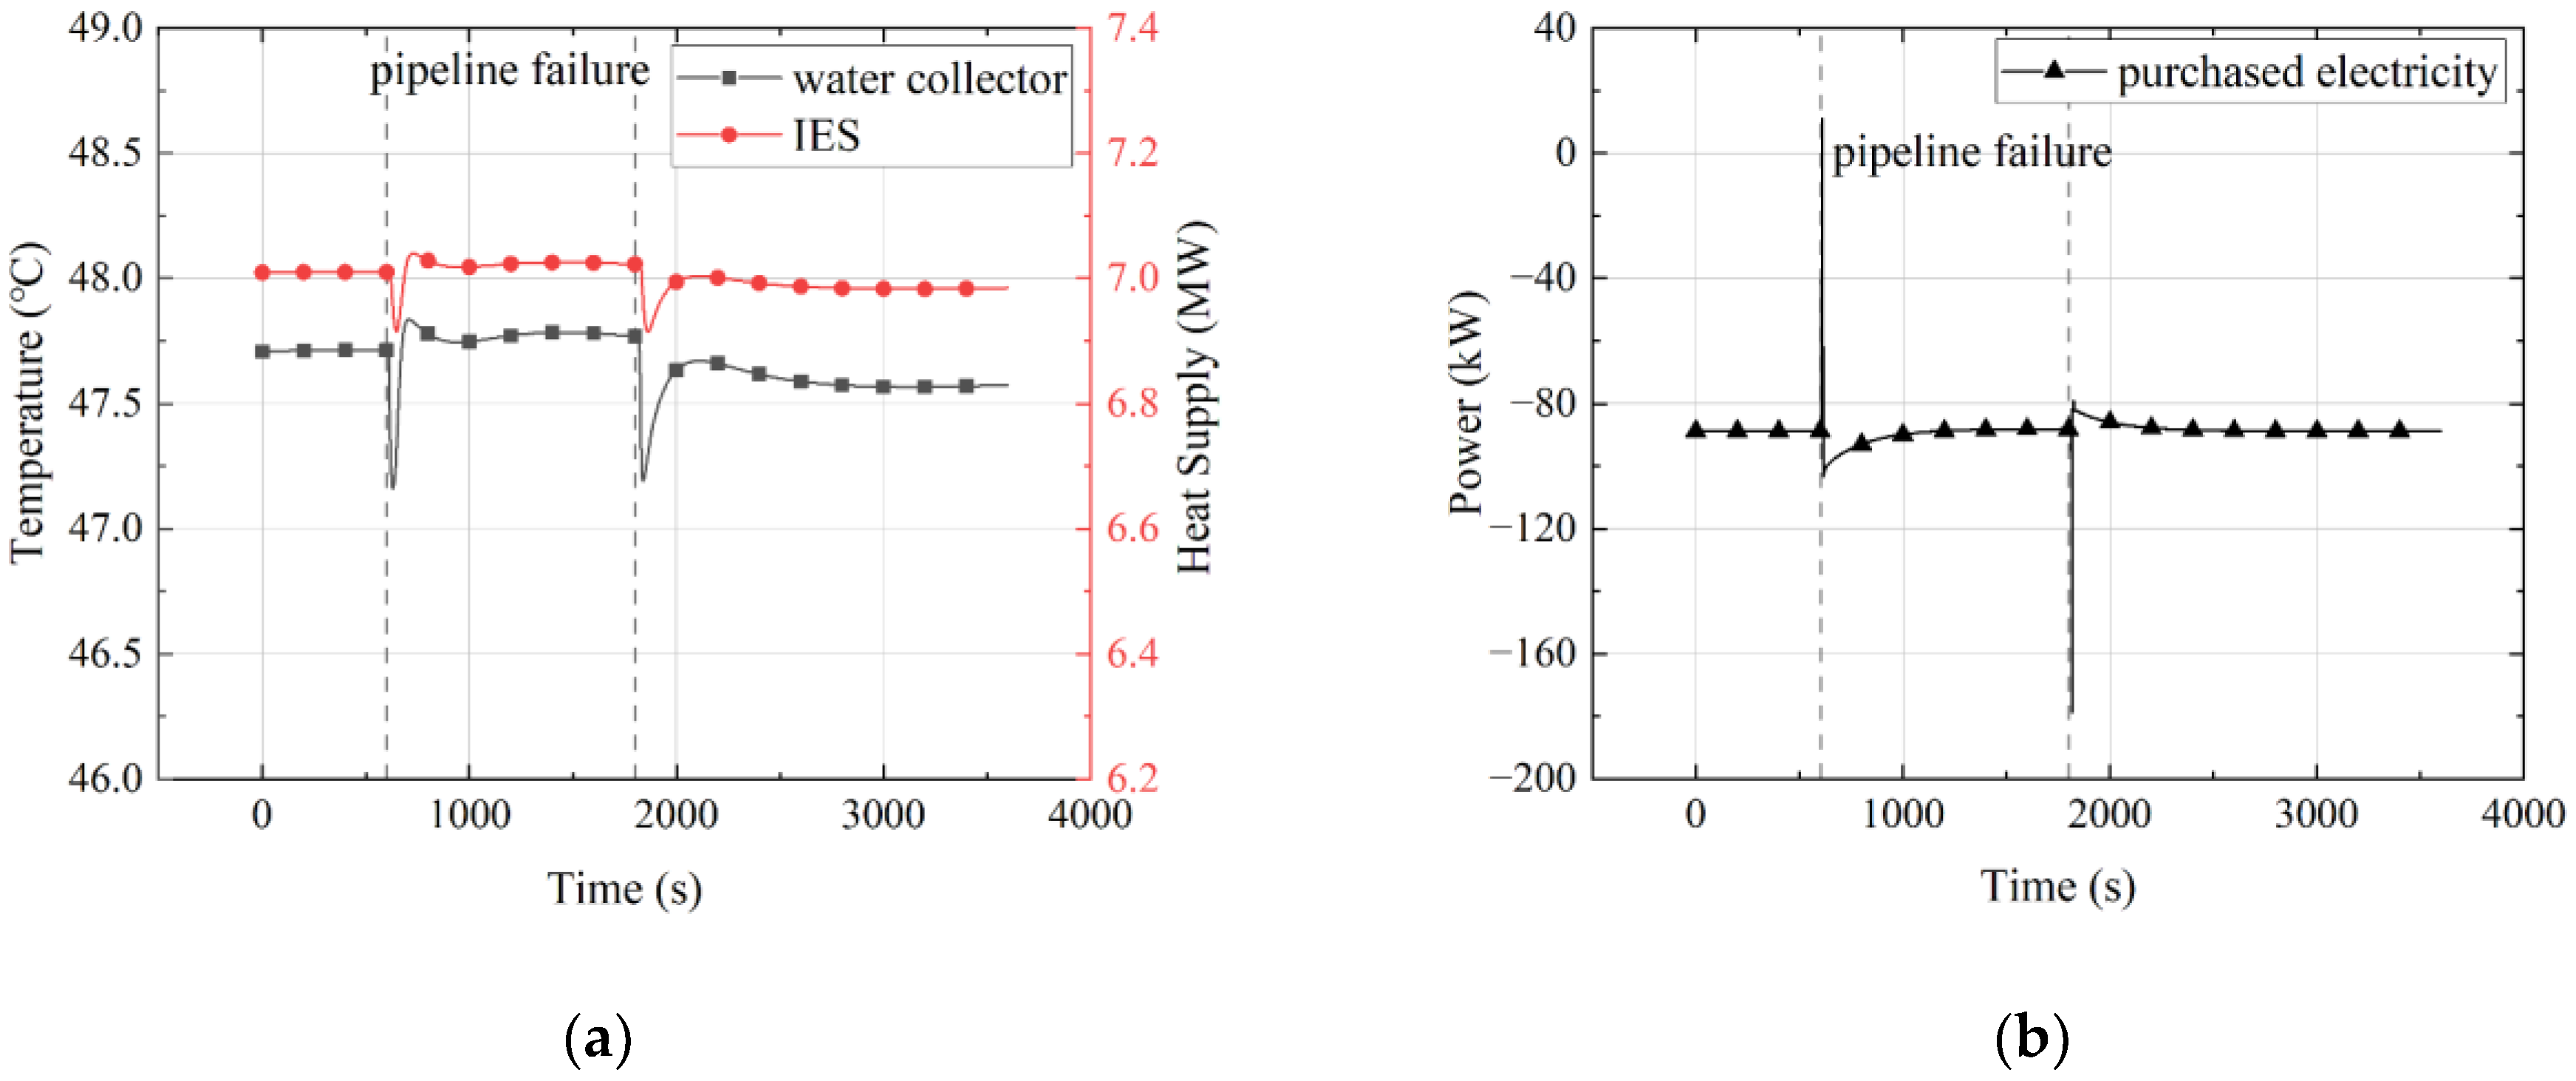
Figure 10 shows the heat and power subnetworks response of the IES with AA-CAES method during the pipeline failure period. The failure was set to appear in the 600 s and was eliminated in the 1800 s, and the total simulation time was 3600 s. When the pipeline failure was detected, the control system opened the high-temp tank and started the discharging process of the AA-CAES to deliver heat and electric power to the IES. During the pipeline failure period, the water collector’s temperature was maintained at 47.7 °C, and the IES generated a surplus of electric power about 90 kW, which was consistent with the normal operation of the IES. After the failure was eliminated, the AA-CAES was shut down, and the IES gradually returned to normal operation.

Figure 10.
Response of IES with the AA-CAES method. (a) heat subnet; (b) power subnet.
4.3. Simulation of IES under Dynamic Conditions
4.3.1. Operation of the IES during Failure Period
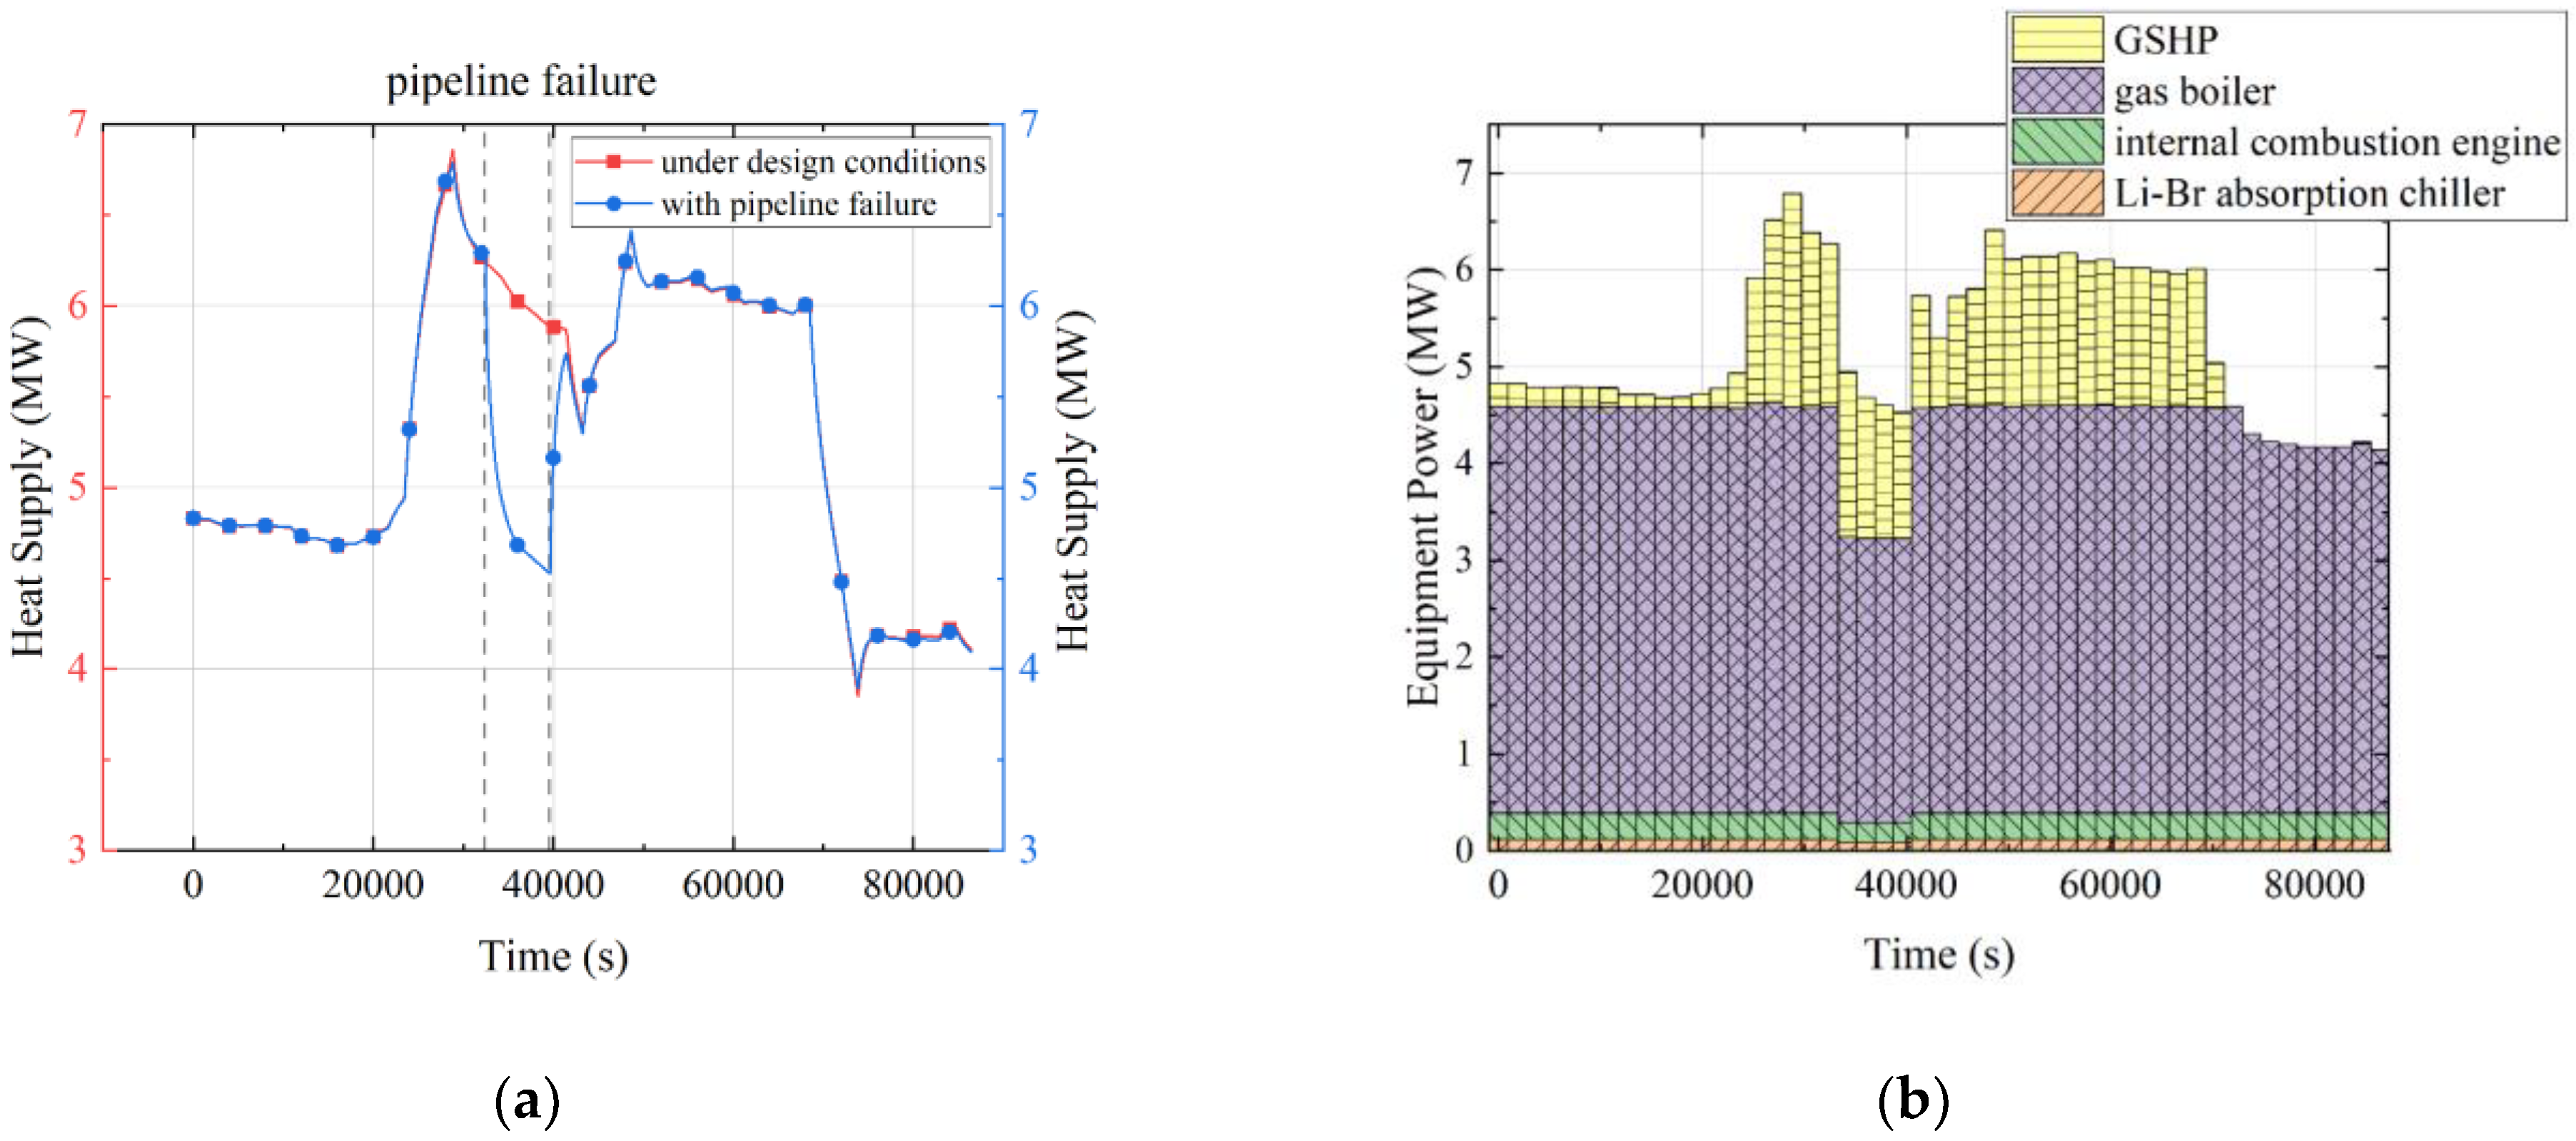
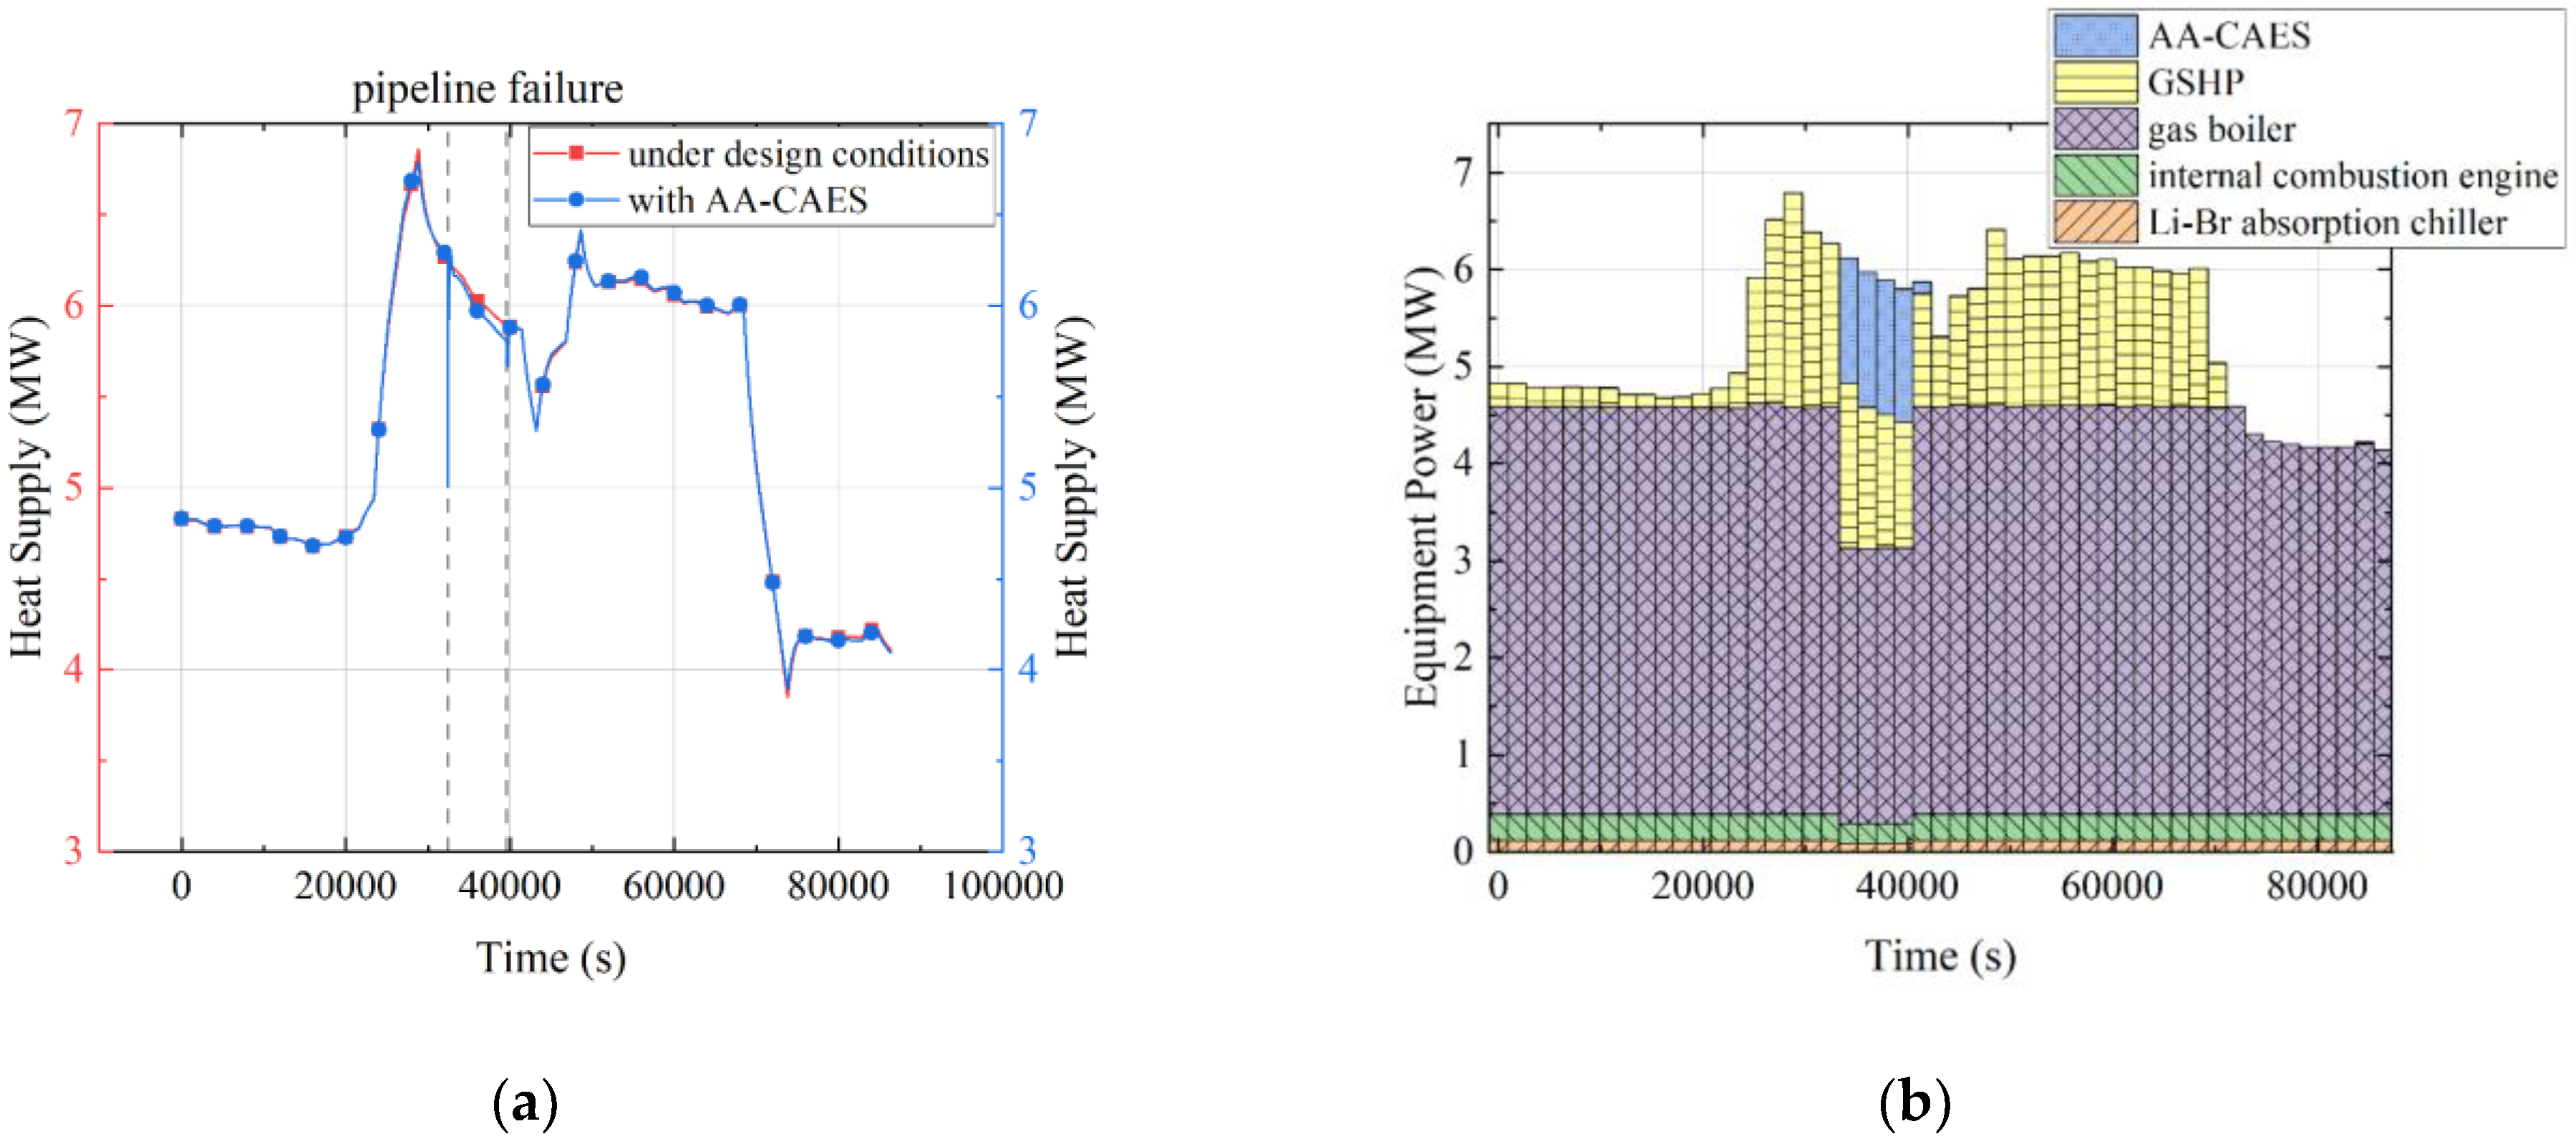
Since the power of the Li-Br absorption chiller is 275 kW under dynamic conditions, which accounts for less than 5% of the IES heat supply, the pump failure will not have much impact on the heat supply of the IES. According to this, only the pipeline failure is considered in the dynamic operation of the IES. The failure is set to appear at 9 o’clock (32,400 s) and is eliminated at 11 o’clock (39,600 s). The total operation time is 24 h (86,400 s). The heat supply of the IES and power of equipment are recorded from “Average heat flow on tube surfaces” of “Counter Current Heat Exchanger” in Apros. The result of the IES operation under pipeline failure is shown in Figure 11.

Figure 11.
Dynamic response of IES during pipeline failure period. (a) heat supply; (b) equipment power.
The pipeline failure resulted in a power decrease of the gas boiler and the CHP system. The power of the GSHP remained the same as normal since the IES purchased electricity from the external network, but the power of the gas boiler and the CHP system decreased because of the lack of gas.
The two robust operation methods were initiated to eliminate the impact of the pipeline failure on the IES. The results of the IES operation with two methods under pipeline failure conditions are shown in Figure 12 and Figure 13.
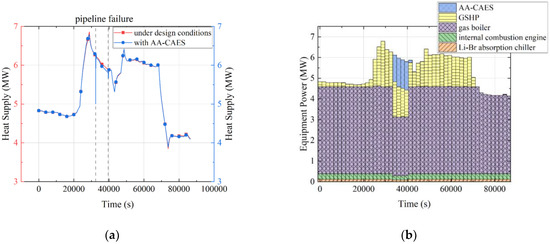
Figure 12.
Dynamic response of IES with AA-CAES method. (a) heat supply; (b) equipment power.
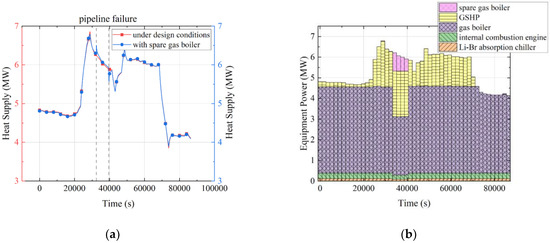
Figure 13.
Dynamic response of IES with spare gas boiler method. (a) heat supply; (b) equipment power.
During the IES operation under pipeline failure conditions, the heat supply results using two methods both met the heat demand. In the method using AA-CAES, the water level of the high-temp tank dropped from the highest level to the lowest level during the failure, which means two hours is the maximum thermal energy release period of the AA-CAES under the simulated conditions. The decrease of the IES’s heat supply with AA-CAES at 11 o’clock (39,600 s) in Figure 12a can also prove this. In the method using the spare gas boiler, the GSHP was set to maximum power during the failure while the power of the spare gas boiler was controlled to meet the heat demand. As there is no limit in the spare gas boiler method such as the water level of the tanks, the heat supply of the IES with the spare gas boiler was maintained as normal in Figure 13a.
4.3.2. Economic Analysis
The local electric price is CNY 0.94 per kWh, the gas price is CNY 3.12 per cubic meter, and the heating income is CNY 100 per GJ. The dynamic operating income of the IES in one day with the two robust operation methods is calculated as shown in Table 5.
Table 5.
Dynamic operating income of the IES.
During the dynamic operation, both robust operation methods using AA-CAES and spare gas boiler can guarantee the stable operation of the IES. In terms of the dynamic operating income, the income of the AA-CAES robust operation method is CNY 1036.96 higher than the income of the spare gas boiler method. The result verifies the possibility of the integrated operation of IES and AA-CAES, and it also reflects the economic advantage of using the AA-CAES robust operation method during the pipeline failure period.
5. Conclusions
An integrated system composed of an IES and an AA-CAES is built to realize stable and safe operation under equipment and pipeline failures. The steady and dynamic simulations of the IES during pump failure and pipeline failure are simulated. A robust operation method using AA-CAES is proposed and used in the steady and dynamic operations of IES. Another method using spare gas boiler is proposed to compare the income of the IES in the dynamic operation with two methods. The result showed that:
- The pump failure under steady conditions affected the heat subnet of the IES, which caused the heat supply of the IES to drop from 7 MW to 6.62 MW. The pipeline failure affected both heat and power subnets of the IES, which caused the heat supply of the IES to drop from 7 MW to 6.65 MW and the additional 10 kW purchased power.
- The operation method using AA-CAES guaranteed the robust operation of the IES during failure periods. The heat supply of the IES was kept above 6.95 MW while the surplus of electric power was kept above 90 kW, which proved the effectiveness of the joint operation of the AA-CAES and the IES in ensuring the robust operation of the IES.
- In the dynamic operation of the IES, both methods using AA-CAES and spare gas boiler ensured safe and stable operation during the failure period. The income of the AA-CAES method was a bit higher (RMB 1036.96) than the income of the spare gas boiler method, which verified the advantage of AA-CAES for the robust operation of the IES.
- Although the AA-CAES is effective in realizing the robust operation of the IES, the output power of the AA-CAES needs to be precisely controlled in the joint operation. Since the energy storage process of the AA-CAES stores both electricity and heat, simultaneous electricity and heat release is suggested.
Author Contributions
Conceptualization, R.X.; methodology, R.X. and W.L.; software, W.L.; validation, R.X., W.L. and M.C.; formal analysis, M.C.; investigation, R.X., W.L. and M.C.; resources, R.X. and Y.S.; data curation, R.X.; writing—original draft preparation, R.X. and W.L.; writing—review and editing, Y.S.; visualization, W.L. and M.C.; supervision, R.X. and Y.S.; project administration, R.X. and Y.S.; funding acquisition, R.X. All authors have read and agreed to the published version of the manuscript.
Funding
This research was funded by the National Key R&D Program of China, grant number 2017YFA0700300.
Institutional Review Board Statement
Not applicable.
Informed Consent Statement
Not applicable.
Data Availability Statement
Not applicable.
Conflicts of Interest
The authors declare no conflict of interest.
Abbreviations
| IES | Integrated energy system |
| CAES | Compressed air energy storage |
| A-CAES | Adiabatic compressed air energy storage |
| AA-CAES | Advanced adiabatic compressed air energy storage |
| TES | Thermal energy storage |
| GSHP | Ground source heat pump |
| CHP | Combined heat and power |
| Li-Br | Lithium bromide |
References
- Rathor, S.K.; Saxena, D. Energy Management System for Smart Grid: An Overview and Key Issues. Int. J. Energy Res. 2020, 44, 1–43. [Google Scholar] [CrossRef]
- Li, J.; Liu, J.; Yan, P.; Li, X.; Zhou, G.; Yu, D. Operation Optimization of Integrated Energy System under a Renewable Energy Dominated Future Scene Considering Both Independence and Benefit: A Review. Energies 2021, 14, 1103. [Google Scholar] [CrossRef]
- Ren, G.; Wan, J.; Liu, J.; Yu, D.; Söder, L. Analysis of Wind Power Intermittency Based on Historical Wind Power Data. Energy 2018, 150, 482–492. [Google Scholar] [CrossRef]
- Garacía Vera, Y.E.; Dufo-López, R.; Bernal-Agustín, J.L. Energy Management in Microgrids with Renewable Energy Sources: A Literature Review. Appl. Sci. 2019, 9, 3854. [Google Scholar] [CrossRef] [Green Version]
- Zia, M.F.; Elbouchikhi, E.; Benbouzid, M. Microgrids Energy Management Systems: A Critical Review on Methods, Solutions, and Prospects. Appl. Energy 2018, 222, 1033–1055. [Google Scholar] [CrossRef]
- Hu, X.; Zhang, H.; Chen, D.; Li, Y.; Wang, L.; Zhang, F.; Cheng, H. Multi-objective Planning for Integrated Energy Systems Considering Both Exergy and Economy. Energy 2020, 197, 117155. [Google Scholar] [CrossRef]
- Zhao, J.; Chen, L.; Wang, Y.; Liu, Q. A Review of System Modeling Assessment and Operational Optimization for Integrated Energy Systems. Sci. China Inf. Sci. 2021, 64, 191201. [Google Scholar] [CrossRef]
- Xu, Y.; Yan, C.; Liu, H.; Wang, J.; Yang, Z.; Jiang, Y. Smart Energy Systems: A Critical Review on Design and Operation Optimization. Sustain. Cities Soc. 2020, 62, 102369. [Google Scholar] [CrossRef]
- Pan, Y.; Mei, F.; Zhou, C.; Shi, T.; Zheng, J. Analysis on Integrated Energy System Cascading Failures Considering Interaction of Coupled Heating and Power Networks. IEEE Access 2019, 7, 89752–89765. [Google Scholar] [CrossRef]
- Li, Z.; Wang, Z.; Fu, Y.; Zhao, N. Energy Supply Reliability Assessment of the Integrated Energy System Considering Complementary and Optimal Operation during Failure. IET Gener. Transm. Distrib. 2021, 15, 1897–1907. [Google Scholar] [CrossRef]
- Moslehi, S.; Reddy, A. Sustainability of Integrated Energy Systems: A Performance-based Resilience Assessment Methodology. Appl. Energy 2018, 228, 487–498. [Google Scholar] [CrossRef]
- Benjamin, M.F.D.; Tan, R.R.; Razon, L.F. A Methodology for Criticality Analysis in Integrated Energy Systems. Clean Technol. Environ. Policy 2015, 17, 935–946. [Google Scholar] [CrossRef]
- Dehghani, M.; Ghiasi, M.; Niknam, T.; Ghadimi, N.; Taghizadeh-Hesary, F. Blockchain-Based Securing of Data Exchange in a Power Transmission System Considering Congestion Management and Social Welfare. Sustainability 2021, 13, 90. [Google Scholar] [CrossRef]
- Budt, M.; Wolf, D.; Span, R.; Yan, J. A Review on Compressed Air Energy Storage: Basic Principles, Past milestones and Recent Developments. Appl. Energy 2016, 170, 250–268. [Google Scholar] [CrossRef]
- Zhou, Q.; Du, D.; Lu, C.; He, Q.; Liu, W. A Review of Thermal Energy Storage in Compressed Air Energy Storage System. Energy 2019, 188, 115993. [Google Scholar] [CrossRef]
- Venkataramani, G.; Parankusam, P.; Ramalingam, V.; Wang, J. A Review on Compressed Air Energy Storage—A Pathway for Smart Grid and Polygeneration. Renew. Sustain. Energy Rev. 2016, 62, 895–907. [Google Scholar] [CrossRef]
- Razmi, A.R.; Soltani, M.; Ardehali, A.; Gharali, K.; Dusseault, M.B.; Nathwani, J. Design, Thermodynamic, and Wind Assessments of a Compressed Air Energy Storage (CAES) Integrated with Two Adjacent Wind Farms: A Case Study at Abhar and Kahak Sites, Iran. Energy 2021, 221, 119902. [Google Scholar] [CrossRef]
- Mucci, S.; Bischi, A.; Briola, S.; Baccioli, A. Small-scale Adiabatic Compressed Air Energy Storage: Control Strategy Analysis via Dynamic Modelling. Energy Convers. Manag. 2021, 243, 114358. [Google Scholar] [CrossRef]
- Kaiser, F.; Weber, R.; Krüger, U. Thermodynamic Steady-State Analysis and Comparison of Compressed Air Energy Storage (CAES) Concepts. Int. J. Thermodyn. 2018, 21, 144–156. [Google Scholar] [CrossRef]
- Jiang, R.; Cai, Z.; Peng, K.; Yang, M. Thermo-economic Analysis and Multi-objective Optimization of Polygeneration System Based on Advanced Adiabatic Compressed Air Energy Storage System. Energy Convers. Manag. 2021, 229, 113724. [Google Scholar] [CrossRef]
- Yin, B.; Li, Y.; Miao, S.; Lin, Y.; Zhao, H. An Economy and Reliability Co-optimization Planning Method of Adiabatic Compressed Air Energy Storage for Urban Integrated Energy System. J. Energy Storage 2021, 40, 102691. [Google Scholar] [CrossRef]
- Du, R.; He, Y.; Chen, H.; Xu, Y.; Li, W.; Deng, J. Performance and Economy of Trigenerative Adiabatic Compressed Air Energy Storage System Based on Multi-parameter Analysis. Energy 2022, 238, 121695. [Google Scholar] [CrossRef]
- Olabi, A.G.; Wilberforce, T.; Ramadan, M.; Abdelkareem, M.A.; Alami, A.H. Compressed Air Energy Systems: Components and Operating Parameters—A Review. J. Energy Storage 2021, 34, 102000. [Google Scholar] [CrossRef]
- Mousavi, S.B.; Adib, M.; Soltani, M.; Razmi, A.R.; Nathwani, J. Transient Thermodynamic Modeling and Economic Analysis of an Adiabatic Compressed Air Energy Storage (A-CAES) Based on Cascade Packed Bed Thermal Energy Storage with Encapsulated Phase Change Materials. Energy Convers. Manag. 2021, 243, 114379. [Google Scholar] [CrossRef]
- Yang, D.; Wang, M.; Yang, R.; Zheng, Y.; Pandzic, H. Optimal Dispatching of an Energy System with Integrated Compressed Air Energy Storage and Demand Response. Energy 2021, 234, 121232. [Google Scholar] [CrossRef]
- Wang, H.; Zhang, C.; Li, K.; Ma, X. Game Theory-based Multi-agent Capacity Optimization for Integrated Energy Systems with Compressed Air Energy Storage. Energy 2021, 221, 119777. [Google Scholar] [CrossRef]
- Hemmati, M.; Mirzaei, M.A.; Abapour, M.; Zare, K.; Mohammadi-ivatloo, B.; Mehrjerdi, H.; Marzband, M. Economic-environmental Analysis of Combined Heat and Power-based Reconfigurable Microgrid Integrated with Multiple Energy Storage and Demand Response Program. Sustain. Cities Soc. 2021, 69, 102790. [Google Scholar] [CrossRef]
- Zhang, S.; Miao, S.; Li, Y.; Yin, B.; Li, C. Regional Integrated Energy System Dispatch Strategy Considering Advanced Adiabatic Compressed Air Energy Storage Device. Int. J. Electr. Eng. 2021, 125, 106519. [Google Scholar] [CrossRef]
- Wojcik, J.D.; Wang, J. Feasibility Study of Combined Cycle Gas Turbine (CCGT) Power Plant Integration with Adiabatic Compressed Air Energy Storage (ACAES). Appl. Energy 2018, 221, 477–489. [Google Scholar] [CrossRef]
- Han, Z.; Ma, F.; Wu, D.; Zhang, H.; Dong, F.; Li, P.; Xiao, L. Collaborative Optimization Method and Operation Performances for a Novel Integrated Energy System Containing Adiabatic Compressed Air Energy Storage and Organic Rankie Cycle. J. Energy Storage 2021, 41, 102942. [Google Scholar] [CrossRef]
- Kalantzis, N.; Pezouvanis, A.; Ebrahimi, K.M. Internal Combustion Engine Model for Combined Heat and Power (CHP) Systems Design. Energies 2017, 10, 1948. [Google Scholar] [CrossRef] [Green Version]
- Ma, G.; Zhang, Y.; Yue, M.; Shi, Y. Thermal Economy Study on the Waste Heat Utilization of a Double Reheat Unit under Coupled Steam Turbine and Boiler. Appl. Therm. Eng. 2020, 175, 115112. [Google Scholar] [CrossRef]
- Liu, Z.; Xu, W.; Qian, C.; Chen, X.; Jin, G. Investigation on the Feasibility and Performance of Ground Source Heat Pump (GSHP) in Three Citied in Cold Climate Zone, China. Renew. Energy 2015, 84, 89–96. [Google Scholar] [CrossRef]
- Xie, R.; Chen, M.; Liu, W.; Jian, H.; Shi, Y. Digital Twin Technologies for Turbomachinery in a Life Cycle Perspective: A Review. Sustainability 2021, 13, 2495. [Google Scholar] [CrossRef]
- Fu, Y.; Zhou, X.; Zhou, H. Application of Water Pump Proportionality Law to Heating and Air Conditioning Systems. Appl. Mech. Mater. 2013, 353–356, 3054–3061. [Google Scholar] [CrossRef]
- Arnaldos, J.; Casal, J.; Montiel, H.; Sánchez-Carricondo, M.; Vílchez, J.A. Design of a Computer Tool for the Evaluation of the Consequences of Accidental Natural Gas Releases in Distribution Pipes. J. Loss Prev. Process Ind. 1998, 11, 135–148. [Google Scholar] [CrossRef]
- Mei, S.; Wang, J.; Tian, F.; Chen, L.; Xue, X.; Lu, Q.; Zhou, Y.; Zhou, X. Design and Engineering Implementation of Non-supplementary Fired Compressed Air Energy Storage System: TICC-500. Sci. China Technol. Sci. 2015, 58, 600–611. [Google Scholar] [CrossRef]
- Hentschel, J.; Zindler, H.; Spliethoff, H. Modelling and Transient Simulation of a Supercritical Coal-fired Power Plant: Dynamic Response to Extended Secondary Control Power Output. Energy 2017, 137, 927–940. [Google Scholar] [CrossRef]
- Siikonen, T. Numerical Method for One-dimensional Two-phase Flow. Numer. Heat Transf. 1987, 12, 1–18. [Google Scholar] [CrossRef]
- Kapor, J.S.; Lucey, A.D.; Pitman, M.W. A Mesh-Free Compliant-Wall Fluid-Structure Interaction Model. In Proceedings of the 2011 19th International Congress on Modelling and Simulation (MODSIM), Perth, Australia, 12–16 December 2011; MSSANZ: Canberra, Australia, 2011; pp. 551–557. [Google Scholar] [CrossRef]


Publisher’s Note: MDPI stays neutral with regard to jurisdictional claims in published maps and institutional affiliations. |
© 2022 by the authors. Licensee MDPI, Basel, Switzerland. This article is an open access article distributed under the terms and conditions of the Creative Commons Attribution (CC BY) license (https://creativecommons.org/licenses/by/4.0/).