Article

Heat Loss Analysis of a 2D Pump’s Transmission

1
Key Laboratory of Special Purpose Equipment and Advanced Manufacturing Technology, Ministry of Education & Zhejiang Province, Zhejiang University of Technology, Hangzhou 310023, China
2
School of Automobile, Zhejiang Institute of Communication, Hangzhou 311112, China
3
School of Transportation, Zhejiang Industry Polytechnic College, Shaoxing 312000, China
*
Author to whom correspondence should be addressed.
Machines 2022, 10(10), 860; https://doi.org/10.3390/machines10100860
Submission received: 18 August 2022 / Revised: 19 September 2022 / Accepted: 19 September 2022 / Published: 26 September 2022
(This article belongs to the Section Electromechanical Energy Conversion Systems)

Abstract

:
Highly enhanced pump power density inevitably results in a profound rise in pump temperature, which seriously influences both power loss and service performance. Heat loss analysis is an important part of analyzing the mechanical and cooling efficiency of a 2D piston pump. This paper focuses on heat loss analysis of this pump’s transmission. Firstly, theoretical and experimental studies are carried out on the thermal–hydraulic model to investigate the heat loss of the pump’s transmission. A pump test rig is developed and thermal experiments are conducted, from 1000 rpm to 6000 rpm. Furthermore, its transient thermal simulation model is implemented with Ansys software to capture the pump’s thermal status. The test convective heat transfer coefficients and temperature data are set in the model, and the simulation results are mutually validated with the experimental ones. Finally, the transmission’s heat loss is compared with its reference churning loss formula. The distribution of the transient heat loss is 49.66% into the end cap, 27.74% into the cylinder head, 13.30% into the inner cylinder, and 9.30% into the oil. The heat loss simulation results agree with the churning loss below 4000 rpm; therefore, the transmission thermal model is accurate and efficient.

1. Introduction

Pumps, becoming more lightweight, energy efficient, and intelligent, are at the heart of fluid power systems [1] and are widely used in the aerospace industry, petrochemical fields, automotive plants, and steel mills [2]. To pursue a larger power-to-weight ratio, higher pressure and more power are spontaneously demanded by hydraulic systems, especially for aircraft [3]. The even more enhanced pressure and power will inevitably increase the invalid power of the system, resulting in a profound rise in the temperature and increased leakage [4,5]. This is significant for high-power hydraulic systems on marine vessels, especially on chemical tankers with thousands of kilowatts of pumping power, where the problems related to the efficiency and temperature rise matter profoundly [6]. Moreover, the enhancement of the power density requires that pumps provide higher pressure and withstand faster speed. These factors force the pumps to operate at high temperatures, which cause efficiency decline, insufficient lubrication, sealing problem, thermal stress fatigue, working life reduction, etc. So, the heat accumulation has become the critical point restricting the pumps’ speed and pressure. Professor Noah D. Manring and others from the University of Missouri studied the factors affecting the maximum speed of piston pumps [7]. Sidders J. A. from the University of Bath studied the thermal characteristics simulation of hydraulic systems [8]. Eduardo D.L. and Victor Juliano D.N. evaluated the gear pump efficiency by temperature measurements [9]. Iben U. from Bosch GmbH explored the temperature effect on plunger pumps with cavitation characteristics [10]. Green Therman E. from Ford Motor Company studied thermographic detection for fault diagnosis of the hydraulic system [11]. Monika Ivantysynova’s team from Maha Fluid Power Research Center focused on the research of piston pumps in detail with CASPAR software [12].
High-performance pump design techniques, efficiency, reliability, and operating conditions are researched widely in product manufacturing, material processing, and fluid conveying [12,13]. The two-dimensional pump (2D pump), which is especially suitable for high-power-density aerospace applications, was developed by Prof. Ruan’s research team [14]. Multiple studies have been carried out on 2D pumps. Ding-can Jin, Ke Zhu and Hengyuan Wang investigated its transmission [15,16,17]. Sheng-nan Shentu and Jia-yuan Qian studied its flow ripple [18]. Chuan Ding, Yu Huang, Hengyuan Wang, and Chen-chen Zhang engaged their efforts in mechanical efficiency [19,20], including volume efficiency [21] and churning loss [22]. Chuan Ding also carried out a 2D flowmeter [23]. In addition, 2D pump researchers have preliminarily analyzed the mechanical efficiency in theory and experiment. Its energy losses could be carried away in the form of heat and vibration [1]. However, the heat loss, as the main factor, has not yet been studied. This study is conducted to develop the heat transfer model of the 2D pump’s transmission. This paper presents a test rig to capture its hydrothermal characteristics, data processing, and heat simulation by Matlab and Ansys software to calculate the heat transfer of complex constructions and eventually deduce the heat loss.

2. Structure and Working Principle

Mechanical Structure

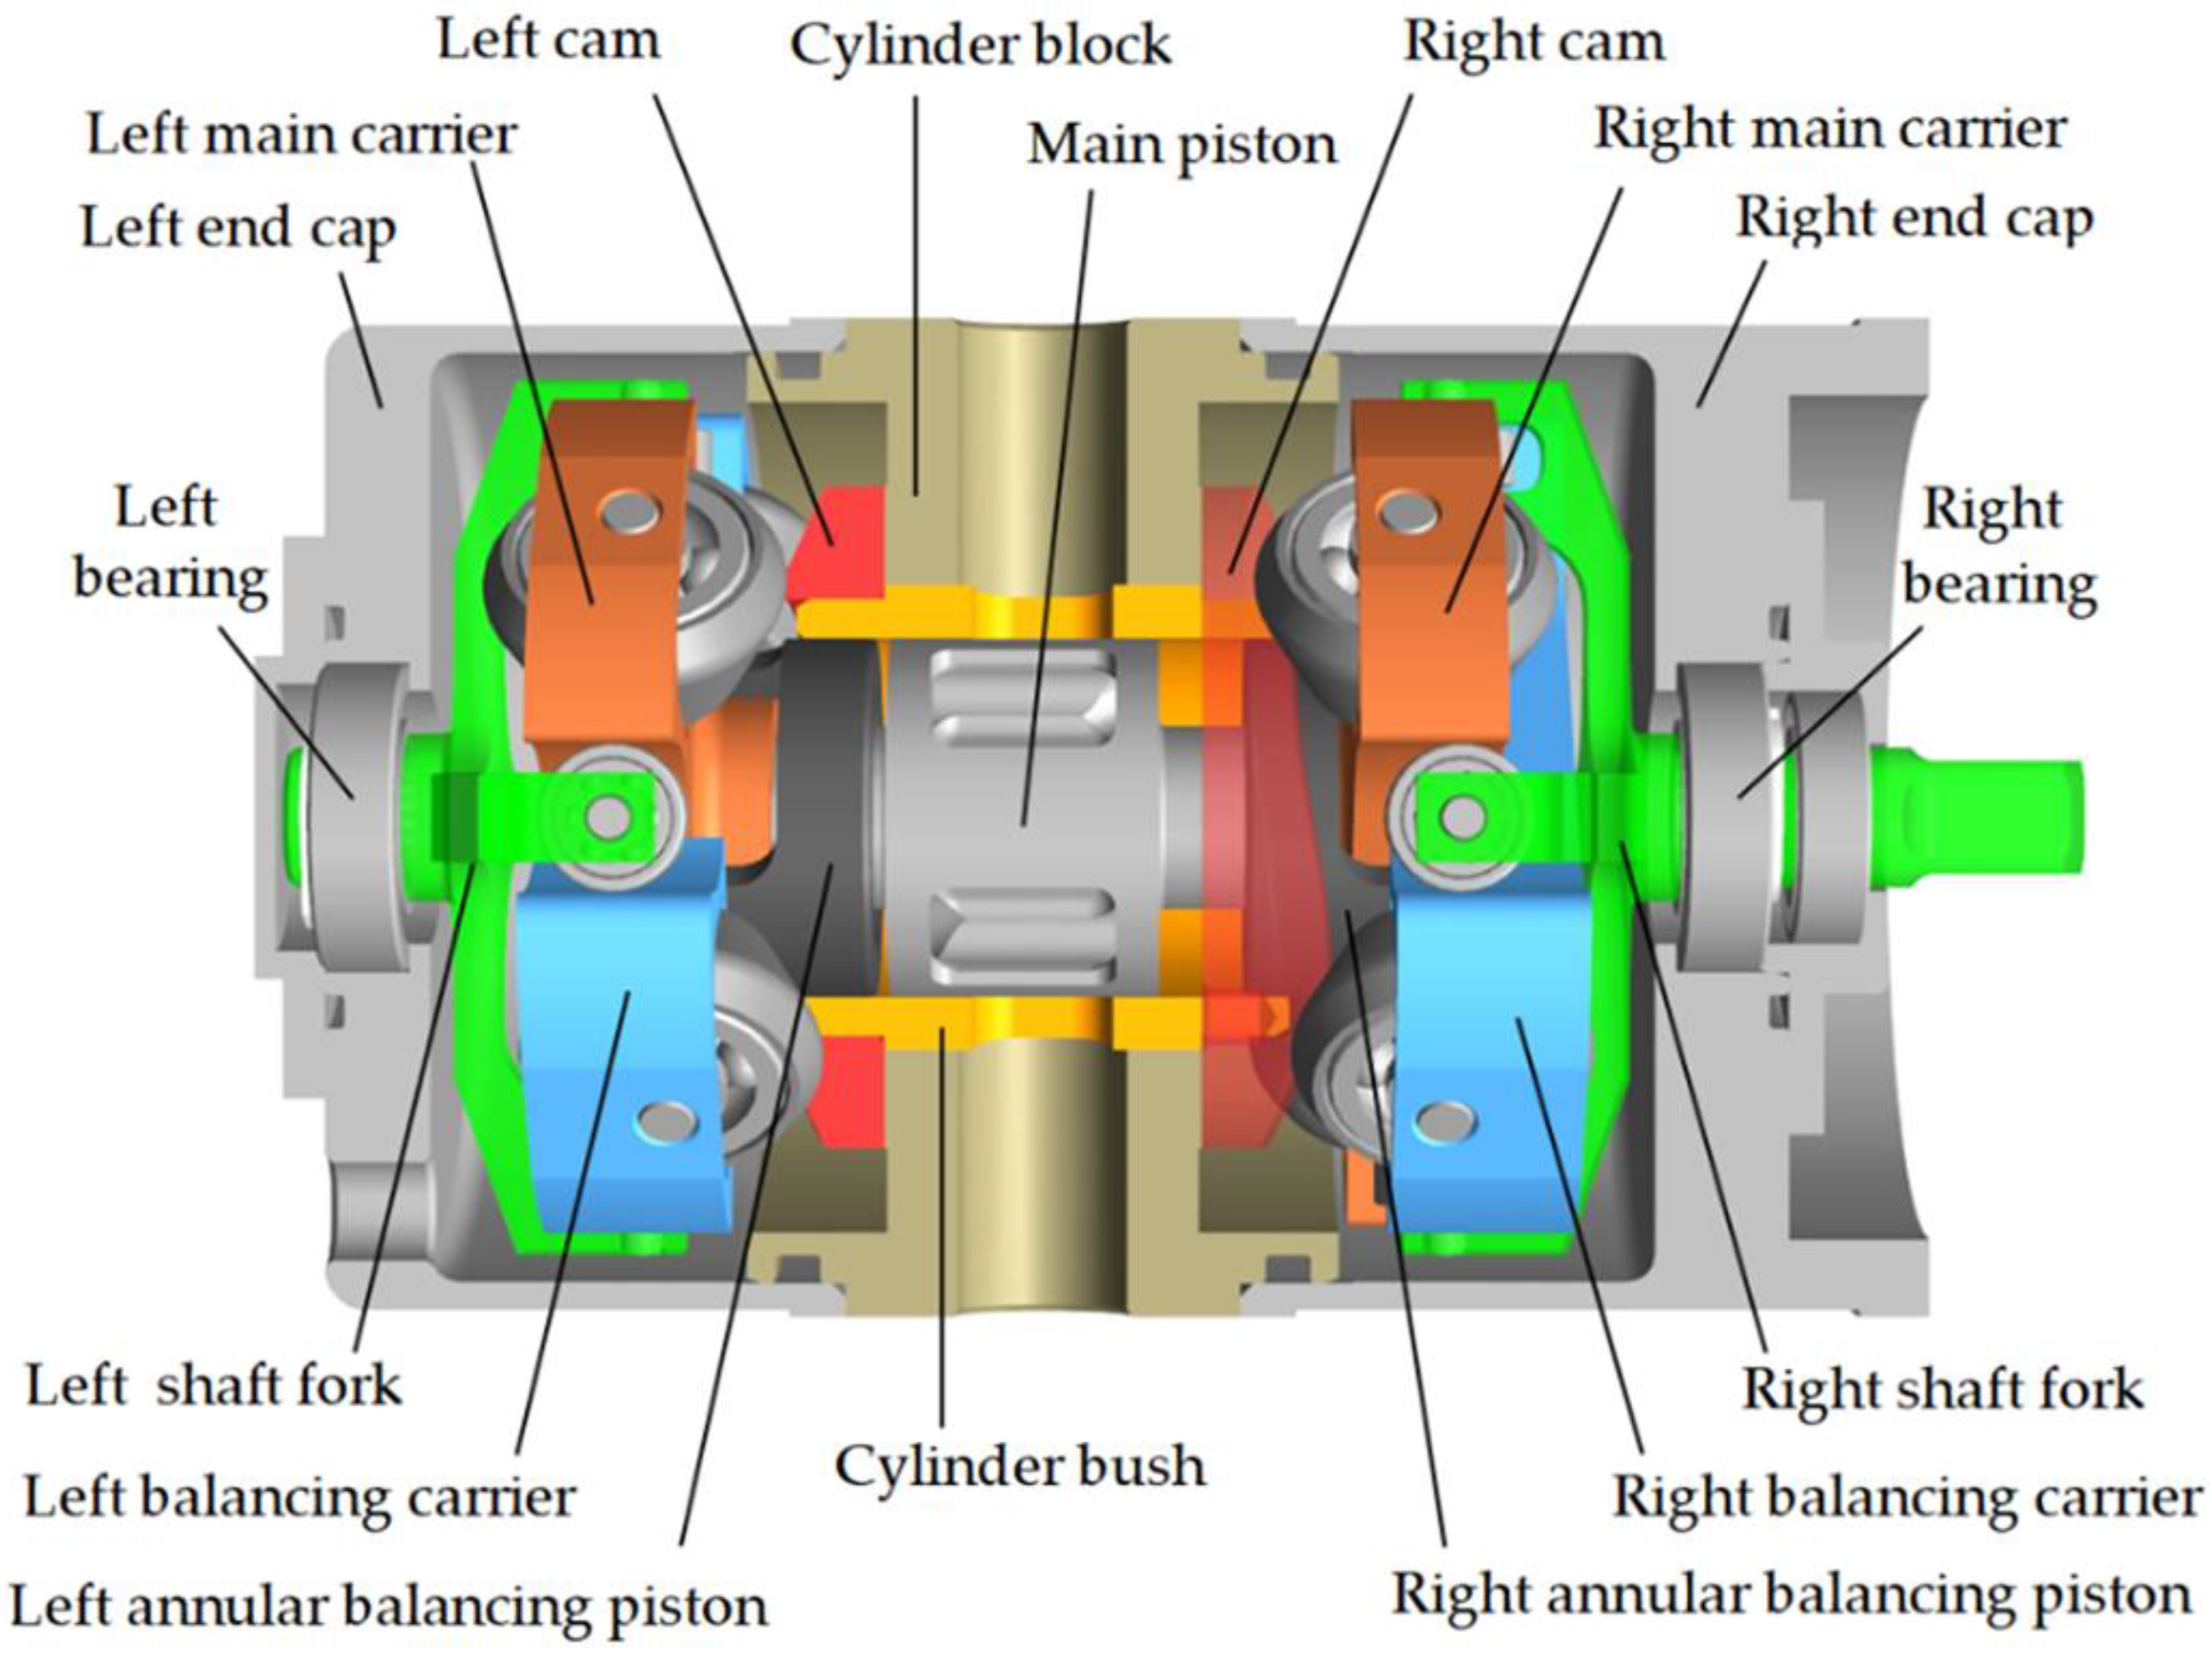
This pump belongs to one kind of double-acting piston-type force pump [24], composed of one cylinder, two end caps, two annular balancing pistons, one main piston, two cam-roller sets, two shaft forks, and others, as shown in Figure 1. Two suction nozzles and two discharge nozzles are evenly distributed around the cylinder, and the main piston has four corresponding channels. Two sets of carrier-rollers, perpendicular to each other and driven by shaft forks to rotate along two cams, are located on either side of the end caps to actuate the main piston and annular pistons to reciprocate oppositely. The two spatial cams are settled with a 90-degree phase difference beside the cylinder, and the rollers on each carrier run along the cams. So, the main carriers make homodromy and opposite reciprocation with the two balancing carriers synchronously.
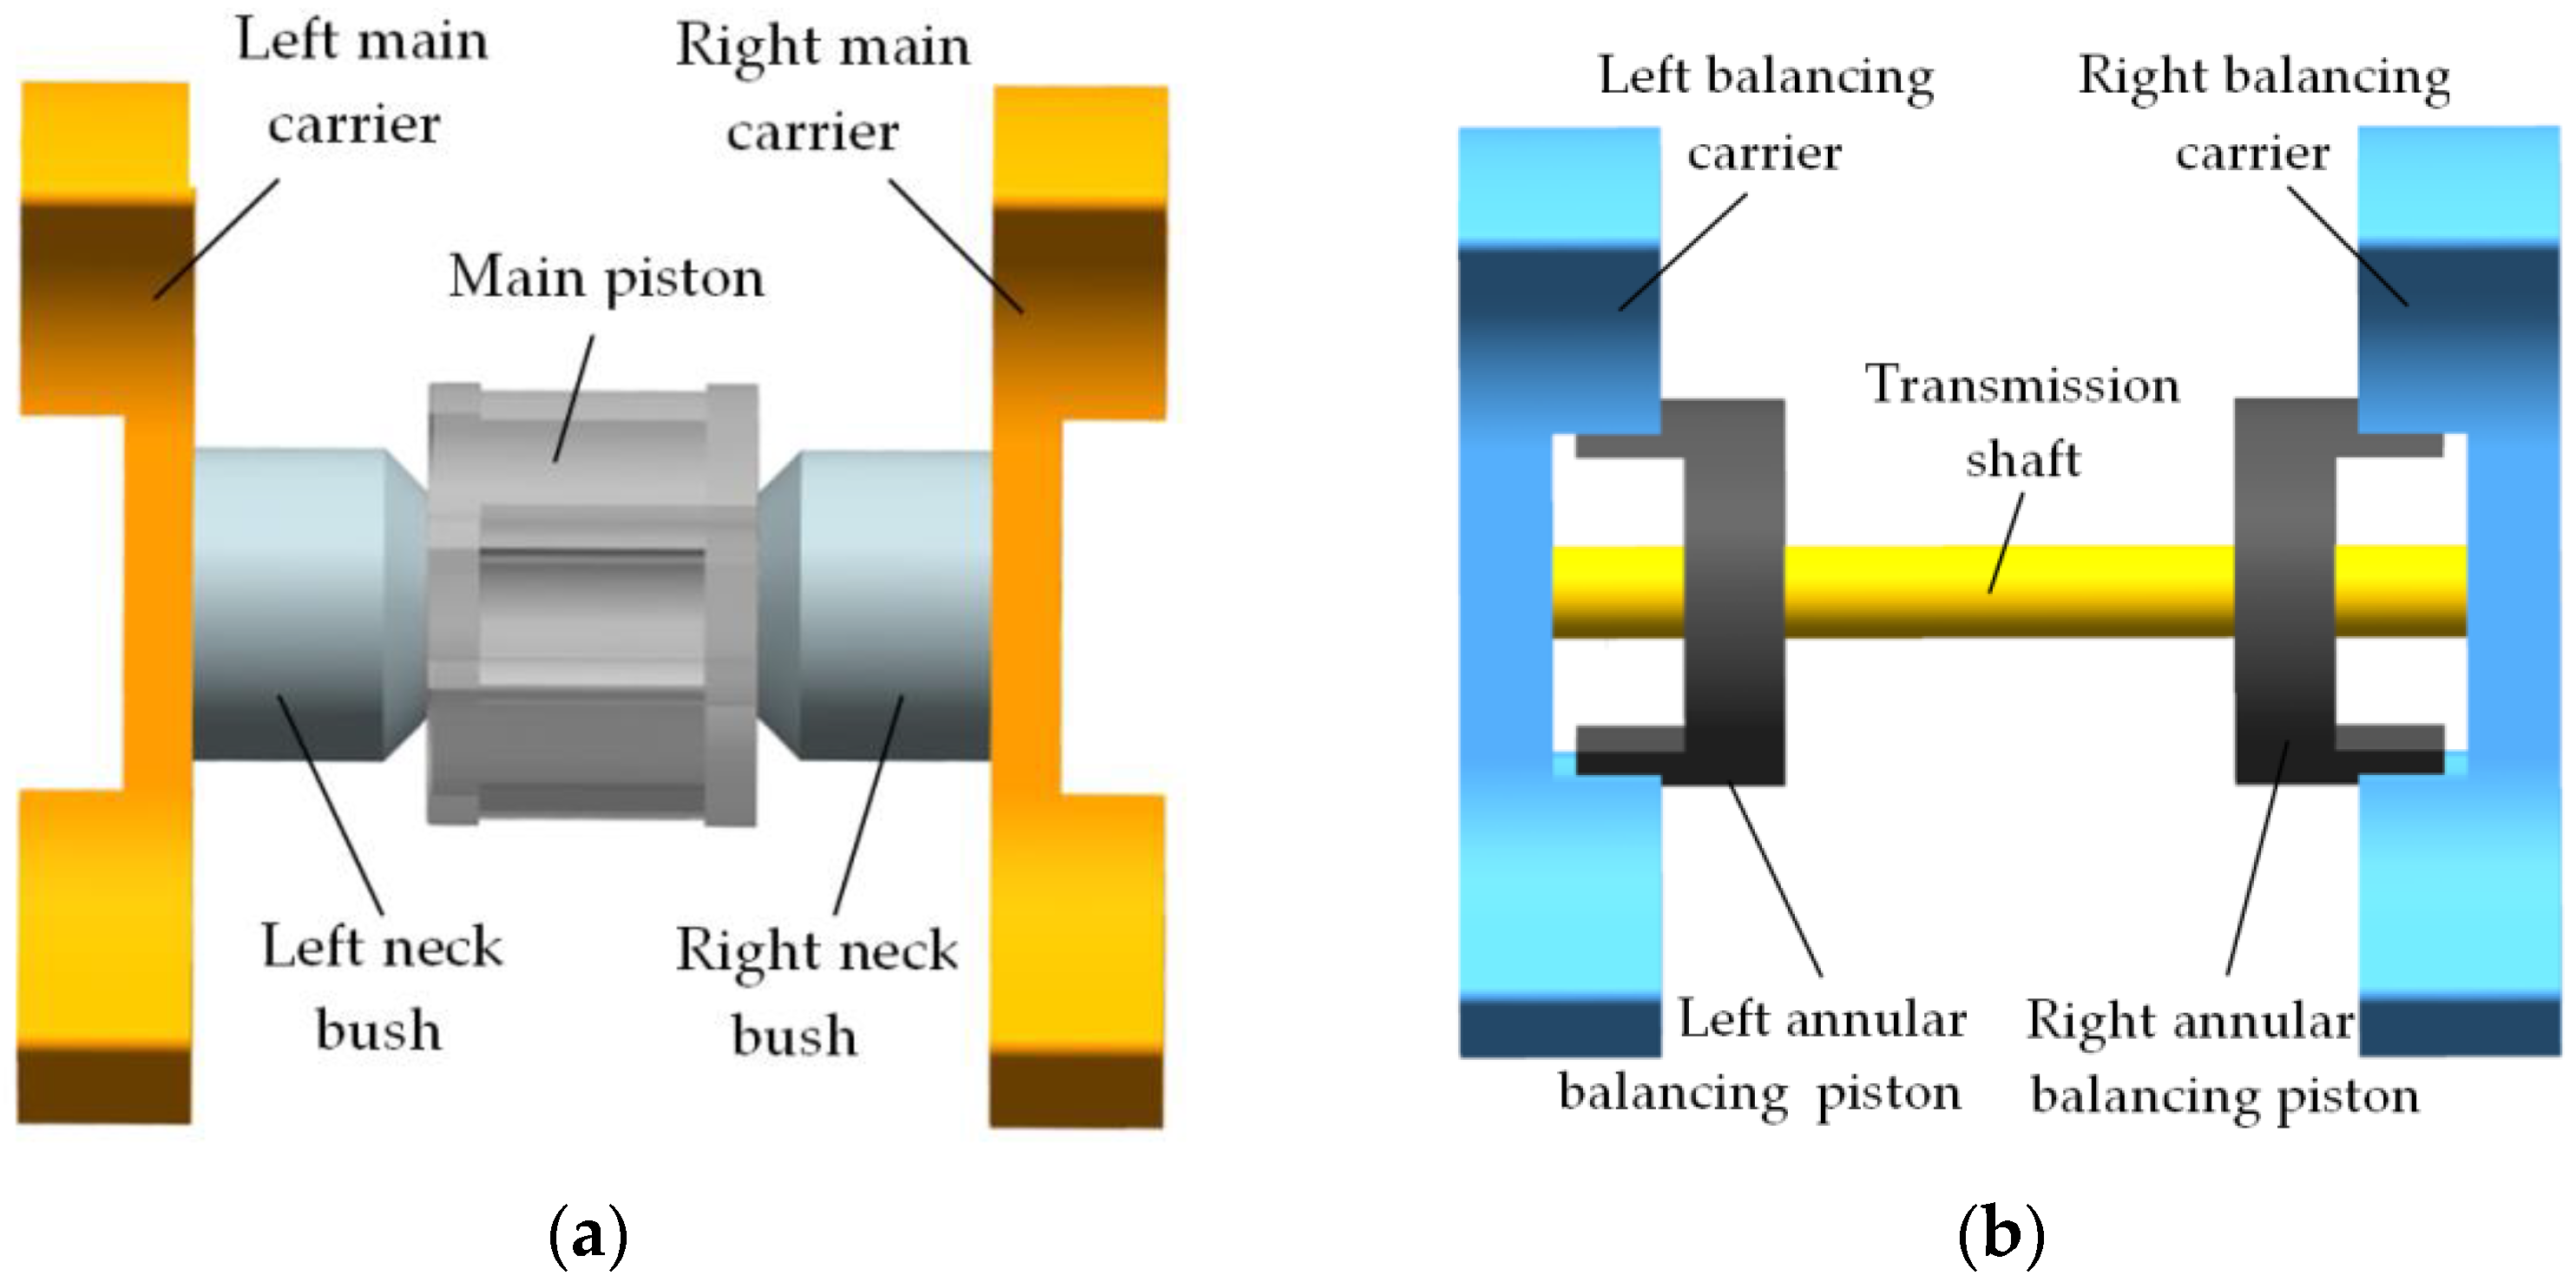
As Figure 2 illustrates, the 2D pump’s transmission consists of two groups of components. Figure 2a illustrates the main piston transmission set containing the main piston, two neck bushes, and two main carriers. The right shaft fork sends 50% power to the right main carrier through the main piston to the left main carrier. In addition, both sides of the main carriers drive the main piston and neck bushes to rotate and reciprocate together. Figure 2b shows the annular piston transmission set, including two annular pistons, two balancing carriers, and one transmission shaft. The right shaft fork delivers another 50% input torque to the right balancing carrier through a transmission shaft to the left balancing carrier. In addition, the annular pistons move together with the balancing carriers and the transmission shaft. Respectively, the main piston makes concurrent rotation and opposite reciprocation with the two balancing pistons at the same time. That is why the two-dimensional (2D) piston pump was named. Due to the rotational and reciprocating movement, the working volumes between the main piston and balancing pistons, surrounded by the copper bushes, are changed periodically. In addition, such transmission allows this pump to efficiently perform four oil suctions and compress processes in a cycle.
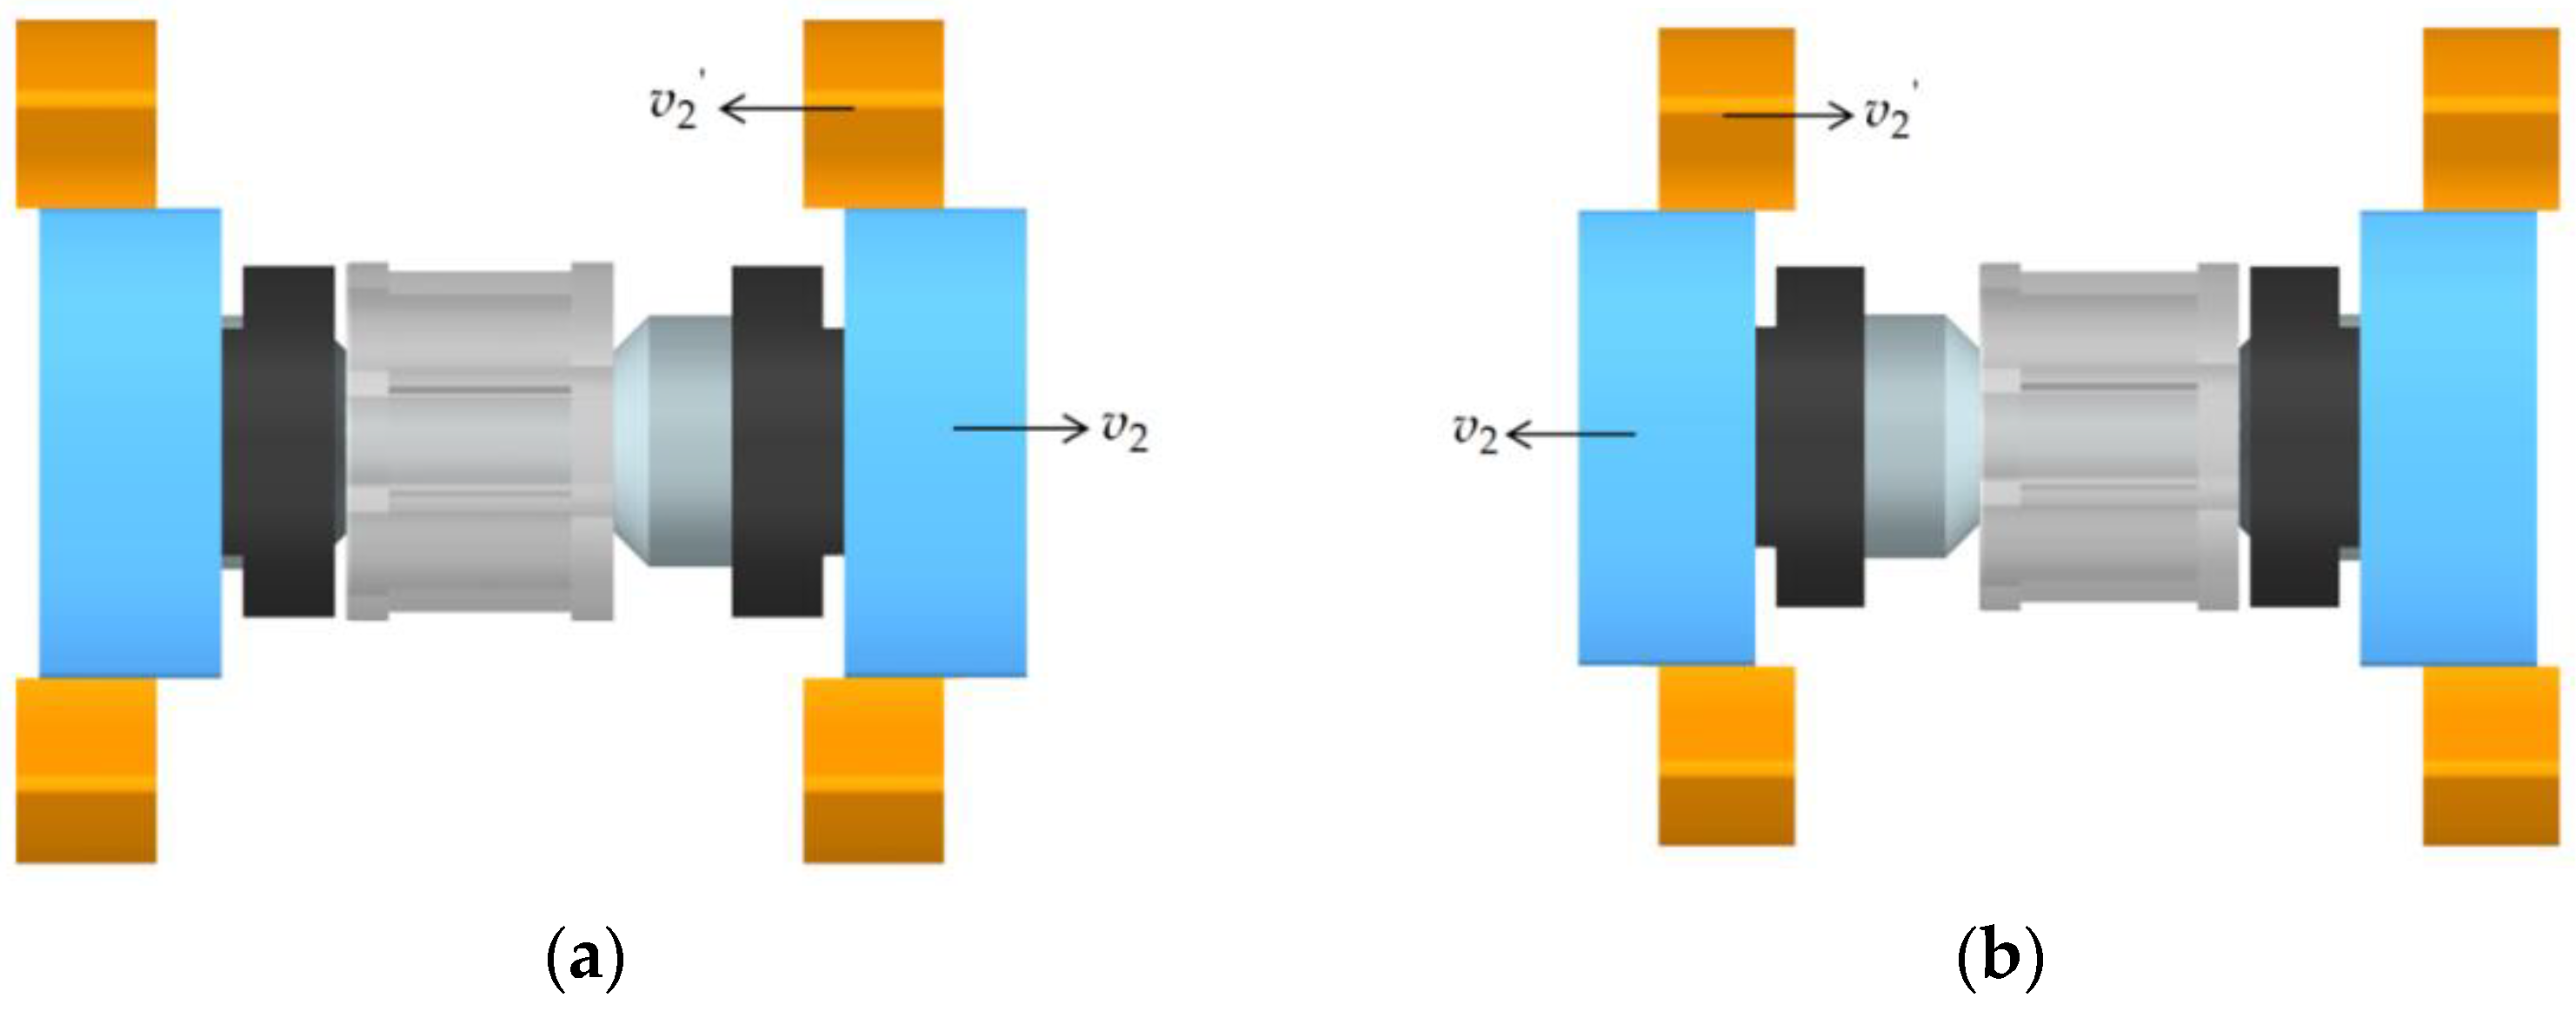
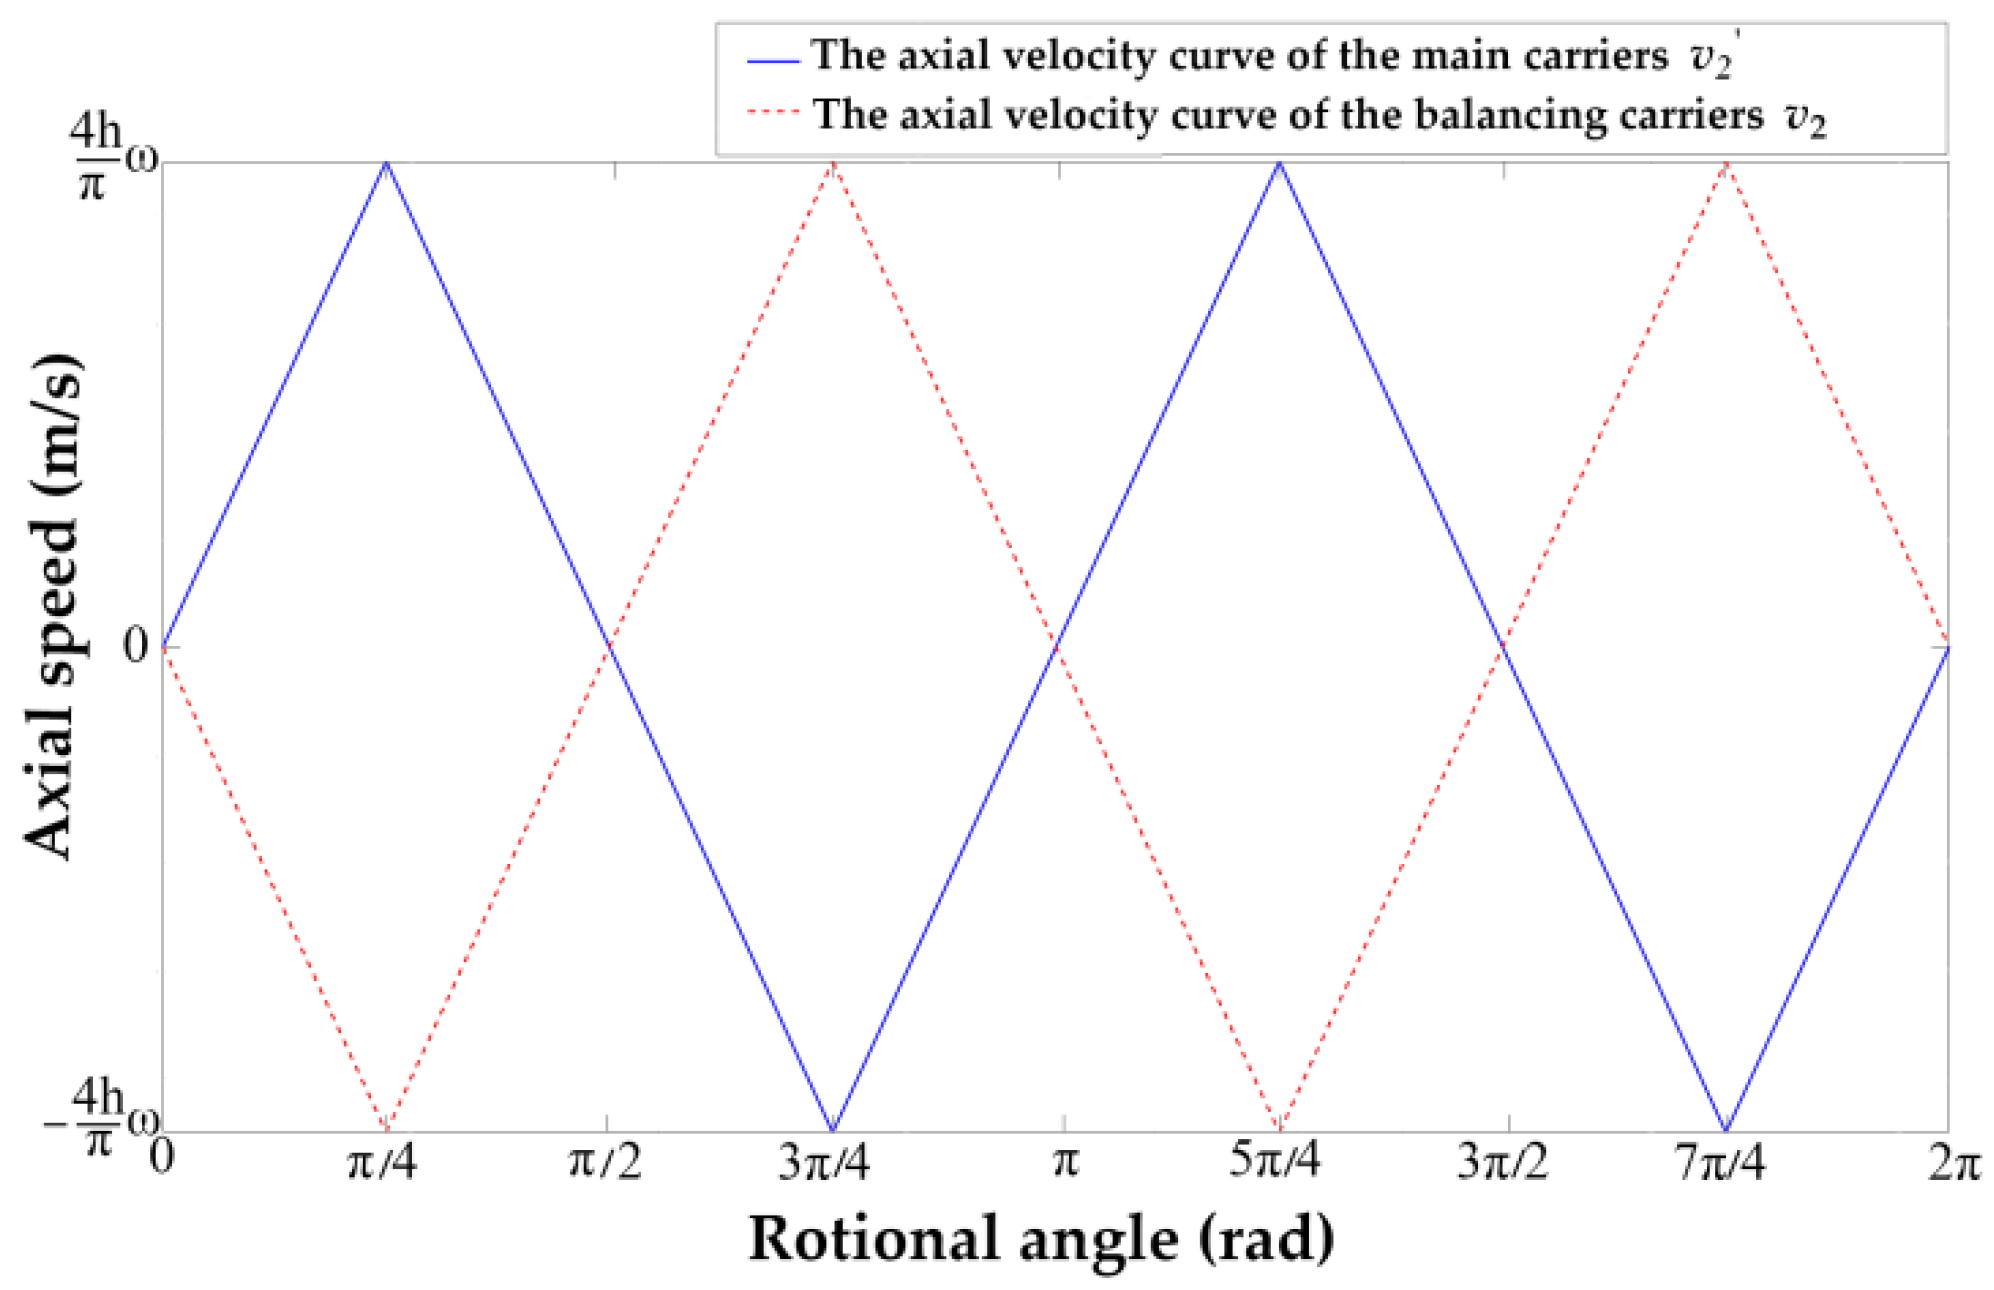
Both the two transmission assemblies’ rotation speeds are in accord with the input rotational velocity. The carrier’s max linear velocity v 1 is illustrated in Equation (1). Owing to the cams’ curves, which are designed by the law of uniform acceleration and deceleration, the transmissions’ reciprocating speeds are also under this rule correspondingly. The axial reciprocating velocities of the main carriers and balancing carriers on either side are equal in magnitude and opposite in direction ( v 2 = v 2 ), as described by Equation (2) and shown in Figure 3 and Figure 4. So, the annular piston transmission set can not only increase its displacement by doubling the piston stroke, but also counteract the axial inertance caused by the main piston transmission set. The balancing assembly is the highlight of this pump compared with other piston pumps. However, this innovative apparatus also adds extra contact and friction and makes the thermal–hydraulic model more complex.
v 1 = ω · r 3 = 2 π n 60 × r 3 = 3.14 × 10 3 n
v 2 = 16 h π 2 ω θ                   , θ ( 0 ,   π 4 ) 16 h π 2 ω θ + 8 h π ω ,   θ ( π 4 ,   3 π 4 ) 16 h π 2 ω θ 16 h π ω ,   θ ( 3 π 4 ,   5 π 4 ) 16 h π 2 ω θ + 24 h π ω ,   θ ( 5 π 4 ,   7 π 4 ) 16 h π 2 ω θ 32 h π ω ,   θ ( 7 π 4 ,   2 π )

3. Heat Transfer Analysis

Both the main piston transmission set and the annular piston transmission set of this pump are axisymmetric and obviously eudipleural. In this mechanism, the roller sets, containing main carriers, balancing carriers, and shaft forks, can be treated as two annuli. In addition, their outside caps belong to stationary outer annuli [25]. Thus, one roller set with its cap, on either side of the pump, constitutes a pair of concentric cylinders. So, the flow dynamics in the annulus belong to the Taylor flow [26]. Moreover, the flow structure in this concentric cylinder depends on its geometric parameters. In addition, the convective heat transfer coefficient between the flow and contact surface is core to determining the heat transfer. However, the convective heat transfer coefficient of the 2D pump varies a lot from the general ones owing to the unique movement rule and shearing cavitation.

3.1. Heat Transfer Analysis of the 2D Pump Cap

3.1.1. Heat Transfer Analysis of Pump Cap’s Annulus

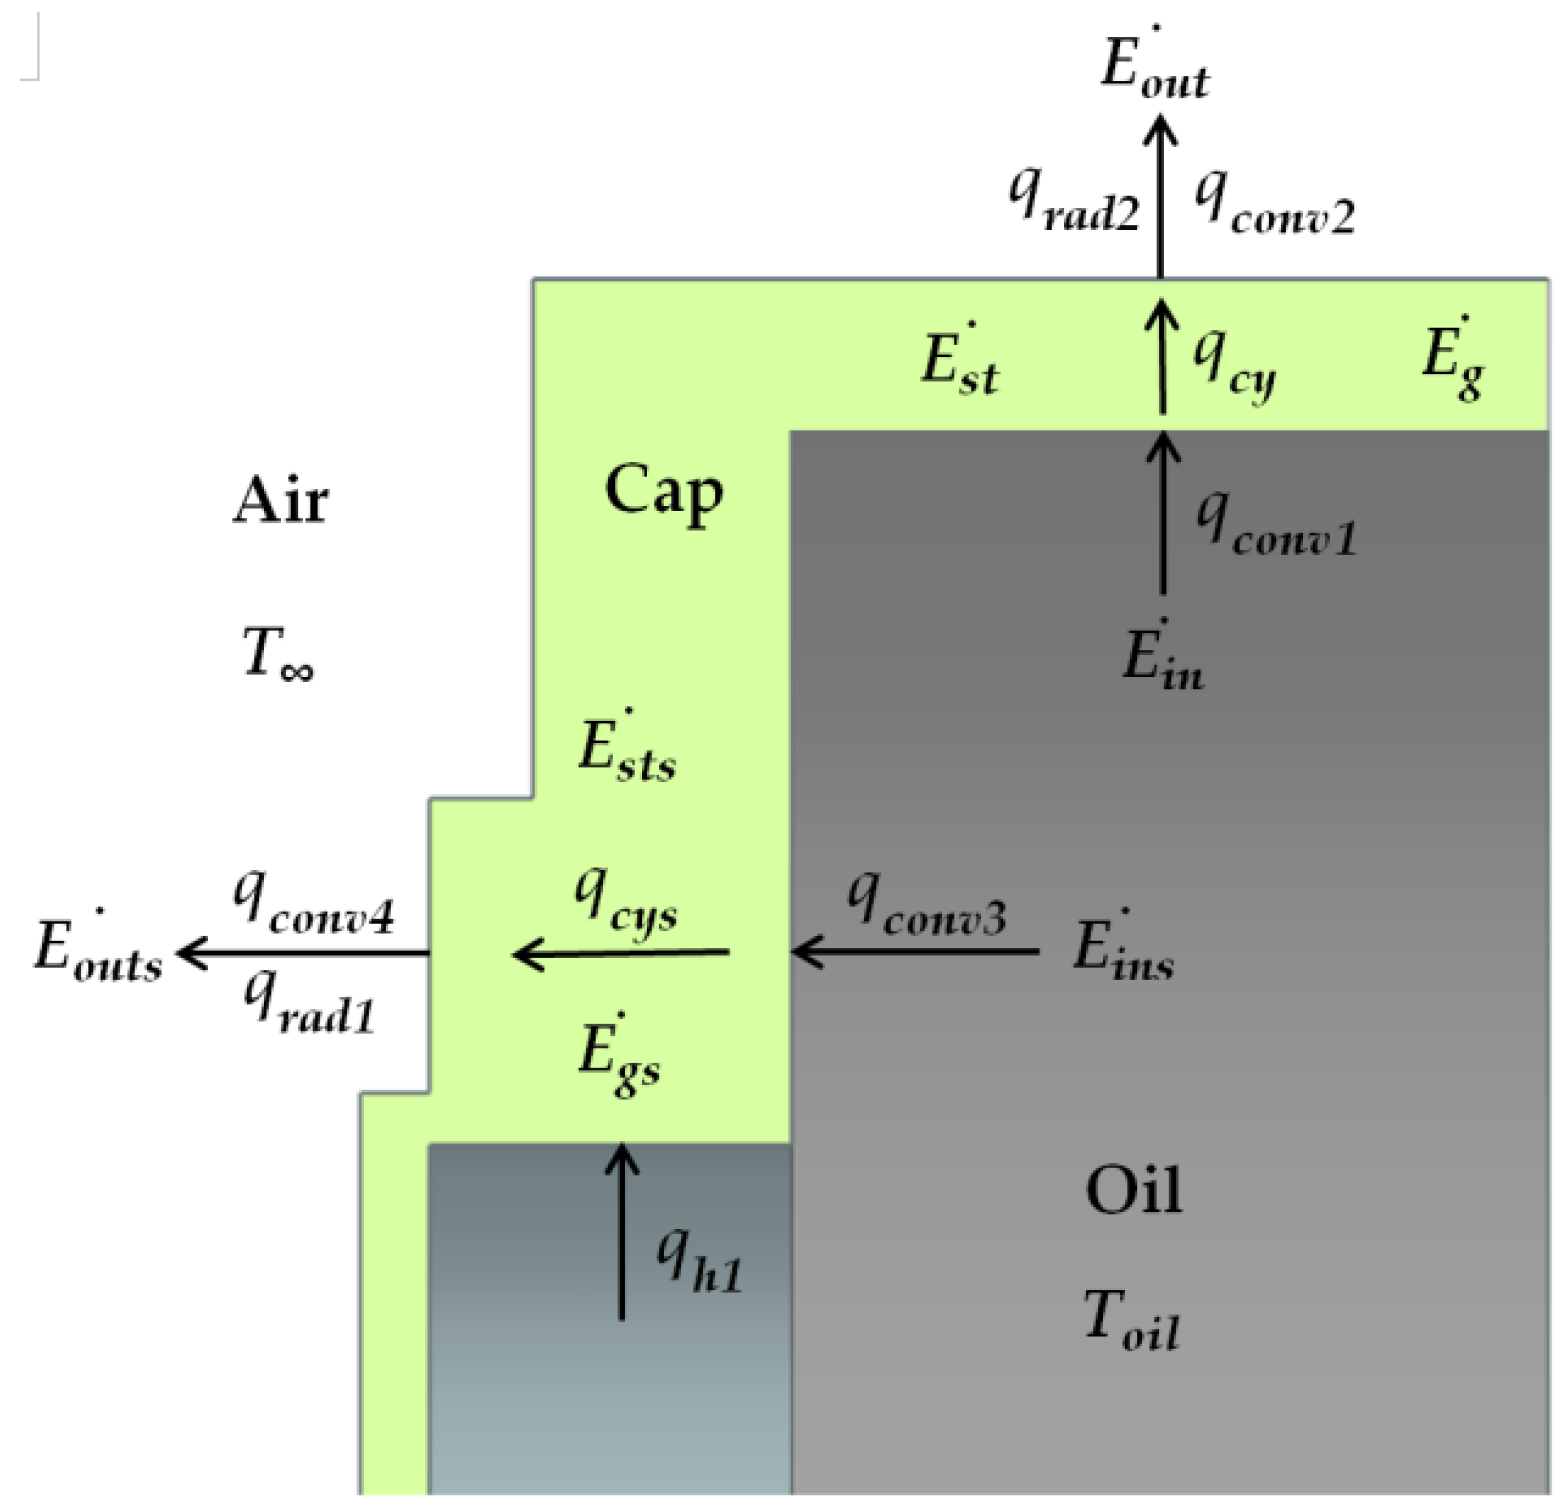
In the cap’s annulus, its geometric parameters are stable, and the Taylor flow’s dynamics are formed by the velocity field and temperature field, including the inner cylinder linear velocity v 1 and reciprocating velocity v 2 and v 2 . The heat transfer is from the high-temperature oil flow through the cap to the low-temperature surroundings, as Figure 5 shows. The heat transfer of the outside surface is a natural heat transfer system with free-convection heat transfer and radiation to the surroundings. The cap material is Al2024 aluminum alloy, and the fluid inside is ISO VG 46 hydraulic oil. Because the Biot number between the oil and cylinder inner-face and between the air and cylinder outer-face are all less than 0.1, the heat transfer in the cylinder without heat sources ( E g ˙ = 0 ) can be analyzed by the lumped-heat-capacity method [27]. So, it belongs to a one dimension transient heat transfer. According to the first law of thermodynamics ( E i n ˙ + E g ˙ E o u t ˙ = E s t ˙ ), the input heat flow ( q c o n v 1 ) from the oil, turning into the cylinder heat flow q c y and its internal energy ( E s t ˙ ), finally outputs to circumstances via the heat convection ( q c o n v 2 ) and radiation ( q r a d 2 ).
E i n ˙ = q convl = 2 π r 1 h 1 L c y T o i l T r 1
E o u t ˙ = q 2 = q c o n v 2 + q r a d 2
E s t ˙ = V c y ρ c y c c y d T c y d t = π ( r 2 2 r 1 2 ) L c y ρ c y c c y d T c y d t
q c y = 2 π L c y k c y T r 1 T r 2 l n r 2 / r 1
q c o n v 2 = 2 π r 2 L cy h 2 T r 2 T
q r a d 2 = 2 π r 2 L cy ε σ ( T r 2 4 T s u r 4 )
According to the experimental correlation formula for natural convection heat transfer of a horizontal cylinder with a wide range of Rayleigh numbers recommended by Churchill and Chu [28], the Nusselt number of the cylinder outer-face is given in Relation (9). Thus, the convective heat transfer coefficient h 2 could be calculated in Equation (10).
N u 2 = h 2 D h 2 k 2 = 0 . 6 + 0.387 R a 2 1 / 6 1 + ( 0 . 559 P r 2 ) 9 / 16 8 / 27 2
h 2 = k 2 N u 2 D h 2
So, the convective heat transfer coefficient h 1 between the oil and cylinder inner-face could be deduced in Relation (11).
h 1 = r 2 h 2 ( T r 2 T ) + r 2 ε σ ( T r 2 4 T s u r 2 4 ) + 0 . 5 ( r 2 2 r 1 2 ) ρ c y c c y d T c y d t r 1 ( T o i l T r 1 )

3.1.2. Heat Transfer Analysis of Pump Cap’s Head

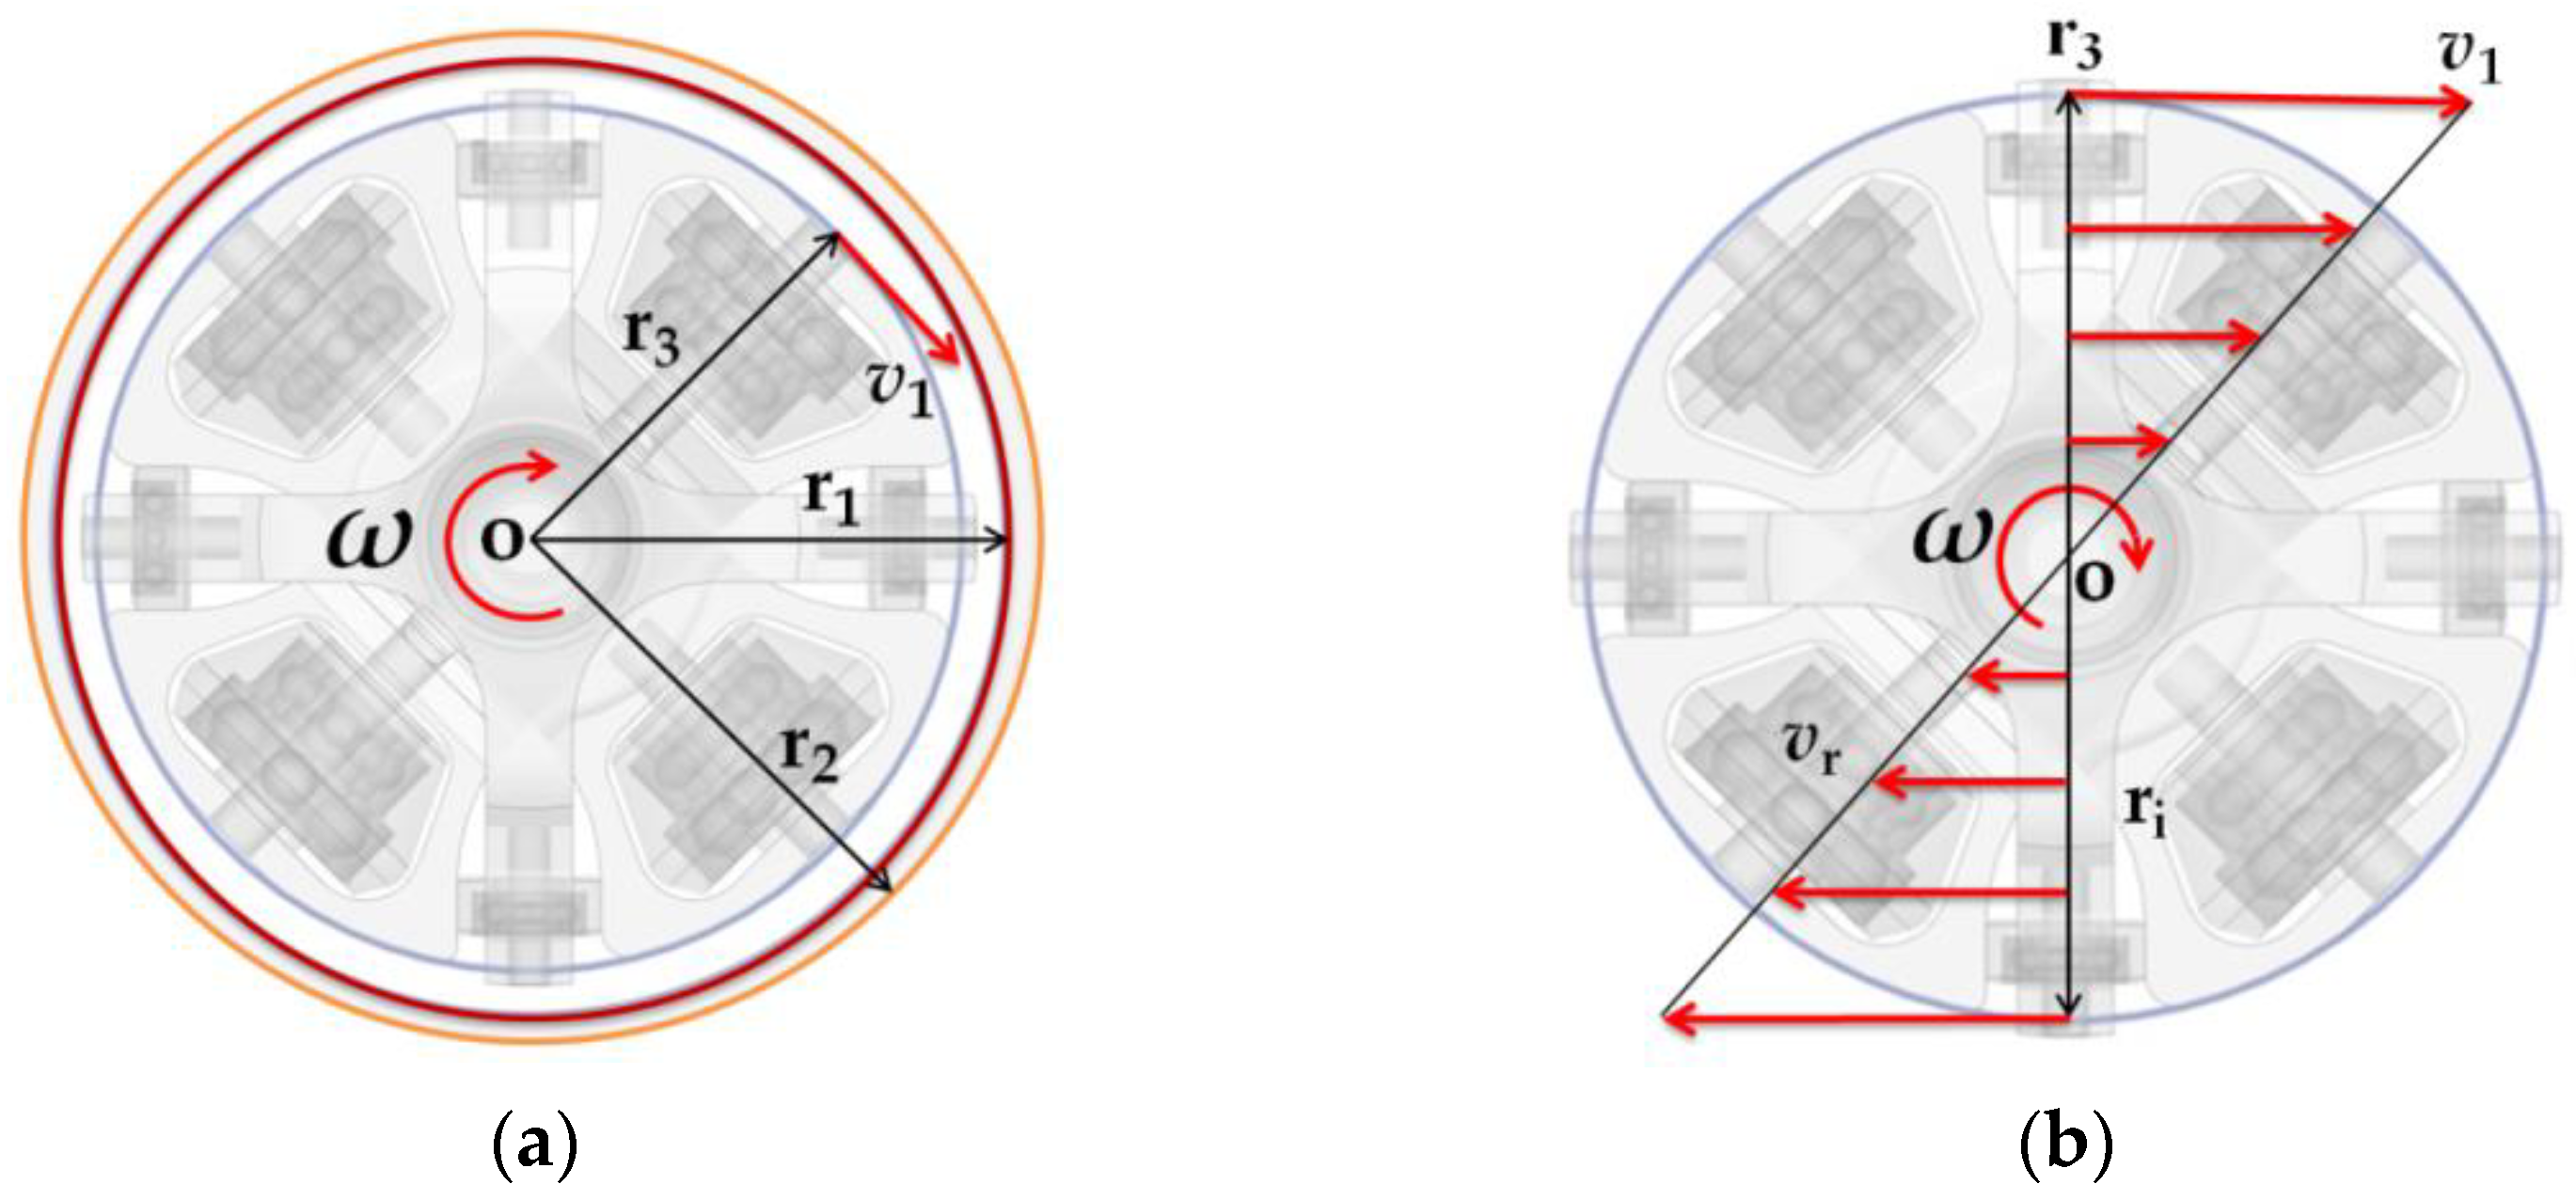
The heat transfer of the pump cap’s head belongs to multiple dimensions. In the axial direction, the heat of the oil is transferred through the cap head to the circumstances, as Figure 5 shows. In addition, a deep groove ball bearing, which generates heat by traction fluid movement and sends heat through the bearing race to the cap in the radial is located in the cap’s housing. In the cap, the vortex flow, driven by the inner cylinder, exists between the cap’s head and the inner cylinder’s bottom surface. The velocity field v r of the vortex flow is shown in Figure 6. The oil temperature and cavitation number in the cap are assumed to be consistent at the same time herein. So, the influence of cavitation on thermal convection of this vortex flow can refer to the Taylor flow in the cap.
A traditional relation N u = 0 . 023 R e 0 . 8 P r 0 . 3 , recommended by Dittus and Boelter (for cooling of the fluid), is adopted to cope with the convective heat transfer coefficient of this vortex flow h s 1 , and a factor α is introduced to correct the deviation caused by oil cavitation, shown in Formulas (12) and (16). In addition, α will be determined through the following heat transfer experiment.
For the linear velocity linearly distributed along the radial direction, the average speed of the vortex flow v r a v e 1 is used to figure out the valid Reynolds number. The Prandtl number and convective heat transfer coefficient of the vortex flow are described in Relations (15) and (16).
N u s 1 = 0 . 023 α R es 1 0 . 8 P rs 0 . 3
v r a v e 1 = 2 . 15 × 10 3 n   ( m / s )
R e s 1 = v r a v e D s 1 ϑ s = 3 . 727 × 10 5 n ϑ s
P r s = c p ϑ s ρ o i l k o i l
h s 1 = N u s 1 k o i l D s 1 = 1 . 324 α R e s 1 0 . 8 P r s 0 . 3 k oil
q c o n v 3 = S 1 h s 1 ( T o i l T s 1 )
Rolling bearing friction is an important heat source for the cap head. Both sides’ shaft forks, mounted on the bearings, only deliver the driving rotation torque. So, the radial force acting on the bearings can be neglected. Under this pump’s working conditions, ϑ s n is larger than 2 × 10 3 . So, the bearing friction torque can be calculated in turbulent conditions, shown in Formula 18, where the mean bearing diameter D m = 16   mm , and f 0 = 2 (deep groove ball bearing with oil bath lubrication in the horizontal shaft). Bearing heat is a product of the torque and angular velocity. In addition, the heat is decomposed into three fractions: one for the oil and two for both of the raceways [29]. It is assumed that one-third of the friction power loss transmits through the bearing race to the cap’s bearing housing, described in Relation (19) and shown in Figure 7a.
M b = 10 3 f 0 ( ϑ s n ) 2 / 3 D m 3
q h 1 = 2 . 87 × 10 4 n 5 / 3 ϑ s 2 / 3
According to the experimental correlation formula for natural convection heat transfer of a vertical plane with a wide range of Rayleigh numbers recommended by Churchill and Chu [28], the Nusselt number of the cap head outer-face is given in Relation (20). Thus, the convective heat transfer coefficient h 3 could be calculated in Equation (21).
N u 3 = h 3 D h 3 k 2 = 0 . 825 + 0 . 387 R a 2 1 / 6 1 + ( 0 . 492 P r 2 ) 9 / 16 8 / 27 2
h 3 = k 2 N u 3 D h 3
q c o n v 4 = π r 1 2 h 3 T r 3 T
q r a d 1 = π r 1 2 ε σ ( T r 3 4 T sur 4 )

3.2. Heat Transfer Analysis of Pump Cylinder’s Head

The heat transfer of the pump cylinder’s head also belongs to a two-dimensional transient one. In the axial direction, the heat of the oil is transferred through the cylinder head and cam to the cylinder. The average speed of the vortex flow v r a v e 2 is used to figure out the valid Reynolds number. The hydraulic diameter D s 2 is 0.0097 m. The Prandtl number and convective heat transfer coefficient of this vortex flow are described in Relations (15) and (27).
N u s 2 = 0 . 023 α R e s 2 0 . 8 P rs 1 0 . 3
v r a v e 2 = 2 . 24 × 10 3 n   ( m / s )
R es 2 = v r a v e 2 D s 2 ϑ s = 3.59 × 10 5 n ϑ s
h s 2 = N u s 2 k o i l D s 2 = 2 . 371 α R es 2 0 . 8 P rs 1 0 . 3 k o i l
q c o n v 5 = S 2 h s 2 T o i l T s 2
In the radial, the heat is generated by shearing the oil, and the annular piston rotates and reciprocates. In one path, the oil transfers heat q c 1 through the cylinder bush to the cylinder; in another path, the oil transfers heat q cli to the annular piston, as Figure 8 shows. In the cap, the vortex flow driven by the inner cylinder exists between the cylinder’s head and the inner cylinder’s bottom surface. The shearing torques on the cylinder bush T c 1 and on the annular piston T c 1 can be denoted in
T c 1 = μ c 1 ( π D c 1 L c 1 ) · ( D c 1 2 ω ) h c 1 · D c 1 2 = 4 . 43 × 10 4 n μ c 1
T c 1 = μ c 1 π D c 1 L c 1 · D c 1 2 ( ω ) h c 1 · D c 1 2 = 4 . 43 × 10 4 n μ c 1
The power generated by the viscous resistance torque on the cylinder bush P c 1 and on the annular piston P c 1 can be described in
P c 1 = T c 1 · n 9550 × 10 3 = 4 . 64 × 10 5 n 2 μ c 1
P c 1 = T c 1 · ( n ) 9550 × 10 3 = 4 . 64 × 10 5 n 2 μ c 1
In addition, it is assumed that the above power P c 1 and P c 1 are, respectively, turned into heat q c 1 and q c 1 i ( P c 1 = q c 1 ,   P c 1 = q c 1 i ), as Figure 7 shows.

3.3. Heat Transfer Analysis of the Inner Cylinder

The heat transfer of the inner cylinder in the pump cap is also a multiple-dimensional one. In the axial direction, the heat from the oil ( q conv 3 i , q conv 5 i ) is transferred through both bottom surfaces of the inner cylinder to its inside; and in the radial direction, the heat from the oil ( q conv 1 i ) is transferred to the inner annulus, as Figure 7b shows. Because the gaps between the rotor (inner cylinder) and stator (pump cap and cylinder head) are narrow, we treat the convective heat transfer coefficients of the corresponding surfaces of the rotor and stator as the same. So, the convective heat transfer coefficient from oil to the inner annulus is equal to h 1 ( h 1 i = h 1 ), the convective heat transfer coefficient from oil to the left bottom surface is equal to h s 1 ( h s 1 i = h s 1 ), and the convective heat transfer coefficient from oil to the right bottom surface is equal to h s 2 ( h s 2 i = h s 2 ) .
q c o n v 1 i = S cyi h i 1 T o i l T r 1 i
q c o n v 3 i = S 1 i h s 1 i T o i l T s 1 i
q c o n v 5 i = S 2 i h s 2 i T o i l T s 2 i

3.4. Heat Transfer between the 2D Pump’s Piston and Transmission Shaft

The rotational speeds of the main piston, annular pistons, neck bushes, and transmission shaft are the same as the driving motor. There only exist axial velocities of relative movement and shearing forces among them, as Figure 9 illustrates.
In the axial, the heat is generated by shearing the oil. Two pairs of the annular pistons and neck bushes move against each other (Figure 9a); the main piston and transmission shaft reciprocate against each other (Figure 9b). The main piston and neck bushes move with v 2 , and the annular pistons and transmission shaft move with v 2 . So, all of them are under the law of uniform acceleration and deceleration, as Figure 3 and Figure 4 show.
Because the thickness h s 3 is 0.02 mm, the outer diameters of neck bushes and the inner diameters of annular pistons are equivalent to D s 3 . The shearing forces on the left annular piston F c 3 and on the neck bush F c 3 can be expressed in
F c 3 = μ c 3 ( π D s 3 L s 3 ) h s 3 · 2 v 2 = 11 . 7 μ c 3 · v 2
The instantaneous power of them is
P c 3 = F c 3 · ( v 2 )   = 11 . 7 μ c 3 v 2 2
P c 3 = F c 3 · ( v 2 ) = 11 . 7 μ c 3 ( v 2 ) 2
The time for each revolution t r is 60 / n second, and the work performed per revolution by F c 3 is
W c 3 = 0 t r P c 3 d t = 1 . 664 × 10 9 n μ c 3
So, the average power of F c 3 is
P c 3 a = W c 3 t r = 2 . 773 × 10 11 n 2 μ c 3
In addition, the average power of F c 3 is equal to P c 3 a ( P c 3 a = P c 3 a ).
Because the structure of the pump transmission mechanism is symmetrical and the working condition is the same, the shearing forces on the right annular piston are F c 4 = F c 3 and on the right neck bush are F c 3 = F c 4 . So, the average power of F c 4 is equal to P c 3 a ( P c 4 a = P c 3 a ), and the average power of F c 4 is equal to P c 3 a ( P c 4 a = P c 3 a ).
The thickness h s 4 is 0.25 mm, and the outer diameter of the transmission shaft and the inner diameter of the main pistons cannot be treated as approximately equal. The shearing forces on the transmission shaft F s 4 and on the main piston F s 4 can be expressed in
F s 4 = μ s 4 ( π D s 4 L s 4 ) h s 4 · 2 v 2 = 8 . 14 μ s 4 · v 2
The instantaneous power of them is
P s 4 = F s 4 · ( v 2 ) = 8 . 14 μ s 4 · v 2 2
The work performed per revolution is
W s 4 = 0 t r P s 4 d t = 1 . 81 × 10 7 n μ s 4
W s 4 = 0 t r P s 4 d t = 1 . 96 × 10 7 n μ s 4
In addition, the average power is
P s 4 a = W s 4 t r = 3 . 018 × 10 9 n 2 μ s 4
P s 4 a = W s 4 t r = 3 . 27 × 10 9 n 2 μ s 4

3.5. Heat Transfer Simulation Model

The mesh quality influences the accuracy of the simulation results directly [22]. In this paper, the unstructured mesh is used in the simulation models, using the Ansys Mesh automatic method. In order to verify the validity of the key convective heat transfer coefficients h 1 and h s 1 , a single 3D CFD model of the pump cap with 20,938 elements (Tet10 and Hex20) is implemented with Ansys Transient Thermal software. The geometry of the cap is consistent with the prototype. As shown in Figure 10a, the grid is set as an integrated grid to ensure good continuity. In addition, the CFD numerical simulation model parameters, including h 1 , h s 1 , oil temperatures, air temperatures, and surrounding temperatures, are set consistently with the experimental data under the rotational speed from 1000 rpm to 6000 rpm.
For the whole heat transfer status investigation of this 2D piston pump, a 3D CFD model with 14,113 elements is implemented with Ansys Transient Thermal software. The shaft fork sets, oil seals, jump rings, bears, rollers, and other small parts are omitted, and the cams are also simplified, as Figure 11a shows. The geometries of other main components are consistent with the actual design. The material of the pump shell, including cylinder and end caps, is Al2024. The material of pump transmission, including cams, carriers, pistons, and shaft, is alloy steel. In addition, the material of the cylinder bush and the neck bushes is copper alloy. The heat transfer in this model contains convection from the oil to the contact parts, convection from the shell to the air, heat flow from the rolling bearing, radiation from the shell to the surroundings, etc. In addition, the CFD numerical simulation model parameters, including convective heat transfer coefficients and components initial temperatures, oil temperatures, air temperatures, and surrounding temperatures, are set consistently with the experimental data under the rotational speed from 1000 rpm to 6000 rpm.
The force convention with tabular data of convection coefficient and oil temperatures are added to the contact surfaces. The natural convection with convection coefficient of the stagnant air-horizontal cylinder and vertical plane and the radiation with emissivity 0.96 is set on the pump shell. In addition, the ambient temperature is set with the experimental value. We assume that the shearing power totally turns into heat flux, which transfers to the contact surface. Through the transient heat transfer simulation process, the transient temperature of the whole pump can be calculated, as shown in Figure 11b.

4. Experimental Study

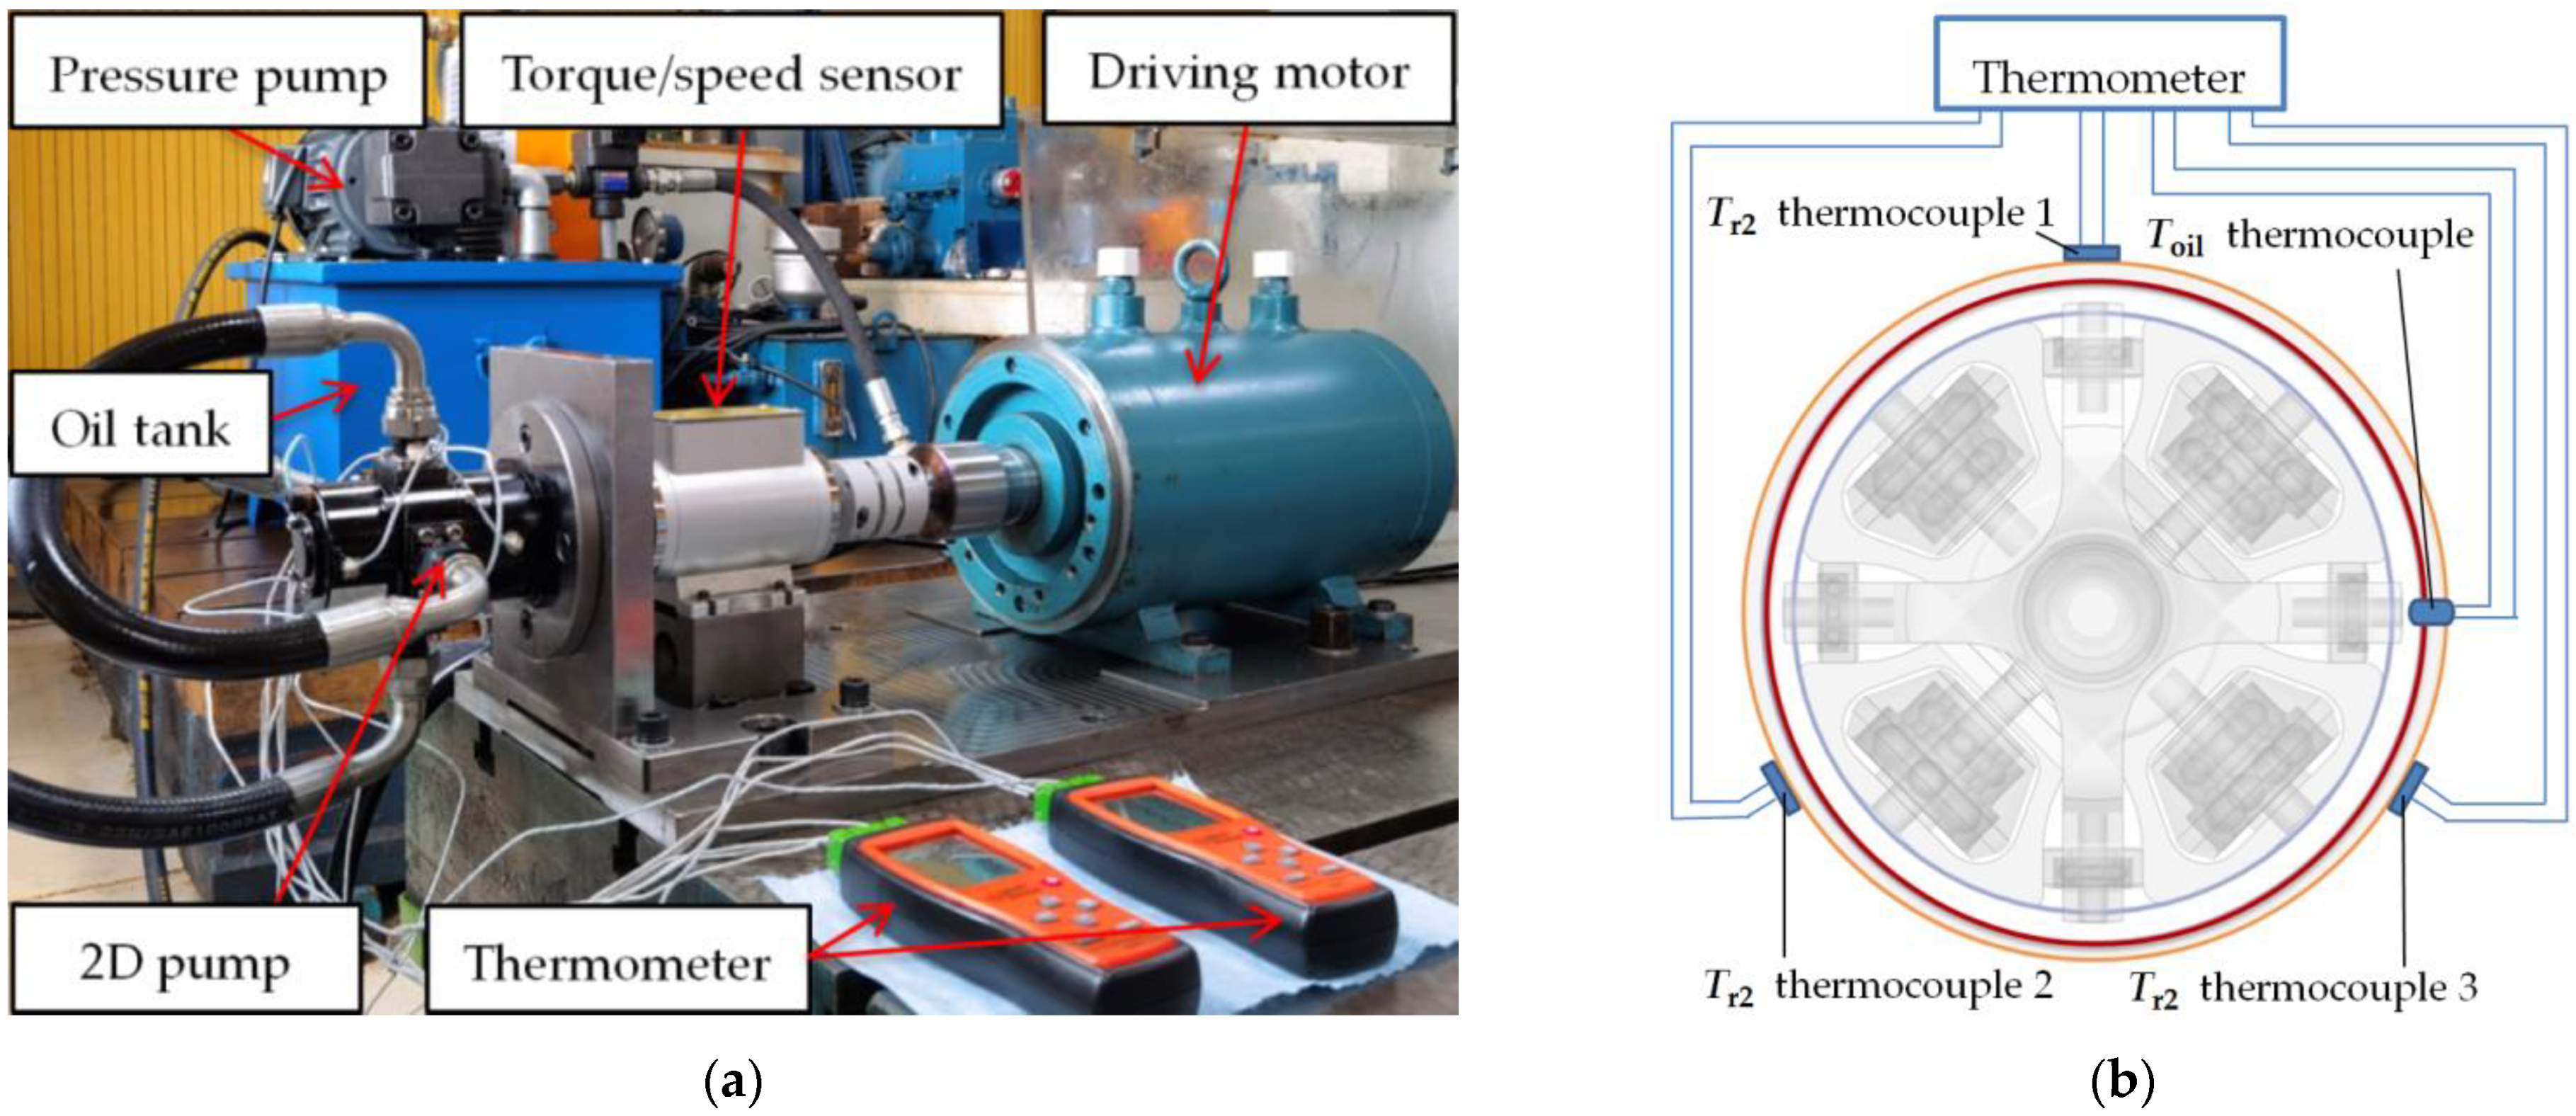
To confirm the convective heat transfer coefficients and the theoretical heat transfer model of the 2D pump, an experimental rig, as shown in Figure 12a, was developed to obtain thermal data. It was composed of a 30 kW electric motor with utmost speed of 10,000 rpm, a dynamic torque sensor between the pump and motor, a 2D pump, two Smart Sensor AS887 four channels thermometers with eight thermocouples, and others. Eight K-type thermocouples were installed: two for measuring the oil temperatures of the end caps; two for capturing the oil temperatures of one suction nozzle and one discharge nozzle; two for obtaining the end cap topside temperatures; and two symmetrically secured beside the end cap to record the annuli temperatures. All of the thermocouples were directly connected to the digital thermometers.
The speed of the pump can be simply obtained by the speed sensor. The accuracies of the related devices are shown in Table 1. In addition, the temperature display accuracy of the thermometers was 0.1 K. Two thermocouple temperature sensors, set at the intermediate height of the cap’s oil level of both sides of the end caps, were totally immerged in the oil. T oil is the average of the two measurements. For the vibration and other causes, the thermocouples, installed on the outside of the end cap, could not easily acquire Tr2 accurately. So, three sensors were placed around the cap 120 degrees apart, and the average of their measurements were taken as T r 2 , as shown in Figure 12b. To avoid the influence of the surrounding temperature, each test was carried out with around 23.5 °C surrounding temperature through the air conditioning.
When the pump structural parameters were built up, the Nusselt number determined the heat transfer intensity, mainly affected by the fluidic velocity and temperature. To form various velocities and temperature fields, this experiment was conducted under a rotational speed from 1000 rpm to 6000 rpm, from lower Nusselt numbers to higher ones. The two suction nozzles of this pump were directly connected with its two discharge nozzles. So, the pump ran almost without load, and the temperature rose almost due to the churning loss instead of the friction of transmission parts. In this way, the energy losses were mainly heat loss rather than vibration loss. So, the heat loss experimental results could compare with Huang’s results of the churning loss [19,22] of this pump’s carriers.

5. Results and Discussion

The test apparatus can obtain the key temperature data for calculating the unique convective heat transfer coefficients and Nusselt numbers of the inner cylinder’s Taylor flow. In addition, these test temperature data and heat transfer coefficients were set in the pump CFD heat transfer simulation model. Then, the simulation temperature results were compared with the experimental data. So, the simulation results and experimental results can be mutually verified under the rotational speed from 1000 rpm to 6000 rpm. When the rotational speed was beyond 2000 rpm, the flow in the cap became a gas–liquid cavitation flow for the shear cavitation and dissolved gas. In addition, the effect of cavitation on convective heat transfer from the oil to the cap was consistent with both the annular faces and the head faces. So, another unknown convective heat transfer coefficient of the inner cylinder’s vortex flow could refer to the Taylor flow.

5.1. The Convective Heat Transfer Coefficients of the Pump Transmission

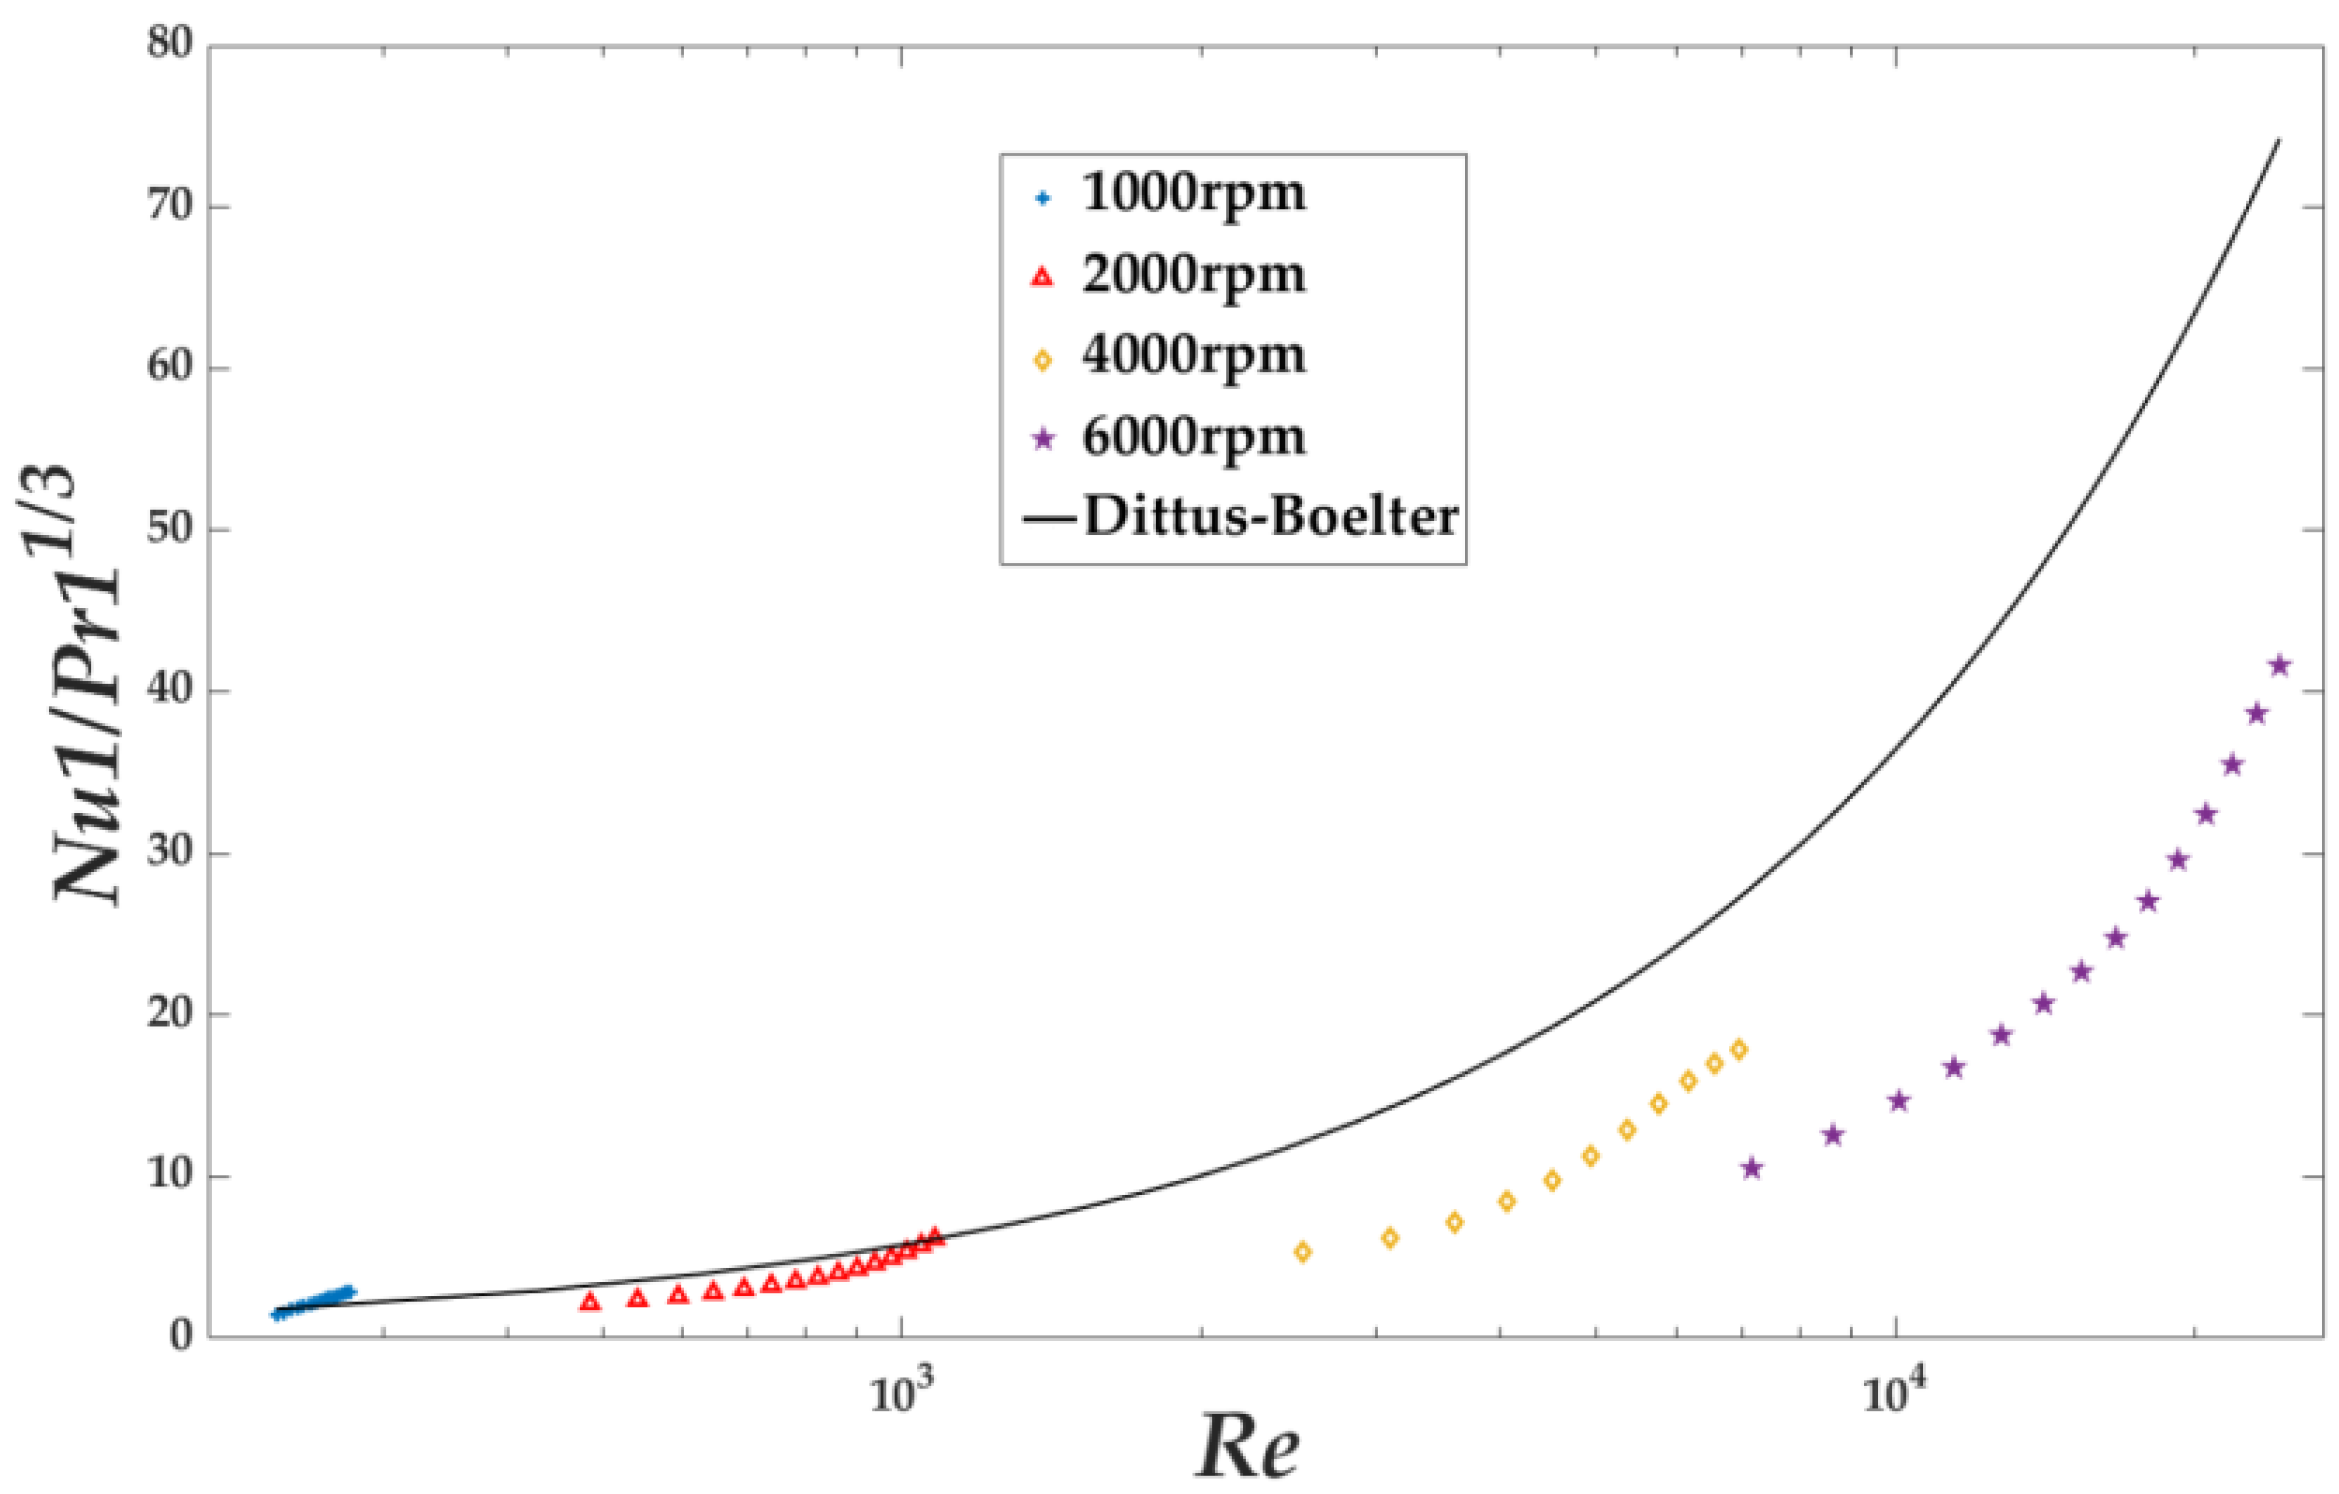
A log-linear plot of N u 1 / P r 1 1 / 3 versus Re (up to 24,320) is shown in Figure 13, which presents the development of the Nusselt number with the Reynolds number and rotational speed for the inner cylinder’s annular flow. At the speeds of 1000 rpm and 2000 rpm, the experimental results agreed well with the Dittus–Boelter relation. However, the experimental results varied a lot from the reference relation when the speeds were at 4000 rpm and 6000 rpm, as Table 2 shows. The experimental results do not give good agreement with the comparable one and exhibit even more separation tendency with the increasing of Re. This can be explained because the annular flow in this pump belongs to high shear flow, the small bubble cavitation grows, and the void fraction increases with the increasing oil temperature and rotational speed [30]. The higher the inner annular rotation speed, the more shear stress and bubble cavitation generated. In addition, the bubbles adhering to the outer annuli will reduce the heat transfer from the two-phase flow to the cap.
The correction factor α was determined through the Taylor flow heat transfer experiment. It is 1.155 at 1000 rpm, 0.789 at 2000 rpm, 0.546 at 4000 rpm, and 0.457 at 6000 rpm, shown in Table 2.
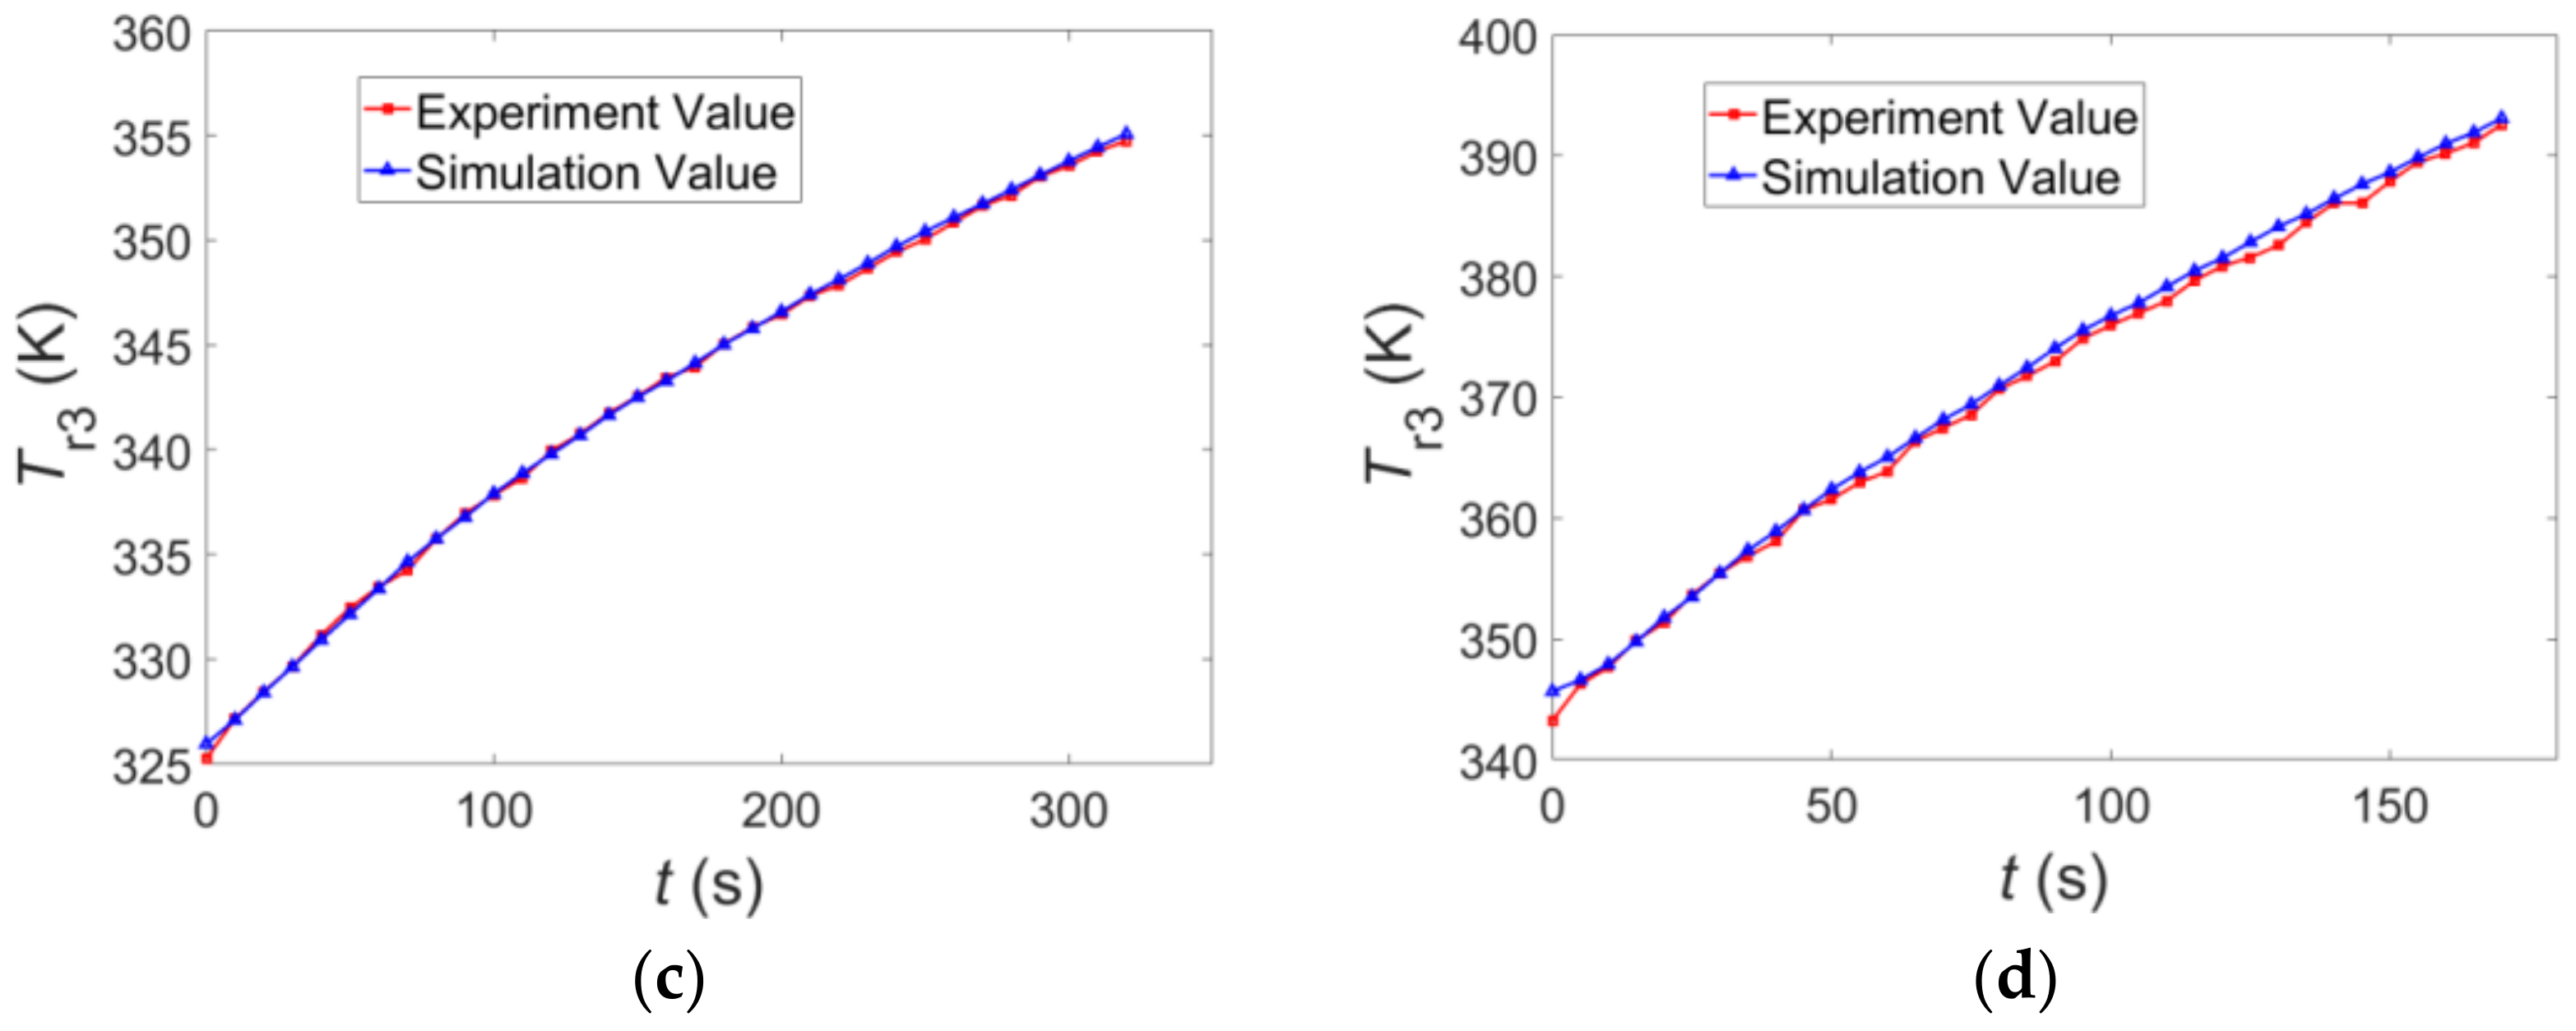
The test temperature of the cap head T r 3 can be calculated and compared with the average temperature of simulation T r 3 , as shown in Figure 14, from 1000 rpm to 6000 rpm. Moreover, Table 3 demonstrates that the simulation results can represent the experimental data within ± 1% relative deviation, and the simulation results agree well with the experimental values of T r 3 . So, it can be concluded that the two-dimensional heat transfer model, the experimental data, the correction factor α , and the deduced convective heat transfer coefficient h s 1 are accurate.

5.2. The Heat Loss Analysis of the Pump Transmission

Heat loss analysis is an important method to analyze the mechanical efficiency of a 2D piston pump. When the pump runs without load, the temperature rises almost due to the churning loss. So, the energy losses of the pump transmission are mainly attributed to heat loss. According to the former study results on the same pump’s transmission about churning loss torque [19,22], T c h = 7 . 25 × 10 5 n 2 . 5 × 10 9 n 2 . In this formula, the effect of the oil temperature on churning loss torque is ignored. Thus, the churning loss of power is
P c h = T ch · n 9550 × 10 3 = 7 . 59 × 10 6 n 2 2 . 62 × 10 10 n 3
The churning loss P c h turns into the transmission heat losses, including the oil internal energy increment ( E o i l ˙ ), the inner cylinder internal energy increment ( E s t c ˙ ), and heat flows ( q c o n v 1 ,   q c o n v 3 ,   q c o n v 5 ) . The heat flows ( q c o n v 1 i ,   q c o n v 3 i ,   q c o n v 5 i ) , which transfer into the inner cylinder, turn into its internal energy increment ( E s t c ˙ ), described in Relation (52). The heat flows of the pump cap ( E o u t c ˙ ) are carried away by radiation to the surroundings, and heat is transferred to the air, as shown in Figure 5 and Relation (53).
P c h = E o i l ˙ + E s t c ˙ + q c o n v 1 + q c o n v 3 + q c o n v 5
E s t c ˙ = q c o n v 1 i + q c o n v 3 i + q c o n v 5 i
E o u t c ˙ = E o u t ˙ + E o u t s ˙
The transmission heat loss simulation results with experimental T oil compared with the reference churning loss at the rotational speeds of 1000 rpm, 2000 rpm, 4000 rpm, and 6000 rpm are plotted in Figure 15 and shown in Table 4. With the rise of rotational speed, the transmission heat loss raises with the churning loss. The above four figures have a common characteristics: the oil temperature keeps increasing with time, and the heat loss first increases rapidly and then gradually decreases. The initial temperature of the heat loss model is uniformly set by T r 2 . That leads to a smaller temperature difference between the oil and the contact surfaces, resulting in a lower heat loss at first. At the same speed, as the oil temperature increases, the viscosity of the oil decreases continuously, and the churning loss decreases gradually. Thus, the heat loss is also reduced accordingly.
At 1000 rpm, the T oil curve is flat, and the transmission heat transfer could be treated as a steady-state one. The average heat loss (6.27 W) is lower than the reference churning loss about 14.43%. This could be explained by the fact that the test churning torque is somehow larger than the actual value due to the sensor measurement accuracy under low torque.
From 2000 rpm to 6000 rpm, the transmission heat transfer, belonging to the unsteady-state heat transfer, can barely attain the thermal equilibrium. The initial temperatures of the simulation model are set to approach the initial T oil , so the heat transfer from oil to transmission is artificially weakened at the beginning. Thus the heat loss values are relatively small and increase rapidly to the peaks at first. As the oil temperature rises, the slope of the T oil curve is becoming smaller, and the temperature difference between the oil and the contact surfaces also gradually decreases. Moreover, the small bubble cavitation grows, and the void fraction increases, reducing the convective heat transfer, as Figure 13 shows. In this way, the heat loss curves gradually decline after reaching the maximum.
The reference churning loss formula is deduced under the following experimental conditions ( T oil and test time for each speed): 290.15 K and 10 s at 1000 rpm, 290.65 K and 10 s at 2000 rpm, 291.15 K and 10 s at 4000 rpm, and 292.15 K to 295.15 K and 10 s at 6000 rpm [22]. The kinematic viscosity of the oil is considered a constant ( 45 . 8 × 10 6 m 2 / s , at 313.15 K), and the effect of T oil on churning loss is ignored. However, the properties of the materials, including oil and pump components, vary with temperatures in the pump heat transfer model of this paper. This distinction means that the transmission heat loss simulation results can only agree with the reference churning loss values in certain short times at different speeds.
At 6000 rpm, the deviations of heat loss simulation values to reference churning loss value enlarge profoundly as Figure 15d shows. The heat loss is about 44.34% larger than the churning loss on average. Although the pump is not on-load, the heat generated by the friction of the cam-roller set cannot be neglected at high speed. It adds extra heat to the oil and eventually enhances the heat loss.
Table 5 shows the proportion of different heat flows to total heat loss of the transmission from 1000 rpm to 6000 rpm. These values are calculated by the transmission thermal simulation with experimental data. The distribution of the transient heat losses are: 36.87% into the outer cylinder’s inner-face, 27.74% into the cylinder head, 12.79% into the cap head, 13.30% into the inner cylinder, and 9.30% into the oil. The pump cap carries away about 49.66% of the heat flow, which turns into its internal energy (12.85%) and will be taken away by the circumstance (36.81%). About 27.74% of the heat is transferred into the cylinder head, also turns into its internal energy, and will be carried away by the oil in the cylinder block. About 9.30% of the heat stays in the oil and makes its temperature increase.
Compared with q c o n v 1 and q c o n v 3 , the cap head carries away the least percentage of heat ( q c o n v 2 ) because the distance between the inner cylinder and the end cap is larger than the need (the hydraulic diameter of the oil between them is the largest), which reduces its convective heat transfer coefficient. So, the gap between them should be shortened to enhance q c o n v 2 . Since q c o n v 1 contributes the most to the heat loss, the heat dissipation ability of the transmission can be better improved by setting fans to strengthen the convection intensity or adding fins to the shell to increase the heat dissipation area.

6. Conclusions

The heat transfer theoretical and simulation model of the pump’s transmission were investigated, and relevant thermal experiments were conducted to capture temperature data and mutually validated with each other from 1000 rpm to 6000 rpm. The transmission’s thermal status and heat loss analysis were preliminarily studied. The conclusions can be summarized as follows:
(1)
The Dittus–Boelter relation cannot be applied directly to the pump transmission above 4000 rpm, so a corrected one was investigated to deal with the convective heat transfer of the vortex flows in it. The correction factor α was determined through the Taylor flow heat transfer experiment. It is 1.155 at 1000 rpm, 0.789 at 2000 rpm, 0.546 at 4000 rpm, and 0.457 at 6000 rpm. In addition, the corrected relation was verified to be accurate.
(2)
With the rise of rotational speed, the transmission heat loss raises with the churning loss. At the same speed, as the oil temperature increases, the churning loss decreases gradually with the decrease of oil viscosity, and the heat loss is also reduced accordingly.
(3)
The heat loss simulation results are 6.27 W at 1000 rpm, 32.64 W at 2000 rpm, 93.06 W at 4000 rpm, and 312.87 W at 6000 rpm. They agree well with the reference churning loss experimental formula from 1000 rpm to 4000 rpm. At 6000 rpm, the heat loss is 44.35% higher than the reference value because of extra heat generated by the friction of the cam-roller set.
(4)
The distribution of the transient heat losses in the pump transmission are: 49.66% into the end cap, 27.74% into the cylinder head, 13.30% into the inner cylinder, and 9.30% into the oil. The pump cap carries away about 49.66% heat flow, which turns into its internal energy (12.85%) and transfers to the circumstances (36.81%). About 27.74% of the heat transfers into the cylinder head. In all, 77.40% of the heat transfers away from the transmission; 22.60% of the heat changes into its internal energy and makes its temperature rise.
The conclusions in this paper demonstrate the accurate thermal status of the 2D pump transmission. It will help researchers improve the pump toward high speed, high pressure, and efficient operation and cooling.

Author Contributions

Formal analysis, J.R.; experiment, L.C. and Z.L.; data manipulation, L.C.; writing—original draft preparation, L.C.; writing—review and editing, W.J.; funding acquisition, S.L., W.J. and L.C. All authors have read and agreed to the published version of the manuscript.

Funding

This research was funded by the National Key Research and Development Program of China, grant number 2019YFB2005202, and by the Natural Science Foundation of Zhejiang Province, grant number LY21E050015, and by the Department of Education of Zhejiang Province, grant number Y201839694.

Conflicts of Interest

The authors declare no conflict of interest.

Nomenclature

c cy Specific heat of the cylinderkJ/kg·K
D c 1 Outer diameter of the annular pistonm
D h 1 Hydraulic diameter of the inner annulusm
D h 2 Hydraulic diameter of the outer cylinder’s outer wallm
D h 3 Hydraulic diameter of the cap head’s outer wallm
D s 1 Hydraulic diameter of the cap headm
D s 2 Hydraulic diameter of the cylinder headm
D s 3 Inner diameter of the annular pistonm
D s 4 Diameter of the transmission shaftm
D s 4 Diameter of the main pistonm
E in ˙ Input energy rate of the annuluskJ/s
E ins ˙ Annular input energy rate of the cap headkJ/s
E o i l ˙ Energy output rate of the oilkJ/s
E out ˙ Energy output rate of the annuluskJ/s
E outc ˙ Energy output rate of the capkJ/s
E outs ˙ Energy output rate of the cap headkJ/s
E g ˙ Change rate of energy generation of the annuluskJ/s
E gs ˙ Change rate of energy generation of the cap headkJ/s
E st ˙ Change rate of the cylinder’s internal energy of the annuluskJ/s
E sts ˙ Change rate of the cylinder’s internal energy of the cap headkJ/s
F c 3 Shearing force on the left annular pistonN
F c 3 Shearing force on the left neck bushN
F c 4 Shearing force on the right annular pistonN
F c 4 Shearing force on the right neck bushN
F s 4 Shearing force on the transmission shaftN
F s 4 Shearing force on the main pistonN
h Maximum stroke of the pistonm
h c 1 Thickness between the annular piston and cylinder bushm
h s 3 Thickness between the annular piston and neck bushm
h s 4 Thickness between the main piston and transmission shaftm
h 1 Convective heat transfer coefficient between oil and inner wallW/m2·K
h 1 i Convective heat transfer coefficient between oil and inner annulus wallW/m2·K
h 2 Convective heat transfer coefficient between surroundings and outer wallW/m2·K
h 3 Convective heat transfer coefficient between surroundings and cap headW/m2·K
h s 1 Convective heat transfer coefficient between oil and cap headW/m2·K
h s 1 i Convective heat transfer coefficient between oil and left side of inner cylinderW/m2·K
h s 2 Convective heat transfer coefficient between oil and cylinder headW/m2·K
h s 2 i Convective heat transfer coefficient between oil and right side of inner cylinderW/m2·K
k o i l Thermal conductivity of the oilW/m·K
k 2 Thermal conductivity of the airW/m·K
L c 1 Fluid field length of the annular pistonm
L c y Fluid field length of the outer annulusm
L s 3 Length of the annular pistonm
L s 4 Length of the main pistonm
M b Bearing friction torqueN·m
nRotational speedrpm
N u 1 Nusselt number of the inner wall
N u 2 Nusselt number of the outer wall
N u s 1 Nusselt number of the cap head
N u s 2 Nusselt number of the cylinder head
P c 1 Viscous resistance power on the cylinder bushW
P c 1 Viscous resistance power on the annular pistonW
P c 3 Viscous resistance power on the left annular pistonW
P c 3 Viscous resistance power on the left neck bushW
P c 3 a Average viscous resistance power on the left annular pistonW
P c 3 a Average viscous resistance power on the left neck bushW
P c 4 Viscous resistance power on the right annular pistonW
P c 4 Viscous resistance power on the right neck bushW
P c 4 a Average viscous resistance power on the right annular pistonW
P c 4 a Average viscous resistance power on the right neck bushW
P ch Churning loss powerW
P s 4 Viscous resistance power on the transmission shaftW
P s 4 Viscous resistance power on the main pistonW
P s 4 a Average viscous resistance power on transmission shaftW
P s 4 a Average viscous resistance power on the main pistonW
P r 2 Prandtl number of the outer wall
P rs Prandtl number of the cap head oil
P rs 1 Prandtl number of the cylinder head oil
q c 1 Heat-transfer rate of the oil and cylinder bushkJ/s
q c 1 i Heat-transfer rate of the oil and annular pistonkJ/s
q c o n v 1 Heat-transfer rate of the oil and inner wallkJ/s
q c o n v 1 i Heat-transfer rate of the oil and inner annuluskJ/s
q c o n v 2 Heat-transfer rate of the air and outer wallkJ/s
q c o n v 3 Heat-transfer rate of the oil and cap headkJ/s
q c o n v 3 i Heat-transfer rate of the oil and left side of the inner cylinderkJ/s
q c o n v 4 Heat-transfer rate of the air and cap headkJ/s
q c o n v 5 Heat-transfer rate of the air and cylinder headkJ/s
q c o n v 5 i Heat-transfer rate of the air and right side of the inner cylinderkJ/s
q c y Heat-transfer rate of the annuluskJ/s
q cys Heat-transfer rate of the cap headkJ/s
q h 1 Heat-transfer rate of the cap’s bearing housingkJ/s
q r a d 1 Radiation heat transfer rate of the cap head and surroundingskJ/s
q r a d 2 Radiation heat transfer rate of the outer wall and surroundingskJ/s
r 1 Radius of the inner wallm
r 2 Radius of the outer wallm
r 3 Radius of inner annulusm
R a 2 Rayleigh number of the outer wall
R es 1 Reynolds number of the cap head oil
R es 2 Reynolds number of the cylinder head oil
S 1 Area of the cap headm2
S 1 i Area of the left side of the inner cylinderm2
S 2 Area of the cylinder headm2
S 2 i Area of the right side of the inner cylinderm2
S cyi Area of the inner annulusm2
t Times
t r Time per rounds
T c 1 Shearing torque on the cylinder bushN·m
T c 1 Shearing torque on the annular pistonN·m
T ch Churning loss torqueN·m
T c y Cylinder temperatureK
T o i l Oil temperatureK
T r 1 Inner wall temperatureK
T r 1 i Inner Wall temperature of annulusK
T r 2 Outer wall temperature of outer cylinderK
T r 3 Outer wall temperature of cap headK
T s 1 Inner wall temperature of cap headK
T s 1 i Right side wall temperature of the inner cylinderK
T s 2 Wall temperature of cylinder headK
T s 1 i Left side wall temperature of the inner cylinderK
T sur Temperature of surroundingsK
T Environment temperatureK
v 1 Inner annular tangential velocitym/s
v 2 Axial velocity of the main carrierm/s
v 2 Axial velocity of the balancing carrierm/s
v r a v e 1 Mean velocity of the cap head oilm/s
v r a v e 2 Mean velocity of the cylinder head oilm/s
v e Effective velocity of the carrierm/s
V c y Volume of the cylinderm3
W c 3 Work performed by the shearing force on the left annular piston per revolutionJ
W s 4 Work performed by the shearing force on the transmission shaft per revolutionJ
W s 4 Work performed by the shearing force on the main piston per revolutionJ

Greek Symbols

ϑ s Kinematic viscosity of the oilm2/s
μ c 1 Dynamic viscosity of the oil between cylinder bush and annular pistonN·s/m2
μ c 3 Dynamic viscosity of the oil between neck bush and annular pistonN·s/m2
μ s 4 Dynamic viscosity of the oil between transmission shaft and main pistonN·s/m2
ρ c y Density of the cylinderkg/m3
ω Angular velocityrad/s
α Correction factor
σ Stefan–Boltzmann constant
ε Emissivity

References

  1. Yang, H.; Pan, M. Engineering research in fluid power: A review. J. Zhejiang Univ. A Sci. 2015, 16, 427–442. [Google Scholar] [CrossRef]
  2. Gracey, M.T. High Pressure Pumps, 1st ed.; Gulf Professional Publishing: Burlington, OH, USA, 2006; p. 197. [Google Scholar]
  3. Chao, Q.; Zhang, J.; Xu, B.; Huang, H.; Pan, M. A review of high-speed electro-hydrostatic actuator pumps in aerospace applications: Challenges and solutions. J. Mech. Des. 2019, 141, 050801. [Google Scholar] [CrossRef]
  4. Li, C.; Jiao, Z. Thermal-hydraulic modeling and simulation of piston pump. Chin. J. Aeronaut. 2006, 19, 354–358. [Google Scholar] [CrossRef]
  5. Li, C.; Jiao, Z. Calculation method for thermal-hydraulic system simulation. J. Heat Transf. 2008, 130. [Google Scholar] [CrossRef]
  6. Banaszek, A.; Petrovi, R. Calculations of the unloading operation in liquid cargo service with high density on modern product and chemical tankers equipped with hydraulic submerged cargo pumps. Stroj. Vestn. J. Mech. Eng. 2010, 56, 186–194. [Google Scholar]
  7. Manring, N.D.; Mehta, V.S.; Nelson, B.E.; Graf, K.J.; Kuehn, J.L. Scaling the speed limitations for axial-piston swash-plate type hydrostatic machines. J. Dyn. Syst. Meas. Control 2014, 136, 031004. [Google Scholar] [CrossRef]
  8. Sidders, J.A.; Tilley, D.G.; Chapple, P.J. Thermal-hydraulic performance prediction in fluid power systems. Proc. Inst. Mech. Eng. Part I J. Syst. Control. Eng. 1996, 210, 231–242. [Google Scholar] [CrossRef]
  9. Eduardo, D.L.; Victor Juliano, D.N. A new evaluation method for hydraulic gear pump efficiency through temperature measurements. SAE Tech. Pap. 2006, 1, 3503. [Google Scholar]
  10. Iben, U.; Wrona, F.; Munz, C.D. Cavitation in hydraulic tools based on thermodynamic properties of liquid and gas. J. Fluids Eng. 2002, 124, 1011–1017. [Google Scholar] [CrossRef]
  11. Green, T.E.; Snell, J.R. Thermographic inspection of hydraulic systems. In Proceedings of the Thermosense XVIII: An International Conference on Thermal Sensing and Imaging Diagnostic Applications, Orlando, FL, USA, 15 March 1996; pp. 25–30. [Google Scholar]
  12. Ivantysynova, M.; Lasaar, R. An investigation into micro and macrogeometric design of piston/cylinder assembly of swash plate machines. Int. J. Fluid Power 2004, 5, 23–36. [Google Scholar] [CrossRef]
  13. Zhang, J.; Li, Y.; Xu, B.; Chen, X.; Pan, M. Churning losses analysis on the thermal-hydraulic model of a high-speed electro-hydrostatic actuator pump. Int. J. Heat Mass Transf. 2018, 127, 1023–1030. [Google Scholar] [CrossRef]
  14. Xing, T.; Xu, Y.; Ruan, J. Two-dimensional piston pump: Principle, design, and testing for aviation fuel pumps. Chin. J. Aeronaut. 2020, 33, 1349–1360. [Google Scholar] [CrossRef]
  15. Dingcan, J.; Jian, R.; Sheng, L.; Bin, M.; Lingfeng, W. Modelling and validation of a roller-cam rail mechanism used in a 2D piston pump. J. Zhejiang Univ. A Sci. 2019, 20, 201–217. [Google Scholar] [CrossRef]
  16. Zhu, K.; Ruan, C.; Wang, H.; Li, S.; Ruan, J. Analysis of the torque loss of high-speed transmission mechanism with a stacked roller set. Machines 2021, 9, 140. [Google Scholar] [CrossRef]
  17. Wang, H.; Ding, C.; Huang, Y.; Li, S.; Jian, R. Design and research of 2D piston pumps with a stacked cone roller set. Proc. Inst. Mech. Eng. Part C J. Mech. Eng. Sci. 2022, 236, 2128–2146. [Google Scholar] [CrossRef]
  18. Shentu, S.; Ruan, J.; Qian, J.; Meng, B.; Wang, L.; Guo, S. Study of flow ripple characteristics in an innovative two-dimensional fuel piston pump. J. Braz. Soc. Mech. Sci. Eng. 2019, 41, 464. [Google Scholar] [CrossRef]
  19. Huang, Y.; Ruan, J.; Zhang, C.; Ding, C.; Li, S. Research on the mechanical efficiency of high-speed 2D piston pumps. Processes 2020, 8, 853. [Google Scholar] [CrossRef]
  20. Wang, H.; Tong, C.; Ruan, C.; Ding, C.; Li, S.; Ruan, J. Optimization of mechanical efficiency models for 2D piston pumps with a stacked taper roller set. Machines 2022, 10, 180. [Google Scholar] [CrossRef]
  21. Zhang, C.; Jian, R.; Xing, T.; Li, S.; Ding, C. Research on the volumetric efficiency of a novel stacked roller 2D piston pump. Machines 2021, 9, 128. [Google Scholar] [CrossRef]
  22. Huang, Y.; Ding, C.; Wang, H.; Ruan, J. Numerical and experimental study on the churning losses of 2D high-speed piston pumps. Eng. Appl. Comput. Fluid Mech. 2020, 14, 764–777. [Google Scholar] [CrossRef]
  23. Ding, C.; Zhu, Y.; Liu, L.; Tong, C.; Ruan, J. Research on a novel flowmeter with parallel two-dimensional pistons as its metering units. IEEE Access 2019, 7, 110912–110927. [Google Scholar] [CrossRef]
  24. Miller, R.; Miller, M.R.; Stewart, H. Pumps and Hydraulics, 6th ed.; Wiley Publishing: Indianapolis, IN, USA, 2004; p. 239. [Google Scholar]
  25. Childs, P.R.N.; Long, C.A. A review of forced convective heat transfer in stationary and rotating annuli. Proc. Inst. Mech. Eng. Part C J. Mech. Eng. Sci. 1996, 210, 123–134. [Google Scholar] [CrossRef]
  26. Yong, N.L.; Minkowycz, W.J. Heat transfer characteristics of the annulus of twocoaxial cylinders with one cylinder rotating. Int. J. Heat Mass Transf. 1989, 32, 711–722. [Google Scholar] [CrossRef]
  27. Incroprera, F.P.; Dewitt, D.P.; Bergman, T.L.; Lavinne, A.S. Fundamentals of Heat and Mass Transfer; John Wiley & Sons: Hoboken, NJ, USA, 2007. [Google Scholar]
  28. Churchill, S.W.; Chu, H.H.S. Correlating equations for laminar and turbulent free convection from a horizontal cylinder. Int. J. Heat Mass Transf. 1975, 18, 1049–1053. [Google Scholar] [CrossRef]
  29. Hannon, W.M. Rolling-element bearing heat transfer—Part I: Analytic model. J. Tribol. 2015, 137, 031102. [Google Scholar] [CrossRef]
  30. Hamakawa, H.; Mori, H.; Iino, M.; Hori, M.; Yamasaki, M.; Setoguchi, T. Experimental study of heating fluid between two concentric cylinders with cavities. J. Therm. Sci. 2008, 17, 175–180. [Google Scholar] [CrossRef] [Green Version]
Figure 1. Schematic configuration of the 2D piston pump with balancing sets.
Machines 10 00860 g001
Figure 2. Schematic configuration of the pump transmission sets: (a) main piston transmission set; (b) annular piston transmission set.
Machines 10 00860 g002
Figure 3. The axial velocities of the left carriers: (a) θ ( 0 , π 2 ) ( π , 3 π 2 ) ; (b) θ ( π 2 , π ) ( 3 π 2 , 2 π ) .
Machines 10 00860 g003
Figure 4. The axial velocity of the carriers.
Machines 10 00860 g004
Figure 5. Schematic configuration of heat transfer of the pump cap.
Machines 10 00860 g005
Figure 6. The velocities of the inner cylinder: (a) on the side surface; (b) on the bottom surface.
Machines 10 00860 g006
Figure 7. The heat flows in the left cap: (a) on the cap’s inner surface; (b) on the inner cylinder.
Machines 10 00860 g007
Figure 8. The torque of shearing flow by the annular piston.
Machines 10 00860 g008
Figure 9. The axial shearing forces: (a) between the annular pistons and neck bushes; (b) between the main piston and transmission shaft.
Machines 10 00860 g009
Figure 10. The heat transfer simulation of the outer annulus: (a) the grid model; (b) the T r 2 simulation results at 6000 rpm.
Machines 10 00860 g010
Figure 11. The heat transfer simulation of the 2D pump: (a) the cross-section view of the 2D pump heat transfer model; (b) the cross-section view of the 2D pump heat transfer simulation result at 6000 rpm.
Machines 10 00860 g011
Figure 12. The 2D pump heat transfer experimental setup: (a) an overview of the test rig; (b) schematic of the cap temperature measurement system.
Machines 10 00860 g012
Figure 13. Experimental and reference Nusselt number at different Reynolds number and speed.
Machines 10 00860 g013
Figure 14. The heat transfer simulation of the cap head: (a) the T r 3 values at 1000 rpm; (b) the T r 3 values at 2000 rpm; (c) the T r 3 values at 4000 rpm; (d) the T r 3 values at 6000 rpm.
Machines 10 00860 g014aMachines 10 00860 g014b
Figure 15. The transmission heat loss simulation results with experimental T oil compared with the reference churning loss: (a) at 1000 rpm; (b) at 2000 rpm; (c) at 4000 rpm; (d) at 6000 rpm.
Machines 10 00860 g015
Table 1. The experimental conditions and devices’ details.
DescriptionValue
Sanjing SL06 torque/speed sensorRange 0~10 Nm, accuracy ± 0.1%; Rotational speed range 0~18,000 rpm
Smart Sensor AS887 thermometerRange −200~1372 °C, accuracy ± 0.1% °C
K-type thermocoupleRange −50~300 °C, accuracy ±1.5%
Atmospheric pressure101.16 kPa
Rotational speed1000~6000 rpm
Initial surrounding temperature 23.5 °C
Initial environment temperature23.5 °C
Table 2. Deviation of experimental Nusselt number to the Dittus–Boelter relation and correction factor α at different speed.
Speed (rpm)Relative Deviation RangeAverage Deviation Correction Factor α
1000−19.78~38.87%15.49%1.155
2000−33.57~0.52%−21.11%0.789
4000−56.21~−34.32%−45.41%0.546
6000−62.34~−43.94%−54.31%0.457
Table 3. Deviations of simulation values to experimental values of T r 3 .
Speed (rpm)Relative Deviation RangeMean Deviation
10000.01~0.07%0.04%
20000.02~0.24%0.08%
4000−0.09~0.22%0.03%
6000−0.05~0.70%0.19%
Table 4. Deviations of simulation values to reference values at different speeds.
Speed (rpm)Mean Heat Loss (W)Churning Loss (W)Relative Deviation RangeMean Deviation
10006.277.33−38.02~3.75%−14.43%
200032.6428.27−15.68~53.90%15.45%
400093.06104.71−29.92~9.39%−11.12%
6000312.87216.75−6.13~67.33%44.35%
Table 5. Heat loss distribution proportion at different speeds.
Speed (rpm) E o i l ˙ E s t c ˙ q c o n v 1 q c o n v 2 q c o n v 3 E o u t c ˙
10009.58%14.18%32.89%14.14%29.21%36.04%
20009.89%14.57%35.92%12.09%27.52%37.90%
40009.07%12.71%37.54%12.46%28.22%35.38%
60008.67%11.75%41.11%12.45%26.01%37.90%
Mean values9.30%13.30%36.87%12.79%27.74%36.81%
Publisher’s Note: MDPI stays neutral with regard to jurisdictional claims in published maps and institutional affiliations.