Article

CFD-DEM Study of Pleated Filter Plugging Process Based on Porous Media Model

1
School of Mechanical Engineering, University of Jinan, Jinan 250022, China
2
Shandong Roadway Construction Machinery Manufacturing Co., Ltd., Jining 272000, China
*
Author to whom correspondence should be addressed.
Machines 2022, 10(10), 862; https://doi.org/10.3390/machines10100862
Submission received: 1 September 2022 / Revised: 18 September 2022 / Accepted: 21 September 2022 / Published: 26 September 2022
(This article belongs to the Section Machine Design and Theory)

Abstract

:
The pneumatic conveying process of fine particles through filters was studied by CFD-DEM simulation method. The porous media model and porous structure were used to simulate the airflow state and the blocking effect of fine particles when they flowed through the filter. Under different particle feed rates and initial particle velocities, the effects of the plugging rate and settling velocity in pleated filters were analyzed, and the effect of particle deposition height on fluid zone was studied. The results showed that particles should avoid the feed rate of 250–750 g/s and choose the initial particle velocity of 3–6 m/s to achieve lower plugging rate and faster settling velocity. The position of the filter should avoid the particle inlet to avoid the increase of non-uniformity. Timely cleaning of particles in the filter box can improve the filtering performance.

1. Introduction

With the deepening understanding of the concept of environmental protection in all walks of life, the treatment requirements of fine particles are also rising [1,2,3]. Due to its good fluid permeability and porous structure, the pleated filter screen is widely used in the filtration of fine particles in industries including traditional minerals, metallurgy, and other fields to obtain clean air [4,5,6,7]. During the filtration of particles, the porous media structure of the filter screen plays the role of the filter, making it difficult for small particles to be discharged into the air. The folded structure on the surface of the filter screen plays the role of a baffle. When larger particles arrive here, they are blocked and settle or get stuck between the folded structures. The blockage of small particles in the filter screen can be widely removed by means of reverse pulse airflow [8]. However, it is difficult to remove large particles between the fold structures due to the limitation of gravity and resistance. The large surface area of large particles will not only cause the failure of the porous media action at the location of blockage but also have a great impact on the porous media action inside the fold. Without affecting the normal operation of the filter screen, it is difficult to remove the large particles stuck in the middle of the filter screen fold. Moreover, particles in the filter screen will deform the filter screen and affect the filter performance [9,10]. Therefore, in order to ensure the efficient operation of the filter screen, it is necessary to study the dynamic characteristics of particles at the filter screen, avoid the particle sticking in the filter screen, and improve the performance of the filter screen [11].
Due to the complexity of the filter screen structure and the tightness of the conveying process, investigation of the filter screen filtration performance and particle deposition process through experimental research takes a long time and the process is relatively complex [12]. The simulation research on the blocking effect of the filter screen on fluid and particles can not only save time but also ensure the accuracy of the results. Moreover, the changes of filter screen structure and particle shape and size can be fully considered. Computational fluid dynamics (CFD) and discrete element method (DEM) are often used in the study of fluid and particles, which can accurately characterize the continuous motion characteristics of fluid and the interaction between particles and solid phase. The research on the structure of porous filter screen by CFD mainly considers the influence of solid-phase pore wall structure on the fluid flow direction [13]. Compared with plane filters, pleated filters have a lower pressure drop [14]. The pleated structure of filter screen will have an obvious impact on the fluid flow velocity [15,16], and dense pleated filter screens can reduce the flow velocity more [17]. The stability between pleated filter gaps will also affect the flow field [18]. In addition, the influence of temperature on fluid motion characteristics is also a main research direction. The high viscosity caused by high temperature leads to low filtration efficiency [19,20], and the fluid will also erode the filter [21,22]. Most of the studies are aimed at optimizing the filter structure or improving the simulation reliability according to the flow characteristics such as filter pressure loss and velocity distribution. However, the simple CFD method lacks the consideration of the interaction between particles and solid phase, so it is difficult to accurately describe the complex gas–solid two-phase flow process. DEM can fully simulate the kinematic and dynamic characteristics of particles, such as predicting the number of particles in the conical hopper and the particle discharge time [23], analyzing the gate load before unloading the dustbin according to the particle accumulation characteristics [24], optimizing the conveyor structure based on the particle conveying speed and interaction force [25], and studying the influence of particle shape on the load movement of the tumbling mill [26]. At present, the numerical research on the filtration process of the filter rarely considers the filtration process of particles, and the existence of particles will have a great impact on the efficient work of the filter. Therefore, the CFD-DEM coupling method can fully consider the filtration effect and deposition characteristics of particles when they flow through the filter [27].
The pressure drop caused by airflow will have a great impact on the filtration performance of the filter [28,29,30]. The complexity of the filter screen makes it difficult to mesh and calculate. The simplification of the filter structure provides the possibility for simulation [31], but it is difficult to simulate the real pressure drop behavior. Porous media model [32] can simulate the pressure drop of fluid in complex porous structure, but it cannot simulate the pressure drop caused by particle blocking. Therefore, large errors will occur in the simulation. The CFD-DEM coupling method can realize the interaction of particle information and flow field information [33,34]. When the particles accumulate in the filter screen, the corresponding pressure drop of the fluid phase will occur, which can greatly solve the problem of insufficient consideration of pressure drop caused by particle accumulation [35] in the porous media model.
Aiming to study the distribution of particles considering actual pressure drop caused by the filter screen, the CFD-DEM coupling method is used. The porous media model is used to simulate the airflow pressure drop in the CFD software. Moreover, the real porous structure is applied to demonstrate the blocking of particles in the DEM software. It allows the filtration process of particles in the flow field transport state to be more accurately simulated. This work will provide a reference for the determination of conveying parameters of fine particles and the improvement of filter screen performance.

2. Numerical Model and Simulation Conditions

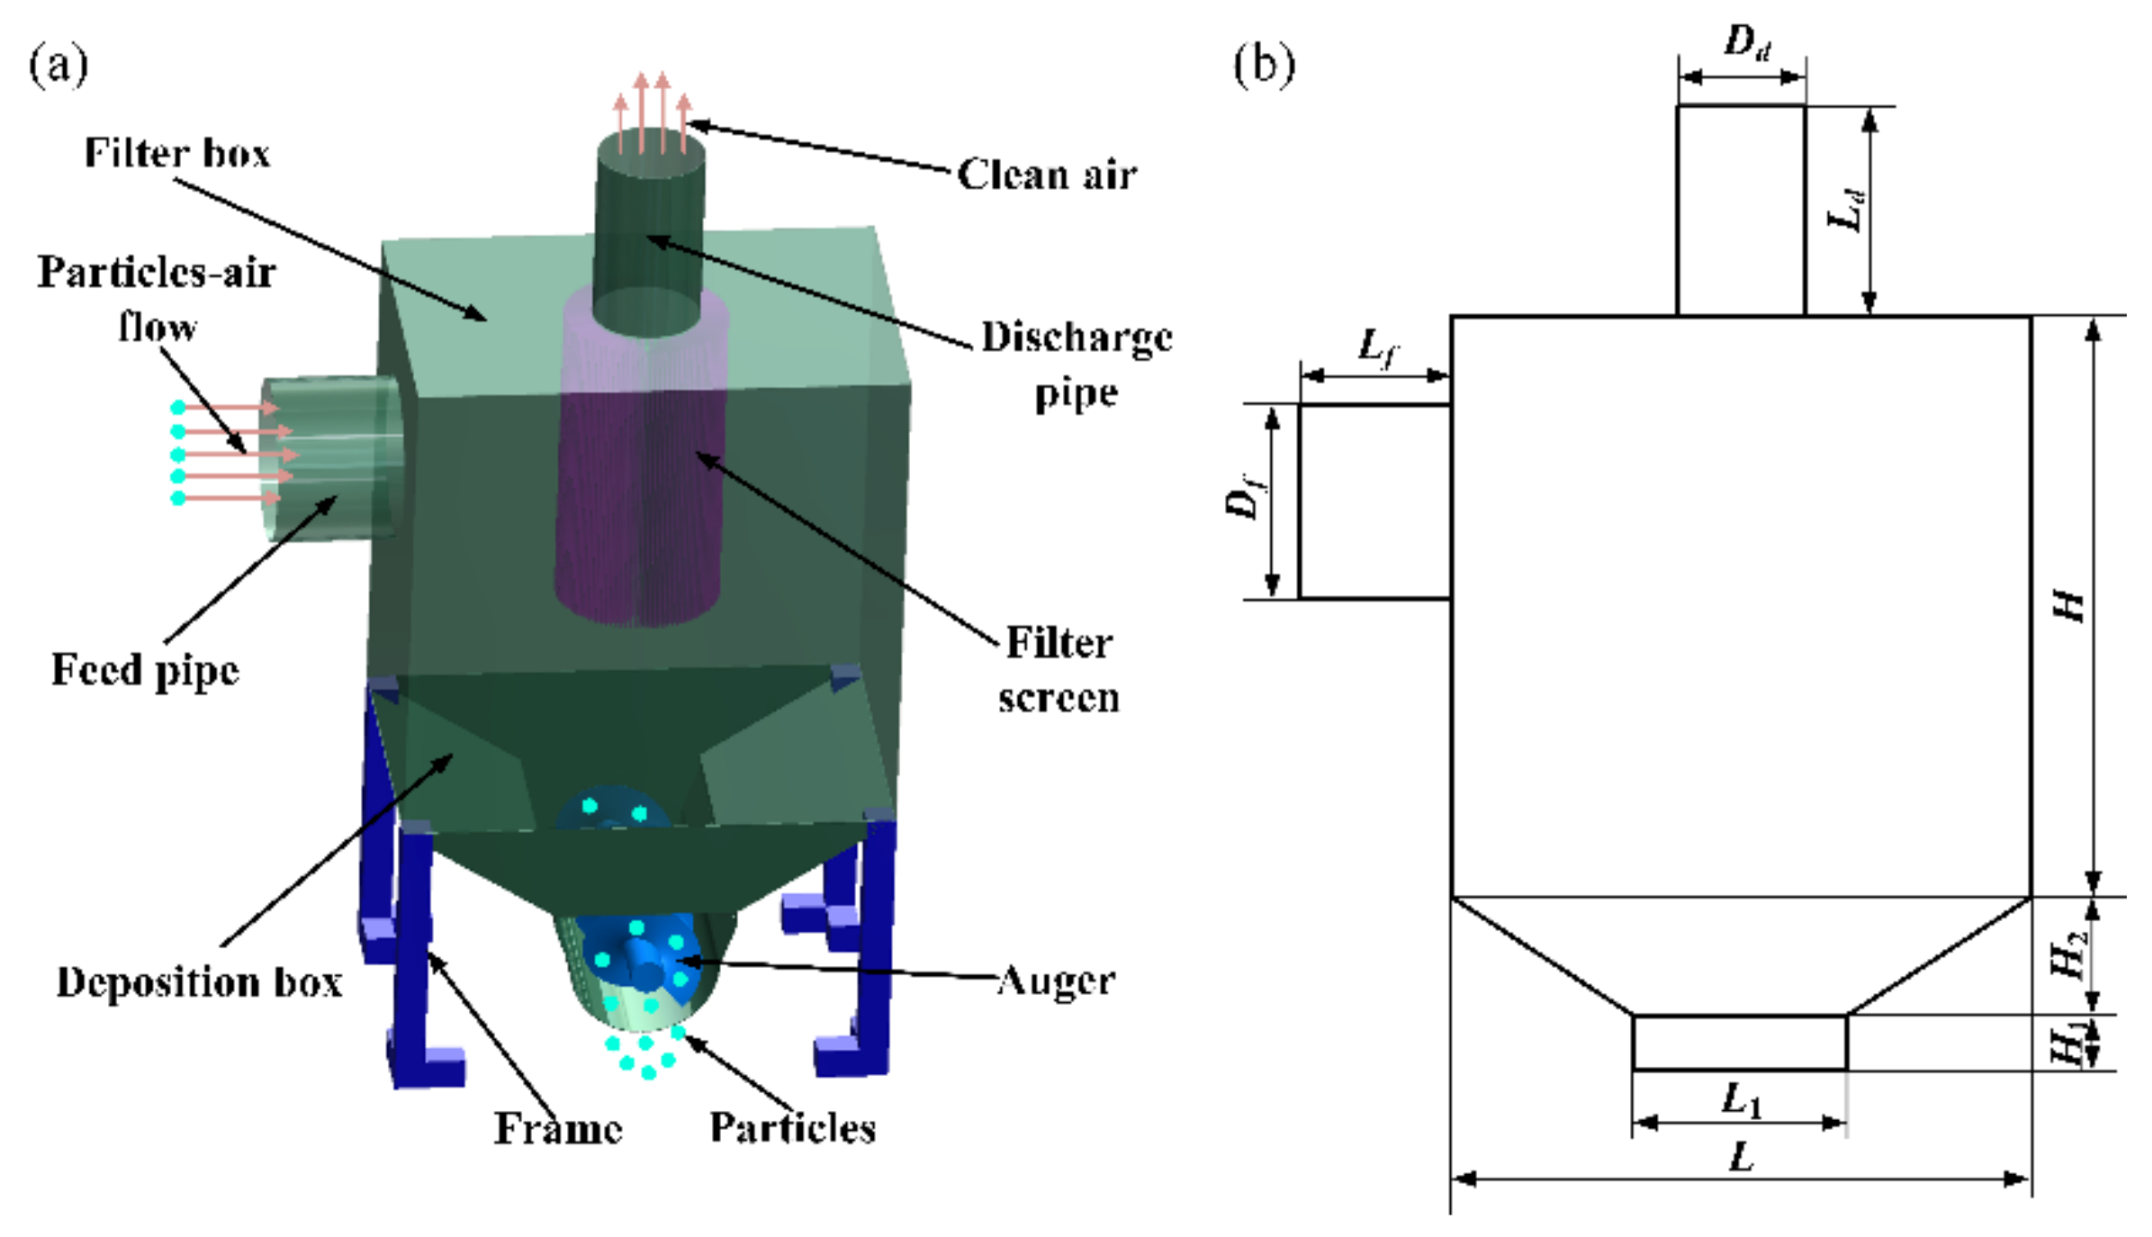
2.1. Filter Configuration and Performance Evaluation Indexes

Figure 1 shows the overall structure configuration of the filter equipment. As can be seen from the overall structure configuration in Figure 1a, the particles/airflow enter the filter box at the feed pipe when work starts. Subsequently, the larger particles settle to the deposition box under the action of gravity, and the others follow the airflow to the filter. Under the barrier of the screen, deposition process occurs in some particles, and the rest of the particles gather inside the filter. Ultimately, the particles are discharged through the auger after falling to the deposition box, and only relatively clean air is output at the discharge pipe. Figure 1b shows the overall structural dimension: the diameter of the feed pipe Df = 200 mm and the length Lf = 154 mm; the discharge pipe diameter Dd = 132 mm and the length Ld = 220 mm; the length L × width W × height H of the filter box is 400 mm × 600 mm × 600 mm. The deposition box is composed of discharge part and transition part with height H1 = 40 and H2 = 80, respectively. The length of discharge part L1 = 218 mm, and the width is consistent with the width of the filter box.
The accumulation of particles in the filter seriously affects the filtration performance [36]. Therefore, the cleaning process must be carried out when there are more particles in it. However, this will result in a serious decline in the work efficiency. In order to accurately characterize the filtration performance of the filter for particles, the plugging rate α was used to describe the ratio between the particle content in the filter and the particle content blocked by the actual filter. This is calculated by Equation (1) [37,38].
α = ( C i n f C o v e r ) ( 1 C i n f ) C i n f ( 1 C o v e r ) 2 * 100 %
where Cinf represents the proportion of particles whose size is smaller than the maximum distance between adjacent folds in the feed and Cover indicates the proportion of particles whose size is smaller than the maximum distance between adjacent folds outside the screen.
The content of particles in the filter box will affect the secondary filtration of particles. The velocity component along the gravity direction is defined as the settling velocity. Faster settling velocity of particles is conducive to reducing plugging rate. The velocity of particles in the direction of gravity has an important relationship with the speed of particle deposition, which can be used to characterize the settling velocity. Moreover, the standard deviation is used to describe the uniformity of particles accumulated in the filter.

2.2. Computational Fluid Dynamics

Considering the interaction between airflow and particles, the continuity equation and momentum equation of air are given by Equations (2) and (3), respectively [39].
ρ g t + x j ( ρ g v j ) = 0
( ρ g v i ) t + x j ( ρ g v j v i ) = p x i + x j [ μ g ( v i x j + v j x i ) ] + ρ g g + F s
where ρg is the density of the air, vi and vj are the velocity vectors of the air, p is the pressure of the air, μg is the effective viscosity of the air, and Fs is the momentum source term.
The porous media model in CFD introduces the momentum source term into the momentum equation to simulate the viscous loss and inertia loss caused by volume pressure drop, as shown in Equation (4).
F s = ( j = 1 3 D i j μ g v j + 1 2 j = 1 3 C i j ρ g | v | v j )
where Dij is the viscous drag coefficient and Cij is the inertial drag coefficient. The values of Dij and Cij can be obtained by fitting several groups of velocity and pressure loss values.
The standard k-ε turbulence model can well calculate complex turbulence. The kinetic energy equation and diffusion equation are shown in Equations (5) and (6), respectively.
( ρ g k ) t + x i ( ρ g k v i ) = x i [ ( μ g + μ t σ k ) k x i ] + G k ρ g ε
( ρ g ε ) t + x i ( ρ g ε v i ) = x i [ ( μ g + μ t σ ε ) ε x i ] + C 1 ε ε k G k C 2 ε ρ g ε 2 k
where k is turbulent kinetic energy, ε is dissipation rate, turbulent viscosity μt is expressed by Equation (7), Cμ is a constant determined by experience, generation term of turbulent kinetic energy Gk is shown in Equation (8), and C and C are constants related to Reynolds number.
μ t = C μ ρ g k 2 ε
G k = μ t ( v i x j + v j x i ) v i x j

2.3. Discrete Element Method

In the discrete element method, the translational and rotational motion of particles can be expressed as Equations (9) and (10), respectively, according to Newton’s second law [40].
m d v d t = m g + F c + F d + F l + F b
I d ω d t = T c + T g
among them, Fi refers to various forces on particles: solid contact force Fc, fluid resistance Fd, buoyancy Fb, and lift Fl, including Saffman lift and Magnus lift. m and I represent the mass and moment of inertia of the particle. Tc is the torque caused by particle collision. Tg is the torque caused by fluid viscosity.
In this paper, Hertz–Mindlin contact model is adopted, and the simplified mechanical model in two-dimensional is shown in Figure 2. It shows that the solid contact force FC is composed of spring elastic force caused by the tension spring and torsion spring, sliding friction brought about by the friction slider, and damping force resulting from the dashpot.

2.4. Definition of Pressure Drop Coefficient in Porous Media Model

For simple homogeneous porous media, the viscous resistance coefficient and inertia resistance coefficient are constant. Pressure drop Δ p = S i Δ n , Δn is the thickness of porous media. Δp can be expressed by Equation (11) and Ci and Di are the inertia resistance coefficient and viscous resistance coefficient of porous media model, respectively.
Δ p = 1 2 ρ Δ n C i | v | v i + Δ n D i μ v i
Δp can be expressed by velocity and pressure drop as Equation (12). a and b (b ≠ 0) are constants.
Δ p = a v 2 + b v
The corresponding relations of quadratic coefficient and primary coefficient are Equation (13) and (14), respectively.
a = 1 2 ρ Δ n C i
b = D i μ g Δ n
Based on the above derivation, the pressure drop coefficient Cp is defined as shown in Equation (15). In the complex porous media model, Cp has different values in different positions due to different fluid velocity and direction. It can fully characterize the porous media model.
C p = Δ p D i μ g Δ n v v 2

2.5. Simulation Conditions

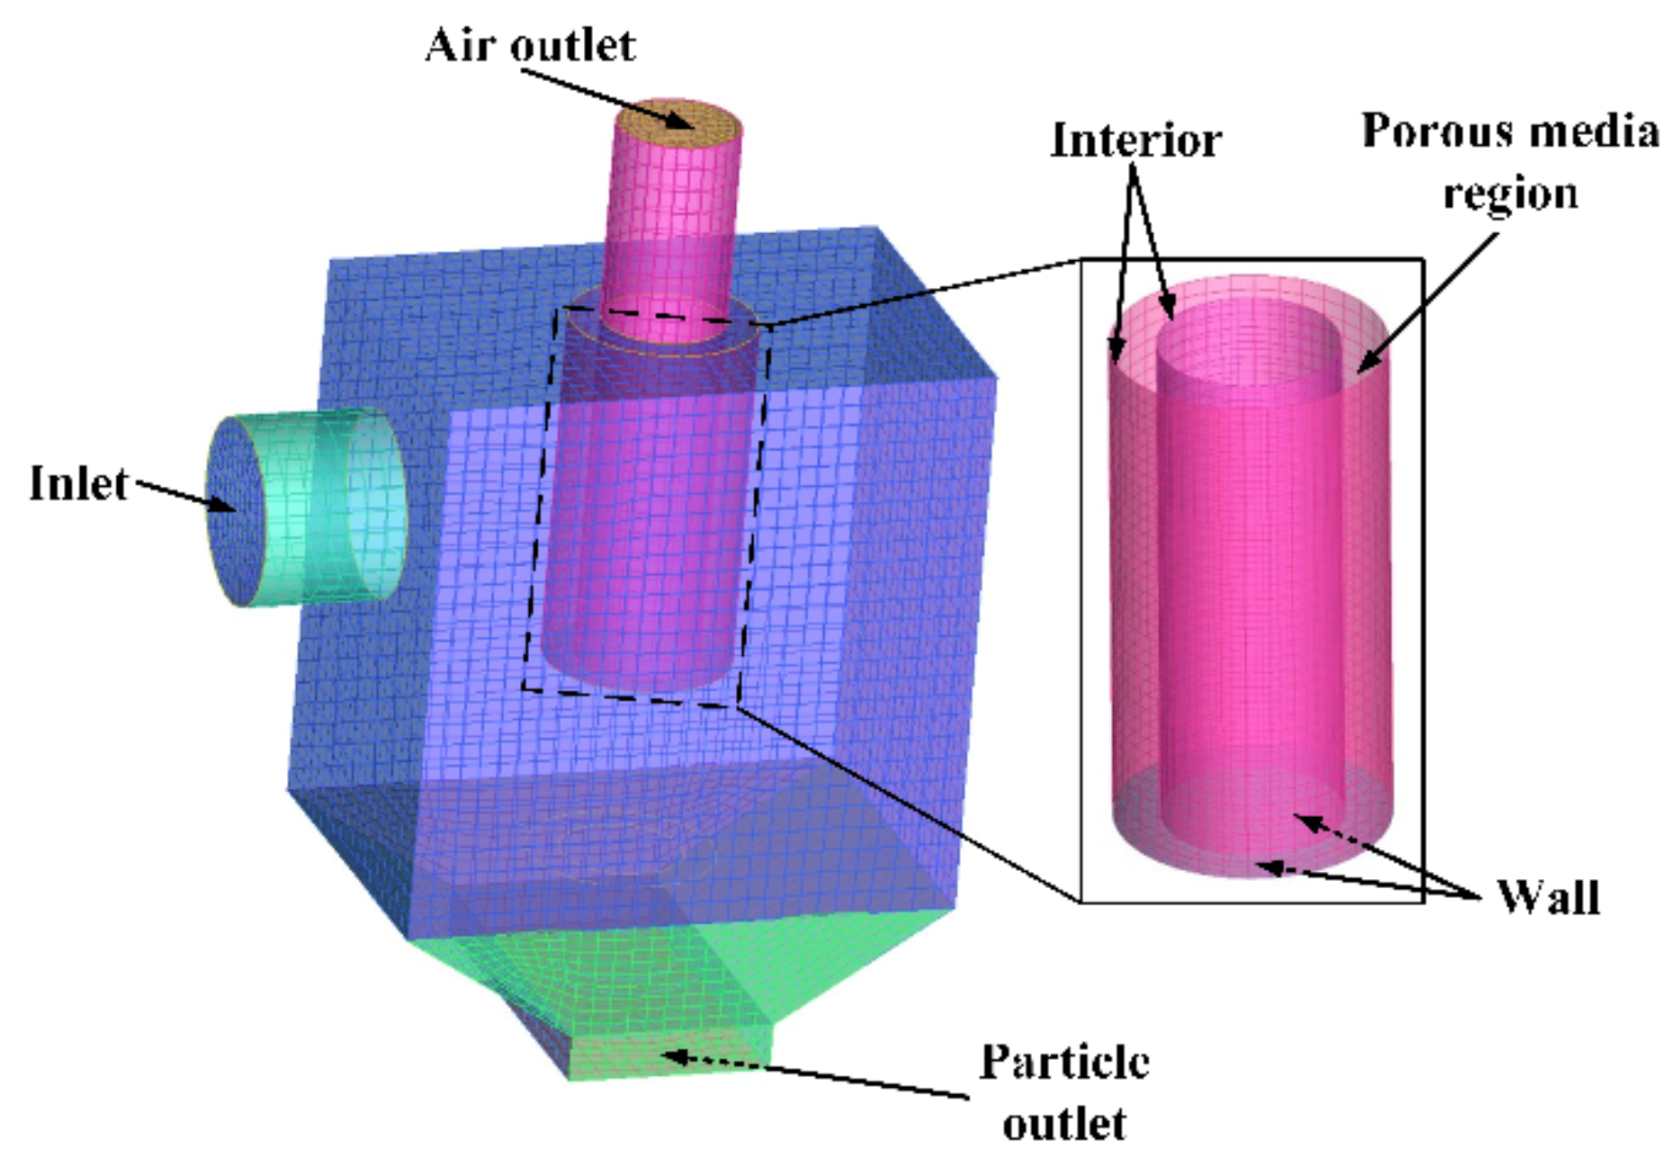
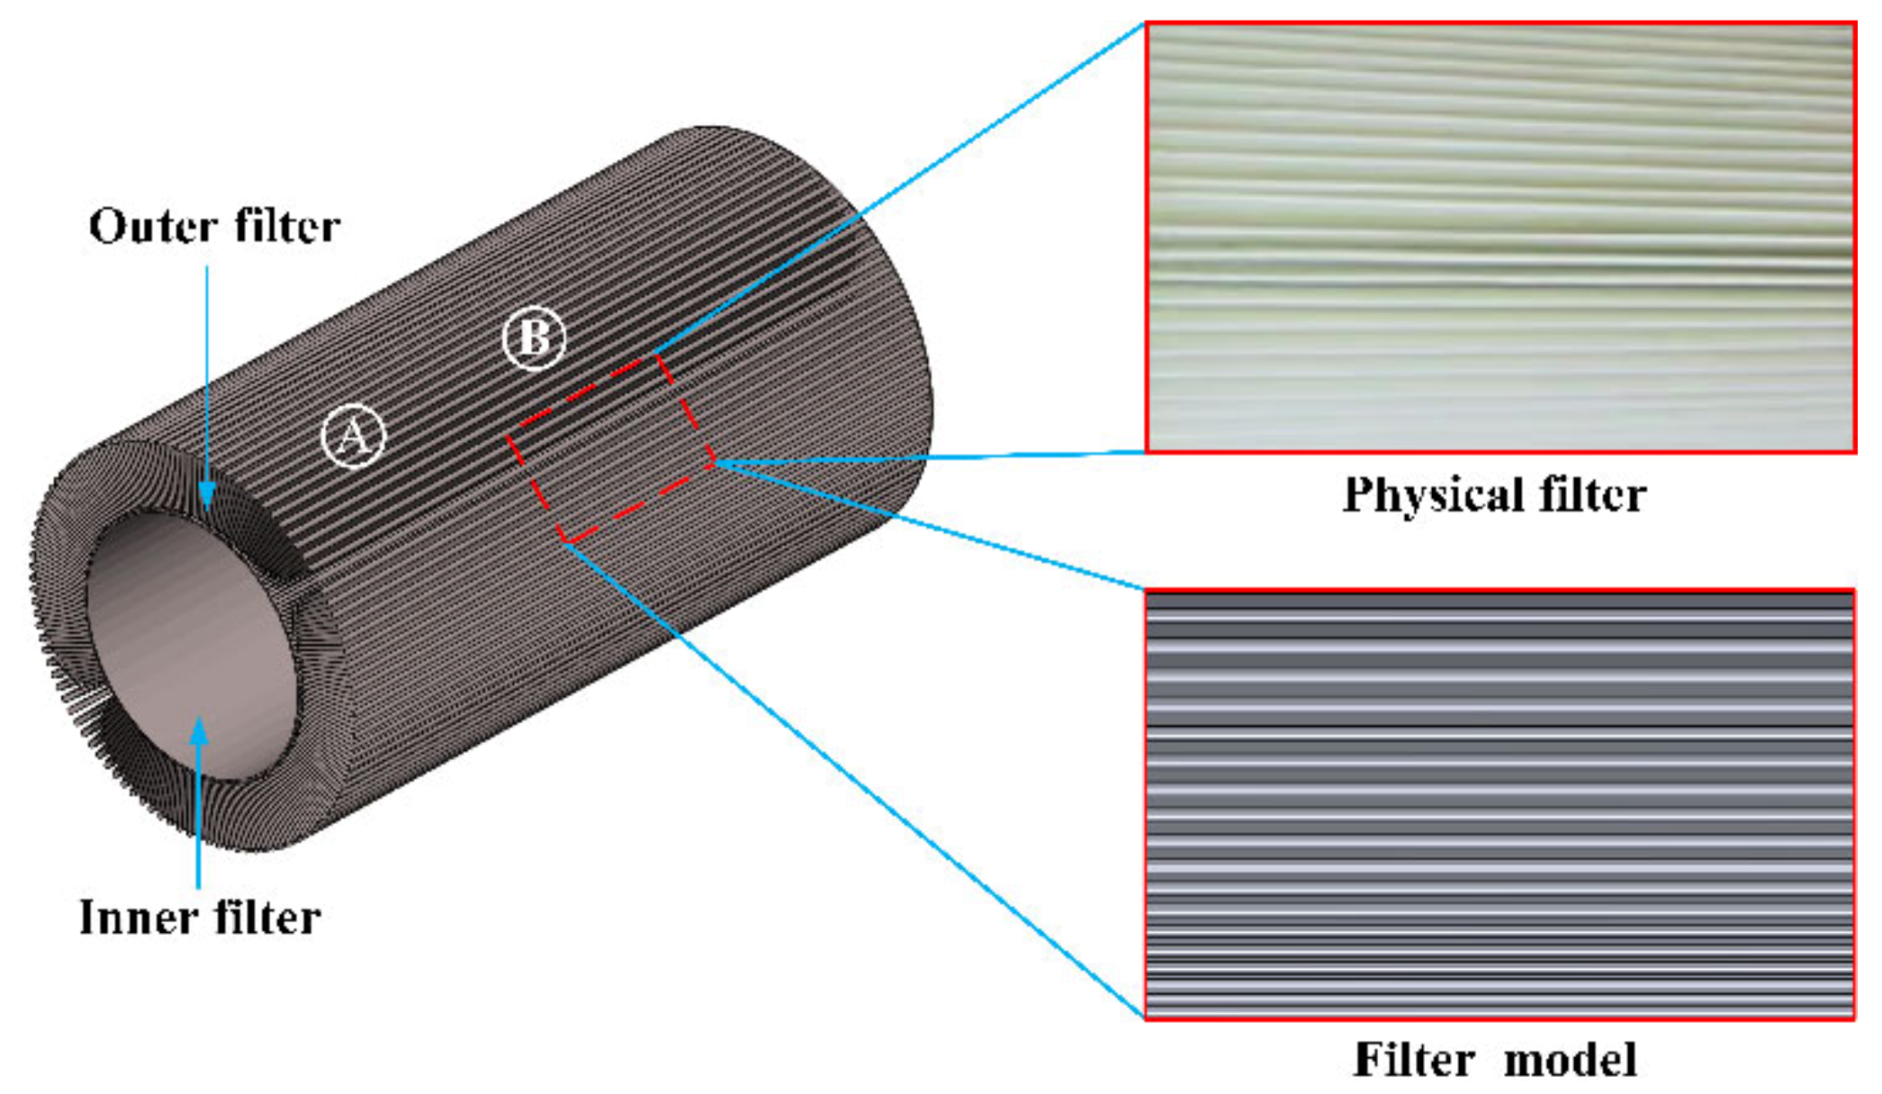
2.5.1. Filter Model and Simulation Setup

In this simulation work, computational fluid dynamics software and discrete element method software were FLUENT and EDEM, respectively. Hexahedral structure mesh was used, and the calculation boundary is shown in Figure 3. The mesh was divided into fluid domain and porous media domain, in which the filter belonged to porous media domain. The interior boundary was adopted at both the inner and outer screens, and the wall boundary was adopted at the bottom of the filter. The pressure inlet and outlet were set at –460 Pa and –2500 Pa, respectively. It was assumed that there was no air leakage at the particle outlet. To make the research more in line with the actual project, the flow field was calculated through the coupled algorithm. The air density and dynamic viscosity were 1.225 kg/m3 and 1.789 × 10⁻⁵ m2\s, respectively. The viscous resistance coefficient and inertial resistance coefficient of the filter were 2.225 × 10⁸ and 10.256, respectively, according to [41]. Other relevant parameters are shown in Table 1 [42].

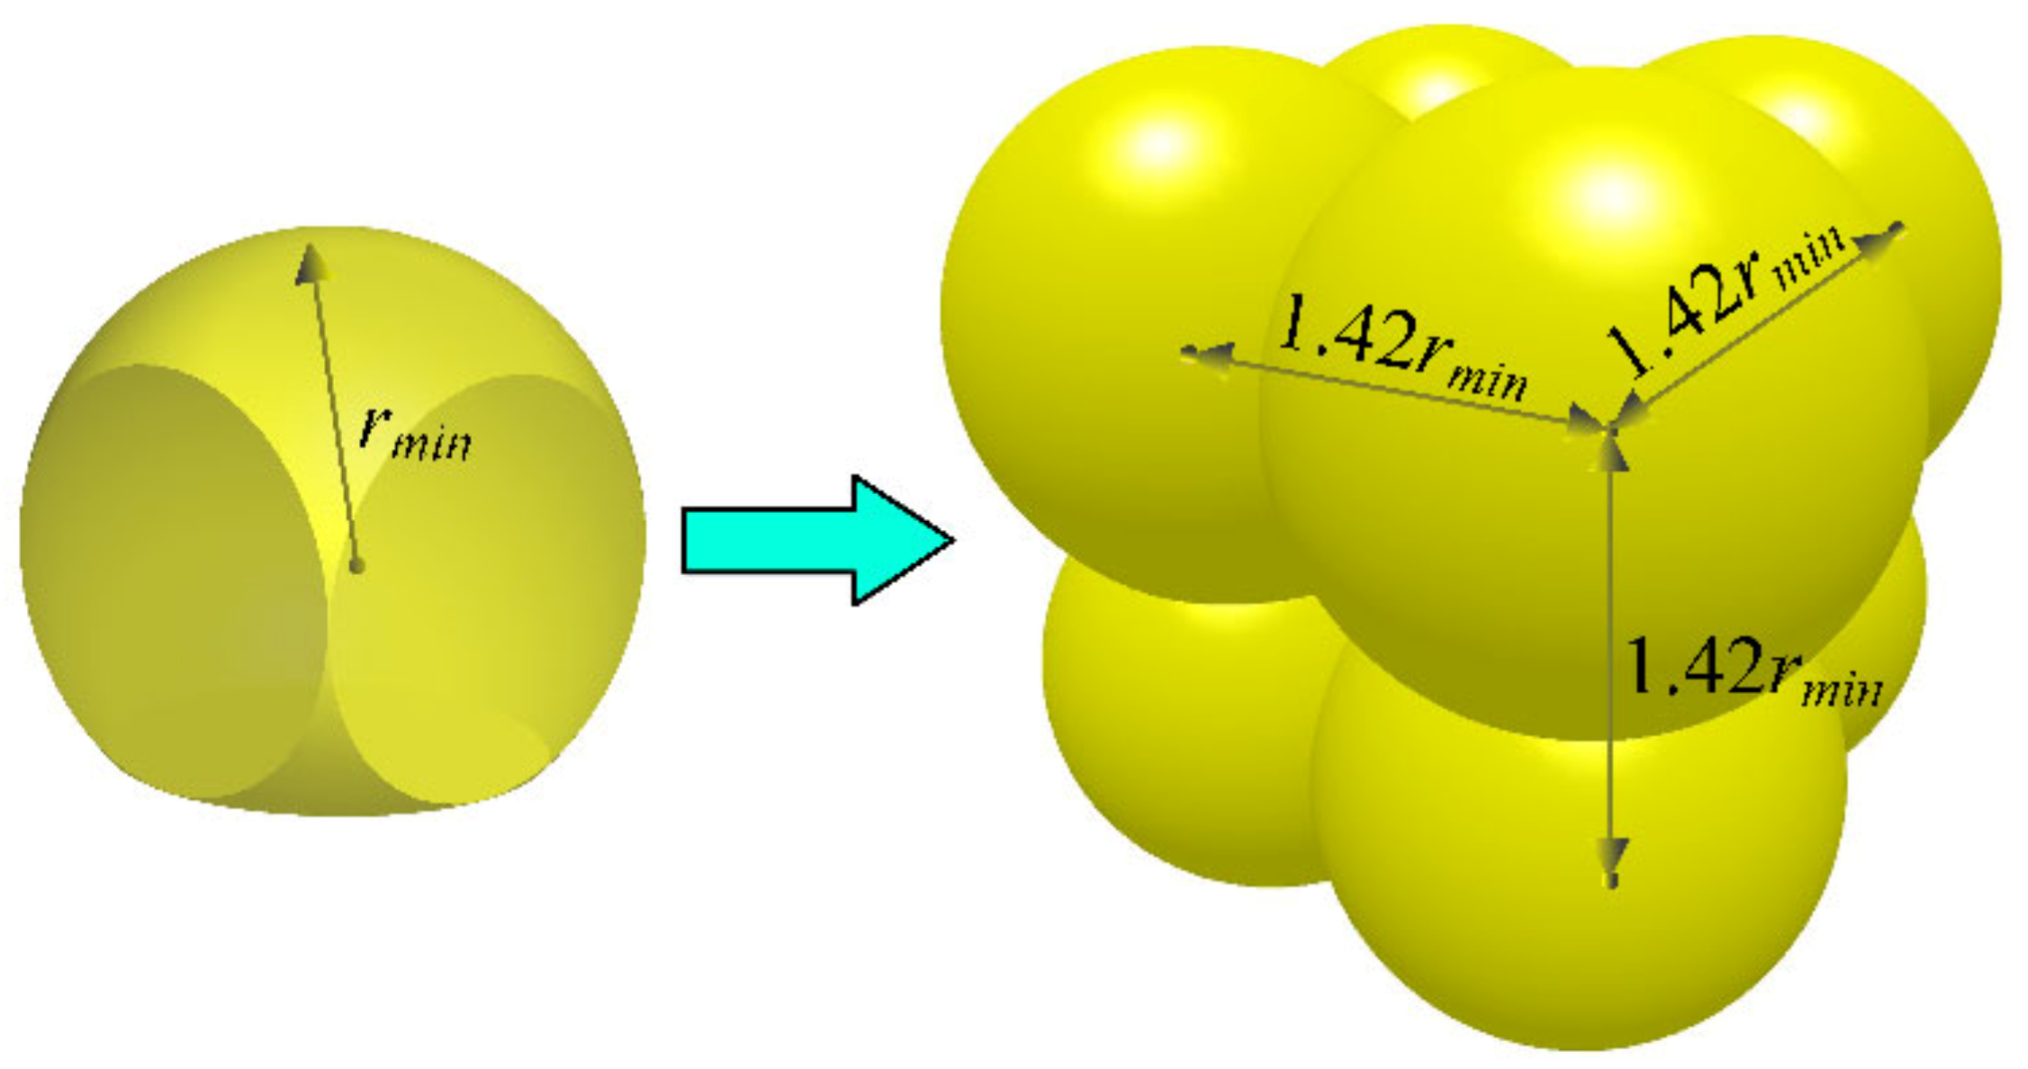
2.5.2. DEM Model of the Filter and Particles

In the discrete element software, the filter screen is mainly used to block particles. According to the actual engineering application, the pleated filter was used in this work, as shown in Figure 4. The outer and inner filter diameters were 100 mm and 66 mm, respectively. Their height was 380 mm. The maximum distance between adjacent folds in the radial direction was 3 mm.
To make the particles more truly reflect the actual engineering application, non-spherical particles were also considered in the simulation. The similarity between non-spherical and spherical particles with the same volume was evaluated by sphericity [43,44], as shown in Equation (16).
φ s = S s p S n s p
where φ s is sphericity, and S s p and S n s p are the surface areas of spherical and corresponding non-spherical particles, respectively.
The non-spherical particle model is shown in Figure 5. Its overall outline was based on the cube geometry, and it was generated by eight independent spheres with radius rmin. The distance between two adjacent spheres was 1.42rmin, and the sphericity was about 78%.
In the simulation, the size distribution of particles was random. Figure 6 shows a schematic diagram of particle blockage in filter screen. Given that the distance between adjacent folds of the filter screen in the middle of the radial direction was 3 mm, 3 mm was taken as one of the dividing boundaries [45]. When the particle diameter is greater than 3 mm, the possibility of particles becoming stuck in the filter screen is very small, so 3–6 mm particles were taken as a research scope. Particles in the range of 1–3 mm diameter have a greater probability of getting stuck in the filter screen, which is the focus of research. Therefore, particles with diameter less than 3 mm were divided into 1–2 mm and 2–3 mm. Based on the results of measurements, the proportion in the ranges of 1–2 mm, 2–3 mm, and 3–5 mm was calculated as 27.5%, 57.3%, and 15.2%, respectively. According to the principle of equal volume, the non-spherical particles were set.

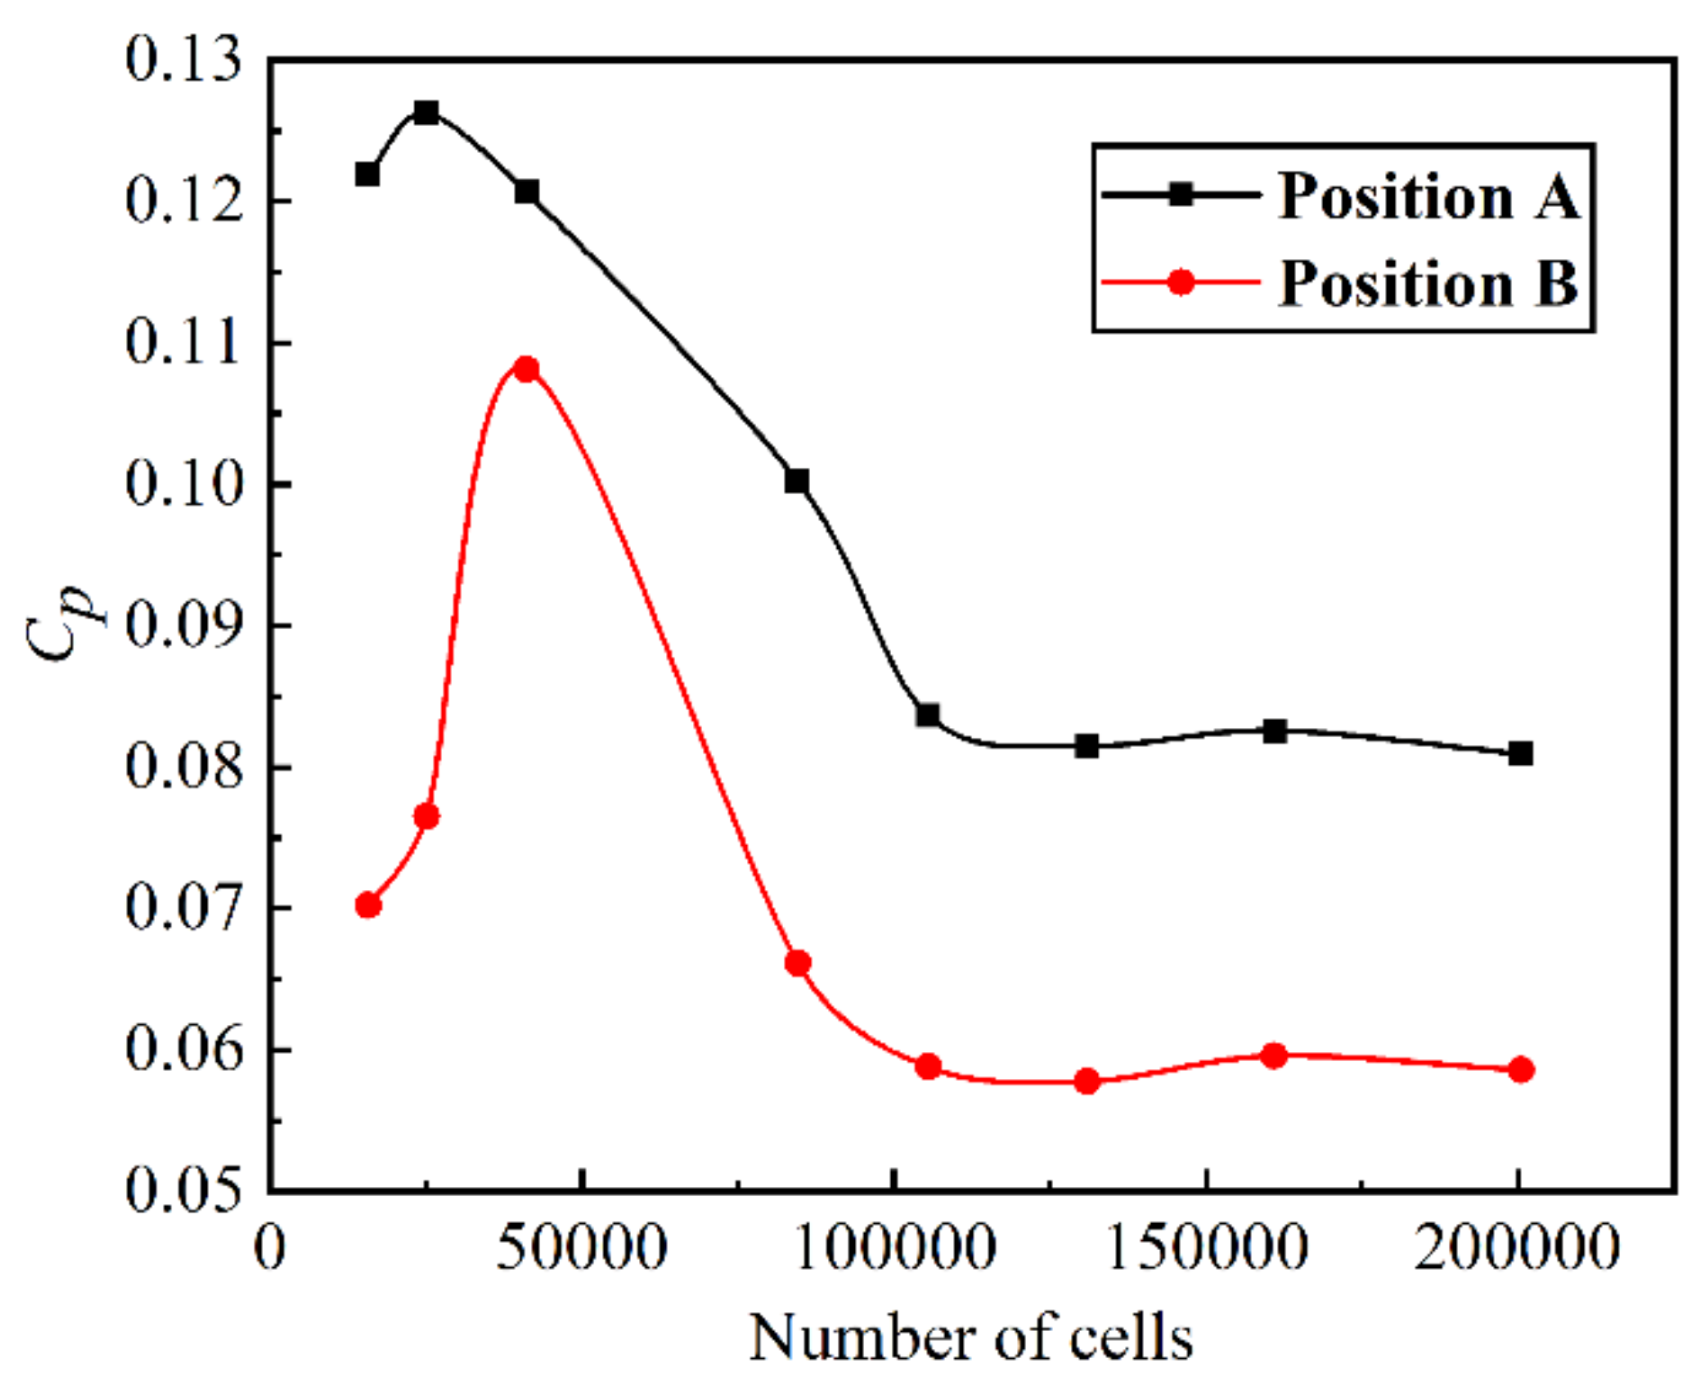
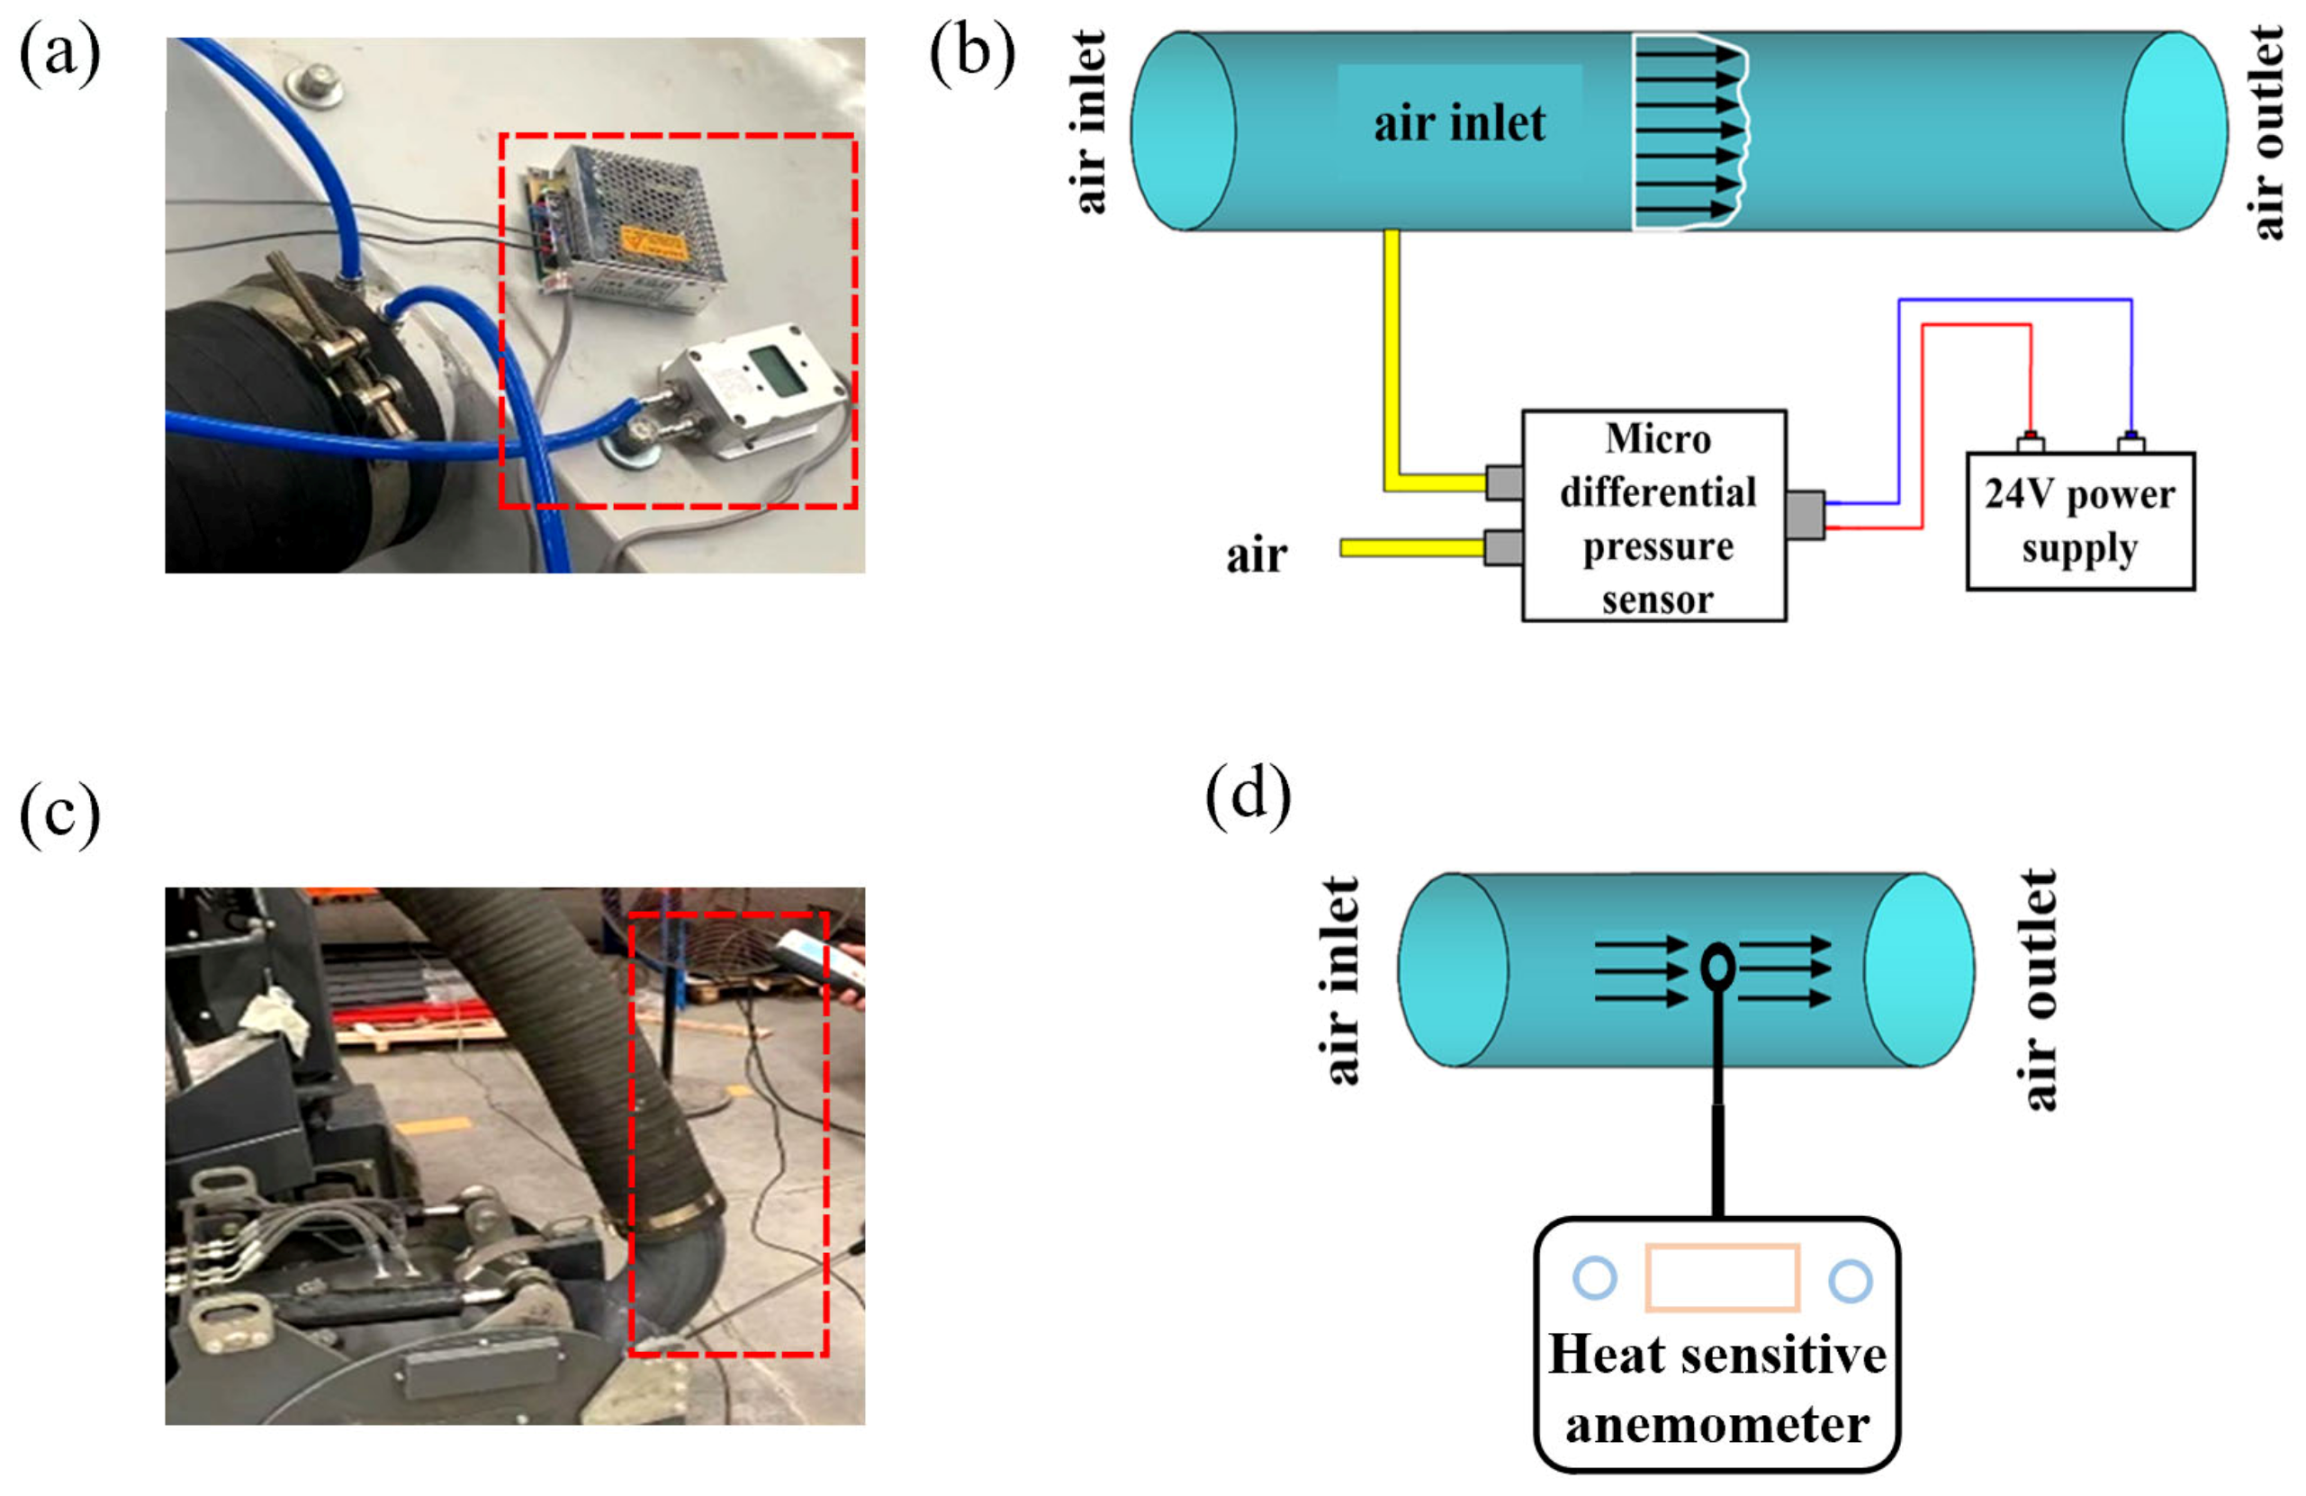
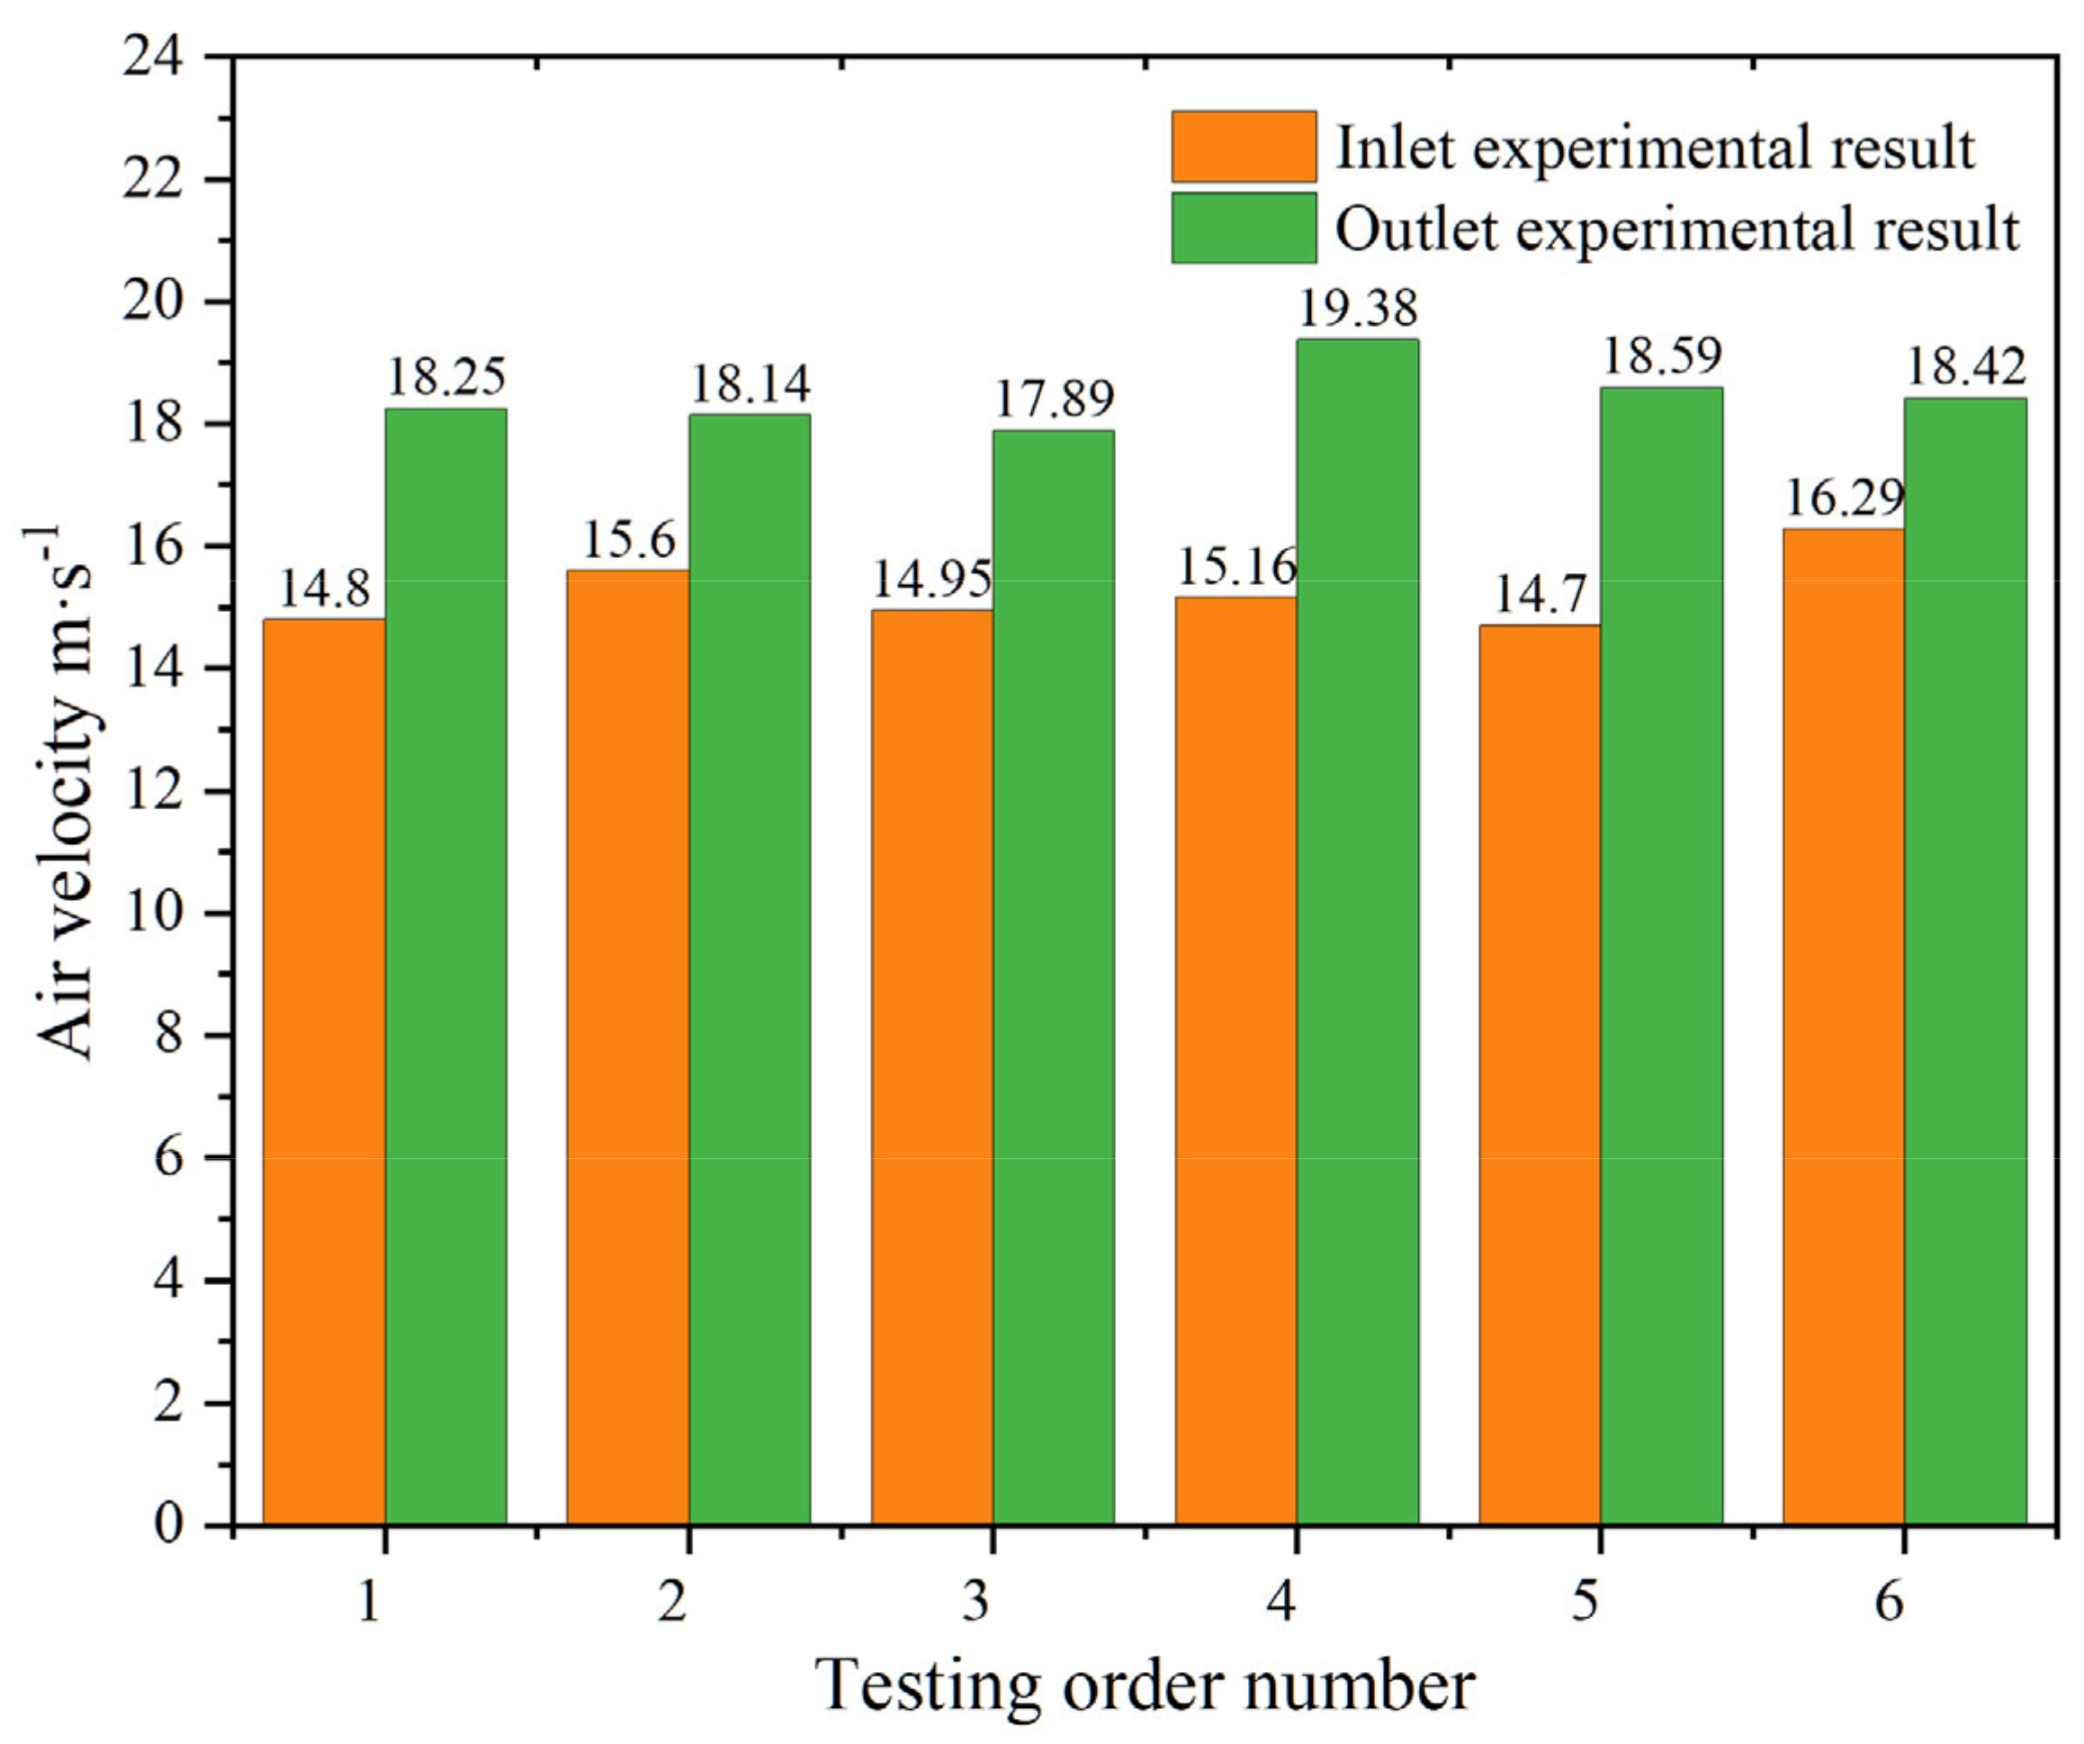
2.5.3. Mesh Sensitivity Study and Experimental Verification.

Cp can fully characterize the porous media model, so it is very representative to study the mesh sensitivity of porous media model. To correspond to normal working conditions, mesh with 10,000 to 200,000 cells was simulated. Positions A and B, as shown in Figure 4, were selected for research (A and B were located at the inlet side). The results in Figure 7 show that when the number of cells reached 130,000, the CP on the filter remained at a certain value. Considering that the minimum cell size was greater than the particle volume in the simulation process, this condition was not met when the number of cells exceeded 160,000, and the optimal number of cells was determined to be 131,004.

2.5.4. Model Accuracy Validation

Model accuracy verification idea: the test-measured pressure values at the outlet and inlet of the pipe were used as simulation input parameters, and the test-measured velocity values at the outlet and inlet of the pipe were used as verification values; these values were compared with the outlet and inlet velocity values obtained through simulation to verify the accuracy of the simulation model.
As shown in Figure 8a, a pressure measurement test was conducted using a micro differential pressure sensor, the schematic diagram of which is shown in Figure 8b; the test-measured pressure at the inlet (−460 Pa) and pressure at the outlet (−2500 Pa) were used as simulation input values, and the 500 g/s dust particle feed rate and 9 m/s particle initial velocity was selected for the simulation test. A thermal anemometer, as shown in Figure 8c, was used for the inlet and outlet wind speed measurement test; the schematic diagram is shown in Figure 8d, where the thermal anemometer telescopic rod top sensor was placed inside the pipe for the wind speed measurement at that lo-cation, and 6 random measurements of the fluid velocity values at the inlet and outlet were recorded.
The outlet and inlet wind speed values measured by the thermal anemometer were recorded and organized to obtain Figure 9. The average speed at the inlet measured in the six tests was 15.25 m/s, and the average speed at the inlet measured in the model simulation was 14.37 m/s, with an error of 7.6% between simulation and test; the average speed at the outlet measured in the test was 18.45 m/s, and the average speed at the outlet measured in the model simulation was 17.32 m/s, with an error between simulation and test of 6.1%. The validity of the simulation can be verified to ensure the accuracy of the simulation results, to a certain extent.

3. Results and Discussion

3.1. Effect of Initial Conditions of Particle on Filtration Process

After the filter started to work, the particles were transported by the dynamic action of airflow. In order to reveal the influence of fluid on particles transportation, the feed rate of particles was set at 500 g/s, and the initial particle velocity was set at 9 m/s, producing the CFD velocity vector diagram in stable state, as shown in Figure 10. It was found that the airflow entered at a constant speed at the inlet. Under the blocking effect of the filter, some of the air flowed back and around, and the rest flowed into the inner side of the filter after decelerating. The airflow direction determined by the geometric structure allowed the cyclonic airflow to easily occur at the bottom of the filter box. The cyclonic airflow ‘a’ was formed by the a1 airflow blocked by the filter, the a2 airflow blocked by the airflow b2, and the a3 airflow blocked by the airflow at the box and at the inlet. The b3 airflow forming the cyclonic airflow b was blocked by the filter, b1 and b2 were blocked by the airflow along the box direction, and b2 was also blocked by a2. The formation of cyclonic airflow was not only related to the airflow direction and box structure but also affected by the adjacent cyclonic airflow. Its formation caused the airflow to lose a lot of energy, resulting in the formation of low-speed region of airflow. The existence of anticyclonic airflow was due to the symmetry of fluid in the xoy plane about the xoz plane. The change of airflow direction caused by collision led to the generation of anticyclonic airflow, which caused serious loss of fluid momentum and forms a low-speed region. The formation of the low-speed region accelerated the deposition of particles.
The DEM simulations based on the particle velocity distribution (q = 500 g/s, vp = 9 m/s) are shown in Figure 11. At this time, the content of particles in the deposition box reached a dynamic stable state. It can be seen that the density of particles was the largest on the side near the inlet of the filter, the particles accelerate into the box at the inlet, and the speed was the largest near the filter. Under gravity and the impact of the filter, most of particles were deposited at the bottom of the box. By comparing the data of particle content and particle size distribution at different positions in the filter, it can be found that the content of particles in the filter was the least back against the inlet, and the larger particles entered the filter on the side near the inlet under the action of inertia force and fluid conveying force. Most of the small particles entered with the airflow on both sides of the filter. Spherical particles and non-spherical particles had similar particle motion processes.
The cartridge flow line diagram based on the velocity distribution gives the cartridge xoz plane (left side diagram) and xoy plane (right side diagram) pressure cloud diagram as shown in Figure 12.Through the analysis of the flow line, it can be seen that the cartridge porous media had an obvious deceleration effect on the fluid, and due to the existence of airflow inertia force and viscous force along the circumference of the filter, the flow velocity gradually decreased from near the inlet side to far from the inlet side, and the air was continuously accelerated from the outlet after deceleration by the cartridge. Due to the existence of porous media of the cartridge, the pressure was distributed in a gradient along the radial direction of the cartridge, and the pressure in the low-pressure area on the side near the entrance was higher than the pressure far from the exit, and the area was larger. The reason for this effect may be that the high flow rate brings about a large flow rate which made this area more obviously affected by the pressure at the entrance, and the range of low-pressure area decreased from the corresponding center to both sides.
The particles are required to stay in the filter box as little as possible during the recovery process and to be deposited in the deposition box as fast as possible so that the particles are not carried into the screen again by the airflow. The deposition rate and settling speed of the filter particles can not only better evaluate the performance of the filter use but also reflect the rationality of the system structure parameters and working parameters, to a certain extent.

3.2. Effect of Initial Conditions of Particle on Filtration Performance

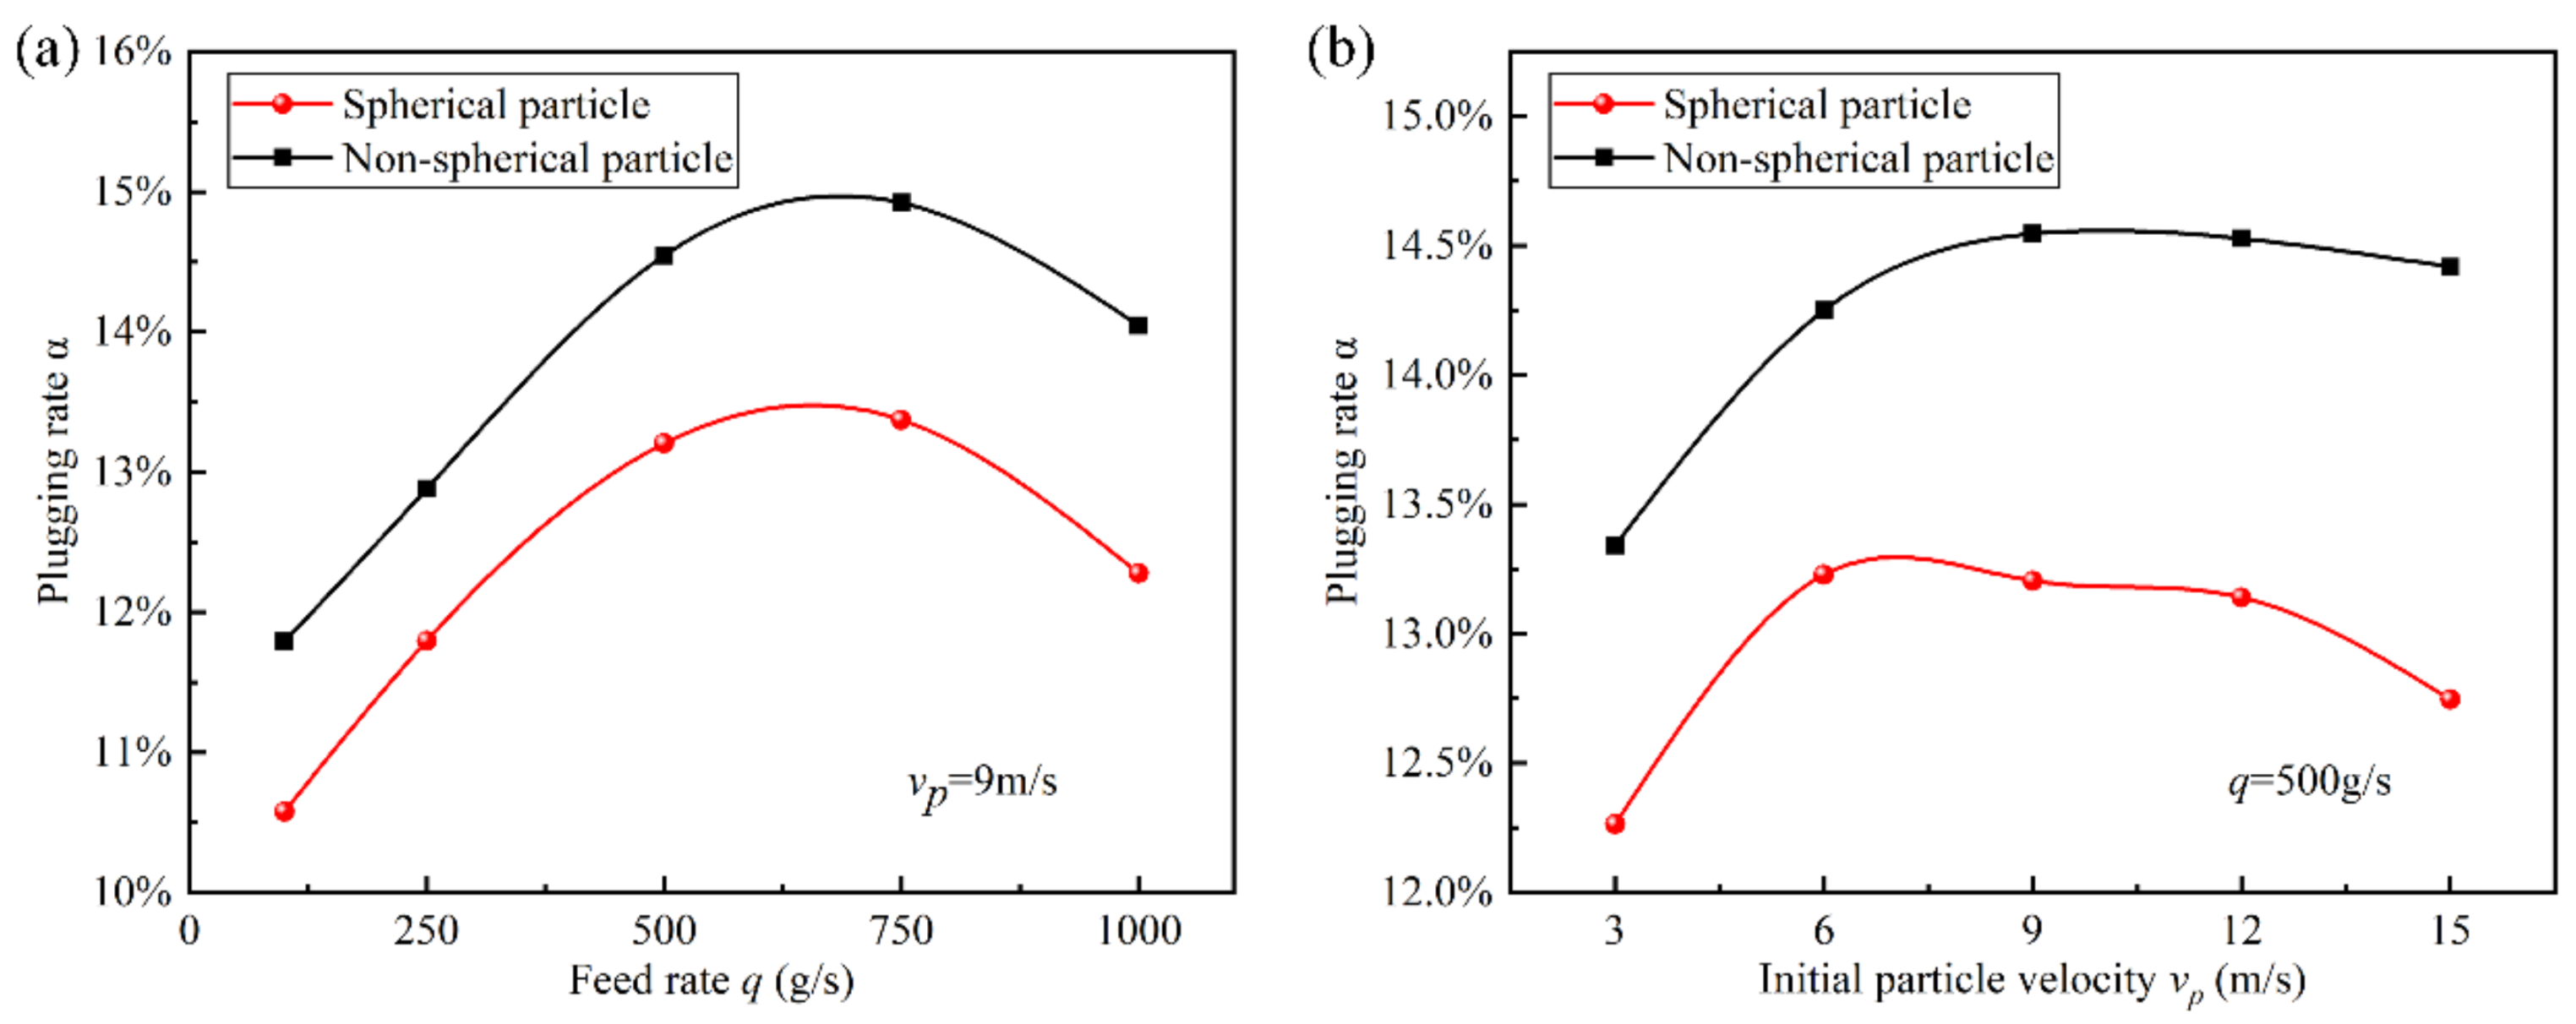
3.2.1. Effect of Working Parameters on Plugging Rate

In the process of recycling, the particles should stay in the filter box as little as possible and settle in the deposition box as soon as possible to avoid the particles being brought into the filter again by the airflow. The deposition rate and settling velocity of particles can not only better evaluate the performance of the filter but also reflect the rationality of the system structure parameters and working parameters, to a certain extent. Therefore, to ensure the long-term and efficient use of the filter, it is of great significance to study the performance of the filter under different particle shapes, particle feed rates and initial particle velocities.
In the case of spherical particles and non-spherical particles, we adjusted the particle feed rate q and initial particle velocity vp to obtain the particle content in the filter and analyze the influencing factors of plugging rate. Figure 13 shows the effect of working parameters on plugging rate, which shows that the feed rate of spherical particles and non-spherical particles had the same trend in the influence of initial particle velocity on plugging rate. The maximum difference between the plugging rate of non-spherical particles and that of spherical particles was no more than 2%, and non-spherical particles accumulated more easily in the filter. Figure 13a shows the effect of particle feed rate on plugging rate when the initial particle velocity was 9 m/s. Considering spherical particles as an example, when the feed rate increased from 100 g/s to 500 g/s, the plugging rate increased from 10.57% to 13.2%. When the feed rate is small, most particles will stay in the filter and accumulate with the increase of feed rate, resulting in the increase of plugging rate. When the feed rate increased from 750 g/s to 1000 g/s, the plugging rate decreased from 13.37% to 12.28%. At this stage, due to the influence of the size structure of the filter, the passage of particles into the filter was blocked. At this time, a large number of particles entered the deposition state under their own gravity and fluid action after collision, so as to reduce the deposition rate. The maximum plugging rate of 14.96% when the feed rate was about 660 g/s. At this time, the largest proportion of particles accumulated in the filter. The particle feed rate was well matched with the size of the filter, and small particles were brought more easily into it by airflow. In order to allow the filter to have low plugging rate and maintain good filtration performance, the feed rate of particles should avoid 500–750 g/s as far as possible.
Figure 13b shows the effect of the initial particle velocity on plugging rate when the particle feed rate was 500 g/s. It can be seen that when the initial particle velocity increased from 3 m/s to 6 m/s, the plugging rate of non-spherical particles increased sharply by 0.97%. With the increase of the initial particle velocity, the particles will reach the filter in a short time and reduce the content in the deposition direction caused by their own gravity, resulting in more particles enter the filter. When the initial particle velocity rose from 9 m/s to 15 m/s, the plugging rate showed a slow downward trend, and the difference between the plugging rates did not exceed 0.45%. Because the particles adopt the elastic model, the larger initial particle velocity will lead to higher collision energy, the particles will move backward under the action of elastic force and hinder the normal movement of other particles. As a result, particles entering the filter will be reduced. Between 6 m/s and 9 m/s, the plugging rate of the filter had the maximum value, and the maximum plugging rate of non-spherical particles was 14.55%. At this time, particles will enter the filter at a faster velocity while reducing the gravity action from other particles. Meanwhile, particles entering the filter will not rebound out of the filter due to large collision, or even affect other particles from entering the filter. In order to reduce the plugging rate of particles in the filter, the initial particle velocity should be maintained in the range of 3–6 m/s, and the lower the velocity, the lower the plugging rate.

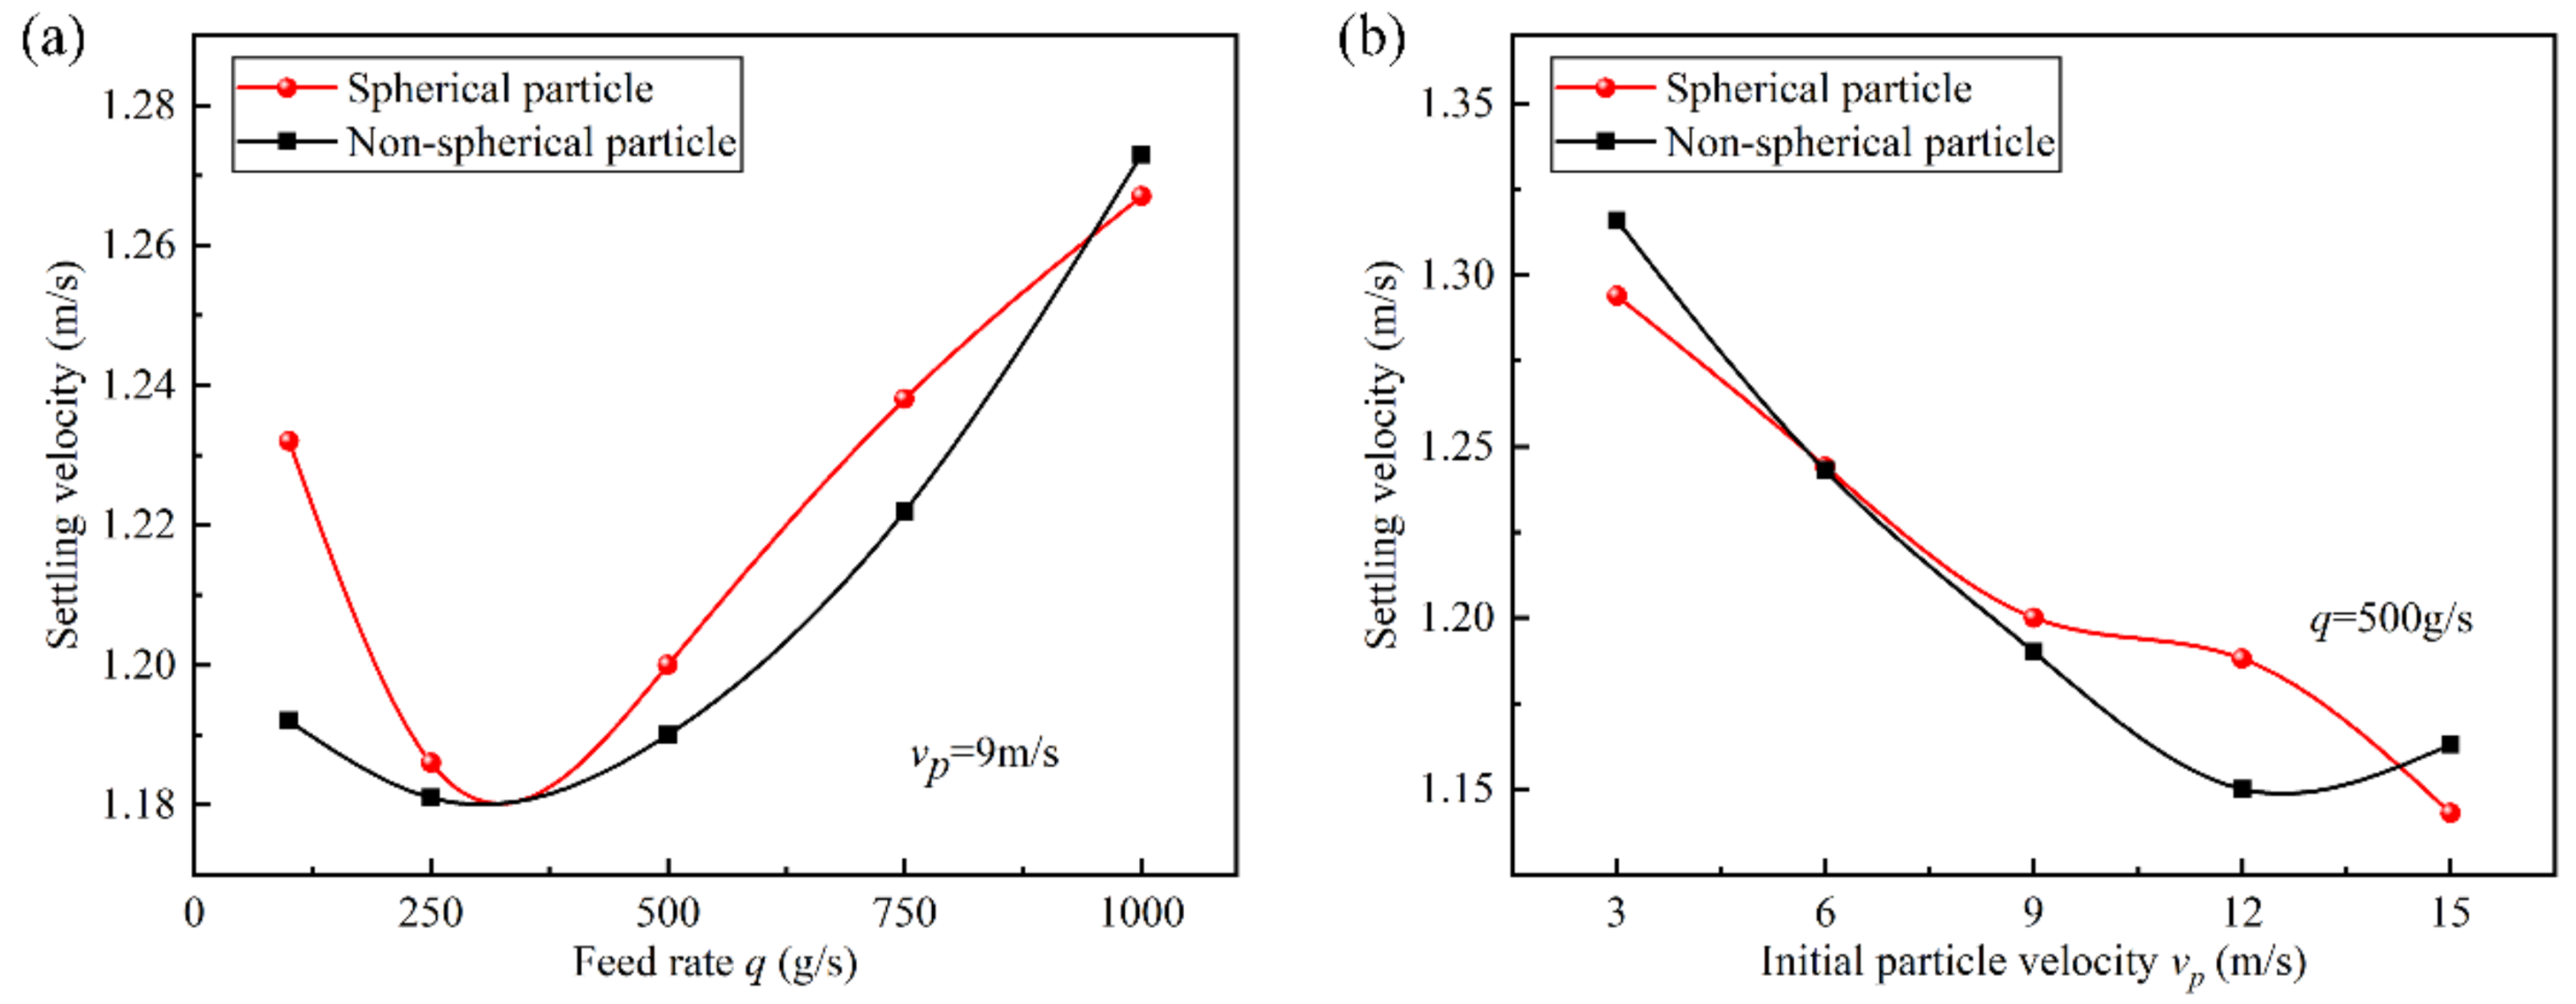
3.2.2. Effect of Working Parameters on Particle Settling Velocity

Figure 14a,b show the effect of particle feed rate and initial particle velocity on settling velocity, respectively. It can be seen from Figure 14a that the effect of feed rate of spherical particles and non-spherical particles on settling velocity showed the same change law. Before the feed rate of 750 g/s, the change rate of spherical particle settling velocity with feed rate was significantly faster than that of non-spherical particles. After that, the change rate of non-spherical particles was more obvious. At 100–250 g/s, with the increase of feed rate, the collision probability between particles increased, resulting in the loss of particle kinetic energy due to the interaction between particles and the decrease of settling velocity. In the range of 500–1000 g/s, the particle settling velocity increased with the increase of feed rate. The reason is that the settling effect caused by the gravity of more large particles will act on small particles, increasing the velocity of particles in the gravity direction, and then accelerating the settling velocity. When the feed rate was about 300 g/s, the settling velocity was the minimum. At this time, the particle collision loses more kinetic energy and the gravity of large particles acts less on small particles, resulting in a slow settling process of particles. The results show that the effect of feed rate on particle settling velocity was mainly divided into kinetic energy loss caused by particle collision and the effect of large particle gravity action on small particles. When the feed rate changed from small to large, the former dominant factor gradually shifted to the latter. In order to increase the settling velocity of particles in the filter box and reduce secondary filtration, the feed rate should be as large as possible while avoiding the range of 250–500 g/s.
As can be seen from Figure 14b, with the increase of the initial particle velocity, the overall particle settling velocity showed a downward trend. Non-spherical particles had a maximum settling velocity of 1.32 m/s when the initial particle velocity was 3 m/s, and spherical particles had a minimum settling velocity of 1.14 m/s when the initial particle velocity reached 15 m/s. The lower initial particle velocity of particles made most particles settle under the action of gravity before colliding with the filter. With the increase of velocity, the particle activity increased. The particles not only collided with the filter and box but also collided with each other. The higher initial particle velocity will cause the newly entered particles to significantly slow down the rebounded particles, so that the particles have a low settling velocity. Choosing a lower initial particle velocity was conducive to the settlement of particles in the filter box.

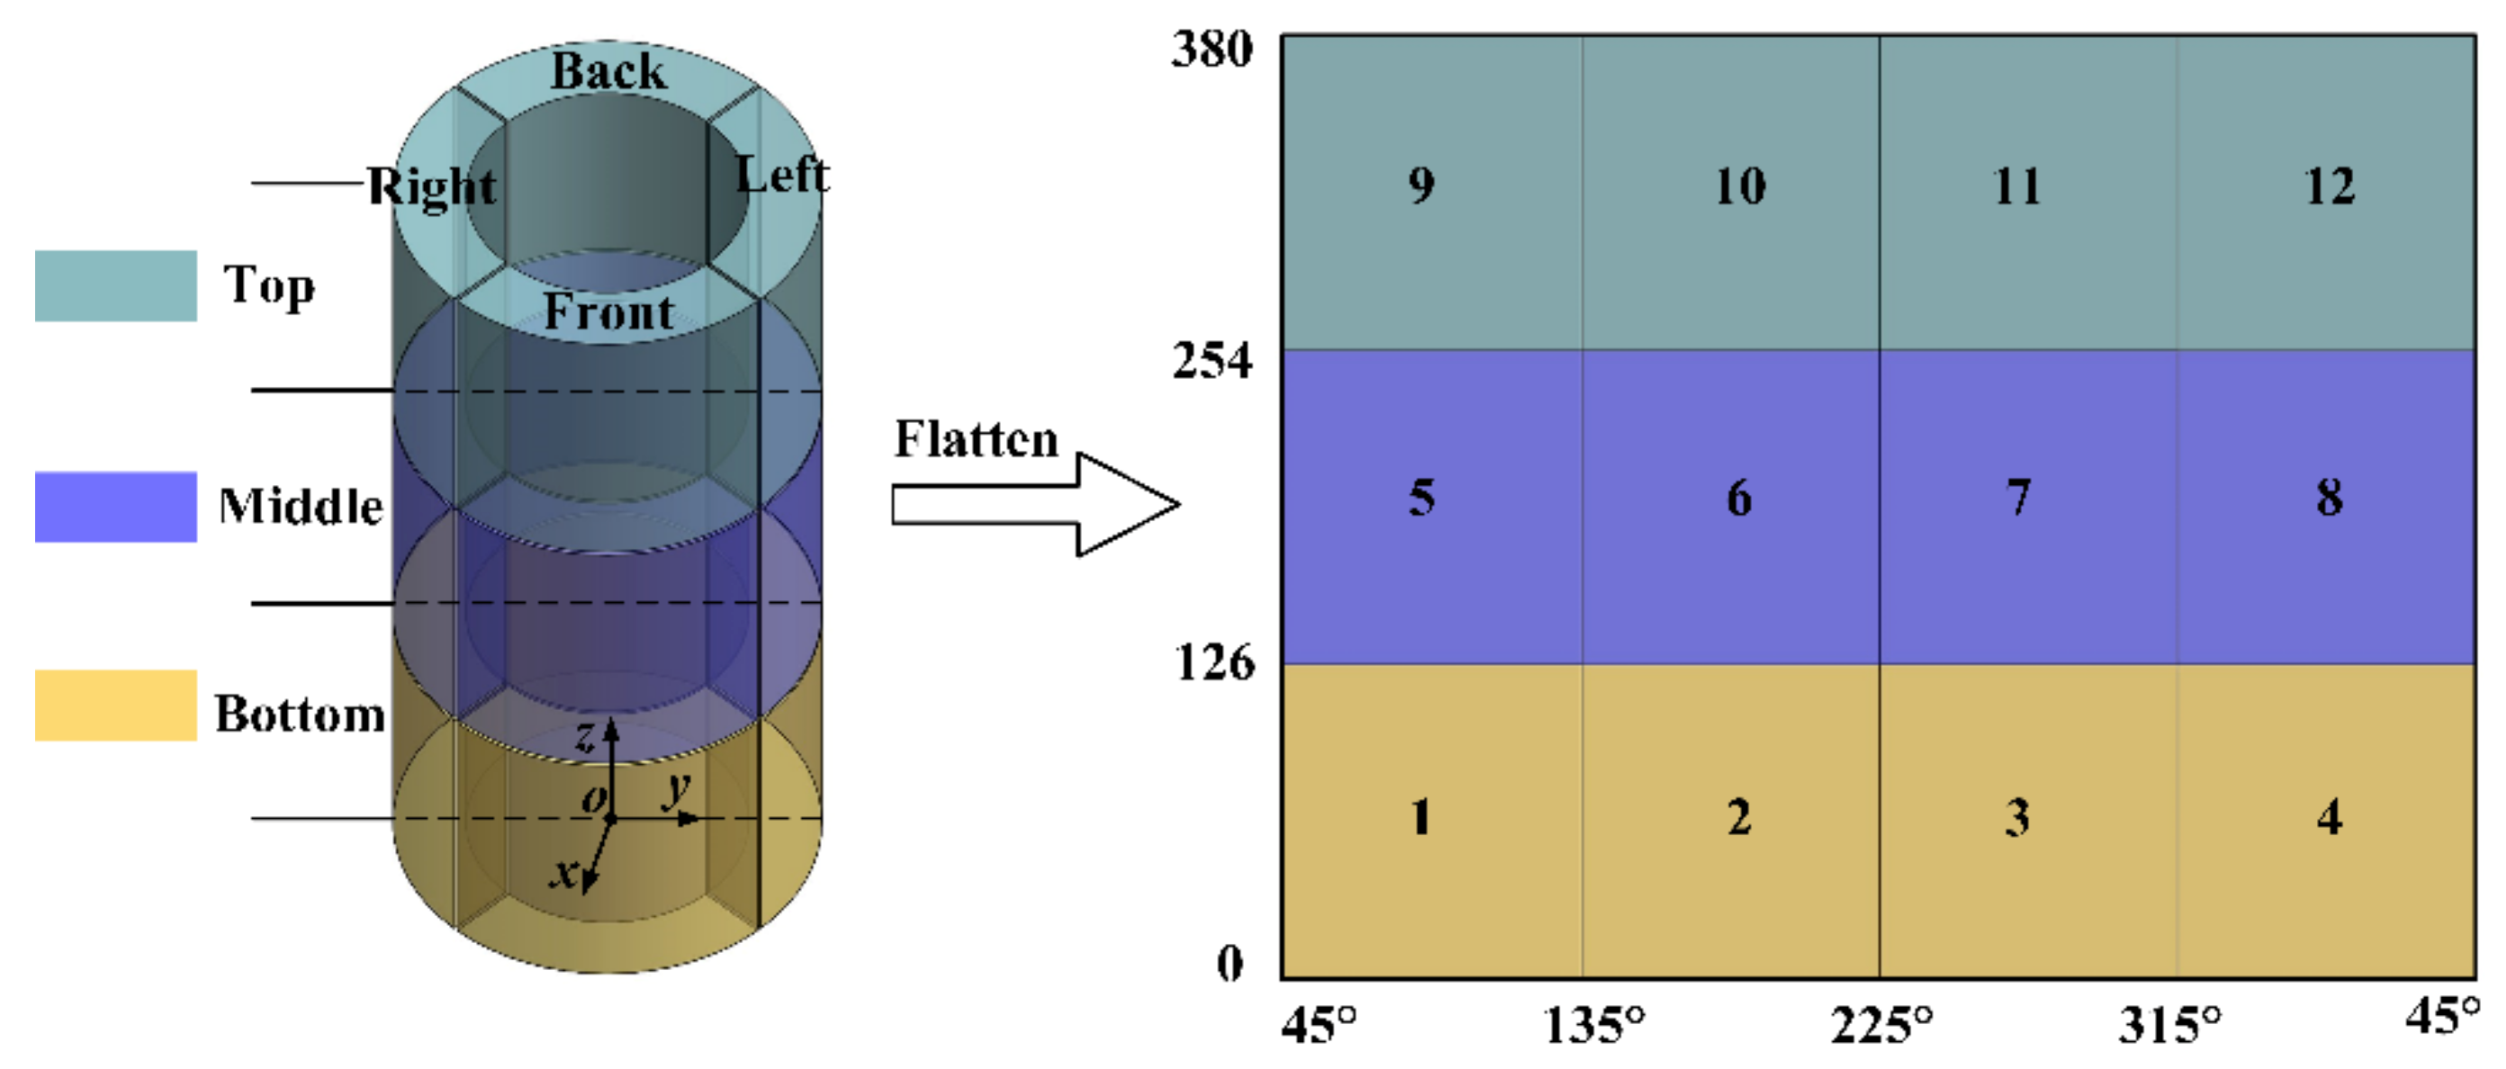
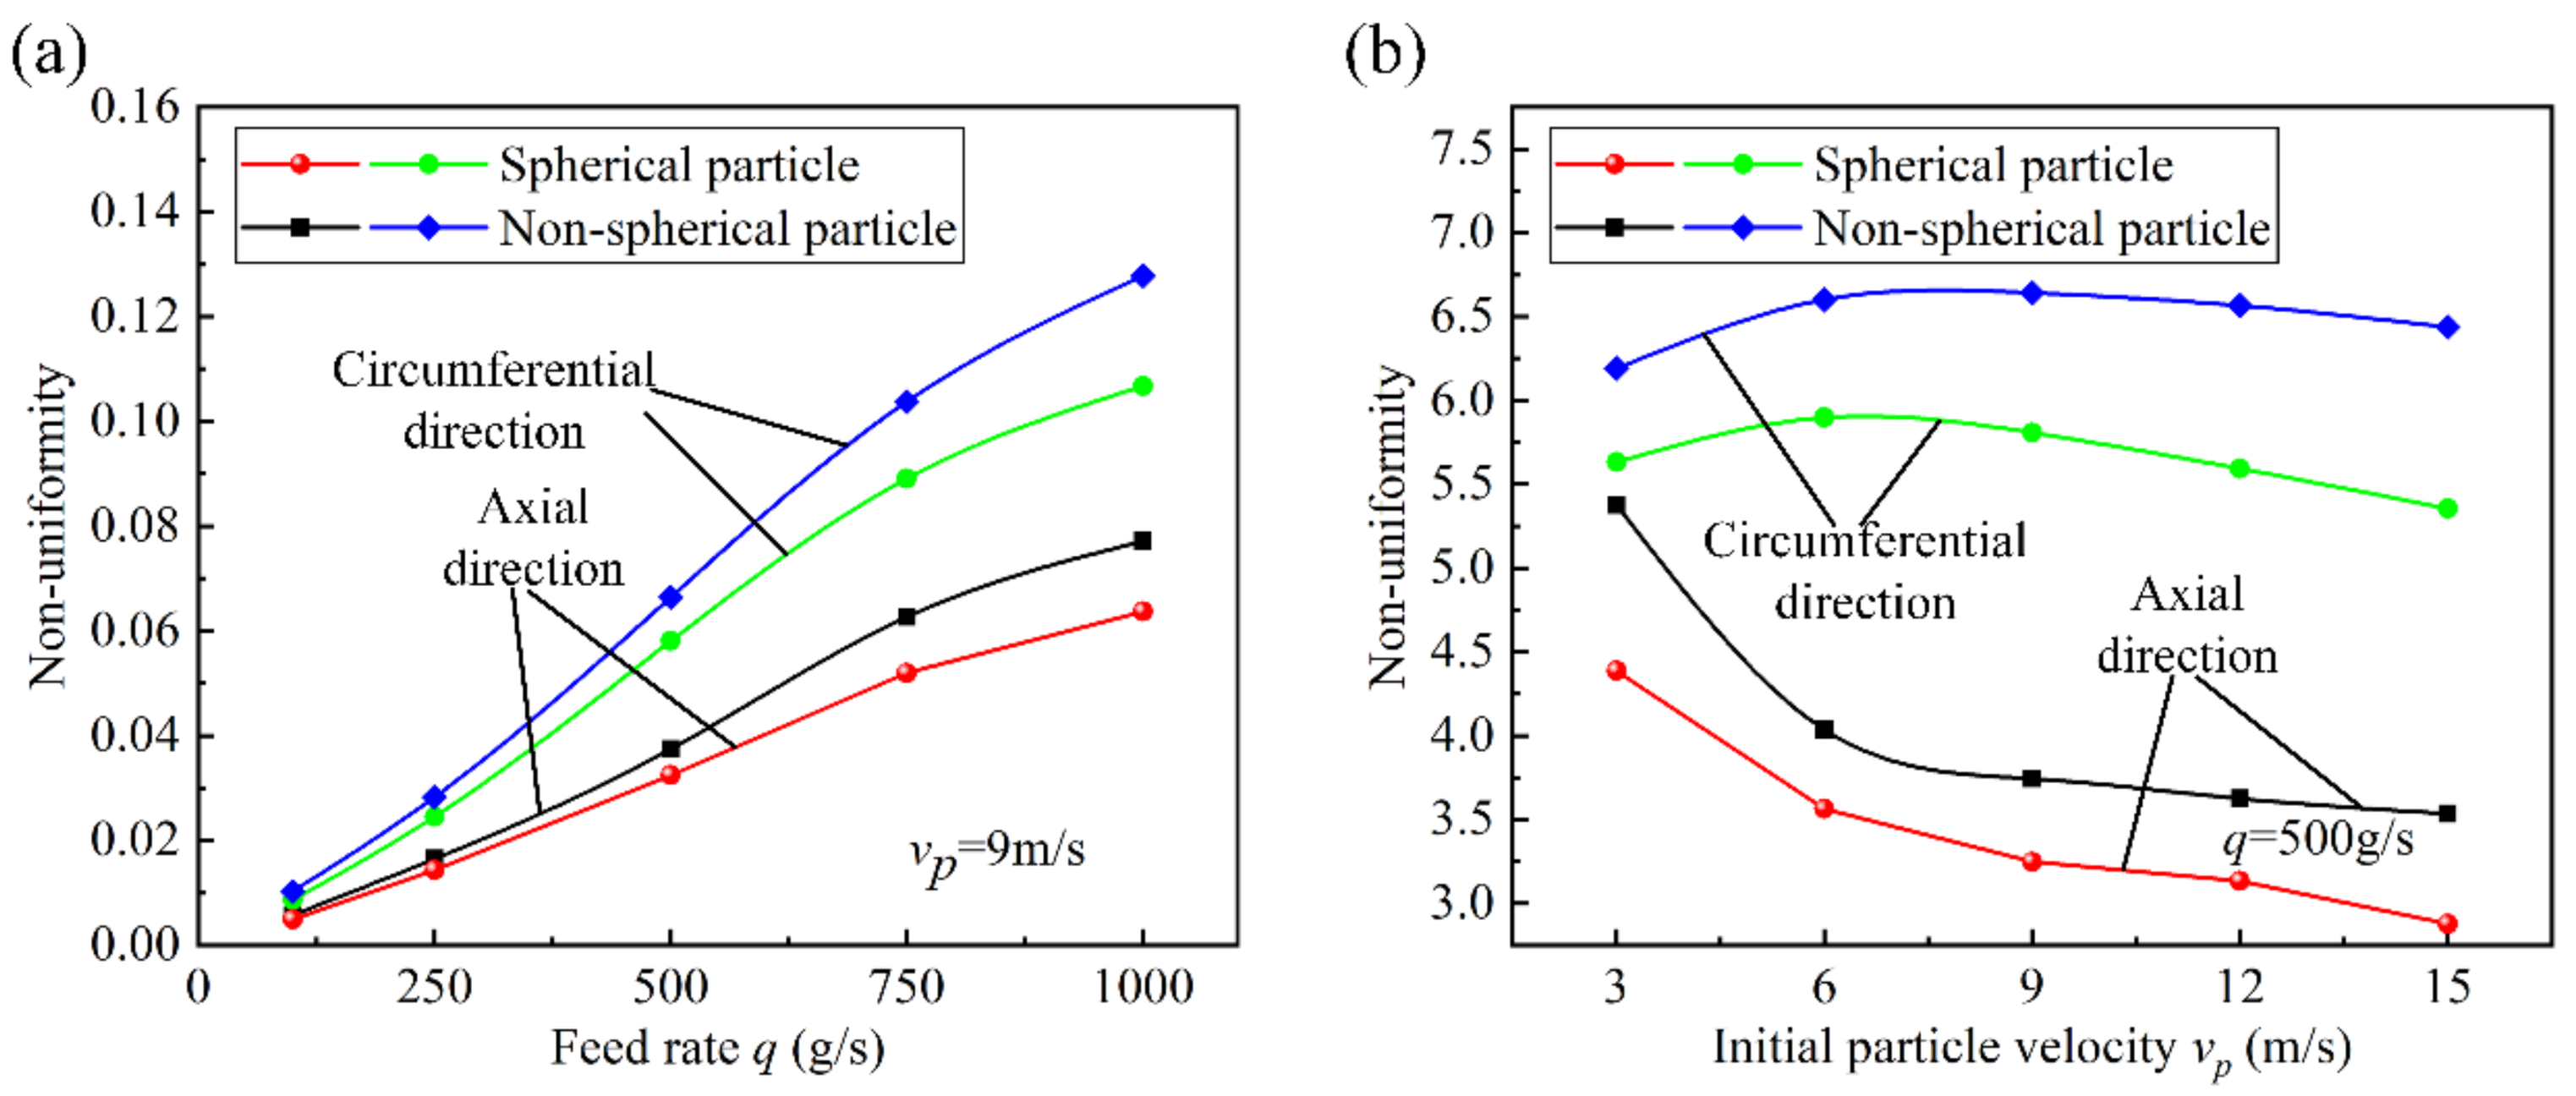
3.3. Analysis of Accumulation Position of Particles in Filter

When the particle reached the filter, the entering position mainly depended on the initial particle velocity, the conveying airflow, and the blocking effect of the filter on particles and airflow. Reasonable prediction of the position of particles entering the filter can better optimize the structure and adjust the conveying parameters. As shown in Figure 15, the filter was divided into top, middle, and bottom parts along the axial direction. The normal of the inlet plane points to the outside, which is the positive direction of the x-axis, and the gravity is in the negative direction of the z-axis. According to the angle between the projection of the cutting line on the xoy plane and the positive direction of the x-axis, the filter is divided into four parts along the circumferential direction: front, back, left, and right. The twelve calculation domains of the filter can realize the comprehensive extraction of particle information.
The standard deviation of particle content in different calculation domains was used to characterize the non-uniformity, and the accumulation position of particles in the filter was numerically analyzed. Figure 16 shows the influence of working parameters on the non-uniformity of each calculation domain. It can be seen that the axial distribution of particles in the filter was more uniform than that in the circumferential direction, and the distribution of non-spherical particles in the filter was more varied. Figure 16a shows the effect of feed rate on non-uniformity of calculation domain. With the increase of feed rate, the non-uniformity of particles in the filter showed an upward trend, and the maximum standard deviation was 0.128. In the axial direction, the increase of feed rate will lead to the increase of the gravity action of large particles on small particles, and the deposition of particles in the bottom part will increase, thus increasing the axial non-uniformity. In the circumferential direction, there were a large number of particles entering the front part of the filter, resulting in obvious non-uniformity. Within a certain range, the more particles entering per unit time, the more particles increasing in the front part. However, the front part was limited by the spatial structure, and the circumferential non-uniformity gradually decreased with the increase of feed rate.
Figure 16b shows the effect of initial particle velocity on the non-uniformity of the calculation domain. The initial particle velocity increased from 3 m/s to 6 m/s, and the particles entered the filter from the front part at a faster speed, which increased the axial uniformity and decreased the circumferential uniformity. After 9 m/s, the particle uniformity increased because the higher initial particle velocity led to more particle collisions. After the collision, the particles dispersed, and the settling velocity decreased. The particles had more time to enter the filter from each calculation domain under the action of airflow, resulting in the improvement of uniformity. The maximum standard deviation of non-uniformity with initial particle velocity was 6.566, and the standard deviations in axial and circumferential directions were maintained within 0.543 and 1.842, respectively.
The increase of feed rate improved the non-uniformity of particles blocking in the filter, while the increase of initial particle velocity made the blocking of particles in the filter more uniform. The blocking of particles in the local position of the filter will greatly reduce the filtering performance at this position, even causing damage to the filter damaged and making it unable to be used. As a result, the service life of the filter is greatly reduced. In order to increase the uniformity of particles blocking in the filter, the feed rate should not be too large, but a larger initial particle velocity should be selected to maintain better filter performance and longer filter life. In addition, the large number of particles entering the front part was the main reason for the obvious difference in non-uniformity. Therefore, the position of the filter should avoid the inlet position of particles or the baffle should be added at the front part of the filter to avoid a large number of particles entering.

3.4. Effect of Particle Deposition Height on Motion Characteristics of Gas-Solid Two-Phase Flow

After the particles flowed into the filter box and were filtered by the filter, most of the particles smaller than the diameter of the screen pore were deposited at the bottom of the box. The deposition height of the particles at the bottom of the box will change the airflow conveying direction and the distance between the particles and the filter. Under the action of airflow, some particles at the bottom of the box will rise again to the filter for secondary filtration, further increasing the burden of the filter.
Figure 17 shows the velocity vector diagram of the airflow region affecting the movement of particles: (a)–(d) are the velocity vector diagrams of the fluid zone at different deposition heights h, and the rising zone, the descending zone, and the low impact zone of the airflow is marked. In the rising zone, the particles were mainly affected by the vertical downward gravity and the upward lift. When the lift was greater than, equal to, or less than the gravity, the acceleration of the particles under the action of the fluid was upward, equal to 0, or downward, respectively. For small particles, the secondary filtration process will be carried out after rising with the airflow, while large particles will reduce the settling velocity in this zone. In the descending zone, the lift was downward. No matter how much the lift, the particle acceleration was downward in this zone and was always greater than zero. Regardless of the particle size, the particles will eventually accelerate the deposition in this area. In the low impact zone, it can be approximated that the particles are only affected by gravity, and the particles will finally realize a stable deposition process in this zone. As can be seen from Figure 17, with the continuous increase of particle deposition height, the area of rising zone, descending zone, and low impact zone showed a downward trend; the change of rising zone was the smallest, which shows that the increase of particle deposition height reduced the airflow movement area and made its distribution more centralized. In addition, the reduction of the area of low impact zone increased the airflow movement area in the deposition box. To a certain extent, the rising number of particles was reduced. In order to improve the performance of the filter, the area of the descending zone should be increased as much as possible while reducing the area of the rising zone. Reducing the particle deposition height can realize the rapid settlement of particles and reduce the secondary filtration of particles. Compared with other studies on pneumatic conveying under small particles, it can be concluded that the porous medium model can better reflect the interaction between fluid and filter structure under the condition of particle filtration with filter device.

4. Conclusions

The CFD-DEM model of particles filtered by the filter is established, and the filter is divided into different calculation domains. The effects of particle feed rate and initial particle velocity on the plugging rate and particle settling velocity were studied, the distribution and uniformity characteristics of particles in the filter were analyzed, and the effect of airflow on particles under different particle deposition height was studied. The following conclusions can be drawn from this study:
(1) In the process of dust air flow transportation, the large feed rate hinders the passage of dust particles into the filter, the large initial particle velocity increases the rebound speed of dust particles, and the gravity effect of dust particles promotes the settlement of itself and other dust particles. In order to make the filter have a low blocking rate to maintain good filtration performance, the dust particle feed rate should avoid 500–750 g/s as far as possible, and the initial particle speed should be maintained in the range of 3–6 m/s, and the lower the speed, the lower the blocking rate.
(2) In order to increase the settling speed of dust particles in the filter box and reduce the secondary filtration, the feeding rate of dust particles should be selected as large as possible while avoiding the range of 250–500 g/s. A lower initial particle velocity is conducive to the settling of dust particles in the filter box.
(3) With the increase of particle deposition height, the area of fluid rising zone, falling zone, and low influence zone decreases, and the increase of accumulation height reduces the amount of particle rising, to a certain extent, which can achieve better filter performance. The position of the filter should be away from the inlet position of the dust particles to reduce the uneven blocking of the dust particles in the filter. Cleaning the dust particles in the filter box in time can improve the filtering performance of the filter [18,29].

Author Contributions

Conceptualization, Y.Z., X.F. and X.M.; methodology, Y.Z.; software, Y.Z.; validation, S.W., X.F. and Y.Z.; formal analysis, Y.Z. and S.W.; investigation, L.C. and M.X.; resources, X.F.; data curation, S.W.; writing—original draft preparation, Y.Z.; writing—review and editing, Y.Z. and S.W.; supervision, X.F.; project administration, X.F.; funding acquisition, X.F. All authors have read and agreed to the published version of the manuscript.

Funding

This work was supported by the Key projects of Natural Science Foundation of Shandong Province (ZR2020KE022), and Key projects of Natural Science Foundation of Shandong Province (ZR2021ME179), the Major innovation project in Shandong Province (2019JZZY010451).

Data Availability Statement

The data presented in this study are available on request from the corresponding author. The data are not publicly available due to the data relates to corporate research results.

Acknowledgments

Thanks to Shandong Roadway Construction Machinery Manufacturing Co., LTD. For the road milling machine test equipment and technical support.

Conflicts of Interest

The authors declare that they have no known competing financial interests or personal relationships that could have appeared to influence the work reported in this paper.

References

  1. Zhang, L.; Zhou, G.; Ma, Y.; Jing, B.; Sun, B.; Han, F.; He, M.; Chen, X. Numerical Analysis on Spatial Distribution for Concentration and Particle Size of Particulate Pollutants in Dust Environment at Fully Mechanized Coal Mining Face. Powder Technol. 2021, 383, 143–158. [Google Scholar] [CrossRef]
  2. Torno, S.; Toraño, J.; Álvarez-Fernández, I. Simultaneous Evaluation of Wind Flow and Dust Emissions from Conveyor Belts Using Computational Fluid Dynamics (CFD) Modelling and Experimental Measurements. Powder Technol. 2020, 373, 310–322. [Google Scholar] [CrossRef]
  3. Kang, K.; Kim, T.; Shin, C.W.; Kim, K.; Kim, J.; Lee, Y.G. Filtration Efficiency and Ventilation Performance of Window Screen Filters. Build. Environ. 2020, 178, 106878. [Google Scholar] [CrossRef]
  4. Ding, X.; Xu, G.; Liu, W.V.; Yang, L.; Albijanic, B. Effect of Polymer Stabilizers’ Viscosity on Red Sand Structure Strength and Dust Pollution Resistance. Powder Technol. 2019, 352, 117–125. [Google Scholar] [CrossRef]
  5. Tian, X.; Ou, Q.; Pei, C.; Li, Z.; Liu, J.; Liang, Y.; Pui, D.Y.H. Effect of Main-Stage Filter Media Selection on the Loading Performance of a Two-Stage Filtration System. Build. Environ. 2021, 195, 107745. [Google Scholar] [CrossRef]
  6. Nazarova, Е.; Alimova, D.S.; Mikhaylov, V.I.; Krivoshapkina, E.F.; Krivoshapkin, P.V. Macroporous Ceramic Filters from Mineral Raw Materials for Machine Oils Filtration. Ceram. Int. 2019, 45, 8767–8773. [Google Scholar] [CrossRef]
  7. Postila, H.; Heiderscheidt, E.; Leiviskä, T. Removal of Metals from Mine Drainage Waters by in Situ Mineral Sorbent-Based Pilot Filter Systems. J. Environ. Manag. 2019, 236, 631–638. [Google Scholar] [CrossRef]
  8. Wakeman, R.J.; Hanspal, N.S.; Waghode, A.N.; Nassehi, V. Analysis of Pleat Crowding and Medium Compression in Pleated Cartridge Filters. Chem. Eng. Res. Des. 2005, 83, 1246–1255. [Google Scholar] [CrossRef]
  9. Qiu, J.; Wu, D.; Chen, D.R.; Li, J. Reverse Pulsed-Flow Cleaning of Pleated Filter Cartridges Having an Inner Pleated Filter Cone. Process Saf. Environ. Prot. 2021, 146, 481–489. [Google Scholar] [CrossRef]
  10. Furumoto, K.; Narita, T.; Fukasawa, T.; Ishigami, T.; Kuo, H.P.; Huang, A.N.; Fukui, K. Influence of Pulse-Jet Cleaning Interval on Performance of Compact Dust Collector with Pleated Filter. Sep. Purif. Technol. 2021, 279, 119688. [Google Scholar] [CrossRef]
  11. Zhou, R.; Meng, L.; Yuan, X.; Qiao, Z. Research and Experimental Analysis of Hydraulic Cylinder Position Control Mechanism Based on Pressure Detection. Machines 2022, 10, 1. [Google Scholar] [CrossRef]
  12. Lu, X.; Xie, P.; Ingham, D.B.; Ma, L.; Pourkashanian, M. A Porous Media Model for CFD Simulations of Gas-Liquid Two-Phase Flow in Rotating Packed Beds. Chem. Eng. Sci. 2018, 189, 123–134. [Google Scholar] [CrossRef]
  13. Teitel, M. On the Applicability of the Forchheimer Equation in Simulating Flow through Woven Screens. Biosyst. Eng. 2011, 109, 130–139. [Google Scholar] [CrossRef]
  14. Roegiers, J.; Denys, S. Development of a Novel Type Activated Carbon Fiber Filter for Indoor Air Purification. Chem. Eng. J. 2021, 417, 128109. [Google Scholar] [CrossRef]
  15. Brown, A.I.; Levison, P.; Titchener-Hooker, N.J.; Lye, G.J. Membrane Pleating Effects in 0.2 Μm Rated Microfiltration Cartridges. J. Membr. Sci. 2009, 341, 76–83. [Google Scholar] [CrossRef]
  16. Brown, A.I.; Titchener-Hooker, N.J.; Lye, G.J. Scale-down Prediction of Industrial Scale Pleated Membrane Cartridge Performance. Biotechnol. Bioeng. 2011, 108, 830–838. [Google Scholar] [CrossRef] [PubMed]
  17. Velali, E.; Dippel, J.; Stute, B.; Handt, S.; Loewe, T.; von Lieres, E. Model-Based Performance Analysis of Pleated Filters with Non-Woven Layers. Sep. Purif. Technol. 2020, 250, 117006. [Google Scholar] [CrossRef]
  18. Kang, S.; Bock, N.; Swanson, J.; Pui, D.Y.H. Characterization of Pleated Filter Media Using Particle Image Velocimetry. Sep. Purif. Technol. 2020, 237, 116333. [Google Scholar] [CrossRef]
  19. Xiong, R.; Sun, G.; Si, K.; Liu, Q.; Liu, K. Pressure Drop Prediction of Ceramic Membrane Filters at High Temperature. Powder Technol. 2020, 364, 647–653. [Google Scholar] [CrossRef]
  20. Cortés, C.; Gil, A. Modeling the Gas and Particle Flow inside Cyclone Separators. Prog. Energy Combust. Sci. 2007, 33, 409–452. [Google Scholar] [CrossRef]
  21. Zhang, R.; Hao, S.; Zhang, C.; Meng, W.; Zhang, G.; Liu, Z.; Gao, D.; Tang, Y. Analysis and Simulation of Erosion of Sand Control Screens in Deep Water Gas Well and Its Practical Application. J. Pet. Sci. Eng. 2020, 189, 106997. [Google Scholar] [CrossRef]
  22. Zhang, Y.; Zhang, J.; Ma, J.; Li, X. Erosion Wear Behavior of Slotted Screen Liner for Sand Control. Tribology 2009, 29. [Google Scholar] [CrossRef]
  23. Huang, X.; Zheng, Q.; Yu, A.; Yan, W. Shape Optimization of Conical Hoppers to Increase Mass Discharging Rate. Powder Technol. 2020, 361, 179–189. [Google Scholar] [CrossRef]
  24. Shen, J.; Roberts, A.; Wheeler, C. Dem Simulations on Gate Loads and Bin Storage Characteristics before Discharge. Powder Technol. 2021, 383, 280–291. [Google Scholar] [CrossRef]
  25. Žídek, M.; Rozbroj, J.; Jezerska, L.; Diviš, J.; Nečas, J.; Zegzulka, J.; Demmler, M. Effective Use of DEM to Design Chain Conveyor Geometry. Chem. Eng. Res. Des. 2021, 167, 25–36. [Google Scholar] [CrossRef]
  26. Bibak, Z.; Banisi, S. A Combined Physical and DEM Modelling Approach to Investigate Particle Shape Effects on Load Movement in Tumbling Mills. Adv. Powder Technol. 2021, 32, 916–930. [Google Scholar] [CrossRef]
  27. Li, Y.; Lin, Q.; Meng, F.; Zheng, Y.; Xu, X. Research on the Influence of Tip Clearance of Axial-Flow Pump on Energy Characteristics under Pump and Turbine Conditions. Machines 2022, 10, 56. [Google Scholar] [CrossRef]
  28. Howarth, J.; Anand, S.C. Design, Development and Characterization of a Novel and Innovative Exhaust Filter Media for the Global Automotive Industry. Text. Res. J. 2016, 86, 1962–1972. [Google Scholar] [CrossRef]
  29. Sheng, Y.; Zhang, L.; Wang, Y.; Miao, Z. Exploration of a Novel Three-Dimensional Knitted Spacer Air Filter with Low Pressure Drop on Cooking Fume Particles Removal. Build. Environ. 2020, 177, 106903. [Google Scholar] [CrossRef]
  30. Bian, Y.; Wang, R.; Wang, S.; Yao, C.; Ren, W.; Chen, C.; Zhang, L. Metal-Organic Framework-Based Nanofiber Filters for Effective Indoor Air Quality Control. J. Mater. Chem. A 2018, 6, 15807–15814. [Google Scholar] [CrossRef]
  31. Mahgoub, A.O.; Ghani, S. Numerical and Experimental Investigation of Utilizing the Porous Media Model for Windbreaks CFD Simulation. Sustain. Cities Soc. 2021, 65, 102648. [Google Scholar] [CrossRef]
  32. Kendouci, M.A.; Kharroubi, B.; Khelfaoui, R.; Bendida, A.; Dennai, B.; Maazouzi, A. Simulation of Water Filtration in Porous Zone Based on Darcy’s Law. Energy Procedia 2013, 36, 163–168. [Google Scholar] [CrossRef]
  33. Xu, B.H.; Yu, A.B. Numerical Simulation of the Gas-Solid Flow in a Fluidized Bed by Combining Discrete Particle Method with Computational Fluid Dynamics. Chem. Eng. Sci. 1997, 52, 2785–2809. [Google Scholar] [CrossRef]
  34. Kuang, S.; Zhou, M.; Yu, A. CFD-DEM Modelling and Simulation of Pneumatic Conveying: A Review. Powder Technol. 2020, 365, 186–207. [Google Scholar] [CrossRef]
  35. Xu, Z.; Kong, F.; Tang, L.; Liu, M.; Wang, J.; Qiu, N. Effect of Blade Thickness on Internal Flow and Performance of a Plastic Centrifugal Pump. Machines 2022, 10, 61. [Google Scholar] [CrossRef]
  36. Yang, X.D.; Zhao, L.; Li, H.X.; Liu, C.S.; Hu, E.Y.; Li, Y.W.; Hou, Q.F. DEM Study of Particles Flow on an Industrial-Scale Roller Screen. Adv. Powder Technol. 2020, 31, 4445–4456. [Google Scholar] [CrossRef]
  37. Jiang, H.; Duan, C.; Wu, J.; Zhao, Y.; Liu, C.; Luo, Z.; Dong, L.; Zhang, B.; Wang, Z.; Zhang, C.; et al. Kinematics Characteristics of the Vibrating Screen with Rigid-Flexible Screen Rod and the Behavior of Moist Coal Particles during the Dry Deep Screening Process. Powder Technol. 2017, 319, 92–101. [Google Scholar] [CrossRef]
  38. Jiang, H.; Zhao, Y.; Duan, C.; Yang, X.; Liu, C.; Wu, J.; Qiao, J.; Diao, H. Kinematics of Variable-Amplitude Screen and Analysis of Particle Behavior during the Process of Coal Screening. Powder Technol. 2017, 306, 88–95. [Google Scholar] [CrossRef]
  39. Bin, C.; Cong, W.; Zhiwei, W.; Liejin, G. Investigation of Gas-Solid Two-Phase Flow across Circular Cylinders with Discrete Vortex Method. Appl. Therm. Eng. 2009, 29, 1457–1466. [Google Scholar] [CrossRef]
  40. Yang, F.; Jiang, D.; Yuan, Y.; Lv, Y.; Jian, H.; Gao, H. Influence of Rotation Speed on Flow Field and Hydraulic Noise in the Conduit of a Vertical Axial-Flow Pump under Low Flow Rate Condition. Machines 2022, 10, 691. [Google Scholar] [CrossRef]
  41. Li, Z.; Ding, Y. dong; Liao, Q.; Cheng, M.; Zhu, X. An Approach Based on the Porous Media Model for Numerical Simulation of 3D Finned-Tubes Heat Exchanger. Int. J. Heat Mass Transf. 2021, 173, 121226. [Google Scholar] [CrossRef]
  42. Liu, Y. Simulation Study on Milling Device of Road Milling Machine Based on the Discrete Element Method. Master’s Thesis, Jilin University, Changchun, China, 2015; pp. 1–86. Available online: https://kns.cnki.net/KCMS/detail/detail.aspx?dbname=CMFD201502&filename=1015588251.nh (accessed on 28 August 2022).
  43. Zou, R.P.; Yu, A.B. Evaluation of the Packing Characteristics of Mono-Sized Non-Spherical Particles. Powder Technol. 1996, 88, 71–79. [Google Scholar] [CrossRef]
  44. Zhou, J.; Liu, Y.; Liu, S. yong; Du, C. long; Li, J. Effects of Particle Shape and Swirling Intensity on Elbow Erosion in Dilute-Phase Pneumatic Conveying. Wear 2017, 380–381, 66–77. [Google Scholar] [CrossRef]
  45. Ran, Z.; Ma, W.; Wang, K.; Chai, B. Multi-Objective Optimization Design for a Novel Parametrized Torque Converter Based on an Integrated CFD Cascade Design System. Machines 2022, 10, 482. [Google Scholar] [CrossRef]
Figure 1. Overall structure configuration of filter equipment. (a) overall structure configuration (b) device size drawing.
Machines 10 00862 g001
Figure 2. Hertz–Mindlin mechanical model.
Machines 10 00862 g002
Figure 3. Mesh model of fluid computing domain.
Machines 10 00862 g003
Figure 4. Geometric model of filter screen.
Machines 10 00862 g004
Figure 5. Non-spherical particle model.
Machines 10 00862 g005
Figure 6. Schematic diagram of particle blockage in filter screen.
Machines 10 00862 g006
Figure 7. Mesh sensitivity study.
Machines 10 00862 g007
Figure 8. Model accuracy validation test. (a) pressure measuring test (b) principle of pressure measurement (c) wind speed measuring test (d) principle of wind speed measurement
Machines 10 00862 g008
Figure 9. Outlet and inlet wind speed test measurement results.
Machines 10 00862 g009
Figure 10. Velocity distribution and vortex formation diagram.
Machines 10 00862 g010
Figure 11. Snapshots of the screening process in DEM simulations: (a) spherical particles and (b) non-spherical particles.
Machines 10 00862 g011
Figure 12. Velocity and pressure distribution of the filter.
Machines 10 00862 g012
Figure 13. The effect of working parameters on plugging rate: (a) feed rate (b) initial particle velocity
Machines 10 00862 g013
Figure 14. The effect of working parameters on settling velocity: (a) feed rate (b) initial particle velocity.
Machines 10 00862 g014
Figure 15. Calculation domain division of filter screen.
Machines 10 00862 g015
Figure 16. The effect of working parameters on non-uniformity of each calculation domain. (a) feed rate (b) initial particle velocity
Machines 10 00862 g016
Figure 17. Velocity vector diagram of airflow region affecting particle motion: (a) h = 0 mm (b) h = 40 mm (c) h = 80 mm (d) h = 120 mm
Machines 10 00862 g017
Table 1. Material parameters used in simulations.
DetailsIndexValue
ParticlePoisson’s ratio [-]0.25
Shear modulus [Pa]1.0 × 10⁸
Density [kg·m−3]2600
WallPoisson’s ratio [-]0.3
Shear modulus [Pa]7.9 × 10¹⁰
Density [kg·m−3]7850
Particle–ParticleCoefficient of restitution [-]0.25
Coefficient of static friction [-]0.75
Coefficient of rolling friction [-]0.05
Particle–WallCoefficient of restitution [-]0.5
Coefficient of static friction [-]0.5
Coefficient of rolling friction [-]0.05
Publisher’s Note: MDPI stays neutral with regard to jurisdictional claims in published maps and institutional affiliations.

