Article

Experimental Study on the Influence of Micro-Abrasive and Micro-Jet Impact on the Natural Frequency of Materials under Ultrasonic Cavitation

School of Mechanical Engineering, North University of China, Taiyuan 030051, China
*
Author to whom correspondence should be addressed.
Machines 2022, 10(10), 891; https://doi.org/10.3390/machines10100891
Submission received: 29 August 2022 / Revised: 29 September 2022 / Accepted: 30 September 2022 / Published: 3 October 2022
(This article belongs to the Section Advanced Manufacturing)

Abstract

:
The higher the natural frequency of the material is, the more resistant it is to deformation under impulse loading. To explore the influence of micro-abrasive and micro-jet impact on the natural frequency and resonance amplitude value of the material under ultrasonic cavitation, 18 sets of single-factor controlled variable ultrasonic cavitation experiments were carried out on a polished specimen of 6061 aluminum alloy (30 mm × 30 mm × 10 mm). With the increase of the abrasive content in the suspension, the natural frequency of the workpiece first increased, then decreased and remained stable. With the increase of the ultrasonic amplitude, the resonance amplitude value of the material increased, reaching the maximum at 0.1789 m·s−2 and then decreased. The effect of ultrasonic amplitude on the natural frequency of the material was greater than that of the abrasive content, and the effect of the abrasive content on the common amplitude value was greater than that of the ultrasonic amplitude. This research provides a certain reference significance for exploring the influence of power ultrasonic micro-cutting on material properties and avoiding the occurrence of resonance phenomenon of the workpiece under different working conditions.

1. Introduction

Ultrasonic cavitation is an interdisciplinary complex phenomenon with important research value, which is related to nonlinear dynamic acoustics, fluid mechanics, thermodynamics, chemistry, and so on [1,2]. The cavitation phenomenon is mainly characterized by the repeated formation and strong collapse of vacuoles in the liquid, and a series of secondary effects will be produced during the collapse process, such as micro-jets, shock waves, and sonoluminescence, resulting in local high temperature and high pressure. There will be strong impact on the surface of the material if the cavitation phenomenon occurs near the solid material, and even cause erosion damage to the material [3]. At the end of the 19th century, Parsons and Barnaby first proposed the cavitation effect, and pointed out that the collapse of the cavitation is the main reason for the reduction of the efficiency of propeller blades. With the deepening of the research on the properties of cavitation and its secondary effects, ultrasonic cavitation plays a key role in chemical research, mechanical industry, and biomedicine, such as ultrasonic chemistry, ultrasonic cleaning [4], ultrasonic cavitation peening [5], sonothrombolysis and sonoporation [6], microfluidic devices [7], and high-intensity focused ultrasound [8].
The micro-abrasive can realize the rapid formation of cavitation nuclei and enhance the cavitation effect [9]. Adding micro-abrasive to the working fluid can significantly improve the removal rate of the material and have a stronger grinding effect on the surface of the material, which further improves the surface modification effect of the material. Therefore, it is a hot direction of cavitation research to explore surface modification by micro-cutting materials with micro-abrasive and micro-jets.
Surface modification of materials can be achieved by ultrasonic cavitation. Toh [5] proposed for the first time that the ultrasonic cavitation peening can be applied to complex special-shaped surfaces and reduce the roughness of the material surface. In the past ten years, many scholars have proposed methods such as ultrasonic cavitation peening, laser-induced cavitation peening, and cavitation abrasive flow polishing to achieve material polishing and surface modification.
Beaucamp [10] proposed that the micro-jet action of cavitation collapse at the micro-scale and the erosion of the fluid vibration abrasive at the macro-scale are the two main mechanisms of cavitation polishing. Bai et al. [11] studied the plastic deformation of materials by ultrasonic cavitation, and found that the microhardness of materials was significantly improved with the increase of ultrasonic amplitude. Guo et al. [12] studied the relationship between micro-jet and bubble parameters, and proposed that ultrasonic cavitation induced cavitation bubbles near the solid wall, and the high-speed micro-jet released by the collapse caused the plastic deformation of the material wall. The micro-jet released by the collapse of the cavitation can realize the modification of metal materials [13]. Ye et al. [14] carried out finite element simulation of ultrasonic cavitation micro-jet, and analyzed the deformation of the material wall caused by the micro-jet. Zhang et al. [15] simulated the bubble collapse process near the wall in static flow fields and high-speed jet, and found that the micro-jet generated by bubble collapse would damage the wall. Furthermore, the shock waves generated by bubble collapse generate material altering stress and plastic deformation of the wall, which causes plastic deformation of the wall. Liu et al. [16] found that the cavitation effect can cause the softened surface layer of the material to fall off.
Balamurugan et al. [17] used water jet cavitation peening to modify and strengthen the root surface of molybdenum-based high-speed steel forming tools, which improved the tool fatigue life. Laguna-Camacho [18] found that abrasive grains can make irregular dents on the surface of the material by conducting cavitation tests on 6082 aluminum alloy, 304 stainless steel, and 4340 steel in tap water without and with SiC particles, respectively. Nagalingam [19] used SiC abrasive fluid cavitation erosion to process the inner surface of cylindrical aluminum alloy parts manufactured by laser cladding additive manufacturing and analyzed the processing effect.
Due to the phenomenon of grain boundary migration and grain refinement, the stiffness of the material will change, and the natural frequency of the material will also change after surface modification of materials by ultrasonic cavitation. Sugaswwa et al. [20] claimed that cavitation shock causes submicron grain refinement on the surface of the material. During the grain refinement process, the crystal orientation changes. Some studies have shown that there is a phase transition in which the energy accumulated due to cavitation shocks in grains is rearranged to the energy of the grain boundaries. When the kernel average misorientation value of the grain reaches a constant value, the grain decomposes into small grains [21].
Mahesh and Mathew [22] claimed that reducing grain boundary sliding can reduce the rate of cavitation damage and thus prolong the creep life under high stress. Zhang et al. [23] used cavitation shock to enhance the surface properties of 2A70 aluminum alloys; they captured the dynamic properties of cavitation bubbles with a high-speed camera and showed considerable improvement in fatigue life and corrosion resistance.
Chen and Wu [24] conducted cavitation experiments on 690 Inconel alloy, claiming that the areas subjected to strong cavitation are concentrated at grain boundaries, and the deformation areas of grain boundaries and twin boundaries are larger. Dular and Osterman [25] claimed that micro-deformations of the surface generate cavitation, causing more cavitation bubbles to appear in the region, and thereby more severe cavitation damage. Niederhofer et al. [26] suggested that cavitation damage preferentially occurs at grain boundaries with high density of dislocations.
In summary, there have been some studies on the modification of materials by ultrasonic cavitation and the interaction between cavitation effect and grain boundaries. However, few scholars have explained changes in material surface properties from the perspective of change in natural frequency of the material.
The natural frequency of the material is only related to its natural characteristics. When the external vibration frequency is equal to the natural frequency, resonance will occur, causing damage to the material structure. The higher the natural frequency of a material is, the more resistant it is to deformation under impulse loading. Therefore, increasing the natural frequency of the material can improve the ability of the material component to resist the deformation of the pulse load, so that it can work in a higher frequency working environment and avoid resonance.
6061 aluminum alloy is widely used in various fields such as aerospace [27] and weapon manufacturing [28] because of its excellent processing properties, corrosion resistance, and ability to be electroplated [29]. As a special machining method, ultrasonic machining has excellent cutting ability, precise smoothing [30], and outstanding surface strengthening [31]; it can achieve relatively high machining accuracy. The wear resistance and corrosion resistance of the material can be improved by ultrasonic machining [32]; thus, it is often used for processing of 6061 aluminum alloy. During the processing, the crystal structure of the material, the stiffness of the material, and the natural frequency of the material changes accordingly due to the influence of ultrasonic cavitation.
Many scholars have carried out extensive research on the cutting effect of micro-abrasive and micro-jet on materials, but the research on the micro-cutting mechanism of micro-abrasive and micro-jet on materials under ultrasonic cavitation environment is not yet mature, especially the research on the relationship between cavitation effect and material natural frequency or material resonance amplitude is still in the initial stage.
In this study, singular spectral decomposition (SSD) is used to investigate the influence of cavitation on the natural frequency of 6061 aluminum alloy. Furthermore, the influence of power ultrasonic micromachining on material properties is explored.
In 2014, P. Bonizzi et al. [33] proposed SSD, a new iterative time series decomposition method based on singular spectral analysis (SSA). In the article, SSD was applied to signal processing. SSD was used to process tidal and tsunami data, achieving excellent results. SSD decomposed the original vibration signal into multiple single-component signals, and adaptively reconstructed these signal components sequentially from high frequency to low frequency. Therefore, this paper uses SSD to process the collected material vibration signals. As a deconvolution filter, minimum entropy deconvolution (MED) counteracts the effect of the transmission path by finding an inverse filter that maximizes kurtosis, which can denoise the signal while enhancing the impact component. Sawalhi et al. [34] studied the MED algorithm in depth, and verified the effectiveness of the method by analyzing the signal. Liu et al. [35] proposed a new method to eliminate noise components in the infrared spectrum by using blind deconvolution method. Through experimental analysis, the noise reduction effect was determined by calculating the entropy value, and it was verified that the method was superior to the traditional noise reduction means. In this paper, the MED algorithm is used to denoise the collected material vibration signal, and then the processed signal is decomposed by SSD.
To explore the changes in the material resonance amplitude and the relationship between the impact of abrasive on the material in the abrasive suspension and the natural frequency of the material during ultrasonic cavitation processing, the MED algorithm was used to reduce the collected material vibration signal; pulse enhancement was achieved using an acoustic emission instrument, and then, SSD was used to decompose the processed signal. Through the envelope spectrum analysis, the relationship between the content of abrasive in the SiC abrasive suspension, the ultrasonic amplitude, and the natural frequency of the material was explored. Besides that, the change of the material resonance amplitude under different processing environments was studied.

2. Materials and Methods

2.1. Noise Reduction Processing

Under the influence of the ultrasonic cavitation working environment, the material vibration signal collected by the acoustic emission instrument had significant background noise. Therefore, before the signal research, it is necessary to perform preprocessing such as noise reduction and pulse enhancement.
The main purpose of the MED algorithm is finding the optimal filter to maximize the kurtosis value of the original signal, restoring the various characteristics of the original signal to the greatest extent, satisfying the physical characteristics of the original signal, and enhancing the pulse in the vibration signal.
Firstly, assume a vibration signal:
y ( n ) = h ( n ) × x ( n ) + e ( n )
where x(n) is the original shock sequence of the vibration signal and h(n) is the impulse response function of the transfer path. The influence of noise signal e(n) on the system for the time being is ignored in Equation (1). The deconvolution process is to find an L-order inverse filter w(n), and pass the lag output y(n) through the inverse filter to restore the input x(n) as follows:
x ( n ) = w ( n ) × y ( n )
The evaluated entropy value of the sequence norm was obtained by deconvolution, and the optimal result is obtained as follows:
O 2 4 ( w ( n ) ) = i = 1 N x 4 ( i ) [ i = 1 N x 2 ( i ) ] 2
The MED algorithm was used to determine the optimal inverse filter w(n) for minimizing the entropy after filtering, that is, to maximize the norm O 2 4 (w(n)). So, it was necessary to ensure that the first derivative of Equation (3) was zero as follows:
O 2 4 ( w ( n ) ) w ( n ) = 0
According to Equation (2),
x ( n ) = w ( n ) × y ( n ) = l = 1 L w ( n ) y ( n l )
where L is the size of the inverse filter w(n). Taking derivatives on both sides of Equation (5) as follows:
w ( n ) w ( l ) = y ( n l )
According to Equation (6), further calculate Equation (3) as follows:
n = 1 N x 2 ( n ) n = 1 N x 4 ( n ) n = 1 N x 3 ( n ) y ( n l ) = p = 1 L w ( p ) × n = 1 N y ( n l ) y ( n p )
b = n = 1 N x 2 ( n ) n = 1 N x 4 ( n ) n = 1 N x 3 ( n ) y ( n l )
w = p = 1 L w ( p )
A = n = 1 N y ( n l ) y ( n p )
Substituting Equations (8)–(10) into Equation (7), the matrix representation is obtained:
b = A w
where b is the cross-correlation matrix between the input and output of the inverse filter, A is the Toeplitz autocorrelation matrix inputed by the inverse filter, and w is the parameter of the inverse filter. According to Equation (11), the iterative method was used to solve the inverse filter matrix W.

2.2. Signal Decomposition

SSD is a new method that can adaptively decompose non-stationary and nonlinear vibration signal time series. The basic parameters of the algorithm can be adaptively selected, and the vibration signal can be adaptively decomposed into multiple singular spectrum components (SSC) and residual components in descending frequency order from high to low. The specific process of the SSD method is shown in Figure 1 as follows:

2.2.1. Building the Trajectory Matrix

Given an original signal of length N and the embedding dimension M, generate the M × N matrix X such that its i-th row is Xi = (x(i),…x(N), x(1),…x(i−1)), where i = 1,…,M, therefore X = [ x 1 T , x 2 T ,…, x M T ]T. For example, given a time series x(n) = {1,2,3,4,5}, and the embedding dimension is set to M = 3, the corresponding trajectory matrix will be:
X = [ 1 2 3 4 5 2 3 4 5 1 3 4 5 1 2 ]
The left side of the vertical line of the matrix corresponds to the trajectory matrix X utilized in SSA. To make the oscillatory components in the original vibration signal time series stand out and make the energy of the final residual signal components gradually weaken, the three elements in the lower right corner of the right side of the vertical line of the matrix are correctly added to the upper right corner of the left side of the vertical line. The new matrix constructed by it is as follows:
X = [ 1 1 2 1 2 3 4 5 2 3 4 5 3 4 5 ]

2.2.2. Adaptive Selection of Embedding Dimensions

Considering the impact of the embedding dimension size M on the decomposition results provided by SSA, the size of the embedding dimension used in the j-th iteration is selected here, and the power spectral density (PSD) of the residual component vj in the j-th iteration is calculated firstly.
v j ( n ) = x ( n ) k = 1 j 1 v k ( n ) ( v 0 ( n ) = x ( n ) )
The frequency fmax corresponding to the largest peak in the PSD associated with the main peak is then estimated. In the first iteration, if the normalized frequency fmax/Fs, where Fs is the sampling frequency, is less than a given threshold which is usually 103, indicating that there is a considerable trend in the time series, M is set to N/3. Otherwise, for the j-th iteration (j > 1), the embedding dimension is set to M = 1.2 × Fs/fmax.

2.2.3. Reconstruction of Component Sequence

Reconstructing the j-th component sequence g(1)(n) as follows: in the first iteration, if a particularly large trend has been detected, only the first left and right eigenvectors are used to obtain g(1)(n), so that X1 = σ1u1 v 1 , T and g(1)(n) is obtained from the diagonal average of X1.
Otherwise, for the j-th iteration (j > 1), select the feature group whose left eigenvector has prominent dominant frequency in the [fmax − δf, fmax + δf] spectral range and contributed the most to the energy of the main peak to create a subset Ij(Ij = {i1,…,ip}). The corresponding component sequence is then reconstructed by the diagonal mean along the diagonal of the matrix X j I = X 1 i +…+ X p i , where δf represents half the width of the main peak in the PSD of the residual sequence vj(n), which needs to be estimated from the PSD of vj(n).

2.2.4. Setting Iterative Stop Condition
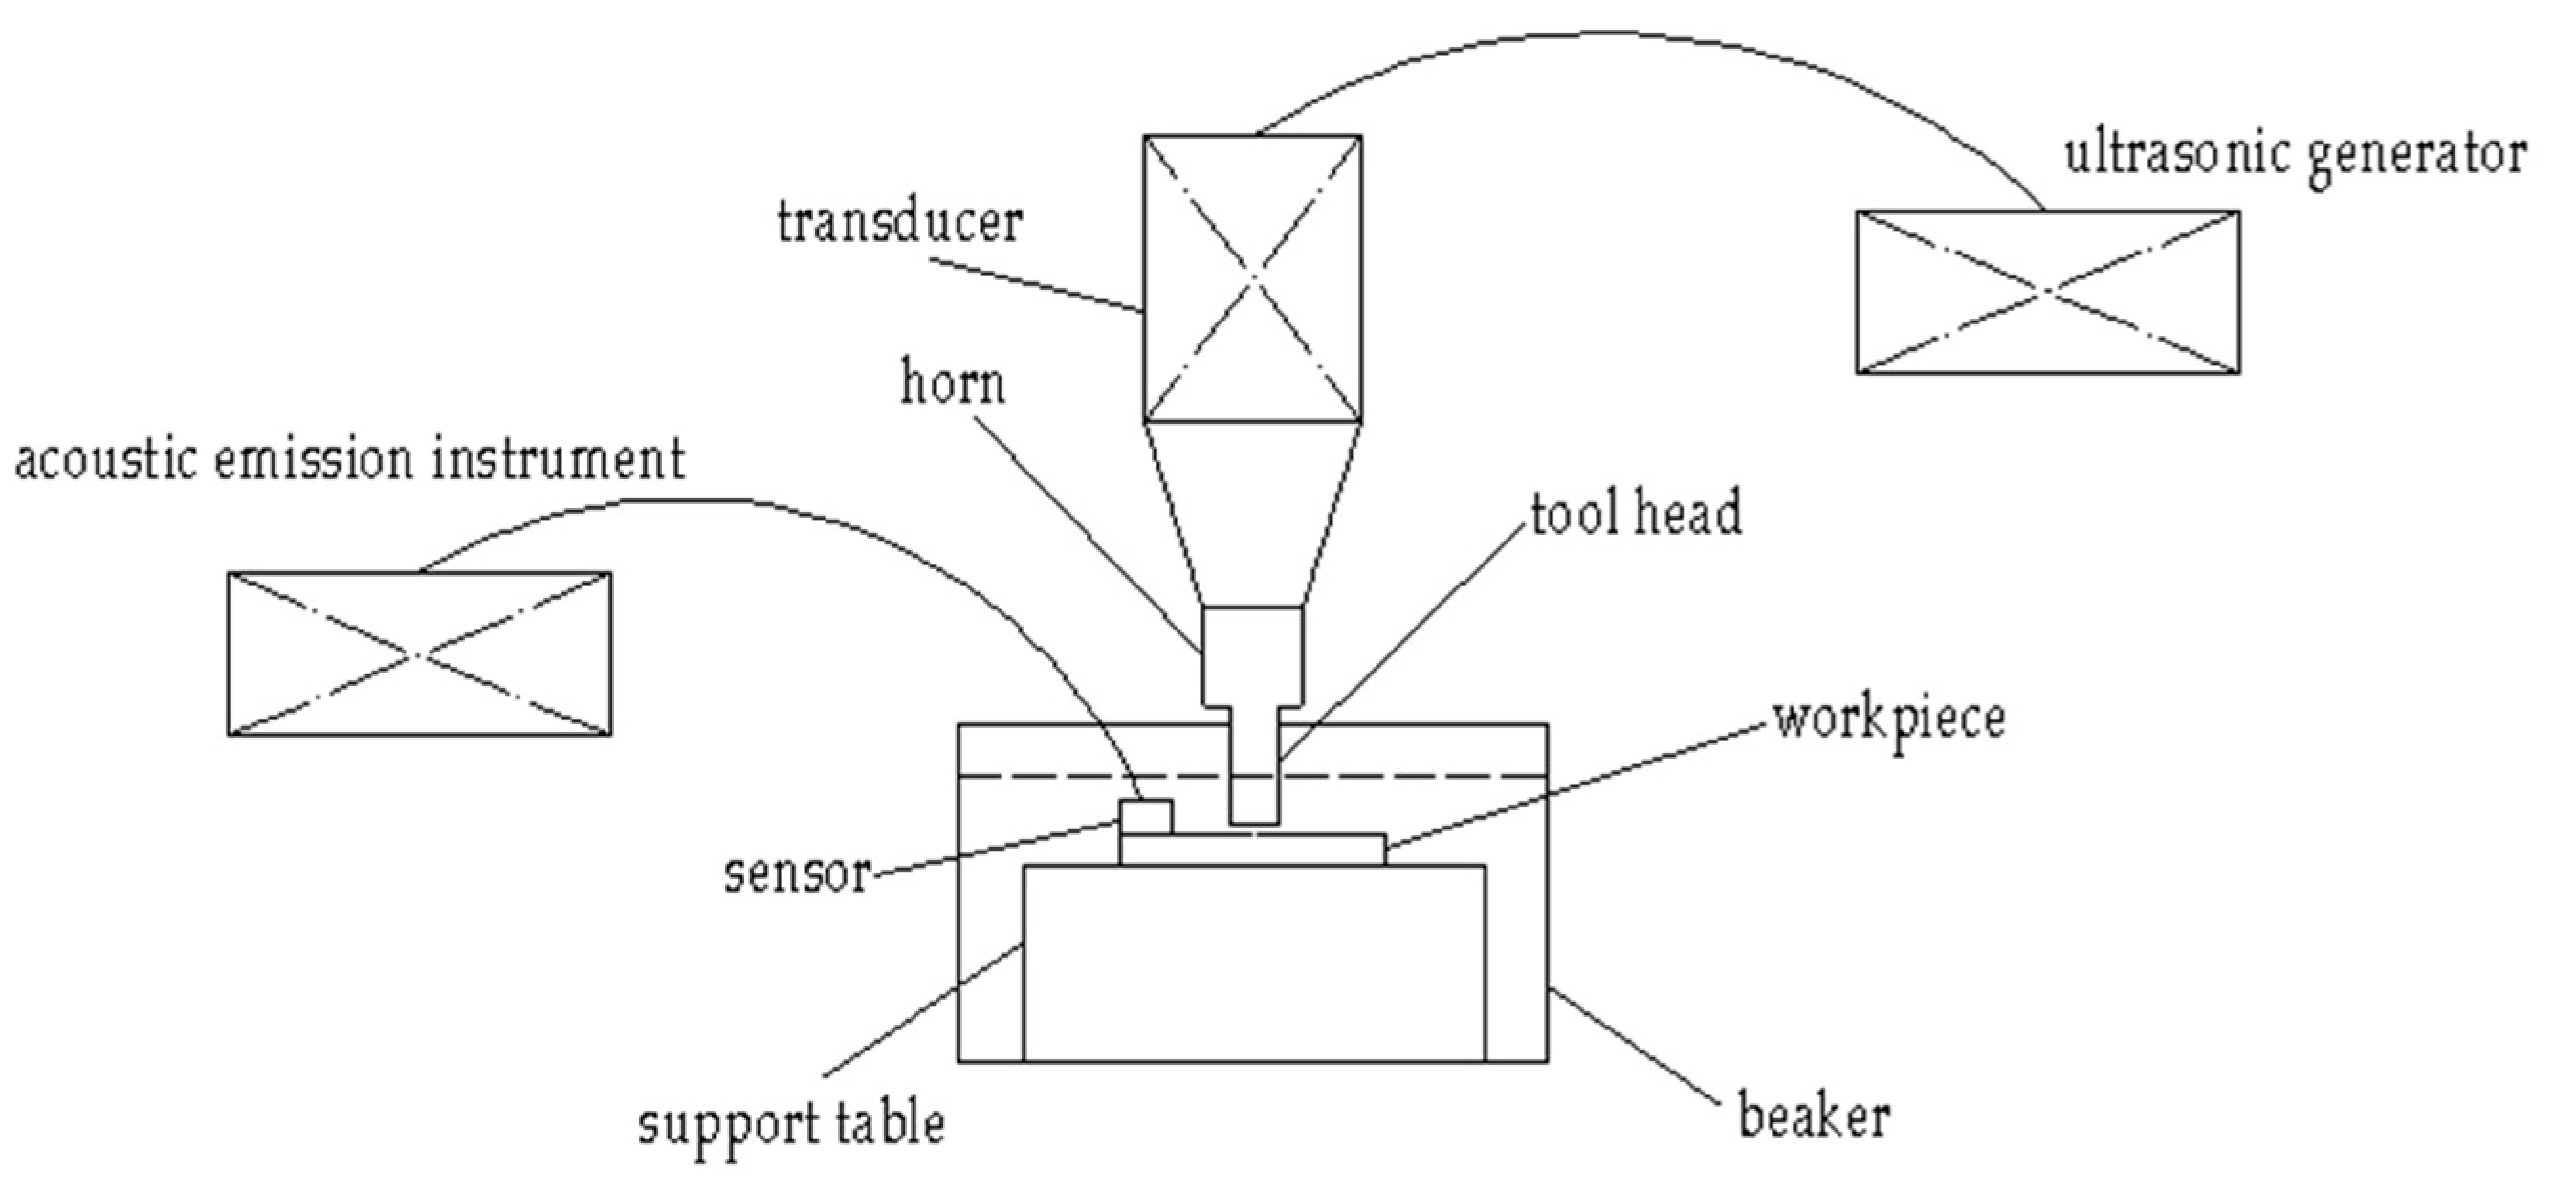
Each time a new component sequence gj(n) was estimated, a new residual was computed: v(j+1)(n) = v(j)(n)-g(j)(n), which represents the input to the next iteration (j + 1). Then, the normalized mean squared error (NMSE) between the residuals and the original signal was calculated:
N M S E ( j ) = i = 1 N ( v ( j + 1 ) ( n ) ) 2 i = 1 N ( x ( i ) ) 2
When NMSE was less than a given threshold, the decomposition process stops; otherwise, the iterative process continues until the stopping condition was met. It is represented as follows:
x ( n ) = k = 1 m g ( k ) ( n ) + v ( m + 1 ) ( n )
where m is the number of components.
The above is the principle of MED algorithm and SSD algorithm. Therefore, single factor controlled variable experiments were designed and carried out. The collected vibration signals of 6061 aluminum alloy were subjected to noise reduction processing by MED and signal decomposition processing by SSD. Then, envelope spectrum analysis was carried out to study the influence of abrasive content and ultrasonic amplitude on the natural frequency and resonance amplitude of the material.

2.3. Experiments

6061 aluminum alloy has the advantages of good corrosion resistance, electroplating, and resistance to deform after processing, so it is widely used in the aerospace applications. In this paper, the surface of 6061 aluminum alloy was modified by ultrasonic cavitation, and the effects of abrasive content and ultrasonic amplitude on the natural frequency and resonance amplitude of the material were analyzed. Mechanical properties of 6061 aluminum alloy are shown in Table 1.
To ensure a smooth cutting surface and high material preparation efficiency, 6061 aluminum alloy was cut into samples with dimensions of 30 mm × 30 mm × 10 mm. The samples were polished with sandpaper to remove excess oxides on the surface of the material, followed by polishing with a polishing machine. After polishing, the specimens were cleaned with alcohol and air dried.
The ultrasonic cavitation experiment platform is shown in Figure 2. It comprised an ultrasonic generator, transducer, horn, tool head, beaker, support table, acoustic emission instrument, and so on. The diameter of the tool head was 10.5 mm, and it was made of TC4 titanium alloy. The ultrasonic frequency in experiments was set to 30 ± 0.5 kHz. The ultrasonic intensity was adjusted by adjusting the percentage of ultrasonic amplitude. The maximum amplitude of the tool head was 15 ± 0.05 μm.
The workpiece was placed on the support table and placed in the beaker. The beaker is filled with abrasive suspensions with different SiC contents. The particle size of the SiC abrasive was 10 μm. The adjustment device ensures that the distance between the workpiece and the tool head was maintained at 5 ± 0.01 mm, and the processing time was 30 s. The sensor of the acoustic emission instrument was placed on the surface of the workpiece for signal acquisition.
The schematic diagram experimental set-up is shown in Figure 3.
The ultrasonic generator converted the current into a high-frequency alternating current signal that matched the transducer, and the signal was converted into high-frequency vibration through piezoelectric ceramic electro-acoustic conversion. Then, the high-frequency vibration was amplified by the horn. The tool head was mounted on the end of the horn, and both vibrated at the same frequency. During the experiment, the ultrasonic amplitude and the content of silicon carbide abrasive particles were changed, while the other conditions were kept unchanged, and the vibration signal of the workpiece under different conditions was measured.

3. Results

Two factors were controlled in the experiments, namely the abrasive content (0, 2.5 wt.%, 5 wt.%, 7.5 wt.%, 10 wt.%, 12.5 wt.%, 15 wt.%, 17.5 wt.%, and 20 wt.%) and ultrasonic amplitude, which is expressed as a percentage of maximum amplitude (30%, 35%, 40%, 45%, 50%, 55%, 60%, 65%, and 70%). Eighteen groups of single-factor controlled variable experiments were carried out, and the specifications of the 6061 aluminum alloy blocks used in each experiment were the same. Details of the experiments are shown in Table 2 and Table 3.
The workpiece surfaces after experiments in abrasive suspensions with different SiC contents (0, 2.5 wt.%, 5 wt.%, 7.5 wt.%, 10 wt.%, 12.5 wt.%, 15 wt.%, 17.5 wt%, and 20 wt.%) are shown in Figure 4 from left to right and top to bottom. The workpiece surfaces after experiments at ultrasonic amplitudes of 30%, 35%, 40%, 45%, 50%, 55%, 60%, 65%, and 70% are shown in Figure 5 from the left to the right and from top to bottom. 6061 aluminum alloy is very easy to be oxidized. During the experiments, the workpiece surfaces were oxidized, so the images look blurred and indistinct. The influence of ultrasonic cavitation on the workpiece surface was clearly seen in Figure 4 and Figure 5.
The captured vibration signal was the resonance frequency. The natural frequency is the specific frequency determined by the properties of the material. Under the action of an external force of a certain frequency, the material will vibrate at the frequency of the external force. When the frequency of the external force is the same as the natural frequency of the material, the amplitude will reach the maximum. That is, resonance occurs. At this time, the measured resonant frequency is approximately equal to the natural frequency.
To further verify the accuracy of the measured frequency, the natural frequency of the workpiece was measured by free vibration. The natural frequencies of workpieces in Table 2 measured by free vibration are shown in Table 4. The natural frequencies of workpieces in Table 3 measured by free vibration are shown in Table 5. By comparison, the natural frequencies of the two measurements are basically the same.
After the experiment was completed, MED algorithm was used to denoise and pulse enhancement of the collected signal data, thereafter the processed signal was decomposed by SSD algorithm. Finally, the envelope spectrum was analyzed.

4. Discussion

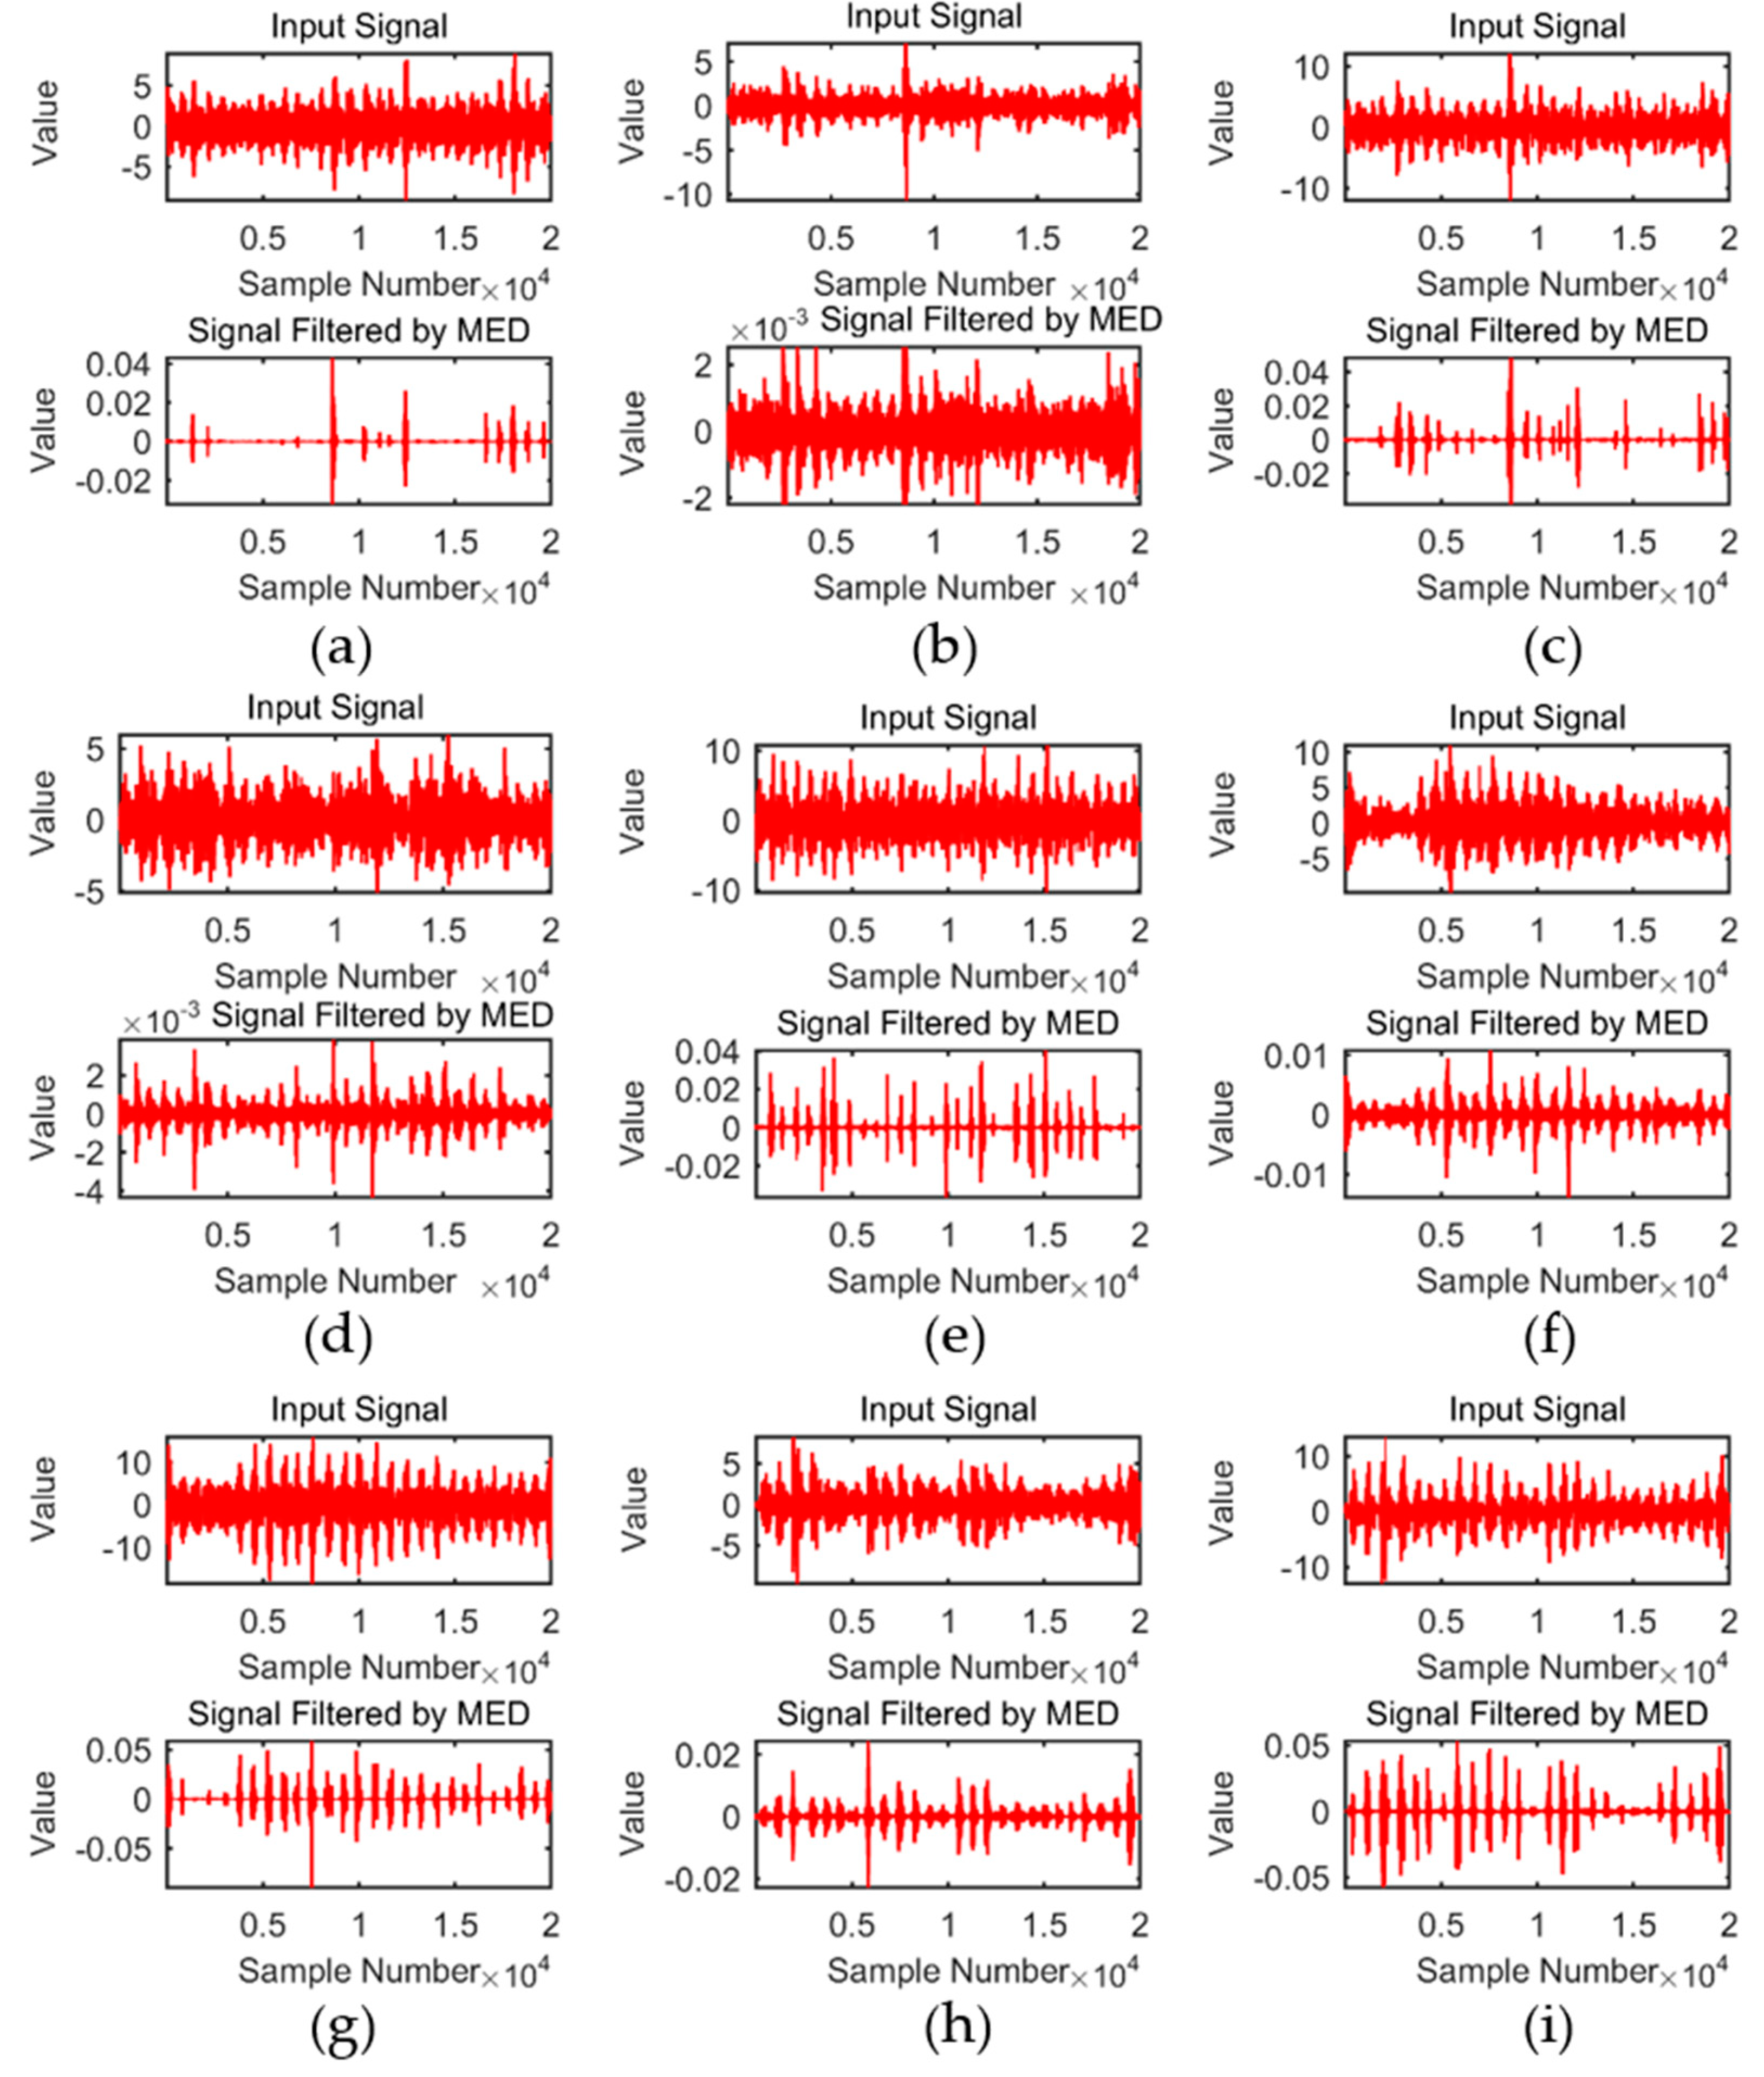
4.1. Pretreatment of Material Vibration Signal

To accurately obtain the vibration signals on the surface of the 6061 aluminum alloy material under the action of ultrasonic cavitation, noise reduction and pulse enhancement processing of the collected signals were necessary, especially to remove high frequency signals near the tool head. For the convenience of calculation, the first 20,000 data were taken for analysis and research without affecting the results.
The measured vibration signals of materials in abrasive suspensions with different SiC contents (0, 2.5 wt.%, 5 wt.%, 7.5 wt.%, 10 wt.%, 12.5 wt.%, 15 wt.%, 17.5 wt.%, and 20 wt.%) and the signal waveforms after MED processing are shown in Figure 6 from left to right and top to bottom. The abscissa and the ordinate are the sampling point and amplitude, respectively. MED verified the effectiveness of the method by Sawalhi et al. through analyzing the collected signals [34]. Comparing the waveforms before and after MED processing, the effect of MED filtering was observed clearly. The waveform data of some sampling points were obviously filtered. MED filtering was thus beneficial to the analysis and research of the data. The material vibration signals at ultrasonic amplitudes of 30%, 35%, 40, 45%, 50%, 55%, 60%, 65%, and 70% and the signal waveforms by MED are shown in Figure 7 from the left to the right and from top to bottom.

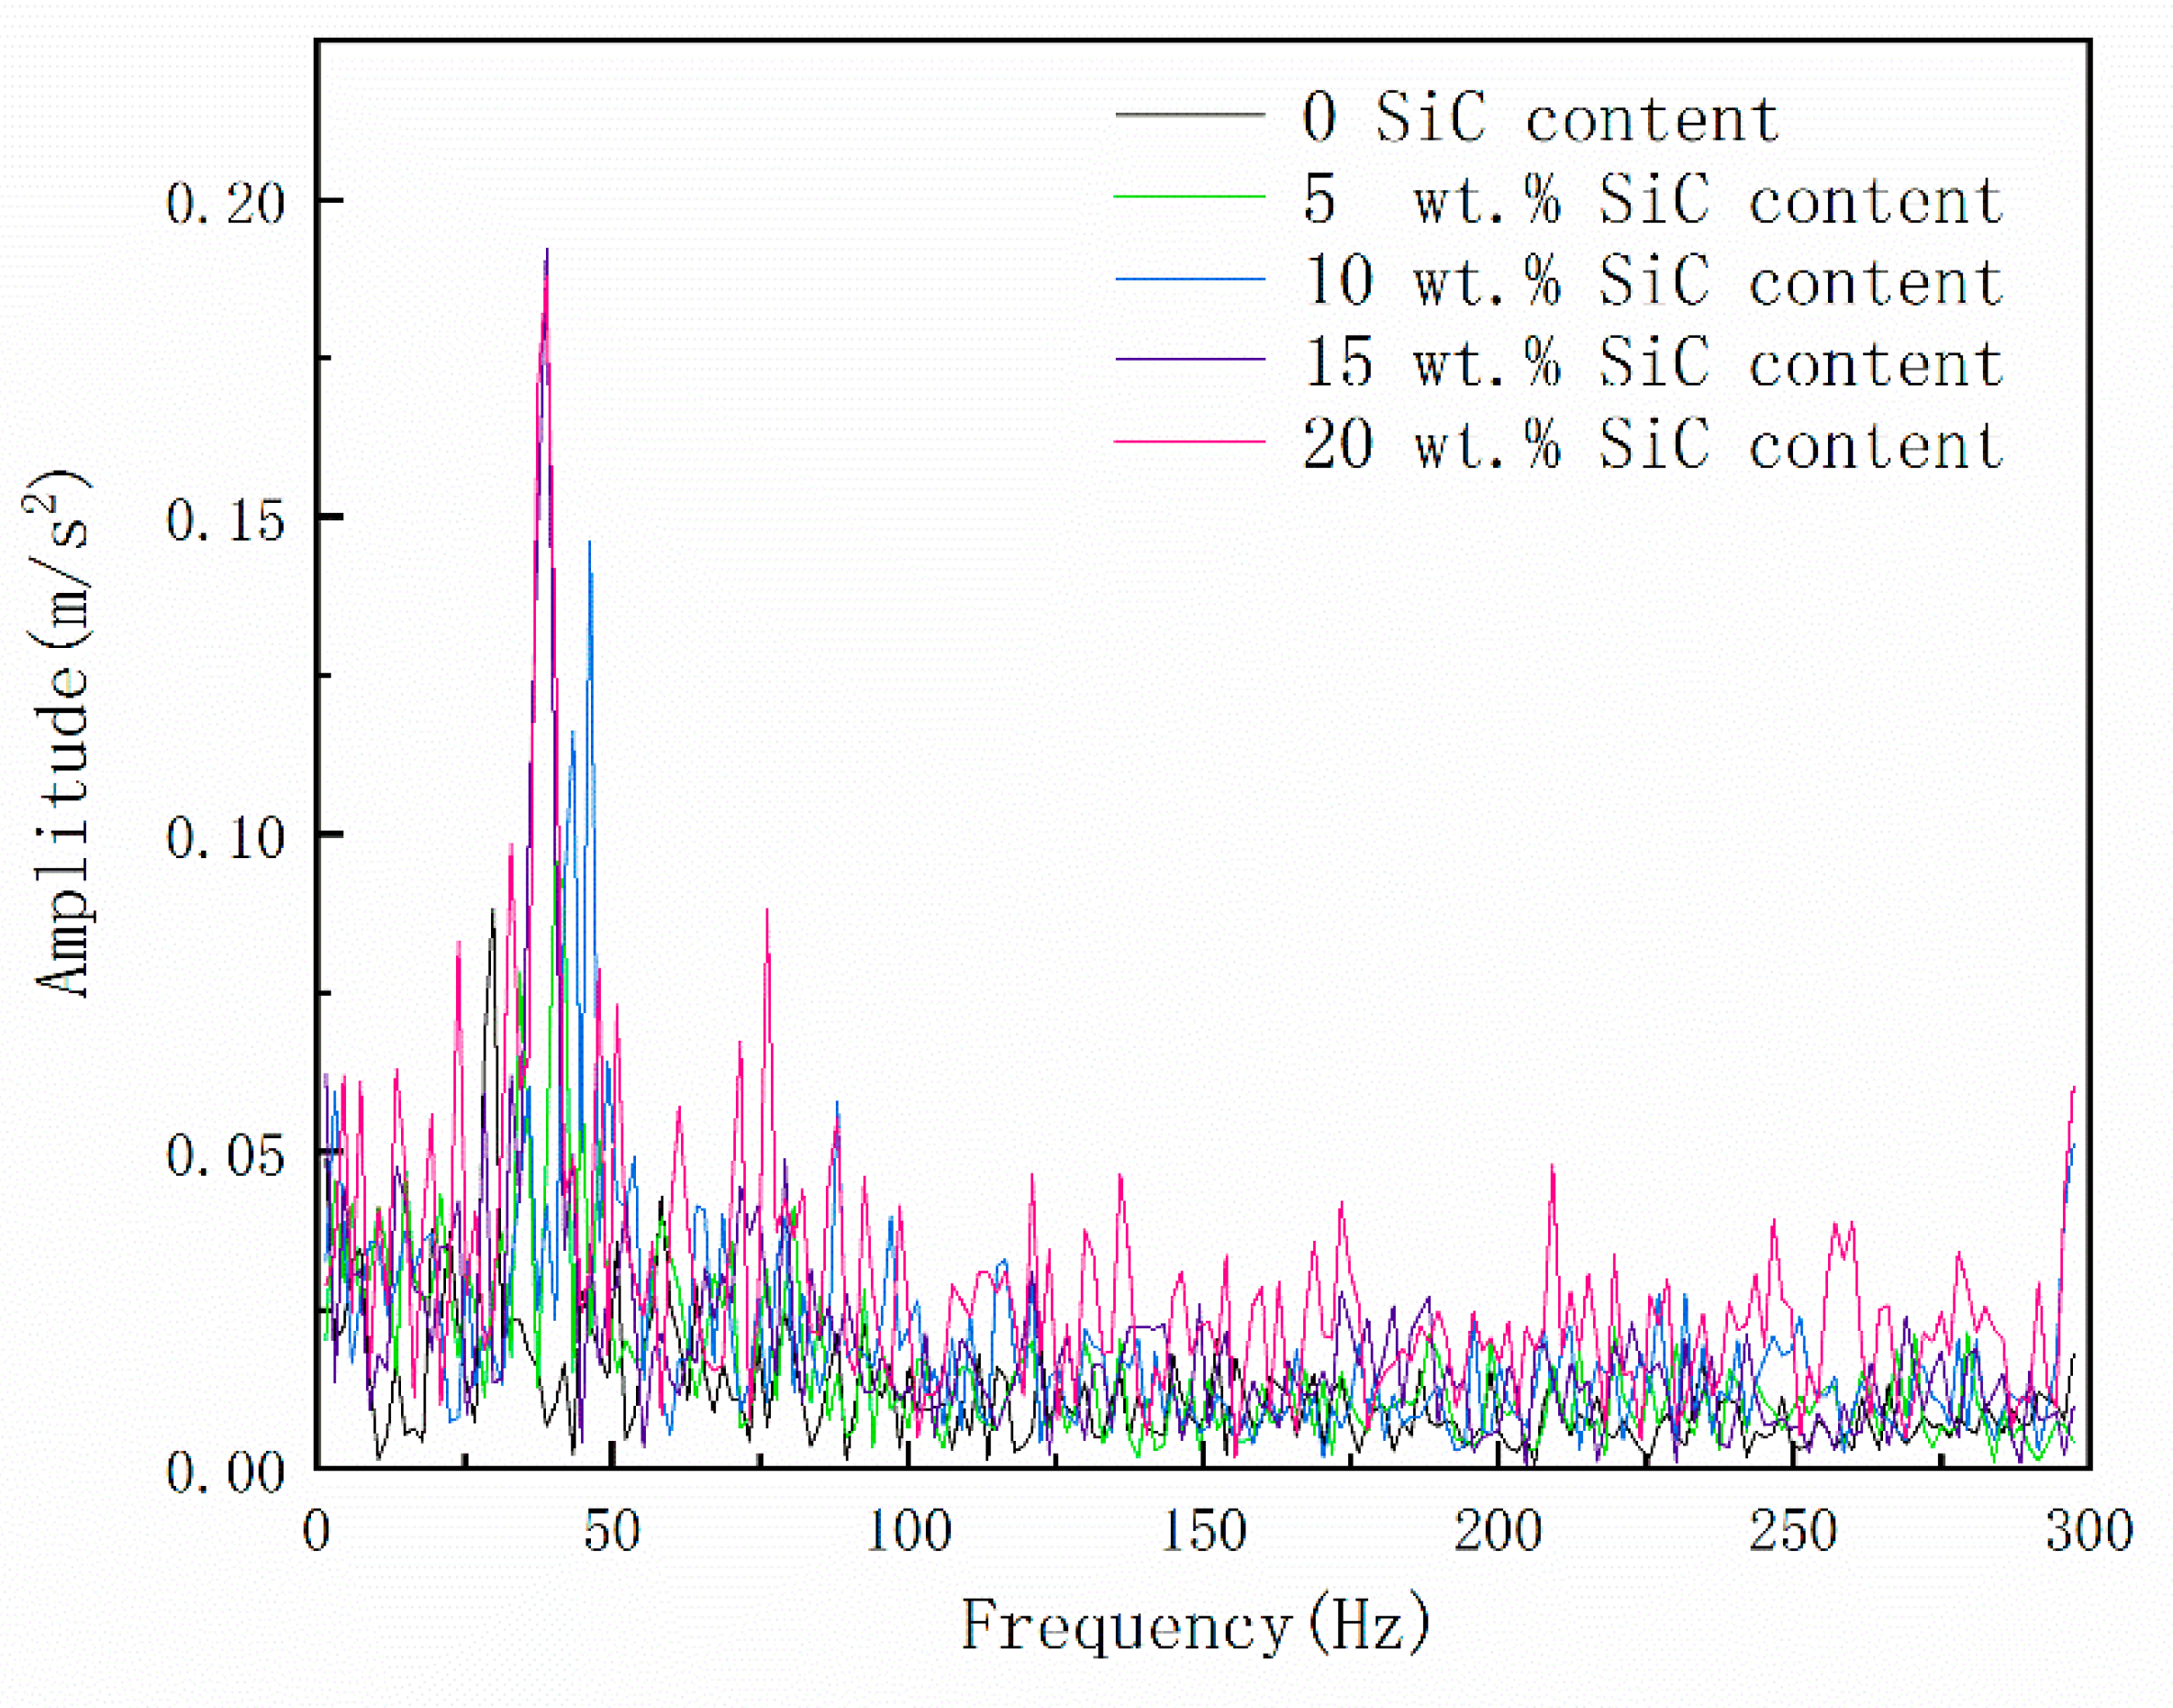
4.2. Envelope Spectrum Analysis of Material Vibration Signal

After the above data were filtered by MED, the signals were decomposed by SSD. To limit the length of the paper, the envelope spectra when at SiC abrasive grain contents of 0, 5 wt.%, 10 wt.%, 15 wt.%, and 20 wt.% were selected. The obtained analysis results are shown in Figure 8. The abscissa in the figure is the vibration frequency of the material, and the ordinate is the vibration amplitude of the material under the action of ultrasonic cavitation. With the increase in the abscissa, the value of the ordinate decreased; the graph after the frequency > 300 Hz was not analyzed.
The peaks of the curves in the envelope spectra indicate that the amplitude of the material at this point reaches the maximum value, and the workpiece was in a resonance state at this point. The abscissa value at the peak point was approximately equal to the natural frequency of the material, and the ordinate was the resonance amplitude value of the workpiece at this frequency. The results of the envelope spectra analysis of the vibration signal of the material in the abrasive suspension with different SiC content (0, 2.5 wt.%, 5 wt.%, 7.5 wt.%, 10 wt.%, 12.5 wt.%, 15 wt.%, 17.5 wt.%, and 20 wt.%) and ultrasonic amplitudes (30%, 35%, 40, 45%, 50%, 55%, 60%, 65%, and 70%) are shown in Table 2 and Table 3.
The data in Table 2 and Table 3 were analyzed and a line graph was drawn, as shown in Figure 9.
Figure 9a shows that with increase in abrasive content, in the ultrasonic cavitation environment, the micro-cutting effect of micro-abrasive and micro-jet on the material was significantly improved. Change in the grain gap of the material was caused by the micro-cutting action of micro-abrasives and micro-jets, which changed the material stiffness and the natural frequency of the material, showing that the natural frequency of the material increased gradually. At SiC content of approximately 10 wt.% in the suspension, the natural frequency of the material reached a maximum of 46.32 Hz. When the content of abrasive in the SiC suspension exceeded 10.wt%, due to the excessive content of abrasive in the suspension, the interaction between the micro-abrasives and the micro-jets and the impact of the collision between the micro-abrasives during the test influenced the cutting effect on the material, which decreased the natural frequency of the material. When the content of SiC exceeded 15.wt%, the cutting effect was affected by the collision between the abrasive grains. The content of SiC abrasive grains in the suspension did not considerably influence the cutting effect, and the natural frequency of the material remained unchanged.
Figure 9b shows that with increase in ultrasonic amplitude, the micro-cutting effect of micro-abrasives and micro-jets improved. Changes in the grain gap in the outer layer of the material caused significant changes in the stiffness of the material, which increased the natural frequency of the material. At ultrasonic amplitude of approximately 50%, the natural frequency of the material reached a maximum of 46.03 Hz. However, the slope of the curve in Figure 9b was larger than that in Figure 9a before the natural frequency of the material reached the maximum value. Thus, it was considered that the changes in the ultrasonic amplitude have a greater effect on the micro-cutting of the material than the effect of the abrasive content in the suspension. The natural frequency of the material is more influenced by the ultrasonic amplitude than the abrasive content in the suspension. The effect of ultrasonic amplitude on the cutting effect of the material was stronger than that of the abrasive content in the suspension. At the ultrasonic amplitude >50%, the natural frequency of the material decreased and gradually plateaued.
Figure 9c shows that at SiC abrasive content = 0, the resonance amplitude value of the material under the action of the micro-jet was larger than that of the suspension with abrasive content < 7.5%. With increase in abrasive content, the resonance amplitude value of the material gradually increased. At abrasive content of approximately 15%, the resonance amplitude of the material reached the maximum value, and then, the resonance amplitude of the material tends to plateau. This was because at low abrasive content, with increase in abrasive content, the micro-abrasive and the micro-jet significantly improved the micro-cutting effect.
Figure 9d shows that with increase in the ultrasonic amplitude, the resonance amplitude of the material also gradually increased, reaching a peak point at ultrasonic amplitude of 60%; thereafter, it showed a gradually decreasing trend. Comparing with Figure 9c, we see that before the material resonance amplitude value reached the peak value, the slope of the curve of Figure 9c was larger than that in Figure 9d, and the material resonance amplitude at the peak point under the influence of abrasive content was higher than that of the material under the influence of ultrasonic amplitude. The effect of abrasive content on the resonance amplitude of the material was greater than the effect of ultrasonic amplitude.

5. Conclusions

To investigate the effects of abrasive content in the SiC abrasive suspension and ultrasonic amplitude on the natural frequency and resonance amplitude of the material in the ultrasonic cavitation environment, 6061 aluminum alloy was selected as the workpiece material. The signal analysis method was used for analysis and research. First, the working principle of the adopted algorithm was introduced, and then, a single-factor control variable experiment was designed and conducted. The main conclusions are as follows:
(1)
The micro-cutting action of the micro-abrasive in the SiC abrasive suspension and micro-jets on the material changed the natural frequency and the resonance amplitude of the material.
(2)
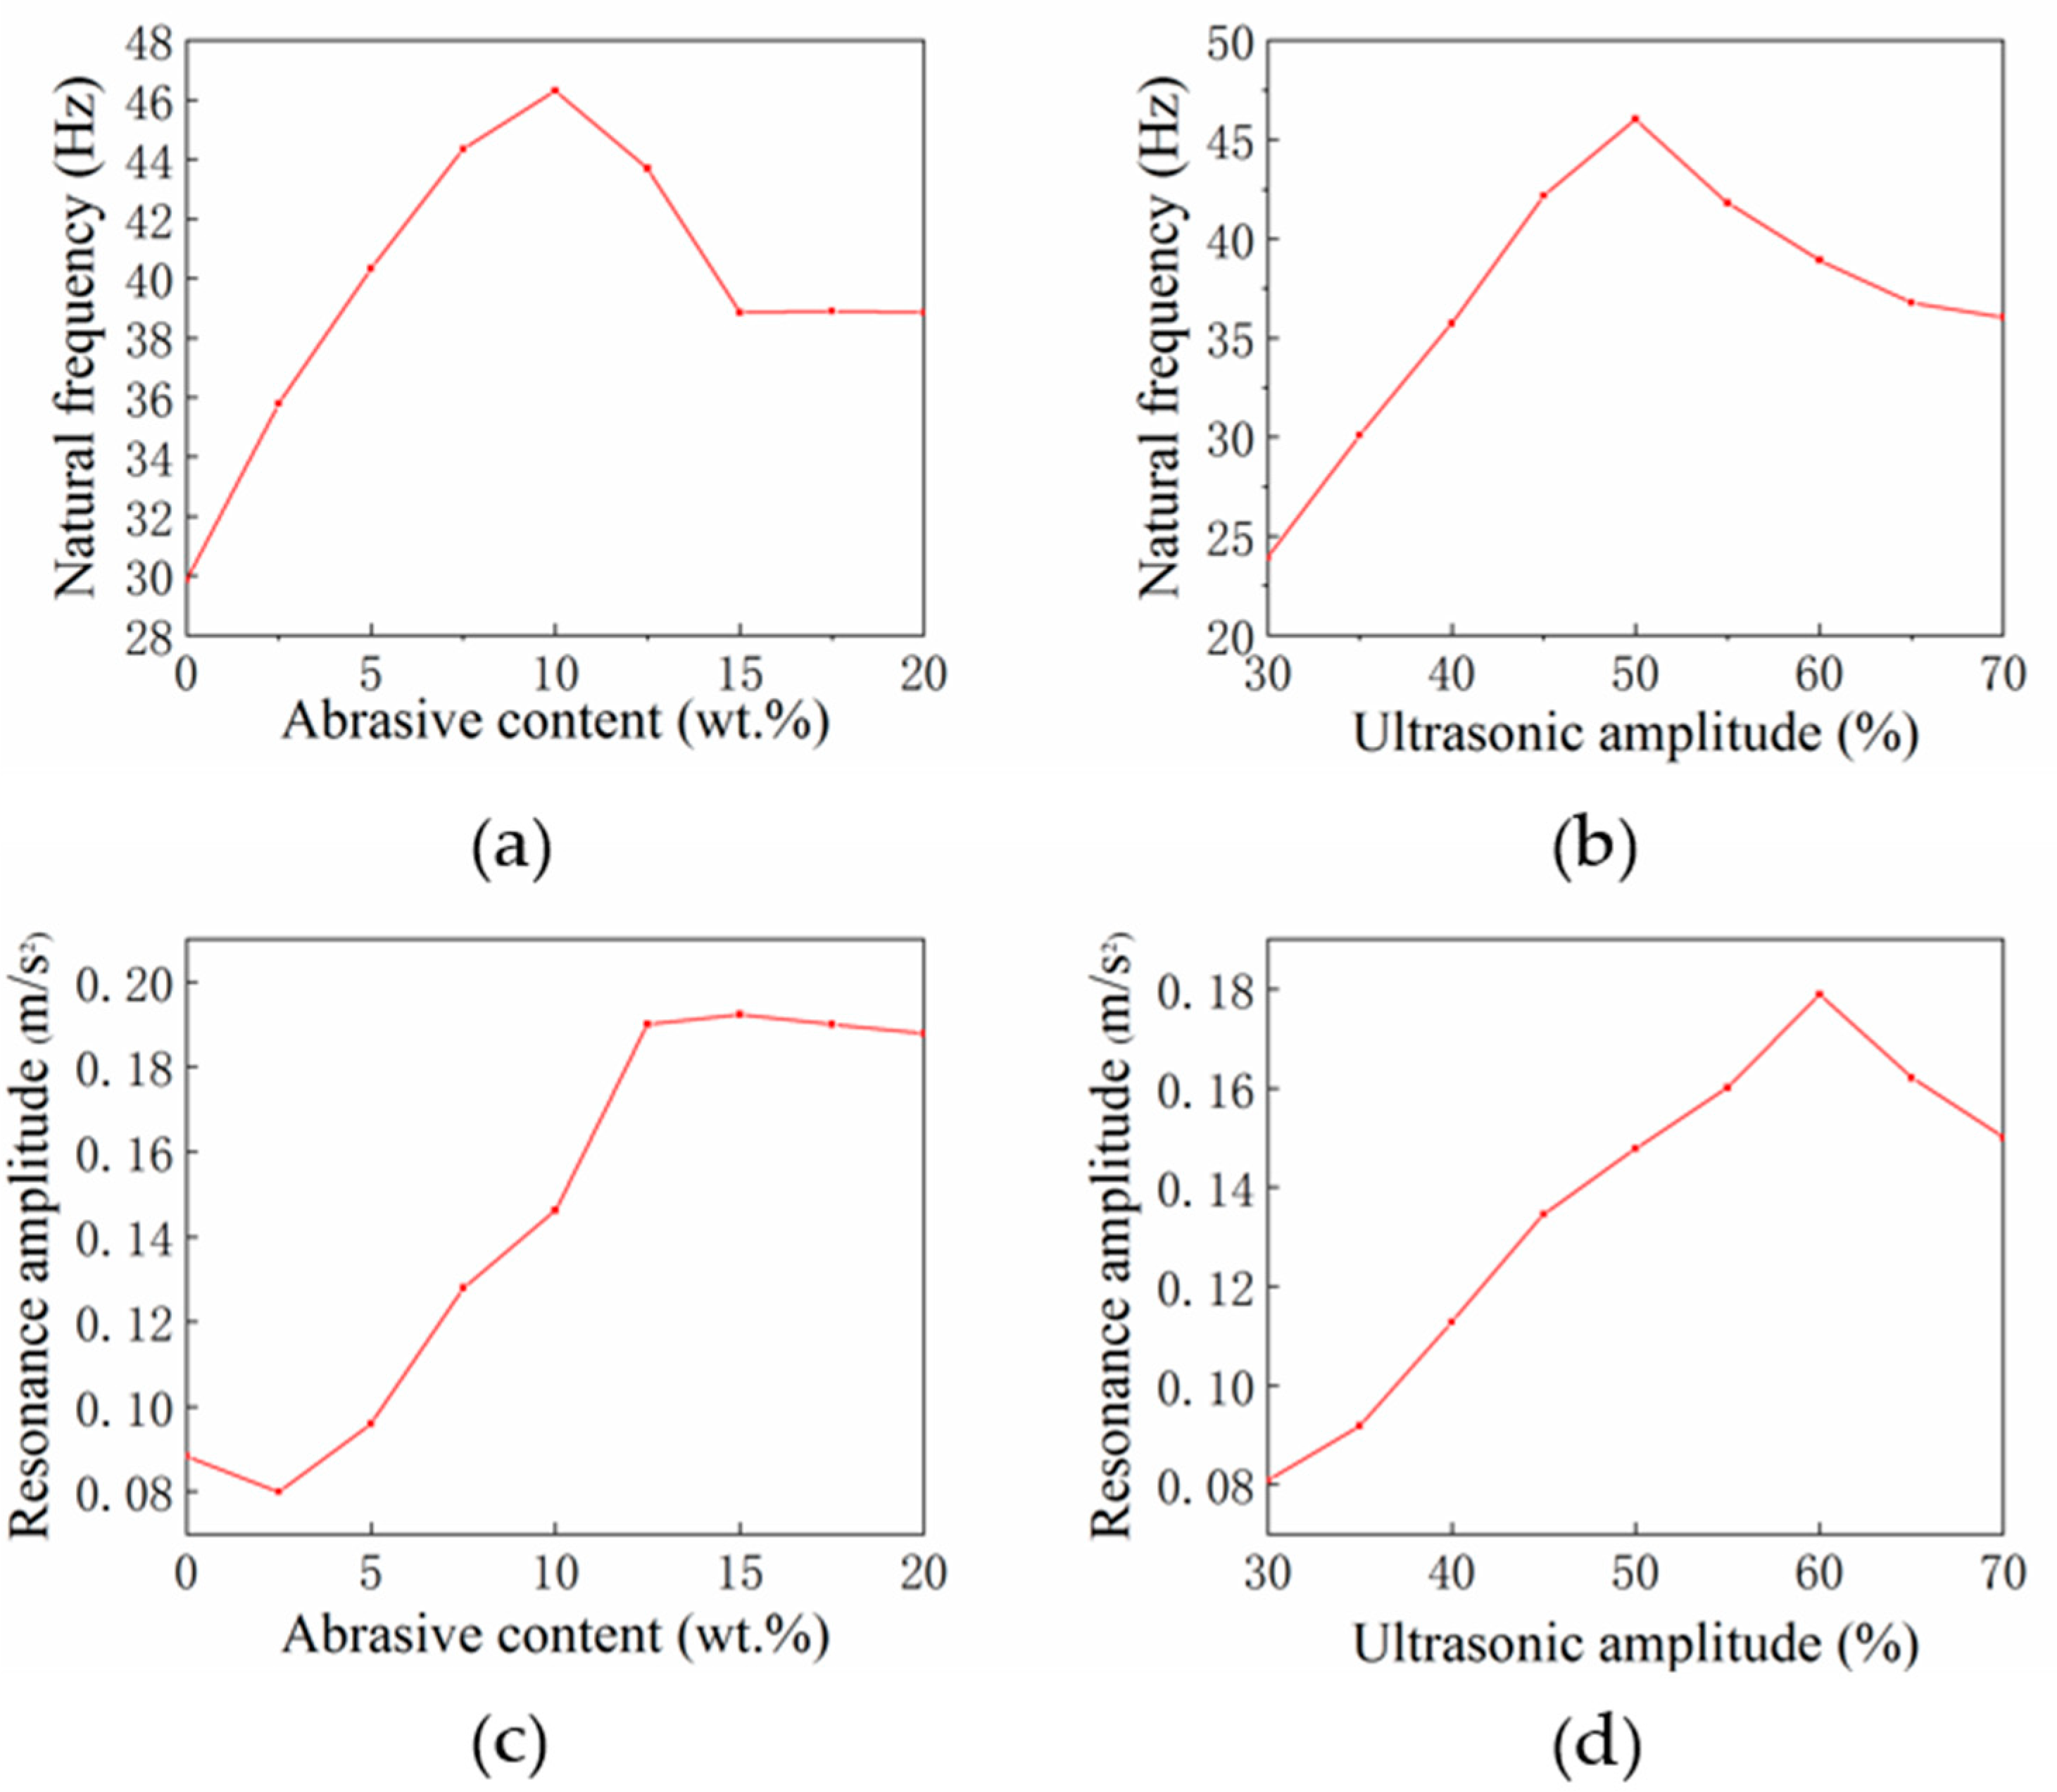
In the abrasive suspension, with increase of SiC abrasive content, the natural frequency of the material first increased, then decreased and remained unchanged. At the abrasive content of approximately 10 wt.%, the natural frequency of the material reached a peak of 46.32 Hz. Similarly, at ultrasonic amplitude of 50%, the natural frequency of the material reached the peak, and then gradually decreased with increase in amplitude.
(3)
In the abrasive suspension, with increase in SiC abrasive content, the resonance amplitude of the material first decreased, then increased and remained unchanged with increase in the abrasive content. At ultrasonic amplitude of 15%, the resonance amplitude value of the material reached a maximum of 0.19 m·s2. At constant abrasive content, with increase in ultrasonic amplitude, the resonance amplitude of the material first increased and then decreased. At ultrasonic amplitude of 60%, the resonance amplitude value of the material reached a maximum of 0.1789 m·s2.
(4)
The effect of ultrasonic amplitude on the natural frequency of the material was stronger than that of the abrasive content on the natural frequency and the effect of abrasive content on the resonance amplitude was stronger than the effect of ultrasonic amplitude on the resonance amplitude.

Author Contributions

Conceptualization, T.S. and L.Y.; methodology, X.Z.; software, J.Z.; validation, T.S., X.Z., and L.Y.; formal analysis, T.S.; investigation, L.Y.; resources, X.Z.; data curation, T.S.; writing—original draft preparation, T.S.; writing—review and editing, T.S.; visualization, X.Z.; supervision, X.Z.; project administration, T.S.; funding acquisition, L.Y. All authors have read and agreed to the published version of the manuscript.

Funding

This research was funded by the National Natural Science Foundation of China (grant no. 51975540, 52005455), Fundamental Research Program of Shanxi Province (grant no. 20210302123013) and the Graduate Science and Technology Project of North University of China (grant no. 20201703).

Institutional Review Board Statement

Not applicable.

Informed Consent Statement

Not applicable.

Data Availability Statement

The data presented in this study are available on request from the corresponding author.

Acknowledgments

North University of China are greatly acknowledged for their financial support in making this research possible.

Conflicts of Interest

The authors declare no conflict of interest.

References

  1. Ye, L.; Zhu, X.; Wang, L.; Guo, C. Study on characteristics of single cavitation bubble considering condensation and evaporation of kerosene steam under ultrasonic vibration honing. Ultrason. Sonochem. 2018, 40, 988–994. [Google Scholar] [CrossRef] [PubMed]
  2. Ye, L.; Zhu, X.; Liu, Y. Numerical study on dual-frequency ultrasonic enhancing cavitation effect based on bubble dynamic evolution. Ultrason. Sonochem. 2019, 59, 104744. [Google Scholar] [CrossRef] [PubMed]
  3. Ye, L.; Zhu, X.; He, Y. Micro-cutting force model of micro-jet induced by cavitation collapse in the ultrasonic field at micro-nano scale. Int. J. Adv. Manuf. Technol. 2022, 119, 3695–3702. [Google Scholar] [CrossRef]
  4. Chahine, G.L.; Kapahi, A.; Choi, J.K.; Hsiao, C.T. Modeling of surface cleaning by cavitation bubble dynamics and collapse. Ultrason. Sonochem. 2016, 29, 528–549. [Google Scholar] [CrossRef] [PubMed]
  5. Toh, C.K. The use of ultrasonic cavitation peening to improve micro-burr-free surfaces. Int. J. Adv. Manuf. Technol. 2006, 31, 688–693. [Google Scholar] [CrossRef]
  6. Coussios, C.C.; Roy, R.A. Applications of Acoustics and Cavitation to Noninvasive Therapy and Drug Delivery. Ann. Rev. Fluid Mech. 2008, 40, 395–420. [Google Scholar] [CrossRef]
  7. Ahmed, D.; Mao, X.; Juluri, B.K.; Huang, T.J. A fast microfluidic mixer based on acoustically driven sidewall-trapped microbubbles. Microfluid. Nanofluid. 2009, 7, 727–731. [Google Scholar] [CrossRef]
  8. Law, S.; Zhou, Y. High-Intensity Focused Ultrasound Ablation by the Dual-Frequency Excitation. IEEE Trans. Ultrason. Ferroelectr. Freq. Control 2019, 66, 18–25. [Google Scholar]
  9. Zhang, L.; Belova, V.; Wang, H.; Dong, W.; Mohwald, H. Controlled Cavitation at Nano/Microparticle Surfaces. Chem. Mater. 2014, 26, 2244–2248. [Google Scholar] [CrossRef]
  10. Beaucamp, A.; Katsuura, T.; Takata, K. Process mechanism in ultrasonic cavitation assisted fluid jet polishing. Cirp Ann. 2018, 67, 361–364. [Google Scholar] [CrossRef]
  11. Bai, F.; Saalbach, K.A.; Wang, L.; Wang, X.; Twiefel, J. Impact of time on ultrasonic cavitation peening via detection of surface plastic deformation. Ultrasonics 2018, 84, 350–355. [Google Scholar] [CrossRef] [PubMed]
  12. Guo, C.; Zhu, X.J.; Wang, J.Q.; Ye, L.Z. Velocity analysis for collapsing cavitation bubble near a rigid wall under an ultrasound field. Acta Phys. Sin. 2016, 65, 184–191. [Google Scholar] [CrossRef]
  13. Hutli, E.; Nedeljkovic, M.; Bonyar, A. Controlled Modification of the Surface Morphology and Roughness of Stainless Steel 316 by a High Speed Submerged Cavitating Water Jet. Appl. Surf. Sci. 2018, 458, 293–304. [Google Scholar] [CrossRef]
  14. Ye, L.; Zhu, X.; He, Y.; Song, T.; Hu, W. Surface strengthening and grain refinement of AZ31B magnesium alloy by ultrasonic cavitation modification. Chin. J. Aeronaut. 2021, 34, 508–517. [Google Scholar] [CrossRef]
  15. Zhang, C.S.; Xue, J.; Wang, C. Study on the Characteristics of Underwater Explosion Bubble Near Perforated Rigidwall. Beijing Ligong Daxue Xuebao/Trans. Beijing Inst. Technol. 2018, 38, 771–778. [Google Scholar]
  16. Haixia, L.; Zhang, T.; Kang, C. Evaluation of cavitation erosion resistance of copper alloy in different liquid media. Mater. Corros. 2018, 69, 917–925. [Google Scholar]
  17. Balamurugan, K.; Uthayakumar, M.; Gowthaman, S.; Pandurangan, R. A study on the compressive residual stress due to waterjet cavitation peening. Eng. Fail. Anal. 2018, 92, 268–277. [Google Scholar] [CrossRef]
  18. Laguna-Camacho, J.R.; Lewis, R.; Vite-Torres, M.; Méndez-Méndez, J. A study of cavitation erosion on engineering materials. Wear 2013, 301, 467–476. [Google Scholar] [CrossRef]
  19. Nagalingam, A.P.; Yeo, S.H. Controlled hydrodynamic cavitation erosion with abrasive particles for internal surface modification of additive manufactured components. Wear 2018, 414–415, 89–100. [Google Scholar] [CrossRef]
  20. Sugasawa, S.; Uematsu, S.; Akiyama, S. Observation of Microstructural Deformation Behavior in Metals Caused by Cavitation Impact. Jpn. J. Appl. Phys. 2011, 50, 07HE03. [Google Scholar] [CrossRef]
  21. Sugasawa, S. Observations of crystal orientation of pure aluminum damaged by cavitation impact. Jpn. J. Appl. Phys. 2019, 58, SGGD12. [Google Scholar] [CrossRef]
  22. Mahesh, S.; Mathew, M.D. Modeling the Effect of Grain Boundary Sliding on Creep Lifetime: Application to Two Austenitic Stainless Steels. Procedia Eng. 2013, 55, 747–750. [Google Scholar] [CrossRef]
  23. Zhang, H.; Ren, X.; Tong, Y.; Larson, E.A.; Adu-Gyamfi, S.; Wang, J.; Li, X. Surface integrity of 2A70 Aluminum Alloy Processed by Laser-induced Peening and Cavitation Bubbles. Results Phys. 2018, 12, 1204–1211. [Google Scholar] [CrossRef]
  24. Chen, J.H.; Wu, W. Cavitation erosion behavior of Inconel 690 alloy. Mater. Sci. Eng. A 2008, 489, 451–456. [Google Scholar] [CrossRef]
  25. Dular, M.; Osterman, A. Pit clustering in cavitation erosion. Wear 2008, 265, 811–820. [Google Scholar] [CrossRef]
  26. Niederhofer, P.; Richrath, L.; Huth, S.; Theisen, W. Influence of conventional and powder-metallurgical manufacturing on the cavitation erosion and corrosion of high interstitial CrMnCN austenitic stainless steels. Wear 2016, 360–361, 67–76. [Google Scholar] [CrossRef]
  27. Meng, Y.; Zhao, Z.; Cui, J. Heat treatment of new high strength Al-Mg-Si alloy. Dongbei Daxue Xuebao/J. Northeast. Univ. 2011, 32, 1248–1251+1290. [Google Scholar]
  28. Prakash, Y.M.S.; Shankar, M.C.G.; Karthik; Sharma, S.S.; Kini, A. Property Enhancement During Artificial Aging of Al6061- Silicon Oxide Metal Matrix Composites. Mater. Today Proc. 2018, 5, 24186–24193. [Google Scholar] [CrossRef]
  29. Marzo, F.F.; Alberro, M.; Manso, A.P.; Garikano, X.; Alegre, C.; Montiel, M.; Lozano, A.; Barreras, F. Evaluation of the corrosion resistance of Ni(P)Cr coatings for bipolar plates by electrochemical impedance spectroscopy. Int. J. Hydrogen Energy 2020, 45, 20632–20646. [Google Scholar] [CrossRef]
  30. Brehl, D.E.; Dow, T.A. Review of vibration-assisted machining. Precis. Eng. 2008, 32, 153–172. [Google Scholar] [CrossRef]
  31. Kumar, M.N.; Subbu, S.K.; Krishna, P.V.; Venugopal, A. Vibration Assisted Conventional and Advanced Machining: A Review. Procedia Eng. 2014, 97, 1577–1586. [Google Scholar] [CrossRef] [Green Version]
  32. Yuan, Z.; Fang, B.; Dong, Y.; Ding, H.; Zhang, Y. Study on surface texture and corrosion resistance of ultrasonic vibration-assisted micromilling Inconel 718. Int. J. Adv. Manuf. Technol. 2022, 121, 601–618. [Google Scholar] [CrossRef]
  33. Bonizzi, P.; Karel, J.; Meste, O.; Peeters, R. Singular Spectrum Decomposition: A New Method for Time Series Decomposition. Adv. Adapt. Data Anal. 2014, 6, 107–109. [Google Scholar] [CrossRef]
  34. Sawalhi, N.; Randall, R.B.; Endo, H. The enhancement of fault detection and diagnosis in rolling element bearings using minimum entropy deconvolution combined with spectral kurtosis. Mech. Syst. Signal Process. 2007, 21, 2616–2633. [Google Scholar] [CrossRef]
  35. Liu, H.; Zhang, Z.; Liu, S.; Shu, J.; Liu, T.; Yan, L.; Zhang, T. Spectral blind deconvolution with differential entropy regularization for infrared spectrum. Infrared Phys. Technol. 2015, 71, 481–491. [Google Scholar] [CrossRef]
Figure 1. Specific process of the SSD method.
Machines 10 00891 g001
Figure 2. Ultrasonic cavitation experiment platform. (a) Abrasive suspensions with different SiC contents; (b) Water without SiC.
Machines 10 00891 g002
Figure 3. Schematic diagram experimental set-up.
Machines 10 00891 g003
Figure 4. The workpiece surfaces in abrasive suspensions with different SiC contents. (a) Abrasive suspension with SiC content of 0; (b) Abrasive suspension with SiC content of 2.5 wt.%; (c) Abrasive suspension with SiC content of 5 wt.%; (d) Abrasive suspension with SiC content of 7.5 wt.%; (e) Abrasive suspension with SiC content of 10 wt.%; (f) Abrasive suspension with SiC content of 12.5 wt.%; (g) Abrasive suspension with SiC content of 15 wt.%; (h) Abrasive suspension with SiC content of 17.5 wt.%; (i) Abrasive suspension with SiC content of 20 wt.%.
Machines 10 00891 g004
Figure 5. The workpiece surfaces at different ultrasonic amplitudes. (a) Ultrasonic amplitude of 30%; (b) Ultrasonic amplitude of 35%; (c) Ultrasonic amplitude of 40%; (d) Ultrasonic amplitude of 45%; (e) Ultrasonic amplitude of 50%; (f) Ultrasonic amplitude of 55%; (g) Ultrasonic amplitude of 60%; (h) Ultrasonic amplitude of 65%; (i) Ultrasonic amplitude of 70%.
Machines 10 00891 g005
Figure 6. Material vibration signal waveform with changing abrasive content. (a) Abrasive suspension with SiC content of 0; (b) Abrasive suspension with SiC content of 2.5 wt.%; (c) Abrasive suspension with SiC content of 5 wt.%; (d) Abrasive suspension with SiC content of 7.5 wt.%; (e) Abrasive suspension with SiC content of 10 wt.%; (f) Abrasive suspension with SiC content of 12.5 wt.%; (g) Abrasive suspension with SiC content of 15 wt.%; (h) Abrasive suspension with SiC content of 17.5 wt.%; (i) Abrasive suspension with SiC content of 20 wt.%.
Machines 10 00891 g006
Figure 7. Material vibration signal waveform with changing ultrasonic amplitude. (a) Ultrasonic amplitude of 30%; (b) Ultrasonic amplitude of 35%; (c) Ultrasonic amplitude of 40%; (d) Ultrasonic amplitude of 45%; (e) Ultrasonic amplitude of 50%; (f) Ultrasonic amplitude of 55%; (g) Ultrasonic amplitude of 60%; (h) Ultrasonic amplitude of 65%; (i) Ultrasonic amplitude of 70%.
Machines 10 00891 g007
Figure 8. Envelope spectra of material vibration signals.
Machines 10 00891 g008
Figure 9. Graph of data in Table 2 and Table 3. (a) Relationship between abrasive content and material natural frequency in SiC suspension; (b) Relationship between ultrasonic amplitude and natural frequency of material; (c) Relationship between abrasive content in SiC suspension and resonance amplitude of the material; (d) Relationship between ultrasonic amplitude and material resonance amplitude.
Machines 10 00891 g009
Table 1. Mechanical properties of 6061 aluminum alloy.
MaterialElastic Modulus/GPaPoisson’s RatioYield Strength/MPaHardness/HV
6061700.326569
Table 2. Experiment table at 50% ultrasonic amplitude.
NumberAbrasive Content/wt.%Natural Frequency/HzResonance Amplitude/m·s−2
1029.880.0884
22.535.800.08
3540.340.096
47.544.350.128
51046.320.1462
612.543.700. 19
71538.850.1923
817.538.900.19
92038.850.1878
Table 3. Experiment table with abrasive content of 10 wt.%.
NumberUltrasonic Amplitude/%Natural Frequency/HzResonance Amplitude/m·s−2
13023.890.0759
23530.100.0918
34035.720.1128
44542.170.1346
55046.030.1478
65541.800.1601
76038.920.1789
86536.780.1621
97036.050.15
Table 4. Natural frequencies remeasured of workpieces in Table 2.
NumberNatural Frequency/Hz
129.83
235.80
340.29
444.33
546.32
643.65
738.85
838.87
938.84
Table 5. Natural frequencies remeasured of workpieces in Table 3.
NumberNatural Frequency/Hz
123.85
230.10
335.72
442.10
546.05
641.77
738.90
836.75
936.01
Publisher’s Note: MDPI stays neutral with regard to jurisdictional claims in published maps and institutional affiliations.

