Article

Evaluation of a Hydrogen Powered Scooter Toy Prototype

by
Santiago Salazar
1,
Dionisio Malagón
1,
Edwin Forero-García
2,*,
María Josefina Torres
3 and
Marco Antonio Velasco Peña
4
1
Faculty of Mechanical Engineering, Universidad Santo Tomas, Bogota 110231, Colombia
2
Faculty of Electronic Engineering, Universidad Santo Tomas, Bogota 110231, Colombia
3
Escuela de Ingeniería Mecánica, Pontificia Universidad Católica de Valparaíso, Av. Los Carrera, Valparaiso 01567, Chile
4
Faculty of Technology, Universidad Distrital Francisco José de Caldas, Bogota 111931, Colombia
*
Author to whom correspondence should be addressed.
Machines 2022, 10(12), 1134; https://doi.org/10.3390/machines10121134
Submission received: 24 August 2022 / Revised: 18 November 2022 / Accepted: 20 November 2022 / Published: 29 November 2022
(This article belongs to the Section Vehicle Engineering)

Abstract

:
Electric scooters are used as alternative ways of transport because they easily make travel faster. However, the batteries can take around 5 h to charge and have an autonomy of 30 km. With the presence of the hydrogen cell, a hybrid system reduces the charging times and increases the autonomy of the vehicle by using two types of fuel. An increase of up to 80% in maximum distance and of 34% in operating times is obtained with a 1:10 scale prototype with the hydrogen cell; although more energy is withdrawn, the combined fuel efficiency increases, too. This suggests the cell that is used has the same behavior as some official reported vehicles, which have a long range but low power. This allows concluding that use of the cell is functional for load tests and that the comparison factor obtained works as input for real-scale scooter prototypes to compete with the traditional electric scooters.

1. Introduction

Since 2017 it has been seen that the highest air contamination rates as a consequence of traffic congestion are found in the developing countries. (They contribute an approximate 70–80%) [1]. The World Bank and the UN have warned that the contamination levels could increase up to 50% [2]. In 2019, a study was made in more than 400 cities around the world, finding that the highest traffic congestion levels were found in Bengalaru (India), Manila (Philippines) and Bogotá (Colombia), where the traffic congestion levels were up to 60% [3]. In that sense, the World Bank has invested around USD 5.7 trillion in countries with heavy problems of mobility [4]. An alternative to solving these two problems is the development of electric vehicles.
Car manufacturers developed new architectures to build electric vehicles like hybrid (HEV), plug-in hybrid (PHEV) or battery electric vehicles (BEV) [5]. These types of electric vehicles help with the reduction of pollution, but the levels of traffic congestion should not be reduced. Other means of transport, like bicycles and scooters, have played a significant role in urban planning. They have gained popularity by their lightweight, low energy consumption, slow speed and the smaller space they occupy compared to cars. It is expected that these means of transport reduce the levels of traffic congestion [6]. Personal mobility using bicycles, scooters and even walking has taken an important role in urban planning [7]. The incursion of electric bicycles and electric scooters has gained huge popularity due to their light weight, power, slow speed (compared to cars) and the smaller space they occupy [8].
Nevertheless, they have a disadvantage in their charging times, as they can take up to 12 h charging for a 100 km route [9]. Nowadays, electric scooters are produced by different manufacturers. Among the features that make them different are the components of the battery and hence the power the battery can give [10]. The most popular electric scooters are the ones with lithium ion batteries (Li–ion), which can give between 2.2 and 4.7 V [11]. Other alternatives are batteries made of nickel-cadmium (NiCd) or nickel-metal hydride (NiMH), which can give 1.2 and 1.3 V, respectively [12]. Recently, a new alternative to the batteries is power generation by hydrogen cells [13].
The hydrogen cells are conformed by three parts: an anode, a cathode and an electrolytic membrane [14]. The function of these cells is like the batteries: The hydrogen flows to the anode, where a film takes out the electrons from the atom. The electrons are forced to exit through an external circuit in the form of electric current, while the ionized hydrogen goes forward to the cathode where it meets with the oxygen from the air to form water molecules. The electric charge is stored by a battery or it can be sent directly to the electric engine to move the vehicle. Figure 1 shows a comparison between the two architectures of these two technologies.
Currently, there is a mistrust of this fuel because it stores 2.6 times more energy quantity than gasoline, which means that, if it is not well stored or manipulated safely, it can cause the deadliest explosions [15]. However, brands like Toyota, Hyundai or Mercedes-Benz, with the support of local governments (Japan, South Korea and Germany) are building a reliable infrastructure for the use of hydrogen in vehicles [16]. This technology has even landed with other types of vehicles such as airplanes or trains [17,18]. Apart from these vehicles, the combustion cells have been proved in golf carts, providing from 10 kW to 12 kW of peak power using a hybrid configuration. Instead of using an internal combustion engine, however, a hydrogen cell is used [19]. These cells have shown their effectiveness by substantially reducing the charging times, making them similar to those needed to refuel diesel in trucks [20]. As with batteries, the generated power depends on the size of the cell [21].
Hydrogen cells have more specific energy quantity per kg than lithium-ion batteries (±400 Wh/kg for hydrogen tanks at 35 MPa and ±350 Wh/kg for hydrogen tanks at 70 MPa compared with ±150 Wh/kg for lithium-ion batteries) [22]. However, hydrogen systems have low efficiency to generate the electric current. For this reason, the hydrogen cells must be used in a hybrid configuration with batteries to take advantage of their energy potential [23].
Therefore, the aim of this paper it is to compare the functionality of a 1:10 scale scooter toy prototype with a hydrogen cell and the functionality of the same vehicle with the use of a lithium battery. This prototype can work as an input for ride-on vehicles for kids since the speeds cannot be too high.

2. Materials and Methods

2.1. Vehicle Design

The vehicle design is performed in three stages: design of chassis and steering; design of the power transmission system; and design of the electronic control system. The initial conditions of the design are given by the characteristics of the hydrogen cell H-Cell 2.0 (Horizon, Warren, NJ, USA) that was chosen for its compact size (80 mm wide, 47 mm long and 75 mm high). The technical characteristics are listed in Table 1.
The cell requires two cartridges, which store the hydrogen in gas form, and a trough and valve regulate the flow, depending on the demand of the cell. Once the electrolytic process in the interior is complete, the electric current is sent to a condenser where it is stored to be delivered by the control system of the cell, as necessary. Finally, through a nozzle of air intake, it takes in the air to be mixed with the oxygen and the ionized hydrogen in the cell, and it is released through an escape valve in the form of water vapor.

2.1.1. Design of the Chassis and Steering

The chassis and the steering column were designed to be made by fused deposition modeling additive manufacturing. HIPS filament (High-Impact polystyrene; e-Sun brand) was used. Polymer selection is important because the hydrogen cell could reach a temperature of up to 55 °C while its working, and the chassis will not deform by temperature.
A TD–8120MG servomotor (21.8 kg-cm at 6.6 V) was chosen for vehicle steering. This is coupled directly to the fork of the vehicle, and its turn control is mediated by a HC–06 Bluetooth control unit (Arduino UNO, Ivrea, Italy). A sectional view of the vehicle and its components is shown in Figure 2.

2.1.2. Design of the Power Transmission System

To size the motor, the wheels of the vehicle need to be chosen since they affect the dynamic directly. This design uses 84-mm diameter skating wheels, so they use bearings with the category ABEC 11 that guarantee a higher efficiency.
The designed scooter has a total mass (m) of 5 kg and corresponds to the condition where it requires the maximum power of the motor. For the minimum condition (minimum power required), it is removed the hydrogen cell resulting on a mass of 4.4 kg.
Finally, the required force to move the vehicle is estimated to sizing the motor. By sum of forces, the next equation (Equation (1)) is obtained.
F = m[a + g(μ × cos(15°) + sin(15°))]
where:
a = 2.78 m/s2, obtained by the average accelerations of electric scooters in the market;
g = 9.81 m/s2, gravity acceleration;
μ = 0.02, corresponds to the friction coefficient between the material of the wheels and a good condition road.
Once the force is found, it is obtained that the torque on the wheels to move the vehicle is 1.2 N-m. This is the result of solving the next equation (Equation (2)):
τ = (F × D)/2
where:
  • F is the force needed to move the vehicle in N.
  • D is the diameter of the wheels in m (0.084 m).
The gearbox used corresponds to a bevel gear set that drives the power from the motor to the differential and this last to the wheels. A set of gears is chosen for RC vehicles (Tamiya, Shizuoka, Japan) by its availability in the market and its special application to RC vehicles of high torque. Figure 3 shows the gear system and its characteristics.
The analysis of the torque along the gear train to obtain the required power was done, and it results in a 200 W power. For this purpose, a motor for Crawler RC vehicles (16T-1450 kV), which delivers 1.3 N-m and requires a battery with 3 cells and 7.4 V, is chosen.

2.1.3. Design of the Control System

The Horizon hydrogen cell used is already designed to be implemented in RC vehicles because its work voltage and its functioning are supported in the battery in a serial system.
The battery feeds the Arduino board to send the voltage in a regulated form (from 7.4 V in the battery to 6 V for the cell, the servomotor and the Bluetooth HC-06 controller). This voltage is fed to the control unit of the cell and sends the generated current by the cell to the motor. Additionally, it is possible to store the current for delivery as needed or to allow the direct flow of current from the battery in case the hydrogen cartridges are empty (Figure 4).
For cell operation, the cartridges are refueled using the charger produced by the same manufacturer as the cells (Hydrofill Pro). Figure 5 shows the vehicle with its electronic components exposed.

2.2. Test Procedure

The working tests of the vehicle are done over a straight surface where the vehicle moves constantly. The test includes two drive configurations: (A) a drive mode of the scooter using only the battery and (B) a drive mode using the serial system of hydrogen cell and battery. The test for the drive mode only with battery (A) was done until the discharge of the battery. On the other hand, in the hybrid mode (B), the cell is disconnected when the cartridges are empty. (This action is performed automatically by the control unit of the cell.) The speed is measured per lap, and the distance traveled each lap is from a circular circuit with 1780 mm of diameter. The minimum speed to defeat the inertia is 0.0756 m/s for the load of 5 kg, and the maximum speed obtained is 0.0989 m/s. This speed is determined by the time used to complete each lap.
After the test, the total dynamic force of the vehicle was calculated; it corresponds to the traction force and drag resistance force. As in this case there was no slope present, this force was equal to 0, and it was assumed that the speed has extremely low variations; therefore, acceleration force can be omitted. In this way, the force is calculated using Equation (3) [25]:
FTOTAL = FL + FR = (0.5 × ρair × CW × A × V2) + (CR × g × m)
where:
  • FL is the drag resistance force.
  • FR is the traction force.
  • ρair is equal to 0.8878 kg/m3 and corresponds to the density of the air at an altitude of 2640 m (considering that tests were performed in Bogotá, Colombia).
  • CW is the drag coefficient for electric scooters. This factor is equal to 0.7 according to literature.
  • A is the transversal section area in m2. It is equal to 0.0105 m2.
  • V is the speed of the vehicle in m/s.
  • CR is the Rolling resistance coefficient. This value depends on the speed and is calculated using Equation (4) [25]:
CR = 0.009 + 0.002 × ((V × 3.6)/100) + 0.0003 × ((V × 3.6)/100)4
  • g corresponds to the gravity acceleration.
  • m corresponds to the weight of the vehicle.
The power was calculated by Equation (5):
P = η × U/t
where:
  • P is Power.
  • η is the efficiency due to the motor and the gearbox.
  • t is time up to discharge.

2.3. Experimental Design

The experimental design is shown in Table 2; eight tests were done, where two levels of speed and weight for each drive mode were evaluated. For each test, the time per lap was taken with a chronometer (±0.01 s), and the number of laps in a cornering radius of 89 mm was recorded. (This radius was measured with the purpose of keeping them constant for each test.)

2.4. Non-Dimensional Comparison Factor

This factor is useful because the variables of maximum distance and withdrawn energy are two variables that depend on the speed and the weight of the vehicle. Thus, this allows comparisons based in a non-dimensional factor to be done [25,26]. The Environmental Protection Agency (EPA) has determined that the factor which relates the range, the specific withdrawn energy and the specific capacity of the battery is Equation (6):
R × E/SE
where:
  • R is the maximum distance reached in the test in km.
  • E is the specific withdrawn energy (Rolling resistance energy + Drag resistance energy + Inertia force energy) on each test in Wh/km × kg.
  • SE is the specific energy of the battery and is obtained by the values of voltage and amperes of the battery (30.34 Wh). For the case with the hydrogen cell, the power value of the cell (60.34 Wh) is added. This variable is in Wh/kg.

3. Results

Table 3 shows the results for each drive mode test. In tests 1, 3, 5 and 77, an increment can be seen in the average speed, while for 2, 4, 6 and 8 tests the tendency is to decrease. This behavior is related to vehicle weight, which for tests 1, 3, 5 and 7, was the minimum, while tests 4, 6 and 8 were the maximum weight due to the presence of the hydrogen cell and its fuel. The obtained average speed is just about 10% lower than the RC vehicle toys on the market can achieve [27]; however, in the design stage, speed was established not to be an important parameter for the vehicle since it is looked to overcome the inertia of the vehicle itself because the goal is to study the behavior of the hybrid system with a maximum load capacity and not to make the vehicle toy faster.
However, these speeds can lead to problems on the drag coefficient and the roll resistance due to the scale. This is because most of these values are so low that they do not have a significant impact on this scale, but they still needed to obtain a good approximation for energy consumption in Equations (3) and (4) [25].
On the other hand, the maximum reached distance always had an increment, with the presence of the hydrogen cell reaching increments from 2% to 80%. This is close with earlier studies, whereby optimizing the withdrawn energy of the vehicle, it could be possible to reach increments in the distance from 20% to 50% [28]. This behavior is due to the hybrid system of the vehicle, which first uses the hydrogen charge to generate the power and, once the reserve is over, it allows the power of the battery to be delivered. Tests 5, 6, 7, and 8 were used for the hydrogen cell, and in Table 3, the traveled distance is reported. On these tests, the energy to travel the total distance was supplied by the battery and by the hydrogen cell. It can be seen that 44% to 69% of the traveled distance was achieved by just operating the hydrogen cell. The literature shows that presence of a hydrogen cell increments the distance about 36%, which is lower than results obtained in these tests [19].
At the same time, an increment in the distance is reflected in an increment in the total operating time of the vehicle between 8% and 34%. These results are expected, well since having higher traveled distances; the operating time must be higher as well. Additionally, it is obtained that the tests where hydrogen cell is not present are the same where the average speed increases. This corresponds again to that, during these tests, the weight was the minimum; it then needs less energy. However, the withdrawn energy increases with the hydrogen cell. These increments are given by the higher weight of the vehicle which generates a bigger inertia force over the vehicle. This increment results in a higher comparison factor than the battery vehicles, as can be seen in Table 3. This does not affect the maximum distance nor the operating time, which is a factor more important to its functionality.
As it was expected, for tests 6 and 8, the hydrogen consumption was higher in comparison to 5 and 7 because this consumption leads to: the given speed and the low weight of the vehicle requiring less power to keep moving, which results in less hydrogen consumption to generate power. Compared with other types of power plants for vehicles, hydrogen cells are the ones with lead fuel consumption [29].
Finally, the fuel efficiency of the vehicle for the different tests was studied. It is obtained that the presence of the hydrogen cell generates more efficiency compared to the vehicle using just battery. The increment in efficiency is between 29% and 171%. This is due to the control system of the cell optimizing the fuel to be consumed based on the energetic requirement to move the vehicle while running the cell. The control system of the cell optimizes the input energy, which comes from the battery, as well as the energy produced by the cell, making that the current is given considering the requirement of the vehicle. This behavior is like the one reported in the literature, where hydrogen cells generate an efficiency between 20% and 50% over battery vehicles [29].
One of the problems when implementing this method is that all the values will present an approximation of what is happening with the vehicle. The main reason is this technology still being expensive, and budget starts to play a significant role while developing the prototype. Thus, it was needed to find mathematical expressions that could present a correct approximation without having specialized equipment to check with more detail the energy management in the cell and the battery. To do this, two stages in the experiments are considered. The first is performed by an experimental test where the speed, time and distance were obtained, and the second one is based on the mathematical model implemented from the vehicle dynamics where the energy and efficiency were obtained. The experimental stage is performed two times and, therefore, the mathematical method was also analyzed for the second experiment. The results were compared to find the deviation between experiments.
The values of the comparison factor for each test are presented in Figure 6, and they are compared accordingly to the drive mode A (Battery only) and B (Battery and hydrogen cell).
As it was previously mentioned, this comparison factor considers the specific withdrawn energy, the capacity of the battery and the maximum distance to obtain a non-dimensional factor, thus the obtained values for tests 3 and 4 are between 11% and 23% higher in comparison to the tests 1 and 2. This suggests an increment in the energy consumed by the vehicle in the two last tests linked to the increment in speed. At higher speeds, the vehicle will require more power, and this will cause a faster discharge in the battery.
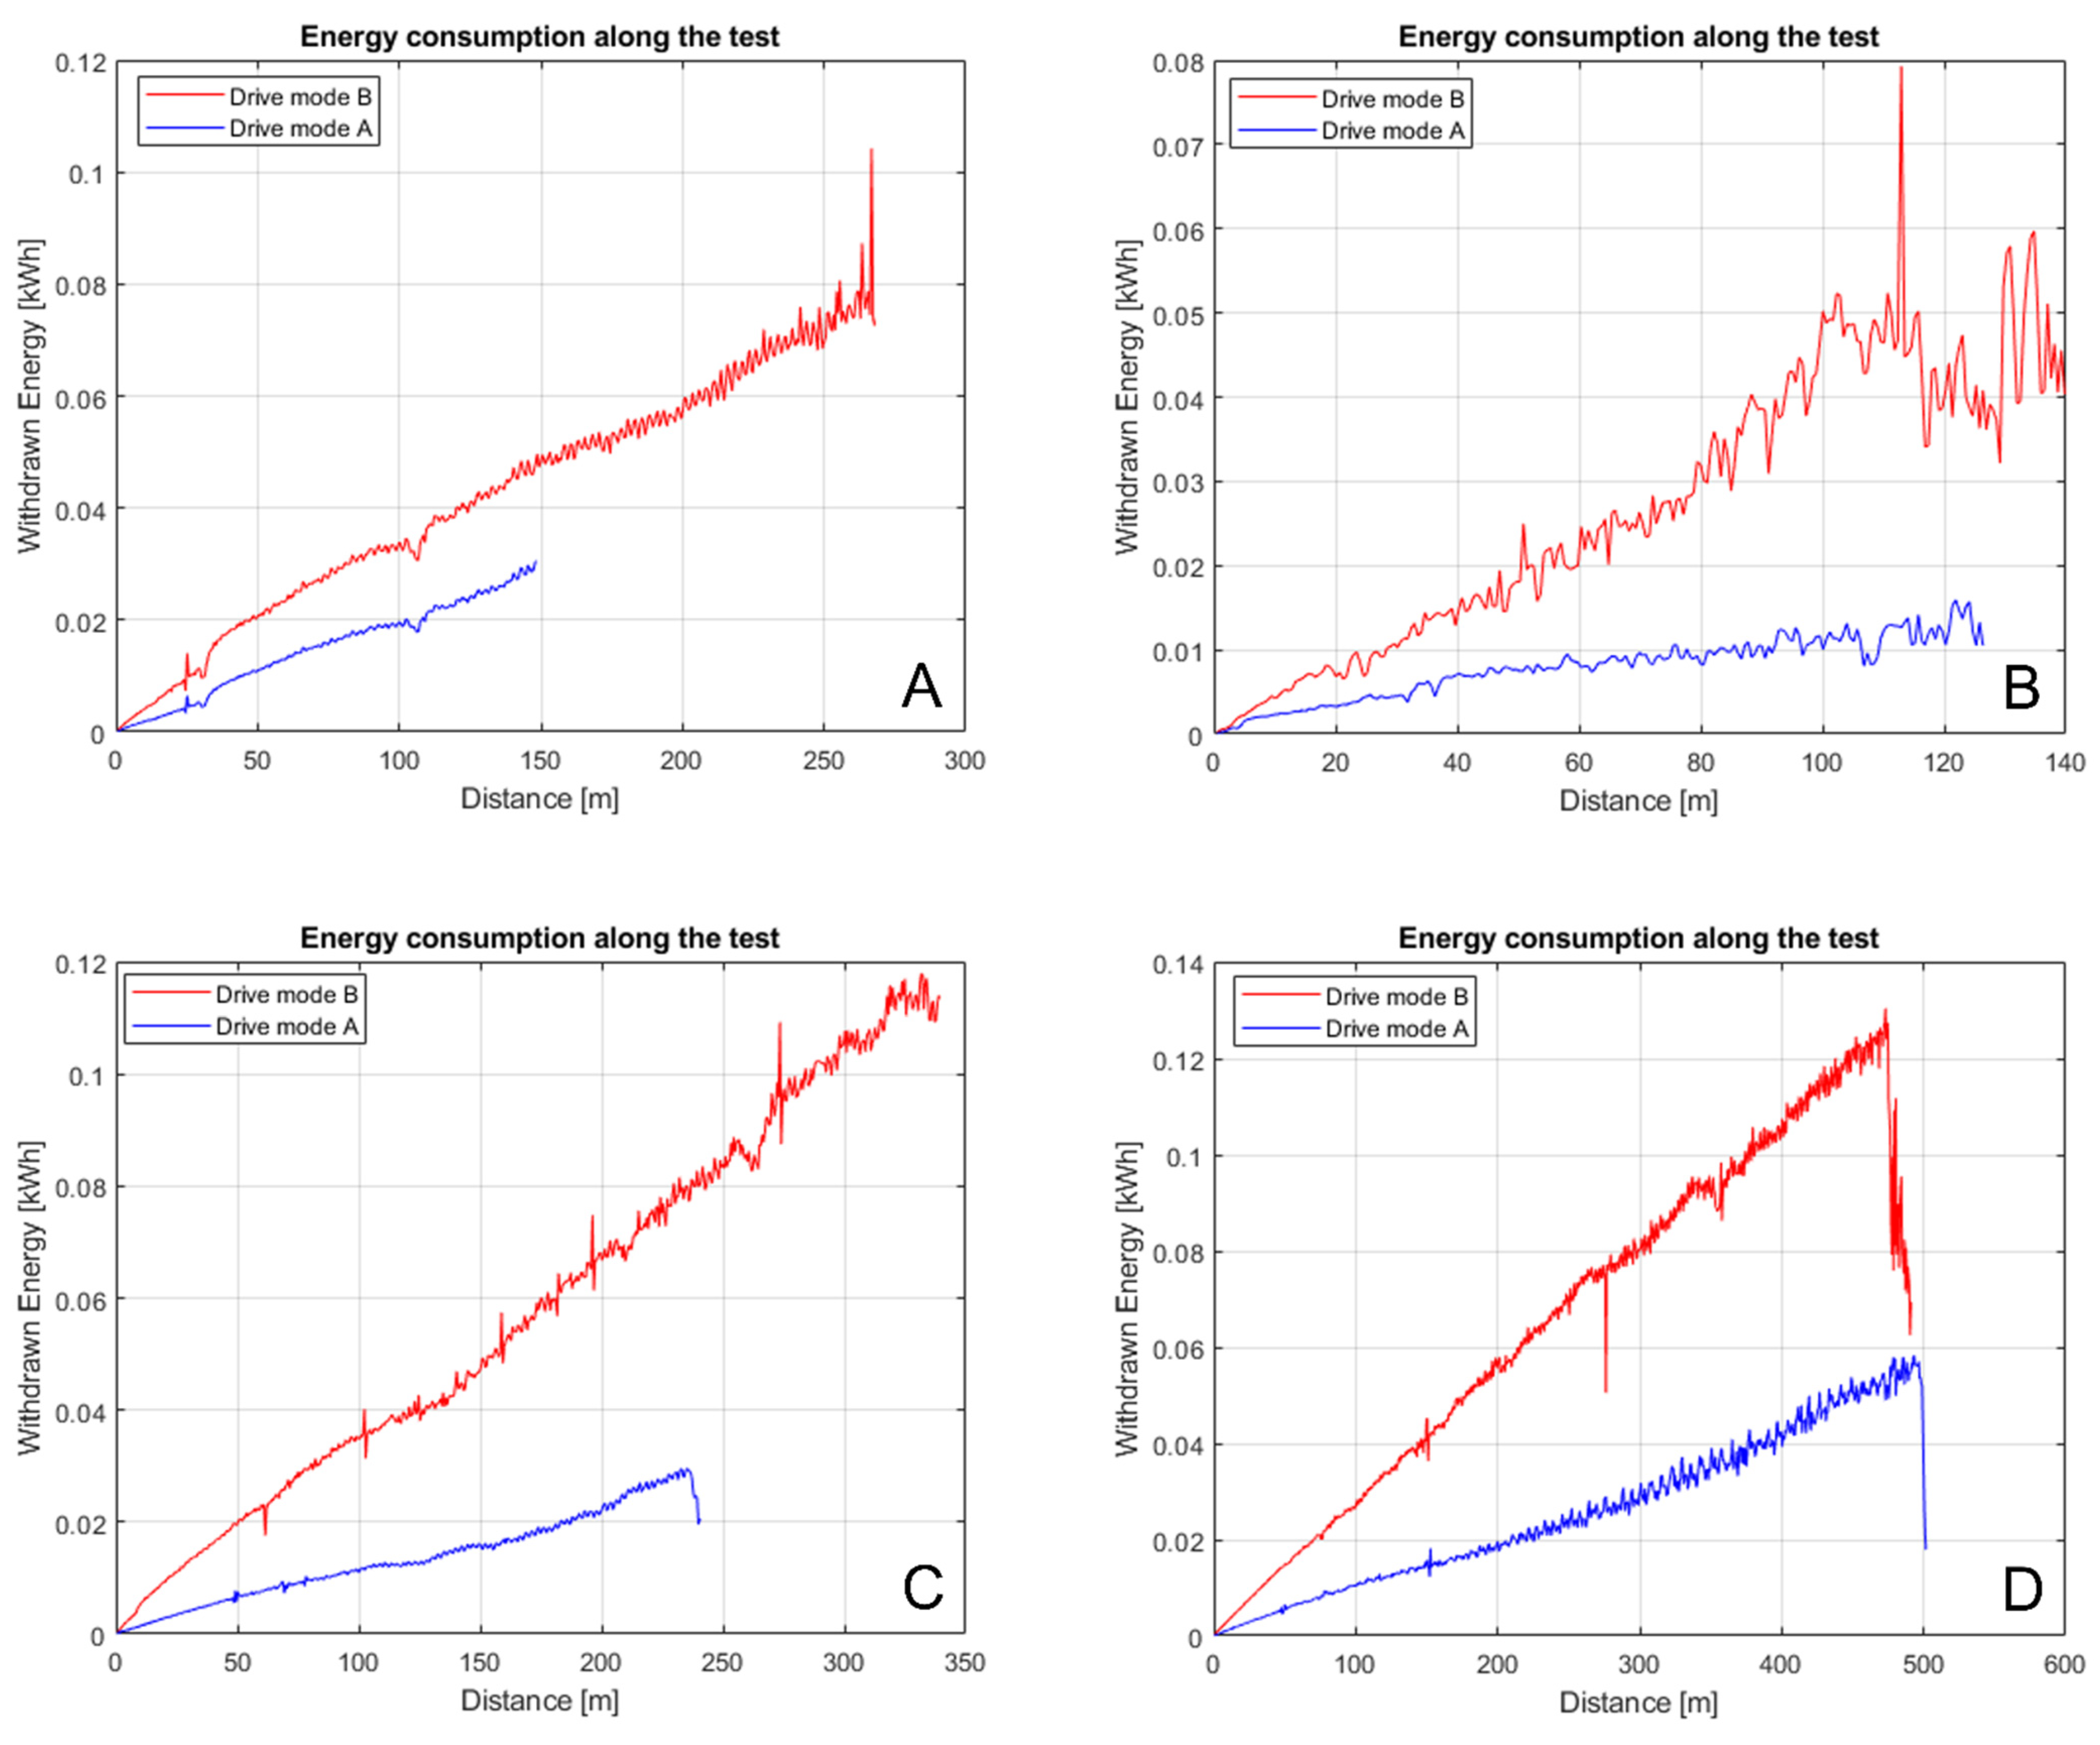
The behavior of the withdrawn energy along the test is shown in Figure 7. The tests with drive mode B have an increment in comparison to the test in drive mode A. This increment is linked to the additional weight given by the hydrogen cell.
However, it highlights the behavior in test 5 (Figure 7A) by an increment similar to tests 7 and 8 (Figure 7C,D). This is not just linked to the added weight but also to the speed of the vehicle.
Regarding tests 2 and 6, these tests are the ones with the less withdrawn energy (Figure 7B), and at the same time, they present the lowest comparison factor (Figure 6). This behavior is explained because the vehicle has the maximum load and the slowest speed; this means that, along these tests, the vehicle used all the capacity of the battery to do the movement, which concludes in a shorter test with less traveled distance.
In comparison with other vehicles, the Environmental Protection Agency (EPA) reports battery vehicles with a comparison factor between 1.25 and 2, while to date they do not have reports for fuel cell passenger vehicles [26]. These values, they assure, correspond to batteries that give a higher traveled distance or autonomy than a superior performance. As can be seen in Figure 6, the hydrogen cell in the vehicle is in the range between 0.92 and 2.4, which means that it has the same behavior as the vehicle’s reports from the EPA with an extended range and less performance.
Although literature reported data about the withdrawn energy of other vehicles, studies about hydrogen cell vehicles are restricted. Some authors have reported a factor of 0.4 for a hydrogen-powered golf cart [19]. This means that this vehicle has a powertrain with more power or that the size of the cell and the battery is bigger than the size needed for the vehicle to work. In comparison, the prototype build here has just energy enough to do the work but at low power rate. With these values can be affirmed that for the objective to obtain a powertrain that allows moving a 6 kg as maximum load, the hydrogen cell does its job since it provides the needed energy quantity in the other hand, relating to the control elements, it is observed that along each test the Bluetooth signal is not too stable. Besides, it could lose some charge (around 1%) just trying to connect between the mobile app and the Bluetooth module. Although this percentage is low, it makes the efficiency of the system decrease, as it requires a small percentage of fuel (battery charge in the case of drive mode A and charged hydrogen in drive mode B) for its connection and not for the proper work of the vehicle.
By analyzing the charging times of the battery and the hydrogen cell, the performance of the hybrid mode in comparison to the battery-only drive mode can be determined. The comparison of all three drive modes can be seen in Table 4, and here can be found an advantage of hybrid-mode as it reduces charging times by letting the prototype charge in a parallel form. In this form, the charging time will only be affected by the size of the battery as it is the one with the largest charging time.
The energy consumption for the hybrid mode will increase as it will be two fuels charging at the same time, but this will provide more range to the prototype without wasting more time than expected and, if the vehicle does not go to extreme cycles of charge and discharge, the hybrid mode will consume 8.5 W/h.
However, this technology results to be expensive compared to battery vehicles since the fuel cell and the hydrogen charger cost almost $3000, and real-size scooters are expected to use bigger fuel cells and chargers that could be difficult to obtain commercially.

4. Conclusions

By the calculations of the vehicle dynamics and as it can be corroborated in the tests, using a 30 W hydrogen cell with an electrical system of a toy scooter prototype results in a right working for the load tests. Extending the autonomy of the vehicle in a satisfactory way with almost 80% to the traveled distance, the operating times were increased in 34% compared to the drive mode using just battery; however, it also has an increment in the withdrawn energy due to the extra weight caused by the hydrogen cell itself. This does not affect the performance of the vehicle because the hydrogen gives the additional energy required for the work and can be seen with the increment of the combined fuel efficiency between 29% and 171%. Additionally, the presence of the hydrogen cell produces a more stable drive mode by showing less variations in the iterations of the tests. In comparison to real battery electric vehicles, it can be seen that the prototype has theoretically the same behavior as vehicles with high torque and low power thanks to the comparison factor obtained; however, evaluation is needed with a 1:1 scale prototype that reduces the limitations from drag and rolling resistance. Finally, the control system using Bluetooth is a viable choice for a low budget project, but after the inconvenience with the unstable connection, an RC system, which is expensive but easier to operate for the user, is recommended.

Author Contributions

Conceptualization, E.F.-G., D.M., and S.S.; software, S.S.; validation, M.J.T., and M.A.V.P.; investigation, S.S., D.M., and E.F.-G.; writing—original draft preparation, S.S. and E.F.-G.; writing—review and editing, M.J.T. and M.A.V.P.; supervision, E.F.-G., M.J.T., M.A.V.P., and D.M. All authors have read and agreed to the published version of the manuscript.

Funding

This research received no external funding.

Data Availability Statement

Not applicable.

Conflicts of Interest

The authors declare no conflict of interest.

References

  1. Saxena, P.; Srivastava, A. Air Pollution and Total Environmental Health; Springer: Berlin/Heidelberg, Germany, 2020; Volume 20, ISBN 9789811534805. [Google Scholar]
  2. The World Bank Mobility. Available online: https://www.worldbank.org/en/results/2017/12/01/mobility (accessed on 16 November 2022).
  3. Bokaba, T.; Doorsamy, W.; Paul, B.S. A Comparative Study of Ensemble Models for Predicting Road Traffic Congestion. Appl. Sci. 2022, 12, 1337. [Google Scholar] [CrossRef]
  4. The World Bank Pollution. Available online: https://www.worldbank.org/en/topic/pollution (accessed on 16 November 2022).
  5. Amry, Y.; Elbouchikhi, E.; Le Gall, F.; Ghogho, M.; El Hani, S. Electric Vehicle Traction Drives and Charging Station Power Electronics: Current Status and Challenges. Energies 2022, 15, 6037. [Google Scholar] [CrossRef]
  6. Şengül, B.; Mostofi, H. Impacts of E-Micromobility on the Sustainability of Urban Transportation—A Systematic Review. Appl. Sci. 2021, 11, 5851. [Google Scholar] [CrossRef]
  7. Gössling, S. Integrating E-Scooters in Urban Transportation: Problems, Policies, and the Prospect of System Change. Transp. Res. Part D Transp. Environ. 2020, 79, 102230. [Google Scholar] [CrossRef]
  8. García-Olivares, A.; Solé, J.; Osychenko, O. Transportation in a 100% Renewable Energy System. Energy Convers. Manag. 2018, 158, 266–285. [Google Scholar] [CrossRef]
  9. Ramchandra Mouli, G.; Vanduijsen, P.; Velzeboer, T.; Nair, G.; Zhao, Y.; Jamodkar, A.; Isabella, O.; Silvester, S.; Bauer, P.; Zeman, M. Solar Powered E-Bike Charging Station with AC, DC and Contactless Charging. In Proceedings of the 20th European Conference on Power Electronics and Applications, EPE 2018 ECCE Europe, Riga, Latvia, 17–21 September 2018; pp. 1–10. [Google Scholar]
  10. Rohini, M.; Asha, S. A Review of Electric Vehicle Components. In Smart Technologies for Energy, Environment and Sustainable Development; Springer: Singapore, 2022; pp. 531–558. [Google Scholar]
  11. Moreau, H.; de Jamblinne de Meux, L.; Zeller, V.; D’Ans, P.; Ruwet, C.; Achten, W.M.J. Dockless E-Scooter: A Green Solution for Mobility? Comparative Case Study between Dockless e-Scooters, Displaced Transport, and Personal e-Scooters. Sustainability 2020, 12, 1803. [Google Scholar] [CrossRef] [Green Version]
  12. Karkera, G.; Reddy, M.A.; Fichtner, M. Recent Developments and Future Perspectives of Anionic Batteries. J. Power Sources 2021, 481, 228877. [Google Scholar] [CrossRef]
  13. Apostolou, D.; Casero, P.; Gil, V.; Xydis, G. Integration of a Light Mobility Urban Scale Hydrogen Refuelling Station for Cycling Purposes in the Transportation Market. Int. J. Hydrogen Energy 2021, 46, 5756–5762. [Google Scholar] [CrossRef]
  14. Dwivedi, S. Solid Oxide Fuel Cell: Materials for Anode, Cathode and Electrolyte. Int. J. Hydrogen Energy 2020, 45, 23988–24013. [Google Scholar] [CrossRef]
  15. Yang, F.; Wang, T.; Deng, X.; Dang, J.; Huang, Z.; Hu, S.; Li, Y.; Ouyang, M. Review on Hydrogen Safety Issues: Incident Statistics, Hydrogen Diffusion, and Detonation Process. Int. J. Hydrogen Energy 2021, 46, 31467–31488. [Google Scholar] [CrossRef]
  16. Samsun, R.C.; Rex, M.; Antoni, L.; Stolten, D. Deployment of Fuel Cell Vehicles and Hydrogen Refueling Station Infrastructure: A Global Overview and Perspectives. Energies 2022, 15, 4975. [Google Scholar] [CrossRef]
  17. Choi, Y.; Lee, J. Estimation of Liquid Hydrogen Fuels in Aviation. Aerospace 2022, 9, 564. [Google Scholar] [CrossRef]
  18. Haseli, Y.; Naterer, G.F.; Dincer, I. Comparative Assessment of Greenhouse Gas Mitigation of Hydrogen Passenger Trains. Int. J. Hydrogen Energy 2008, 33, 1788–1796. [Google Scholar] [CrossRef]
  19. Tolj, I.; Lototskyy, M.V.; Davids, M.W.; Pasupathi, S.; Swart, G.; Pollet, B.G. Fuel Cell-Battery Hybrid Powered Light Electric Vehicle (Golf Cart): Influence of Fuel Cell on the Driving Performance. Int. J. Hydrogen Energy 2013, 38, 10630–10639. [Google Scholar] [CrossRef] [Green Version]
  20. Cunanan, C.; Tran, M.K.; Lee, Y.; Kwok, S.; Leung, V.; Fowler, M. A Review of Heavy-Duty Vehicle Powertrain Technologies: Diesel Engine Vehicles, Battery Electric Vehicles, and Hydrogen Fuel Cell Electric Vehicles. Clean Technol. 2021, 3, 474–489. [Google Scholar] [CrossRef]
  21. Katz, E.; Bollella, P. Fuel Cells and Biofuel Cells: From Past to Perspectives. Isr. J. Chem. 2021, 61, 68–84. [Google Scholar] [CrossRef]
  22. Thomas, C.E. Fuel Cell and Battery Electric Vehicles Compared. Int. J. Hydrogen Energy 2009, 34, 6005–6020. [Google Scholar] [CrossRef] [Green Version]
  23. Manoharan, Y.; Hosseini, S.E.; Butler, B.; Alzhahrani, H.; Senior, B.T.F.; Ashuri, T.; Krohn, J. Hydrogen Fuel Cell Vehicles; Current Status and Future Prospect. Appl. Sci. 2019, 9, 2296. [Google Scholar] [CrossRef] [Green Version]
  24. Educational, H. H-Cell 2.0 User Manual; Horizon Eductional: Los Angeles, CA, USA, 2018; pp. 1–44. [Google Scholar]
  25. Mitschke, M.; Wallentowitz, H. Fahrwiderstände, Leistungsbedarf BT. In Dynamik der Kraftfahrzeuge; Mitschke, M., Wallentowitz, H., Eds.; Springer: Berlin/Heidelberg, Germany, 2004; pp. 67–79. ISBN 978-3-662-06802-1. [Google Scholar]
  26. Office of Technology Assessment; United States Environmental Protection Agency. Method for Evaluating Vehicle Performance. In Advanced Automotive Technology: Visions of a Super-Efficient Family Car; United States. Congress. Office of Technology Assessment: Washington, DC, USA, 1995; p. 26. [Google Scholar]
  27. Envyride Pulse Performance Safe Start Review—3-Wheel Toddler Electric ScooterPulse Performance Safe Start Review—3-Wheel Toddler Electric Scooter. Available online: https://envyride.com/pulse-performance-safe-start/ (accessed on 22 May 2022).
  28. Wu, D.; Ren, J.; Davies, H.; Shang, J.; Haas, O. Intelligent Hydrogen Fuel Cell Range Extender for Battery Electric Vehicles. World Electr. Veh. J. 2019, 10, 29. [Google Scholar] [CrossRef] [Green Version]
  29. Propfe, B.; Kreyenberg, D.; Wind, J.; Schmid, S. Market Penetration Analysis of Electric Vehicles in the German Passenger Car Market towards 2030. Int. J. Hydrogen Energy 2013, 38, 5201–5208. [Google Scholar] [CrossRef]
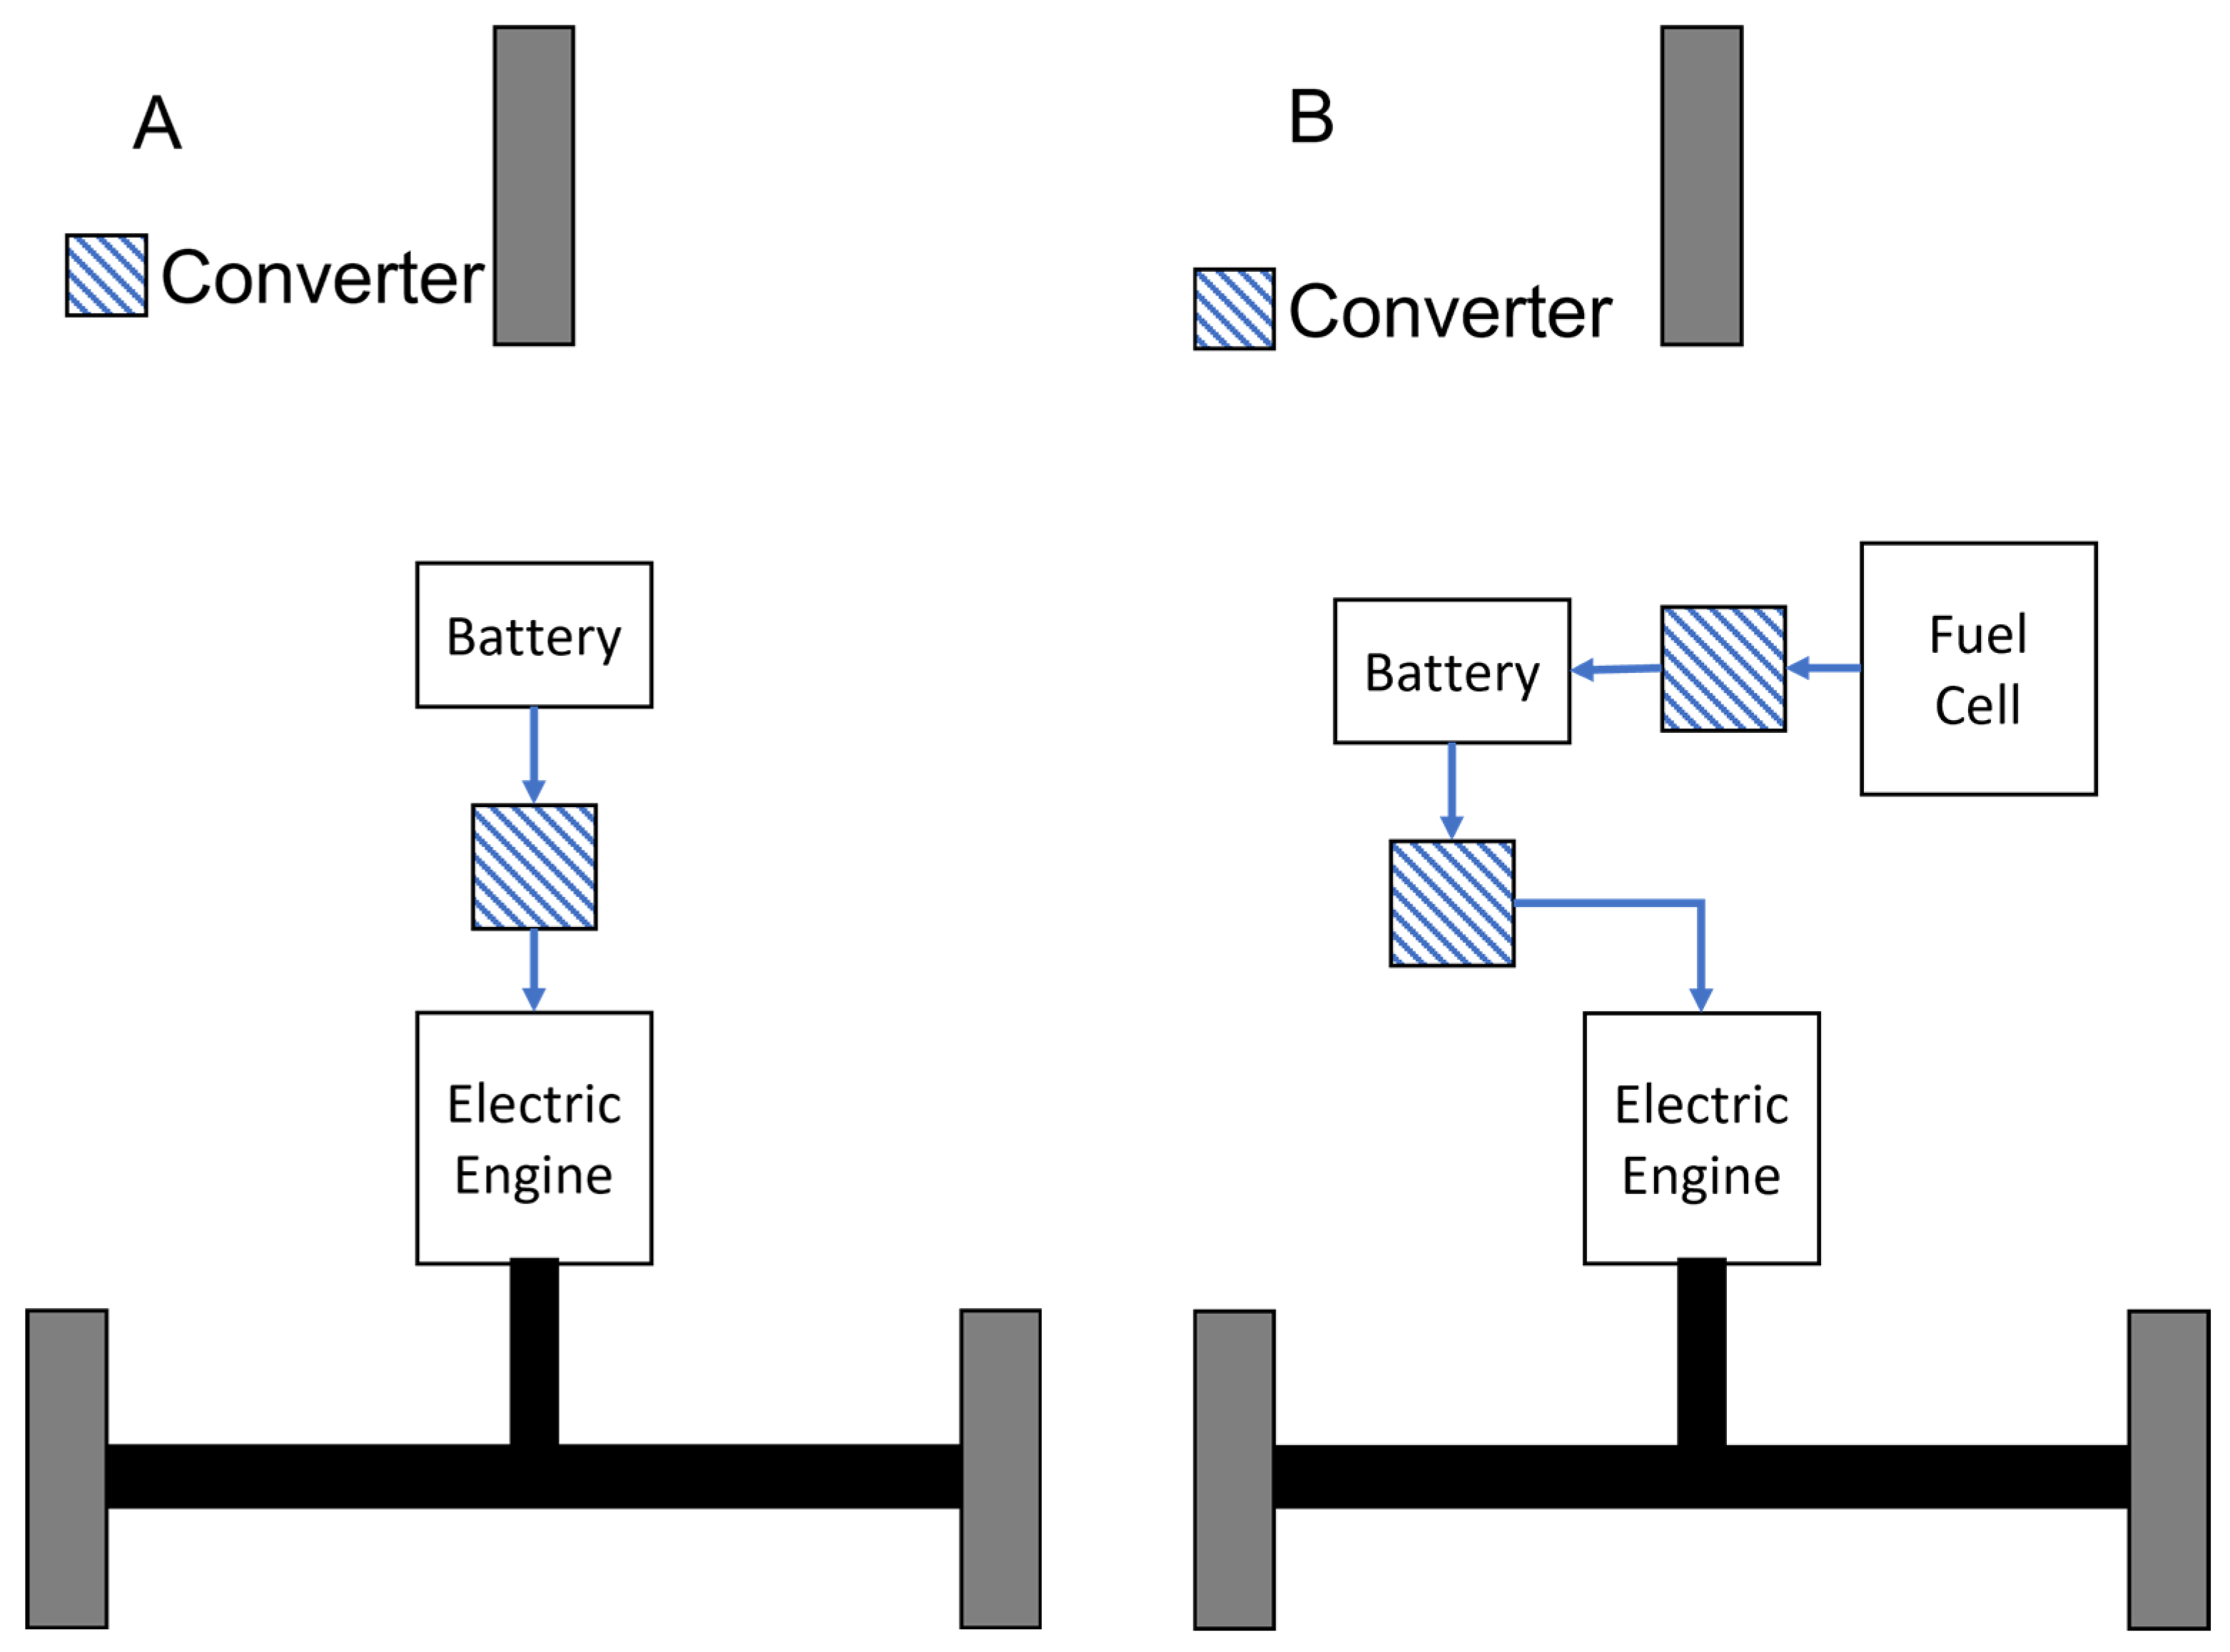
Figure 1. Schematic architecture of a battery scooter compared to a hydrogen cell scooter. By Author. (A) Schematic architecture of a scooter using a battery. (B) Schematic architecture of a scooter using a fuel cell.
Machines 10 01134 g001
Figure 2. Sectional view of the vehicle and its internal components.
Machines 10 01134 g002
Figure 3. Gear system for the transmission.
Machines 10 01134 g003
Figure 4. Schematic diagram of the control system of the vehicle.
Machines 10 01134 g004
Figure 5. Back view of the vehicle showing the hydrogen cell assembled.
Machines 10 01134 g005
Figure 6. Graph with the values for the comparison factor accordingly to the drive mode A and B. By: Authors.
Machines 10 01134 g006
Figure 7. Behavior of the withdrawn energy in kWh along the test for the drive mode A and B. By: Authors. (A) Behavior of the withdrawn energy in kWh along the test 1 (in blue) and 5 (in red). (B) Behavior of the withdrawn energy in kWh along the test 2 (in blue) and 6 (in red). (C) Behavior of the withdrawn energy in kWh along the test 3 (in blue) and 7 (in red). (D) Behavior of the withdrawn energy in kWh along the test 4 (in blue) and 8 (in red).
Machines 10 01134 g007
Table 1. Technical Characteristics of the Horizon Hydrogen Cell [24].
ElementCharacteristicValue
Hydrogen Cartridge (H2)SizeØ22 × 88 mm
Capacity10 L of H2
(3 MPa–35 °C)
H2 Purity99.995%
Weight±105 g (charged)
Charging Pressure3 MPa
Work Temperature0–55 °C
Hydrogen CellTypePEM
Power30 W
Max. Performance8.4 V @ 3.6 A
Working Voltage6 V
ReactantsHydrogen and Air
Max. Temperature55 °C
CoolingAir (Fan)
Weight370 g
H2 Flow0.42 L/min
Hydrogen Pressure discharge45–55 kPa
Table 2. Configuration for each test divided by the drive modes. By: Author.
TestNominal Speed (m/s)Weight (kg)Drive Mode
10.07564.4A (Battery only)
20.07565.0A (Battery only)
30.09894.4A (Battery only)
40.09895.0A (Battery only)
50.07564.4B (Battery and hydrogen cell)
60.07565.0B (Battery and hydrogen cell)
70.09894.4B (Battery and hydrogen cell)
80.09895.0B (Battery and hydrogen cell)
Table 3. Summary of results for the tests done.
Test12345
Drive ModeAAAAB
Average Speed [m/s]0.0585 (±0.00176)0.0698 (±0.00077)0.0846 (±0.00021)0.1156 (±0.000212)0.0756 (±0.00212)
Maximum Distance [m]148.18 (±3.54)126.38 (±3.96)240.45 (±3.95)490.98 (±4.277)267.85 (±3.55)139.8 (±3.16)339.46 (±3.97)501.6 (±0.0494)
Distance While Operating the Cell [m]----154.34 (±4.74)62.63 (±3.16)177.82 (±3.95)347.82 (±3.95)
Total Time [h]0.76 (±0.0282)0.5391 (±0.0258)0.84 (±0.0141)1.23 (±0.0070)1.02 (±0.0042)0.634 (±0.0184)0.91 (±0.014)1.41 (±0.0183)
Withdrawn Energy [kWh]0.036 (±0.00141)0.0195 (±0.00346)0.037 (±0.0094)0.0584 (±0.0025)0.1073 (±0.00127)0.0548 (±0.0012)0.1330 (±0.015)0.1548 (±0.0070)
Fuel Efficiency (Hydrogen) [m/kg]----3169.2 (±97.425)1286.04 (±0.158)3651.33 (±0.205)7142.1 (±81.168)
Combined Fuel Efficiency [kWh/m]0.000247 (±4.94 × 10−06)0.000155 (±2.43 × 10−05)0.000154 (±4.24 × 10−05)0.000116 (±1.55 × 10−05)0.000321 (±5.58 × 10−05)0.000392 (±2.12 × 10−07)0.000392 (±7.07 × 10−08)0.000315 (±1.41 × 10−06)
Non-Dimensional Comparison Factor RE/SE0.460.291.21.91.770.912.02.4
Test12345678
Drive ModeAAAABBBB
Table 4. Comparison of the energy consumption for three type of fuels present.
SourceCharging TimesAverage RangeEnergy Consumption
Lipo Battery18 h251.49 M6 W/H
Hydrogen Charger10 h185.65 M2.5 W/H
Hybrid Mode18 h312.17 M8.5 W/H
Publisher’s Note: MDPI stays neutral with regard to jurisdictional claims in published maps and institutional affiliations.